Embed Size (px)
Citation preview
Causal Patterns in Density
Lessons to Infuse into Density Units to
Enable Deeper Understanding
The Understandings of Consequence Project Project Zero, Harvard Graduate School of Education
This module was created by Tina Grotzer with Carolyn Houghton, Belinda Basca, Sarah Mittlefehldt, Rebecca Lincoln, and Dorothy MacGillivray. Dorothy MacGillivray and Rebecca Lincoln did the design and extensive editing with contributions from Kiki Donis. David Perkins offered insights on the nature of the causal models that frame all of the Understandings of Consequence Project modules. Sarah Mittlefehldt, Rebecca Lincoln, Kristin Record, and Maritess Panlilio assisted in testing the lessons with students and collecting and analyzing the data. Regina Ritscher helped to analyze students’ interviews to assess their understanding. Becky DeVito investigated how teachers in the pilot process carried out the lessons. Carlos Vasco, Professor Emeritus of Mathematics, at the National University of Colombia at Bogata, Joseph Snir, Physics Education Professor at the University of Haifa, Israel, and Reed Konsler, who as a doctoral candidate in Chemistry at Harvard University, advised us on matters of science and we thank them for their patience with our many questions and their good humor in finding ways to explain complex concepts so that students can grasp them. We are immensely grateful to Elizabeth Vanderputten and Ken Whang at the National Science Foundation for their support and also to Nora Sabelli, now at SRI, who supported earlier phases of this work. The teachers in the Burlington, MA Public Schools, specifically Rich Carroll, David Thibault, Lucy Morris, and Valorie Tobias, worked with us to test the concepts with their students. We are very grateful to them for their patience and insight. We thank the administration, particularly Dr. Bill Conners, Mr. Richard Connors, Dr. Katie Spinos, and Dr. Jim Piccone for supporting our work. We also thank the many students who shared their thinking with us over the past six years. Photo credits for pictures on cover: Students comparing wooden and marble cylinders, © The Annenberg Foundation Molecular diagram of diamond, © www.reciprocalnet.org ©2005, President and Fellows of Harvard University for Understandings of Consequence Project of Project Zero, Harvard Graduate School of Education, Cambridge, MA. This work was supported by the National Science Foundation, Grant No. REC-0106988 and REC-9725502 to Tina Grotzer and David Perkins, Co-Principal Investigators. Any opinions, findings, conclusions or recommendations expressed here are those of the authors and do not necessarily reflect the views of the National Science Foundation.
©2005, President and Fellows of Harvard College
Table of Contents
Introduction.................................................................................... 1
Section 1: Visualizing Density: Density is Non-obvious........................................................................................... 15
Lesson 1: How Can Objects of the Same Volume Differ in Mass?.............................17
Lesson 2: What Are Some Models That Help Us Think About Density? ...................23
Section 2: Defining Density as a Relationship......................37
Lesson 3: What Patterns Can Be Found Between Mass, Volume, and Density? ....................................................................................................................... 39
Lesson 4: How Can We Calculate Density From the Relationship Between Mass and Volume? ......................................................................................................47
Lesson 5: Why Is Density Considered a Property of a Particular Kind of Material? .....................................................................................................................55
Lesson 6: Do Liquids Have Density? ..........................................................................60
Lesson 7: Do Gases Have Density? .............................................................................64
Section 3: The Causes of Differences in Density ................. 93 Lesson 8: How Does Atomic Mass Contribute to Density? ........................................ 95
Lesson 9: How Do Atomic and Molecular Bonds Contribute to Density? ............... 100
Lesson 10: How Does Mixed Density Contribute to Overall Density? .....................108
Lesson 11: What Does It Mean for Density to Have Multiple Contributing Causes? ......................................................................................................................114
Lesson 12: Can the Density of Solids, Liquids, and Gases Change? ........................118
Section 4: The Role of Density in Sinking or Floating: Relational Causality.........................................149 Lesson 13: Dropping an Object into a Liquid: How Does Density Affect Sinking or Floating? ..................................................................................................151
Lesson 14: Layering Liquids: How Does Density Affect Sinking or Floating? ....................................................................................................................158
Lesson 15: What Happens in Sinking or Floating When the Relationship Between Densities Changes? .....................................................................................162

©2005, President and Fellows of Harvard College 1
INTRODUCTION
This introduction provides teachers with an overview of the module. It introduces the forms of causality that are inherent in density-related
phenomena and gives a rationale for why it is important to teach these causal concepts. It offers suggestions for how to encourage a classroom culture that supports the development of the understanding goals of the
module.
2 ©2005, President and Fellows of Harvard College
Introduction Table of Contents
Overview........................................................................................................................3 Challenges in Understanding Density ...........................................................................4 What Students Need to Know About Matter, Mass and Volume ................................11 Instructional Approach ................................................................................................13
©2005, President and Fellows of Harvard College 3
Introduction
Overview This curriculum module consists of fifteen lessons that can be used as a stand-alone unit or can be infused into a broader unit on density. The lessons are designed to address persistent difficulties that students have when learning about density. These difficulties stem from how students reason about the nature of cause and effect. The module contains four sections. Each section introduces a challenge in thinking about causality that impacts students’ ability to deeply understand density. The sections, and the multiple lessons within each section, are sequenced to build understanding. In each lesson, a background information section describes the difficulties that students typically have in learning about density, and shows how the various causal understandings, if not mastered, contribute to those difficulties. Each lesson includes subject matter goals and more general goals about the nature of causality. This module is designed for middle school, but can be adjusted for use with younger and older students. Embedded within the lessons are special activities called RECAST activities. These activities are designed to REveal CAusal STructure, or help students RECAST their understandings so that they fit with the causal patterns that scientists use. RECAST activities typically have outcomes that don’t fit with what students typically think, so they may serve as an impetus for students to restructure their understandings. The curriculum is designed around “best practices” in science education. Lessons involve students in inquiry-based activities that ask them to observe and construct understandings. Lessons typically begin by asking students to examine their current beliefs and invite opportunities for students’ ideas to evolve during the course of the unit. Student discussion is a central activity and teachers are encouraged to create an environment where students are comfortable sharing their ideas. Through discussion, students will realize that science involves revising ideas in a process of seeking the best explanation for the phenomenon in question.
Causal Patterns in Density: Introduction
4 ©2005, President and Fellows of Harvard College
Challenges in Understanding Density Emphasizing the Relational Aspects of Density
What causes objects to sink or float? Why are some clouds tall while others are flat? What causes currents in the ocean? What makes hot and cold weather fronts? From most students’ perspectives, these are unrelated questions. From a scientific perspective, there is a common causal pattern underlying each of them—relative density. The relationship between two or more densities causes the outcome.
Understanding relative density begins with understanding a more basic relationship—the relationship of mass to volume that defines density. This module seeks to help students to understand density as a relationship, and to grasp the generative concept of relative density. Many density units emphasize that density is a property of materials, related to different “material kinds.” While this unit does introduce the idea that density is a property, it also alerts students and teachers to ways that this concept can be problematic for learners as they try to extend their understandings to more complex phenomena. As elaborated below, it emphasizes the relational aspects of density and density concepts, and introduces conditions in which density is dynamic. Our research suggests that these concepts offer an effective intermediate model and a conceptual bridge to reasoning about density in complex phenomena.
Difficulties Understanding Density
A wealth of research demonstrates how difficult it is for students to come to a scientific understanding of density. Most students think of weight and density as the same thing1. They tend to focus on one feature of an object (either weight, size, or shape) or another kind of material (for instance, a liquid is often described as thin, thick, or loose)2. This limited focus is also found when students explain sinking and floating. Typically, they focus only on the object that they are testing to see if it sinks or floats3 ignoring the liquid that the object is in. 1 Smith, C., Carey, S., & Wiser, M., (1985). On differentiation: A case study of the concepts of size,
weight, and density. Cognition, 21, 177-237. Smith, C., Maclin, D., Grosslight, L., & Davis, H. (1997). Teaching for understanding: A study of students’ pre-instruction theories of matter and a comparison of the effectiveness of two approaches to teaching about matter and density. Cognition and Instruction, 15(3) 317-393. Smith, C., Snir, J., & Grosslight, L. (1992). Using conceptual models to facilitate conceptual change: The case of weight-density differentiation. Cognition and Instruction, 9(3), 221-283.
2 Smith, C., Carey, S., & Wiser, M., (1985). On differentiation: A case study of the concepts of size, weight, and density. Cognition, 21, 177-237.
3 Houghton, C., Record, K., Bell, B., & Grotzer, T.A. (2000, April). Conceptualizing density with a
relational systemic model. Paper presented at the Annual Conference of the National Association for Research in Science Teaching (NARST), New Orleans, LA. Kohn, A. S. (1993). Preschooler’s reasoning about density: Will it float? Child Development 64(6), 1637-50. Raghavan, K., Sartoris, M., & Glaser, R. (1998). Why does it go up?: The impact of the MARS curriculum as revealed through changes in student explanations of a helium balloon. Journal of Research in Science Teaching, 35(5), 547-567.
Causal Patterns in Density: Introduction
©2005, President and Fellows of Harvard College 5
Without a clear concept of density, students often explain differences in objects of the same volume but different mass as due to one object being hollow or “filled with air.” While this is one possible explanation (and is a case of mixed density—the density of the material surrounding the hollow space plus the density of the air inside), students often do not realize the possibility that the object is not hollow, but is made of a substance of lesser density. There are a number of reasons, from a cognitive and perceptual sense, that students would be inclined to focus on the weight of an object (and miss its density), or focus on the sinking or floating object (missing the role of the liquid), locating the cause of sinking or floating in the entity itself. We explain each in turn below. Non-Obvious Causality
Density is an intensive quantity. You can’t directly see or measure it. It must be inferred by holding either volume or mass constant and assessing the implications for the other variable4. This typically creates huge difficulties for students5. Everyday experience does not necessarily provide opportunities for us to hold the volume or mass of an object constant in order to make the existence of density obvious. Weight, on the other hand can immediately be perceived or felt as one lifts an object. The obviousness of the object’s surface features (felt weight and/or size) attracts students’ attention, making it unlikely that they will look beyond these features to infer the existence of density. In order to develop separate notions of weight and density, students need to reason about non-obvious causes. The relationship between density and weight is perceptually non-obvious. It only becomes obvious in outcomes where what one would predict based on weight is discrepant with what one would predict based on density, and some experience reveals the discrepancy. Children do have enough of these experiences to lead them to develop some intuitive sense of density6. For example, solid objects can be the same size but have different weights; very large objects can weigh less than much smaller ones. As children notice that these objects are made of different materials, they develop an intuitive sense that there are heavier and lighter kinds of materials. These intuitive notions, while helpful in some respects, can be limiting in others, as they further an object-based focus that is problematic when extended to more complex density problems, such as sinking and floating.
4 Inhelder, B. & Piaget, J. (1958). The growth of logical thinking from childhood to adolescence.
London: Routledge & Kegan Paul. 5 Bliss, J. (1995). Piaget and after: The case of learning in science. Studies in Science Education, 25,
139-172. Rowell, J. A. & Dawson, C. J. (1977). Teaching about floating and sinking: An attempt to link cognitive psychology with classroom practice. Science Education, 61(2), 245-253.
6 Smith, C., Maclin, D., Grosslight, L., & Davis, H. (1997). Teaching for understanding: A study of
students’ pre-instruction theories of matter and a comparison of the effectiveness of two approaches to teaching about matter and density. Cognition and Instruction, 15(3) 317-393.
Causal Patterns in Density: Introduction
6 ©2005, President and Fellows of Harvard College
Relational Causality
Understanding density involves understanding Relational Causality. Scientists define density as the mass of a substance per unit volume. It is the relationship between the mass (or weight, on Earth) of one unit of a material and the volume of that one unit. Neither feature (mass or volume) is sufficient to define density. Students need to reason about the relationship between mass and volume and understand that if the relationship between them changes, the density changes. Similarly, in understanding the role of density in sinking and floating, students need to reason about the relationship between the densities involved either between object and fluid or fluid and fluid. This relational type of causality involves recognizing that an effect is caused by the relationship, often one of balance or imbalance, between elements of a system. Neither element is the cause by itself. Thinking about Relational Causality requires a departure from linear, unidirectional forms of causality where one object or entity acts as a causal agent on another, affecting an outcome in one direction only like one domino hitting another domino7. Research shows that students typically assume simple linear, unidirectional cause and effect models when analyzing scientific phenomena. These assumptions are evident from infancy8. Causes are often perceived of as embedded in entities. These default assumptions about causality can lead to static linear, entity-based models of density that generate a wealth of perceptual problems and misconceptions. For example, students think that the density within a closed system does not change (e.g. the alcohol in a glass tube that acts as a thermometer) or don’t realize that the density of materials in different phases of matter changes. Students’ problematic tendencies are compounded by certain teaching practices. For instance, common practices include teaching specific densities for various materials without letting students know that density can change or referring to certain objects as ‘sinkers’ and others as ‘floaters’ without reference to the liquid. A common activity in the primary grades is to make a list of objects that sink and objects that float. This disregards the fact that most objects will sink in some liquids and float in others, and supports a linear static model that contributes to a range of difficulties for students later. It makes it difficult for students to understand weather patterns, ocean currents, the make-up of our atmosphere, and so on.
7 Grotzer, T. A. (1993). Children’s understanding of complex causal relationships in natural systems .
Unpublished doctoral dissertation, Harvard University, Cambridge. Perkins, D. N., & Grotzer, T. A. (2000, April). Models and moves: Focusing on dimensions of causal complexity to achieve deeper scientific understanding. Paper presented at the annual conference of the American Educational Research Association, New Orleans.
8 Andersson, B. (1986). The experiential gestalt of causation: A commo n core to pupils’
preconceptions in science. European Journal of Science Education, 8(2), 155-171. Bullock, M., Gelman, R., & Baillargeon, R. (1982). The development of causal reasoning. In W. J. Friedman (Ed.), The developmental psychology of time (pp. 209-254). New York: Academic Press. Leslie, A.M. (1982). The perception of causality in infants. Perception, 11, 173-86.
Causal Patterns in Density: Introduction
©2005, President and Fellows of Harvard College 7
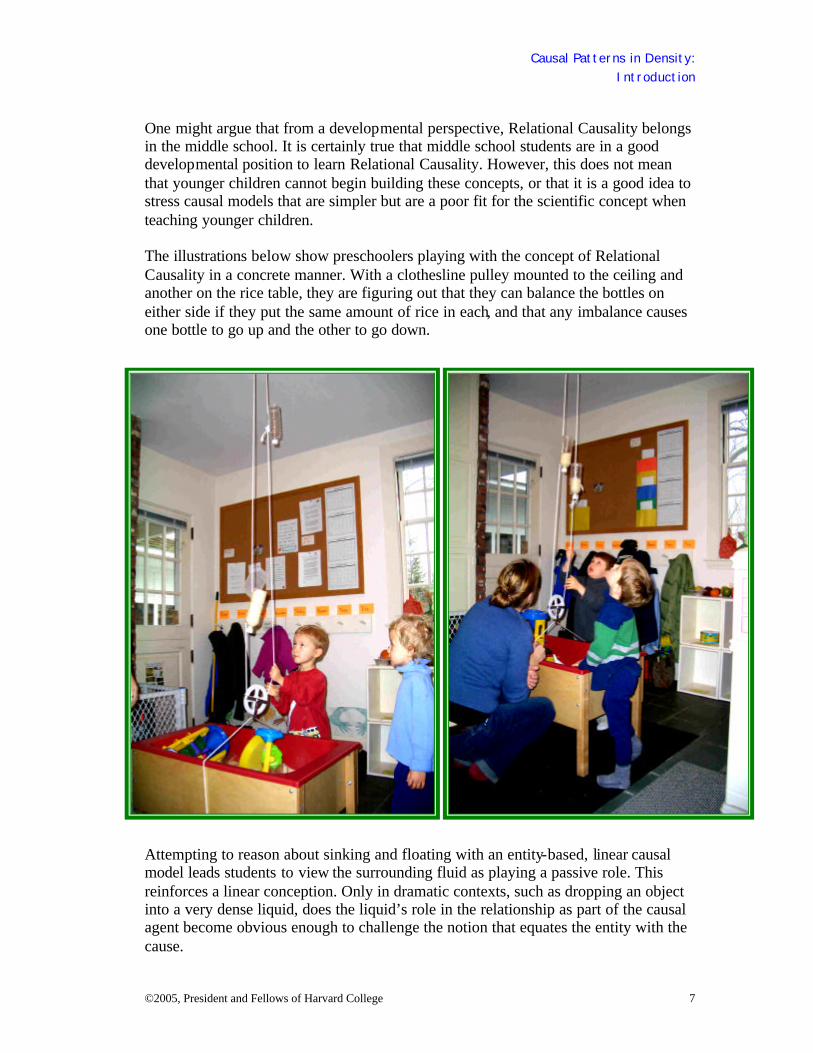
One might argue that from a developmental perspective, Relational Causality belongs in the middle school. It is certainly true that middle school students are in a good developmental position to learn Relational Causality. However, this does not mean that younger children cannot begin building these concepts, or that it is a good idea to stress causal models that are simpler but are a poor fit for the scientific concept when teaching younger children. The illustrations below show preschoolers playing with the concept of Relational Causality in a concrete manner. With a clothesline pulley mounted to the ceiling and another on the rice table, they are figuring out that they can balance the bottles on either side if they put the same amount of rice in each, and that any imbalance causes one bottle to go up and the other to go down. Attempting to reason about sinking and floating with an entity-based, linear causal model leads students to view the surrounding fluid as playing a passive role. This reinforces a linear conception. Only in dramatic contexts, such as dropping an object into a very dense liquid, does the liquid’s role in the relationship as part of the causal agent become obvious enough to challenge the notion that equates the entity with the cause.
Causal Patterns in Density: Introduction
8 ©2005, President and Fellows of Harvard College
Further, an over-emphasis on material type without a sense of the ways that density is dynamic can create an apparent contradiction. Students need to reconcile the notion of density as a property of material type characterized by a steady state model with the notion of density as a potentially dynamic feature of that same material when certain conditions such as temperature and/or pressure change. The Microscopic and Macroscopic Causes of Differences in Density
In order to support the idea that density is defined by the amount of matter in a given space, this module offers students the underlying atomic theory for why there are differences in dens ity. Teachers of younger students may choose to skip over these lessons and use boxes in its place. Crowdedness models use boxes that show different amounts of dots in a given amount of space. Therefore, they capture certain aspects of the underlying atomic theory (amount of particles in a given space due to bond strength and structure). However, for older students, the underlying atomic theory can play an important role in supporting the bigger picture of how density is dynamic and why it is defined relationally. The unit introduces three causes that contribute to density: 1) atomic mass; 2) the strength and structure of atomic and molecular bonds; and 3) mixed density. In any given instance, these causes are possible contributors to density. Therefore, some lessons in this part of the module focus on how to consider what it means to have multiple contributing causes.
1. Atomic Mass: The first cause involves zooming in to the micro- level to consider the atomic structure of the substance. Some types of atoms have more protons and neutrons than others. This contributes to the mass of the material, because protons and neutrons have a significant amount of mass compared to electrons. It also results in more stuff in the same amount of space. The weight of an atom depends upon the number of protons and neutrons it has. This information can be found on the periodic table. However, you can’t directly compare the density of different elements based upon the number of their protons and neutrons alone, because density can have multiple contributing causes. (For example, the strength of the atomic bonds and the subsequent crowdedness of the atoms may compensate for the mass of individual atoms.)
2. The Strength and Structure of Atomic and Molecular Bonds: The second
cause of differences in density also involves zooming in to the micro-level. It has to do with how the atoms are bonded to other atoms (either the same type or different types) to create molecules of pure substances, or compounds, or how the molecules are bonded to other molecules. In some cases, they are bonded very closely (such as in a metal). In other cases they are bonded loosely and there is more space between them, resulting in fewer atoms packed into a certain amount of space. With stronger (tighter) bonds, there are more atoms per unit of space. It is the strength of the bonds that counts; the
Causal Patterns in Density: Introduction
©2005, President and Fellows of Harvard College 9
bonds themselves do not contribute mass or matter because they are not things; they are electrical attraction.
It also makes a difference how the bonds are structured. In a solid, how the atoms or molecules are bonded (the bonds of the crystalline structure) contributes significantly to density. In liquids, scientists don’t understand the bonds very well and they are studying them to try to understand them better. However, there are different amounts of space between the bonds of different liquids. In gases, the most important variable in terms of density is how spread out the atoms or molecules are. The impact on density due to atomic mass and to the strength and structure of atom and molecular bonds is outweighed by how spread out the atoms and molecules are due to pressure and temperature.
3. Mixed Density: The third cause is most easily talked about as mixed density.
The clearest and easiest example of this is with gases (such as water molecules in the form of steam) when they spread out in a room and there are lots of “air molecules” in between. The density of the air in the room, therefore, is actually a mixture. Other examples include a sponge with holes in it. The state of the molecules affects how spread out they are and whether or not other types of atoms or molecules fit between them. For instance, Styrene is a dense liquid. However, it can be blown into Styrofoam so that it increases in volume and has air in the spaces (that has a mixed density).
It is important to note that there are cases where molecules or atoms are spread out, but it is not due to mixed density. Instead of air in between, there is simply space. The structure of the molecules also affects how spread out they are. The molecules in many plastics (polymers) are long and curly so when they fit next to each other there can be spaces (with vacuum, gases or liquids in them). However, in our testing of the module, most middle students found these details to be confusing.
A Word About Culture
There are many forms of reasoning in science that may interact with students’ cultural tendencies. Cultural experience acts as a filter for how we interpret events in our world and interact with how we learn about the world. Contrast a western view of the natural world as something to be dominated and controlled versus a Native American view emphasizing the need to live harmoniously and as part of nature. A science lesson where students are taught to isolate and control variables in order to determine their effects would look quite different through each filter, as would a lesson on the food web and the connectedness of the components of the web. These filters pose slightly different challenges to the learning and thinking in each lesson. The same is true for teaching about causal models. Some cultures may encourage a more relational view of the world, whereas others may encourage a more linear one. Being alert and sensitive to such differences is important in a culturally diverse classroom.
Causal Patterns in Density: Introduction
10 ©2005, President and Fellows of Harvard College
Using the Term “Mass” Versus “Weight”
Middle school students often find it difficult to achieve a clear understanding of the difference between mass and weight. This makes sense because our experience of the two concepts is completely confounded here on Earth. We would probably recognize their difference more easily if we spent time on different planets where the gravitational attraction is different due to the differences in mass between planets. This module uses “mass” throughout or “felt weight” in instances where observations rely on students’ perceptions rather than measurements. However, for younger students, teachers might want to substitute the term “weight on Earth” for mass if it helps students grasp the concepts. “Air Molecules” Versus Molecules That Make up the Air
The module uses the term “air molecules” in quotations since there really is no such thing as an air molecule. Rather, there are a number of different kinds of molecules that make up the air. If you use the term “air molecule,” we suggest telling the students that it is just a shortened way of referring to the molecules in the air (things like Oxygen, Nitrogen, Hydrogen, etc.) but that there’s actually no such thing as a molecule of air. There are molecules of particular gases that make up the air, so another way to handle this issue is to just talk about gases, and not substitute air molecules for gases.
Causal Patterns in Density: Introduction
©2005, President and Fellows of Harvard College 11
What Students Need to Know About Matter, Mass, and Volume Students need to have a deep understanding of matter in order to develop a deep understanding of density concepts. While this module contains some background information about the nature of matter, it is intended primarily in terms of review. The module assumes that students hold the following prerequisite understandings about the nature of matter, and understand the distinction between volume and mass (or at least “weight on Earth”). The Nature of Matter
• Matter is composed of atoms or “particles.” (The particles are molecules, elements, atoms, and compounds.) Between particles, there is empty space.
• Matter takes up space (has volume).
• Matter has mass.
• Air (and all gases) are matter.
• Liquids are matter.
• Matter is measurable. (We can measure its volume and mass.)
• Matter exists in different phases.
• Physical changes involve changes in state, shape, etc. (where the actual particles are not changed).
• Chemical changes involve changes in chemical structure.
• Matter is conserved.
• Molecules are not static. The atoms or molecules in solids move, but stay in the same position relative to one another. The atoms or molecules in liquids move around and change position relative to one another while remaining in contact with each other. The molecules in gases spend almost all their time alone. Each molecule zips through empty space until it hits another one. Then they bounce off each other. Gases can expand and contract much more than solids and liquids because they are mostly empty space.
• Heating matter results in greater movement of the molecules.
Mass and Weight
• Mass is the amount of matter that makes up an object. More accurately, it is a measurement of the amount of matter in an object. It is measured in grams. It is also a measurement of what it takes to move an object, its resistance or stubbornness. It is independent of gravity.
Causal Patterns in Density: Introduction
12 ©2005, President and Fellows of Harvard College
• Weight refers to the amount of force gravity exerts on an object. Therefore, the weight of a particular object is different in different gravitational fields. For example, the gravitational force of a given object on the Moon is 1/6th the gravitational force of the same object on the earth. Objects have the same mass (amount of matter) but different weight in different gravitational fields.
Volume
• Volume refers to how much space matter takes up.
• If an object has a regular shape, its volume can be measured using a ruler.
• If an object doesn't have a regular shape it must be measured by water displacement. (You can also measure a regularly shaped object this way, but you don't have to).
• If an object floats, you hold it just under the surface of the water, then measure the amount of water that the object displaces in an overflow container or how many millimeters the water rises in a graduated cylinder.
• If an object sinks, you drop it into the water, then measure the amount of water that the object displaces in an overflow container or how many millimeters the water rises in a graduated cylinder.
Causal Patterns in Density: Introduction
©2005, President and Fellows of Harvard College 13
Instructional Approach The activities in this module are based on a set of pedagogical assumptions and are best supported by a certain type of classroom culture as outlined below:
• Gear your classroom culture towards developing understanding, instead of “right answers.” Deep understanding takes longer to develop, but the pay-off is greater in terms of being able to apply the learning more broadly.
• Encourage students to talk to each other when discussing ideas rather than directing all their comments to you. This encourages greater involvement on behalf of the students and supports the development of a community of learners.
• Provide opportunities for students to engage in the kind of scientific inquiry that scientists engage in—where the process of learning the subject matter mimics the process of “finding out.” However, not all learning can be inquiry-based or construc tivist. Students also need exposure to the models that scientists have evolved during centuries of scientific inquiry.
• Students already hold general principles about how the world works. Often students don’t explicitly know what assumptions they are making. They need opportunities to reflect on their own thinking.
• Students won’t really change their minds until their objections have been dealt with and the evidence is convincing to them. Their most challenging questions can drive a discussion towards more sophisticated models.
• Science involves the systematic discard and revision of models for ones with greater explanatory power. Understanding evolves in a similar way. Expect students to move towards scientifically accepted models, but realize that they won’t all accept the scientific model before the end of the unit.
• Encourage testing and revising one’s model over “getting it right.” Students who adopt the “right” model without deeply reasoning it through are likely to revert to their less evolved models as soon as the unit ends.
• Encourage students to take risks in their thinking and to test their ideas in a social context. Instead of shooting ideas down, consider the relevant evidence.
• Encourage students NOT to just accept ideas because someone else says they should. They should change their ideas when the evidence is convincing to them.
• Some models have more explanatory power than others, but no model explains everything about a particular phenomenon. Each model fits in some ways and not in others. Critique models as a regular part of class discussions.
Encourage students to generate “rival models”—two different ways of explaining the same event—as often as possible. This helps them to view the models more flexibly and to resist becoming overly invested in one model. However, if students already have a firm idea in mind, they often aren’t able to generate two possibilities and need to grapple with their current model.
©2005, President and Fellows of Harvard College 15
SECTION 1
Visualizing Density: Density is Non-obvious
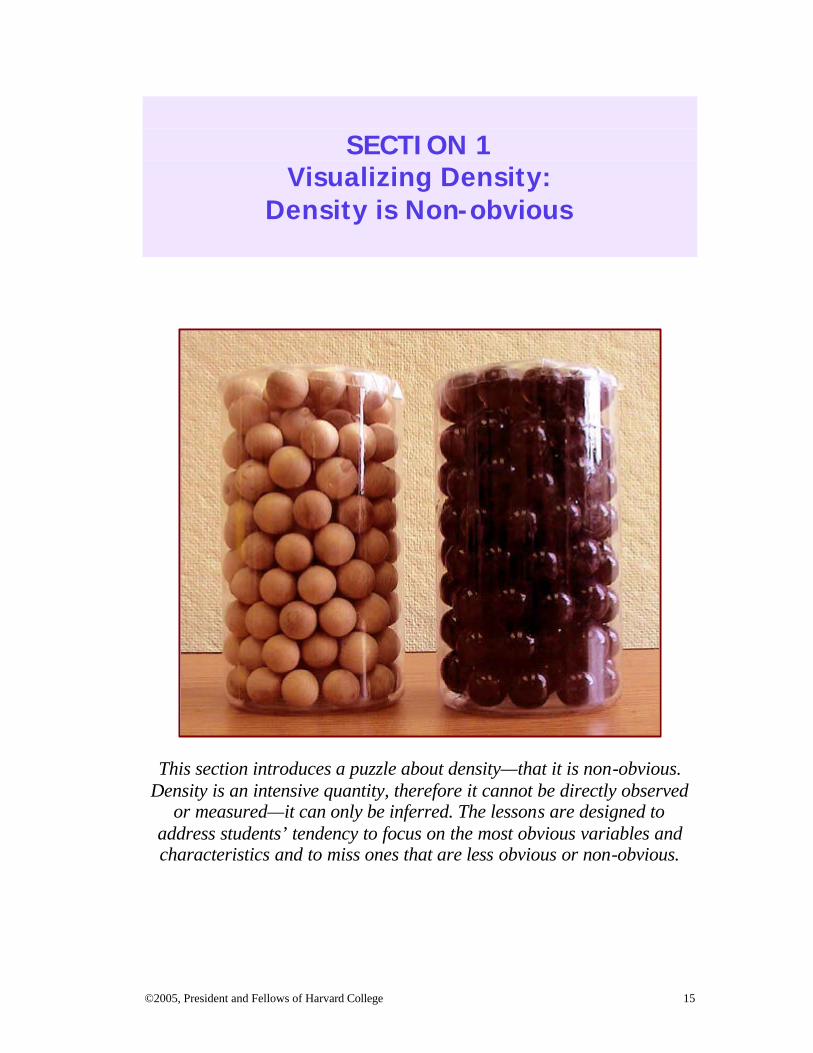
This section introduces a puzzle about density—that it is non-obvious.
Density is an intensive quantity, therefore it cannot be directly observed or measured—it can only be inferred. The lessons are designed to
address students’ tendency to focus on the most obvious variables and characteristics and to miss ones that are less obvious or non-obvious.
16 ©2004, President and Fellows of Harvard College
Section 1 Table of Contents
Lesson 1: How Can Objects of the Same Volume Differ in Mass? ...........................17 Lesson 2: What Are Some Models That Help Us Think About Density? ..................23 Resources for Section 1 ...............................................................................................32
©2005, President and Fellows of Harvard College 17
Lesson 1 How Can Objects of the Same Volume Differ in Mass?
Understanding Goals Subject Matter
v Objects that are made of different materials can have the same mass and different volumes, or the same volumes but different mass. This is because of a property called "density."
v All matter has density. v We can come up with different models for visualizing density. v One way to think about density that students often find helpful is to think
about how crowded or packed a material is. Many models use various illustrations of crowdedness (or more or less packed in) as a way of conveying density.
v Denser things are more crowded or more tightly packed. Causality
v Density is non-obvious. You can only detect differences in density by controlling for mass or for volume.
v You can't measure the density of an object directly. You can only figure it out by knowing the relationship between its mass and its volume.
v When we are looking for the causes, we often focus on only obvious ones because they are easiest to notice.
v People often miss the role that density plays in the real world. Instead, they make the mistake of thinking only about mass or volume.
Background Information Realizing that Density Exists
The purpose of this lesson is to help students realize that density exists. It accounts for differences between masses of different kinds of materials when volume is held constant. Density is an intensive quantity. It is called intensive because it cannot be directly measured. It is determined by the relationship between mass and volume, a quantity because it can be calculated mathematically. This means that you can't measure it directly. It must be inferred. This is different from other types of measurements that students may be familiar with, such as measurements of mass, volume and weight, which are extensive quantities.
*Photo Credit: Girl comparing cylinders, ©Clive Grainger
Causal Patterns in Density: Visualizing Density: Density is Non-obvious
18 ©2004, President and Fellows of Harvard College
We often miss non-obvious variables and focus on those that more easily grab our attention. This lesson controls for volume so that differences in mass become more obvious. The lesson uses two metal cylinders of the same volume, but with noticeably different masses. As students reach out to grasp the two cylinders in this lesson, observe the amount of arm drop that they experience. This reveals the discrepancy between their expectations for how much mass each cylinder should have and the actual mass of each cylinder. Mental Models of Density
This lesson attempts to help students develop a mental model of density—to realize that something is going on that they cannot see to account for differences between materials. While many density curricula stress density as an “unchanging property of the material,” this module uses these terms lightly. Instead, it stresses the relationship between mass and volume. Many students end up drawing crowdedness models. This is particularly common in classes where students have studied the nature of matter. Crowededness models usually depict a certain number of dots or particles in a given amount of space. They connect nicely with density models in population studies. They capture the concept of the amount of stuff in a given amount of space nicely, and fit with the second cause of density at the micro-level—the strength and structure of the atomic and molecular bonds (studied in Section 3). Other students explain the difference between the cylinders as having to do with one being hollow. This is especially common in classes where students do not have a strong background in the nature of matter. As students will learn, a hollow object is essentially a case of mixed density—the density of the surrounding material and the density of the air inside it.
Causal Patterns in Density: Visualizing Density: Density is Non-obvious
©2005, President and Fellows of Harvard College 19
Lesson Plan Materials
Ø Equal-sized aluminum and copper cylinders Ø Individual white boards and markers for each student (You could substitute
paper and pencils, but the white boards work well for revising ideas.) Ø Balance or scale (optional)
Prep Step
Ø Review the lesson plan, background information, and understanding goals. Ø Gather materials.
Analyze Thinking
Note to Teacher: If you have enough materials for students to do the activity in small groups, this is preferable, because students will be able to feel the differences in mass.
Step 1: Unpacking Current Ideas: Comparing Two Cylinders with the Same Volume but Different Mass
Show the students two large cylinders of the same volume, but different materials, for instance, aluminum and copper. Say, “Here I have two cylinders. What do you notice about them?” Then hand the cylinders to a student and ask, “What observations can you make?"
Have students volunteer their ideas.
If students begin making interpretations, ask them to stick to observations. Do they know the difference? An observation is a description of what you see or perceive. An interpretation explains or tells the meaning of something. Make sure that they notice that the objects are the same size and shape, therefore they have the same volume. This means that they take up the same amount of
Note to Teacher: The illustrations in the examples (pp. 33-35) use a brass cylinder instead of a copper one. This is because some teachers have found brass easier to obtain than copper. However, brass is an alloy of copper and zinc, not a pure substance like aluminum. An alloy is a substance composed of two or more metals. When students begin analyzing the cylinders on the atomic level in later lessons, it can be simpler to model a pure substance rather than an alloy.
Causal Patterns in Density: Visualizing Density: Density is Non-obvious
20 ©2004, President and Fellows of Harvard College
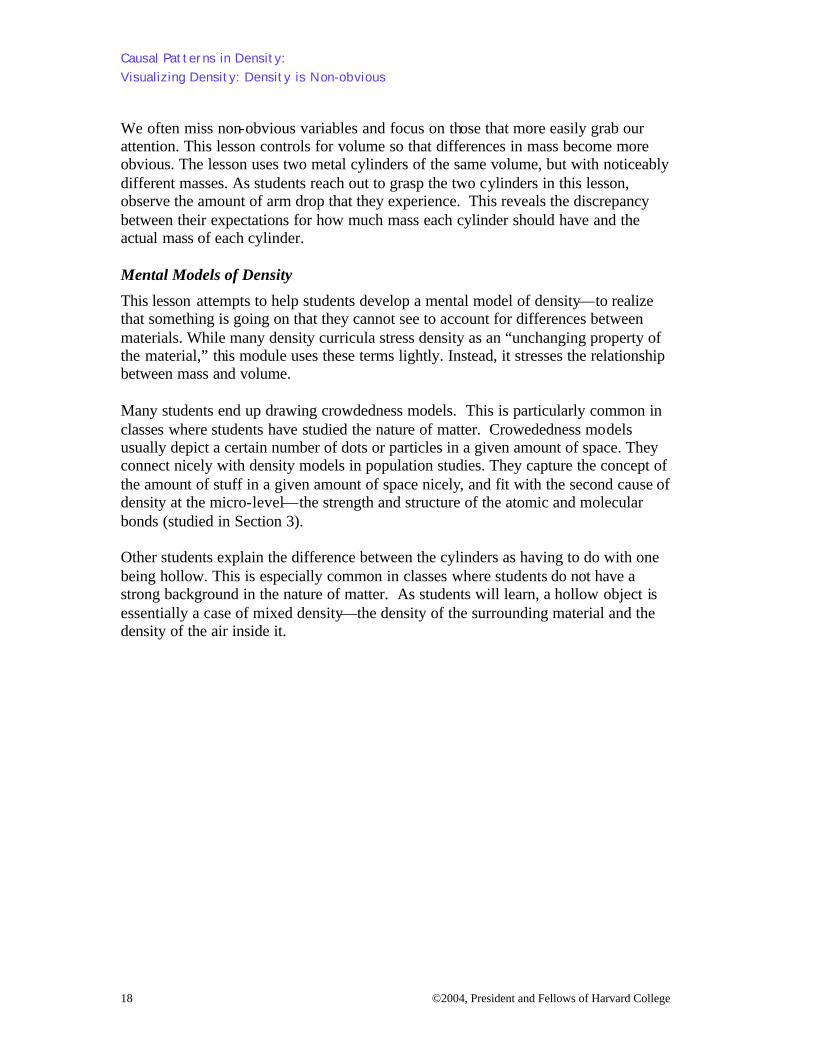
space. Have some students take a set, one in each hand, and tell them to look at the objects, feel them, and make any observations they can. As the students take the cylinders, notice how much their arms drop with the mass of the copper one and whether their other arm (with the aluminum cylinder) goes up. They should notice that they have different felt weight or mass. An option is to weigh the cylinders on a scale or compare them on a balance. Pass the cylinders around so everyone gets to hold and compare them.
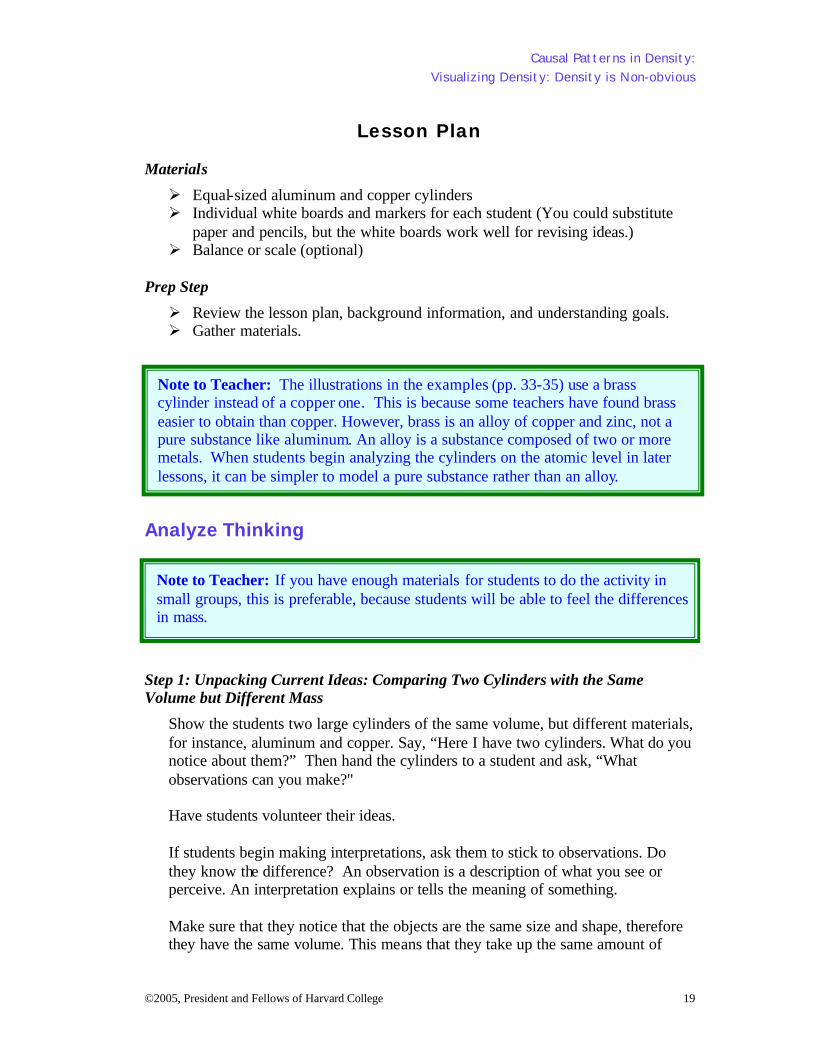
Ask your students to think about what is going on here. Pass out small white boards and markers and ask them to draw a diagram (or models, which you will talk more about later) on the white board that explains how two objects that take up the same amount of space can have such different weights. Explain to your students that while they are drawing, they should think about what they might see if they could zoom in to what is happening on a microscopic level. Their diagram should show each material (copper and aluminum) to compare them (see student examples on pages 33-35).
It is also important to remember that science drawings are different from ones that students make in art class. Here students want to draw enough to make their ideas clear and if they draw details, they should be details that help someone else understand their ideas. It is not important to draw lots of extra things (like the table that the cylinders are sitting on or the background, etc.).
Give the students 5-10 minutes to draw their models. Ask them to draw both objects and illustrate why one has more mass than the other. The point of this activity is to help them get in touch with their current thinking so that they (and you) can reflect upon it and help them revise it so that they have more powerful models for explaining what is going on.
© The Annenberg Foundation
© Clive Grainger
Causal Patterns in Density: Visualizing Density: Density is Non-obvious
©2005, President and Fellows of Harvard College 21
Checking In
Circulate while they are drawing and talk with students about their ideas. If students use the word “density,” ask them what they think it means. Get a sense of what kinds of models the students are drawing to help you orient the discussion that follows.
After about half of the time has passed, ask the students to stop for a few moments and ask themselves the following questions:
1) Am I using my drawings to really THINK about what each concept means? (Instead of just drawing what someone else has drawn or the first thing that comes to mind?)
2) Am I PUSHING my thinking to explore the concepts deeply? (If a concept is hard, am I not giving up but trying to think it through?)
3) Am I working “minds-on”—actively thinking about the concepts as I draw and trying to create a drawing that explains something about how the concepts are different?
Step 2: Discussing and Analyzing Students’ Current Models
Once students have drawn their models, go around the room and have each student share what they drew and why. Having each student share is a good way to encourage students to participate more fully and takes away the social aspects of volunteering one’s ideas.
Explain that scientists use models in science. Models are a way to help you think about a problem. They are “tools for thinking.”
Discuss what works about each model. Draw out its good points. If the re are drawbacks, mention those too, but put a positive spin on each model to encourage students in their sharing. As much as possible, encourage the students to talk to each other rather than directing all of their ideas to you.
What kinds of things might you say about different models?
• Draw attention to what the model does to explain the differences in felt weight: for instance there might be more dots drawn in one of the cylinders and fewer in the other.
• Notice attention to scientific detail.
• Consider whether the model does a good job showing what might be going on to make one cylinder weigh more than another.
• Comment on whether the model is easy to interpret..
Causal Patterns in Density: Visualizing Density: Density is Non-obvious
22 ©2004, President and Fellows of Harvard College
Some of the models will show air or suggest that the object might be hollow. Acknowledge that this is one possible explanation for the difference between the cylinders. Ask,
• Are there other explanations? • Is there a way to explain it if the cylinders are solid? • Can something that is light be solid, and not be hollow?
Contrast models that do show the cylinders as hollow with ones that do not. As the students are talking about their ideas, collect questions or issues that arise and list them on chart paper or the corner of the board. For instance, one student might refer to space in between the dots in their model, and another student might refer to air.
Step 3: Introducing the Concept of Density
Ask the students if they know a word to describe the differences between the two cylinders. If not, introduce the word “density.” Explain that density is a word that scientists use to help them talk about the difference between the cylinders. They call one more dense (it has more felt weight, weight on earth, or mass) and one less dense. The less dense one feels lighter. Tell them that density describes the amount of matter in a given amount of space. Explain that the word isn’t as important as the sense you make of it, so in the next class, you will show them more models to help them to visualize density.
Students often confuse more and less dense. Explain that the more matter is in a given space, the more dense or denser the material will be. This understanding will be reinforced in later lessons.
Review, Extend, Apply Step 4: Reflecting on the Activity
Ask the students to consider why we gave them the kinds of objects that we did.
• What made it possible to realize that something was going on?
• What did we keep the same? (size, shape, volume) ...and why?
• What did we vary? (kinds of material, mass) ...and why?
See if they can come to the realization that by holding one of the variables constant, you can learn about the other.
©2005, President and Fellows of Harvard College 23
Lesson 2 What Are Some Models That Help Us Think About Density?
Understanding Goals Subject Matter
v We can come up with different models for visualizing density. v There is no “right” model for density. Different models involve different
trade-offs. Each model captures different aspects of the concept. Exploring a variety of models gives us a fuller, more flexible understanding of density.
v Many models use various illustrations of crowdedness (or more or less packed in) as a way of conveying density.
Causality
v Density is non-obvious, but models that control for either volume or mass can help us to consider it.
v If we vary both mass and volume at the same time (which often happens in the real world) density is difficult to notice.
Background Information Introducing Additional Models of Density
The purpose of this lesson is to help students develop mental models of what density is and to conceptualize what “more dense” and “less dense” looks like. This will help students begin to realize that density explains why objects of different materials have different mass-to-volume relations. Density is an intensive quantity. It is called intensive because it cannot be directly measured. It is determined by the relationship between mass and volume, a quantity because it can be calculated mathematically. This means that you can't measure it directly. It must be inferred. For older students, this can involve calculating it mathematically, but for younger ones, the concept can be introduced by controlling for either volume or felt weight. This lesson builds on the previous lesson by offering additional models in an attempt to form a solid anchor for students. It asks students to consider possible models in terms of what works and does not work about them. In Section 3, students return to these models and critique them from a different stance—how well they capture the micro-causes of density.
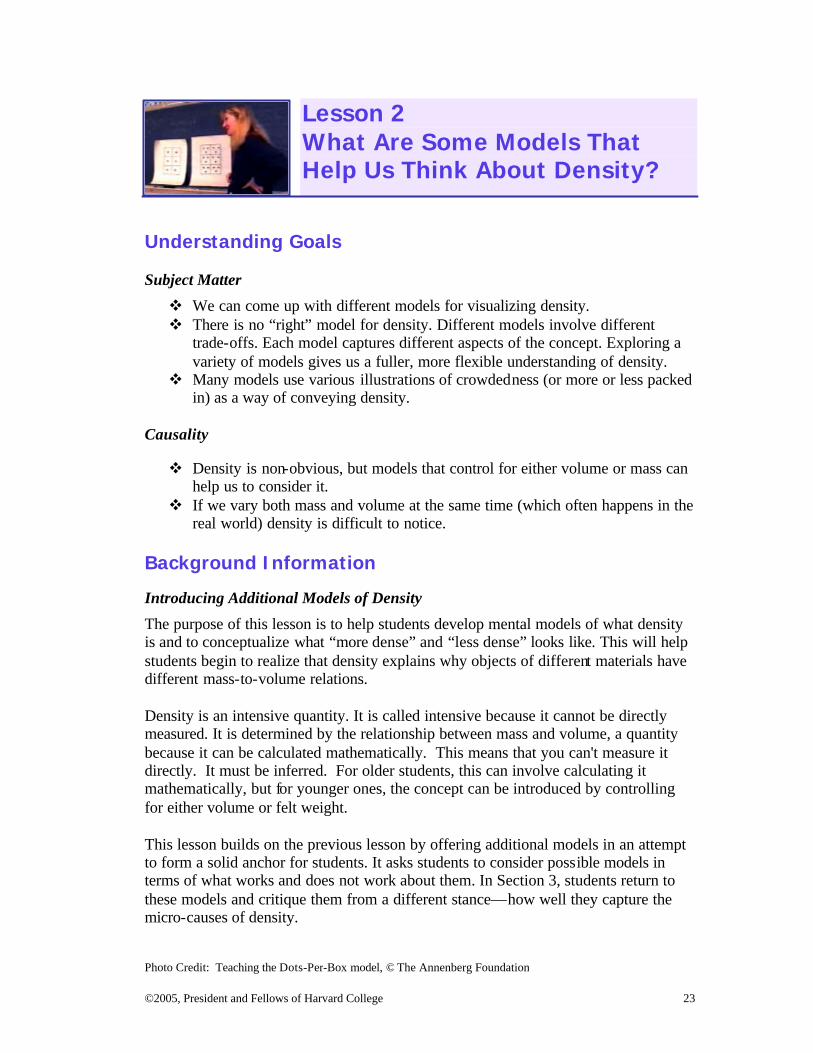
Photo Credit: Teaching the Dots-Per-Box model, © The Annenberg Foundation
Causal Patterns in Density: Visualizing Density: Density is Non-obvious
24 ©2005, President and Fellows of Harvard College
The Issue of Air Versus Space
When thinking about density, students often think that either the object must be hollow or the spaces between the dots in a Dot-Per-Box model must be air. In this module, objects that include air are discussed as having mixed density (the matter of the object plus the matter of the air). For instance, think about eating a brownie. It has a certain density. If there is an air bubble in it, that bubble is not actually brownie (and not a part of the density of the brownie), instead it is air. What you really have is brownie plus air. This is the case with hollow objects. Other mixed density materials have air and another material mixed together such that it is hard to find where the air is. For instance, ice cream is a mixture of cream particles and air particles that are so small it all looks like one material. However, some materials do not have any air in them. There are spaces between the particles, but these spaces are not filled with air (and in most cases, are not large enough to allow an “air molecule” to fit inside). For instance, the aluminum and copper cylinders in Lesson 1 are made of particles and space, but not air. This distinction between air and space is tricky for students, but is important for a deep understanding of density and density-related phenomena. For this reason, the module comes back to these distinctions numerous times and in numerous ways. Models for Visualizing Differences in Density
No model is a perfect representation of a concept. They all include various trade-offs—ways that they fit the real world phenomenon and ways that they don’t. Therefore, the focus in discussing models is not about which model is right, but rather what works well about a model (ways that it fits and ways that it doesn’t). Ultimately, the model that has the most explanatory power in a given situation is likely to be the most useful. Below is a brief explanation of each of the models.
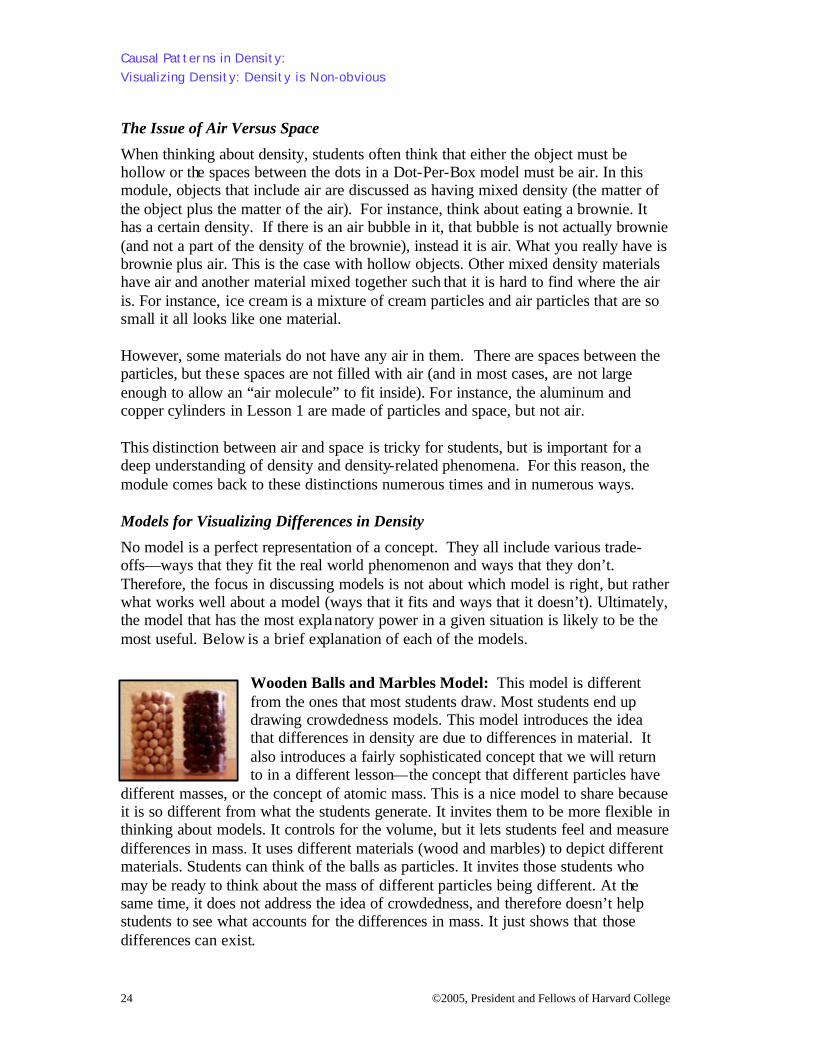
Wooden Balls and Marbles Model: This model is different from the ones that most students draw. Most students end up drawing crowdedness models. This model introduces the idea that differences in density are due to differences in material. It also introduces a fairly sophisticated concept that we will return to in a different lesson—the concept that different particles have
different masses, or the concept of atomic mass. This is a nice model to share because it is so different from what the students generate. It invites them to be more flexible in thinking about models. It controls for the volume, but it lets students feel and measure differences in mass. It uses different materials (wood and marbles) to depict different materials. Students can think of the balls as particles. It invites those students who may be ready to think about the mass of different particles being different. At the same time, it does not address the idea of crowdedness, and therefore doesn’t help students to see what accounts for the differences in mass. It just shows that those differences can exist.
Causal Patterns in Density: Visualizing Density: Density is Non-obvious
©2005, President and Fellows of Harvard College 25
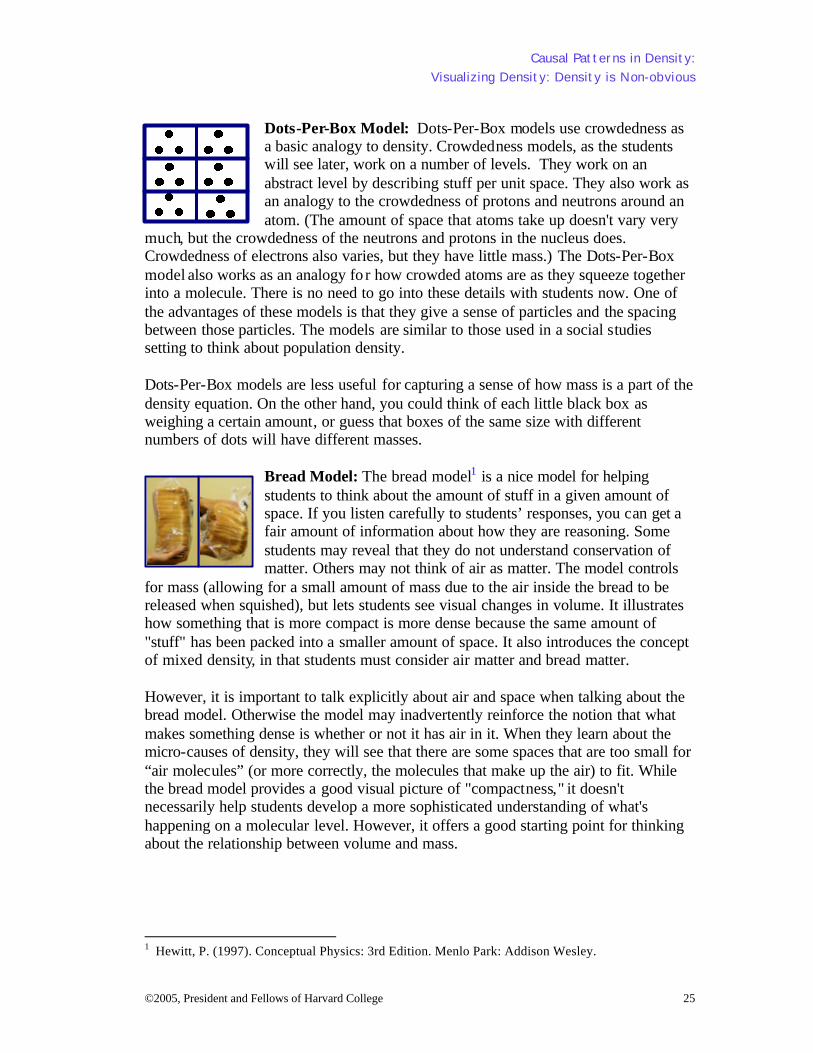
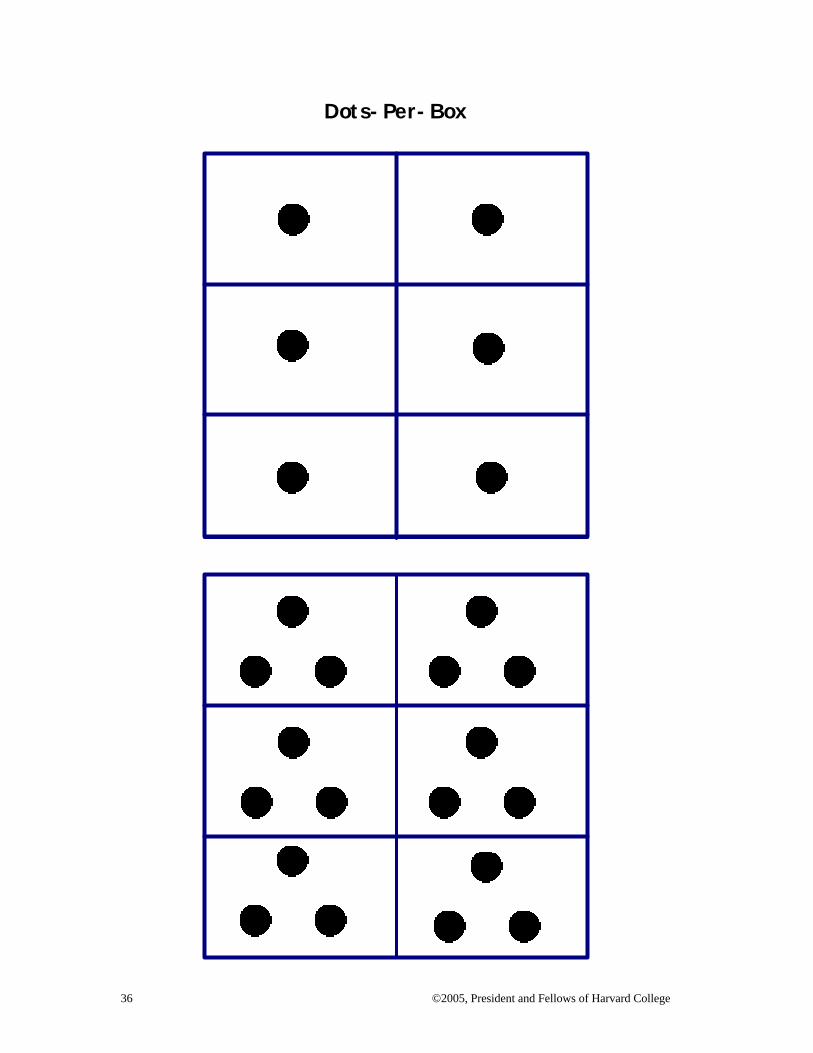
Dots-Per-Box Model: Dots-Per-Box models use crowdedness as a basic analogy to density. Crowdedness models, as the students will see later, work on a number of levels. They work on an abstract level by describing stuff per unit space. They also work as an analogy to the crowdedness of protons and neutrons around an atom. (The amount of space that atoms take up doesn't vary very
much, but the crowdedness of the neutrons and protons in the nucleus does. Crowdedness of electrons also varies, but they have little mass.) The Dots-Per-Box model also works as an analogy fo r how crowded atoms are as they squeeze together into a molecule. There is no need to go into these details with students now. One of the advantages of these models is that they give a sense of particles and the spacing between those particles. The models are similar to those used in a social studies setting to think about population density. Dots-Per-Box models are less useful for capturing a sense of how mass is a part of the density equation. On the other hand, you could think of each little black box as weighing a certain amount, or guess that boxes of the same size with different numbers of dots will have different masses.
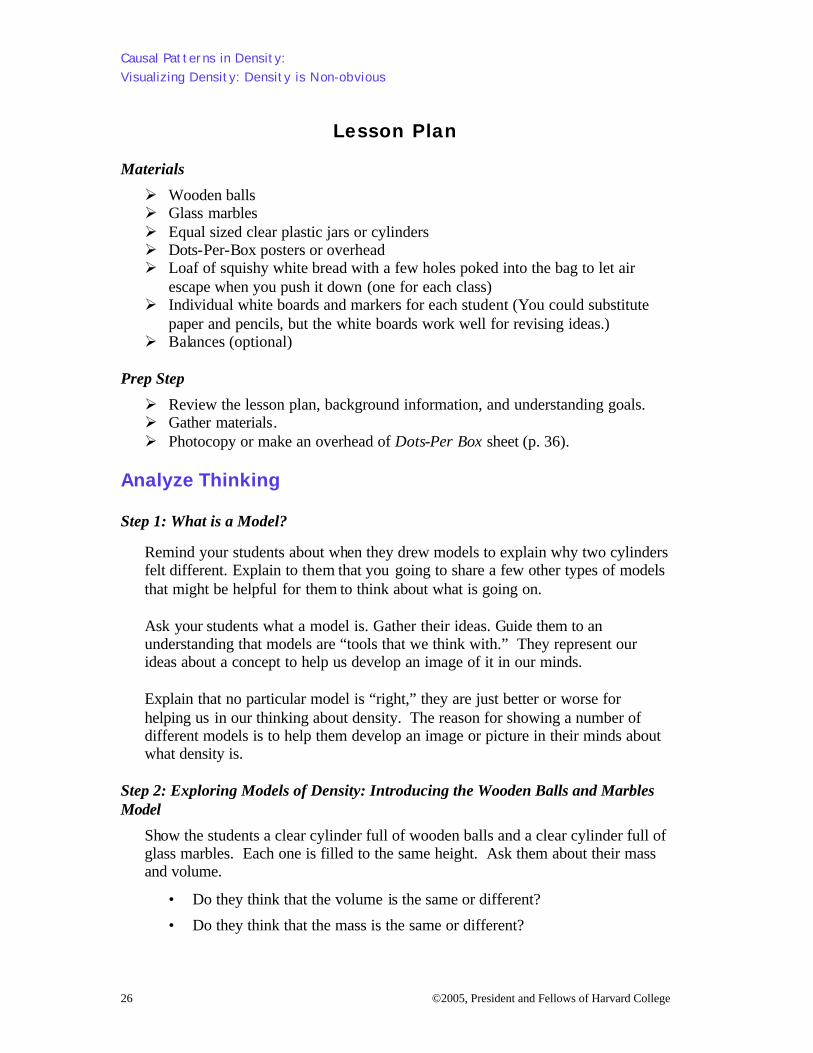
Bread Model: The bread model1 is a nice model for helping students to think about the amount of stuff in a given amount of space. If you listen carefully to students’ responses, you can get a fair amount of information about how they are reasoning. Some students may reveal that they do not understand conservation of matter. Others may not think of air as matter. The model controls
for mass (allowing for a small amount of mass due to the air inside the bread to be released when squished), but lets students see visual changes in volume. It illustrates how something that is more compact is more dense because the same amount of "stuff" has been packed into a smaller amount of space. It also introduces the concept of mixed density, in that students must consider air matter and bread matter. However, it is important to talk explicitly about air and space when talking about the bread model. Otherwise the model may inadvertently reinforce the notion that what makes something dense is whether or not it has air in it. When they learn about the micro-causes of density, they will see that there are some spaces that are too small for “air molecules” (or more correctly, the molecules that make up the air) to fit. While the bread model provides a good visual picture of "compactness," it doesn't necessarily help students develop a more sophisticated understanding of what's happening on a molecular level. However, it offers a good starting point for thinking about the relationship between volume and mass.
1 Hewitt, P. (1997). Conceptual Physics: 3rd Edition. Menlo Park: Addison Wesley.
Causal Patterns in Density: Visualizing Density: Density is Non-obvious
26 ©2005, President and Fellows of Harvard College
Lesson Plan Materials
Ø Wooden balls Ø Glass marbles Ø Equal sized clear plastic jars or cylinders Ø Dots-Per-Box posters or overhead Ø Loaf of squishy white bread with a few holes poked into the bag to let air
escape when you push it down (one for each class) Ø Individual white boards and markers for each student (You could substitute
paper and pencils, but the white boards work well for revising ideas.) Ø Balances (optional)
Prep Step
Ø Review the lesson plan, background information, and understanding goals. Ø Gather materials. Ø Photocopy or make an overhead of Dots-Per Box sheet (p. 36).
Analyze Thinking Step 1: What is a Model?
Remind your students about when they drew models to explain why two cylinders felt different. Explain to them that you going to share a few other types of models that might be helpful for them to think about what is going on. Ask your students what a model is. Gather their ideas. Guide them to an understanding that models are “tools that we think with.” They represent our ideas about a concept to help us develop an image of it in our minds. Explain that no particular model is “right,” they are just better or worse for helping us in our thinking about density. The reason for showing a number of different models is to help them develop an image or picture in their minds about what density is.
Step 2: Exploring Models of Density: Introducing the Wooden Balls and Marbles Model
Show the students a clear cylinder full of wooden balls and a clear cylinder full of glass marbles. Each one is filled to the same height. Ask them about their mass and volume.
• Do they think that the volume is the same or different?
• Do they think that the mass is the same or different?
Causal Patterns in Density: Visualizing Density: Density is Non-obvious
©2005, President and Fellows of Harvard College 27
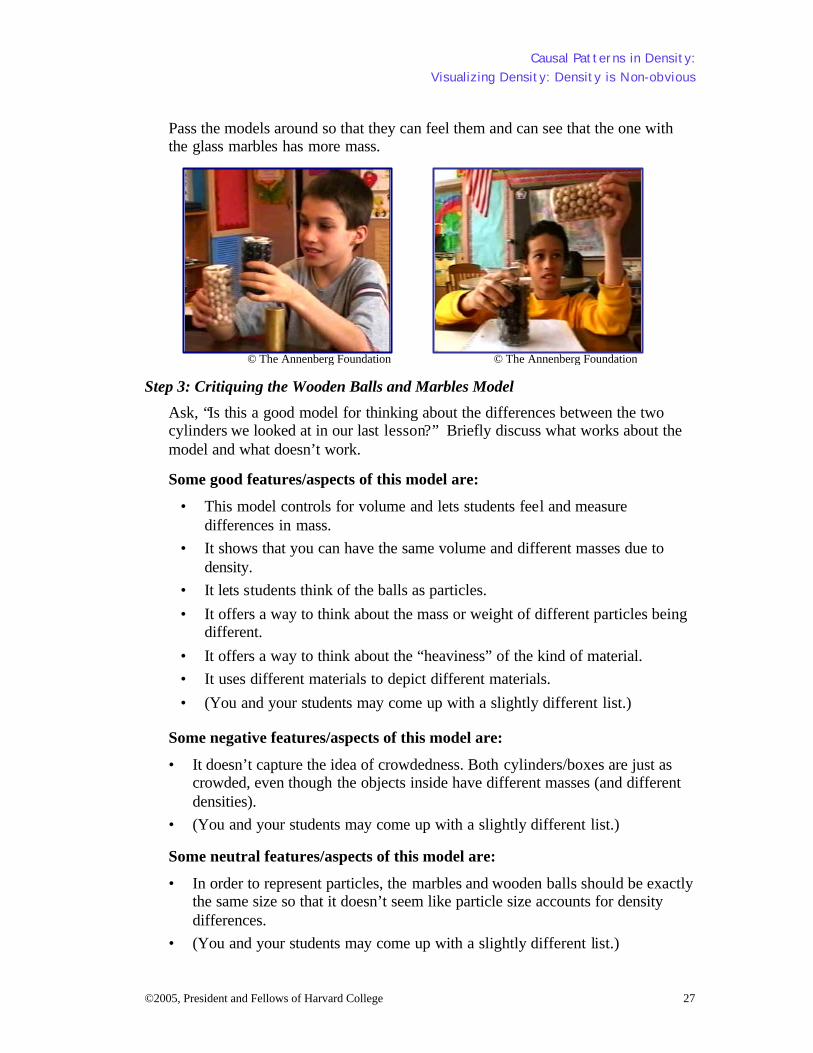
Pass the models around so that they can feel them and can see that the one with the glass marbles has more mass.
Step 3: Critiquing the Wooden Balls and Marbles Model
Ask, “Is this a good model for thinking about the differences between the two cylinders we looked at in our last lesson?” Briefly discuss what works about the model and what doesn’t work.
Some good features/aspects of this model are:
• This model controls for volume and lets students feel and measure differences in mass.
• It shows that you can have the same volume and different masses due to density.
• It lets students think of the balls as particles. • It offers a way to think about the mass or weight of different particles being
different. • It offers a way to think about the “heaviness” of the kind of material. • It uses different materials to depict different materials. • (You and your students may come up with a slightly different list.)
Some negative features/aspects of this model are:
• It doesn’t capture the idea of crowdedness. Both cylinders/boxes are just as crowded, even though the objects inside have different masses (and different densities).
• (You and your students may come up with a slightly different list.)
Some neutral features/aspects of this model are:
• In order to represent particles, the marbles and wooden balls should be exactly the same size so that it doesn’t seem like particle size accounts for density differences.
• (You and your students may come up with a slightly different list.)
© The Annenberg Foundation © The Annenberg Foundation
Causal Patterns in Density: Visualizing Density: Density is Non-obvious
28 ©2005, President and Fellows of Harvard College
Collect questions or issues that cannot be resolved at this point on the corner of the board or on chart paper. For instance, the issue of whether there is air or space between the particles may arise. Without going to the molecular level, there’s no easy way to resolve such questions. They will have a chance to revisit these questions later in the module.
Step 4: Improving the Wooden Balls and Marbles Model
Ask, “How could you improve the wooden balls and marbles model? What would you do to change it?” Have the students collaborate with at least one other student to draw and explain two ideas for how to improve it. Have them work on white boards so that they can make modifications as they listen to other students’ improvements.
Have students share and discuss their improvements. Step 5: Exploring Models of Density: Introducing the Dots-Per-Box Model
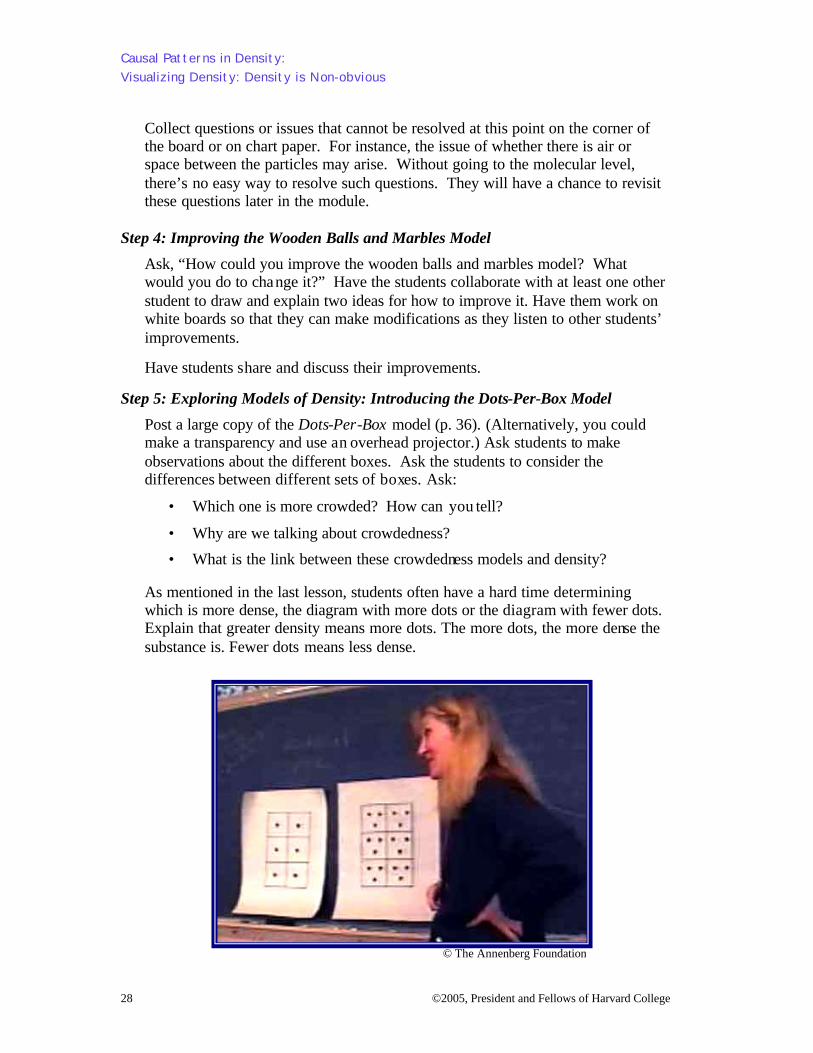
Post a large copy of the Dots-Per-Box model (p. 36). (Alternatively, you could make a transparency and use an overhead projector.) Ask students to make observations about the different boxes. Ask the students to consider the differences between different sets of boxes. Ask:
• Which one is more crowded? How can you tell?
• Why are we talking about crowdedness?
• What is the link between these crowdedness models and density?
As mentioned in the last lesson, students often have a hard time determining which is more dense, the diagram with more dots or the diagram with fewer dots. Explain that greater density means more dots. The more dots, the more dense the substance is. Fewer dots means less dense.
© The Annenberg Foundation
Causal Patterns in Density: Visualizing Density: Density is Non-obvious
©2005, President and Fellows of Harvard College 29
Step 6: Critiquing the Dots-Per-Box Model
Critique the model together.
Some positive features/aspects of this model include:
• It attempts to show what more or less crowding in a certain amount of space would look like.
• We have to measure or compare the volume and then count the dots to figure out density.
• It is similar to the models used in social studies to think about population density.
• It looks like particles.
• It captures how far apart or close together particles are.
• (You and your students may come up with a slightly different list.)
Some negative features/aspects of this model include:
• It doesn’t really offer a sense of how mass is a part of the density equation. (On the other hand, you could think of each little black box as weighing a certain amount, or guess that boxes of the same size with different numbers of dots will have different masses.)
• (You and your students may come up with a slightly different list.) Step 7: Exploring Models of Density: Introducing the Bread Model
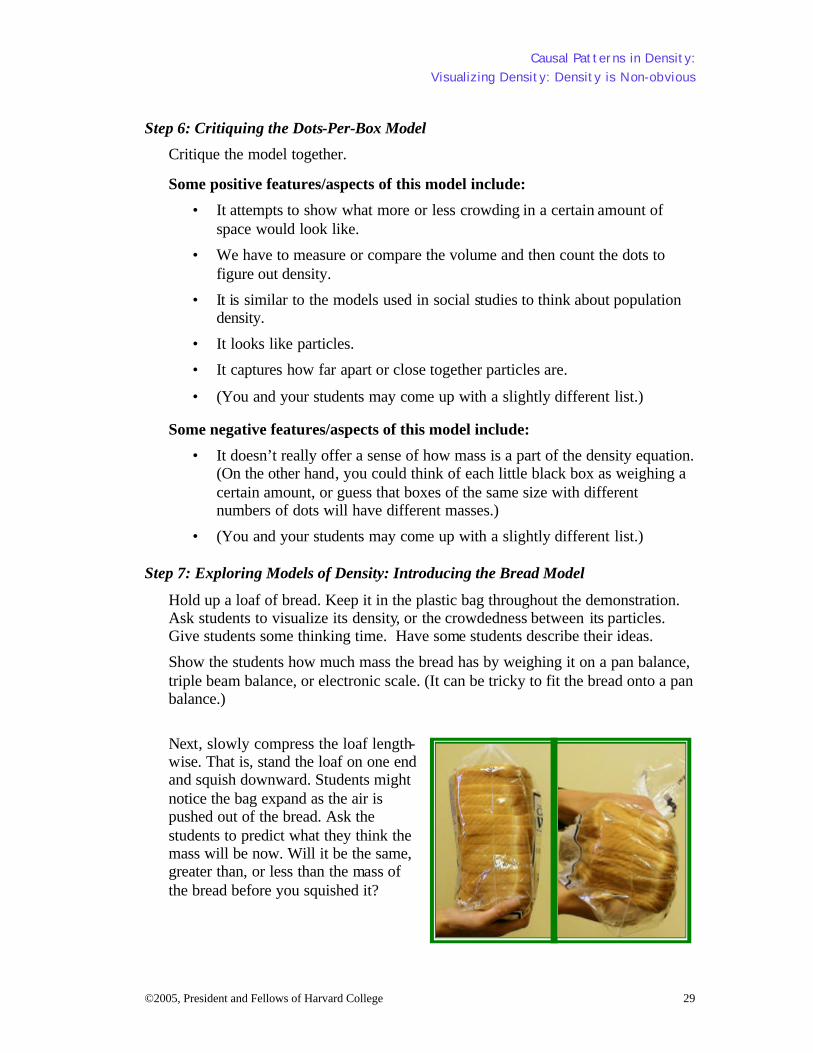
Hold up a loaf of bread. Keep it in the plastic bag throughout the demonstration. Ask students to visualize its density, or the crowdedness between its particles. Give students some thinking time. Have some students describe their ideas.
Show the students how much mass the bread has by weighing it on a pan balance, triple beam balance, or electronic scale. (It can be tricky to fit the bread onto a pan balance.)
Next, slowly compress the loaf length-wise. That is, stand the loaf on one end and squish downward. Students might notice the bag expand as the air is pushed out of the bread. Ask the students to predict what they think the mass will be now. Will it be the same, greater than, or less than the mass of the bread before you squished it?
Causal Patterns in Density: Visualizing Density: Density is Non-obvious
30 ©2005, President and Fellows of Harvard College
Weigh the bread to show that its mass did not change (as far as we can measure). What about the volume? Did it change? If so, how? Have students make predictions about crowdedness or density. Did the density change? If so, how? If not, why not? [Students should find that the mass of the bread doesn't change but the volume does decrease significantly. Therefore, before the bread is squished, its density is lower, with the stuff inside all spread out. After the bread is squished, its density is higher because you have the same amount of "stuff" (mass), but in a smaller space (volume).]
Step 8: Critiquing the Bread Model
Discuss the bread as a model: What works and what doesn’t? What could we do to improve the model? What does this model share that helps us understand density better?
Some positive features/aspects of this model include:
• The bread is essentially the same mass/weight before and after it is compressed. The model controls for mass (allowing for a small amount of mass—due to the air inside the bread—to be released when squished), but lets students see visual changes in volume.
• It helps to illustrate how something that is more compact is also more dense because there is more "stuff" in a smaller amount of space.
• It introduces the concept of "mixed densities." That is, it introduces the problem of how to measure density for objects that consist of more than one type of matter. In this case, students must consider the air inside the bread when thinking about its density.
• (You and your students may come up with a slightly different list.)
Encourage the students to grapple with the question of whether air is responsible for density. The bread clearly had air in it. Does all matter have density? Does everything have air in it? The bread is bread plus air. Make sure to engage students in explicit discussion that sometimes the spaces between particles are not air—they are just space. Explain that we will come back to this concept in a later lesson.
Note to Teacher: Take careful note of the students’ responses. Some of your students may think that because it is smaller, it will weigh less. This suggests that they are not conserving the amount of matter. However, other students may also think this but for a different reason. They may realize that air is matter and that if you push out the air (as you do when you compress it), the bread should weigh less. Technically, they are correct, but we do not have the instruments to measure this small a change in mass. Also, take note of whether students talk about air in between the bread “particles” or space between the bread “particles.”
Causal Patterns in Density: Visualizing Density: Density is Non-obvious
©2005, President and Fellows of Harvard College 31
Some negative features/aspects of this model include:
• The model may reinforce the notion that what makes something dense is whether or not it has air in it. Once you squish the air out, an object gets denser or more dense. Many students believe that air alone is what determines something's density. The more air inside an object, the less dense it will be.
• While the model provides a good visual picture of "compactness", it doesn't necessarily help students develop a more sophisticated understanding of what's happening on a molecular level. We will come back to this in Lessons 9, 10 and 11.
Review, Extend, Apply Step 9: Making Connections: Thinking About Density in the World
Between this lesson and the next one, ask the students to look at objects around them in the world and try to visualize what their density might be like. They should keep track of questions that come up, for instance, “Does all matter have density?” and so on. Encourage students to think about all different phases of matter and many different kinds of objects.
Causal Patterns in Density: Visualizing Density: Density is Non-obvious
32 ©2005, President and Fellows of Harvard College
Resources for Section 1
Lesson 1
Student Models Comparing Two Cylinders Lesson 2
Dots-Per-Box sheet
©2005, President and Fellows of Harvard College 33
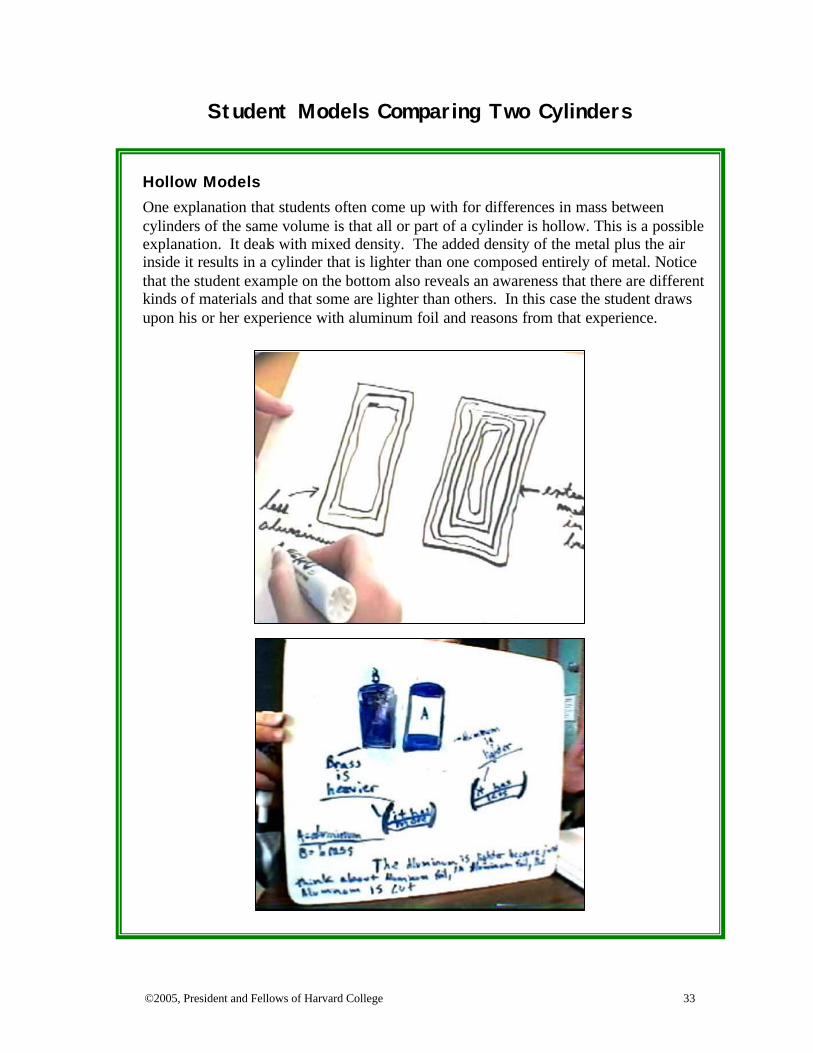
Hollow Models
One explanation that students often come up with for differences in mass between cylinders of the same volume is that all or part of a cylinder is hollow. This is a possible explanation. It deals with mixed density. The added density of the metal plus the air inside it results in a cylinder that is lighter than one composed entirely of metal. Notice that the student example on the bottom also reveals an awareness that there are different kinds of materials and that some are lighter than others. In this case the student draws upon his or her experience with aluminum foil and reasons from that experience.
Student Models Comparing Two Cylinders
34 ©2005, President and Fellows of Harvard College
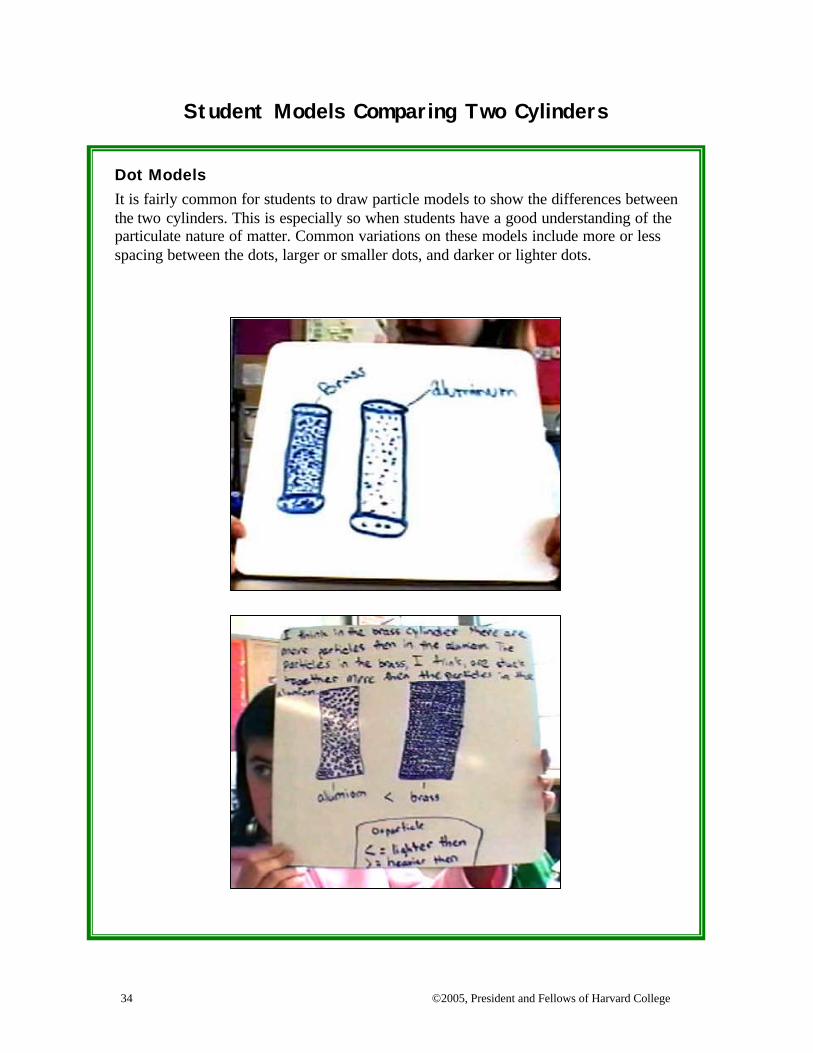
Dot Models
It is fairly common for students to draw particle models to show the differences between the two cylinders. This is especially so when students have a good understanding of the particulate nature of matter. Common variations on these models include more or less spacing between the dots, larger or smaller dots, and darker or lighter dots.
Student Models Comparing Two Cylinders
©2005, President and Fellows of Harvard College 35
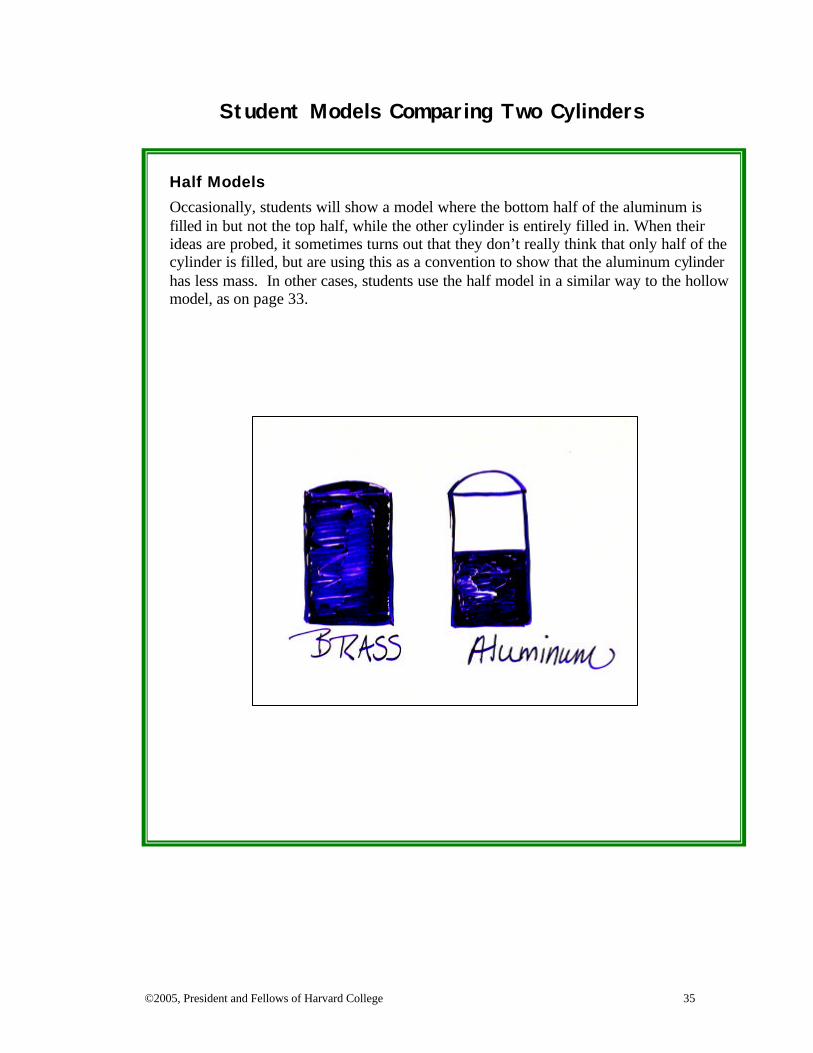
Half Models
Occasionally, students will show a model where the bottom half of the aluminum is filled in but not the top half, while the other cylinder is entirely filled in. When their ideas are probed, it sometimes turns out that they don’t really think that only half of the cylinder is filled, but are using this as a convention to show that the aluminum cylinder has less mass. In other cases, students use the half model in a similar way to the hollow model, as on page 33.
Student Models Comparing Two Cylinders
36 ©2005, President and Fellows of Harvard College
Dots-Per-Box
©2005, President and Fellows of Harvard College 37
SECTION 2
DEFINING DENSITY AS A RELATIONSHIP
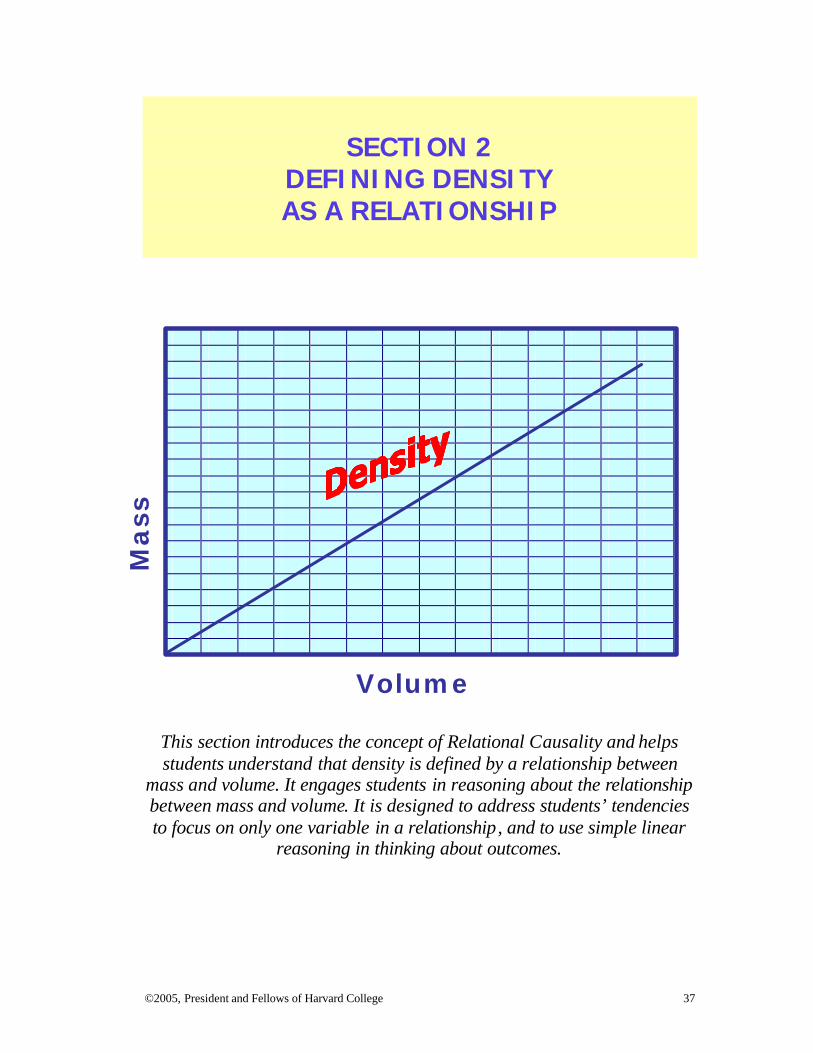
This section introduces the concept of Relational Causality and helps students understand that density is defined by a relationship between
mass and volume. It engages students in reasoning about the relationship between mass and volume. It is designed to address students’ tendencies to focus on only one variable in a relationship, and to use simple linear
reasoning in thinking about outcomes.
Mass
Volume
Mass
©2005, President and Fellows of Harvard College 38
Section 2 Table of Contents
Lesson 3: What Patterns Can Be Found Between Mass, Volume, and Density? ........39 Lesson 4: How Can We Calculate Density From the Relationship Between Mass and Volume?.......................................................................................................................47 Lesson 5: Why is Density Considered a Property of a Particular Kind of Material? ..55 Lesson 6: Do Liquids Have Density? ..........................................................................60 Lesson 7: Do Gases Have Density? .............................................................................64 Resources for Section 2 ...............................................................................................70
©2005, President and Fellows of Harvard College 39
Lesson 3 What Patterns Can Be Found Between Mass, Volume, and Density?
Understanding Goals Subject Matter
v Density can be inferred by knowing the relationship between mass and volume.
v For any given substance, there is a linear relationship between its mass and its volume: when one variable increases, the other variable increases, and vice versa. This consistent relationship between mass and volume constitutes a pattern, and we can use this pattern to make predictions about the mass of a substance based on its volume, or the volume of the substance based on its mass.
Causality
v Density is a relational concept. It requires that we hold two variables—mass and volume—in our heads and reason about their relationship, rather than focusing on a single variable.
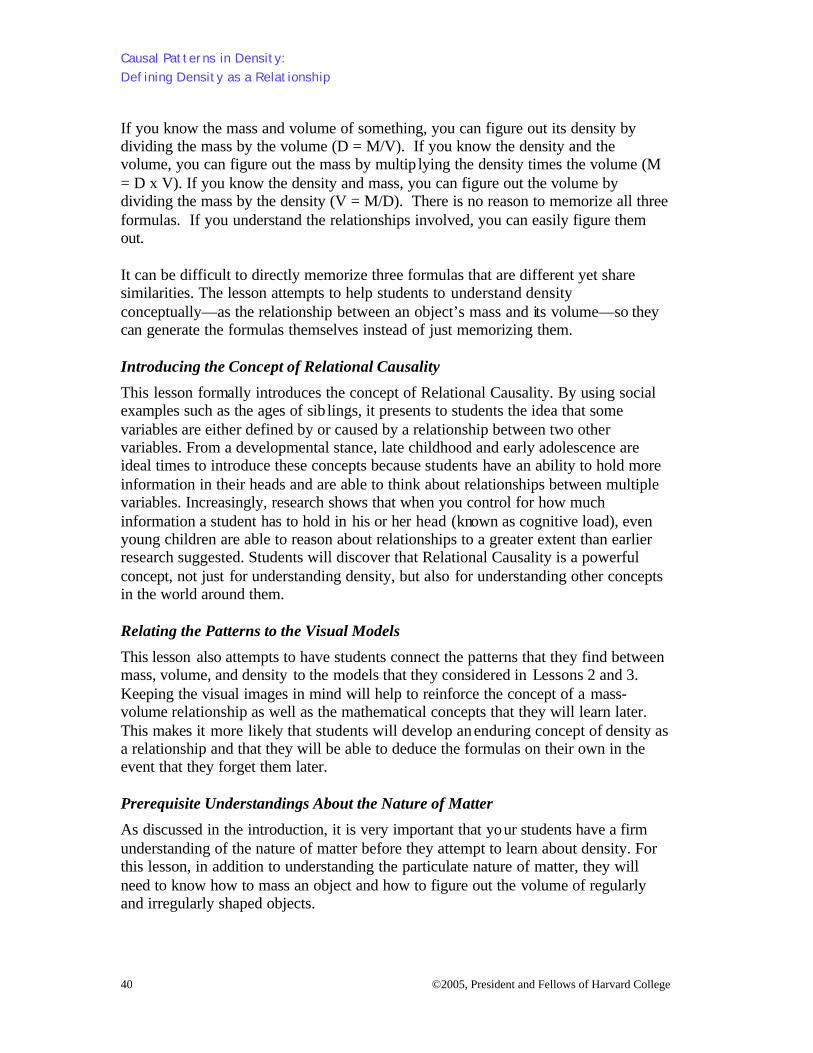
Background Information Finding the Pattern in the Relationship Between Mass and Volume to Discover Density
This lesson focuses on helping students discover the pattern in the relationship between mass and volume. As one variable changes for a given substance, how does the other change? The next lesson covers what most units on density typically cover—information on how to calculate density. However, this lesson looks first at the patterns between mass, volume, and density for a given substance. Instead of stressing the use of formulas to calculate density, it emphasizes using the relationship between mass and volume to infer the intensive quantity of density. By focusing on this relationship, students develop a strong mental model and a strong relational understanding of density. Scientists define density as the mass of a substance per unit of volume. It is the relationship between the mass (or weight) of one unit of a material and the vo lume of that one unit. Neither mass nor volume is sufficient to define density. Students need to reason about the relationship between mass and volume and understand that if the relationship between them changes, density will change.
Causal Patterns in Density: Defining Density as a Relationship
©2005, President and Fellows of Harvard College 40
If you know the mass and volume of something, you can figure out its density by dividing the mass by the volume (D = M/V). If you know the density and the volume, you can figure out the mass by multip lying the density times the volume (M = D x V). If you know the density and mass, you can figure out the volume by dividing the mass by the density (V = M/D). There is no reason to memorize all three formulas. If you understand the relationships involved, you can easily figure them out. It can be difficult to directly memorize three formulas that are different yet share similarities. The lesson attempts to help students to understand density conceptually—as the relationship between an object’s mass and its volume—so they can generate the formulas themselves instead of just memorizing them. Introducing the Concept of Relational Causality
This lesson formally introduces the concept of Relational Causality. By using social examples such as the ages of sib lings, it presents to students the idea that some variables are either defined by or caused by a relationship between two other variables. From a developmental stance, late childhood and early adolescence are ideal times to introduce these concepts because students have an ability to hold more information in their heads and are able to think about relationships between multiple variables. Increasingly, research shows that when you control for how much information a student has to hold in his or her head (known as cognitive load), even young children are able to reason about relationships to a greater extent than earlier research suggested. Students will discover that Relational Causality is a powerful concept, not just for understanding density, but also for understanding other concepts in the world around them. Relating the Patterns to the Visual Models
This lesson also attempts to have students connect the patterns that they find between mass, volume, and density to the models that they considered in Lessons 2 and 3. Keeping the visual images in mind will help to reinforce the concept of a mass-volume relationship as well as the mathematical concepts that they will learn later. This makes it more likely that students will develop an enduring concept of density as a relationship and that they will be able to deduce the formulas on their own in the event that they forget them later. Prerequisite Understandings About the Nature of Matter
As discussed in the introduction, it is very important that your students have a firm understanding of the nature of matter before they attempt to learn about density. For this lesson, in addition to understanding the particulate nature of matter, they will need to know how to mass an object and how to figure out the volume of regularly and irregularly shaped objects.
Causal Patterns in Density: Defining Density as a Relationship
©2005, President and Fellows of Harvard College 41
Lesson Plan Materials
Ø 5 or 6 samples of one pure substance: copper, aluminum, or steel, for instance (It is ideal to have 5 different sizes ranging from 1 cm3 to 30 cm3 and enough sets of samples of a material for each group of 4 students)
Ø White boards and markers Ø Triple beam balances Ø Graduated cylinders Ø Water Ø Paper towels Ø Newspaper Ø Journals Ø Rulers Ø Chart paper for class graph (alternatively, students could chart them on a class
overhead) Ø Marking pens Ø Finding and Graphing Mass and Volume of Pure Substances sheet Ø Mapping Relational Causality: Density sheet Ø Mapping Simple Linear Causality sheet (optional) Ø What is Relational Causality? sheet
Prep Step
Ø Review the lesson plan, background information, and understanding goals. Ø Gather materials. Ø Photocopy the sheets: Finding and Graphing Mass and Volume of Pure
Substances (p. 71); Mapping Relational Causality: Density (p. 74); Mapping Simple Linear Causality (p. 75); and What is Relational Causality? (p. 77).
Analyze Thinking Step 1: Finding the Relationship between the Mass and Volume of Pure Substances
Remind the students that they have been looking at how two objects with the same volume can have different mass and that they have been developing models to help explain what is going on. The concept of density was introduced in the previous two lessons. This lesson explores what happens with the density when you have different amounts of the same material. In previous lessons, we investigated what happened when we had the same amounts of different materials. Now we will examine different amounts of the same material.
Causal Patterns in Density: Defining Density as a Relationship
©2005, President and Fellows of Harvard College 42
Divide the class into working groups of approximately four students. Give each group of students one of the set of five or six samples of one pure substance (copper, aluminum, or steel, for instance). Ask them to make some observations about the volume and felt weight (in lieu of mass since they are not using the balance yet) of the samples. Ask them to make some predictions about the density of the samples. Have them choose two of the samples and draw models of each showing what they think they would see if they had microscopic eyes as they did in Lesson 1. Circulate while students are working to gather a sense of their ideas.
Explore Outcomes
Step 2: Finding the Relationship Between Mass and Volume of Pure Substances
Explain to your students that they are going to explore the relationship between mass and volume for the various samples. First, they need to find out the mass and volume of each sample. Remind your students how to find the mass of a sample using the pan balance and gram masses (see related side box on p. 43). Remind them how they can find the volume of regular and irregular objects (see related side box on p. 44).
Pass out the sheet, Finding and Graphing Mass and Volume of Pure Substances (p. 71). Have the students measure the mass and volume of various samples of a pure substance and plot their results on a graph.
After the students have done one sample of the substance, have them work on a second sample by trading with another group that has a different sample of the same substance (see pp. 72-73 for examples).
Step 3: Analyzing the Patterns Between Mass and Volume
Have the students plot their data points on a class chart (either drawn on paper or a transparency of the graph sheet) for the materials they have measured. What patterns do they notice?
After each group has plotted their examples, ask the students what they have learned. Write their ideas on the board and ask what conclusions can be drawn. Ask them to interpret directly from the graph. What big messages does this activity tell them about density?
The students should notice that the relationship between mass and volume is constant for a pure substance under standard conditions. The graph should show a straight line. This is the graphic equivalent of saying that the relationship is constant and also the “pattern.”
This relationship can be calculated and expressed as a number, and we will use mathematical formulas to represent the relationship and to calculate densities in the next lesson.
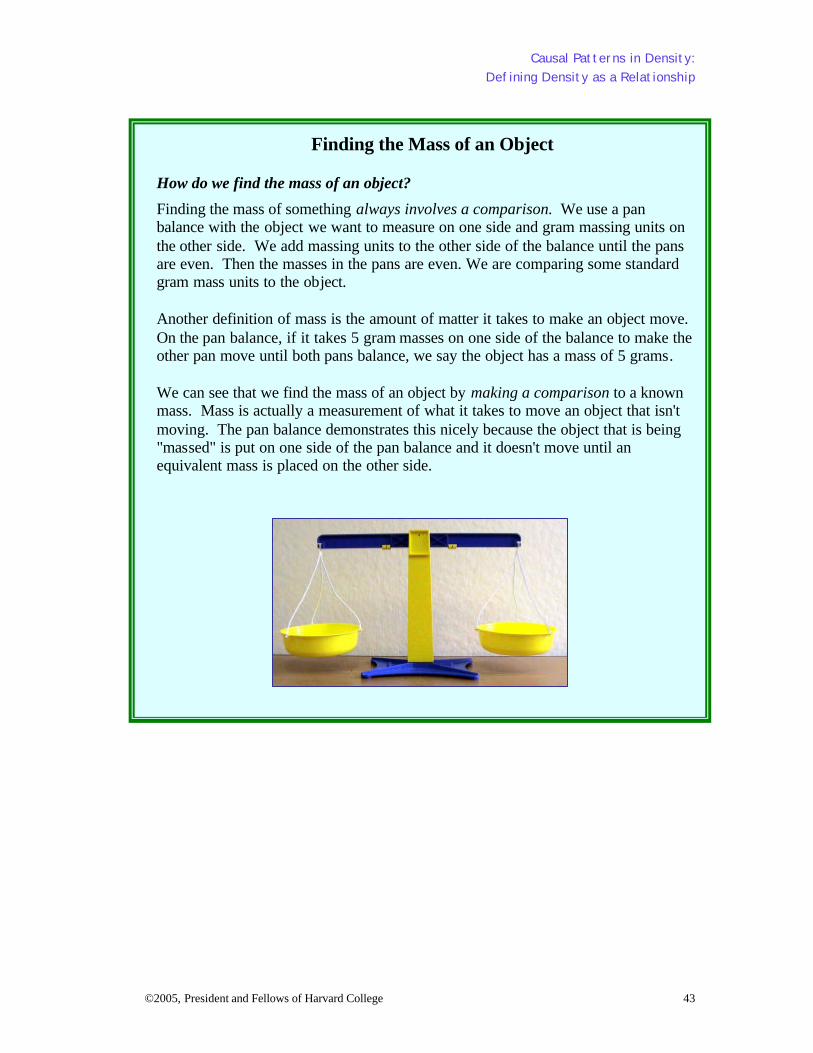
Causal Patterns in Density: Defining Density as a Relationship
©2005, President and Fellows of Harvard College 43
Finding the Mass of an Object
How do we find the mass of an object?
Finding the mass of something always involves a comparison. We use a pan balance with the object we want to measure on one side and gram massing units on the other side. We add massing units to the other side of the balance until the pans are even. Then the masses in the pans are even. We are comparing some standard gram mass units to the object.
Another definition of mass is the amount of matter it takes to make an object move. On the pan balance, if it takes 5 gram masses on one side of the balance to make the other pan move until both pans balance, we say the object has a mass of 5 grams.
We can see that we find the mass of an object by making a comparison to a known mass. Mass is actually a measurement of what it takes to move an object that isn't moving. The pan balance demonstrates this nicely because the object that is being "massed" is put on one side of the pan balance and it doesn't move until an equivalent mass is placed on the other side.
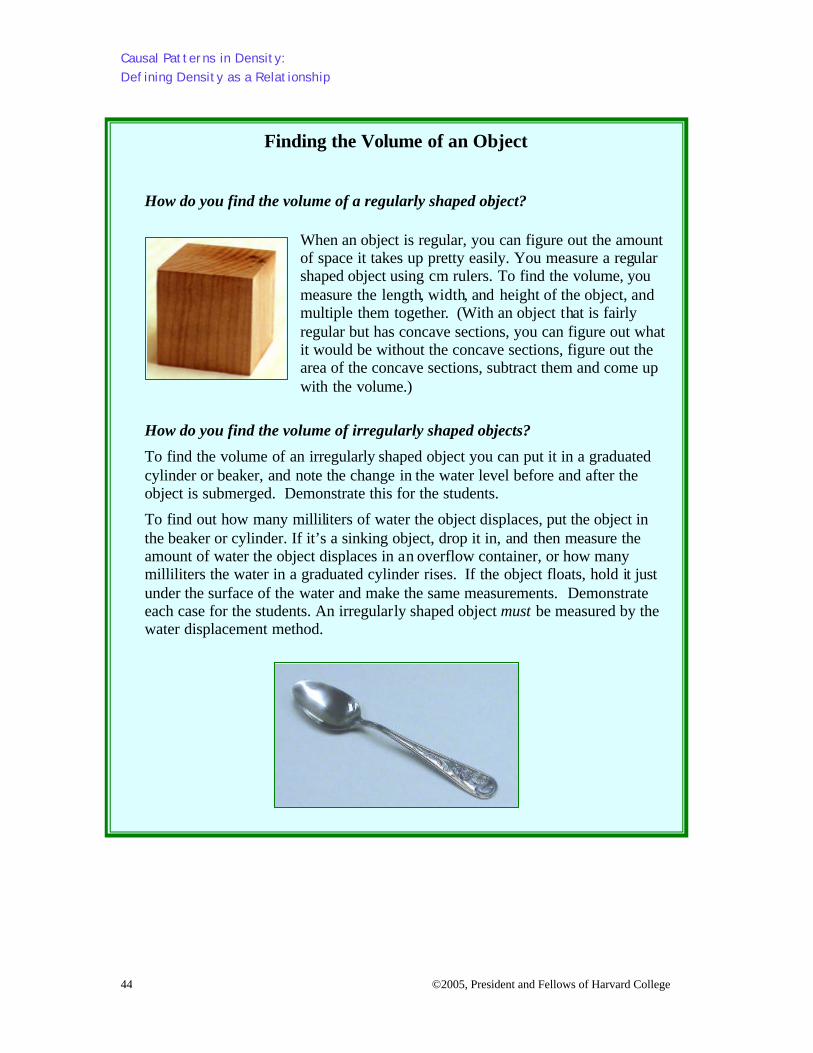
Causal Patterns in Density: Defining Density as a Relationship
©2005, President and Fellows of Harvard College 44
Finding the Volume of an Object
How do you find the volume of a regularly shaped object?
When an object is regular, you can figure out the amount of space it takes up pretty easily. You measure a regular shaped object using cm rulers. To find the volume, you measure the length, width, and height of the object, and multiple them together. (With an object that is fairly regular but has concave sections, you can figure out what it would be without the concave sections, figure out the area of the concave sections, subtract them and come up with the volume.)
How do you find the volume of irregularly shaped objects?
To find the volume of an irregularly shaped object you can put it in a graduated cylinder or beaker, and note the change in the water level before and after the object is submerged. Demonstrate this for the students.
To find out how many milliliters of water the object displaces, put the object in the beaker or cylinder. If it’s a sinking object, drop it in, and then measure the amount of water the object displaces in an overflow container, or how many milliliters the water in a graduated cylinder rises. If the object floats, hold it just under the surface of the water and make the same measurements. Demonstrate each case for the students. An irregularly shaped object must be measured by the water displacement method.
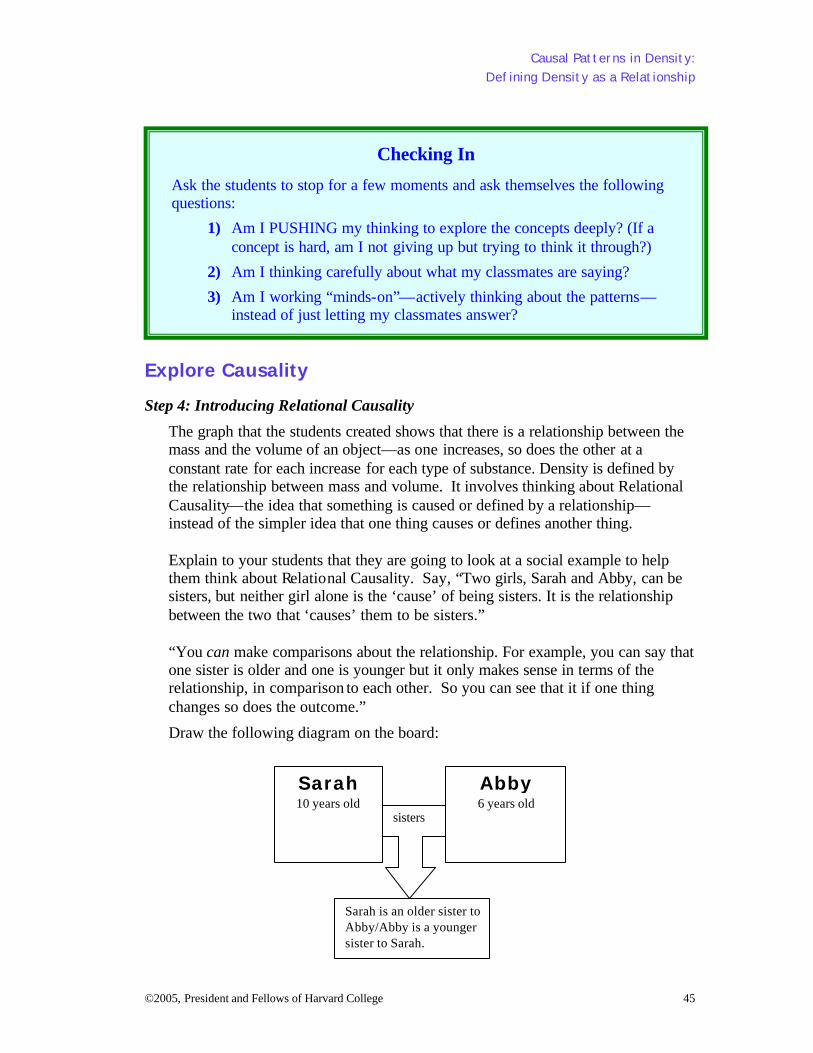
Causal Patterns in Density: Defining Density as a Relationship
©2005, President and Fellows of Harvard College 45
Checking In
Ask the students to stop for a few moments and ask themselves the following questions:
1) Am I PUSHING my thinking to explore the concepts deeply? (If a concept is hard, am I not giving up but trying to think it through?)
2) Am I thinking carefully about what my classmates are saying?
3) Am I working “minds-on”—actively thinking about the patterns—instead of just letting my classmates answer?
Explore Causality Step 4: Introducing Relational Causality
The graph that the students created shows that there is a relationship between the mass and the volume of an object—as one increases, so does the other at a constant rate for each increase for each type of substance. Density is defined by the relationship between mass and volume. It involves thinking about Relational Causality—the idea that something is caused or defined by a relationship—instead of the simpler idea that one thing causes or defines another thing.
Explain to your students that they are going to look at a social example to help them think about Relational Causality. Say, “Two girls, Sarah and Abby, can be sisters, but neither girl alone is the ‘cause’ of being sisters. It is the relationship between the two that ‘causes’ them to be sisters.”
“You can make comparisons about the relationship. For example, you can say that one sister is older and one is younger but it only makes sense in terms of the relationship, in comparison to each other. So you can see that it if one thing changes so does the outcome.”
Draw the following diagram on the board:
Sarah is an older sister to Abby/Abby is a younger sister to Sarah.
sisters
Abby 6 years old
Sarah 10 years old
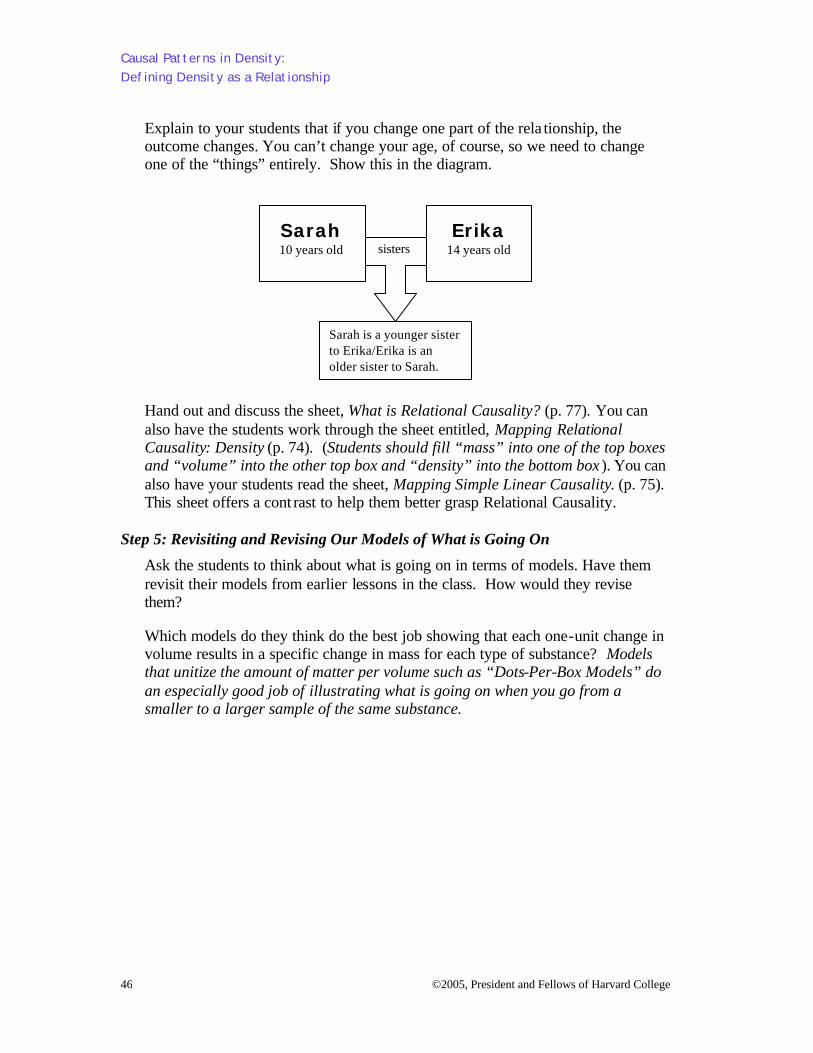
Causal Patterns in Density: Defining Density as a Relationship
©2005, President and Fellows of Harvard College 46
Explain to your students that if you change one part of the rela tionship, the outcome changes. You can’t change your age, of course, so we need to change one of the “things” entirely. Show this in the diagram.
Hand out and discuss the sheet, What is Relational Causality? (p. 77). You can also have the students work through the sheet entitled, Mapping Relational Causality: Density (p. 74). (Students should fill “mass” into one of the top boxes and “volume” into the other top box and “density” into the bottom box ). You can also have your students read the sheet, Mapping Simple Linear Causality. (p. 75). This sheet offers a cont rast to help them better grasp Relational Causality.
Step 5: Revisiting and Revising Our Models of What is Going On
Ask the students to think about what is going on in terms of models. Have them revisit their models from earlier lessons in the class. How would they revise them?
Which models do they think do the best job showing that each one-unit change in volume results in a specific change in mass for each type of substance? Models that unitize the amount of matter per volume such as “Dots-Per-Box Models” do an especially good job of illustrating what is going on when you go from a smaller to a larger sample of the same substance.
Sarah is a younger sister to Erika/Erika is an older sister to Sarah.
sisters
Erika 14 years old
Sarah 10 years old
©2005, President and Fellows of Harvard College 47
Lesson 4 How Can We Calculate Density From the Relationship Between Mass and Volume?
Understanding Goals Subject Matter
v Density can be calculated by knowing the relationship between mass and volume.
v Density is measured in units of mass per volume: g/cm3 (grams per cubic centimeter) or g/ml (grams per milliliter).
v If you know the mass and volume of something, you can figure out its density by dividing the mass by the volume (D = M/V). If you know the density and the volume, you can figure out the mass by multiplying the density times the volume (M = D x V). If you know the density and mass, you can figure out the volume by dividing the mass by the density (V = M/D). There is no reason to memorize all three formulas. If you understand the relationships involved, you can easily figure them out.
Causality
v Density is a relational concept. It requires that we hold two variables, mass and volume, in our heads and reason about their relationships rather than focus on a single variable.
Background Information Using the Relationship Between Mass and Volume to Calculate Density
This lesson introduces information on how to calculate density by focusing on the relationship between mass and volume. Scientists define density as the mass of a substance per unit volume. It is the relationship between the mass (or weight) of one unit of a material and the vo lume of that one unit. Density is expressed in terms of grams per cubic centimeter (g/cm3) or grams per milliliter (g/ml). If you know the mass and volume of an object or substance, you can figure out its density by dividing the mass by the volume (D = M/V). If you know the density and the volume, you can figure out the mass by multiplying the density times the volume (M = D x V). If you know the density and mass, you can figure out the volume by dividing the mass by the density (V = M/D).
Causal Patterns in Density: Defining Density as a Relationship
©2005, President and Fellows of Harvard College 48
It can be difficult to directly memorize three formulas that are different but similar. However, there is no reason to memorize all three formulas. If students realize conceptually what is going on (that density is just the amount of matter for a given amount of space), they can easily figure out the formulas if they forget them. This lesson builds on the concept of Relational Causality introduced in the last lesson by showing students that if just the mass or volume of an object could change, it would affect the relationship between them and the density would change. Relating the Formulas to the Visual Models
This lesson also attempts to help students connect the mathematical formula for density with what is going on in the models of density that they considered in Lessons 1 and 2. Having a visual image of density helps to reinforce the mathematical concepts, and makes it more likely that students will develop an enduring concept of density as a relationship. It also increases the likelihood that they will be able to deduce the formulas on their own in the event that they forget them later. This is important because the formulas are difficult to remember without a deep understanding of what they mean to back them up. The surface similarities of the three formulas will instead cause them to blur together.
Causal Patterns in Density: Defining Density as a Relationship
©2005, President and Fellows of Harvard College 49
Lesson Plan Materials
Ø Calculating Density sheet Ø Practice Using the Relationship Between Mass, Volume, and Density to
Calculate the Unknown Variable sheet Prep Step
Ø Review the lesson plan, background information, and understanding goals. Ø Photocopy the sheets, Calculating Density (p. 78) and Practice Using the
Relationship between Mass, Volume, and Density to Calculate the Unknown Variable (p. 79).
Explore Causality Step 1: Analyzing What Happens to the Relationship between Mass and Volume with the Same Substance
Remind the students about the patterns in terms of Relational Causality and density that they found in the last lesson; how when volume increased, so did mass.
The students learned that the relationship between mass and volume is constant for a pure substance under standard conditions. The relationship between the mass and the volume of any specimen has the same relationship.
Step 2: Analyzing What Happens to the Relationship between Mass and Volume with Different Substances in Terms of Relational Causality and Density
Explain to your students that the relationship between mass and volume works in the same relational way to define or “cause” density. Use examples from the samples that they tested in this lesson.
Note to Teacher: The numbers for volume and mass below will need to be modified based on your actual samples. Replace these examples with your smallest sample and two larger samples.
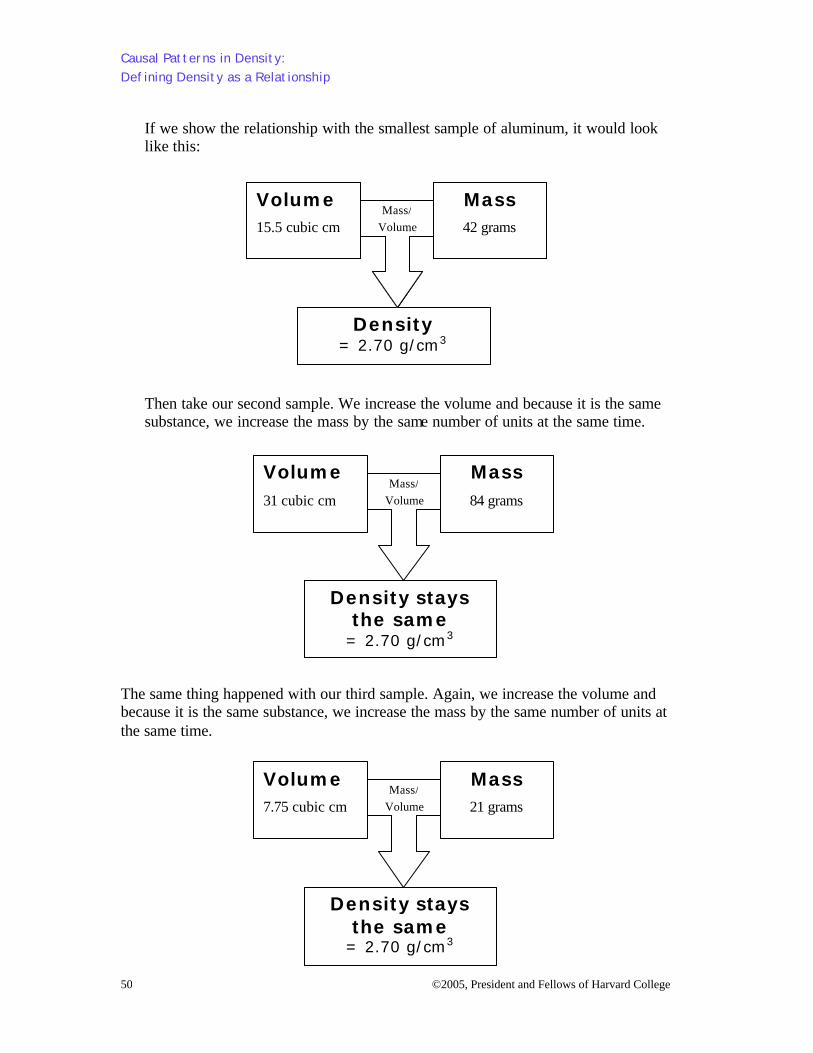
Causal Patterns in Density: Defining Density as a Relationship
©2005, President and Fellows of Harvard College 50
If we show the relationship with the smallest sample of aluminum, it would look like this:
Then take our second sample. We increase the volume and because it is the same substance, we increase the mass by the same number of units at the same time.
The same thing happened with our third sample. Again, we increase the volume and because it is the same substance, we increase the mass by the same number of units at the same time.
Mass/ Volume Mass/
Volume
Volume
15.5 cubic cm
Mass
42 grams
Volume
15.5 cubic cm
Density = 2.70 g/cm3
Mass/ Volume
Mass
42 grams
Volume
15.5 cubic cm
Density stays the same
= 2.70 g/cm3
Mass/ Volume
Mass
84 grams
Volume
31 cubic cm
Density stays the same
= 2.70 g/cm3
Mass/ Volume
Mass
21 grams
Volume
7.75 cubic cm
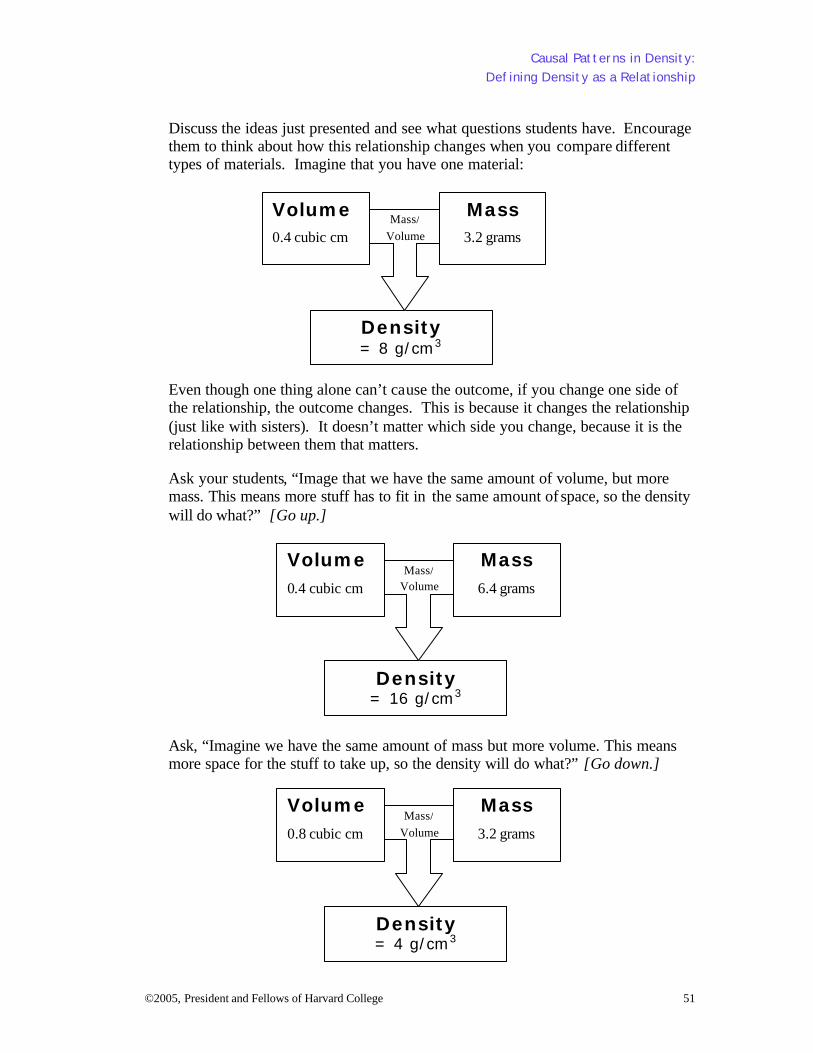
Causal Patterns in Density: Defining Density as a Relationship
©2005, President and Fellows of Harvard College 51
Discuss the ideas just presented and see what questions students have. Encourage them to think about how this relationship changes when you compare different types of materials. Imagine that you have one material:
Even though one thing alone can’t cause the outcome, if you change one side of the relationship, the outcome changes. This is because it changes the relationship (just like with sisters). It doesn’t matter which side you change, because it is the relationship between them that matters. Ask your students, “Image that we have the same amount of volume, but more mass. This means more stuff has to fit in the same amount of space, so the density will do what?” [Go up.]
Ask, “Imagine we have the same amount of mass but more volume. This means more space for the stuff to take up, so the density will do what?” [Go down.]
Density = 8 g/cm3
Mass/ Volume
Mass
3.2 grams
Volume
0.4 cubic cm
Density = 16 g/cm3
Mass/ Volume
Mass
6.4 grams
Volume
0.4 cubic cm
Density = 4 g/cm3
Mass/ Volume
Mass
3.2 grams
Volume
0.8 cubic cm
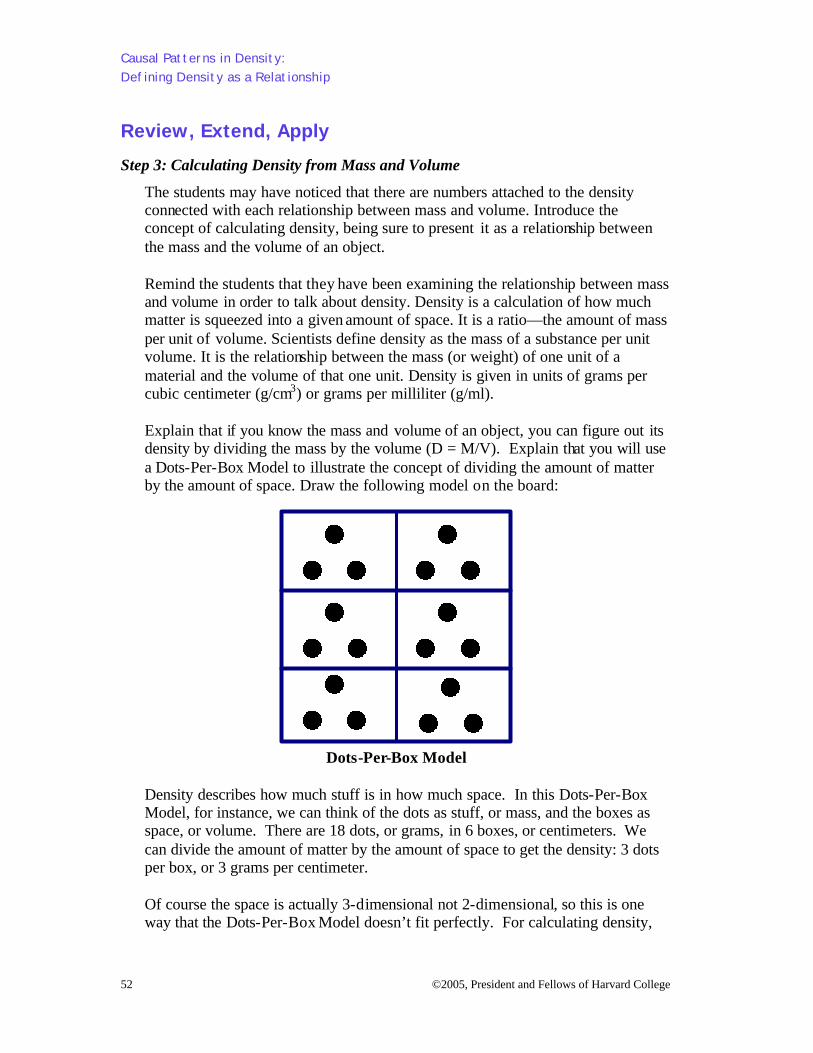
Causal Patterns in Density: Defining Density as a Relationship
©2005, President and Fellows of Harvard College 52
Review, Extend, Apply Step 3: Calculating Density from Mass and Volume
The students may have noticed that there are numbers attached to the density connected with each relationship between mass and volume. Introduce the concept of calculating density, being sure to present it as a relationship between the mass and the volume of an object. Remind the students that they have been examining the relationship between mass and volume in order to talk about density. Density is a calculation of how much matter is squeezed into a given amount of space. It is a ratio—the amount of mass per unit of volume. Scientists define density as the mass of a substance per unit volume. It is the relationship between the mass (or weight) of one unit of a material and the volume of that one unit. Density is given in units of grams per cubic centimeter (g/cm3) or grams per milliliter (g/ml).
Explain that if you know the mass and volume of an object, you can figure out its density by dividing the mass by the volume (D = M/V). Explain that you will use a Dots-Per-Box Model to illustrate the concept of dividing the amount of matter by the amount of space. Draw the following model on the board:
Dots-Per-Box Model
Density describes how much stuff is in how much space. In this Dots-Per-Box Model, for instance, we can think of the dots as stuff, or mass, and the boxes as space, or volume. There are 18 dots, or grams, in 6 boxes, or centimeters. We can divide the amount of matter by the amount of space to get the density: 3 dots per box, or 3 grams per centimeter. Of course the space is actually 3-dimensional not 2-dimensional, so this is one way that the Dots-Per-Box Model doesn’t fit perfectly. For calculating density,
Causal Patterns in Density: Defining Density as a Relationship
©2005, President and Fellows of Harvard College 53
we use cubic centimeters, not centimeters. Another way that the Dots-Per-Box Model doesn’t fit exactly is that we can’t know the mass of each dot of matter.
Step 4: Introducing Formulas for Calculating Density
Introduce the three formulas:
1) If you know the mass and volume of an object or substance, you can figure out its density by dividing the mass by the volume (D = M/V).
2) If you know the density and the volume of an object or substance, you can
figure out its mass by multiplying the density times the volume (M = D x V).
3) If you know the density and mass of an object or substance, you can figure
out its volume by dividing the mass by the density (V = M/D). Tell the students that it can be difficult to directly memorize three formulas that are different, but similar in many respects. However, there is no reason to memorize all three formulas. If they understand that density is just the amount of matter for a given amount of space, then they can easily figure out the formulas.
Step 5: Demonstrating the Formulas
Show students how density is calculated using the following examples. There is a sheet entitled, Calculating Density (p. 78) included in case you would like the students to calculate these examples on their own first.
• 4 cubic centimeters of a mystery substance has a mass of 3.2 grams. What is the density? [0.8 g/cm3]
• A diamond with a volume of 2 cubic centimeters has a mass of 7 grams. What is its density? [3.5 g/cm3]
• The density of cork is 0.2 g per cm3. If I have a cork with a mass of 0.4, what would its volume be? [2 cm3]
• The density of steel is 7.8 g/cm3. If you have a steel cube that has a volume of 10 cm3, what is its mass? [78 g]
Step 6: Practice Using the Relationship between Mass, Volume, and Density to Calculate the Unknown Variable
Hand out the sheet entitled, Practice Using the Relationship Between Mass, Volume, and Density to Calculate the Unknown Variable (p. 79). This sheet is designed for students to practice calcula ting the density of solids. Circulate while your students are working to make sure that they understand the mathematical aspects of calculating density.
Causal Patterns in Density: Defining Density as a Relationship
©2005, President and Fellows of Harvard College 54
Step 7: A Discussion: Can You “Measure” Density?
Pose the following question to the students: Some textbooks say, “The density of a solid can be measured...” What do you think about the word “measured”? Engage the students in a discussion of whether or not this is a good word choice. Can density be directly measured? Help the students to realize that density can be figured out or calculated, but it can’t be directly measured. This reinforces the idea that density is a relationship and that it is an intensive quantity.
©2005, President and Fellows of Harvard College 55
Lesson 5 Why is Density Considered a Property of a Particular Kind of Material?
Understanding Goals Subject Matter
v Density is not affected by the size or shape of the object. v The density of a certain substance or kind of matter does not change if the
amount of matter in a given object changes. You can have more or less matter without affecting density, as long as the substance stays the same.
v Specific densities are assigned to specific elements. These are numbers that define the density of the elements under standard conditions of temperature and pressure.
v The density of a substance can be used to help identify that substance. Causality
v Because density is determined by a relationship, if you cut an object in half so that you have less volume, you also have less mass, so the relationship—the density—stays the same.
v One of the reasons that it is hard to realize that cutting an object in half doesn’t change its density is that we forget to focus on the relationship between mass and volume and instead focus on either mass or volume.
Background Information Confusions About Whether Density is Independent of Size and Shape
Students are often confused about how the size or shape of an object affects its density. For instance, they typically think that cutting an object in half must affect its density. This suggests that they are still focusing on either the mass or the volume and not acknowledging the relationship of mass to volume. They may also get confused when they are dealing with the same material in a very different shape. For instance, in talking about a piece of steel wool, they’ll say it is not very dense because of all the air inside of it. In this sense, they don't think about the steel wool as very thin pieces of pure steel. In fact, the density of a pure piece of steel is the same as the thin fibers of pure steel. Of course it feels lighter to the students because the overall space of the steel wool pad is a mixed density that includes air and steel. Introducing the Idea of Assigning Numbers for Density Under Standard Conditions
This lesson introduces the concept of assigning numbers for density under standard conditions and presents the idea that density can be used to help identify different
Causal Patterns in Density: Defining Density as a Relationship
©2005, President and Fellows of Harvard College 56
substances. However, it also addresses confusions that students often have after learning about assigned numbers for density. Some students may wonder how density can be a relationship between mass and volume and yet be a set property of particular substances. This lesson reinforces students' understanding of the difference between properties of materials and properties of objects. Introducing the idea of specific numbers for density can invite confusions about the nature of density. Students often take away the mistaken idea that density cannot change under any condition. Instead, we want them to realize that these numbers refe r to the density of a substance under standard conditions of temperature and pressure. Even textbooks often miss this point. Missing the caveat about temperature and pressure makes it difficult to understand instances in the real world where density does change, such as in heating of gases, freezing of certain liquids, etc. For this reason, it is important to teach Lesson 12, Can the Density of Solids, Liquids, and Gases Change? and to discuss with students what it does and does not mean to say that density is a property.
Causal Patterns in Density: Defining Density as a Relationship
©2005, President and Fellows of Harvard College 57
Lesson Plan Materials
Ø Graduated cylinder Ø Catch pan Ø Balance Ø Gram masses Ø A Styrofoam cylinder (approximately 8 inches long and 2 inches diameter)
that can be cut in half Ø Densities of Common Substances Under Standard Conditions Table Ø Archimedes and the Golden Crown sheet
Prep Step
Ø Review the lesson plan, background information, and understanding goals. Ø Gather materials. Ø Make a transparency of the Densities of Common Substances Under Standard
Conditions Table (p. 81). Ø Photocopy the sheet, Archimedes and the Golden Crown (p. 82).
Analyze Thinking Step 1: Why is Density Considered a Property of a Particular Kind of Material?
Ask the students to think of examples of properties of materials (such as color, hardness, texture, odor, break-ability, boiling point, melting point), as opposed to properties of objects (such as size and shape). Generate a list of examples on the board. Ask, "Does it make sense that density is a property of a certain kind of material? Why or why not?"
Step 2: Does Cutting an Object in Half Affect its Density?
Students may be aware that the size and shape of an object does not affect its density from the activity in Lesson 3. However, many students are still unclear on this point. As a reinforcement activity, have the students work in small groups. Give each group a long cylinder of Styrofoam. Ask each group to think about what would happen if you only had half of the cylinder. Would the density change or not? Make sure that students first calculate the density of the entire cylinder.
Explore Outcomes Step 3: Testing Predictions
Have each group discuss their predictions and how they would test them. They should explain not only whether they think the density would change or not but how. Students who think that the density would change typically predict that it
Causal Patterns in Density: Defining Density as a Relationship
©2005, President and Fellows of Harvard College 58
will be half. Then have students test the density of the Styrofoam cylinders by using the catch pans, graduated cylinders, balance, and gram masses. After the students have calculated the density for the whole object and for half of it, discuss their findings. They should find that the density is approximately the same. There will be very slight variations because Styrofoam is actually a mixed density of Styrene plus air. However, they will find that the density is certainly not half of what it was for the whole cylinder. For now, you can talk about the slight variations as due to measurement variations. After Lesson 10 where students learn about mixed density, you can come back to this activity as an example. Next, pose the question, “What if I kept cutting this in half until I had a very tiny fragment? What would happen to the density?” Show the students a very tiny piece of the Styrofoam. Have them discuss their ideas in their groups and find a way to show what the outcome could be. Circulate while they are working and encourage them to use various models (Particle, Dot-Per-Box, or other models) and to demonstrate it mathematically. Some students may want to actually try their ideas. What kinds of difficulties do they think they might run into?
Explore Causality Step 4: Why is it Hard to Realize That Density Doesn’t Change with Size or Shape?
Ask students to think about how volume, mass and weight can be measured, and point out that different sized pieces of the same kind of material will have different volumes and masses. Compare this to the density of a pure substance, which is the same no matter what size the piece is (at stable pressure and temperature). The density is not affected by the size or shape of the object. While it is possible to logically reason that taking half of the cylinder again and again until you have a tiny fragment would result in a piece with the same density, this is still counterintuitive for most of us. Ask the students, “Why do you think it is hard for people to realize that cutting the cylinder in half does not change its density?” Gather their ideas. There are at least two reasons that have to do with how we reason about causality:
• One has to do with Relational Causality. It is hard to focus on the relationship of mass to volume, which stays the same. It is generally harder to hold two things in your mind and think about the relationship between them then it is to just focus on one variable.
• The other has to do with the non-obviousness of density. It is much easier
to focus on the more obvious features of weight and size. After all, you can see and feel those!
Causal Patterns in Density: Defining Density as a Relationship
©2005, President and Fellows of Harvard College 59
Review, Extend, Apply Step 5: Introducing the Densities of Common Substances
Put up the overhead of the Densities of Common Substances Under Standard Conditions Table (p. 81). Explain that scientists assign certain numbers to the densities of different substances. Each substance has its own number. In order to get these numbers, scientists test the substances under standard conditions. This means that they keep the temperature and the amount of pressure the same. Explain to the students that they will revisit this concept a little later in the module.
Step 6: Making Connections: “The Case of the Missing Crown”
Pass out the sheet entitled, Archimedes and the Golden Crown (p. 82). Have students read it and answer the question. The sheet asks them to make the connection between a certain substance having a certain density and the ability to identify that substance. Invite students to share their solutions with the class. Try to get a sampling of different kinds of responses. Tell the students to compare the different solutions that they came up with and think about which they think would work the best. Guide the inquiry by asking questions that get to the issues in the story and support the following understandings:
• Density is a property of a certain kind of material.
• We find the density by measuring the relationship between the mass and the volume of an object made of that material.
• Comparing the density of the material a crown is made of to the density of gold will tell us what kind of material the crown is made of. The density of gold can be found by finding the relationship between the mass and volume of a known piece of gold.
©2005, President and Fellows of Harvard College 60
Lesson 6 Do Liquids Have Density?
Understanding Goals Subject Matter
v Liquids have density. v Density is the relationship between volume and mass, so all matter has
density. v Density of liquids is measured by massing a graduated cylinder, pouring in a
specific volume of liquid, measuring the mass of the liquid and graduated cylinder, and subtracting the mass of the graduated cylinder.
v The density of a liquid is measured in grams per milliliter (g/ml). v The density of water is 1.0 grams per milliliter (g/ml).
Causality
v People typically focus on solid objects when they think about different materials. This makes it difficult to realize that liquids also have properties such as density.
Background Information A Limited Focus on “Material Kind” and Objects
Students often think of density as having to do with "stuff," or what a material is made of, which in their minds, includes only solids. A strong focus on “material kind” as the underlying cause of density can inadvertently reinforce this focus. In addition, fluids, especially gases, can be non-obvious to most students. If you can’t see something it is hard to acknowledge its existence or reason about it. Liquids and Gases Have Density
The next two lessons focus on liquids and gases and attempt to convince students that because they take up space and have mass, they must have density. Realizing that we can find the density of solids, liquids, and gases is important for transferring understandings about density to weather sys tems, convection currents and other real-world phenomena. Gases and liquids are both fluids. The main difference between them is the distance between their molecules. In gases, the molecules are far apart, so they move about more freely and aren't affected as much by forces between molecules. In liquids, themolecules are close together, and so the forces of the surrounding molecules affect each other. Both liquids and gases take the shape of the container that they are in.
Causal Patterns in Density: Defining Density as a Relationship
©2005, President and Fellows of Harvard College 61
Lesson Plan Materials
For each group of 2-4 students: Ø 1 10 ml graduated cylinder Ø 4 Eyedroppers Ø 4 jars of 4 liquids (vegetable oil, rubbing alcohol, salt water, and dish soap) Ø 1 Large jar Ø 1 Triple beam balance Ø Paper towels Ø Journals Ø Finding the Density of Water sheet Ø Finding the Density of Common Liquids sheet
Prep Step
Ø Review the lesson plan, background information, and understanding goals. Ø Gather materials. Ø Photocopy the sheets: Finding the Density of Water (p. 85) and Finding the
Density of Common Liquids (p. 86).
Analyze Thinking Step 1: Do Liquids Have Density?
Explain to the students that so far, we have been focusing on the dens ity of solids. Pose the question: “Do liquids have density?” Collect arguments in support of liquids having density and arguments against liquids having density. Ask students to offer their reasoning and any evidence that they can think of for their arguments. They may want to draw some models. Have students think back to what they know about the nature of matter. Ask them to draw a model of a solid and a liquid in their journals to help them think about the question. Invite a few students to put their models on the board (see examples of student models on pages 83-84). Have the students consider the following questions:
• Do liquids take up space? [Yes] • Do liquids have mass? [Yes] • Then do liquids have density? [Yes]
Discuss students’ questions about liquids and density. They may find it hard to believe that there can be differences in density between liquids because liquids are not all that compressible. Think of a bowl full of marbles. They roll all over each other, but there isn’t much difference in the spaces between them. In the next
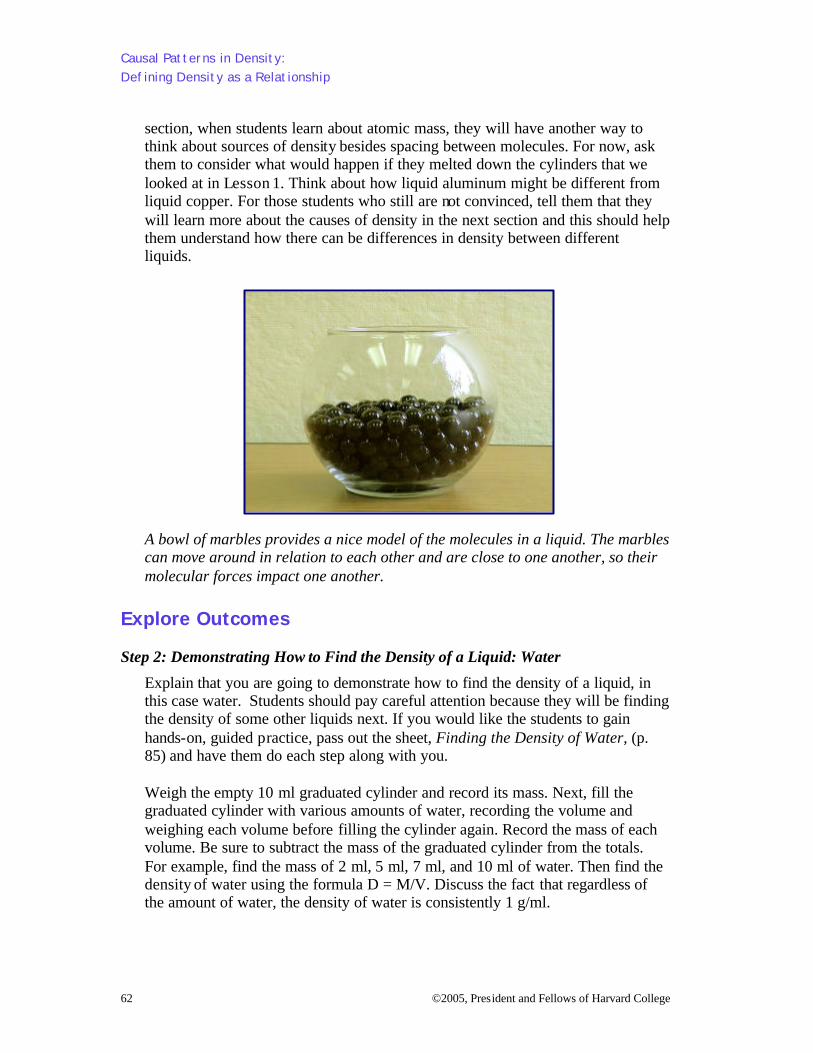
Causal Patterns in Density: Defining Density as a Relationship
62 ©2005, President and Fellows of Harvard College
section, when students learn about atomic mass, they will have another way to think about sources of density besides spacing between molecules. For now, ask them to consider what would happen if they melted down the cylinders that we looked at in Lesson 1. Think about how liquid aluminum might be different from liquid copper. For those students who still are not convinced, tell them that they will learn more about the causes of density in the next section and this should help them understand how there can be differences in density between different liquids.
A bowl of marbles provides a nice model of the molecules in a liquid. The marbles can move around in relation to each other and are close to one another, so their molecular forces impact one another.
Explore Outcomes Step 2: Demonstrating How to Find the Density of a Liquid: Water
Explain that you are going to demonstrate how to find the density of a liquid, in this case water. Students should pay careful attention because they will be finding the density of some other liquids next. If you would like the students to gain hands-on, guided practice, pass out the sheet, Finding the Density of Water, (p. 85) and have them do each step along with you. Weigh the empty 10 ml graduated cylinder and record its mass. Next, fill the graduated cylinder with various amounts of water, recording the volume and weighing each volume before filling the cylinder again. Record the mass of each volume. Be sure to subtract the mass of the graduated cylinder from the totals. For example, find the mass of 2 ml, 5 ml, 7 ml, and 10 ml of water. Then find the density of water using the formula D = M/V. Discuss the fact that regardless of the amount of water, the density of water is consistently 1 g/ml.
Causal Patterns in Density: Defining Density as a Relationship
©2005, President and Fellows of Harvard College 63
Step 3: Finding the Density of Other Common Liquids
Divide the class into groups of approximately two to four students. Pass out to each group a 10 ml graduated cylinder, a triple beam balance, a few paper towels, small jars filled with of one of each of the following: vegetable oil, rubbing alcohol, salt water, and dish soap. Pass out the sheet, Finding the Density of Common Liquids (p. 86). The students should follow the procedure they used with the water:
• Weigh the empty 10 ml graduated cylinder and record its mass.
• Fill the graduated cylinder with 10 ml of one of the liquids (vegetable oil, rubbing alcohol, salt water and dish soap) and then check its mass. Remember to subtract the weight of the graduated cylinder from the total.
• Record the mass.
• Using the formula D=M/V, find the density of each liquid.
After students finish with one liquid, they should trade with another group until they have found the density for all four liquids. Circulate while the students are working to assess how they are doing at figuring out the densities of the different liquids. Make note of any difficulties figuring out mass, volume, or density and offer assistance to those who need it.
Step 4: Discussing Students’ Findings
Ask the students what they found for the density of each liquid. Which liquid is the most dense? Which is the least dense?
Review, Extend, Apply Step 5: Making Connections to the Real World
Ask the students to think about the different liquids that they tested.
• Do the findings fit with their expectations?
• Based on what they learned, can they make any predictions about other everyday liquids?
• What about liquids like milk, soda, and syrup? Do they have density? (Yes)
• Do they think that these would be more dense or less dense than the other liquids that they tested? Why or why not?
• How could they find out?
64 ©2005, President and Fellows of Harvard College
Lesson 7 Do Gases Have Density?
Understanding Goals Subject Matter
v Gases are matter. v Gases take up space. v Gases have mass. v Gases have density. Density is the relationship between volume and mass so
all matter has density. Causality
v Gases are non-obvious in many respects. This makes it difficult to realize that they have properties such as density.
Background Information Gases Have Density, Too!
Students often think of density as having to do with solids. However, gases and liquids also have density. Gases and liquids are both fluids. The main difference between them is the distance between their molecules. In a gas, the molecules are far apart, so they move about more freely and aren't affected as much by the forces between molecules. In a liquid, the molecules are close together, and so the forces of the molecules affect each other more. Both liquids and gases take the shape of the container that they are in. Difficulties Students Have in Realizing that Air is Matter
Students tend to have two kinds of conceptual difficulties in realizing that gases have density. Both relate to uncertainties about air as matter. First, they do not always realize that air takes up space. This is in part because air typically moves out of our way when we move ourselves or other matter into the space that it is in. Second, students often do not believe that air has mass. If they don’t realize that air takes up space and has mass, they certainly won’t think of it as having density! In this lesson, we substitute the word “air” for the word “gases” in some instances since students are likely to think of gases as air. We also use the term “air molecules” in quotations since there really is no such thing as an air molecule. Rather, there are molecules of a number of different substances that make up the air. If you use the term “air molecule,” we suggest telling the students that it is just a shortened way of referring to the molecules in the air (things like oxygen, nitrogen, hydrogen, etc.) but
Causal Patterns in Density: Defining Density as a Relationship
©2005, President and Fellows of Harvard College 65
that there’s actually no such thing as a molecule of air. There is a molecule of particular gases that make up the air so another way to handle this issue is to just talk about gases and not substitute “air molecules” for “gases.” Transferring the Understandings
Realizing that gases have density also helps students begin to think about mixed density. In Lesson 1, students may have said that one of the cylinders is hollow. This is an especially common answer when students have not had much experience with the particulate nature of matter. Once students understand that gases have density, they can begin to reason about the density of hollow objects as composed of the density of the surrounding material plus the density of the gas inside. The reasons why the gas contributes so little mass compared to its volume (and therefore makes the overall object less dense rather than more dense) will be elaborated in Section 3. Realizing that we can find the density of fluids (liquids and gases) is important for transferring understandings about density, such as understanding weather systems, why colder water sinks in warmer water, why icebergs float, and so on. It is a fundamental understanding that will allow students to build many other understandings.
Causal Patterns in Density: Defining Density as a Relationship
66 ©2005, President and Fellows of Harvard College
Lesson Plan Materials
Ø Large plastic garbage bag Ø Clear tub filled with water Ø Food coloring Ø Clear plastic cup (tall and narrow is best) Ø Sheet of paper Ø Syringe Ø 2-3 balloons Ø Pin Ø Straw Ø 2 paper cups Ø Pan Balance Ø Journals Ø Does Air Have Mass? sheet Ø Thinking about the Density of a Gas sheet
Prep Step
Ø Review the lesson plan, background information, and understanding goals. Ø Gather materials. Ø Photocopy the sheets: Does Air Have Mass? (p. 91) and Thinking about the
Density of a Gas (p. 92). Analyze Thinking Step 1: Do Gases Have Density?
Ask the students, “Do gases have density?” Collect arguments in support of and against gases having density. Ask students to explain their reasoning and offer any evidence that they can think of for their arguments. They may want to draw some models. Ask students to again draw models in their journals of solids and liquids, but this time to also draw a model of a gas. Invite a few students to put their models on the board (see examples of students’ models on pages 88-90) Two questions or issues should arise from the conversation:
1) Does gas (or air) take up space? 2) Does gas (or air) have mass?
We really can’t take up the issue of whether or not gases have density until we settle these two questions.
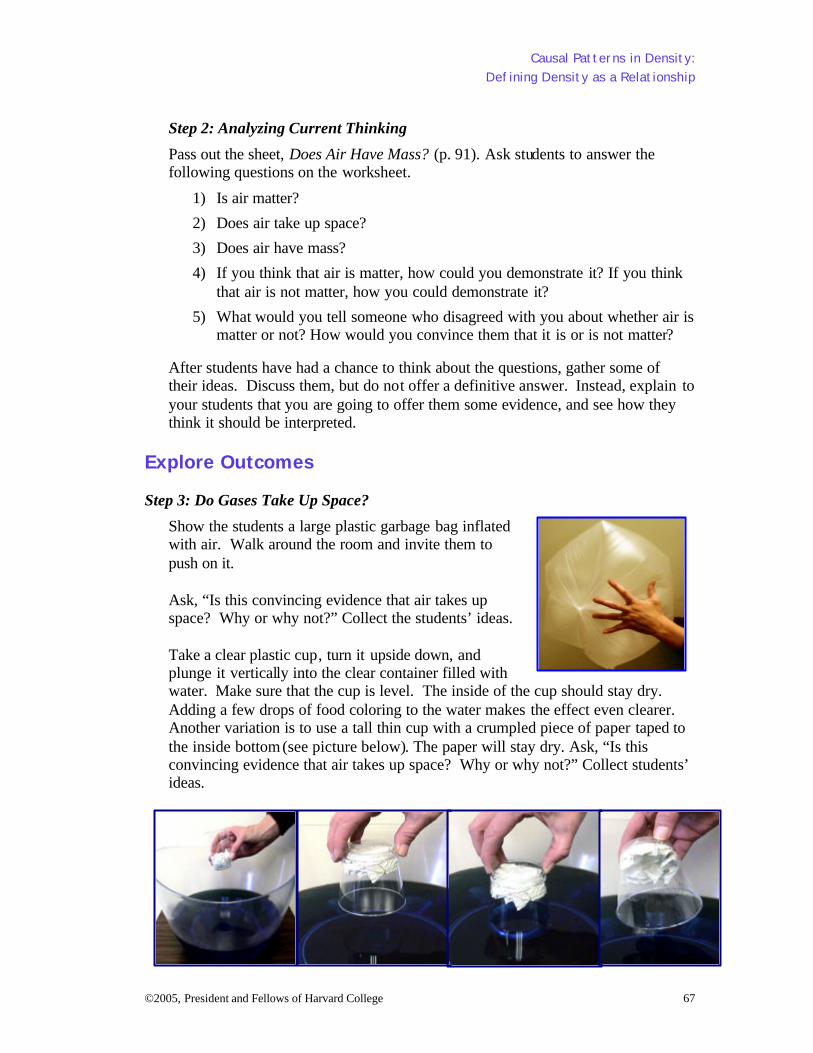
Causal Patterns in Density: Defining Density as a Relationship
©2005, President and Fellows of Harvard College 67
Step 2: Analyzing Current Thinking
Pass out the sheet, Does Air Have Mass? (p. 91). Ask students to answer the following questions on the worksheet.
1) Is air matter?
2) Does air take up space?
3) Does air have mass?
4) If you think that air is matter, how could you demonstrate it? If you think that air is not matter, how you could demonstrate it?
5) What would you tell someone who disagreed with you about whether air is matter or not? How would you convince them that it is or is not matter?
After students have had a chance to think about the questions, gather some of their ideas. Discuss them, but do not offer a definitive answer. Instead, explain to your students that you are going to offer them some evidence, and see how they think it should be interpreted.
Explore Outcomes Step 3: Do Gases Take Up Space?
Show the students a large plastic garbage bag inflated with air. Walk around the room and invite them to push on it. Ask, “Is this convincing evidence that air takes up space? Why or why not?” Collect the students’ ideas. Take a clear plastic cup, turn it upside down, and plunge it vertically into the clear container filled with water. Make sure that the cup is level. The inside of the cup should stay dry. Adding a few drops of food coloring to the water makes the effect even clearer. Another variation is to use a tall thin cup with a crumpled piece of paper taped to the inside bottom (see picture below). The paper will stay dry. Ask, “Is this convincing evidence that air takes up space? Why or why not?” Collect students’ ideas.
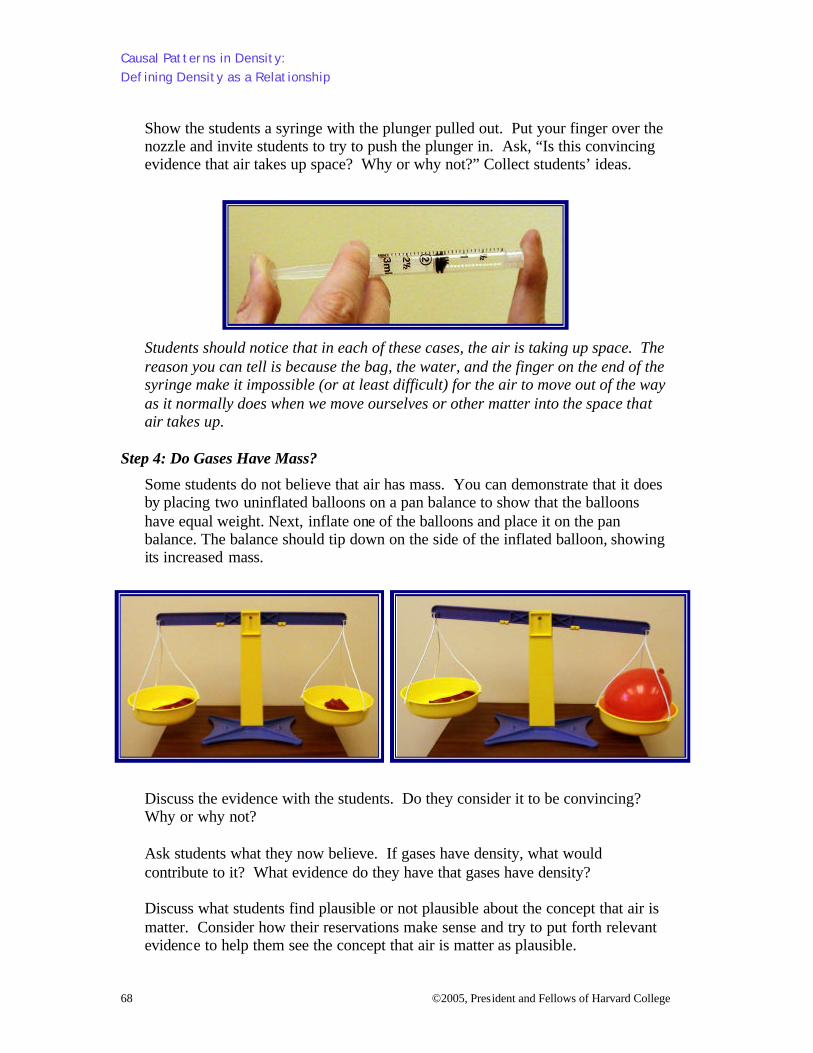
Causal Patterns in Density: Defining Density as a Relationship
68 ©2005, President and Fellows of Harvard College
Show the students a syringe with the plunger pulled out. Put your finger over the nozzle and invite students to try to push the plunger in. Ask, “Is this convincing evidence that air takes up space? Why or why not?” Collect students’ ideas. Students should notice that in each of these cases, the air is taking up space. The reason you can tell is because the bag, the water, and the finger on the end of the syringe make it impossible (or at least difficult) for the air to move out of the way as it normally does when we move ourselves or other matter into the space that air takes up.
Step 4: Do Gases Have Mass?
Some students do not believe that air has mass. You can demonstrate that it does by placing two uninflated balloons on a pan balance to show that the balloons have equal weight. Next, inflate one of the balloons and place it on the pan balance. The balance should tip down on the side of the inflated balloon, showing its increased mass.
Discuss the evidence with the students. Do they consider it to be convincing? Why or why not? Ask students what they now believe. If gases have density, what would contribute to it? What evidence do they have that gases have density? Discuss what students find plausible or not plausible about the concept that air is matter. Consider how their reservations make sense and try to put forth relevant evidence to help them see the concept that air is matter as plausible.
Causal Patterns in Density: Defining Density as a Relationship
©2005, President and Fellows of Harvard College 69
Step 5: What Are Possible Ways to Figure out the Density of Gases?
Hand out the sheet entitled, Thinking About the Density of a Gas (p. 92). Have the students write a paragraph and draw a diagram explaining how they think they could figure out the density of a gas. What would they have to do and why? In order to define the volume, they should realize that gases take up the shape of the container that they are in. The gas molecules bounce around and bump into the wall of the container. Therefore the container impacts the amount of space that the air can take up—the volume. Eventually, when students study air pressure, you can int roduce the concept of “standard pressure conditions.”
Step 6: Making Connections
What do the students think about the following question: “When gases are part of an object, so for instance, a plastic ball that is filled with air, the density of the ball is the density of the plastic plus the density of the air inside. Does the air add a lot to the overall density or not?” Asking this question is a first attempt to get students thinking about mixed density and what it means for something to be hollow as some of their models in Lesson 1 depicted. We will come back to thinking about mixed density in the next section.
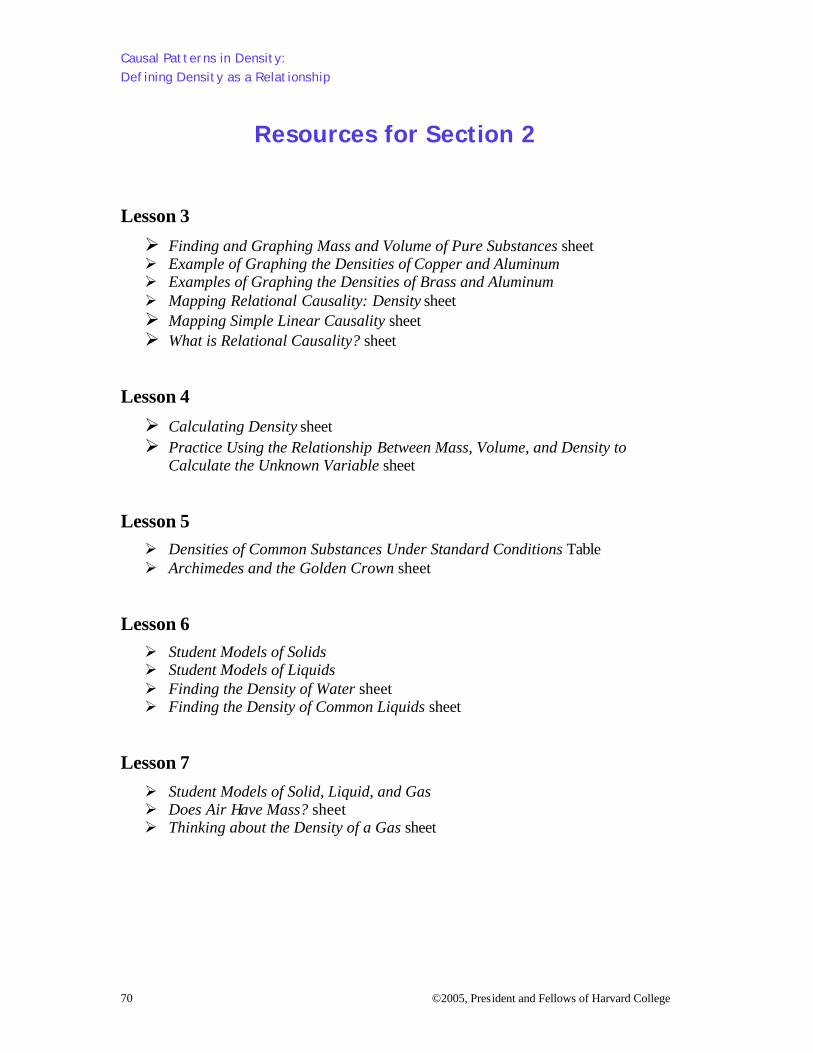
Causal Patterns in Density: Defining Density as a Relationship
70 ©2005, President and Fellows of Harvard College
Resources for Section 2
Lesson 3
Ø Finding and Graphing Mass and Volume of Pure Substances sheet Ø Example of Graphing the Densities of Copper and Aluminum Ø Examples of Graphing the Densities of Brass and Aluminum Ø Mapping Relational Causality: Density sheet Ø Mapping Simple Linear Causality sheet Ø What is Relational Causality? sheet
Lesson 4
Ø Calculating Density sheet Ø Practice Using the Relationship Between Mass, Volume, and Density to
Calculate the Unknown Variable sheet Lesson 5
Ø Densities of Common Substances Under Standard Conditions Table Ø Archimedes and the Golden Crown sheet
Lesson 6
Ø Student Models of Solids Ø Student Models of Liquids Ø Finding the Density of Water sheet Ø Finding the Density of Common Liquids sheet
Lesson 7
Ø Student Models of Solid, Liquid, and Gas Ø Does Air Have Mass? sheet Ø Thinking about the Density of a Gas sheet
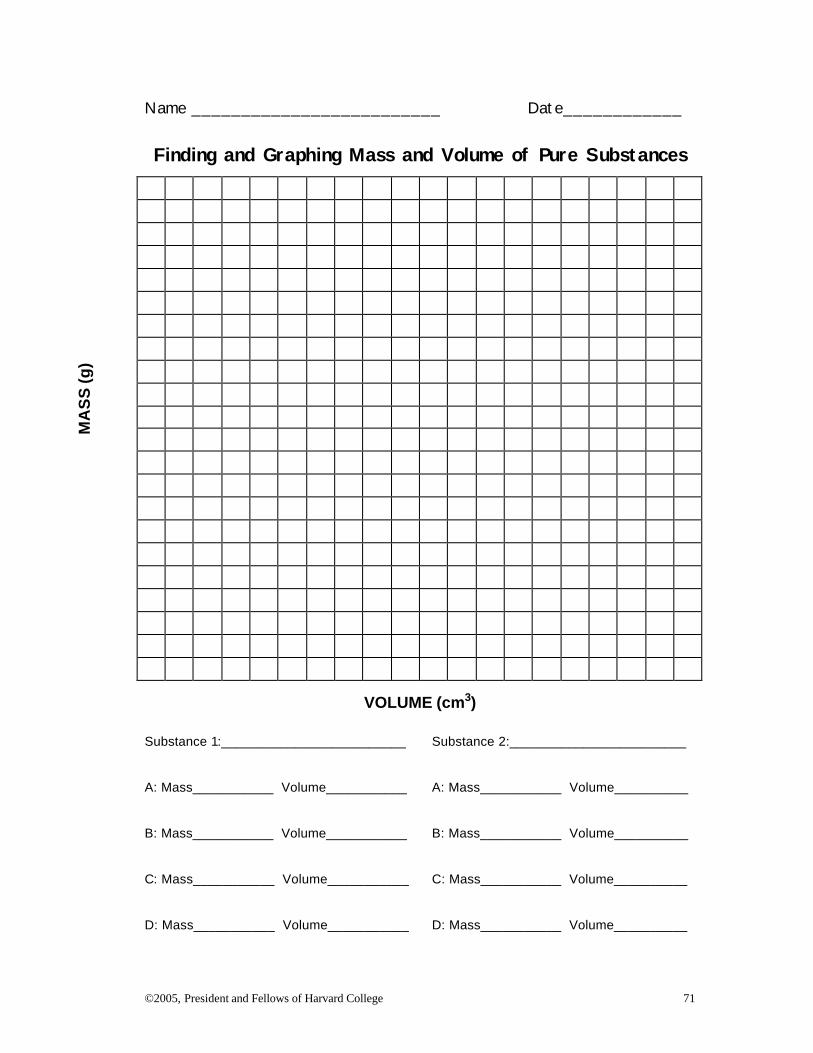
©2005, President and Fellows of Harvard College 71
Name _________________________ Date____________ Finding and Graphing Mass and Volume of Pure Substances
VOLUME (cm3) Substance 1:_________________________ Substance 2:________________________ A: Mass___________ Volume___________ A: Mass___________ Volume__________ B: Mass___________ Volume___________ B: Mass___________ Volume__________ C: Mass___________ Volume___________ C: Mass___________ Volume__________ D: Mass___________ Volume___________ D: Mass___________ Volume__________
MA
SS
(g)
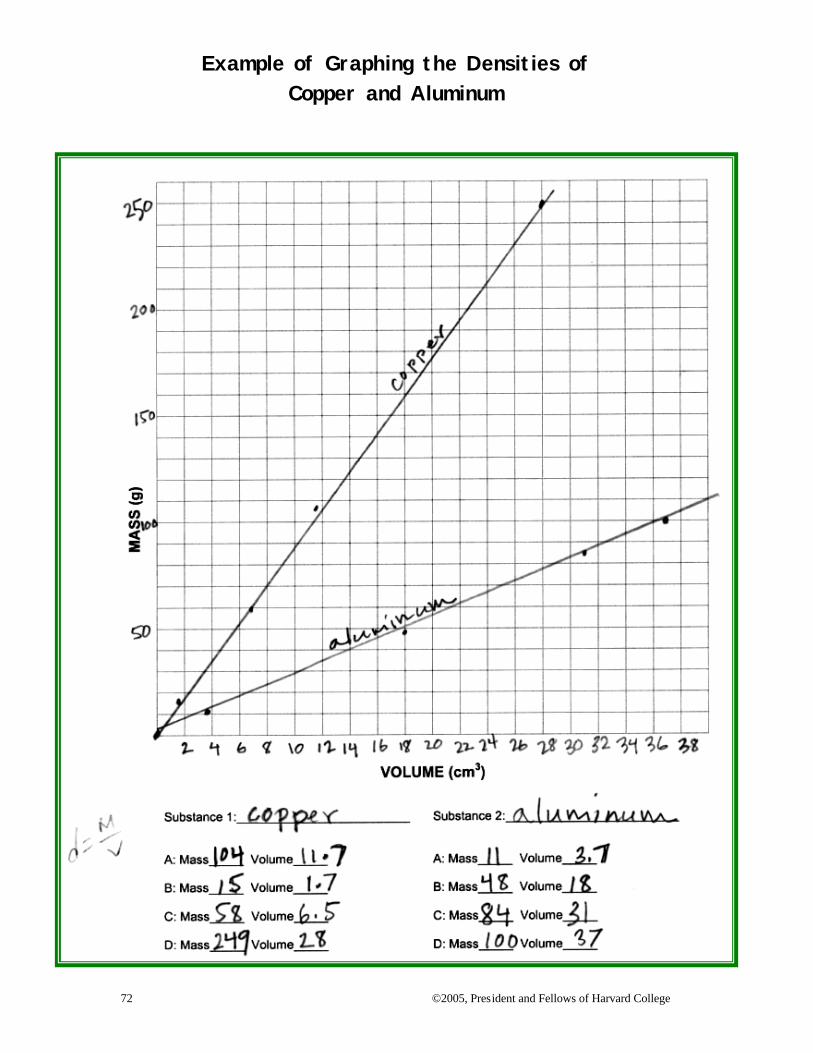
Example of Graphing the Densities of Copper and Aluminum
72 ©2005, President and Fellows of Harvard College
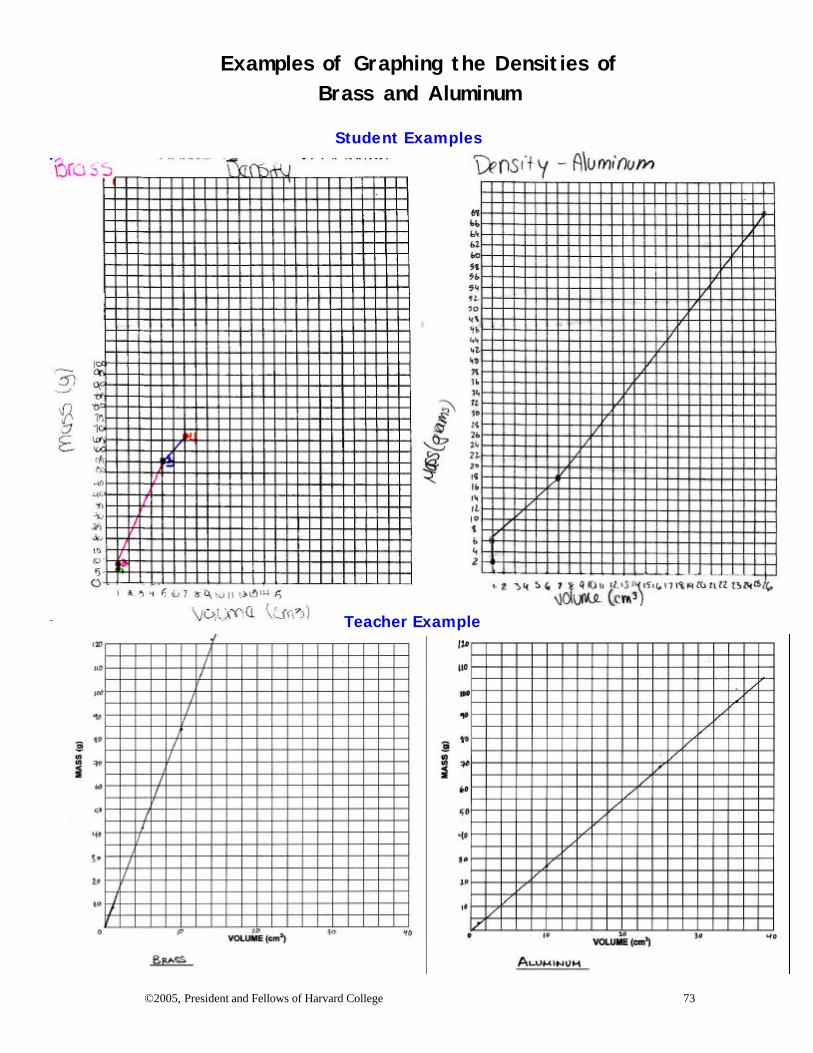
Examples of Graphing the Densities of Brass and Aluminum
©2005, President and Fellows of Harvard College 73
Teacher Example
Student Examples
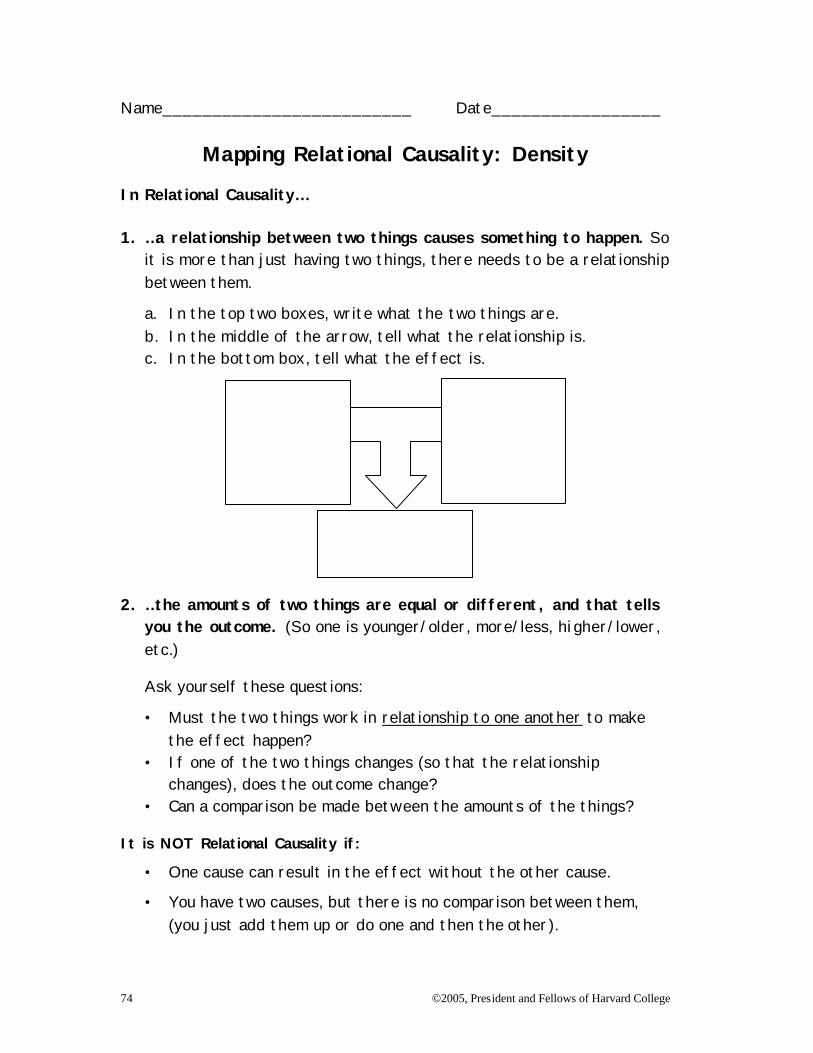
74 ©2005, President and Fellows of Harvard College
Name_________________________ Date_________________
Mapping Relational Causality: Density
In Relational Causality… 1. …a relationship between two things causes something to happen. So
it is more than just having two things, there needs to be a relationship between them.
a. In the top two boxes, write what the two things are. b. In the middle of the arrow, tell what the relationship is. c. In the bottom box, tell what the effect is.
2. …the amounts of two things are equal or different, and that tells
you the outcome. (So one is younger/older, more/less, higher/lower, etc.)
Ask yourself these questions:
• Must the two things work in relationship to one another to make the effect happen?
• If one of the two things changes (so that the relationship changes), does the outcome change?
• Can a comparison be made between the amounts of the things?
It is NOT Relational Causality if:
• One cause can result in the effect without the other cause.
• You have two causes, but there is no comparison between them, (you just add them up or do one and then the other).
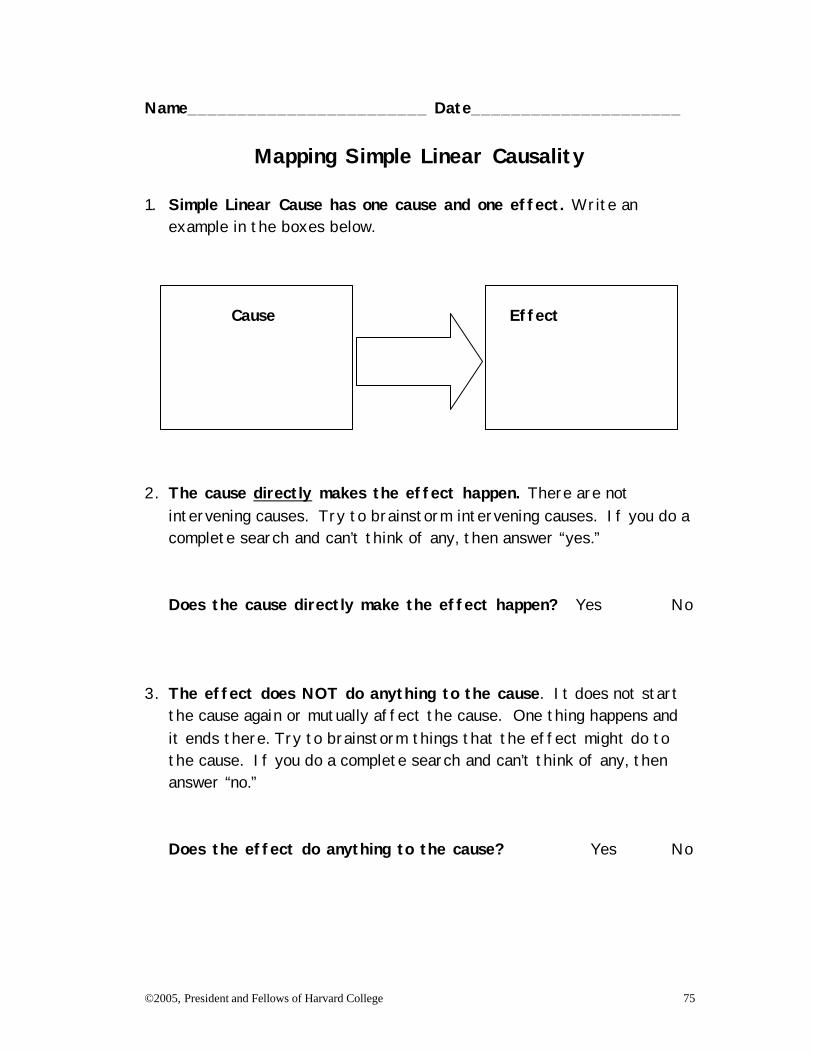
©2005, President and Fellows of Harvard College 75
Name________________________ Date_____________________
Mapping Simple Linear Causality 1. Simple Linear Cause has one cause and one effect. Write an
example in the boxes below. Cause Effect 2. The cause directly makes the effect happen. There are not
intervening causes. Try to brainstorm intervening causes. If you do a complete search and can’t think of any, then answer “yes.”
Does the cause directly make the effect happen? Yes No 3. The effect does NOT do anything to the cause. It does not start
the cause again or mutually affect the cause. One thing happens and it ends there. Try to brainstorm things that the effect might do to the cause. If you do a complete search and can’t think of any, then answer “no.”
Does the effect do anything to the cause? Yes No
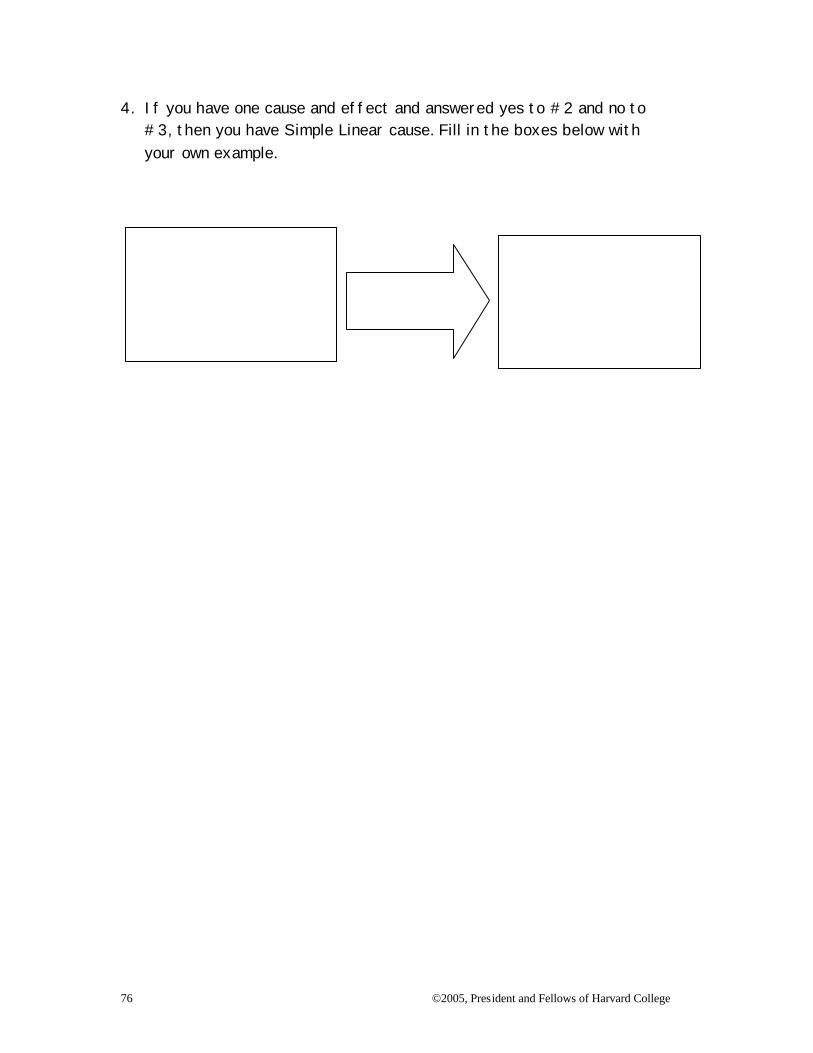
76 ©2005, President and Fellows of Harvard College
4. If you have one cause and effect and answered yes to #2 and no to #3, then you have Simple Linear cause. Fill in the boxes below with your own example.
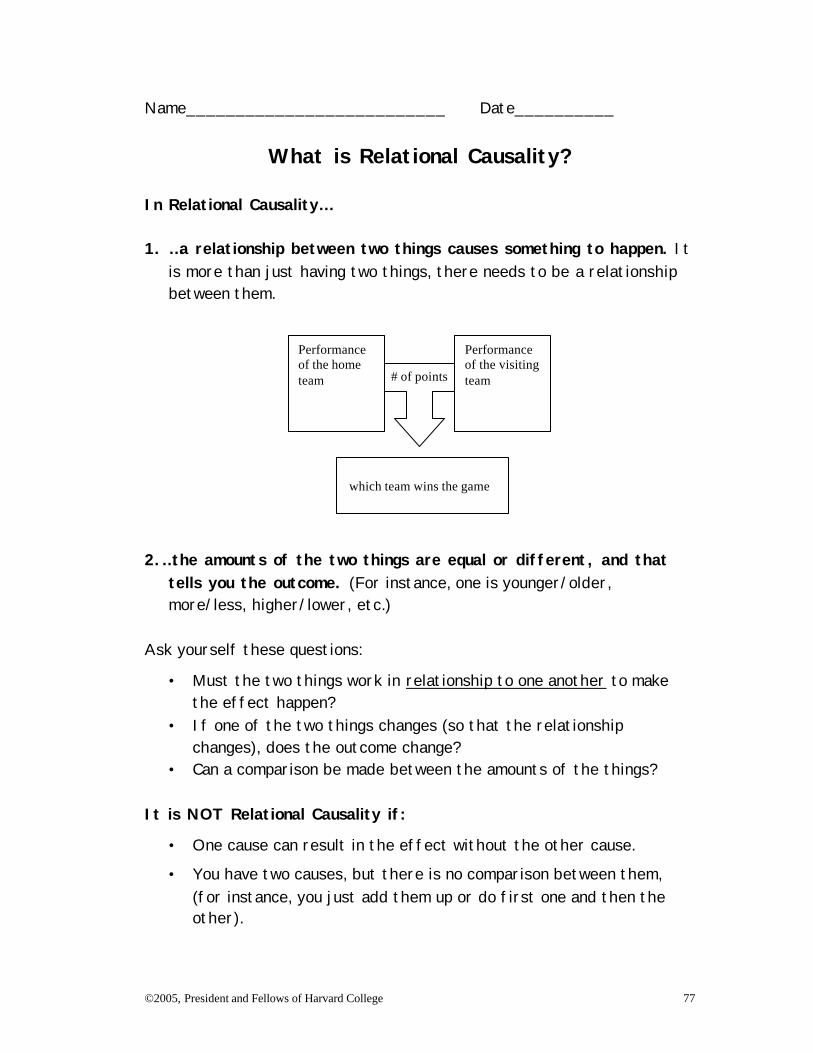
©2005, President and Fellows of Harvard College 77
Name__________________________ Date__________
What is Relational Causality? In Relational Causality… 1. …a relationship between two things causes something to happen. It
is more than just having two things, there needs to be a relationship between them.
2.…the amounts of the two things are equal or different, and that
tells you the outcome. (For instance, one is younger/older, more/less, higher/lower, etc.)
Ask yourself these questions:
• Must the two things work in relationship to one another to make the effect happen?
• If one of the two things changes (so that the relationship changes), does the outcome change?
• Can a comparison be made between the amounts of the things? It is NOT Relational Causality if:
• One cause can result in the effect without the other cause.
• You have two causes, but there is no comparison between them, (for instance, you just add them up or do first one and then the other).
which team wins the game
# of points
Performance of the visiting team
Performance of the home team
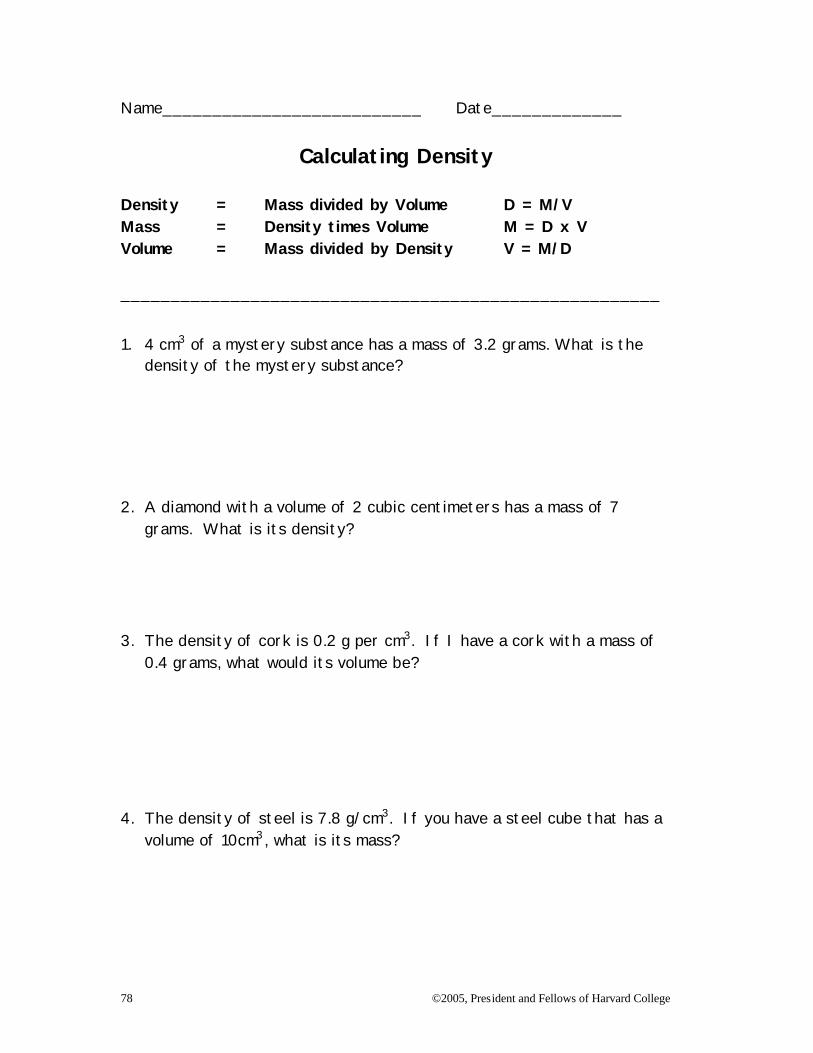
78 ©2005, President and Fellows of Harvard College
Name__________________________ Date_____________
Calculating Density Density = Mass divided by Volume D = M/V Mass = Density times Volume M = D x V Volume = Mass divided by Density V = M/D ______________________________________________________
1. 4 cm3 of a mystery substance has a mass of 3.2 grams. What is the density of the mystery substance?
2. A diamond with a volume of 2 cubic centimeters has a mass of 7
grams. What is its density? 3. The density of cork is 0.2 g per cm3. If I have a cork with a mass of
0.4 grams, what would its volume be? 4. The density of steel is 7.8 g/cm3. If you have a steel cube that has a
volume of 10cm3, what is its mass?
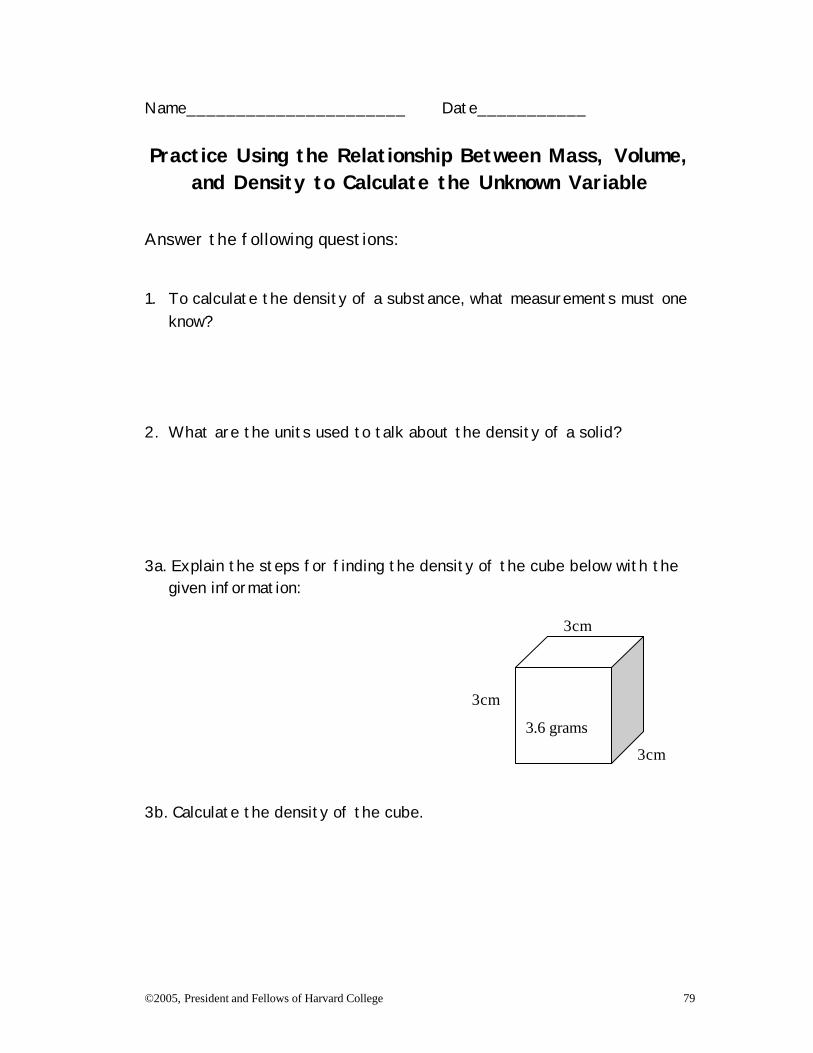
©2005, President and Fellows of Harvard College 79
Name______________________ Date___________ Practice Using the Relationship Between Mass, Volume,
and Density to Calculate the Unknown Variable Answer the following questions: 1. To calculate the density of a substance, what measurements must one
know? 2. What are the units used to talk about the density of a solid? 3a. Explain the steps for finding the density of the cube below with the
given information:
3cm 3cm 3cm 3b. Calculate the density of the cube.
3.6 grams
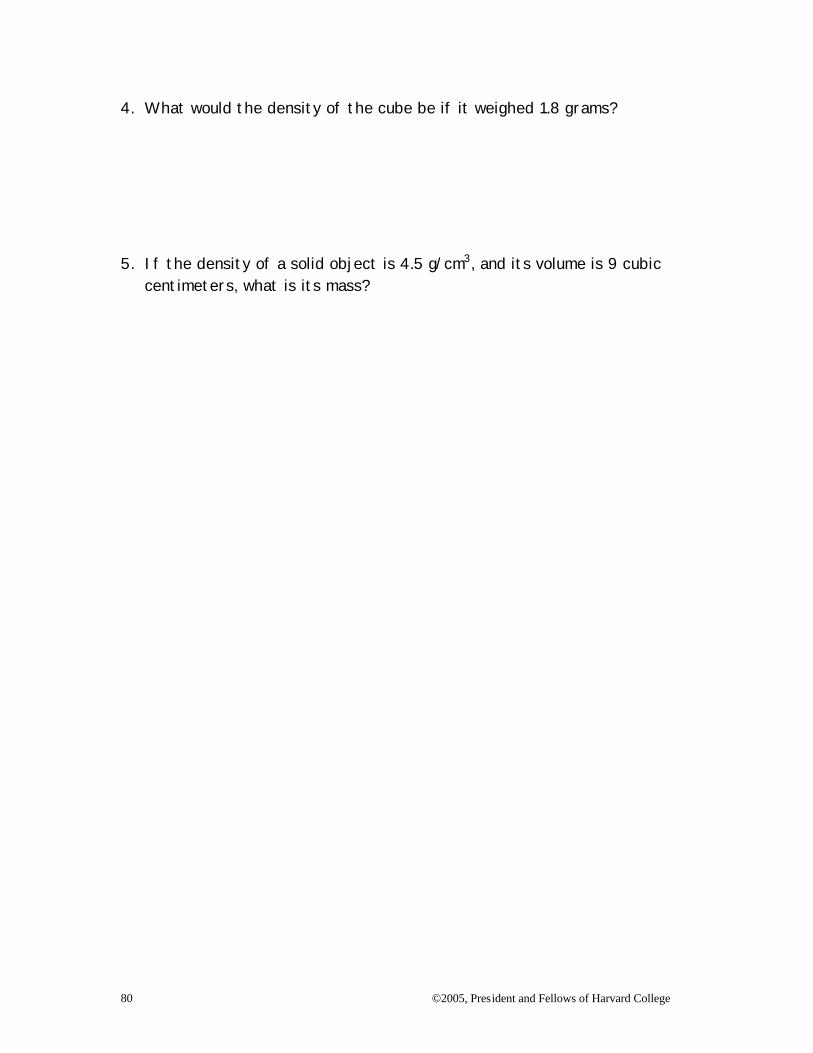
80 ©2005, President and Fellows of Harvard College
4. What would the density of the cube be if it weighed 1.8 grams? 5. If the density of a solid object is 4.5 g/cm3, and its volume is 9 cubic
centimeters, what is its mass?
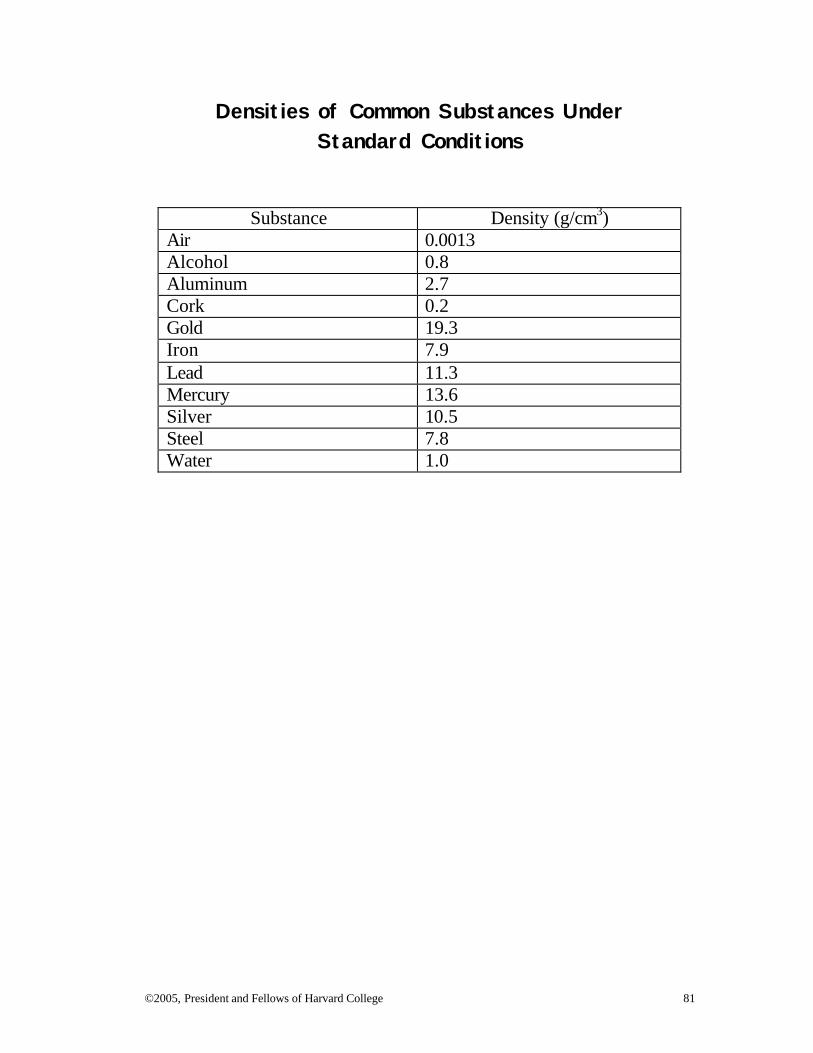
©2005, President and Fellows of Harvard College 81
Densities of Common Substances Under Standard Conditions
Substance Density (g/cm3) Air 0.0013 Alcohol 0.8 Aluminum 2.7 Cork 0.2 Gold 19.3 Iron 7.9 Lead 11.3 Mercury 13.6 Silver 10.5 Steel 7.8 Water 1.0
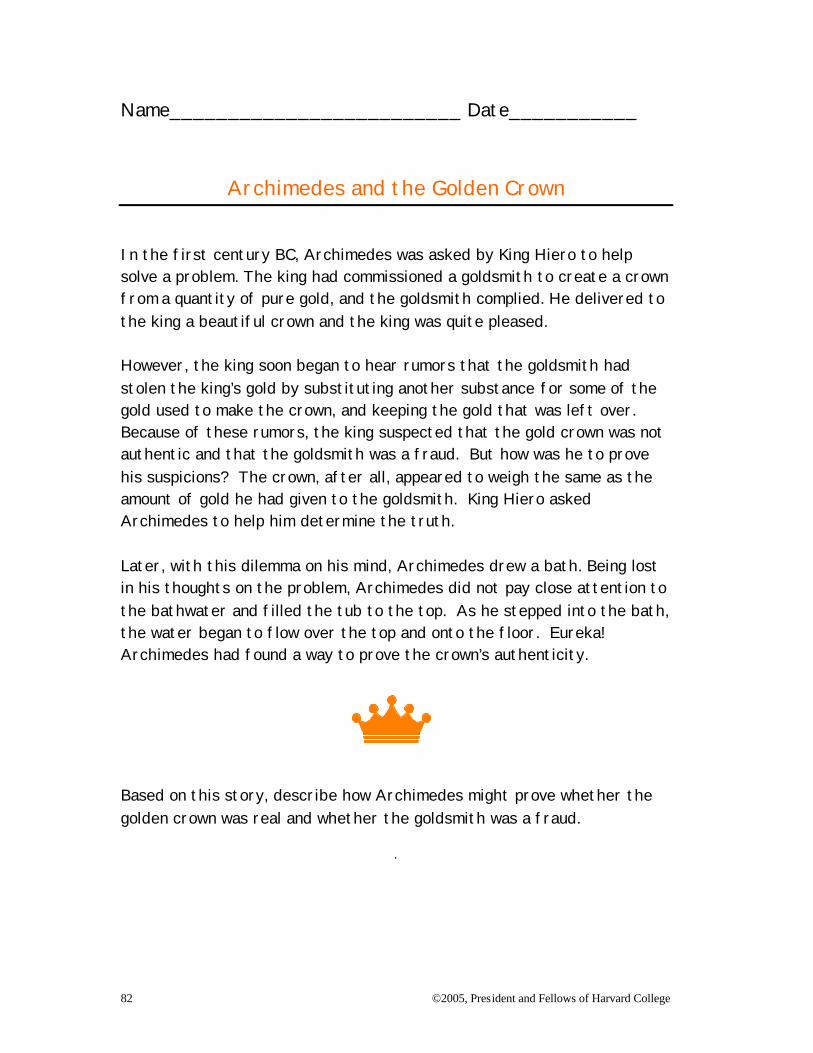
82 ©2005, President and Fellows of Harvard College
Name_________________________ Date___________
Archimedes and the Golden Crown In the first century BC, Archimedes was asked by King Hiero to help solve a problem. The king had commissioned a goldsmith to create a crown from a quantity of pure gold, and the goldsmith complied. He delivered to the king a beautiful crown and the king was quite pleased. However, the king soon began to hear rumors that the goldsmith had stolen the king’s gold by substituting another substance for some of the gold used to make the crown, and keeping the gold that was left over. Because of these rumors, the king suspected that the gold crown was not authentic and that the goldsmith was a fraud. But how was he to prove his suspicions? The crown, after all, appeared to weigh the same as the amount of gold he had given to the goldsmith. King Hiero asked Archimedes to help him determine the truth. Later, with this dilemma on his mind, Archimedes drew a bath. Being lost in his thoughts on the problem, Archimedes did not pay close attention to the bathwater and filled the tub to the top. As he stepped into the bath, the water began to flow over the top and onto the floor. Eureka! Archimedes had found a way to prove the crown’s authenticity. Based on this story, describe how Archimedes might prove whether the golden crown was real and whether the goldsmith was a fraud.
.
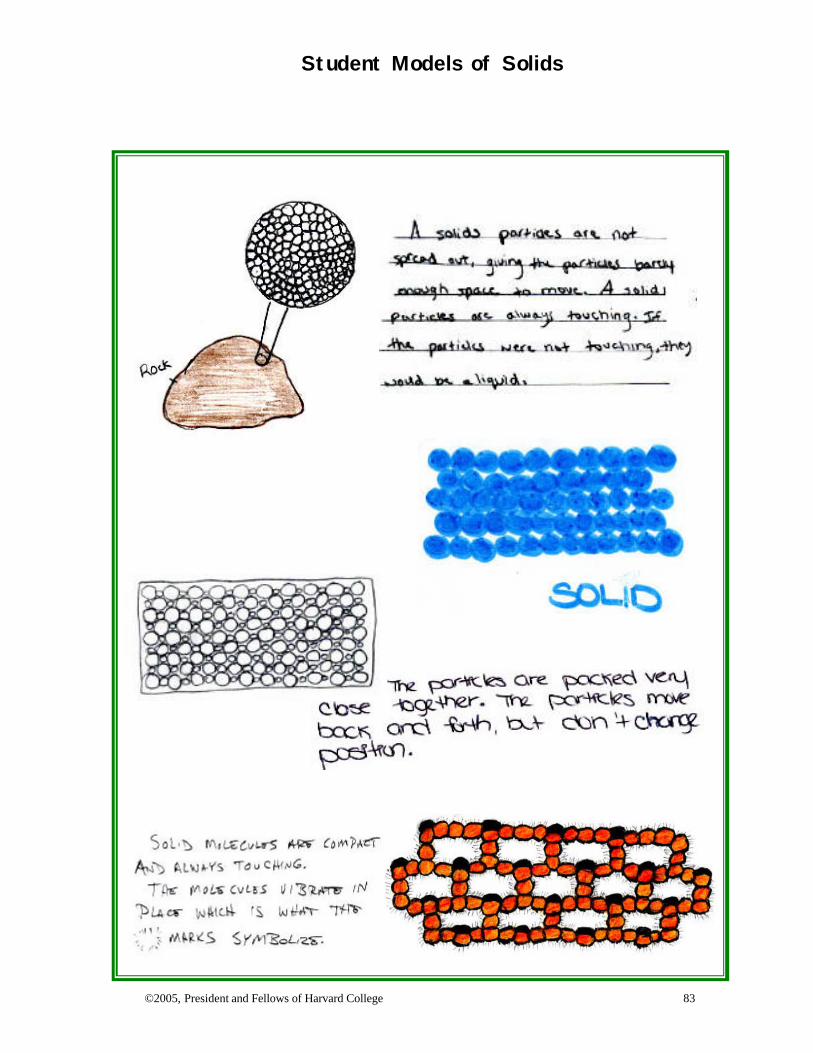
Student Models of Solids
©2005, President and Fellows of Harvard College 83
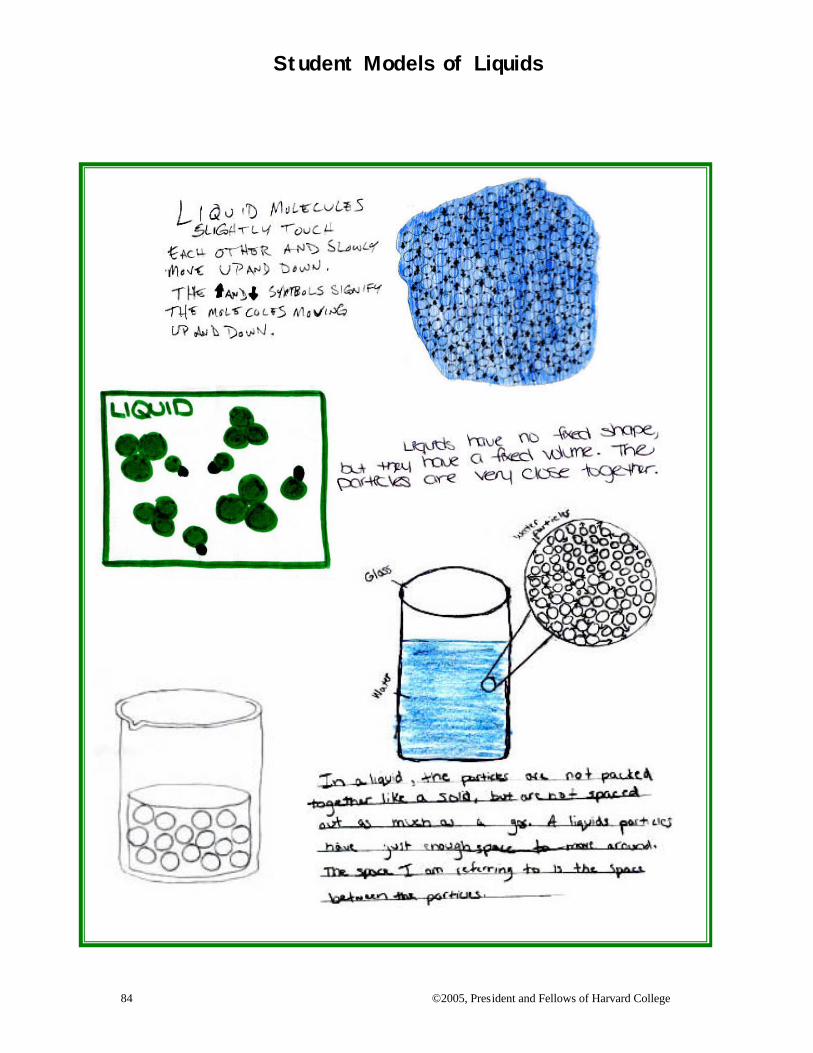
Student Models of Liquids
84 ©2005, President and Fellows of Harvard College
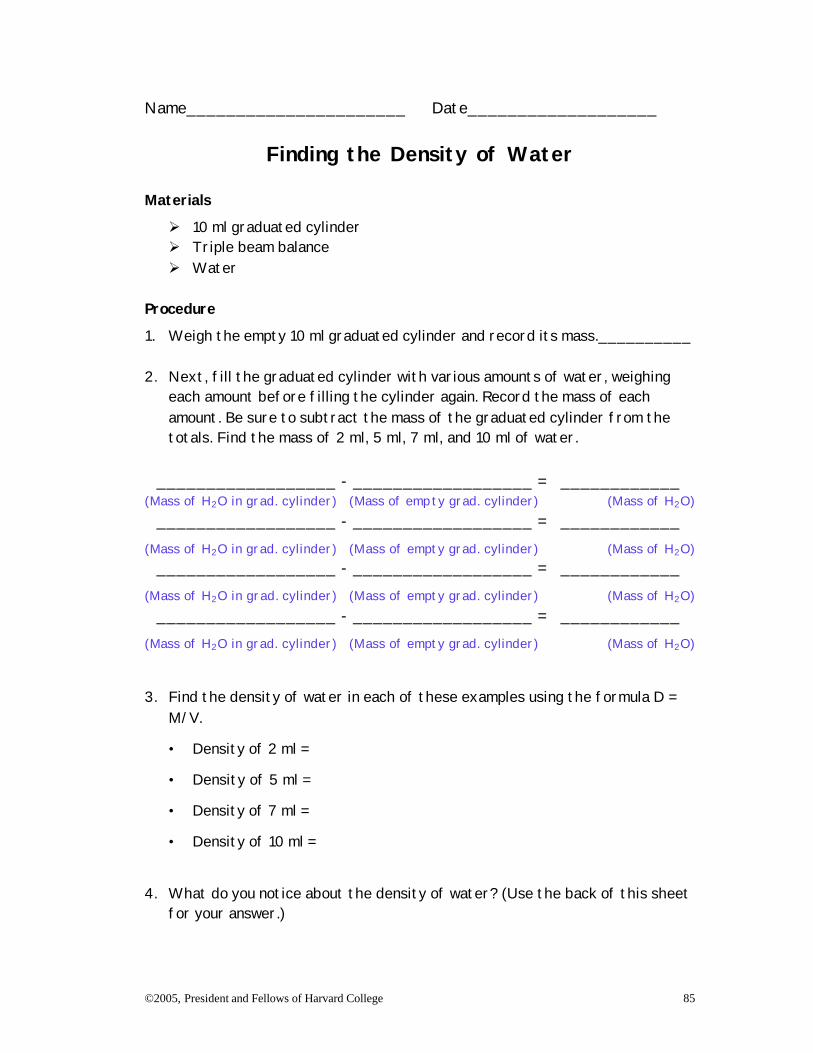
©2005, President and Fellows of Harvard College 85
Name______________________ Date___________________
Finding the Density of Water
Materials
Ø 10 ml graduated cylinder Ø Triple beam balance Ø Water
Procedure
1. Weigh the empty 10 ml graduated cylinder and record its mass.__________ 2. Next, fill the graduated cylinder with various amounts of water, weighing
each amount before filling the cylinder again. Record the mass of each amount. Be sure to subtract the mass of the graduated cylinder from the totals. Find the mass of 2 ml, 5 ml, 7 ml, and 10 ml of water.
__________________ - __________________ = ____________
(Mass of H2O in grad. cylinder) (Mass of emp ty grad. cylinder) (Mass of H2O) __________________ - __________________ = ____________
(Mass of H2O in grad. cylinder) (Mass of empty grad. cylinder) (Mass of H2O) __________________ - __________________ = ____________
(Mass of H2O in grad. cylinder) (Mass of empty grad. cylinder) (Mass of H2O) __________________ - __________________ = ____________
(Mass of H2O in grad. cylinder) (Mass of empty grad. cylinder) (Mass of H2O) 3. Find the density of water in each of these examples using the formula D =
M/V.
• Density of 2 ml =
• Density of 5 ml =
• Density of 7 ml =
• Density of 10 ml =
4. What do you notice about the density of water? (Use the back of this sheet
for your answer.)
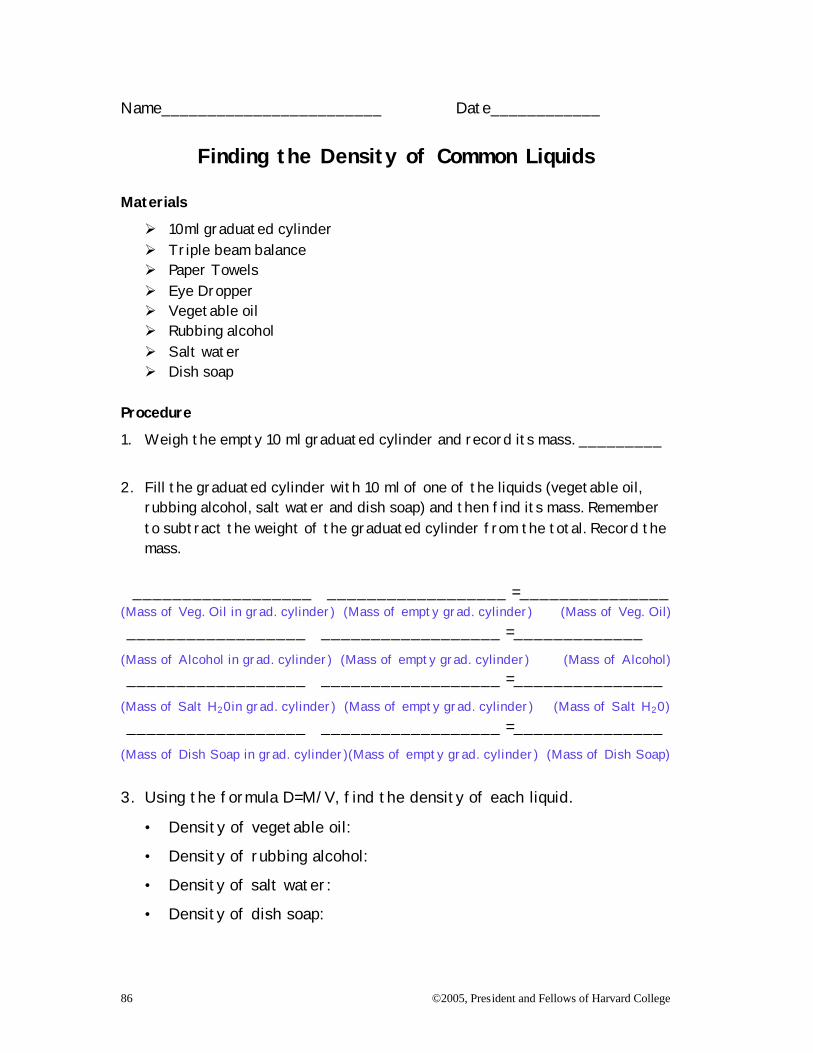
86 ©2005, President and Fellows of Harvard College
Name________________________ Date____________
Finding the Density of Common Liquids Materials
Ø 10ml graduated cylinder Ø Triple beam balance Ø Paper Towels Ø Eye Dropper Ø Vegetable oil Ø Rubbing alcohol Ø Salt water Ø Dish soap
Procedure
1. Weigh the empty 10 ml graduated cylinder and record its mass. _________
2. Fill the graduated cylinder with 10 ml of one of the liquids (vegetable oil,
rubbing alcohol, salt water and dish soap) and then find its mass. Remember to subtract the weight of the graduated cylinder from the total. Record the mass.
__________________ __________________ =_______________
(Mass of Veg. Oil in grad. cylinder) (Mass of empty grad. cylinder) (Mass of Veg. Oil) __________________ __________________ =_____________
(Mass of Alcohol in grad. cylinder) (Mass of empty grad. cylinder) (Mass of Alcohol) __________________ __________________ =_______________
(Mass of Salt H20in grad. cylinder) (Mass of empty grad. cylinder) (Mass of Salt H20) __________________ __________________ =_______________
(Mass of Dish Soap in grad. cylinder)(Mass of empty grad. cylinder) (Mass of Dish Soap) 3. Using the formula D=M/V, find the density of each liquid.
• Density of vegetable oil:
• Density of rubbing alcohol:
• Density of salt water:
• Density of dish soap:
©2005, President and Fellows of Harvard College 87
4. Which liquid is the most dense? 5. Which liquid is the least dense?
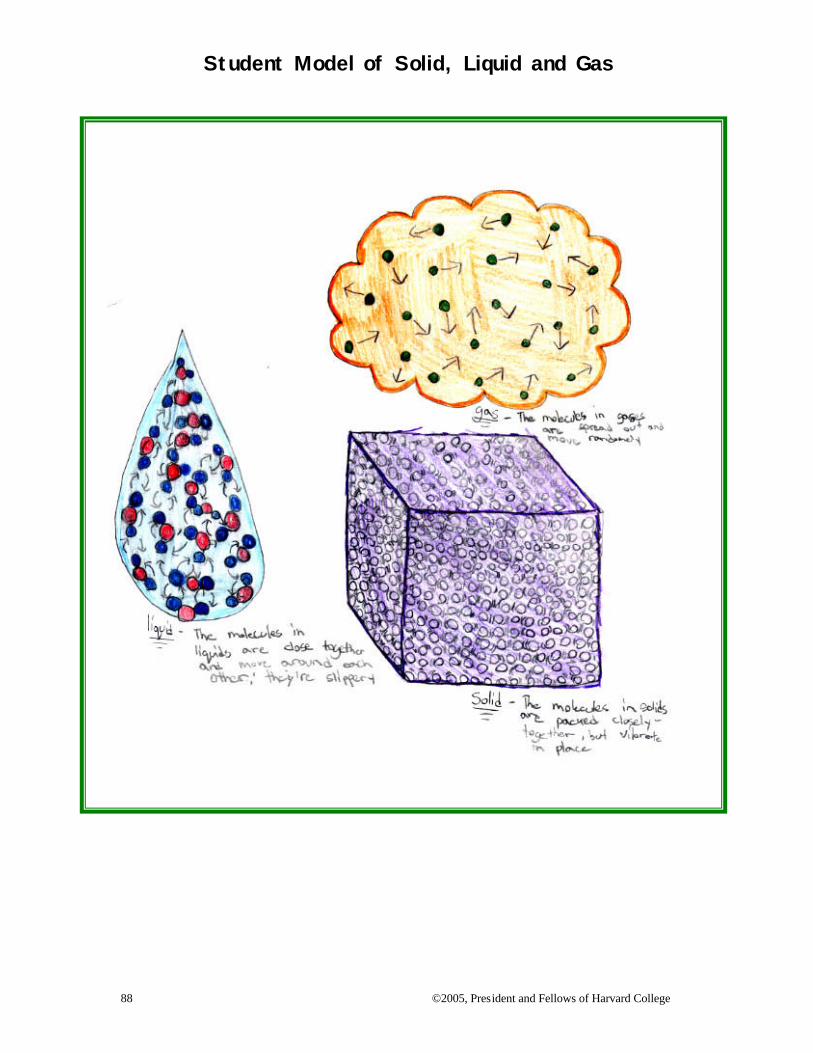
Student Model of Solid, Liquid and Gas
88 ©2005, President and Fellows of Harvard College
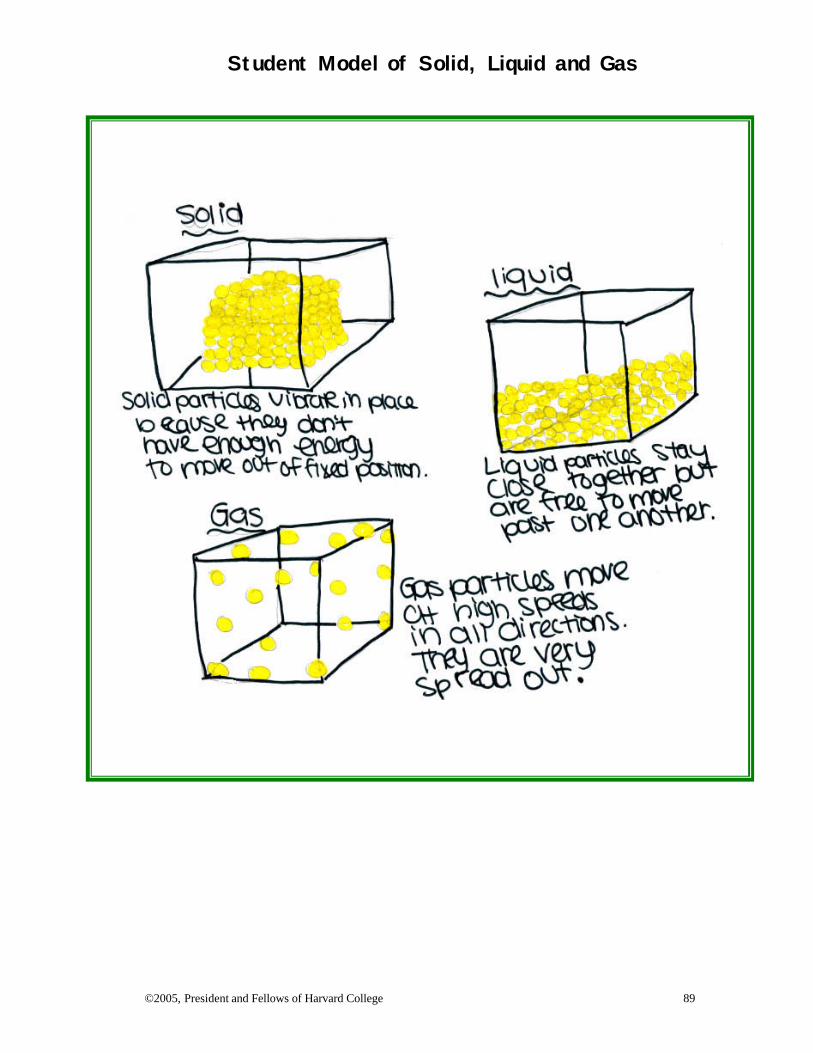
Student Model of Solid, Liquid and Gas
©2005, President and Fellows of Harvard College 89
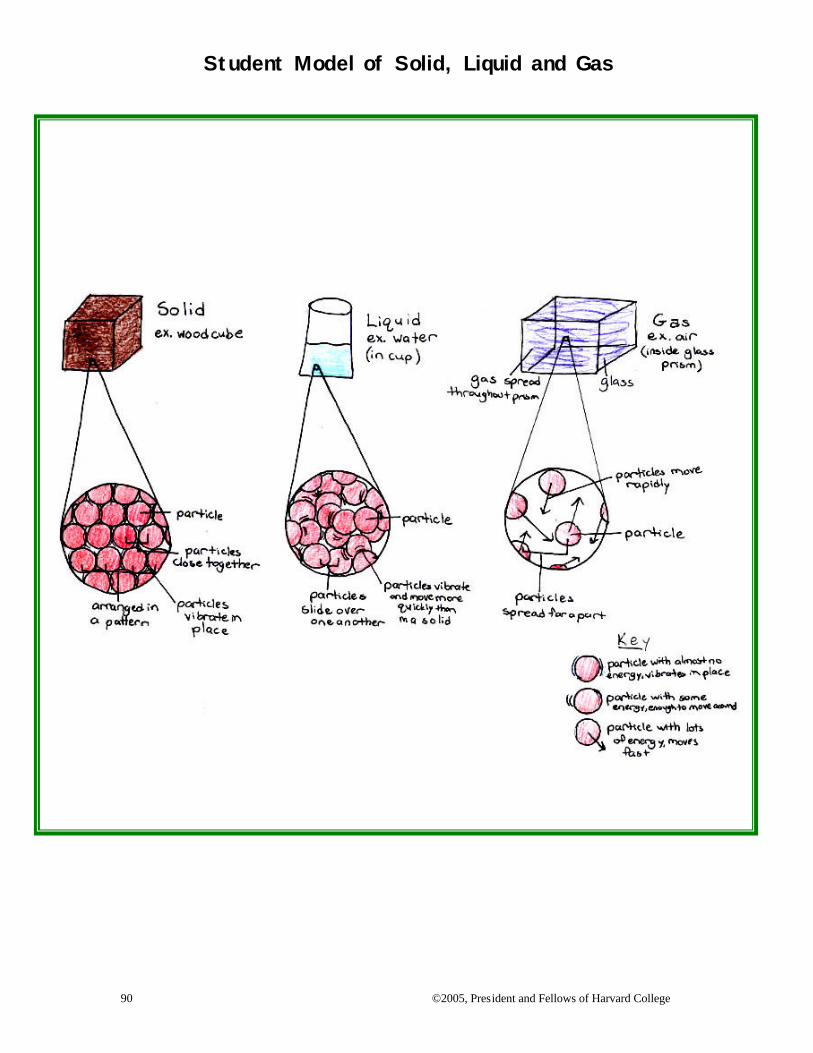
Student Model of Solid, Liquid and Gas
90 ©2005, President and Fellows of Harvard College
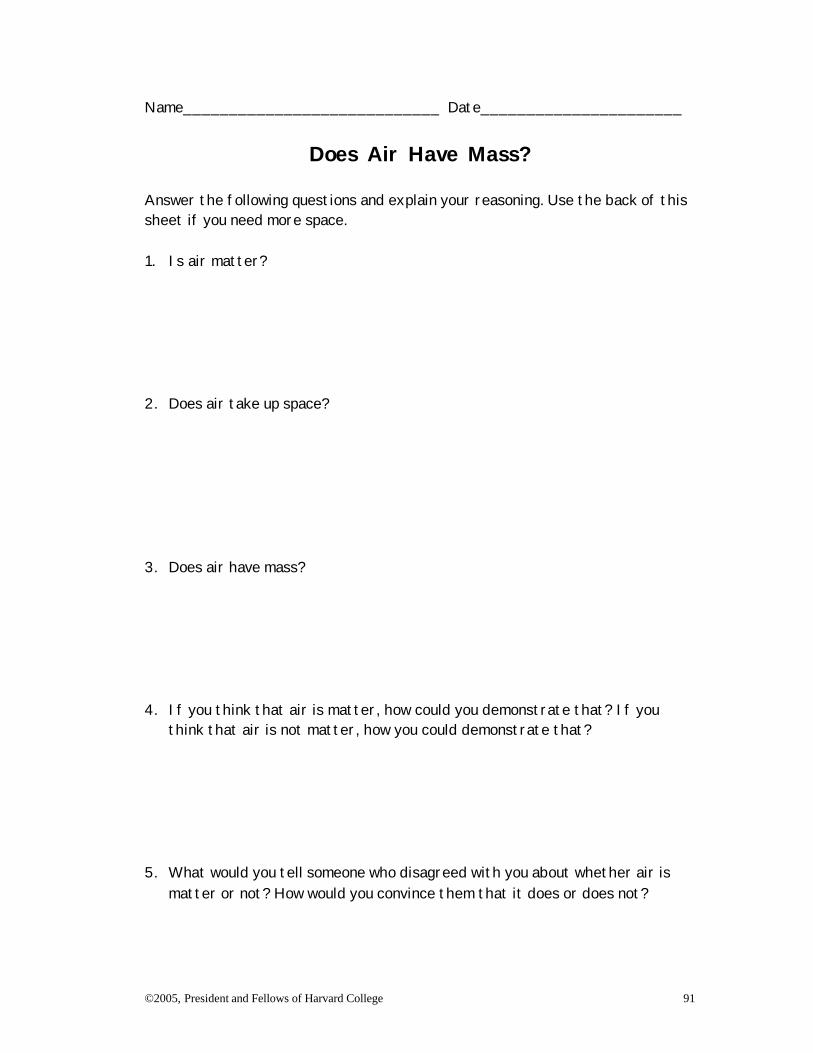
©2005, President and Fellows of Harvard College 91
Name____________________________ Date______________________
Does Air Have Mass? Answer the following questions and explain your reasoning. Use the back of this sheet if you need more space. 1. Is air matter? 2. Does air take up space? 3. Does air have mass? 4. If you think that air is matter, how could you demonstrate that? If you
think that air is not matter, how you could demonstrate that? 5. What would you tell someone who disagreed with you about whether air is
matter or not? How would you convince them that it does or does not?
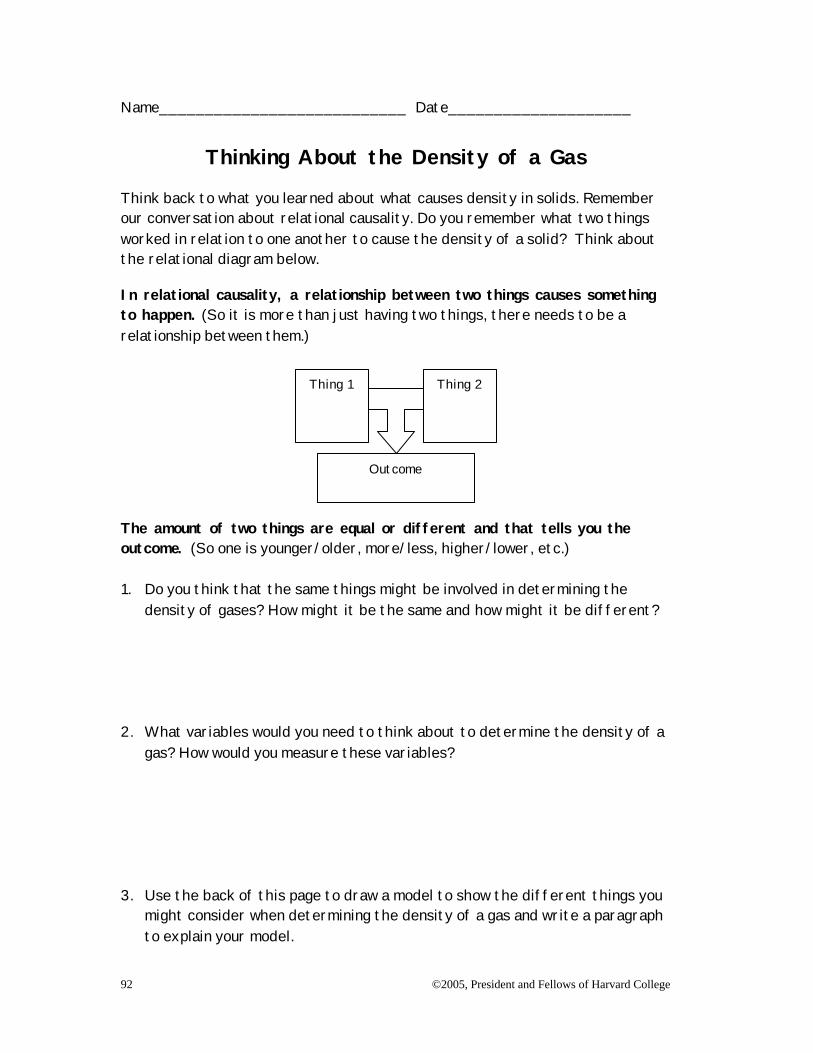
©2005, President and Fellows of Harvard College 92
Name___________________________ Date____________________
Thinking About the Density of a Gas
Think back to what you learned about what causes density in solids. Remember our conversation about relational causality. Do you remember what two things worked in relation to one another to cause the density of a solid? Think about the relational diagram below.
In relational causality, a relationship between two things causes something to happen. (So it is more than just having two things, there needs to be a relationship between them.)
The amount of two things are equal or different and that tells you the outcome. (So one is younger/older, more/less, higher/lower, etc.) 1. Do you think that the same things might be involved in determining the
density of gases? How might it be the same and how might it be different? 2. What variables would you need to think about to determine the density of a
gas? How would you measure these variables? 3. Use the back of this page to draw a model to show the different things you
might consider when determining the density of a gas and write a paragraph to explain your model.
Outcome
Thing 2 Thing 1
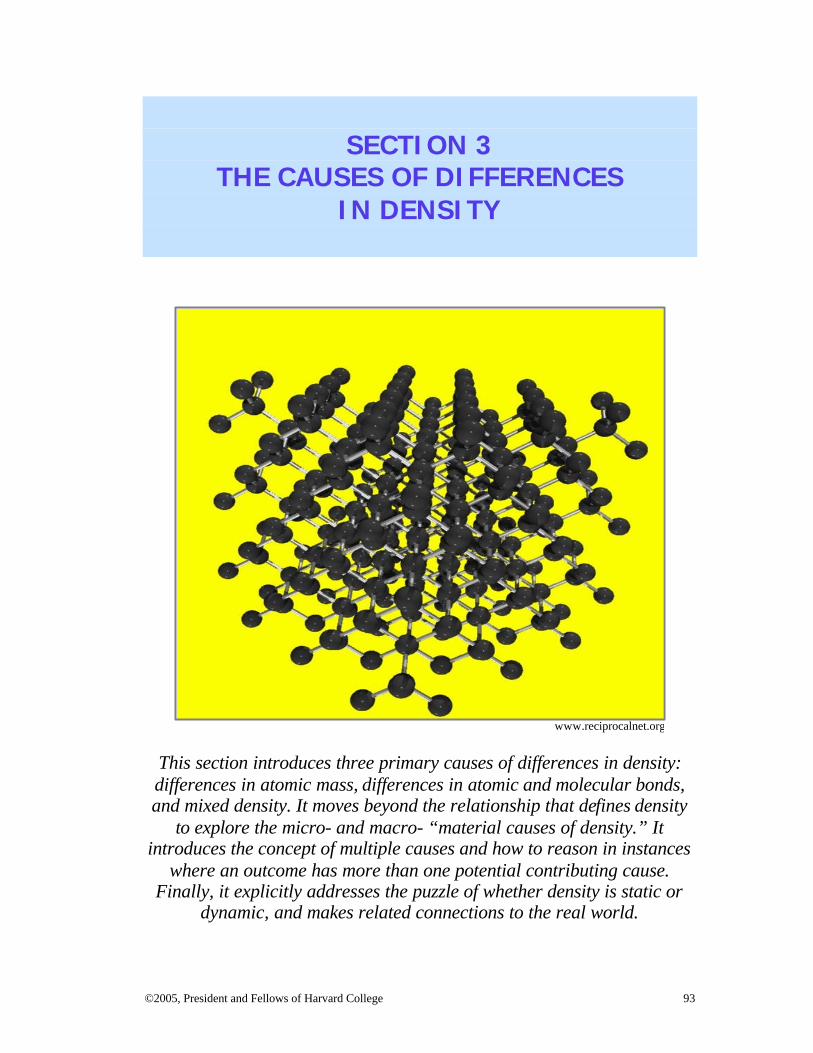
©2005, President and Fellows of Harvard College 93
SECTION 3
THE CAUSES OF DIFFERENCES IN DENSITY
This section introduces three primary causes of differences in density: differences in atomic mass, differences in atomic and molecular bonds, and mixed density. It moves beyond the relationship that defines density
to explore the micro- and macro- “material causes of density.” It introduces the concept of multiple causes and how to reason in instances
where an outcome has more than one potential contributing cause. Finally, it explicitly addresses the puzzle of whether density is static or
dynamic, and makes related connections to the real world.
www.reciprocalnet.org
94 ©2005, President and Fellows of Harvard College
Section 3 Table of Contents
Lesson 8: How Does Atomic Mass Contribute to Density? ........................................95 Lesson 9: How Do Atomic and Molecular Bonds Contribute to Density? ...............100 Lesson 10: How Does Mixed Density Contribute to Overall Density? .....................108 Lesson 11: What Does it Mean for Density to Have Multiple Contributing Causes?...................................................................................................................................114 Lesson 12: Can the Density of Solids, Liquids, and Gases Change? ........................118 Resources for Section 3 .............................................................................................126
©2005, President and Fellows of Harvard College 95
Lesson 8 How Does Atomic Mass Contribute to Density?
Understanding Goals Subject Matter
v One cause of differences in density is the differences in the masses of different atoms.
v The mass of an atom depends upon the number of protons, neutrons and electrons that it is made up of. Protons and neutrons have a lot of mass or are especially heavy, compared to electrons.
v High atomic mass results in more mass in a given amount of space. v Atomic mass as a cause of density applies equally to all states of matter; solid,
liquid, or gas. v We can use atomic mass to make some predictions about density differences.
Causality
v Density has multiple contributing causes. Not every cause is involved in every situation where density is in play.
v You can’t compare objects or substances by using jus t one of the causes alone. It may leave out other important variables that contribute to the resulting density of the objects or substance. You also can’t assume that every cause contributes to every situation.
Background Information Density as Caused Versus Defined
One way to think about the cause of density is that density is a characteristic of stuff –a property of matter. Aristotle talked about “material cause”—in the sense that a “cause” of the existence of a building is its material stuff—that which constitutes it. Density also has “material causes.” However, students tend to say that density isn’t “caused,” it just “is.” They see it as a defining property. By taking a look at the causes of differences in density at the micro- and macro- levels, this section offers students information that enables them to resolve some lingering questions about density—for instance, whether there is air or space in between particles. Or how a very small piece of metal can have much more mass than a large piece of another metal. Students also tend to see density as static. However, there are some respects in which density is dynamic. An understanding of density as dynamic is crucial to
Causal Patterns in Density: The Causes of Differences in Density
96 ©2005, President and Fellows of Harvard College
understanding all sorts of scientific phenomena such as weather patterns, how a thermometer works, convection currents, and so on. This section attempts to shift students towards a more flexible understanding of density—one that enables them to see instances where density can change. This involves having a greater understanding of why there are differences in density and which of the variables contributing to differences in density can change. Causes of Differences in Density: Atomic Mass
In order to help students understand density more deeply and flexibly and to offer them the knowledge that they need in order to analyze real-world instances of density, this section addresses three variables that cause differences in density: 1) atomic mass; 2) the strength and structure of atomic and molecular bonds; and 3) mixed density. This lesson focuses on the first cause: atomic mass. To consider it, we have to zoom in to the micro- level. Some types of atoms have more protons and neutrons than others. This contributes to the mass or weight of the material because protons and neutrons have a lot of mass or weight. (Electrons are very light relative to protons and neutrons, and therefore have little effect on atomic mass.) It also results in more stuff in a given amount of space. Atoms will weigh more or less, depending upon the number of protons and electrons they have. This information can be found on the periodic table. This lesson asks students to use information from the periodic table to predict differences in density. They will find that atomic mass accounts for many of the differences. However, they will also find some discrepancies. This invites students to begin to discover that they can directly compare elements based upon the number of protons and neutrons to come up with the density, because density can have multiple contributing causes. (For example, the strength of the atomic or molecular bonds and subsequent crowdedness of the atoms may compensate for the heaviness of individual atoms.) These other causes, and what it means to have multiple contributing causes, are considered in Lesson 11. Other Causes to Be Explored in Lesson 9 and 10
A second cause of differences in density is the strength and structure of the atomic and molecular bonds. This is most important when thinking about solids and liquids. A third cause of differences in density is mixed density—for instance, when gas molecules are spread out with other molecules in between, or when something is hollow inside and therefore is a combination of air and the material around the outside. These causes are explored in the next few lessons.
Causal Patterns in Density: The Causes of Differences in Density
©2005, President and Fellows of Harvard College 97
Lesson Plan Materials
Ø Cause #1 poster Ø Illustration of Aluminum Atom Ø Some Molecules that Make up Air Ø Thinking about Atomic Mass and Density Ø The Role of Atomic Mass in Density sheet Ø Densities of Common Substances Under Standard Conditions Chart
Prep Step
Ø Review the lesson plan, background information, and understanding goals. Ø Enlarge the Cause #1 poster (p. 127) to post in front of your classroom. Ø Photocopy the sheets, Thinking about Atomic Mass and Density (p. 130); The
Role of Atomic Mass in Density (p. 131); and Densities of Common Substances Under Standard Conditions Chart (p. 132).
Analyze Thinking Step 1: Reflecting on What We Think Causes Differences in Density at the Microscopic Level
Explain to your students that in this lesson we will zoom in to consider the causes of density at a more microscopic level. Ask, “What do you think causes differences in density at the microscopic level?” Encourage students to put forth their theories about how come different materials are denser than others. Collect as many possibilities as students can think of. Students may mention atoms and molecules. If they don’t talk about particles of any kind, introduce the topic by asking, “Do you think the particles that make up matter are part of the explanation for why one substance is denser than another?” Guide them to the idea of particles (or molecules or atoms) and spaces. Say, “Scientists refer to at least three causes of density. We’ll talk a lot about one of them and then we’ll come back to the other two in the next two lessons.”
Explore Causality Step 2: Introducing Atomic Mass
Explain that in order to think about the first cause, we will need to "zoom in." Tell the students that they need to zoom in just like they are looking through a very powerful microscope.
Causal Patterns in Density: The Causes of Differences in Density
98 ©2005, President and Fellows of Harvard College
Put up the Cause #1 poster (p. 127). Ask the students to consider the pictures showing models of two different atoms. Remind the students what atoms are. Then ask them to look at the differences between the atoms. What do they notice? They should notice that one has more protons and neutrons than the other, and that there is more stuff in a given amount of space. One of the causes of density has to do with how many protons and neutrons the atoms that make up the material have. Protons and neutrons are big and heavy. The atoms might also have different numbers of electrons, but these don't really make a difference because they are so light. There could be huge differences in the numbers of electrons between one type of atom and another, but it wouldn't really matter to the density.
Step 3: Can an “Air Molecule” Air fit inside an Atom?
Draw the students’ attention to the spaces inside the atoms. An atom is mostly empty space. Most of the mass is packed into the center part which is called the nucleus. Say, “If another student said that there was lots of air in these spaces, what would you say? Would you agree or disagree?” Gather the students’ ideas and supporting reasoning for why they would agree or not. Show the illustration of an Aluminum Atom (p. 128) and Some Molecules that Make up Air (p. 129). Explain to the students how the molecules that make up air could not possibly fit inside an atom. (Even if the gas that makes up the air was made up only of single atoms, the single atom still wouldn’t fit inside another atom.) Besides the issue of fit in terms of size, there are other chemical and electrical reasons why an atom doesn’t “go inside” another atom.
Remind the students that we sometimes say “Air Molecules,” but what we mean are the molecules that make up the air (such as nitrogen, carbon dioxide, oxygen, etc.) There really is no such thing as an actual air molecule. Help the students come to the realization that air is like any other substance: it is matter and can be part of an object or substance, but it is no different from any other matter when it comes to determining density. Make sure that by the end of the discussion the students understand that the empty space in the atom IS NOT air. It is empty space. In fact, there is even space within the atoms that make up the air that cannot be filled with air.
Step 4: The Role of Atomic Mass in Density
Pass out and read the Thinking about Atomic Mass and Density (p. 130) sheet together. Discuss it. It introduces the concept of atomic mass and helps students to see why some atoms have more mass than others.
Causal Patterns in Density: The Causes of Differences in Density
©2005, President and Fellows of Harvard College 99
Step 5: Exploring the Implications of Atomic Mass
Pass out the sheet, The Role of Atomic Mass in Density (p. 131). If mass of atoms were the only cause of density, which of each pair would you expect to be denser? Have the students go through the list and check the atomic mass of each type of atom. Have them infer from this which materials are likely to be denser. Next, hand out Densities of Common Substances Under Standard Conditions chart (p. 132) and check each element on the worksheet against the density chart. Ask your students, “Were you able to make accurate predictions using atomic mass? Why or why not?”
Review, Extend, Apply
Step 6: Introducing a Puzzler
Pose the following puzzler about platinum and gold. “How can it be that Platinum has a density of 21.4 g/cm3 and Gold has a density of 19.3 g/cm3 if Platinum has a Mass Number (or Atomic Mass) of 195 and Gold has a Mass Number (or Atomic Mass) of 197?” Ask students to draw some models and give a written response. Discuss the puzzler together. Ask students if they think that atomic mass is still a cause of density, as discussed in the lesson, or if they think that the Cause #1 poster is wrong. Is there any way that it can be true and platinum still be denser than gold? Ask the students what they think about it now. Collect some of their ideas. Have the students think about it during the course of the next lesson, and explain that you will come back to this question again later.
100 ©2005, President and Fellows of Harvard College
Lesson 9 How Do Atomic and Molecular Bonds Contribute to Density?
Understanding Goals Subject Matter
v A second cause of differences in density is the strength and structure of the atomic and molecular bonds of the substance. This is most important when thinking about solids and liquids.
Causality
v Density has multiple contributing causes. Not every cause is involved in every situation where density is in play.
v You can’t compare objects or substances by using just one of the causes alone. It may leave out other important relationships that could contribute to the resulting density of the object or substance. You also can’t assume that every cause contributes to every situation.
Background Information Atoms, Molecules, and Compounds
Before diving into this lesson, it may help to clarify some terms and relationships with your students. Atoms are made up of protons, neutrons, and electrons. An atom is mostly empty space. Atoms can bond to other atoms by atomic bonds to create molecules. Atoms can also bond to other atoms to create compounds. When we refer to atomic bonds, we are referring to the bonds between atoms to create molecules or compounds, not what holds protons, neutrons and electrons together within atoms. At the next level, molecules can bond to other molecules by molecular bonds. However, not all matter is made up of molecules. Atoms can also combine directly into compounds. A compound is made up of different elements where there are bonds between the atoms (atomic bonds), and the proportion of one element to the other(s) remains the same. For instance, table salt (NaCl) is made up of chlorine and sodium atoms. If you take a piece of it, it will always have the same ratio of sodium atoms to chlorine atoms, but it does not break down into molecules. Molecules can also form compounds, but not all matter consists of molecules.
The Strength of Atomic and Molecular Bonds
The second cause of density also involves imagining that you are zooming in to the micro- level. It has to do with how atoms are bonded (with atomic bonds) to other
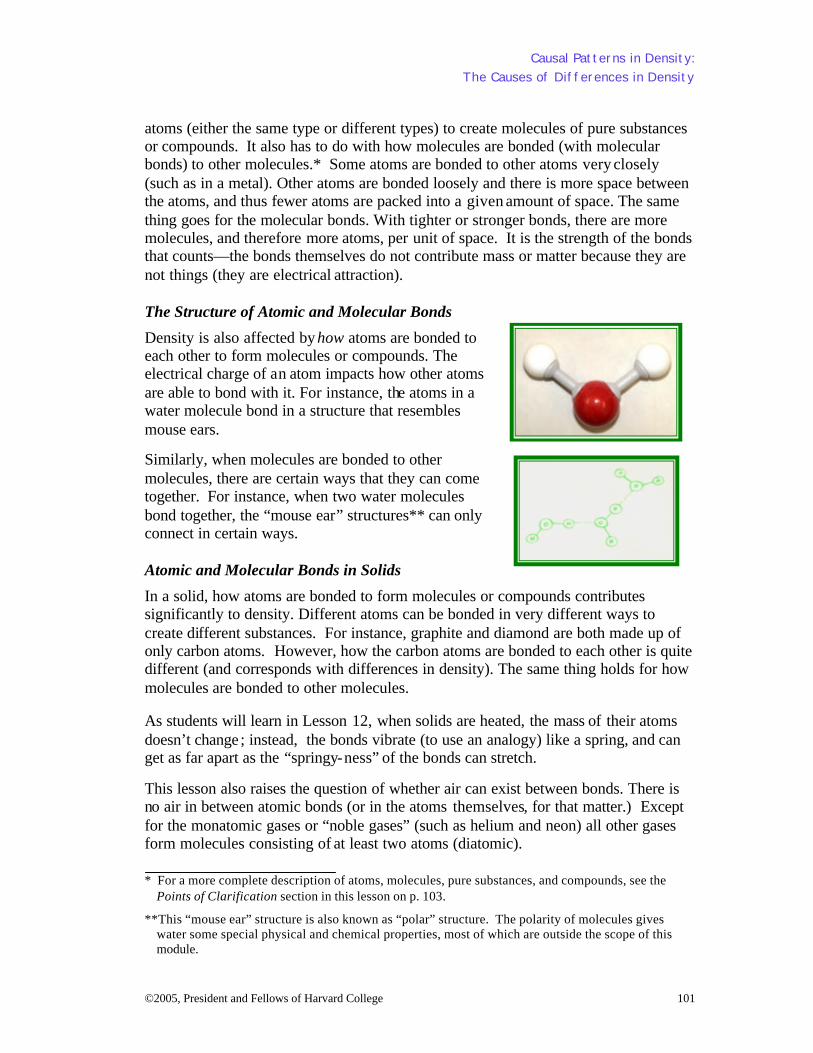
Causal Patterns in Density: The Causes of Differences in Density
©2005, President and Fellows of Harvard College 101
atoms (either the same type or different types) to create molecules of pure substances or compounds. It also has to do with how molecules are bonded (with molecular bonds) to other molecules.* Some atoms are bonded to other atoms very closely (such as in a metal). Other atoms are bonded loosely and there is more space between the atoms, and thus fewer atoms are packed into a given amount of space. The same thing goes for the molecular bonds. With tighter or stronger bonds, there are more molecules, and therefore more atoms, per unit of space. It is the strength of the bonds that counts—the bonds themselves do not contribute mass or matter because they are not things (they are electrical attraction). The Structure of Atomic and Molecular Bonds
Density is also affected by how atoms are bonded to each other to form molecules or compounds. The electrical charge of an atom impacts how other atoms are able to bond with it. For instance, the atoms in a water molecule bond in a structure that resembles mouse ears.
Similarly, when molecules are bonded to other molecules, there are certain ways that they can come together. For instance, when two water molecules bond together, the “mouse ear” structures** can only connect in certain ways. Atomic and Molecular Bonds in Solids
In a solid, how atoms are bonded to form molecules or compounds contributes significantly to density. Different atoms can be bonded in very different ways to create different substances. For instance, graphite and diamond are both made up of only carbon atoms. However, how the carbon atoms are bonded to each other is quite different (and corresponds with differences in density). The same thing holds for how molecules are bonded to other molecules. As students will learn in Lesson 12, when solids are heated, the mass of their atoms doesn’t change; instead, the bonds vibrate (to use an analogy) like a spring, and can get as far apart as the “springy-ness” of the bonds can stretch.
This lesson also raises the question of whether air can exist between bonds. There is no air in between atomic bonds (or in the atoms themselves, for that matter.) Except for the monatomic gases or “noble gases” (such as helium and neon) all other gases form molecules consisting of at least two atoms (diatomic).
* For a more complete description of atoms, molecules, pure substances, and compounds, see the
Points of Clarification section in this lesson on p. 103.
**This “mouse ear” structure is also known as “polar” structure. The polarity of molecules gives water some special physical and chemical properties, most of which are outside the scope of this module.
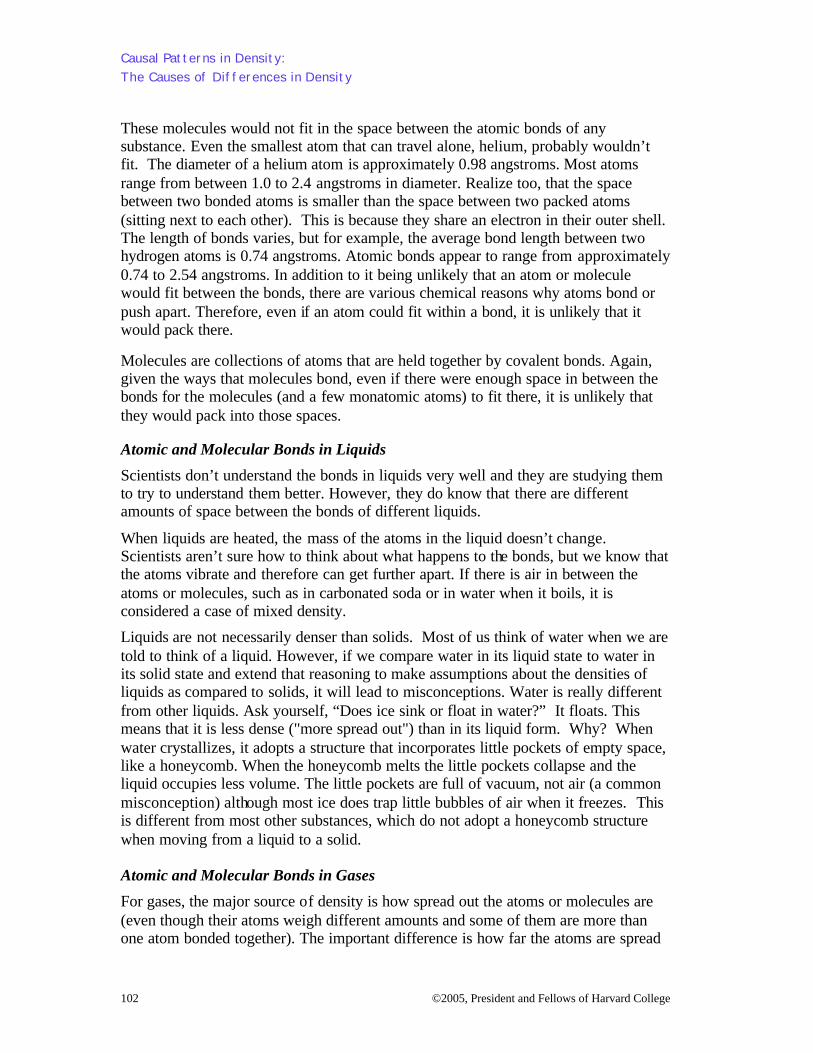
Causal Patterns in Density: The Causes of Differences in Density
102 ©2005, President and Fellows of Harvard College
These molecules would not fit in the space between the atomic bonds of any substance. Even the smallest atom that can travel alone, helium, probably wouldn’t fit. The diameter of a helium atom is approximately 0.98 angstroms. Most atoms range from between 1.0 to 2.4 angstroms in diameter. Realize too, that the space between two bonded atoms is smaller than the space between two packed atoms (sitting next to each other). This is because they share an electron in their outer shell. The length of bonds varies, but for example, the average bond length between two hydrogen atoms is 0.74 angstroms. Atomic bonds appear to range from approximately 0.74 to 2.54 angstroms. In addition to it being unlikely that an atom or molecule would fit between the bonds, there are various chemical reasons why atoms bond or push apart. Therefore, even if an atom could fit within a bond, it is unlikely that it would pack there.
Molecules are collections of atoms that are held together by covalent bonds. Again, given the ways that molecules bond, even if there were enough space in between the bonds for the molecules (and a few monatomic atoms) to fit there, it is unlikely that they would pack into those spaces. Atomic and Molecular Bonds in Liquids
Scientists don’t understand the bonds in liquids very well and they are studying them to try to understand them better. However, they do know that there are different amounts of space between the bonds of different liquids.
When liquids are heated, the mass of the atoms in the liquid doesn’t change. Scientists aren’t sure how to think about what happens to the bonds, but we know that the atoms vibrate and therefore can get further apart. If there is air in between the atoms or molecules, such as in carbonated soda or in water when it boils, it is considered a case of mixed density.
Liquids are not necessarily denser than solids. Most of us think of water when we are told to think of a liquid. However, if we compare water in its liquid state to water in its solid state and extend that reasoning to make assumptions about the densities of liquids as compared to solids, it will lead to misconceptions. Water is really different from other liquids. Ask yourself, “Does ice sink or float in water?” It floats. This means that it is less dense ("more spread out") than in its liquid form. Why? When water crystallizes, it adopts a structure that incorporates little pockets of empty space, like a honeycomb. When the honeycomb melts the little pockets collapse and the liquid occupies less volume. The little pockets are full of vacuum, not air (a common misconception) although most ice does trap little bubbles of air when it freezes. This is different from most other substances, which do not adopt a honeycomb structure when moving from a liquid to a solid. Atomic and Molecular Bonds in Gases
For gases, the major source of density is how spread out the atoms or molecules are (even though their atoms weigh different amounts and some of them are more than one atom bonded together). The important difference is how far the atoms are spread
Causal Patterns in Density: The Causes of Differences in Density
©2005, President and Fellows of Harvard College 103
out (typically, there are other gases in between them). This difference is so much larger than the differences between the bonds of the particular atoms (when there are bonds–helium is individual atoms) or molecules that the strength of the bonds is inconsequential. The effect is outweighed.
However, when you compare different gases, the difference in the mass of their atoms helps to determine which gases sink in relation to others. When a gas is spread out there can be other kinds of atoms and molecules in between—such as nitrogen, oxygen, water, etc. Therefore, they are considered in this module to be a form of mixed density.
Gases can expand a lot because they typically consist of lone, unbonded atoms or molecules. Gases typically do not have bonds between individual atoms or molecules, which allows them to spread out much farther than those of a liquid or solid. How close together or spread out the atoms or molecules are determines the density of a gas to a large extent, because the mass of the individual atoms of molecules doesn’t change, while the amount of volume they take up can change dramatically. Points of Clarification
Students tend to be confused about whether or not air plays a role in density. In order to help students see that in many cases, air or the molecules that make up the air have no role in density; this curriculum presents two causes (atomic mass and atomic or molecular bonds) where “air molecules” do not make any real contribution to differences in density.
The third cause (introduced in Lesson 10) focuses on mixed density. Here, “air molecules” can contribute to overall density. Mixed density of an object refers to instances when the total density includes the density of more than one material or substance.
The three causes are, in a sense, a simplification. Molecular bonds are grouped with atomic bonds to make it easier for students to reason about the three causes. However, there are instances where the causes overlap. For instance, the structure of molecules affects how spread out they are, and in the case of the molecules in many plastics (polymers), they are long and curly. When they fit next to each other there can be spaces (with vacuum, gases or liquids in them). These can be cases of mixed density. In other cases, molecules or atoms are spread out, but it is not due to mixed density. Instead of air in between the molecules or atoms, there is simply space. With older students, you may wish to raise some of these puzzles after they have learned the three causes of density. This will help them to see that the three causes are a simplification. The “causes” are tools for analysis, but need to be understood in terms of the perspective that they present. Teachers can decide whether to gloss over these fine distinctions or to help students understand them, depending upon the particular learning needs of the group and curriculum objectives.
Causal Patterns in Density: The Causes of Differences in Density
104 ©2005, President and Fellows of Harvard College
Lesson Plan Materials
Ø Cause #1 and Cause # 2 posters Ø Two sets of balls with springs between them to illustrate atomic bonds (see
picture below) Ø Water Molecule illustration Ø Molecular Diagram of Graphite Ø Molecular Diagram of Diamond Ø How and Why article by David Ropeik Ø The Densest Element sheet Ø Two of the cylinders from Lesson 1
Prep Step
Ø Review the lesson plan, background information, and understanding goals. Ø Gather materials. Ø Enlarge the Cause #2 poster (p. 133) to post beside the Cause #1 poster. Ø Photocopy the article How and Why by David Ropeik (p. 137) and the sheet,
The Densest Element (p. 138).
Analyze Thinking Step 1: What Else Causes Differences in Density?
Remind students of the discrepancies between what atomic mass predicts for the density of a substance and the information from the density chart. In most cases, high atomic mass correlates with high density, but not in all cases. Ask the students to consider what else might be going on. Do they have any ideas? Collect their thoughts.
Remind them of the various models that they considered in Lesson 2. Do those models help them to think about what else might be going on?
Explore Causality
Step 2: Introducing the Role of Atomic and Molecular Bonds
Put up the Cause #2 poster. (Leave the poster from the last lesson up beside it for comparison.) Explain, “In order to consider atomic mass, we zoomed in to the micro- level. Now we are going to stay zoomed in at that level because Cause #2 is also at the micro- level. A second cause of density has to do with the way that the atoms stay together or that collections of atoms are structured.” Show the students a set of two balls with a spring between them. Explain that each ball represents an atom (along with its protons, neutrons, and electrons) and the spring represents the bond between them. Then compare it to another set of
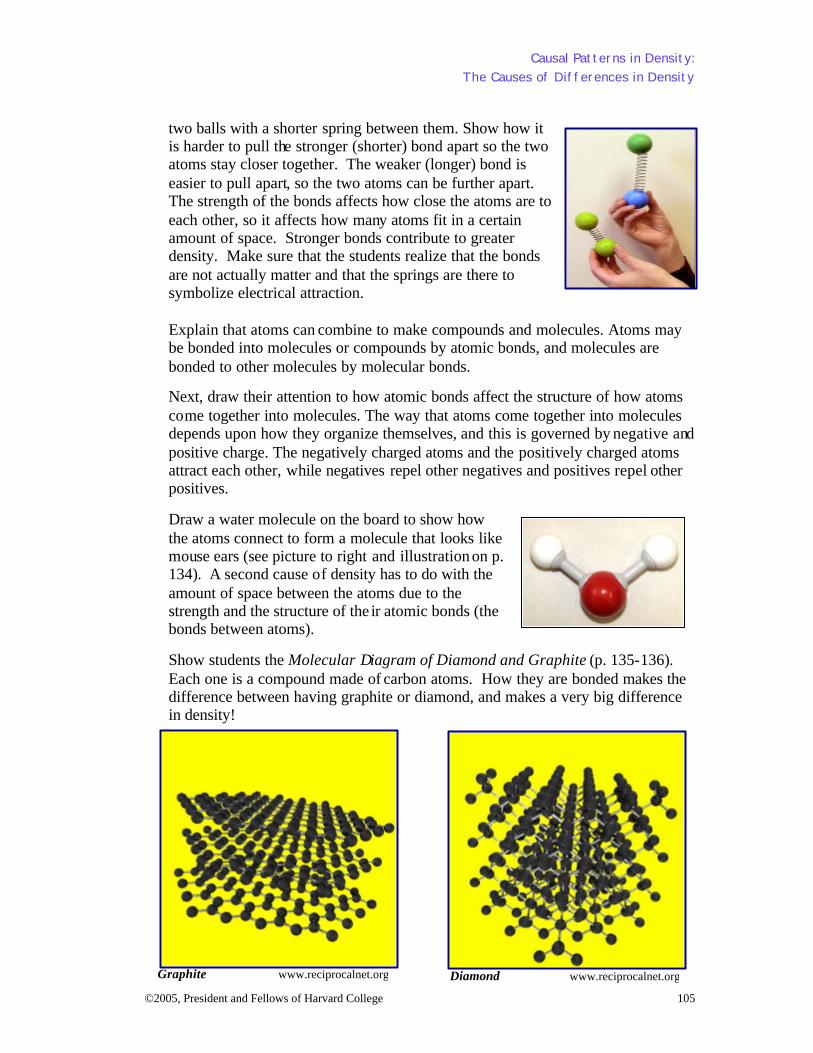
Causal Patterns in Density: The Causes of Differences in Density
©2005, President and Fellows of Harvard College 105
two balls with a shorter spring between them. Show how it is harder to pull the stronger (shorter) bond apart so the two atoms stay closer together. The weaker (longer) bond is easier to pull apart, so the two atoms can be further apart. The strength of the bonds affects how close the atoms are to each other, so it affects how many atoms fit in a certain amount of space. Stronger bonds contribute to greater density. Make sure that the students realize that the bonds are not actually matter and that the springs are there to symbolize electrical attraction. Explain that atoms can combine to make compounds and molecules. Atoms may be bonded into molecules or compounds by atomic bonds, and molecules are bonded to other molecules by molecular bonds.
Next, draw their attention to how atomic bonds affect the structure of how atoms come together into molecules. The way that atoms come together into molecules depends upon how they organize themselves, and this is governed by negative and positive charge. The negatively charged atoms and the positively charged atoms attract each other, while negatives repel other negatives and positives repel other positives.
Draw a water molecule on the board to show how the atoms connect to form a molecule that looks like mouse ears (see picture to right and illustration on p. 134). A second cause of density has to do with the amount of space between the atoms due to the strength and the structure of the ir atomic bonds (the bonds between atoms).
Show students the Molecular Diagram of Diamond and Graphite (p. 135-136). Each one is a compound made of carbon atoms. How they are bonded makes the difference between having graphite or diamond, and makes a very big difference in density!
Diamond www.reciprocalnet.org
Graphite www.reciprocalnet.org
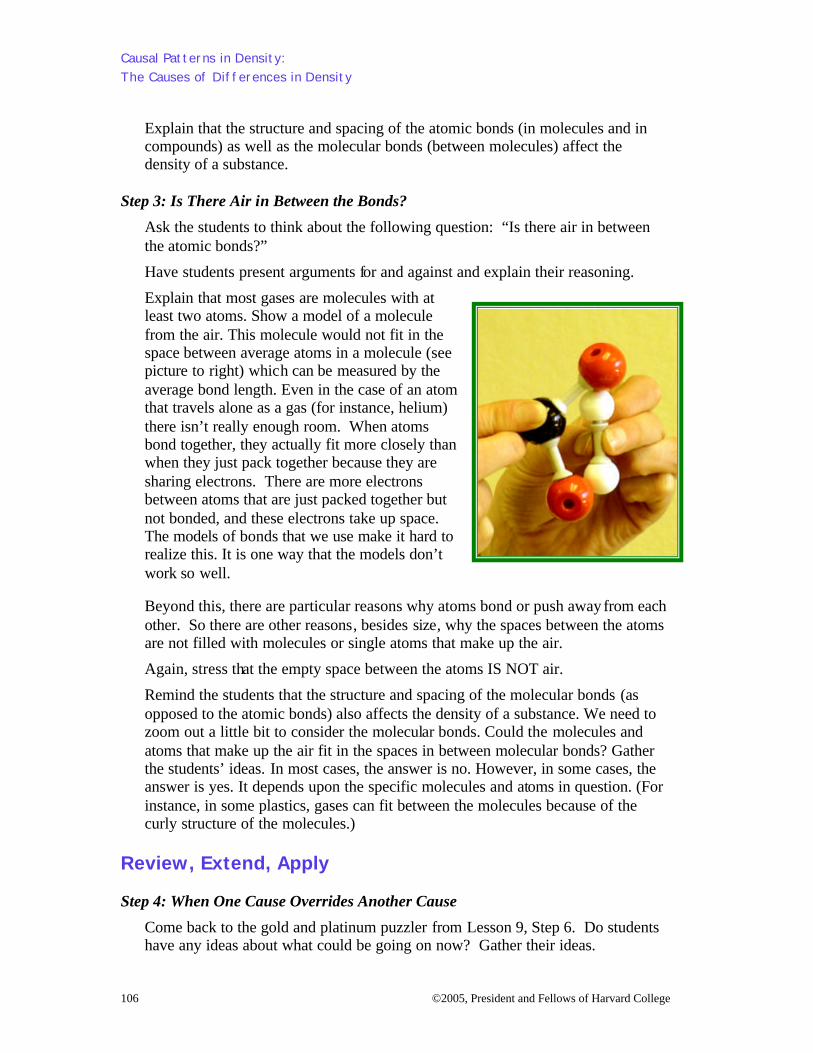
Causal Patterns in Density: The Causes of Differences in Density
106 ©2005, President and Fellows of Harvard College
Explain that the structure and spacing of the atomic bonds (in molecules and in compounds) as well as the molecular bonds (between molecules) affect the density of a substance.
Step 3: Is There Air in Between the Bonds?
Ask the students to think about the following question: “Is there air in between the atomic bonds?”
Have students present arguments for and against and explain their reasoning.
Explain that most gases are molecules with at least two atoms. Show a model of a molecule from the air. This molecule would not fit in the space between average atoms in a molecule (see picture to right) which can be measured by the average bond length. Even in the case of an atom that travels alone as a gas (for instance, helium) there isn’t really enough room. When atoms bond together, they actually fit more closely than when they just pack together because they are sharing electrons. There are more electrons between atoms that are just packed together but not bonded, and these electrons take up space. The models of bonds that we use make it hard to realize this. It is one way that the models don’t work so well. Beyond this, there are particular reasons why atoms bond or push away from each other. So there are other reasons, besides size, why the spaces between the atoms are not filled with molecules or single atoms that make up the air.
Again, stress that the empty space between the atoms IS NOT air.
Remind the students that the structure and spacing of the molecular bonds (as opposed to the atomic bonds) also affects the density of a substance. We need to zoom out a little bit to consider the molecular bonds. Could the molecules and atoms that make up the air fit in the spaces in between molecular bonds? Gather the students’ ideas. In most cases, the answer is no. However, in some cases, the answer is yes. It depends upon the specific molecules and atoms in question. (For instance, in some plastics, gases can fit between the molecules because of the curly structure of the molecules.)
Review, Extend, Apply Step 4: When One Cause Overrides Another Cause
Come back to the gold and platinum puzzler from Lesson 9, Step 6. Do students have any ideas about what could be going on now? Gather their ideas.
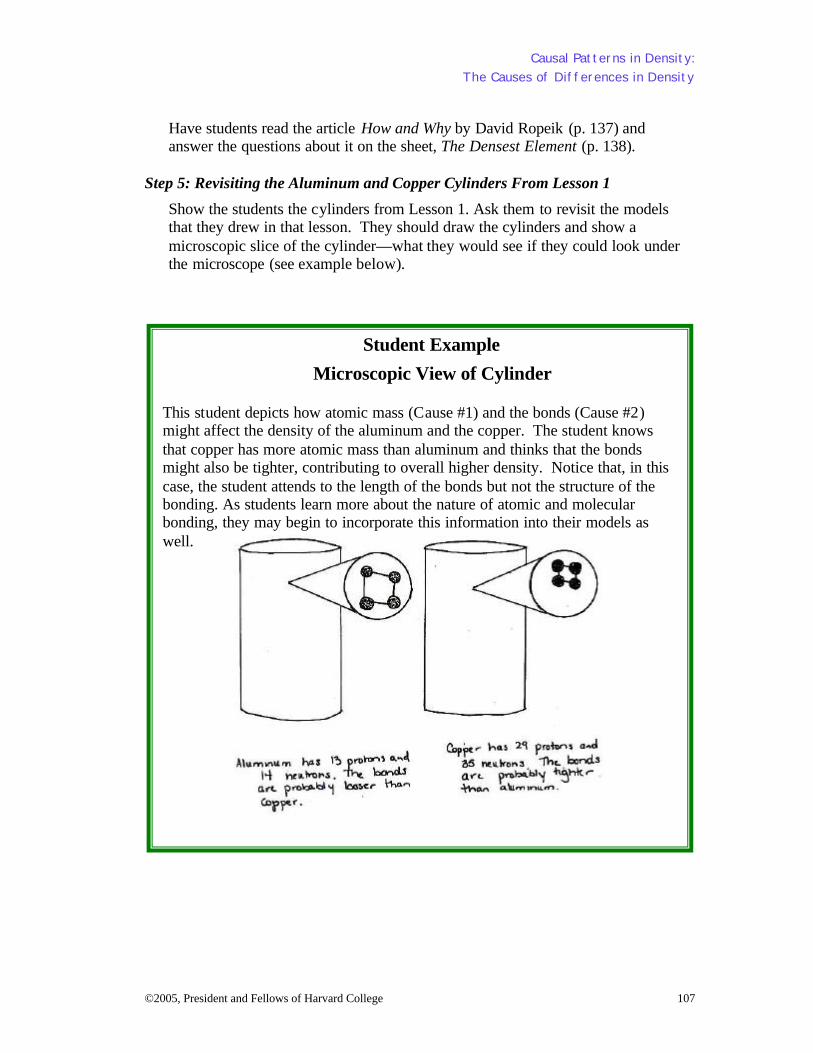
Causal Patterns in Density: The Causes of Differences in Density
©2005, President and Fellows of Harvard College 107
Student Example
Microscopic View of Cylinder
This student depicts how atomic mass (Cause #1) and the bonds (Cause #2) might affect the density of the aluminum and the copper. The student knows that copper has more atomic mass than aluminum and thinks that the bonds might also be tighter, contributing to overall higher density. Notice that, in this case, the student attends to the length of the bonds but not the structure of the bonding. As students learn more about the nature of atomic and molecular bonding, they may begin to incorporate this information into their models as well.
Have students read the article How and Why by David Ropeik (p. 137) and answer the questions about it on the sheet, The Densest Element (p. 138).
Step 5: Revisiting the Aluminum and Copper Cylinders From Lesson 1
Show the students the cylinders from Lesson 1. Ask them to revisit the models that they drew in that lesson. They should draw the cylinders and show a microscopic slice of the cylinder—what they would see if they could look under the microscope (see example below).
108 ©2005, President and Fellows of Harvard College
Lesson 10 How Does Mixed Density Contribute to Overall Density?
Understanding Goals Subject Matter
v A third cause of differences in density is mixed density. v There are different ways that density can be mixed, for instance, when gas
molecules are spread out with other molecules in between; when something is hollow inside or has “air pockets,” and so is a combination of air and the material around the outside.
v Mixed density is usually thought of at the macro- level, for instance, as two or more substances or materials (such as water and carbon dioxide in the case of carbonated beverages).
v There are some instances of mixed density at the micro- level, such as certain plastics (polymers) that have a molecular structure that allows gases to fit in between the molecules.
Causality
v Density has multiple contributing causes. Not every cause is involved in every situation where density is in play.
v You can’t compare objects by using just one of the causes alone. It will leave out other important relationships that could contribute to the resulting density. You also can’t assume that every cause contributes significantly to differences in density in every situation.
Background Information Mixed Density
The third cause is most easily talked about as mixed density. One example of mixed density is when a gas, such as water molecules in the form of steam, spreads out in a room and there are lots of “air molecules” in between the “water molecules.” Other examples include a sponge with holes in it. The state of the molecules affects how spread out they are. For instance, Styrofoam is formed by blowing air into a dense liquid, Styrene. The air greatly increases the liquid’s volume without adding much mass, and the density of the resulting Styrofoam is due to the combination of the density of the Styrene and the density of the air. The in-between space in this case is air (sometimes it is another material instead).
Causal Patterns in Density: The Causes of Differences in Density
©2005, President and Fellows of Harvard College 109
While mixed density appears to be a comprehensible way to talk about the third cause with students, it lacks some precision. Here is the compromise that this simpler presentation makes. First, there are cases where molecules or atoms are spread out, but the density of the object or substance is not due to mixed density. Instead of air in between the molecules or atoms, there is simply space. Second, the molecules in many plastics (polymers) are long and curly, so when they fit next to each other there can be spaces (with vacuum, gases or liquids in them). This introduces a puzzle about where to include molecular bonds. Gases fit in between some molecular bonds, such as those in certain plastics. Therefore, these substances could be categorized as mixed density. However, gases do not fit in the spaces between most molecular bonds, therefore most of them are best described by Cause #2.
110 ©2005, President and Fellows of Harvard College
Lesson Plan Materials
Ø Cause #1, Cause #2, and Cause #3 posters Ø 10 ml graduated cylinder, 1 per group of 3-4 students Ø Catch basins, 1 per group of 3-4 students Ø Triple-beam balances, 1 per group of 3-4 students Ø Assorted materials and objects:
-clay -balsa wood pieces of various shapes -corks of various shapes -Styrofoam pieces of various shapes -other every day objects or materials
Prep Step
Ø Review the lesson plan, background information, and understanding goals. Ø Gather materials. Ø Enlarge the Cause #3 poster (p. 139) to post beside the Cause #1 and Cause
#2 posters. Analyze Thinking Step 1: What Else Causes Differences in Density?
Explain that in this lesson, you will be considering another cause of differences in density. Based on what the students have already learned, can any of them guess what it is?
So far you have explained causes of density that do not involve air. This last cause can include air.
Explore Causality Step 2: Introducing Mixed Density
Put up the Cause #3 poster next to the posters from the previous lessons. Explain that the third cause is a little less “zoomed in” than the first two causes. This cause is most easily talked about as mixed density. One example is when a gas, such as water molecules in the form of steam, spreads out in a room and there are lots of “air molecules” in between the “water molecules.” Other examples include a sponge with holes in it. The state of the molecules affects how spread out they are. For instance, Styrofoam is formed by blowing air into a dense liquid, Styrene. The air greatly increases the liquid’s volume without adding much mass, and the density of the resulting Styrofoam is due to the combination of the density of the Styrene and the density of the air. The in-between space in this case is air (sometimes it is another material instead).
Causal Patterns in Density: The Causes of Differences in Density
©2005, President and Fellows of Harvard College 111
Explore the idea of mixed density with students. Consider the examples on the chart. Then ask, “How does mixed density explain a hollow object?” Gather ideas. [Students have to account for the density of the surrounding material and the density of the air inside.]
Explore Outcomes Step 3: Exploring How Mixed Density Affects Overall Density
This activity invites the students to experiment with different mixed densities by combining materials to create a composition of a given density. Divide the class into groups of 3-4 students. Give each group an assortment (or access to a class collection) of materials and objects. First, the students should choose a target density range. They can look on the density chart from Lesson 8 to choose a target. They shouldn’t choose densities in the range of the heaviest or lightest elements. Ask them to explain why not. Then they should work on assembling an object with this density, pausing periodically to measure its mass and volume and to calculate its density. While students are working, circulate to discuss how students are approaching the task. You can use this as an assessment of how they apply what they know about density and how much they plan out their approach. Afterwards, ask the students to share both what they did and how they approached the task.
Review, Extend, Apply Step 4: Critiquing the Models from Lesson Two: What They Reveal About the Causes of Density
Step back to re-consider the models that were presented in Lesson 2. What does each help to show in terms of the three causes of density? Engage the students in a discussion of each model. Discuss the models by asking others what makes sense about a particular model and what doesn’t. What could we do to improve the model? What do the models share that help us understand density better? Try to draw out the following points:
Note to Teacher: Depending upon the class, you might tell your students as an aside that you have simplified the third cause a little to make it easier to understand. It is basically correct. It leaves out some special cases, for example, certain kinds of plastics.
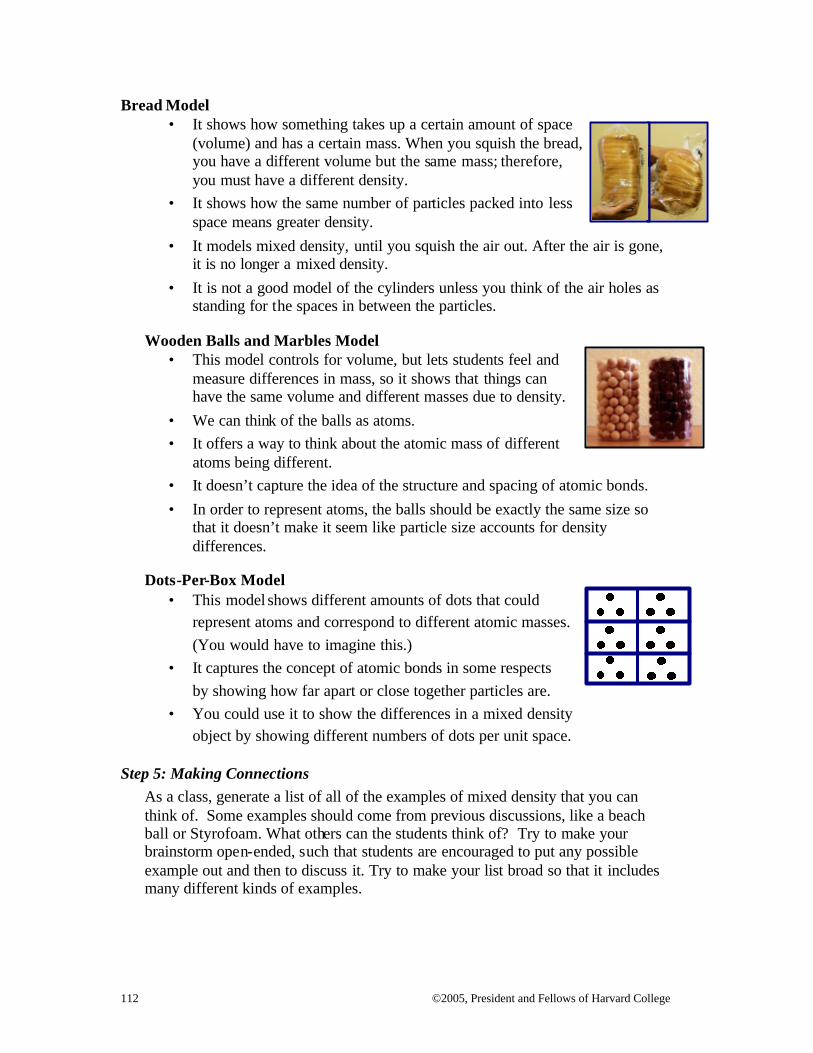
112 ©2005, President and Fellows of Harvard College
Bread Model • It shows how something takes up a certain amount of space
(volume) and has a certain mass. When you squish the bread, you have a different volume but the same mass; therefore, you must have a different density.
• It shows how the same number of particles packed into less space means greater density.
• It models mixed density, until you squish the air out. After the air is gone, it is no longer a mixed density.
• It is not a good model of the cylinders unless you think of the air holes as standing for the spaces in between the particles.
Wooden Balls and Marbles Model • This model controls for volume, but lets students feel and
measure differences in mass, so it shows that things can have the same volume and different masses due to density.
• We can think of the balls as atoms. • It offers a way to think about the atomic mass of different
atoms being different. • It doesn’t capture the idea of the structure and spacing of atomic bonds. • In order to represent atoms, the balls should be exactly the same size so
that it doesn’t make it seem like particle size accounts for density differences.
Dots-Per-Box Model • This model shows different amounts of dots that could
represent atoms and correspond to different atomic masses. (You would have to imagine this.)
• It captures the concept of atomic bonds in some respects by showing how far apart or close together particles are.
• You could use it to show the differences in a mixed density object by showing different numbers of dots per unit space.
Step 5: Making Connections
As a class, generate a list of all of the examples of mixed density that you can think of. Some examples should come from previous discussions, like a beach ball or Styrofoam. What others can the students think of? Try to make your brainstorm open-ended, such that students are encouraged to put any possible example out and then to discuss it. Try to make your list broad so that it includes many different kinds of examples.
Causal Patterns in Density: The Causes of Differences in Density
©2005, President and Fellows of Harvard College 113
Checking In
While generating the list, have students stop and ask themselves some questions about their thinking:
• Am I trying to make connections to my everyday experience?
• Am I coming up with many ideas? Am I being fluid in my thinking?
• Am I coming up with ideas that fit in different categories? Am I being flexible in my thinking?
• Am I using my classmates’ ideas to “piggyback” to new ideas?
• Am I pushing myself to come up with ideas that are different from my classmates?
Include the following challenges, if the students don’t bring them up on their own:
• Can anyone explain how a boat can be thought of as mixed density? (wood or steel and other materials plus air)
• How is ice cream mixed density?
114 ©2005, President and Fellows of Harvard College
Lesson 11 What Does it Mean for Density to Have Multiple Contributing Causes?
Understanding Goals Subject Matter
v One cause of differences in density is the different masses of different atoms. v A second cause of differences in density is the strength and structure of
atomic and molecular bonds. This is most important when thinking about solids and liquids.
v A third cause of differences in density is mixed density, for instance, when gas molecules are interspersed with other molecules, or when something is hollow inside or has “air pockets,” making it a combination of air and the material around the outside.
Causality
v Density has multiple contributing causes. Not every cause is involved in every situation where density is in play.
v You can’t compare objects by using just one of the causes of density alone. It will leave out other important relationships that could contribute to the resulting density. You also can’t assume that every cause contributes to every situation.
Background Information Reasoning About Multiple Possible Causes
People tend to have difficulty reasoning about multiple contributing causes. They tend to make a couple of errors. They often look for one cause and then forget to search further. In some cases, that is enough—there is one cause and it is the only cause. However, it is possible that the one cause that they came up with is sufficient but not necessary for the outcome. This means that other causes can produce the same result. There can be multiple sufficient causes. For instances, there are multiple ways to be nominated for a public office, any one of which is sufficient to get a candidate’s name on a ballot. In addition, one cause can be necessary but not sufficient to explain an outcome. This means another cause is needed to explain what happens. For example, a traffic jam can have multiple contributing causes where if any one single cause was missing, the jam might not result.
People also tend to search only for obvious causes. This can result in missing more subtle or non-obvious causes. In the case of density, looking for obvious causes leads us to miss phenomena that are density-related. This lesson actively engages students in thinking about multiple causes and why it is important to pay attention to them.
Causal Patterns in Density: The Causes of Differences in Density
©2005, President and Fellows of Harvard College 115
Lesson Plan Materials
Ø One of each of the following: steel cylinder, piece of steel wool, piece of Styrofoam, and Soap Bubble picture.
Ø Group Discussion of the Causes of Density sheet Ø Cause #1, and Cause #2, Cause #3 posters Ø Multiple Causes sheet Ø What Causes Differences in Density?: Drawing Models sheet Ø Thinking About Multiple Causes sheet Ø Pitfalls in Reasoning About Density sheet
Prep Step
Ø Review the lesson plan, background information, and understanding goals. Ø Gather materials. Ø Photocopy the sheets: Group Discussion of the Causes of Density (p. 140);
Multiple Causes (p. 141); What Causes Differences in Density?: Drawing Models (p. 144); Thinking About Multiple Causes (p. 145); and Pitfalls in Reasoning About Density (p. 146).
Review, Extend, Apply Step 1: Group Discussion: What Causes Density in Particular Examples?
As a group, discuss each of the following objects/substances in terms of what contributes to their density: 1) a piece of copper; 2) a piece of bread; 3) steam in the air. The sheet, Group Discussion of the Causes of Density (p. 140) is provided in case you want students to draw and think along with the class. For instance, for the copper, because you have a pure, solid metal sample, such as is describe by the first two causes, the mass of the atoms and the structure of the bonds account for the density of the object. But the bread and the steam in the air provide examples of mixed densities, and therefore you must consider Cause #3. Discuss how scientists might picture the various objects inside. Invite the students to contribute to the drawings and to discuss and critique them. Going through the sample substances one at a time, ask students which causes they think contribute to the density of each object. For each substance, ask:
• Do you think the first cause, the mass of the atoms, explains its density? In what way does Cause #1 help or not help to explain the density? How can you illustrate this in their drawing? (If you haven’t already, generate some group conventions for illustrating the concept.)
• Does the second cause, the structure and strength of the bonds, explain its density? In what way does it help explain the density? How can you show
Causal Patterns in Density: The Causes of Differences in Density
116 ©2005, President and Fellows of Harvard College
the bonds? (If you haven’t already, generate some group conventions for illustrating the concept.)
• Does the third cause, mixed density, explain its density? That is, is this a pure substance, or is there more than one substance in the object that you must consider? (Again, consider as a group how you will show it.)
Explore Causality Step 2: What Does it Mean to have Multiple Causes?
Have the students read the sheet Multiple Causes (p. 141). Explain that when there are multiple contributing causes, you need to consider the different possibilities involved and whether each is involved in explaining different cases. The explanation page uses social examples to explain necessary and sufficient multiple causes. Discuss the social examples with the students. Then go over the back of the sheet together and discuss multiple causes and density. Make sure the students understand the examples that are given. Explain why there are quotation marks around the word “density” in reference to the helium atom. The only possible contributor to density that one atom can have is atomic mass.
Review, Extend, Apply Step 3: Drawing Models of Multiple Causes of Density
Pass out the sheet, What Causes Differences in the Density?: Drawing Models (p. 144). Show the students the following examples: 1) a cylinder of steel; 2) a piece of steel wool; 3) a piece of Styrofoam; and; 4) picture of a soap bubble. Have students analyze each example as you did in Step 1 with the copper, bread, and steam. Have them draw a model of each. In each case, they should consider which cause or causes might be involved and illustrate it (or them). For instance, for the steel, the first two causes, the mass of the atoms and the structure of the bonds, both account for the density of the object. But objects #2, #3 and #4 provide examples of mixed densities, and you must consider the third cause as well. Explain to students that they should take their best guess at what causes each object’s density. They won’t know for sure, though there are answers that are better reasoned than others and there are causes that they can rule out in some instances. Remind the students of how some causes might matter in a specific case while others won’t, and remind them of the examples that you showed the
Causal Patterns in Density: The Causes of Differences in Density
©2005, President and Fellows of Harvard College 117
class. You may wish to hand out the sheet, Thinking About Multiple Causes (p. 145) for the students to refer to. After the students have had a chance to analyze each model, discuss the examples together. Help them to see instances where they have not thought about the contributions of one of the causes. Draw students’ attention to different cases where one cause is in play, or two, or even three.
Step 4: Reasoning about Multiple Causes and Density in General
Hand out the sheet, Pitfalls in Reasoning About Density (p. 146) and have students find the reasoning pitfalls in each paragraph. This activity can serve as an informal assessment of students' understanding if it is completed individually instead of in pairs or groups.
118 ©2005, President and Fellows of Harvard College
Lesson 12 Can the Density of Solids, Liquids, and Gases Change?
Understanding Goals Subject Matter
v Density is not static; it can change. v We assign densities (numeric values) to different elements. This can make it
harder to think of density as changeable. The numbers refer to density under a certain set of conditions.
v Changing the temperature (and pressure) can change the density of a substance.
v When the temperature is increased molecules in solids, liquids, and gases move faster.
v Solids and liquids expand a little when heated. Gases expand a lot when heated.
Causality
v We forget to think of “steady states” as caused. Realizing that density is dynamic can help students get beyond the idea that density “just is,” and to help them to think about why it is what it is.
v Recognizing that density is dynamic helps students grasp the role that it plays in many complex systems, such as weather, ocean patterns, and movement of pollutants in the environment.
Background Information Density as a Property of Material Kind
Earlier, we said that density was a property of material kind. A property is a characteristic used to describe a substance or material. A property of a material can’t be changed by physical changes such as cutting it. This is true for density. It doesn’t matter what size the piece of the material is, it still has the same density. However, this does not mean that density always stays the same. Density can change when conditions of temperature and pressure change. What Causes Changes in Density?
One way that density can change has to do with kinetic energy—the vibration or movement of the molecules. In a solid, the movement of the atoms and/or molecules is described as ‘vibration’ because they remain in the same position relative to the
Causal Patterns in Density: The Causes of Differences in Density
©2005, President and Fellows of Harvard College 119
other atoms and molecules. The vibration of structures results in expansion. In a liquid atoms and/or molecules move around each other, changing their relative positions but can be described as ‘touching’ each other at all times. The cause of the expansion has to do with vibrations in the bonds. In a gas, atoms and/or molecules move independently of one another. Their only contact is when they happen to collide as they move. They spread out so that other gases are in between them (Cause #3). Changes in density are caused by: 1) changes in temperature, and 2) changes in pressure. This lesson includes a demonstration that shows a brass ball that is able to pass through a brass ring. The ball is heated on a hot plate for a few minutes, after which the hot ball cannot pass through the ring. The mass of the heated ball is compared to the mass of the unheated ball and they are shown to be the same. Density as a Numeric Value
Students are often taught numeric values for density. They may be taught these in lieu of developing a deep understanding of density and the inherent relationship between mass and volume. Some students may miss the subtle point that the numeric values are assigned under standard conditions of temperature and pressure. Not understanding the causes of density and relying on simplified models of “material kind” can create an apparent contradiction--density is a property of material kind and therefore characterized by a steady state model--while at the same time density is potentially a dynamic feature of that same material when certain conditions such as temperature and/or pressure change. Not viewing density as dynamic supports a static model that contributes to a range of difficulties for students later. It makes it difficult to understand weather patterns, ocean currents, the make-up of our atmosphere, and other complex scientific phenomena.
Causal Patterns in Density: The Causes of Differences in Density
120 ©2005, President and Fellows of Harvard College
Lesson Plan Materials
Ø A brass ball and brass ring with heat resistant handles Ø Heat source (such as a hot plate) for the demonstration Ø Student white boards Ø Model of 2 balls and a spring Ø Student journals Ø Bowl of marbles Ø Glass filled with water Ø Cause #1, Cause #2, and Cause #3 posters Ø How do Molecules Move? sheet Ø Reflecting on What You've Learned about Changes in Density sheet
Prep Step
Ø Review the lesson plan, background information, and understanding goals. Ø Gather materials Ø Photocopy the sheets: How do Molecules Move? (p. 147) and Reflecting on
What You've Learned About Changes in Density (p. 148) Analyze Thinking Step 1: How Do Molecules Move?
1) Have the students read the sheet How Do Molecules Move? (p. 147). This short paper is written by a scientist who specializes in chemistry. It explains the differences between solids, liquids and gases at a microscopic level.
2) Ask the following questions: • What are the major points of the article? That is, what does the scientist
want you to understand? • What makes sense about the article? Give specific details. • What does not make sense about the article? Give specific details.
Step 2: Can Density Change?
Pose the question, “Can density change?” Accept whatever answers students offer, as long as they back them up with reasoning and evidence from examples that they can think of.
RECAST Thinking Step 3: Discrepant Event: Ball and Ring Demonstration
Show the students the ball and ring. Calculate the mass of the ball (including the handle). Pass the ball through the ring at room temperature to show the students
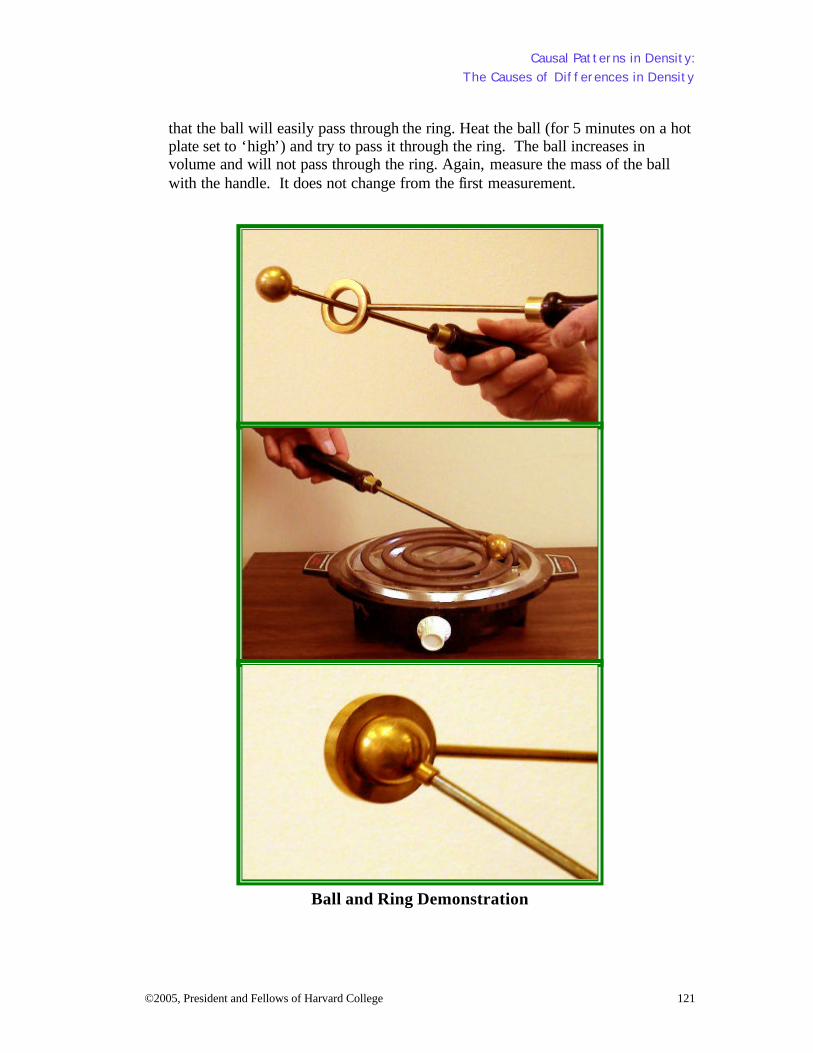
Causal Patterns in Density: The Causes of Differences in Density
©2005, President and Fellows of Harvard College 121
that the ball will easily pass through the ring. Heat the ball (for 5 minutes on a hot plate set to ‘high’) and try to pass it through the ring. The ball increases in volume and will not pass through the ring. Again, measure the mass of the ball with the handle. It does not change from the first measurement.
Ball and Ring Demonstration
Causal Patterns in Density: The Causes of Differences in Density
122 ©2005, President and Fellows of Harvard College
Have the students discuss what they just witnessed. What happened when you heated the ball? Why won’t it go through the ring now? What do they think is going on? Ask the following questions:
• When does the density of an object change?
• Why does density of an object change?
• How does the density of an object change?
• Did the brass ball get more dense or less dense when we heated it?
• What could you do to make an object less dense?
• What could you do to make an object more dense?
• What would it look like if it were magnified thousands of times?
Step 4: Drawing Models of the Ball and Ring Demonstration
Have students draw models on their white boards to explain what happened and why they think it happened. Circulate while students are working. Choose three or four interesting explanations and have those students explain them to the class. In choosing which ones to present, try to choose examples where students have tried to reason from what they know about the nature of matter. It would be good to include a few where the student has an answer that does not match the scientifically accepted response but has done some interesting thinking.
Explore Causality Step 5: Analyzing the Ball and Ring Demonstration in Terms of the Three Causes
Make sure that Cause #1, Cause #2 and Cause #3 posters are up for reference. Remind the students to think about the causes of density and draw their attention back to the posters. Guide students to a scientifically accepted model of what is happening in the ball and ring relationship and contrast it to the models that they came up with. Explain, “If the density is changing, then the cause of density must be affected in some way. Is it possible that any of these things could change?”
• Number of protons and neutrons–i.e. the mass of the atoms?
• The strength or structure of bonds?
• Whether the density is mixed or not? (and in the case of air, how spread out the molecules are?)
Have students discuss what they think could be going on. What do they think changes when you heat the ball and ring?
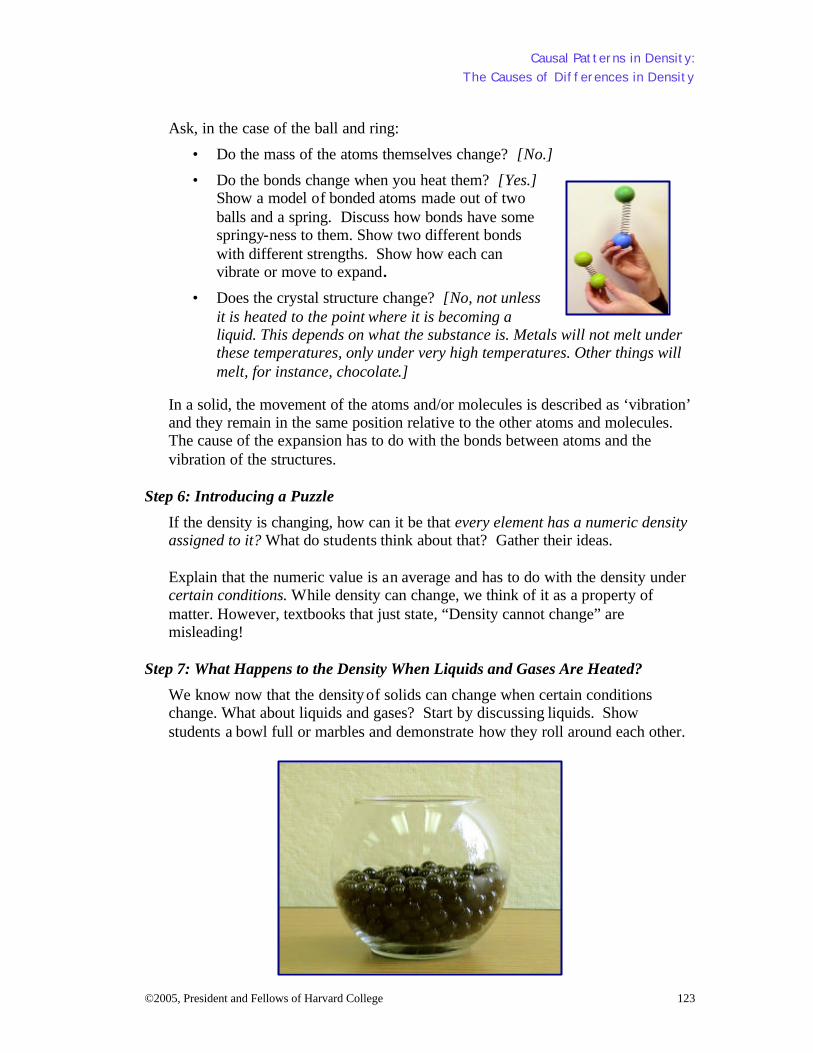
Causal Patterns in Density: The Causes of Differences in Density
©2005, President and Fellows of Harvard College 123
Ask, in the case of the ball and ring:
• Do the mass of the atoms themselves change? [No.]
• Do the bonds change when you heat them? [Yes.] Show a model of bonded atoms made out of two balls and a spring. Discuss how bonds have some springy-ness to them. Show two different bonds with different strengths. Show how each can vibrate or move to expand.
• Does the crystal structure change? [No, not unless it is heated to the point where it is becoming a liquid. This depends on what the substance is. Metals will not melt under these temperatures, only under very high temperatures. Other things will melt, for instance, chocolate.]
In a solid, the movement of the atoms and/or molecules is described as ‘vibration’ and they remain in the same position relative to the other atoms and molecules. The cause of the expansion has to do with the bonds between atoms and the vibration of the structures.
Step 6: Introducing a Puzzle
If the density is changing, how can it be that every element has a numeric density assigned to it? What do students think about that? Gather their ideas. Explain that the numeric value is an average and has to do with the density under certain conditions. While density can change, we think of it as a property of matter. However, textbooks that just state, “Density cannot change” are misleading!
Step 7: What Happens to the Density When Liquids and Gases Are Heated?
We know now that the density of solids can change when certain conditions change. What about liquids and gases? Start by discussing liquids. Show students a bowl full or marbles and demonstrate how they roll around each other.
Causal Patterns in Density: The Causes of Differences in Density
124 ©2005, President and Fellows of Harvard College
Ask the students to visualize molecules heating up and bouncing off of each other. Ask the students to imagine that the marbles are bouncing off of each other. Show students a glass full of water filled to the top and sealed. What do they think would happen to the water if we heated it? [It would expand.]
Explain that as the liquid molecules bounce off of each other, some may eventually change phase and become a gas. Have the students think about a pot of water as it starts to boil. What is going on? The molecules are moving or bouncing around so much that some of the molecular bonds between them break and they become gas molecules. On the board, draw a diagram of water molecules as a gas. What is in between them? [Air. Air is composed of a mixture of gases, mainly nitrogen, oxygen and carbon dioxide. “Molecules of air” or “air molecules” refer to any of the different k inds of molecules found in air.] Water expands when heated, but it has a specific density. What is going on? Discuss what the students think is happening. Remind them tha t even though we assign numbers to densities (for liquids as well as solids), they still can change.
Step 8: Drawing Models of What Happens When Liquids and Gases Are Heated
Have students draw models on their white boards of a fluid (liquid or a gas) expanding. They should show the fluid two times before it is heated and after it is heated. Circulate while students are working. Choose three or four interesting models and have those students explain them to the class. In choosing which ones to present, try to choose examples where students have tried to reason from what they know about the nature of matter. It would be good to include a few where the student has an answer that does not match the scientifically accepted response but has done some interesting thinking.
Note to Teacher: Students often bring up the issue of ice expanding as it freezes. Explain that water/ice is not a good example to reason from because it doesn’t follow all of the same rules as other liquids. When water freezes or crystallizes, it takes on a structure that incorporates little pockets of empty space, like a honeycomb. When the structure melts, the little pockets collapse and the liquid occupies less volume. The little pockets are full of vacuum, not air (this is a common misconception) although most ice does sometimes trap little bubbles of air when it freezes. Water is not confusing as an example to reason from when thinking about what happens during the transition from liquid to gas. Encourage students to focus on other liquids that they know about. Most things contract when they get colder. Use wax or chocolate as examples.
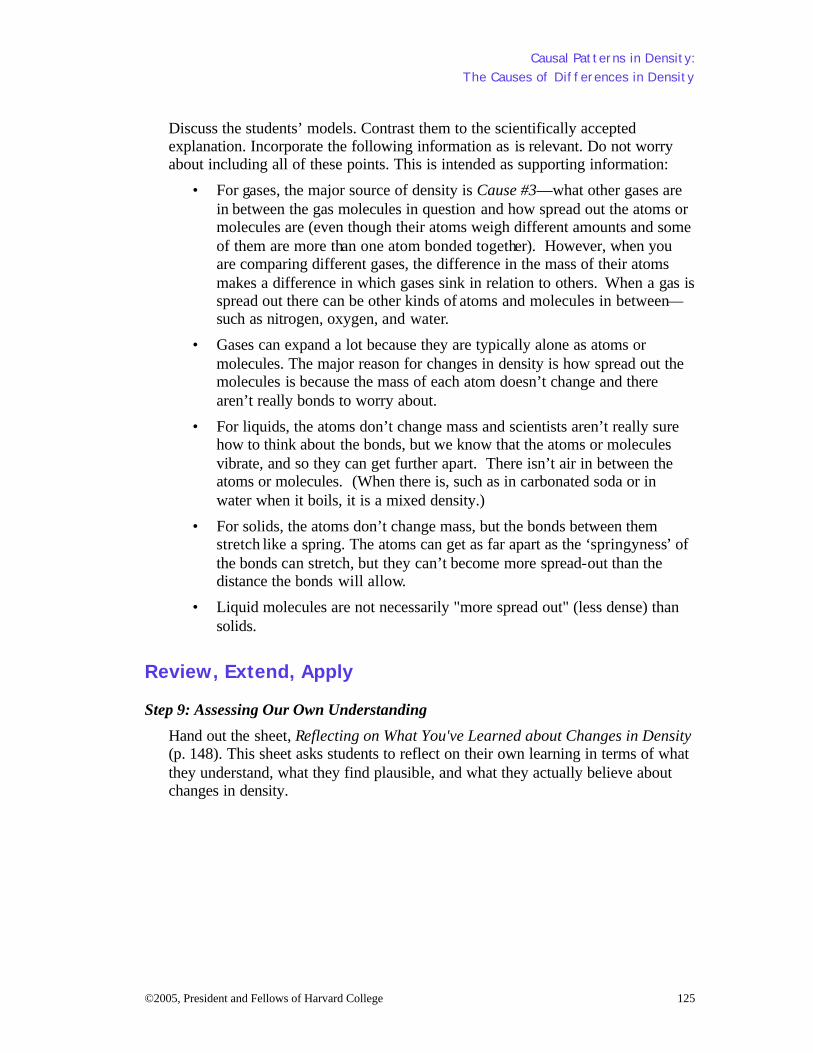
Causal Patterns in Density: The Causes of Differences in Density
©2005, President and Fellows of Harvard College 125
Discuss the students’ models. Contrast them to the scientifically accepted explanation. Incorporate the following information as is relevant. Do not worry about including all of these points. This is intended as supporting information:
• For gases, the major source of density is Cause #3—what other gases are in between the gas molecules in question and how spread out the atoms or molecules are (even though their atoms weigh different amounts and some of them are more than one atom bonded together). However, when you are comparing different gases, the difference in the mass of their atoms makes a difference in which gases sink in relation to others. When a gas is spread out there can be other kinds of atoms and molecules in between—such as nitrogen, oxygen, and water.
• Gases can expand a lot because they are typically alone as atoms or molecules. The major reason for changes in density is how spread out the molecules is because the mass of each atom doesn’t change and there aren’t really bonds to worry about.
• For liquids, the atoms don’t change mass and scientists aren’t really sure how to think about the bonds, but we know that the atoms or molecules vibrate, and so they can get further apart. There isn’t air in between the atoms or molecules. (When there is, such as in carbonated soda or in water when it boils, it is a mixed density.)
• For solids, the atoms don’t change mass, but the bonds between them stretch like a spring. The atoms can get as far apart as the ‘springyness’ of the bonds can stretch, but they can’t become more spread-out than the distance the bonds will allow.
• Liquid molecules are not necessarily "more spread out" (less dense) than solids.
Review, Extend, Apply Step 9: Assessing Our Own Understanding
Hand out the sheet, Reflecting on What You've Learned about Changes in Density (p. 148). This sheet asks students to reflect on their own learning in terms of what they understand, what they find plausible, and what they actually believe about changes in density.
Causal Patterns in Density: The Causes of Differences in Density
126 ©2005, President and Fellows of Harvard College
Resources for Section 3 Lesson 8
Ø Cause #1 poster Ø Illustration of Aluminum Atom Ø Some Molecules that Make up Air Ø Thinking about Atomic Mass and Density sheet Ø The Role of Atomic Mass in Density sheet Ø Densities of Common Substances under Standard Conditions chart
Lesson 9
Ø Cause # 2 poster Ø Water Molecule illustration Ø Molecular Diagram of Graphite Ø Molecular Diagram of Diamond Ø How and Why article by David Ropeik Ø The Densest Element sheet
Lesson 10
Ø Cause #3 poster Lesson 11
Ø Group Discussion of the Causes of Density sheet Ø Cause #1, Cause #2, and Cause #3 posters Ø Multiple Causes sheet Ø Soap Bubble picture Ø What Causes Differences in Density?: Drawing Models sheet Ø Thinking About Multiple Causes sheet Ø Pitfalls in Reasoning About Density sheet
Lesson 12
Ø How do Molecules Move? sheet Ø Reflecting on What You've Learned about Changes in Density sheet Ø Cause #1, Cause #2, and Cause #3 posters
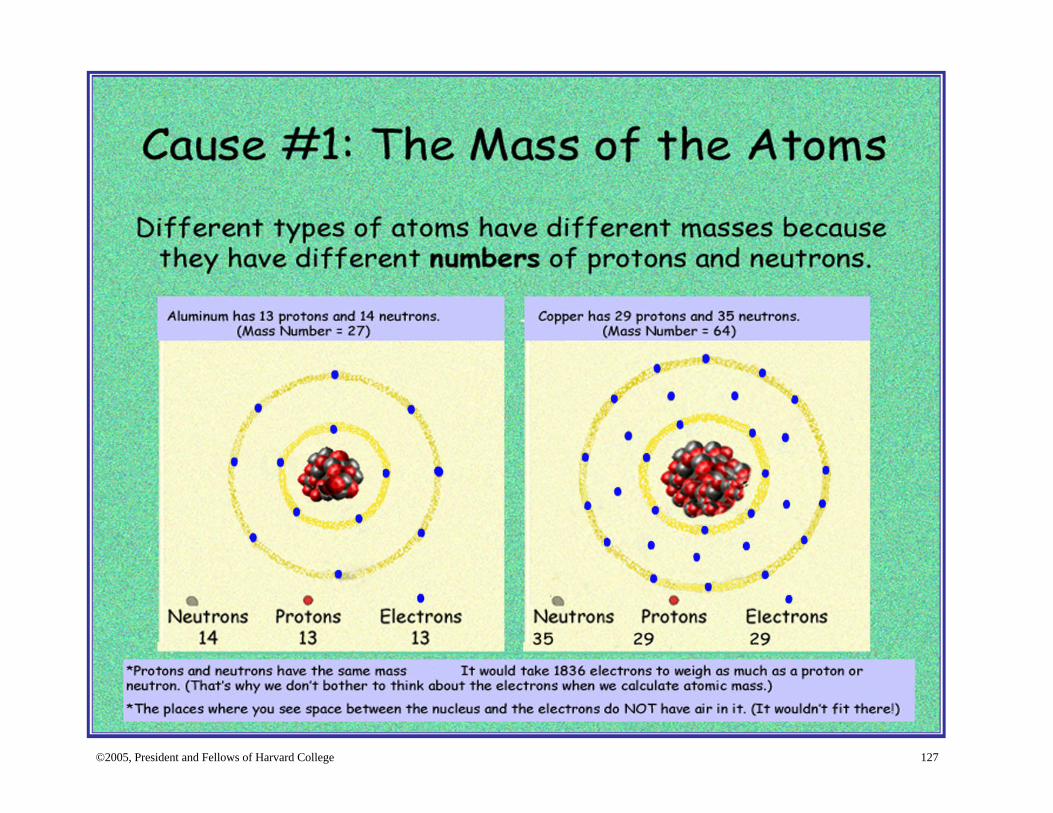
©2005, President and Fellows of Harvard College 127
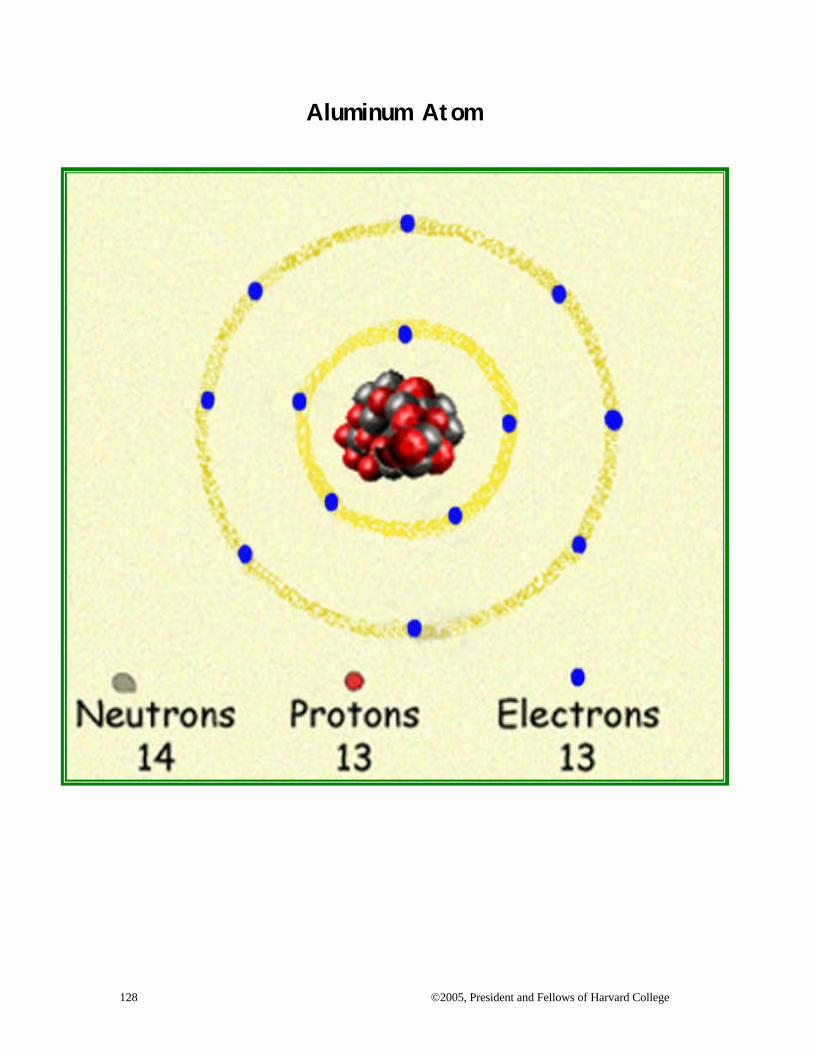
128 ©2005, President and Fellows of Harvard College
Aluminum Atom
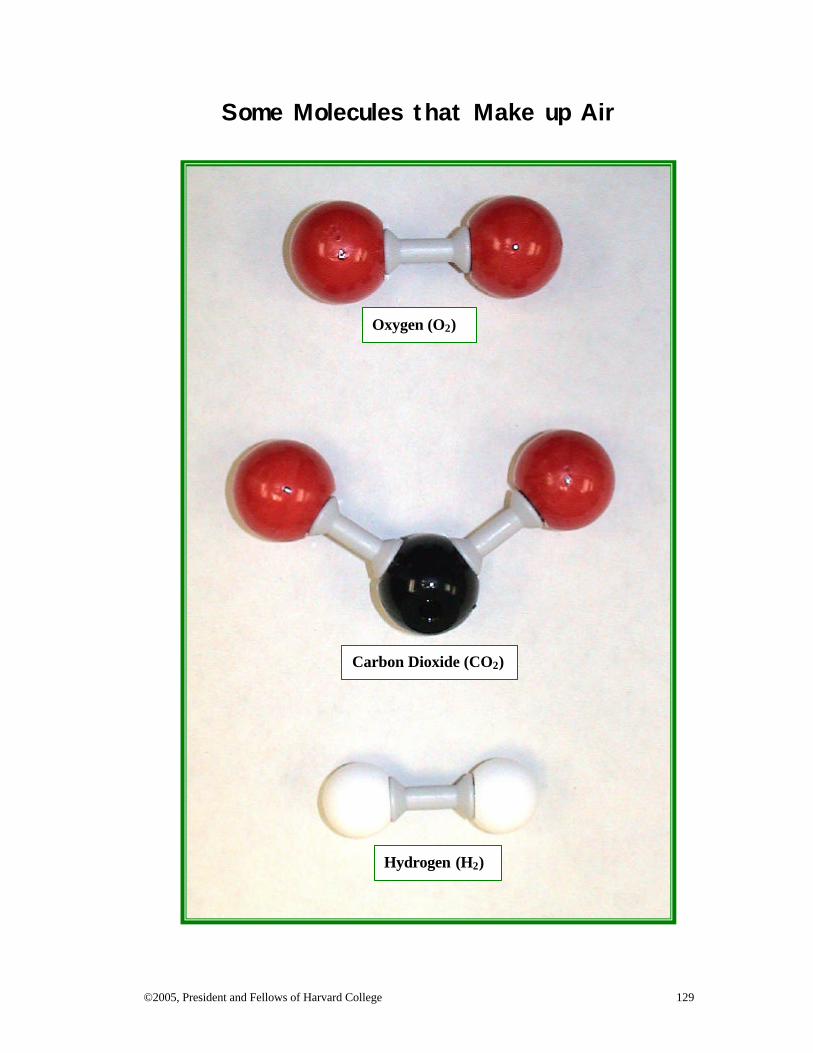
©2005, President and Fellows of Harvard College 129
Some Molecules that Make up Air
Carbon Dioxide (CO2)
Oxygen (O2)
Hydrogen (H2)
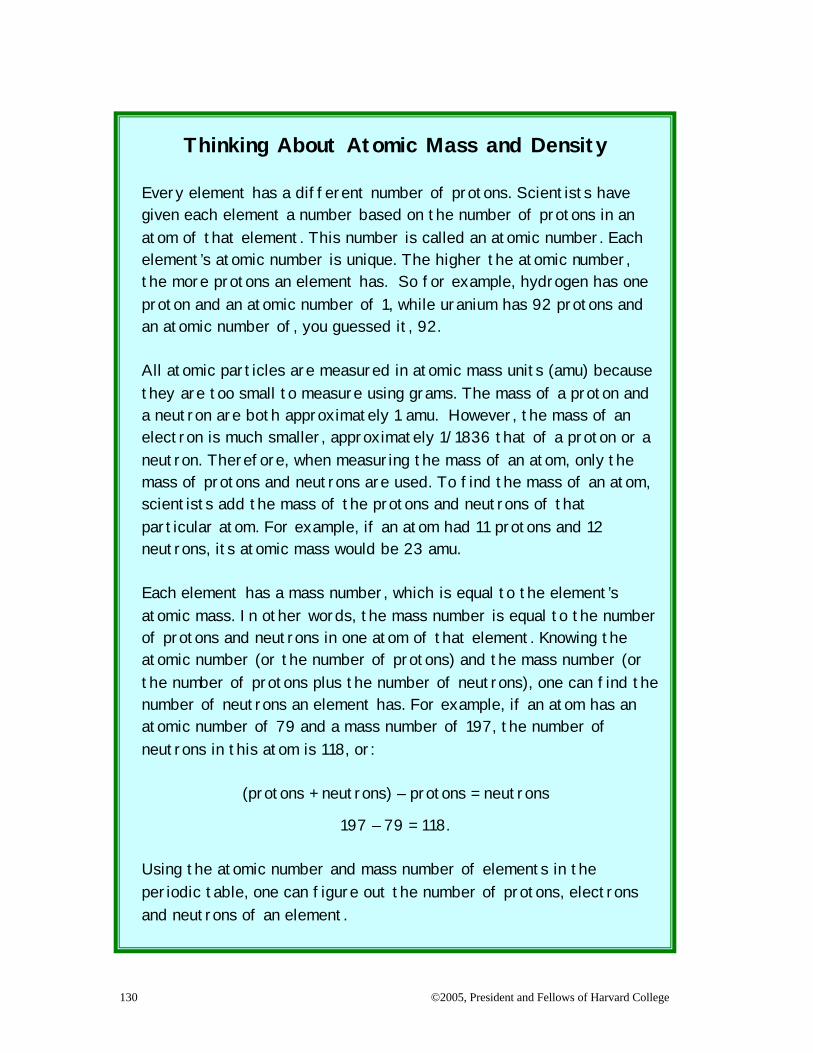
130 ©2005, President and Fellows of Harvard College
Thinking About Atomic Mass and Density
Every element has a different number of protons. Scientists have given each element a number based on the number of protons in an atom of that element. This number is called an atomic number. Each element’s atomic number is unique. The higher the atomic number, the more protons an element has. So for example, hydrogen has one proton and an atomic number of 1, while uranium has 92 protons and an atomic number of, you guessed it, 92.
All atomic particles are measured in atomic mass units (amu) because they are too small to measure using grams. The mass of a proton and a neutron are both approximately 1 amu. However, the mass of an electron is much smaller, approximately 1/1836 that of a proton or a neutron. Therefore, when measuring the mass of an atom, only the mass of protons and neutrons are used. To find the mass of an atom, scientists add the mass of the protons and neutrons of that particular atom. For example, if an atom had 11 protons and 12 neutrons, its atomic mass would be 23 amu.
Each element has a mass number, which is equal to the element’s atomic mass. In other words, the mass number is equal to the number of protons and neutrons in one atom of that element. Knowing the atomic number (or the number of protons) and the mass number (or the number of protons plus the number of neutrons), one can find the number of neutrons an element has. For example, if an atom has an atomic number of 79 and a mass number of 197, the number of neutrons in this atom is 118, or:
(protons + neutrons) – protons = neutrons
197 – 79 = 118.
Using the atomic number and mass number of elements in the periodic table, one can figure out the number of protons, electrons and neutrons of an element.
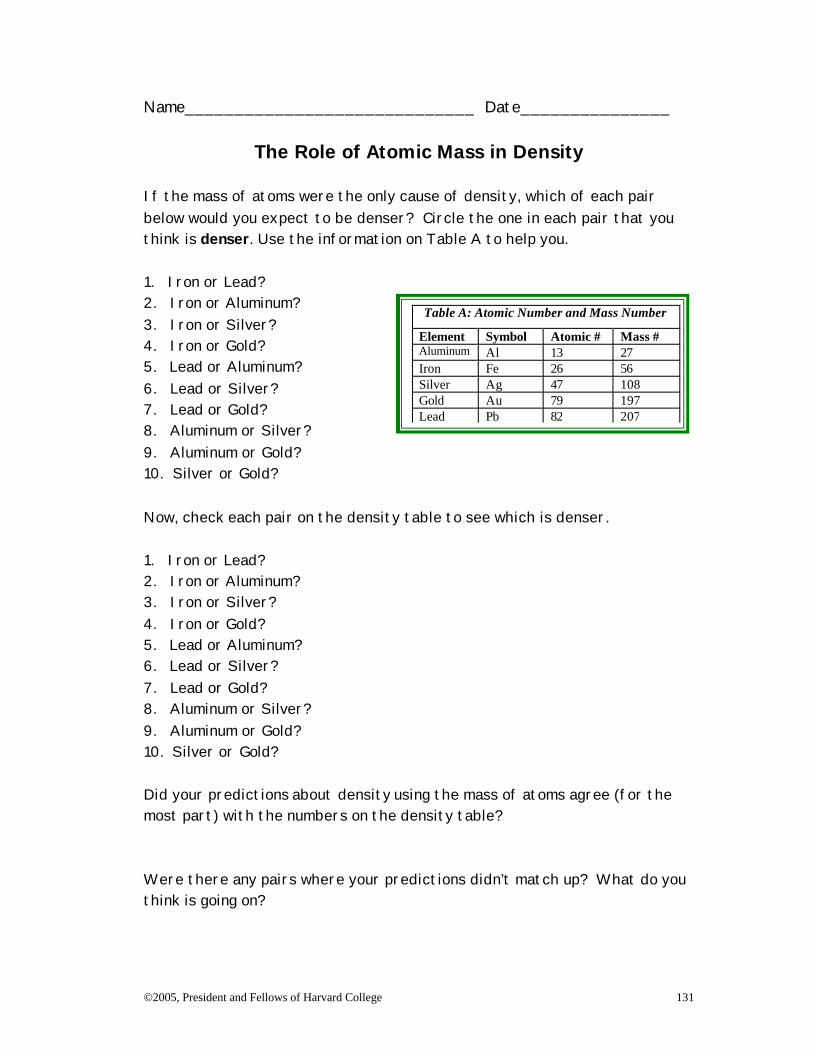
©2005, President and Fellows of Harvard College 131
Name_____________________________ Date_______________
The Role of Atomic Mass in Density If the mass of atoms were the only cause of density, which of each pair below would you expect to be denser? Circle the one in each pair that you think is denser. Use the information on Table A to help you. 1. Iron or Lead? 2. Iron or Aluminum? 3. Iron or Silver? 4. Iron or Gold? 5. Lead or Aluminum? 6. Lead or Silver? 7. Lead or Gold? 8. Aluminum or Silver? 9. Aluminum or Gold? 10. Silver or Gold? Now, check each pair on the density table to see which is denser. 1. Iron or Lead? 2. Iron or Aluminum? 3. Iron or Silver? 4. Iron or Gold? 5. Lead or Aluminum? 6. Lead or Silver? 7. Lead or Gold? 8. Aluminum or Silver? 9. Aluminum or Gold? 10. Silver or Gold? Did your predictions about density using the mass of atoms agree (for the most part) with the numbers on the density table? Were there any pairs where your predictions didn’t match up? What do you think is going on?
Table A: Atomic Number and Mass Number
Element Symbol Atomic # Mass # Aluminum Al 13 27 Iron Fe 26 56 Silver Ag 47 108 Gold Au 79 197 Lead Pb 82 207
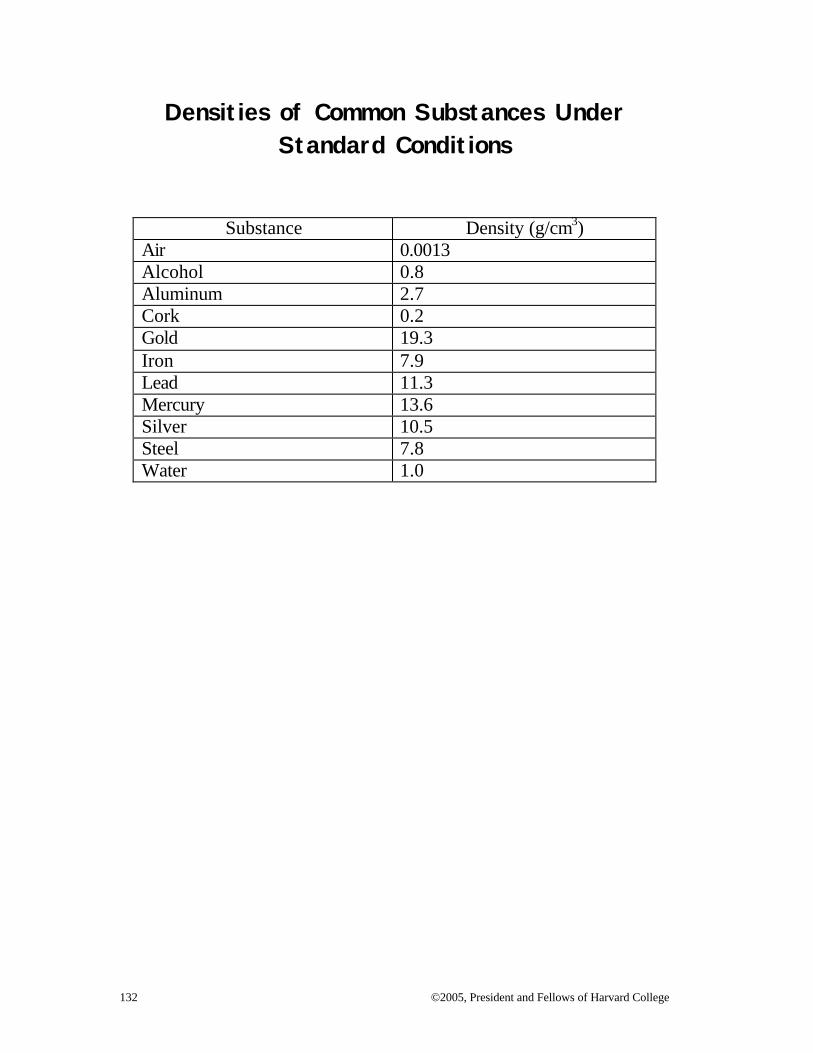
132 ©2005, President and Fellows of Harvard College
Densities of Common Substances Under Standard Conditions
Substance Density (g/cm3) Air 0.0013 Alcohol 0.8 Aluminum 2.7 Cork 0.2 Gold 19.3 Iron 7.9 Lead 11.3 Mercury 13.6 Silver 10.5 Steel 7.8 Water 1.0
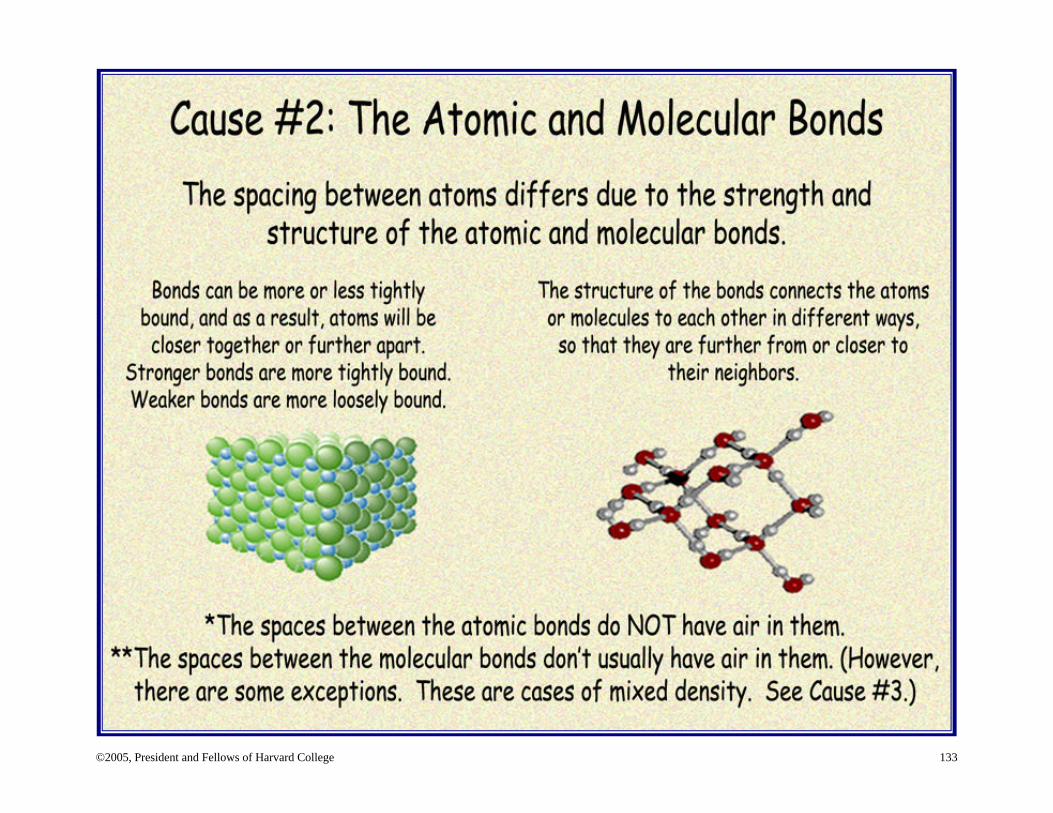
©2005, President and Fellows of Harvard College 133
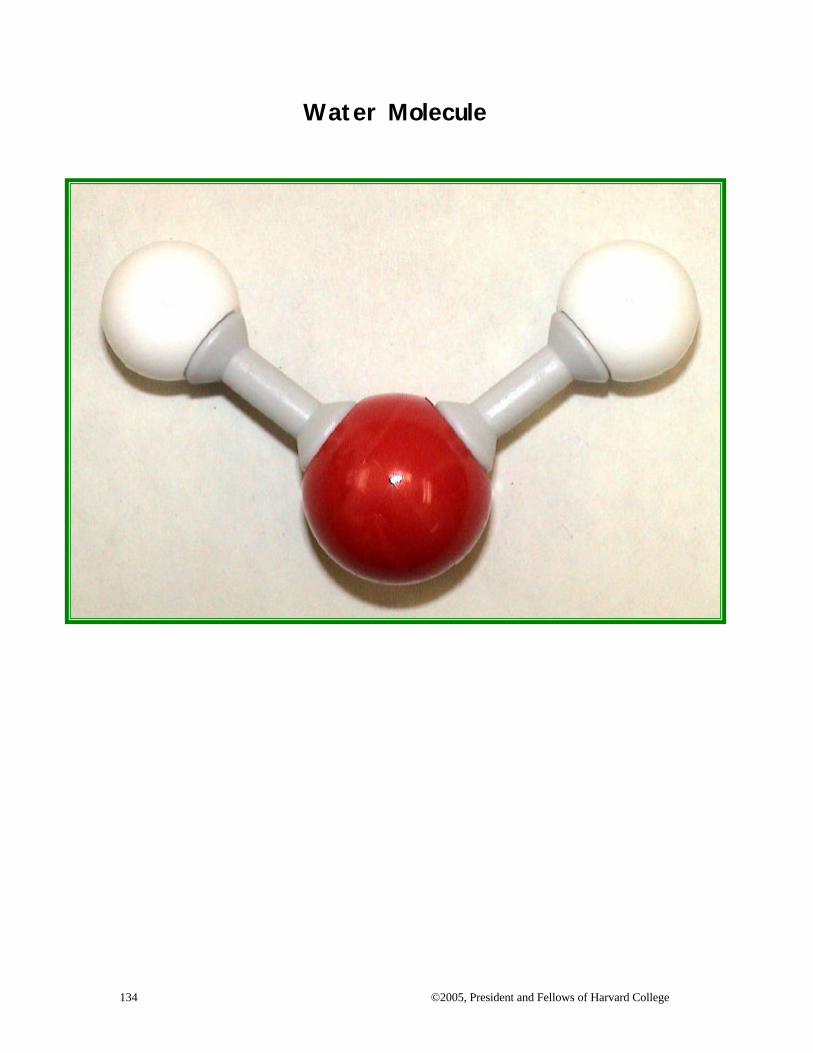
134 ©2005, President and Fellows of Harvard College
Water Molecule
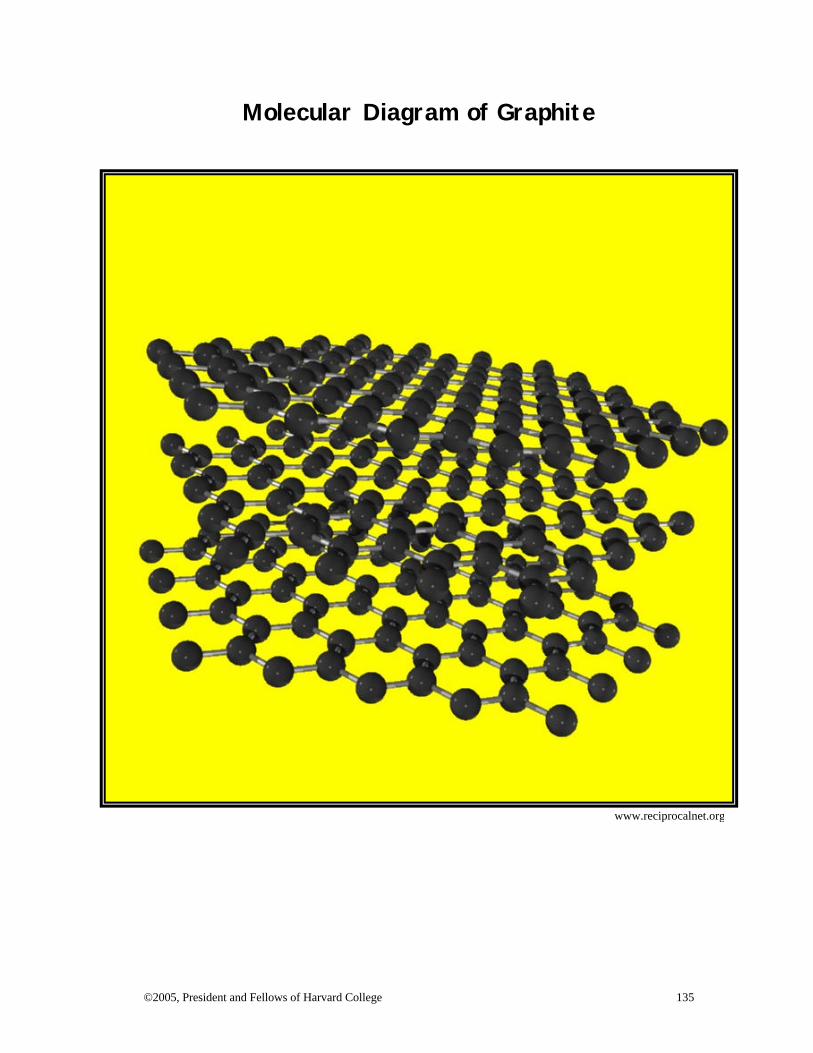
©2005, President and Fellows of Harvard College 135
Molecular Diagram of Graphite
www.reciprocalnet.org
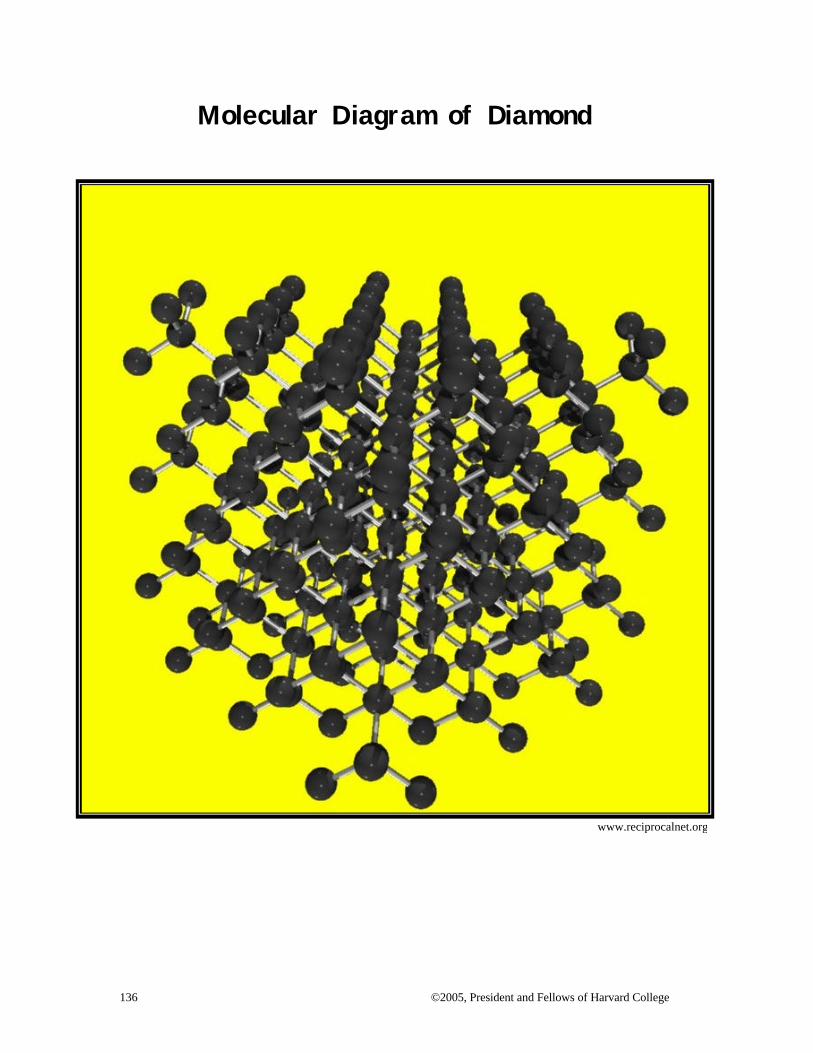
136 ©2005, President and Fellows of Harvard College
Molecular Diagram of Diamond
www.reciprocalnet.org
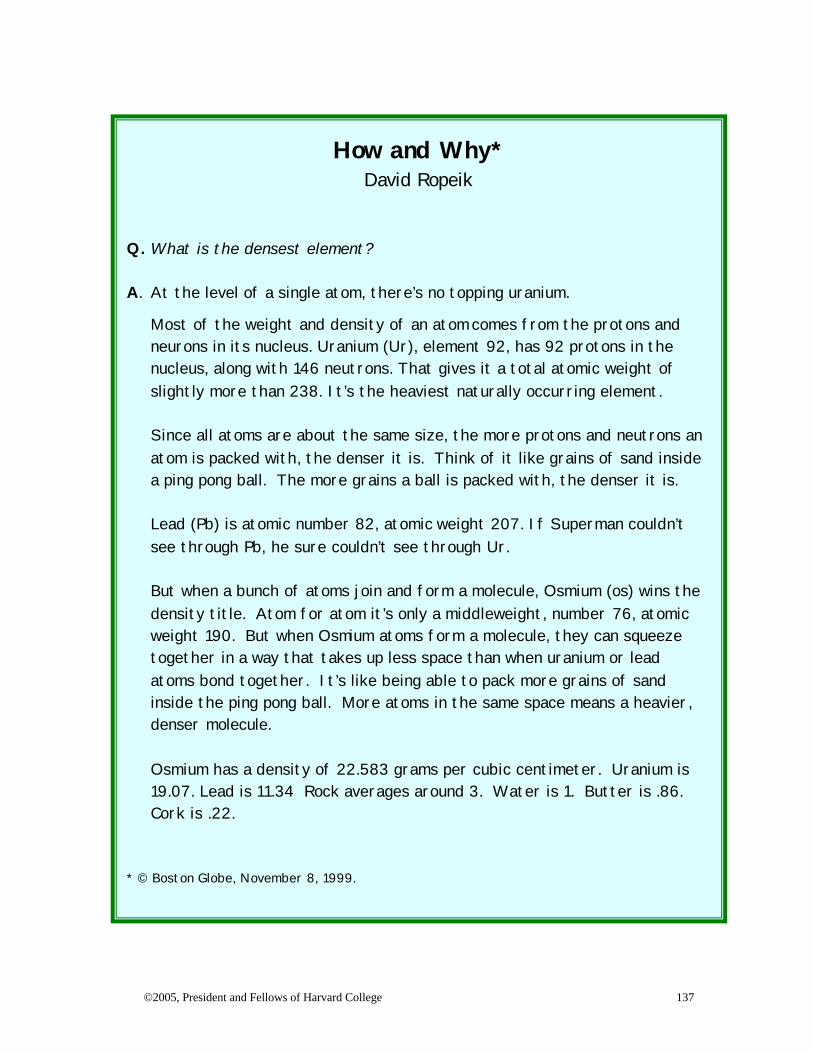
©2005, President and Fellows of Harvard College 137
How and Why* David Ropeik
Q. What is the densest element? A. At the level of a single atom, there’s no topping uranium.
Most of the weight and density of an atom comes from the protons and neurons in its nucleus. Uranium (Ur), element 92, has 92 protons in the nucleus, along with 146 neutrons. That gives it a total atomic weight of slightly more than 238. It’s the heaviest naturally occurring element.
Since all atoms are about the same size, the more protons and neutrons an atom is packed with, the denser it is. Think of it like grains of sand inside a ping pong ball. The more grains a ball is packed with, the denser it is.
Lead (Pb) is atomic number 82, atomic weight 207. If Superman couldn’t see through Pb, he sure couldn’t see through Ur.
But when a bunch of atoms join and form a molecule, Osmium (os) wins the density title. Atom for atom it’s only a middleweight, number 76, atomic weight 190. But when Osmium atoms form a molecule, they can squeeze together in a way that takes up less space than when uranium or lead atoms bond together. It’s like being able to pack more grains of sand inside the ping pong ball. More atoms in the same space means a heavier, denser molecule.
Osmium has a density of 22.583 grams per cubic centimeter. Uranium is 19.07. Lead is 11.34 Rock averages around 3. Water is 1. Butter is .86. Cork is .22.
* © Boston Globe, November 8, 1999.
138 ©2005, President and Fellows of Harvard College
Name_____________________________ Date________________
What Is The Densest Element? A reader asked David Ropeik, “What is the densest element?” Read his response and think about what it means in relation to what you have been learning about density. 1. List all the causes of density you can find in the answer he gave the reader. 2. List all the things in his answer that agree with what you have been
learning about the causes of density at a microscopic or zoomed-in level and explain each one. (There should be at least 3 things)
3. List all the things that don’t make sense in his response and explain why
they don’t make sense.
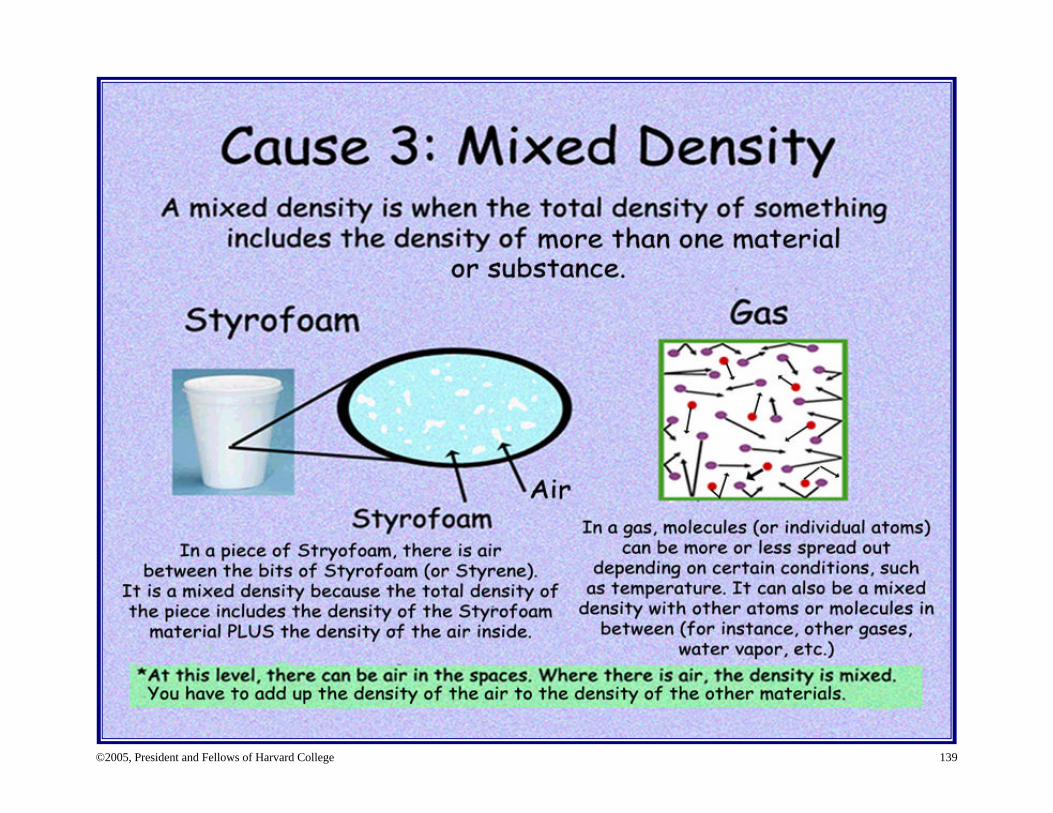
©2005, President and Fellows of Harvard College 139
140 ©2005, President and Fellows of Harvard College
Name_________________________ Date____________
Group Discussion of the Causes of Density
What causes different densities of each of the following things? Use this sheet to help you think about each example as the class discusses them. Think through the possibilities by drawing models. Example 1: A piece of copper Example 2: A piece of bread Example 3: Steam in the air
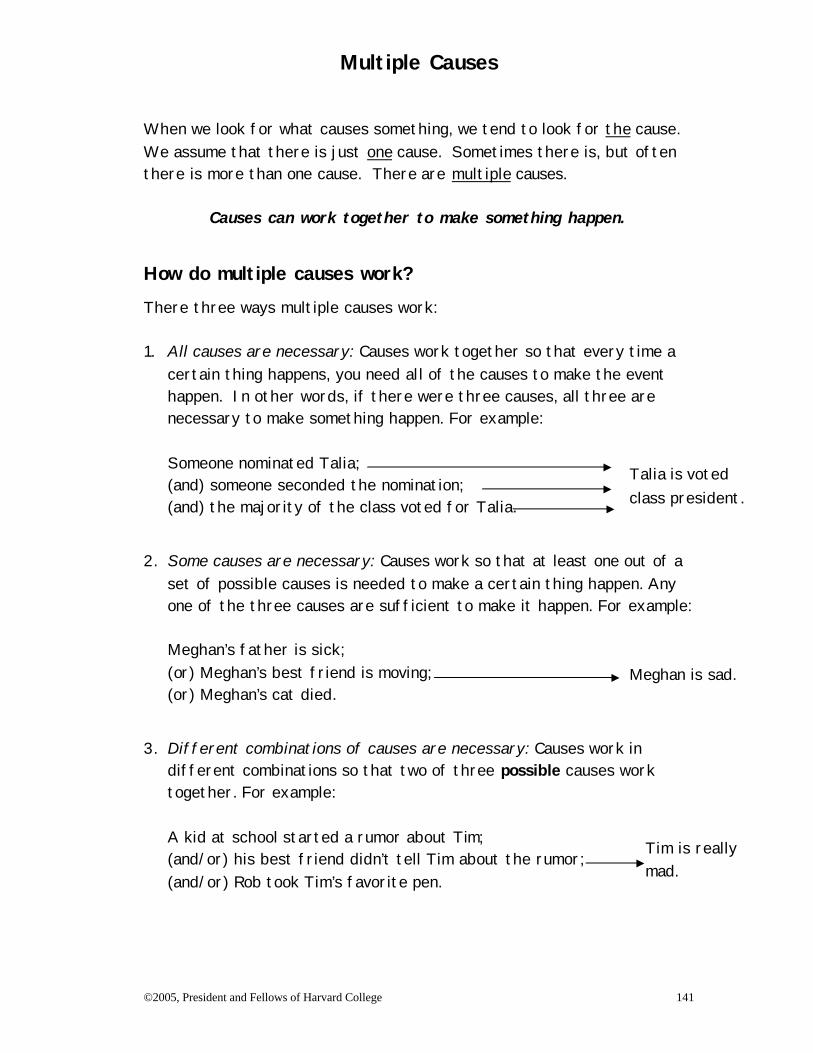
Multiple Causes
©2005, President and Fellows of Harvard College 141
When we look for what causes something, we tend to look for the cause. We assume that there is just one cause. Sometimes there is, but often there is more than one cause. There are multiple causes.
Causes can work together to make something happen.
How do multiple causes work?
There three ways multiple causes work: 1. All causes are necessary: Causes work together so that every time a
certain thing happens, you need all of the causes to make the event happen. In other words, if there were three causes, all three are necessary to make something happen. For example:
Someone nominated Talia; (and) someone seconded the nomination; (and) the majority of the class voted for Talia.
2. Some causes are necessary: Causes work so that at least one out of a set of possible causes is needed to make a certain thing happen. Any one of the three causes are sufficient to make it happen. For example:
Meghan’s father is sick; (or) Meghan’s best friend is moving; (or) Meghan’s cat died.
3. Different combinations of causes are necessary: Causes work in different combinations so that two of three possible causes work together. For example:
A kid at school started a rumor about Tim; (and/or) his best friend didn’t tell Tim about the rumor; (and/or) Rob took Tim’s favorite pen.
Meghan is sad.
Talia is voted class president.
Tim is really mad.
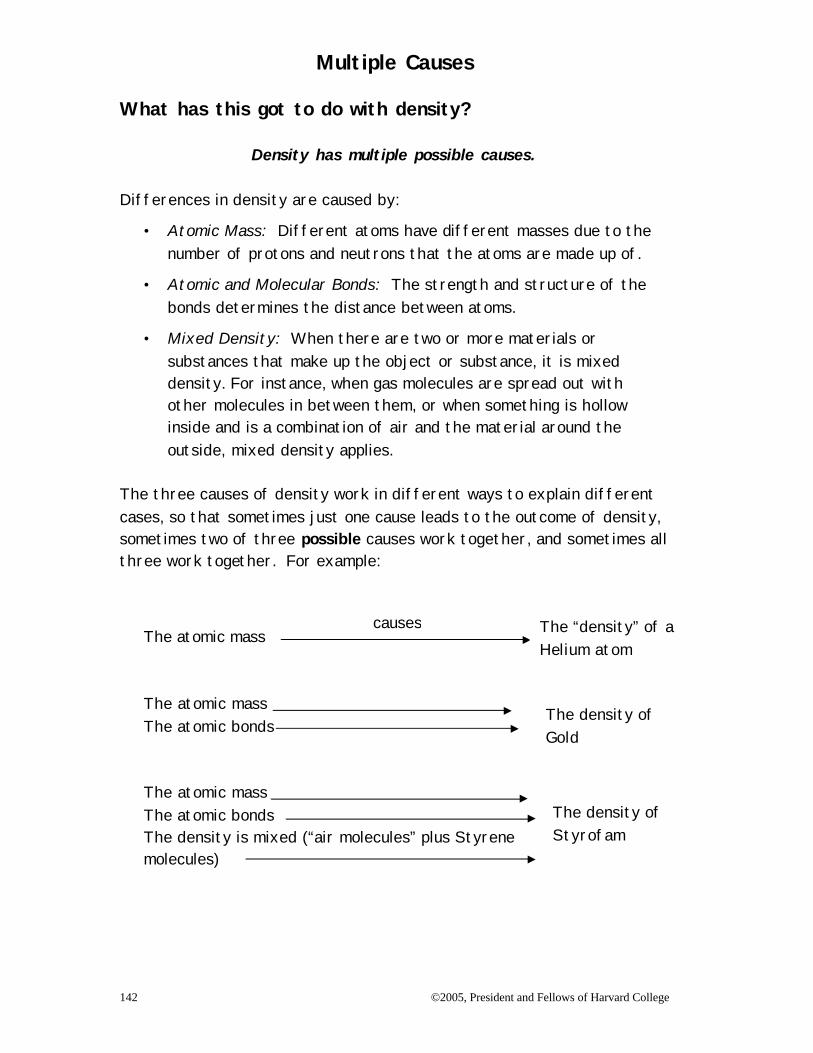
Multiple Causes
142 ©2005, President and Fellows of Harvard College
What has this got to do with density?
Density has multiple possible causes. Differences in density are caused by:
• Atomic Mass: Different atoms have different masses due to the number of protons and neutrons that the atoms are made up of.
• Atomic and Molecular Bonds: The strength and structure of the bonds determines the distance between atoms.
• Mixed Density: When there are two or more materials or substances that make up the object or substance, it is mixed density. For instance, when gas molecules are spread out with other molecules in between them, or when something is hollow inside and is a combination of air and the material around the outside, mixed density applies.
The three causes of density work in different ways to explain different cases, so that sometimes just one cause leads to the outcome of density, sometimes two of three possible causes work together, and sometimes all three work together. For example:
The atomic mass
The atomic mass The atomic bonds
The atomic mass The atomic bonds The density is mixed (“air molecules” plus Styrene molecules)
The “density” of a Helium atom
The density of Gold
The density of Styrofam
causes
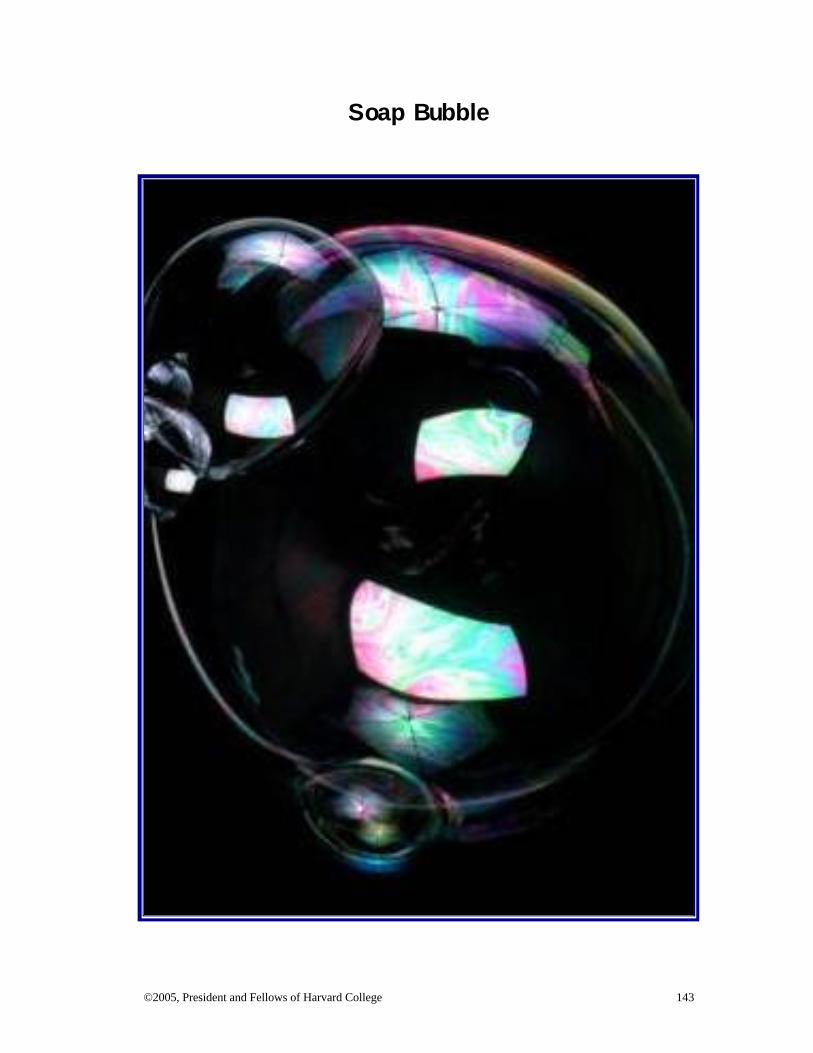
©2005, President and Fellows of Harvard College 143
Soap Bubble
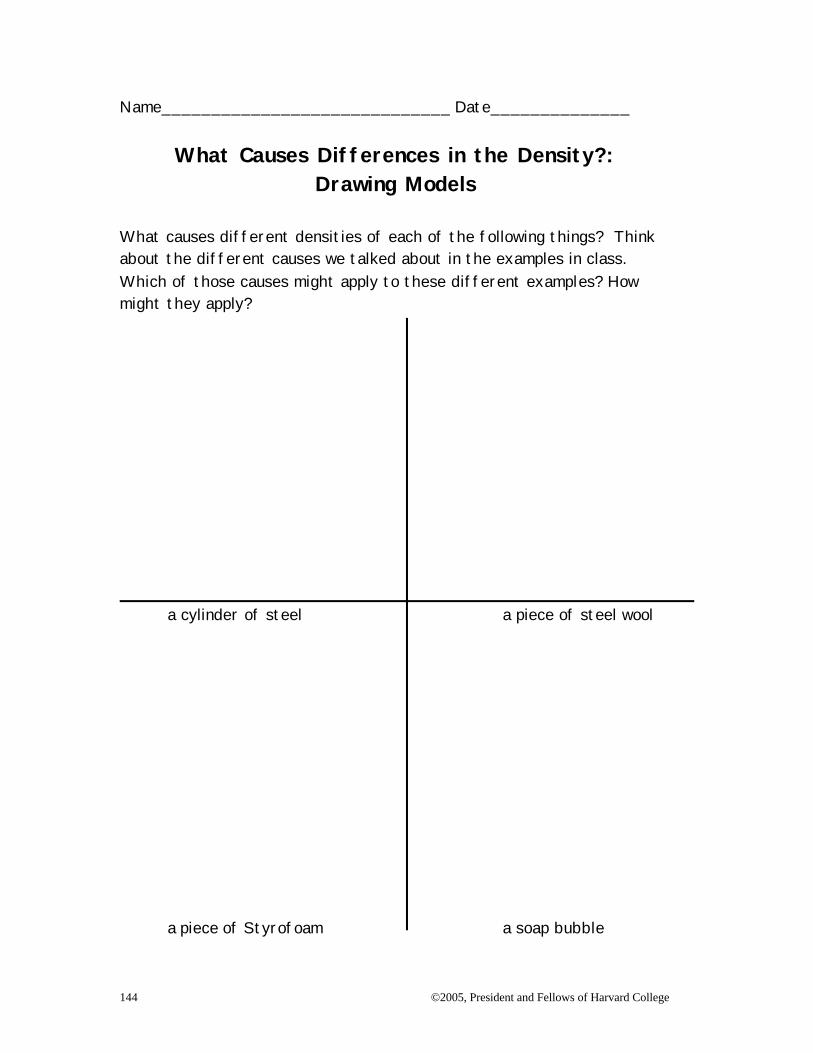
144 ©2005, President and Fellows of Harvard College
Name_____________________________ Date______________
What Causes Differences in the Density?: Drawing Models
What causes different densities of each of the following things? Think about the different causes we talked about in the examples in class. Which of those causes might apply to these different examples? How might they apply? a cylinder of steel a piece of steel wool
a piece of Styrofoam a soap bubble
©2005, President and Fellows of Harvard College 145
Thinking About Multiple Causes Here are some questions to ask to help you think about possible causes that may contribute to an outcome: 1) Is there more than one cause affecting the outcome? 2) What are some causes that might be involved? 3) Can you think of any other possibilities? 4) Which one(s) do you think are involved in causing the
outcome and why do you think so? 5) Are some of them working together to cause the outcome?
©2005, President and Fellows of Harvard College 146
Name_______________________ Date_________
Pitfalls in Reasoning About Density Think carefully about each of the questions below and then write three to four sentences in response to each. We are more interested in your reasoning than in particular right answers. 1. Some students say that things are more or less dense depending upon the
amount of air in them. Is it ever right to say that? If so, when? Is it ever wrong to say that? If so, when?
2. Jason said, “You can always use a substance’s mass number or atomic weight
to find the mass of an atom, and use that to accurately predict density.” Do you agree or disagree? Why?
3. If diamond and graphite are made out of the same element (carbon) why
don’t they have the same density?
4. There is more than one possible cause for density. What advice would you give to someone who wanted to analyze a certain object to consider its density?
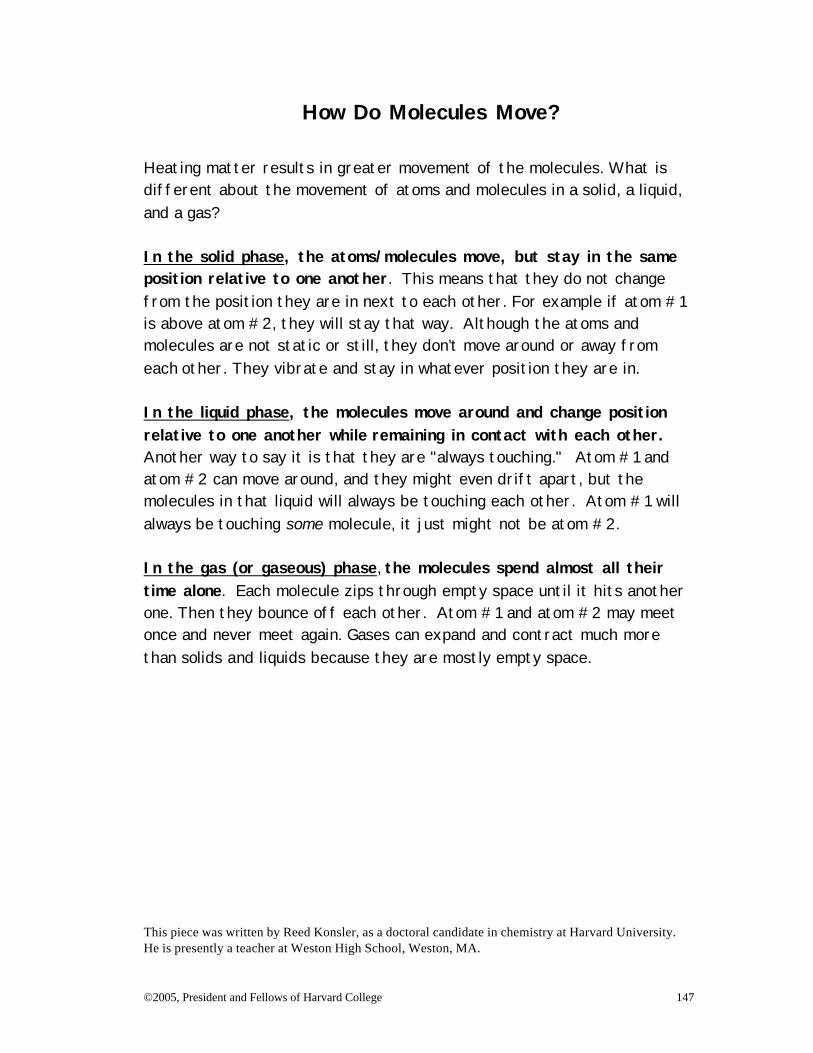
©2005, President and Fellows of Harvard College 147
How Do Molecules Move?
Heating matter results in greater movement of the molecules. What is different about the movement of atoms and molecules in a solid, a liquid, and a gas? In the solid phase, the atoms/molecules move, but stay in the same position relative to one another. This means that they do not change from the position they are in next to each other. For example if atom #1 is above atom #2, they will stay that way. Although the atoms and molecules are not static or still, they don’t move around or away from each other. They vibrate and stay in whatever position they are in. In the liquid phase, the molecules move around and change position relative to one another while remaining in contact with each other. Another way to say it is that they are "always touching." Atom #1 and atom #2 can move around, and they might even drift apart, but the molecules in that liquid will always be touching each other. Atom #1 will always be touching some molecule, it just might not be atom #2. In the gas (or gaseous) phase, the molecules spend almost all their time alone. Each molecule zips through empty space until it hits another one. Then they bounce off each other. Atom #1 and atom #2 may meet once and never meet again. Gases can expand and contract much more than solids and liquids because they are mostly empty space. This piece was written by Reed Konsler, as a doctoral candidate in chemistry at Harvard University. He is presently a teacher at Weston High School, Weston, MA.
©2005, President and Fellows of Harvard College 148
Name_____________________________ Date____________
Reflecting on What You've Learned about Changes in Density
In the past few classes, we have introduced a lot of information about what causes differences in density at the microscopic level and how density can change. Please answer the following questions. Use the back of this sheet if you need additional space.
1. Of what you've learned about what causes differences in density, what makes sense to you? Are there any pieces of what you've learned that seem especially clear to you?
2. Of what you've learned about what causes differences in density, what
doesn't make sense to you? What pieces seem especially difficult to understand?
3. Sometimes even when we understand an idea, we may not believe it. In terms of density, is there anything that you’ve learned that you question the plausibility or believability of?
4. Is there anything about what you learned about density that relates to other ideas you may have learned about? What are they? In what ways do they relate?
©2005, President and Fellows of Harvard College 149
SECTION 4
THE ROLE OF DENSITY IN SINKING AND FLOATING: RELATIONAL CAUSALITY
This section extends the concept of Relational Causality to the phenomenon of sinking and floating. It engages students in RECAST
activities to help them restructure their models of sinking and floating from Simple Linear models to Relational Causal models. It encourages
students to connect these understandings to a range of real world phenomena.
.
150 ©2005, President and Fellows of Harvard College
Section 4 Table of Contents
Lesson 13: Dropping an Object into a Liquid: How Does Density Affect Sinking or Floating? ....................................................................................................................151 Lesson 14: Layering Liquids: How Does Density Affect Sinking or Floating? .......158 lesson 15: What Happens in Sinking or Floating When the Relationship Between Densities Changes? ....................................................................................................162 Resources for Section 4 .............................................................................................168
©2005, President and Fellows of Harvard College 151
Lesson 13 Dropping an Object into a Liquid: How Does Density Affect Sinking or Floating?
Understanding Goals Subject Matter
v Density is one variable involved in sinking and floating. v When considering whether an object will sink or float in a liquid, you have to
compare the density of the object to the density of the liquid. v An object made of a substance with a density greater than the liquid will sink
in the liquid. An object made of a substance with a density less than that of the liquid will float in liquid, controlling for other variables. If the densities of the liquid and object are equal, the object will suspend.
Causality
v The role of density in sinking and floating is described by relational causality. v Students’ default pattern is to use a simple Linear Causal Model. In the case
of sinking and floating, that typically means focusing on the object and neglecting the role of the liquid in the outcome.
v The role that the liquid plays is non-obvious. This makes it appear passive and supports an erroneous linear causal model.
v Placing the same object in liquids in which it sinks and liquids in which it floats makes the role of the liquid obvious.
v Pushing the object down into the liquid and checking to see if it rises or sinks encourages a more active view of the liquid and helps learners to recognize the relational causality involved.
Background Information Entity-based Versus Relational Conceptions of Sinking and Floating
It is common for students to focus on the object that is doing the sinking or floating rather than on the relationship between the densities of the object to the liquid. The activities in this lesson attempt to help students develop a Relational Causal model of sinking and floating by offering evidence that is discrepant with a focus merely on the object and the Linear Causal Model that follows from it. By holding the object constant and varying the liquid, students' attention is directed to the role of the liquid, thereby revealing the underlying causal structure as relational. In Lesson 14, students are asked to layer liquids so they can see the densities of the liquids as relational. These understandings are important for comprehending a variety of phenomena such as why oil floats on water, why ships float differently in salt water than in fresh water, and so on.
Causal Patterns in Density: The Role of Density in Sinking and Floating: Relational Causality
152 ©2005, President and Fellows of Harvard College
Relational Causality
Relational Causality involves recognizing that an effect is caused by a relationship, often one of balance or imbalance, between element s of a system. Neither element is the cause by itself. Thinking about Relational Causality requires a departure from linear, unidirectional forms of causality where one object or entity acts as a causal agent on another affecting an outcome in one direction only, in a domino- like pattern.1 Research shows that students typically assume simple linear, unidirectional cause and effect models when analyzing scientific phenomena. These assumptions are evident from infancy.2 Causes are often perceived of as embedded in objects or entities, in this case, the object or substance that is sinking or floating. Attempting to reason about sinking and floating with an entity-based, linear causal model leads to viewing the surrounding fluid as playing a passive role. This reinforces a linear conception. Only in dramatic contexts, such as dropping an object into a very dense liquid, does the liquid’s role in the relationship as part of the causal agent become obvious enough to challenge the notion that equates the entity with the cause. Helping Students Develop a Relational Conception
Students’ problematic tendencies are compounded by certain teaching practices. For instance, referring to certain objects as “sinkers” and others as “floaters” without reference to the liquid encourages students to view the object itself as the only thing that determines sinking or floating. A common activity in the primary grades is to make a list of objects that sink and objects that float. This encourages a linear, entity -based, static model that can contribute to a range of difficulties for students later. As you talk with your students, it will be helpful to have different examples of relational causality to draw upon. The example used in Section 2 is about what makes two people sisters. In our experience, social examples have helped students to grasp the notion of relational causality because they are able to understand that you can't be a younger or older sister without having another person to relate to. Similarly, in density, you can't determine whether or not an object will sink or float unless you compare the object's density with the liquid's density.
1 Grotzer, T. A. (1993). Children’s understanding of complex causal relationships in natural systems .
Unpublished doctoral dissertation, Harvard University, Cambridge. Perkins, D. N., & Grotzer, T. A. (2000, April). Models and moves: Focusing on dimensions of causal complexity to achieve deeper scientific understanding. Paper presented at the annual conference of the American Educational Research Association, New Orleans.
2 Andersson, B. (1986). The experiential gestalt of causation: A commo n core to pupils’
preconceptions in science. European Journal of Science Education, 8(2), 155-171. Bullock, M., Gelman, R., & Baillargeon, R. (1982). The development of causal reasoning. In W. J. Friedman (Ed.), The developmental psychology of time (pp. 209-254). New York: Academic Press. Leslie, A.M. (1982). The perception of causality in infants. Perception, 11, 173-86.
Causal Patterns in Density: The Role of Density in Sinking and Floating: Relational Causality
©2005, President and Fellows of Harvard College 153
Here are some other examples to help your students think about Relational Causality that you may want to refer to:
• The outcome of certain sports series. For instance, when determining how well a baseball team is doing in a particular season, you can't just look at their win- loss record. You must also think about how the other teams in the league are doing and variables that impact how they might progress and grow over the season.
• Food production and population growth. Determining how much food to produce depends on how big the population is. If food production increases, so will the population. Likewise, if the population increases, food production will also need to increase in order to sustain the population.
Causal Patterns in Density: The Role of Density in Sinking and Floating: Relational Causality
154 ©2005, President and Fellows of Harvard College
Lesson Plan Materials
Ø 2 600 ml beakers marked A and B Ø Equal amount of water (A) and rubbing alcohol (B), approximately 16 fluid oz
of each Ø 2 pieces of candle wax from the same candle, same color and circumference, 1
one- inch long piece, 1 two-inch long piece Ø Paper towel Ø Some clay and wax (another piece of candle is fine) Ø RECAST Activity: Two Candles sheet Ø Thinking About Relational Causality sheet Ø Mapping Relational Causality: Sinking or Floating sheet Ø Student Examples: Making Connections Between Relational Causality and
Everyday Life Prep Step
Ø Review the lesson plan, background information, and understanding goals. Ø Gather materials. Ø Test the candle and alcohol experiment ahead of time. It works with most
candles. However, not all candles are the same density. You can adjust the candle pieces and the percentage of alcohol (Most stores carry a range of 70 to 91%) until the candle sinks in the alcohol and floats in the water.
Ø Build a small object using clay and wax that will suspend in water. You can build it by trial and error. You will need to match the density of water (1.0 grams per milliliter (g/ml).
Ø Before class begins, fill Beaker A with about 500 ml of water, and Beaker B with about 500 ml of alcohol. Make the two beakers as identical as you can.
Ø Photocopy the sheets: RECAST Activity: Two Candles (p. 169); Thinking About Relational Causality (p. 170); and Mapping Relational Causality: Sinking and Floating (p. 171).
Analyze Thinking Step 1: What Causes Something to Sink or Float?
Ask the students to answer the following question either in their journals or on a sheet of paper. “What causes an object to sink or float in a liquid? Draw a model to think through your ideas and then write an explanation.” Circulate while students are working to make sure that they understand the question. You may wish to ask them to consider how density is a part of what happens. Some students will also include non-density related explanations such as surface tension, buoyancy, etc. Give the students about ten minutes to think about their response. Don’t have the students share their ideas just yet.
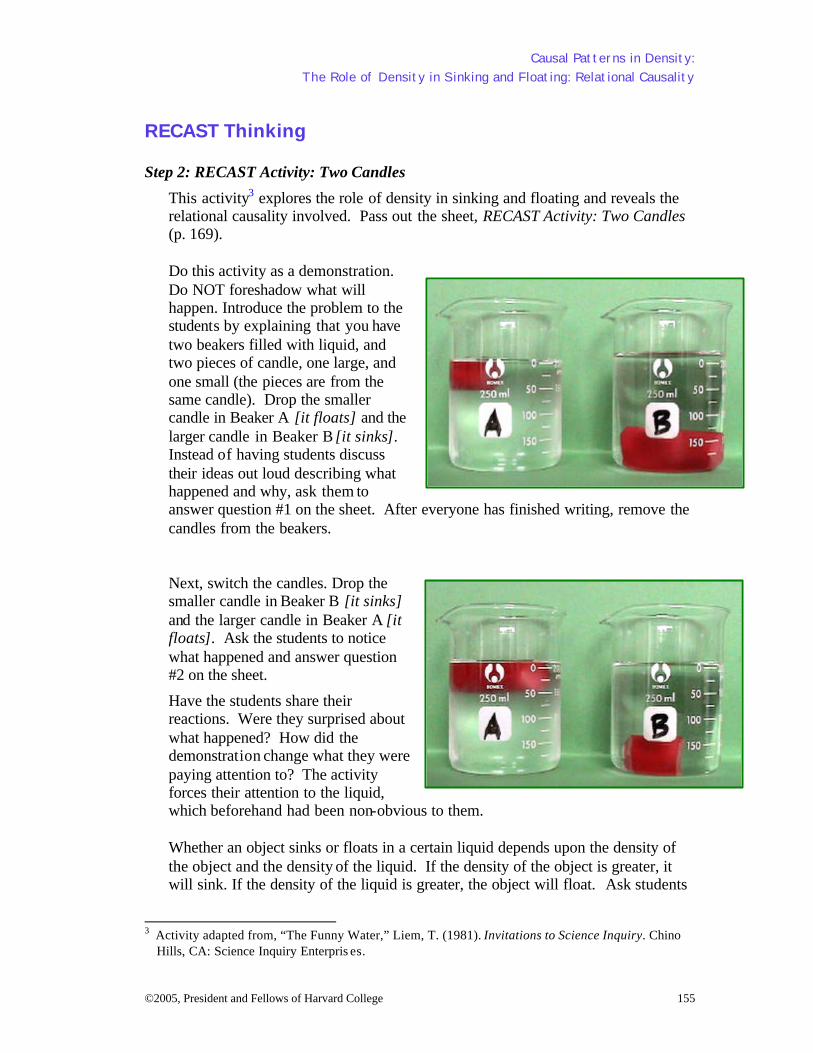
Causal Patterns in Density: The Role of Density in Sinking and Floating: Relational Causality
©2005, President and Fellows of Harvard College 155
RECAST Thinking Step 2: RECAST Activity: Two Candles
This activity3 explores the role of density in sinking and floating and reveals the relational causality involved. Pass out the sheet, RECAST Activity: Two Candles (p. 169). Do this activity as a demonstration. Do NOT foreshadow what will happen. Introduce the problem to the students by explaining that you have two beakers filled with liquid, and two pieces of candle, one large, and one small (the pieces are from the same candle). Drop the smaller candle in Beaker A [it floats] and the larger candle in Beaker B [it sinks]. Instead of having students discuss their ideas out loud describing what happened and why, ask them to answer question #1 on the sheet. After everyone has finished writing, remove the candles from the beakers.
Next, switch the candles. Drop the smaller candle in Beaker B [it sinks] and the larger candle in Beaker A [it floats]. Ask the students to notice what happened and answer question #2 on the sheet.
Have the students share their reactions. Were they surprised about what happened? How did the demonstration change what they were paying attention to? The activity forces their attention to the liquid, which beforehand had been non-obvious to them.
Whether an object sinks or floats in a certain liquid depends upon the density of the object and the density of the liquid. If the density of the object is greater, it will sink. If the density of the liquid is greater, the object will float. Ask students
3 Activity adapted from, “The Funny Water,” Liem, T. (1981). Invitations to Science Inquiry. Chino
Hills, CA: Science Inquiry Enterpris es.
A B
A B
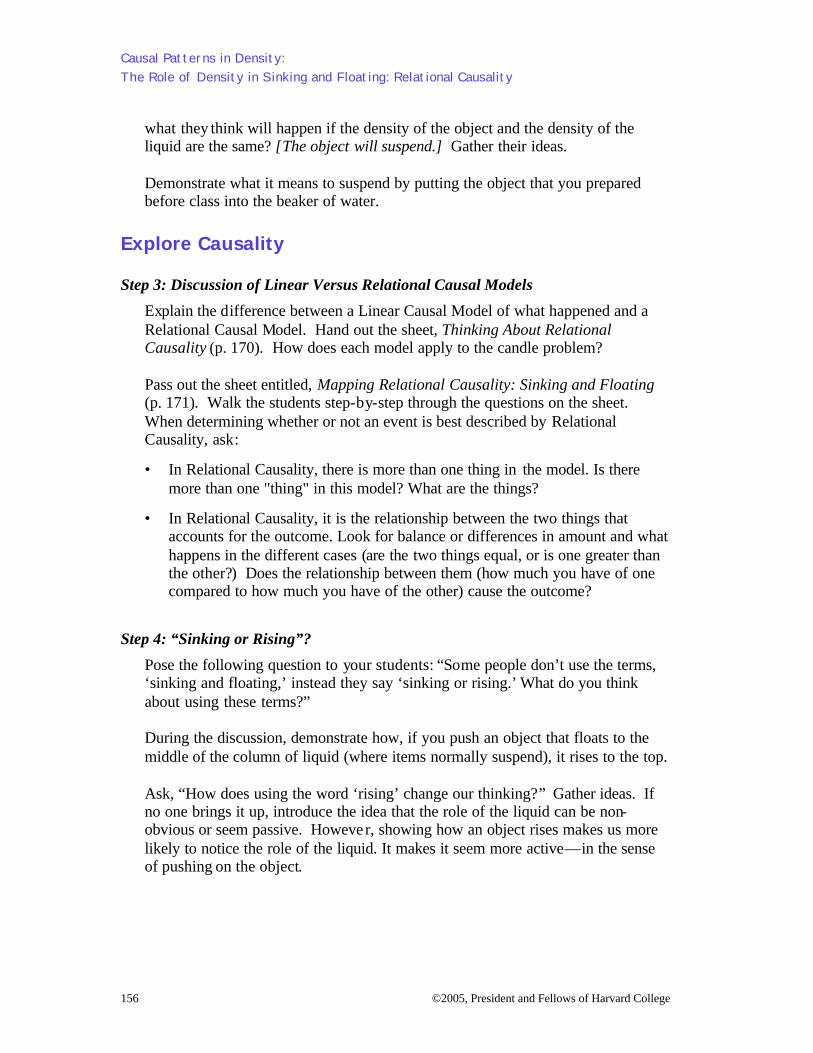
Causal Patterns in Density: The Role of Density in Sinking and Floating: Relational Causality
156 ©2005, President and Fellows of Harvard College
what they think will happen if the density of the object and the density of the liquid are the same? [The object will suspend.] Gather their ideas. Demonstrate what it means to suspend by putting the object that you prepared before class into the beaker of water.
Explore Causality Step 3: Discussion of Linear Versus Relational Causal Models
Explain the difference between a Linear Causal Model of what happened and a Relational Causal Model. Hand out the sheet, Thinking About Relational Causality (p. 170). How does each model apply to the candle problem? Pass out the sheet entitled, Mapping Relational Causality: Sinking and Floating (p. 171). Walk the students step-by-step through the questions on the sheet. When determining whether or not an event is best described by Relational Causality, ask:
• In Relational Causality, there is more than one thing in the model. Is there more than one "thing" in this model? What are the things?
• In Relational Causality, it is the relationship between the two things that accounts for the outcome. Look for balance or differences in amount and what happens in the different cases (are the two things equal, or is one greater than the other?) Does the relationship between them (how much you have of one compared to how much you have of the other) cause the outcome?
Step 4: “Sinking or Rising”?
Pose the following question to your students: “Some people don’t use the terms, ‘sinking and floating,’ instead they say ‘sinking or rising.’ What do you think about using these terms?” During the discussion, demonstrate how, if you push an object that floats to the middle of the column of liquid (where items normally suspend), it rises to the top. Ask, “How does using the word ‘rising’ change our thinking?” Gather ideas. If no one brings it up, introduce the idea that the role of the liquid can be non-obvious or seem passive. However, showing how an object rises makes us more likely to notice the role of the liquid. It makes it seem more active—in the sense of pushing on the object.
Causal Patterns in Density: The Role of Density in Sinking and Floating: Relational Causality
©2005, President and Fellows of Harvard College 157
Review, Extend, Apply Step 5: Making Connections: Relational Causality and Everyday Life!
Explain to your students that Relational Causality and density were introduced in this lesson.
Ask, • Where else have you noticed that differences in dens ity explain what is
going on? In making connections like this, it sometimes helps to "take a mental walk" through your day or through your home to help remind you of what you do or see there. What about when you are preparing food, washing dishes, running a bath, playing in the ocean? Try to find three examples that might have to do with relative density. Write 3-4 sentences explaining each one. You don't have to be positively sure that your examples have to do with relative density, just pretty sure (see student examples on page 173).
158 ©2005, President and Fellows of Harvard College
Lesson 14: Layering Liquids: How Does Density Affect Sinking or Floating?
Understanding Goals Subject Matter
v Density is one variable involved in sinking and floating. v When considering whether a liquid will sink below or float on another liquid,
you have to compare the densities of the liquids. v The liquid with the greater density will sink and the liquid with the lesser
density will float. In cases where there are more than two liquids, the liquids will layer from least dense to most dense, top to bottom.
v Gases also layer from least dense to most dense, top to bottom, as is the case with the gases in our atmosphere.
Causality
v The role of density in sinking and floating is described by Relational Causality. Students’ default pattern is to use simple linear causal models.
v Layering liquids helps to make the role that the liquid plays in sinking and floating obvious.
Background Information
Relational Causality and Layering of Liquids
This lesson asks students to layer liquids to see the densities of the liquids as relational. The lesson then seeks to extend the learning to fluids more generally so that students realize that the understandings also apply to gases. These understandings are important for comprehending a variety of phenomena such as why oil floats on water, why our atmosphere is layered they way it is, and why certain chemicals sink and others float when released into water bodies.
One of the reasons why this lesson is important for many students is that it forces them to focus on the liquid. It is a powerful default assumption in thinking about sinking and floating to focus on the object only. If there is no object and only two liquids, it helps to force students’ attention to the liquid as a part of the equation that influences the outcome. Making Connections Between Relational Causality, Fluids, and Everyday Life
The lesson also encourages students to make connections between everyday life and the layering of liquids. How many of us have tried to clean out an oil jar by filling it
Causal Patterns in Density: The Role of Density in Sinking or Floating: Relational Causality
©2005, President and Fellows of Harvard College 159
with water and then tipping it over? The oil floats right back to the bottom of the jar as it is tipped up. This is a simple lesson in relational density. There are many places where relational density can have a big impact. For instance, the layers of our atmosphere are arranged as they are because of the density of those fluids. Of course, there is lots of mixing of gases in our atmosphere given the behavior of gases. However, generally speaking, large shifts in the densities of gases in our atmosphere will result in shifts in the layering.
Causal Patterns in Density: The Role of Density in Sinking or Floating: Relational Causality
160 ©2005, President and Fellows of Harvard College
Lesson Plan Materials
Ø Paper towels Ø Eye droppers Ø Small bottles or jars (Baby food jars work well.) Ø Vegetable oil Ø Water Ø Dish soap (preferably a colored one) Ø Sinking and Floating Fluids sheet Ø Relational Causality and Layering Liquids sheet Ø Liquid Layers: How Does Density Affect Sinking and Floating? Sheet Ø Layers of the Atmosphere Ø Layers of the Atmosphere Showing Air Density
Prep Step
Ø Review the lesson plan, background information, and understanding goals. Ø Gather materials. Ø Photocopy the sheets: Sinking and Floating Fluids (p. 174); Relational
Causality and Layering Liquids (p. 177); Liquid Layers: How Does Density Affect Sinking and Floating? (p. 179); Layers of the Atmosphere (p. 180); and Layers of the Atmosphere Showing Air Density (p. 181).
Analyze Thinking
Step 1: Extending Relational Causality to Liquids
Ask the students to predict (either in a class discussion or in their journals) what some of the outcomes might be if you put two liquids into a beaker or jar. (They might mix, or mix initially and then separate, one liquid might rise to the top of another, etc.)
Ask, “In the case of liquids that do not stay mixed, what determines which liquid ends up on top, for example oil floating on water?”
Collect whatever ideas the students have. Some of them may extend the learning about Relational Causality that they did in the last lesson to reasoning about what happens with liquids. Leave the question open while they do the activity and come back to it at the end of the lesson.
RECAST Thinking
Step 2: RECAST Activity: What do Liquid Layers Tell Us About Density?
Pass out the sheet Sinking and Floating Fluids (p. 174) to pairs or small groups of students. Have each group collect the materials that they need. Explain that the sheet guides them through a series of questions and activities to help them think about why some liquids sink and some liquids float on other liquids. The activity
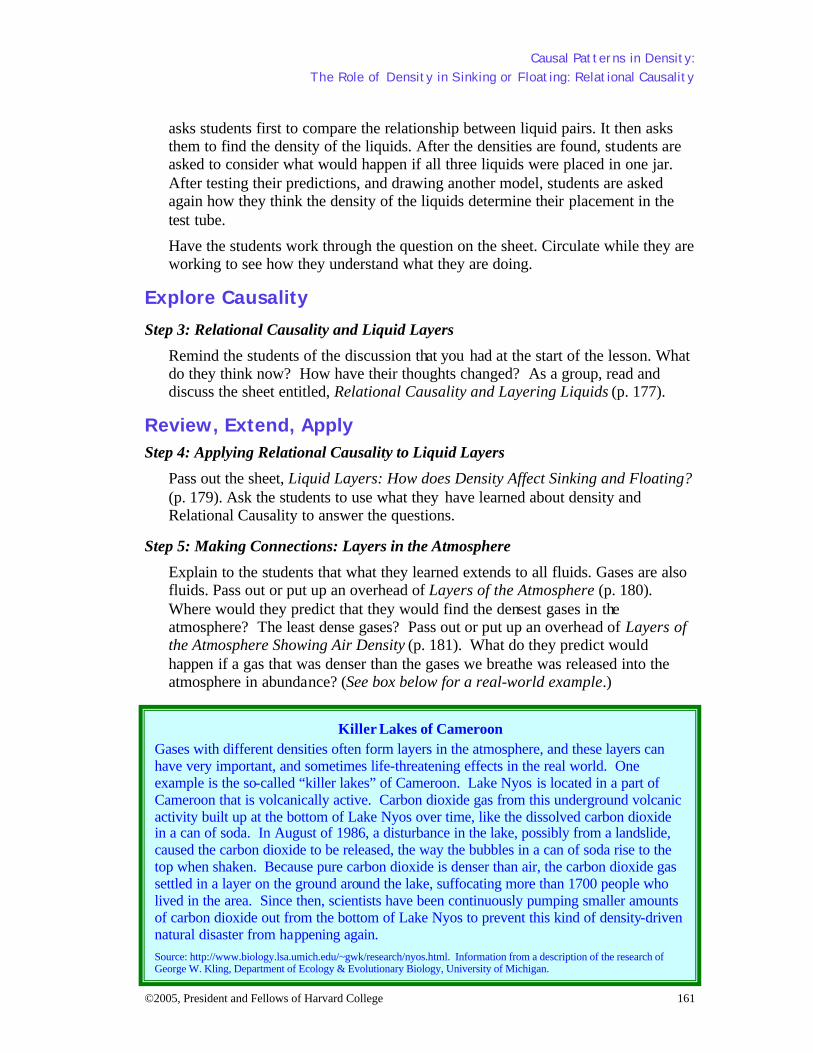
Causal Patterns in Density: The Role of Density in Sinking or Floating: Relational Causality
©2005, President and Fellows of Harvard College 161
asks students first to compare the relationship between liquid pairs. It then asks them to find the density of the liquids. After the densities are found, students are asked to consider what would happen if all three liquids were placed in one jar. After testing their predictions, and drawing another model, students are asked again how they think the density of the liquids determine their placement in the test tube.
Have the students work through the question on the sheet. Circulate while they are working to see how they understand what they are doing.
Explore Causality
Step 3: Relational Causality and Liquid Layers
Remind the students of the discussion that you had at the start of the lesson. What do they think now? How have their thoughts changed? As a group, read and discuss the sheet entitled, Relational Causality and Layering Liquids (p. 177).
Review, Extend, Apply
Step 4: Applying Relational Causality to Liquid Layers
Pass out the sheet, Liquid Layers: How does Density Affect Sinking and Floating? (p. 179). Ask the students to use what they have learned about density and Relational Causality to answer the questions.
Step 5: Making Connections: Layers in the Atmosphere
Explain to the students that what they learned extends to all fluids. Gases are also fluids. Pass out or put up an overhead of Layers of the Atmosphere (p. 180). Where would they predict that they would find the densest gases in the atmosphere? The least dense gases? Pass out or put up an overhead of Layers of the Atmosphere Showing Air Density (p. 181). What do they predict would happen if a gas that was denser than the gases we breathe was released into the atmosphere in abundance? (See box below for a real-world example.)
Killer Lakes of Cameroon
Gases with different densities often form layers in the atmosphere, and these layers can have very important, and sometimes life-threatening effects in the real world. One example is the so-called “killer lakes” of Cameroon. Lake Nyos is located in a part of Cameroon that is volcanically active. Carbon dioxide gas from this underground volcanic activity built up at the bottom of Lake Nyos over time, like the dissolved carbon dioxide in a can of soda. In August of 1986, a disturbance in the lake, possibly from a landslide, caused the carbon dioxide to be released, the way the bubbles in a can of soda rise to the top when shaken. Because pure carbon dioxide is denser than air, the carbon dioxide gas settled in a layer on the ground around the lake, suffocating more than 1700 people who lived in the area. Since then, scientists have been continuously pumping smaller amounts of carbon dioxide out from the bottom of Lake Nyos to prevent this kind of density-driven natural disaster from happening again.
Source: http://www.biology.lsa.umich.edu/~gwk/research/nyos.html. Information from a description of the research of George W. Kling, Department of Ecology & Evolutionary Biology, University of Michigan.
162 ©2005, President and Fellows of Harvard College
Lesson 15 What Happens in Sinking or Floating When the Relationship Between Densities Changes?
Understanding Goals Subject Matter
v Sinking and floating is the result of the relation between the density of the object and the density of the liquid. The substance with the greater density will sink in a substance with lesser density.
v Changes to the liquids or objects can result in changes in the system and in the outcome of sinking or floating.
Causality
v People often use linear models to explain whether something sinks or floats. This makes it hard to see what is really going on.
v A relational causal model helps us attend to the density differential that accounts for sinking and floating.
v If we manipulate the density of a substance, it will not change its relationship to another substance until it reaches the point where the differential between the densities changes direction. This threshold or “tipping point” can create sudden effects even if the causes have been accumulating over time.
Background Information Manipulating Relationships Between Densities
The activities in this lesson reinforce many of the concepts in the module and those in the previous lesson. This lesson also introduces the question of what happens when one part of the system changes—in the demonstration case, the density of the liquid. Students are given an opportunity to use materials they see daily (soft drinks) and relate them to the concept of density. First, they will observe tha t one soda can (diet) floats while the other soda can sinks (regular) in water. This pushes them to see that the densities of the cans of soda must not be the same. Upon examination of the cans, students will find that they are of equal volume so the only way they can have different densities is through different masses. The students may realize this by reading the ingredients on the side of the can. To push the students’ attention to the role of the liquid in the equation, corn syrup is added to the water to increase its overall density. The students will observe the regular soda now rises to the top of the water due to the change in the relationship between the density of the water/corn syrup mixture and the density of the regular soda.
Causal Patterns in Density: The Role of Density in Sinking or Floating: Relational Causality
©2005, President and Fellows of Harvard College 163
Connections to the Real World
There are many instances in the real world where humans or animals manipulate overall density to shift the relationship between two densities to suit their needs. For example, some fish have a swim bladder that they can inflate to a greater or lesser extent to rise or sink in the water column. Submarines mimic this design. Hot air balloons also manipulate the density of the air in the balloon to cause sinking and rising. Encouraging students to make connections such as these will help them to see how the concept of density as dynamic is a powerful tool for understanding scientific problems in the real world. A Threshold for Changing the Relationship
One of the important lessons about relational causality and density is that it involves aspects of what is referred to as the “tipping point” phenomenon. If we manipulate the density of a substance, it will not affect its relationship to another substance until it reaches the point where the differential between the densities changes direction. This threshold or tipping point can create sudden effects even if the causes have been accumulating over time. This has implications for how and when we notice changes in density. It also has important implications for the constitution of our atmosphere, the release of chemicals into water bodies, and the temperatures of our oceans, among other applications.
Causal Patterns in Density: The Role of Density in Sinking or Floating: Relational Causality
164 ©2005, President and Fellows of Harvard College
Lesson Plan Materials
Ø 1 can of diet Pepsi at room temperature Ø 1 can of regular Pepsi at room temperature Ø 1 large container of water (an aquarium or large vase works well) Ø Electronic scale or Triple Beam Balance Ø Paper towel Ø Galileo’s Thermometer Ø Heat source Ø Diet Versus Regular Soda: Which Pop Rises to the Top? sheet Ø Analyzing an Analogy: Galileo’s Thermometer sheet Ø Making Connections with Density sheet
Prep Step
Ø Review the lesson plan, background information, and understanding goals. Ø Gather materials. Ø Test the cans of soda for the experiment. Different ingredients may produce
different results. In the past, using Pepsi and Diet Pepsi has been more successful than using Coke and Diet Coke but changes to the composition of the soda can change the outcome.
Ø Make sure that each can holds the same amount of liquid. Ø Photocopy the sheets: Diet Versus Regular Soda: Which Pop Rises to the
Top? (p. 182); Analyzing an Analogy: Galileo’s Thermometer (p. 183); and Making Connections with Density (p. 184).
Analyze Thinking Step 1: How Can We Manipulate the Relationship Between Densities?
Ask the students to think about the relationship between two densities. What are some ways that we can change the outcome in any given case? Encourage the students to see that we can change the density of a substance to a certain extent, but that once we change the direction of the differential, the outcome tips the other way. It is an example of a kind of “tipping point” phenomenon. There are some events that we don’t notice until they reach a certain threshold or point. Encourage them to think of supporting examples.
RECAST Thinking Step 2: RECAST Activity: Which Pop Rises to the Top?
Do the following demonstration for the class. Show the students unopened cans of diet and regular soda. Ask how they can tell what is different and what is similar
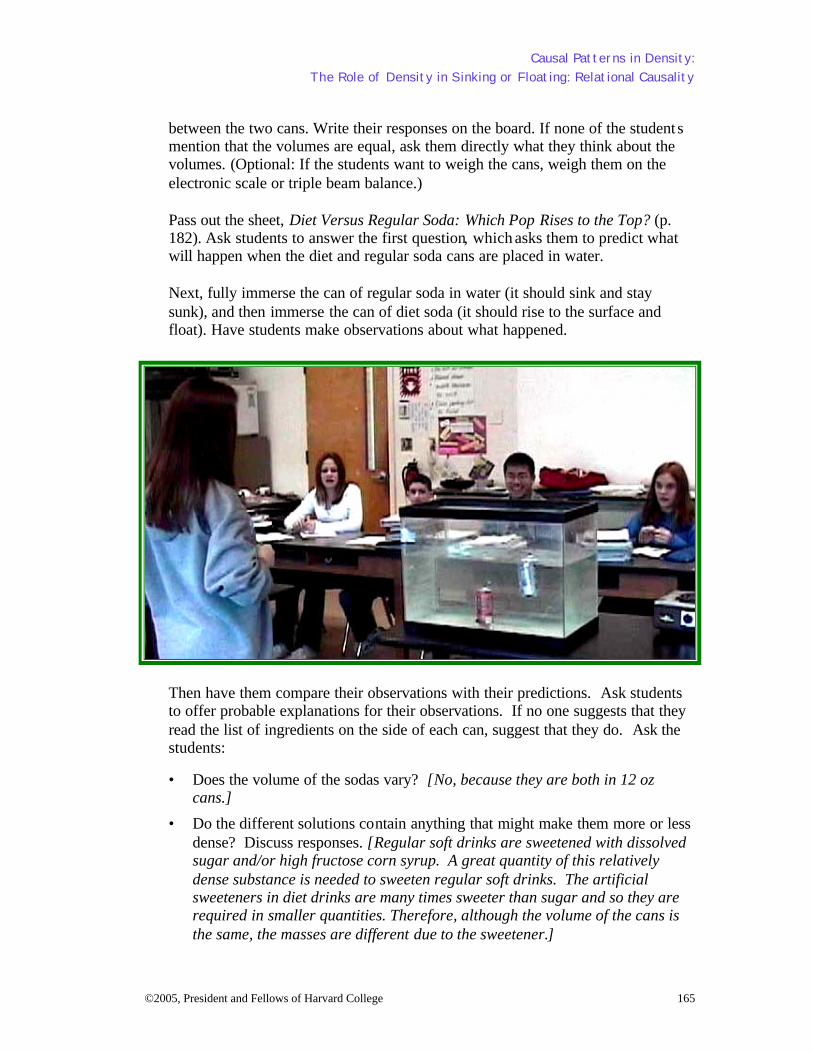
Causal Patterns in Density: The Role of Density in Sinking or Floating: Relational Causality
©2005, President and Fellows of Harvard College 165
between the two cans. Write their responses on the board. If none of the student s mention that the volumes are equal, ask them directly what they think about the volumes. (Optional: If the students want to weigh the cans, weigh them on the electronic scale or triple beam balance.) Pass out the sheet, Diet Versus Regular Soda: Which Pop Rises to the Top? (p. 182). Ask students to answer the first question, which asks them to predict what will happen when the diet and regular soda cans are placed in water.
Next, fully immerse the can of regular soda in water (it should sink and stay sunk), and then immerse the can of diet soda (it should rise to the surface and float). Have students make observations about what happened.
Then have them compare their observations with their predictions. Ask students to offer probable explanations for their observations. If no one suggests that they read the list of ingredients on the side of each can, suggest that they do. Ask the students:
• Does the volume of the sodas vary? [No, because they are both in 12 oz cans.]
• Do the different solutions contain anything that might make them more or less dense? Discuss responses. [Regular soft drinks are sweetened with dissolved sugar and/or high fructose corn syrup. A great quantity of this relatively dense substance is needed to sweeten regular soft drinks. The artificial sweeteners in diet drinks are many times sweeter than sugar and so they are required in smaller quantities. Therefore, although the volume of the cans is the same, the masses are different due to the sweetener.]
Causal Patterns in Density: The Role of Density in Sinking or Floating: Relational Causality
166 ©2005, President and Fellows of Harvard College
Ask the students how the densities of the regular and diet soda cans compare to the density of the water, which is 1g/ml. Ask the students to answer questions 2 to 4 on their sheet. Discuss their responses. Ask the students to predict the following: “What do you think will happen when we add corn syrup to the water? Why?” Add corn syrup to the water slowly, being sure to mix it thoroughly with the water until the regular soda can floats. Then pose the following question, “What happened in terms of the relationship between the water and the can of regular soda? Why?” Collect their ideas. [The addition of corn syrup to the water created a mixture that had a density greater than 1 g/ml, the density of water alone. Since the regular soda can floated to the top of the container, the density of the can in relation to the new mixture must have changed. The regular soda can is less dense than the corn syrup/water mixture, and this new relationship caused the can to float. When thinking in terms of sinking and floating, we must not only consider the density of the object being sunk or floated, but the density of the liquid the object is immersed in as well. We also need to consider how possible changes might impact the relationship.]
Exploring Causality Step 3: Thinking About the Cans of Soda Using Relational Causality
Draw the diagram for Relational Causality on the board to analyze what happened. When determining whether or not an event is best described by Relational Causality, ask yourself:
• In Relational Causality, there is more than one “thing” in the model. Is there more than one "thing" in this model? What are the things?
• In Relational Causality, it is the relationship between the two things that accounts for the outcome. Look for balance or differences in amount and what happens in the different cases (the things are equal to each other, or one is more than the other). Does the relationship between them (how much you have of one compared to how much you have of the other) cause the outcome?
Review, Extend, Apply Step 4: Analyzing an Analogy
Show the students the Galileo's thermometer. How do they think it works? Turn on a heat source near the thermometer. What do they notice? What is going on
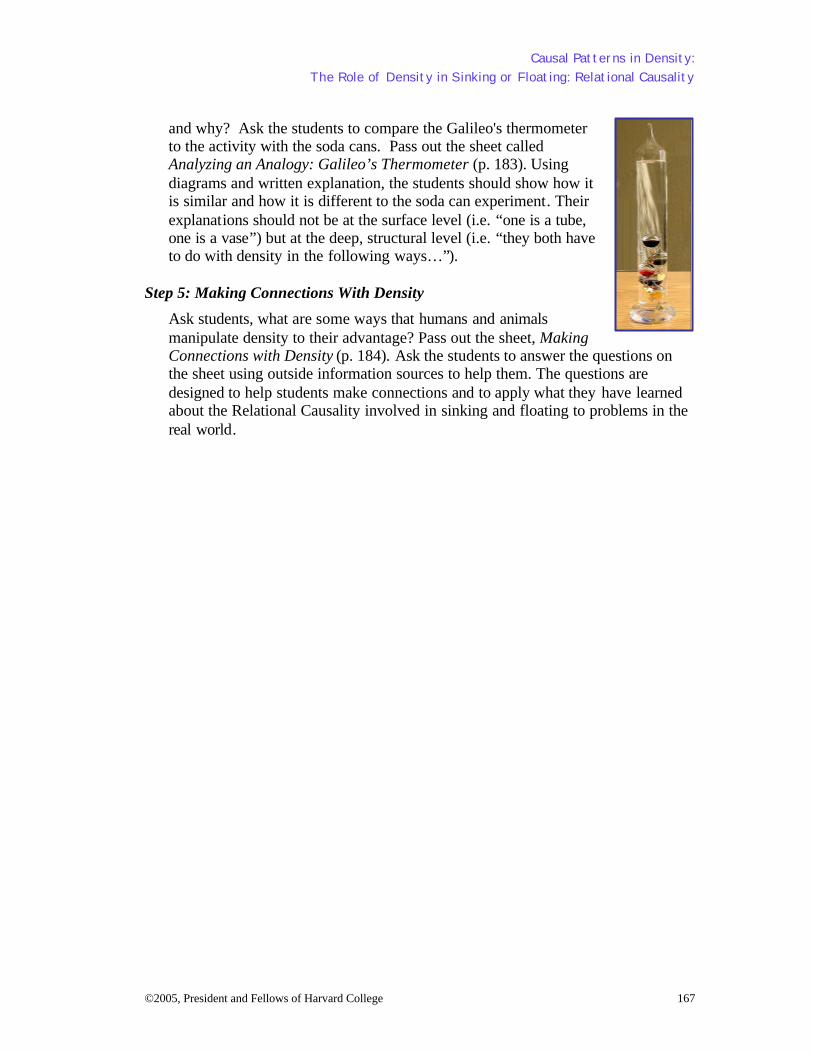
Causal Patterns in Density: The Role of Density in Sinking or Floating: Relational Causality
©2005, President and Fellows of Harvard College 167
and why? Ask the students to compare the Galileo's thermometer to the activity with the soda cans. Pass out the sheet called Analyzing an Analogy: Galileo’s Thermometer (p. 183). Using diagrams and written explanation, the students should show how it is similar and how it is different to the soda can experiment. Their explanations should not be at the surface level (i.e. “one is a tube, one is a vase”) but at the deep, structural level (i.e. “they both have to do with density in the following ways…”).
Step 5: Making Connections With Density
Ask students, what are some ways that humans and animals manipulate density to their advantage? Pass out the sheet, Making Connections with Density (p. 184). Ask the students to answer the questions on the sheet using outside information sources to help them. The questions are designed to help students make connections and to apply what they have learned about the Relational Causality involved in sinking and floating to problems in the real world.
Causal Patterns in Density: The Role of Density in Sinking or Floating: Relational Causality
168 ©2005, President and Fellows of Harvard College
Resources for Section 4
Lesson 13
Ø RECAST Activity: Two Candles sheet Ø Thinking About Relational Causality sheet Ø Mapping Relational Causality: Sinking or Floating sheet Ø Student Examples: Making Connections Between Relational Causality and
Everyday Life Lesson 14
Ø Sinking and Floating Fluids sheet Ø Relational Causality and Layering Liquids sheet Ø Liquid Layers: How Does Density Affect Sinking and Floating? sheet Ø Layers of the Atmosphere Ø Layers of the Atmosphere Showing Air Density
Lesson 15
Ø Diet Versus Regular Soda: Which Pop Rises to the Top? sheet Ø Analyzing an Analogy: Galileo’s Thermometer sheet Ø Making Connections with Density sheet
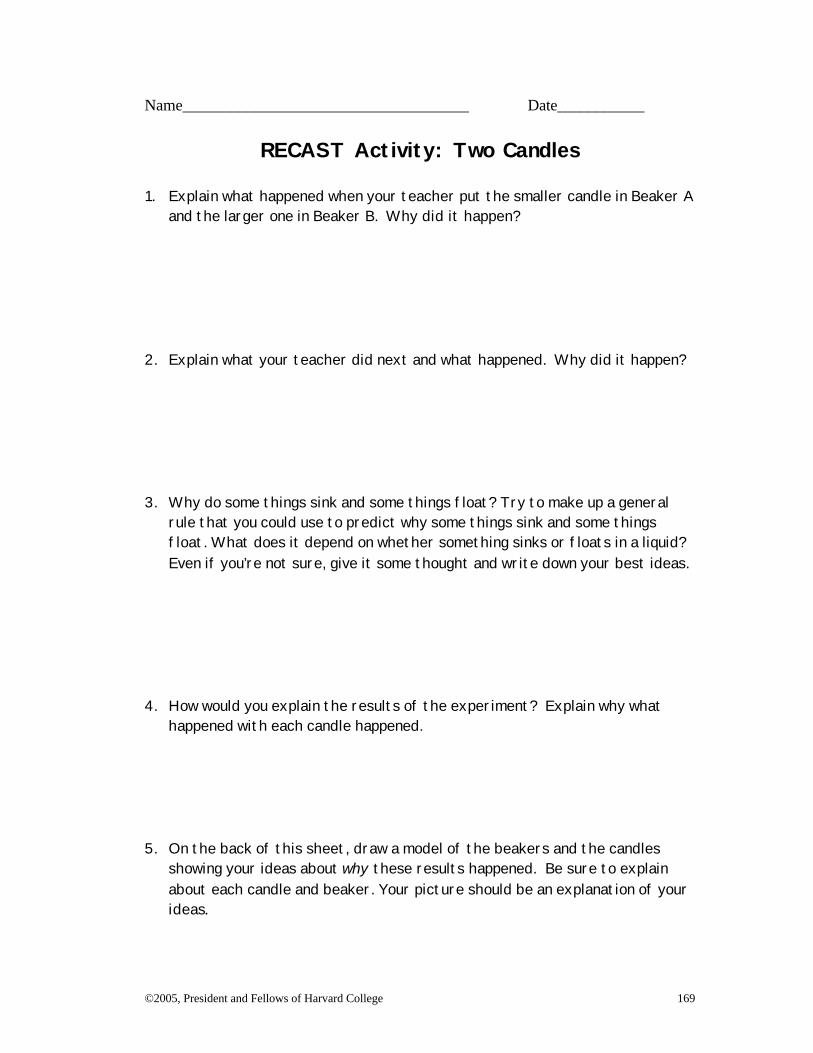
©2005, President and Fellows of Harvard College 169
Name____________________________________ Date___________
RECAST Activity: Two Candles 1. Explain what happened when your teacher put the smaller candle in Beaker A
and the larger one in Beaker B. Why did it happen? 2. Explain what your teacher did next and what happened. Why did it happen? 3. Why do some things sink and some things float? Try to make up a general
rule that you could use to predict why some things sink and some things float. What does it depend on whether something sinks or floats in a liquid? Even if you’re not sure, give it some thought and write down your best ideas.
4. How would you explain the results of the experiment? Explain why what
happened with each candle happened. 5. On the back of this sheet, draw a model of the beakers and the candles
showing your ideas about why these results happened. Be sure to explain about each candle and beaker. Your picture should be an explanation of your ideas.
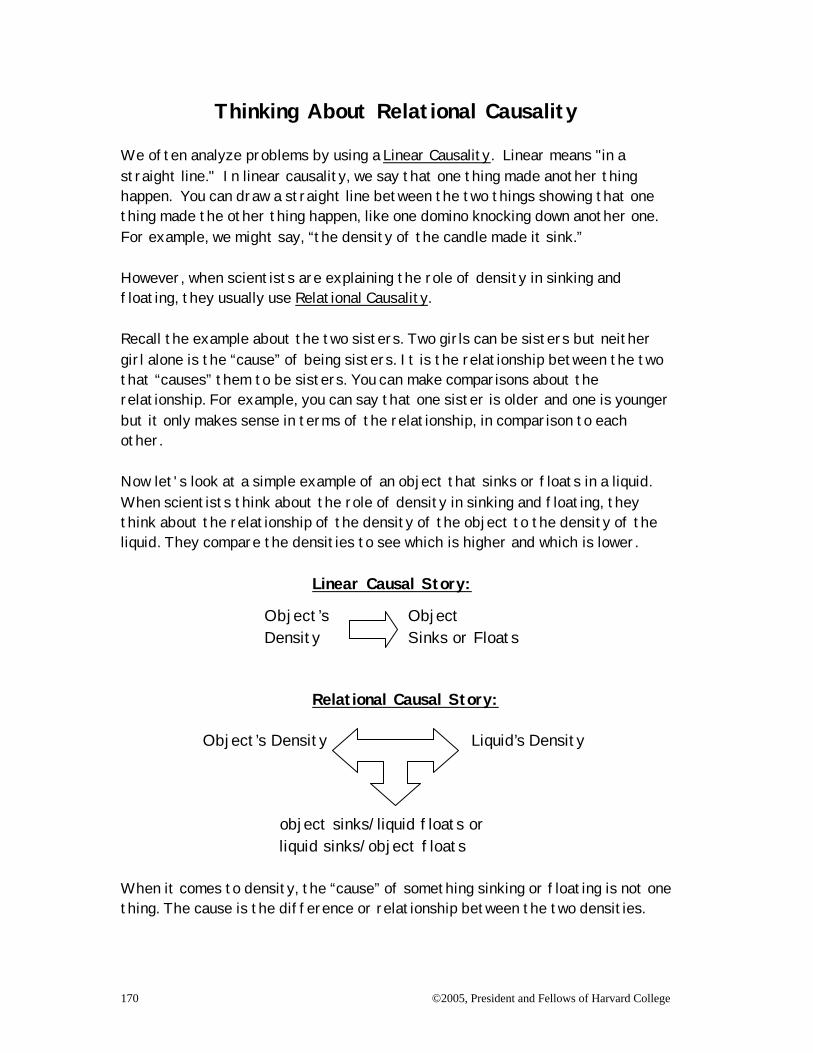
170 ©2005, President and Fellows of Harvard College
Thinking About Relational Causality
We often analyze problems by using a Linear Causality. Linear means "in a straight line." In linear causality, we say that one thing made another thing happen. You can draw a straight line between the two things showing that one thing made the other thing happen, like one domino knocking down another one. For example, we might say, “the density of the candle made it sink.” However, when scientists are explaining the role of density in sinking and floating, they usually use Relational Causality. Recall the example about the two sisters. Two girls can be sisters but neither girl alone is the “cause” of being sisters. It is the relationship between the two that “causes” them to be sisters. You can make comparisons about the relationship. For example, you can say that one sister is older and one is younger but it only makes sense in terms of the relationship, in comparison to each other. Now let's look at a simple example of an object that sinks or floats in a liquid. When scientists think about the role of density in sinking and floating, they think about the relationship of the density of the object to the density of the liquid. They compare the densities to see which is higher and which is lower. Linear Causal Story:
Object’s Object Density Sinks or Floats
Relational Causal Story: Object’s Density Liquid’s Density object sinks/liquid floats or liquid sinks/object floats When it comes to density, the “cause” of something sinking or floating is not one thing. The cause is the difference or relationship between the two densities.
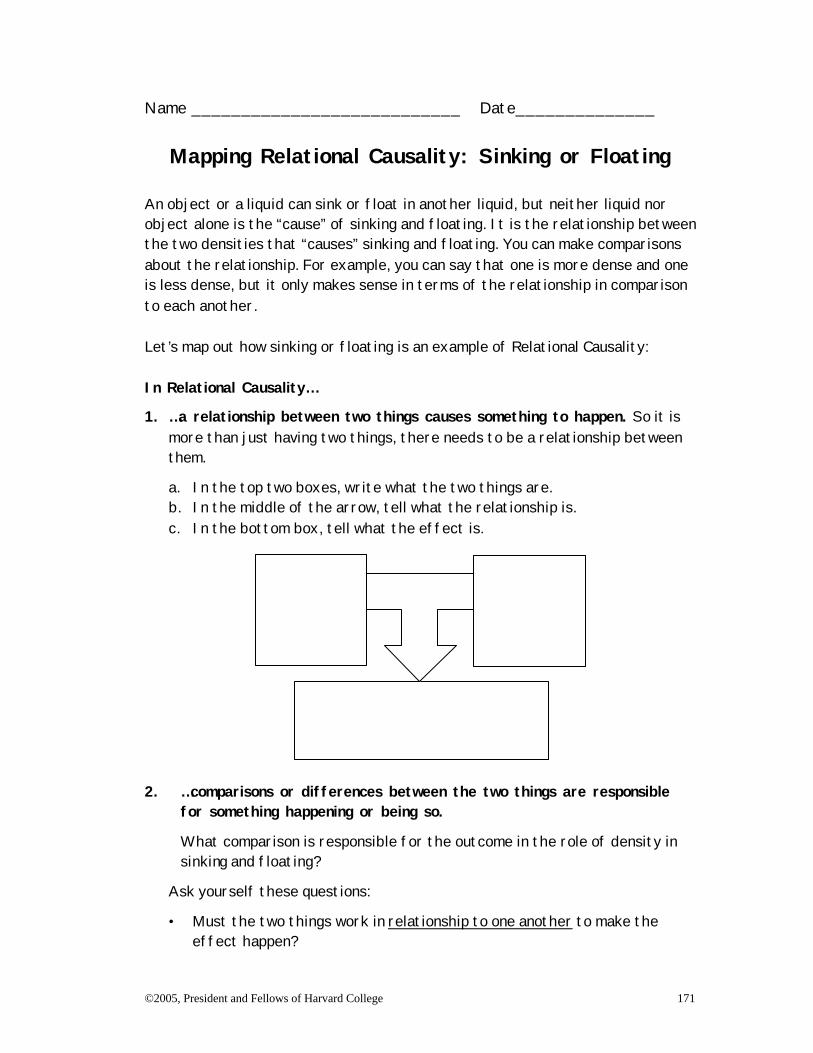
©2005, President and Fellows of Harvard College 171
Name ___________________________ Date______________
Mapping Relational Causality: Sinking or Floating An object or a liquid can sink or float in another liquid, but neither liquid nor object alone is the “cause” of sinking and floating. It is the relationship between the two densities that “causes” sinking and floating. You can make comparisons about the relationship. For example, you can say that one is more dense and one is less dense, but it only makes sense in terms of the relationship in comparison to each another. Let’s map out how sinking or floating is an example of Relational Causality: In Relational Causality…
1. …a relationship between two things causes something to happen. So it is more than just having two things, there needs to be a relationship between them.
a. In the top two boxes, write what the two things are. b. In the middle of the arrow, tell what the relationship is. c. In the bottom box, tell what the effect is.
2. …comparisons or differences between the two things are responsible for something happening or being so.
What comparison is responsible for the outcome in the role of density in sinking and floating?
Ask yourself these questions:
• Must the two things work in relationship to one another to make the effect happen?
172 ©2005, President and Fellows of Harvard College
• If one of the two things changes (so that the relationship changes), does the outcome change?
• Can a comparison be made between the amounts of the things?
It is NOT Relational Causality if:
• One cause can result in the effect without the other cause.
• You have two causes, but there is no comparison between them, (you just add them up or do one and then the other).
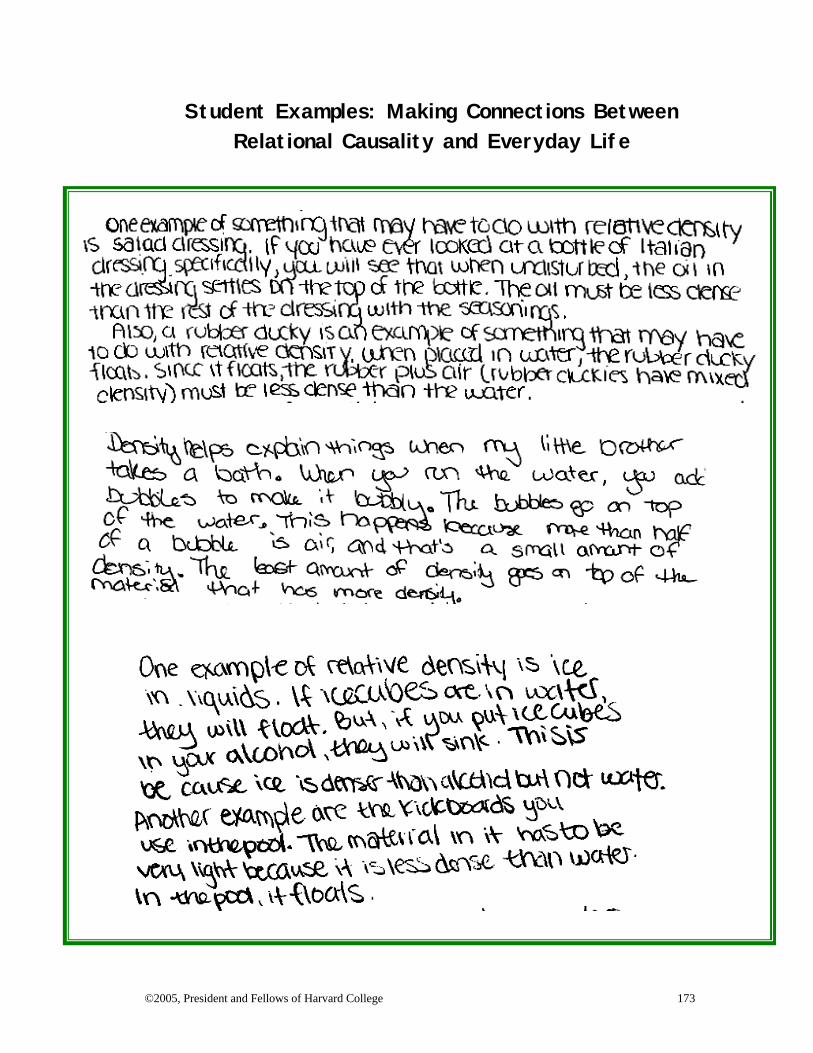
©2005, President and Fellows of Harvard College 173
Student Examples: Making Connections Between Relational Causality and Everyday Life
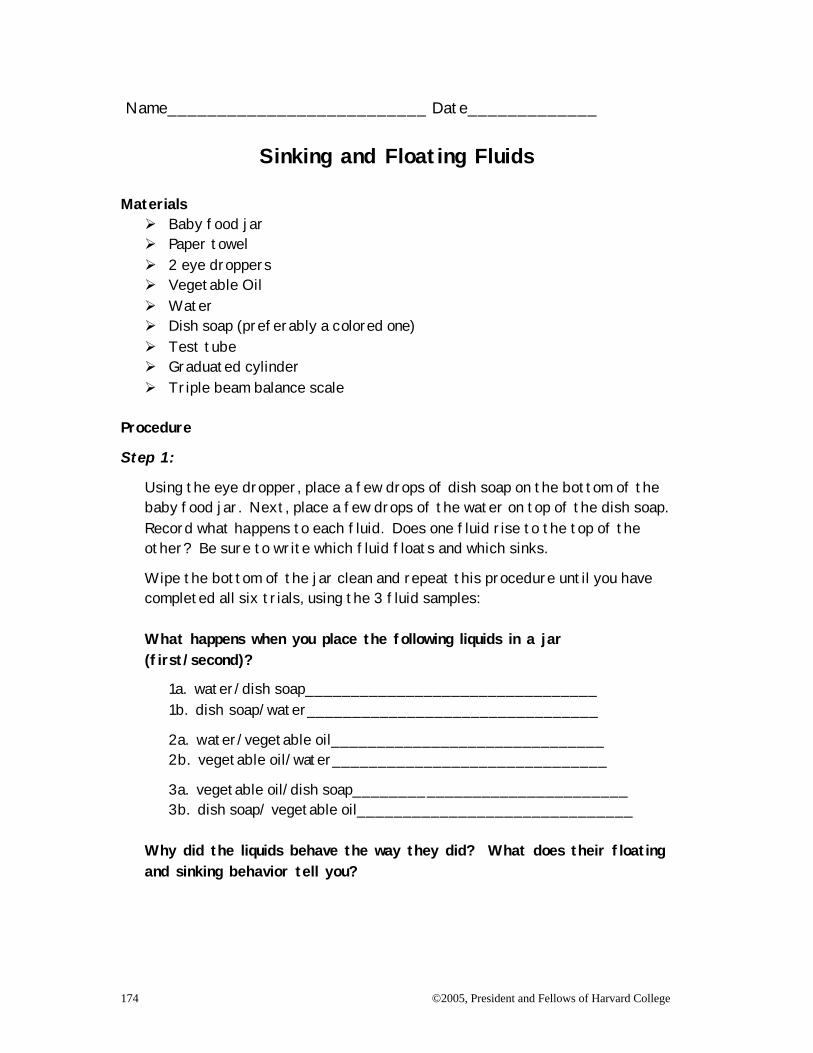
174 ©2005, President and Fellows of Harvard College
Name__________________________ Date_____________
Sinking and Floating Fluids Materials Ø Baby food jar Ø Paper towel Ø 2 eye droppers Ø Vegetable Oil Ø Water Ø Dish soap (preferably a colored one) Ø Test tube Ø Graduated cylinder Ø Triple beam balance scale
Procedure
Step 1:
Using the eye dropper, place a few drops of dish soap on the bottom of the baby food jar. Next, place a few drops of the water on top of the dish soap. Record what happens to each fluid. Does one fluid rise to the top of the other? Be sure to write which fluid floats and which sinks.
Wipe the bottom of the jar clean and repeat this procedure until you have completed all six trials, using the 3 fluid samples:
What happens when you place the following liquids in a jar (first/second)?
1a. water/dish soap________________________________ 1b. dish soap/water________________________________
2a. water/vegetable oil______________________________ 2b. vegetable oil/water______________________________
3a. vegetable oil/dish soap______________________________ 3b. dish soap/ vegetable oil______________________________
Why did the liquids behave the way they did? What does their floating and sinking behavior tell you?
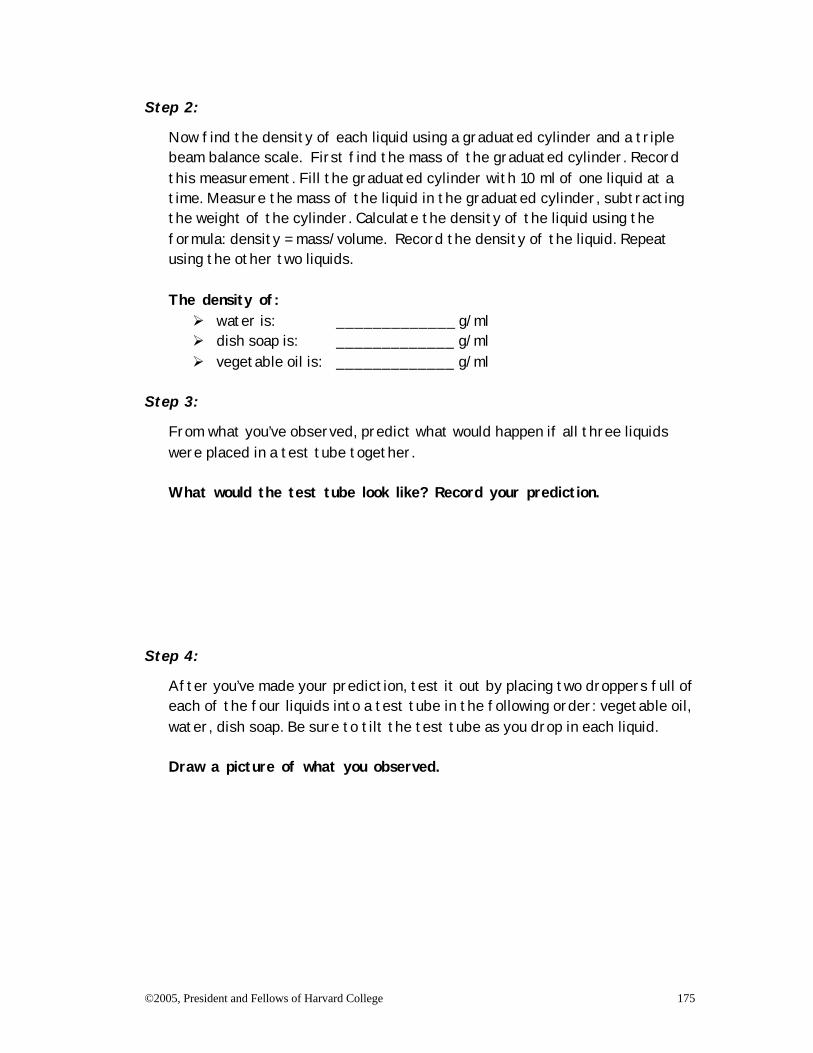
©2005, President and Fellows of Harvard College 175
Step 2:
Now find the density of each liquid using a graduated cylinder and a triple beam balance scale. First find the mass of the graduated cylinder. Record this measurement. Fill the graduated cylinder with 10 ml of one liquid at a time. Measure the mass of the liquid in the graduated cylinder, subtracting the weight of the cylinder. Calculate the density of the liquid using the formula: density = mass/volume. Record the density of the liquid. Repeat using the other two liquids.
The density of: Ø water is: _____________ g/ml Ø dish soap is: _____________ g/ml Ø vegetable oil is: _____________ g/ml
Step 3:
From what you’ve observed, predict what would happen if all three liquids were placed in a test tube together.
What would the test tube look like? Record your prediction.
Step 4:
After you’ve made your prediction, test it out by placing two droppers full of each of the four liquids into a test tube in the following order: vegetable oil, water, dish soap. Be sure to tilt the test tube as you drop in each liquid.
Draw a picture of what you observed.
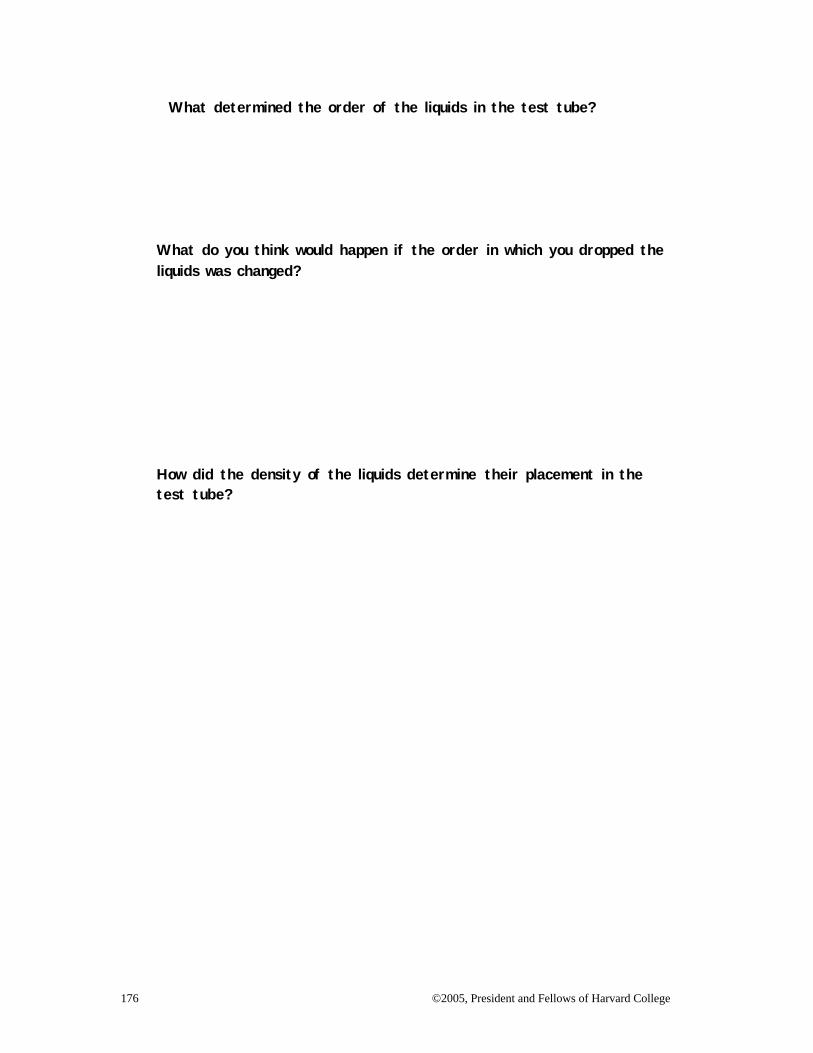
176 ©2005, President and Fellows of Harvard College
What determined the order of the liquids in the test tube?
What do you think would happen if the order in which you dropped the liquids was changed?
How did the density of the liquids determine their placement in the test tube?
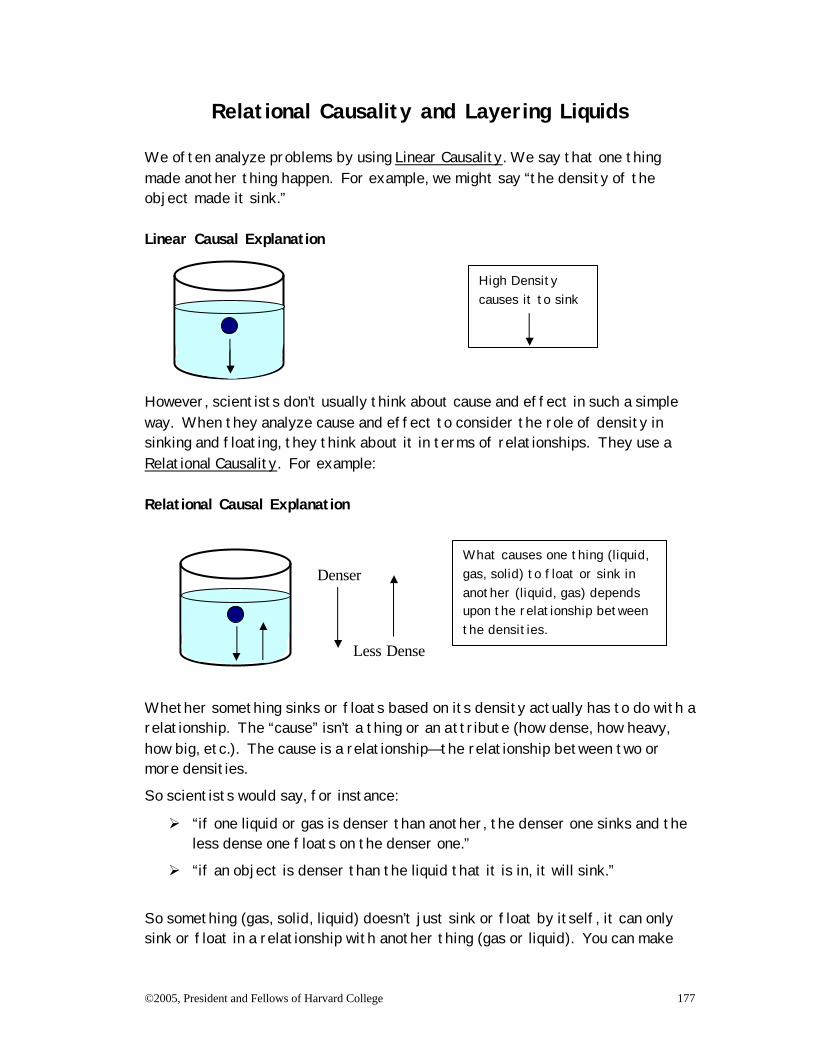
©2005, President and Fellows of Harvard College 177
Denser
Less Dense
Relational Causality and Layering Liquids We often analyze problems by using Linear Causality. We say that one thing made another thing happen. For example, we might say “the density of the object made it sink.” Linear Causal Explanation However, scientists don’t usually think about cause and effect in such a simple way. When they analyze cause and effect to consider the role of density in sinking and floating, they think about it in terms of relationships. They use a Relational Causality. For example: Relational Causal Explanation Whether something sinks or floats based on its density actually has to do with a relationship. The “cause” isn’t a thing or an attribute (how dense, how heavy, how big, etc.). The cause is a relationship—the relationship between two or more densities.
So scientists would say, for instance:
Ø “if one liquid or gas is denser than another, the denser one sinks and the less dense one floats on the denser one.”
Ø “if an object is denser than the liquid that it is in, it will sink.”
So something (gas, solid, liquid) doesn’t just sink or float by itself, it can only sink or float in a relationship with another thing (gas or liquid). You can make
High Density causes it to sink
What causes one thing (liquid, gas, solid) to float or sink in another (liquid, gas) depends upon the relationship between the densities.
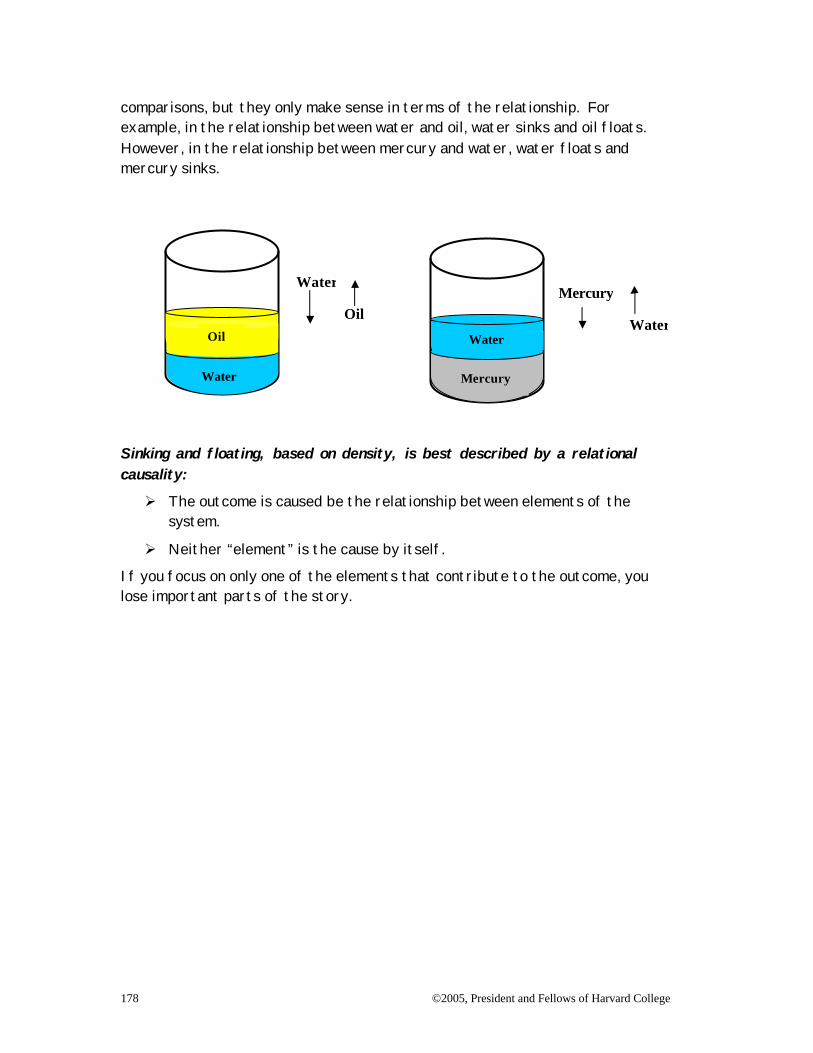
178 ©2005, President and Fellows of Harvard College
comparisons, but they only make sense in terms of the relationship. For example, in the relationship between water and oil, water sinks and oil floats. However, in the relationship between mercury and water, water floats and mercury sinks. Sinking and floating, based on density, is best described by a relational causality:
Ø The outcome is caused be the relationship between elements of the system.
Ø Neither “element” is the cause by itself.
If you focus on only one of the elements that contribute to the outcome, you lose important parts of the story.
Water Oil
Mercury Water
Mercury Water
Oil Water
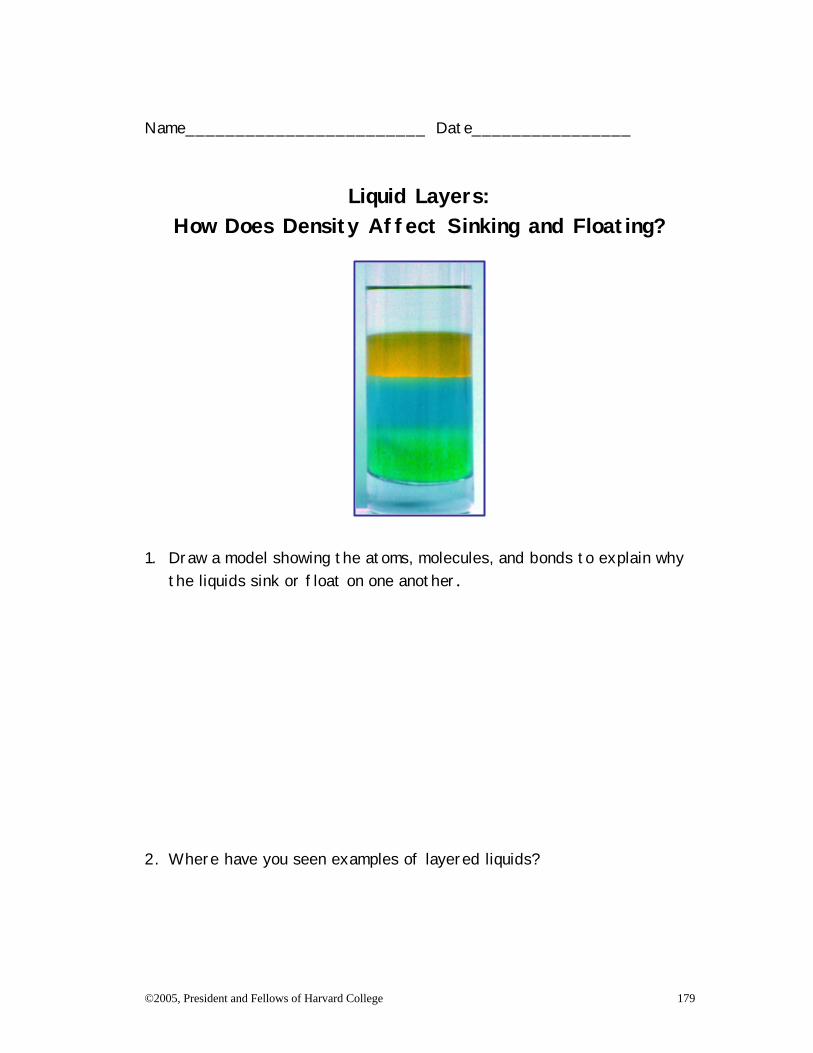
©2005, President and Fellows of Harvard College 179
Name________________________ Date________________
Liquid Layers: How Does Density Affect Sinking and Floating?
1. Draw a model showing the atoms, molecules, and bonds to explain why
the liquids sink or float on one another. 2. Where have you seen examples of layered liquids?
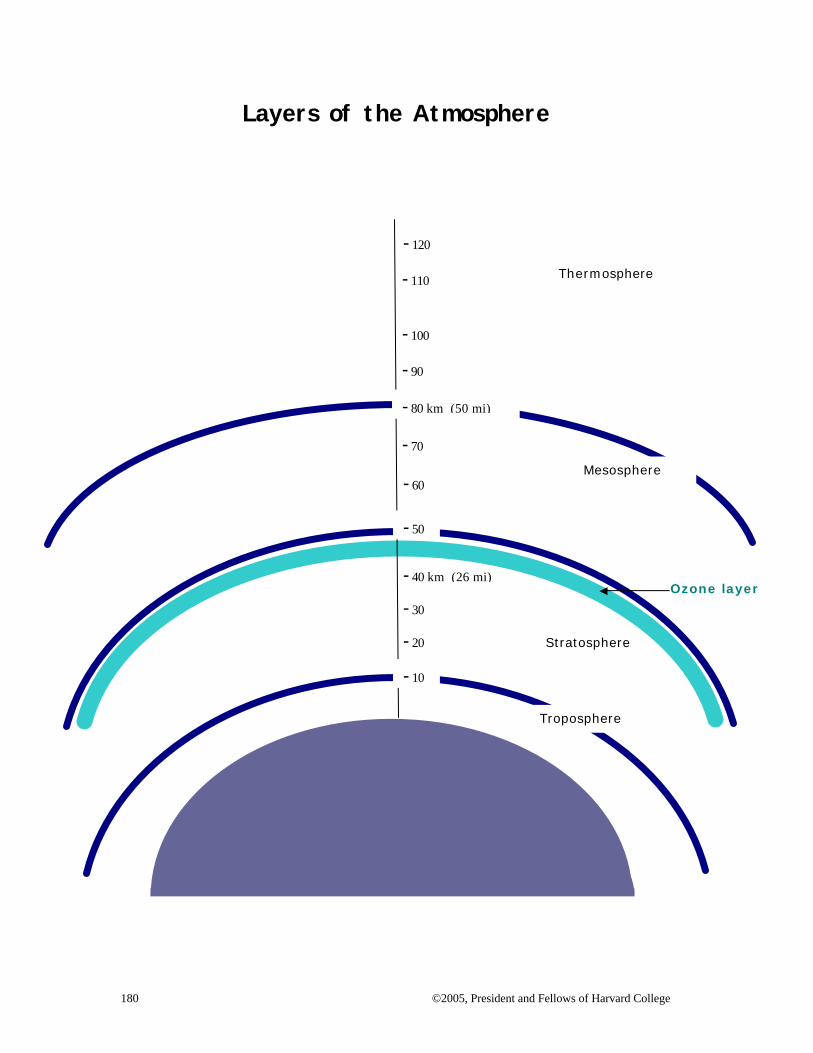
180 ©2005, President and Fellows of Harvard College
Layers of the Atmosphere
-40 km (26 mi)
Stratosphere
Ozone layer
-30
-20
-60
-70
-90
-100
-110
-120
Thermosphere
-50
-80 km (50 mi)
-10
Troposphere
Mesosphere
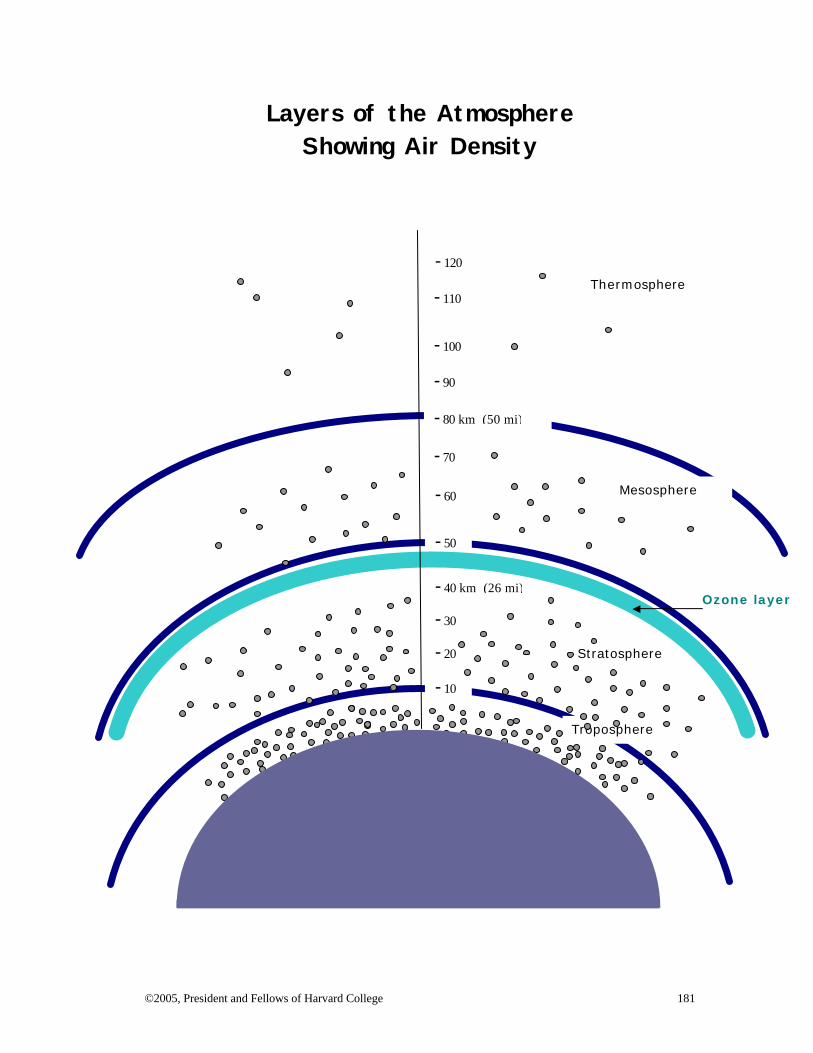
©2005, President and Fellows of Harvard College 181
Layers of the Atmosphere Showing Air Density
Stratosphere
-40 km (26 mi) Ozone layer
Mesosphere
Thermosphere
Troposphere
-10
-30
-20
-50
-60
-70
-80 km (50 mi)
-90
-100
-110
-120
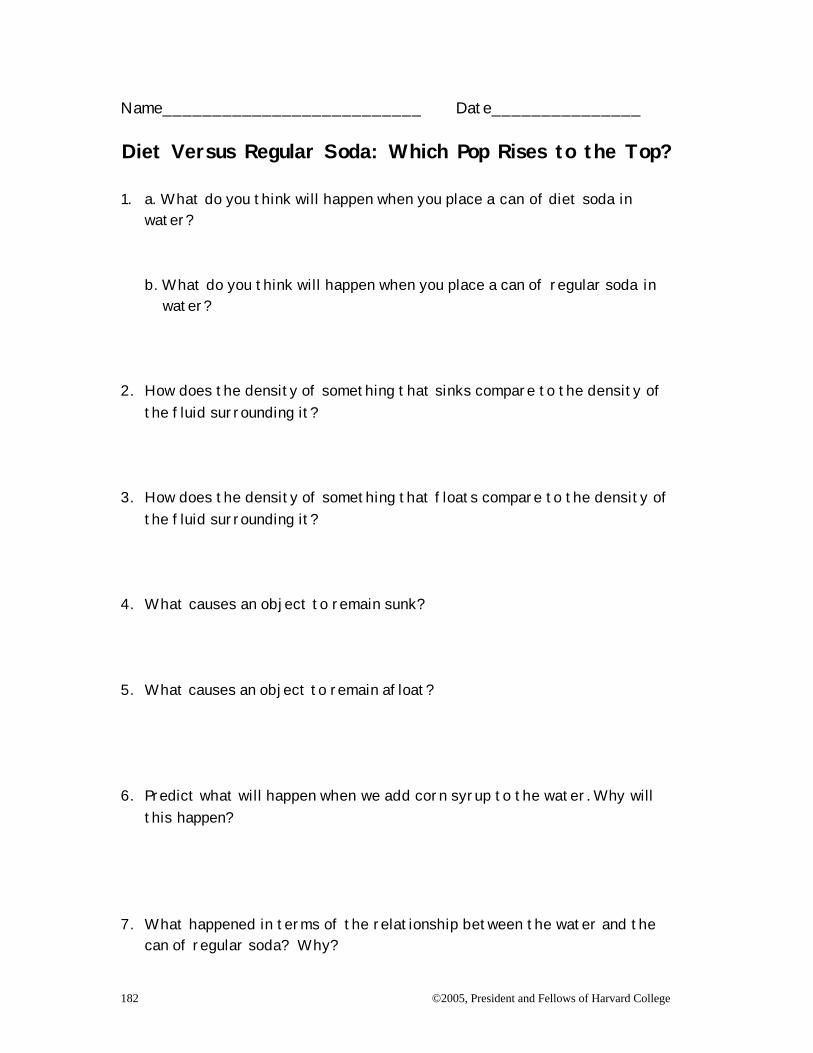
182 ©2005, President and Fellows of Harvard College
Name__________________________ Date_______________
Diet Versus Regular Soda: Which Pop Rises to the Top? 1. a. What do you think will happen when you place a can of diet soda in
water?
b. What do you think will happen when you place a can of regular soda in water?
2. How does the density of something that sinks compare to the density of
the fluid surrounding it? 3. How does the density of something that floats compare to the density of
the fluid surrounding it? 4. What causes an object to remain sunk? 5. What causes an object to remain afloat? 6. Predict what will happen when we add corn syrup to the water. Why will
this happen? 7. What happened in terms of the relationship between the water and the
can of regular soda? Why?
©2005, President and Fellows of Harvard College 183
Name__________________________ Date___________
Analyzing an Analogy: Galileo’s Thermometer In this lesson, you observed a Galileo's thermometer. Think about how the Galileo's thermometer works compared to how the soda can activity that we did worked. What is similar about the two experiments? What is different? Draw a diagram and write a paragraph to explain your reasoning. Try to think beyond surface-level explanations (i.e. “one is a tube, and one is a can of Pepsi”) to a deeper level of comparison (i.e. “explain why it happens”).
184 ©2005, President and Fellows of Harvard College
Name_____________________________ Date__________
Making Connections With Density 1. Is your overall density (the density of your body) the same as or
different from the density of water? If it is not the same, is it more or less? How do you know?
2. Think of a toy that is designed to have a density that is greater than
water. Why is it designed that way? 3. Think of a toy that is designed to have a density that is less than water.
Why is it designed that way? 4. How do submarines use relative density in order to work?
5. How do fish use relative density in order to move about freely in the water? What would happen if a fish always had a density less than water or greater than water?