Embed Size (px)
Citation preview
Causal learning and modeling
David DanksCMU Philosophy & Psychology
2014 NASSLLI
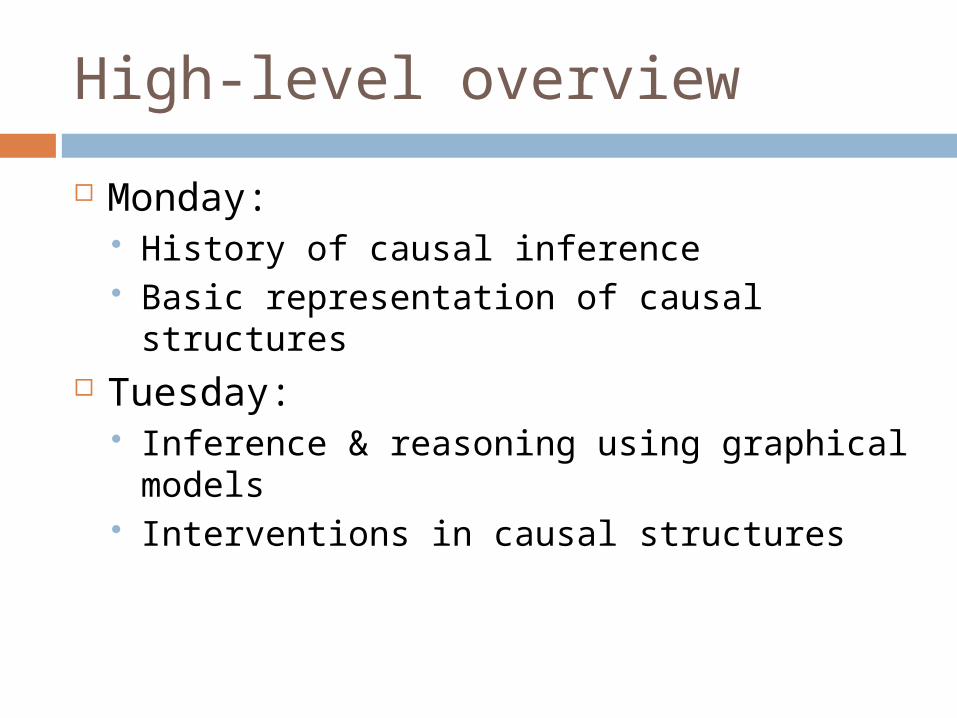
High-level overview
Monday: History of causal inference Basic representation of causal structures
Tuesday: Inference & reasoning using graphical
models Interventions in causal structures
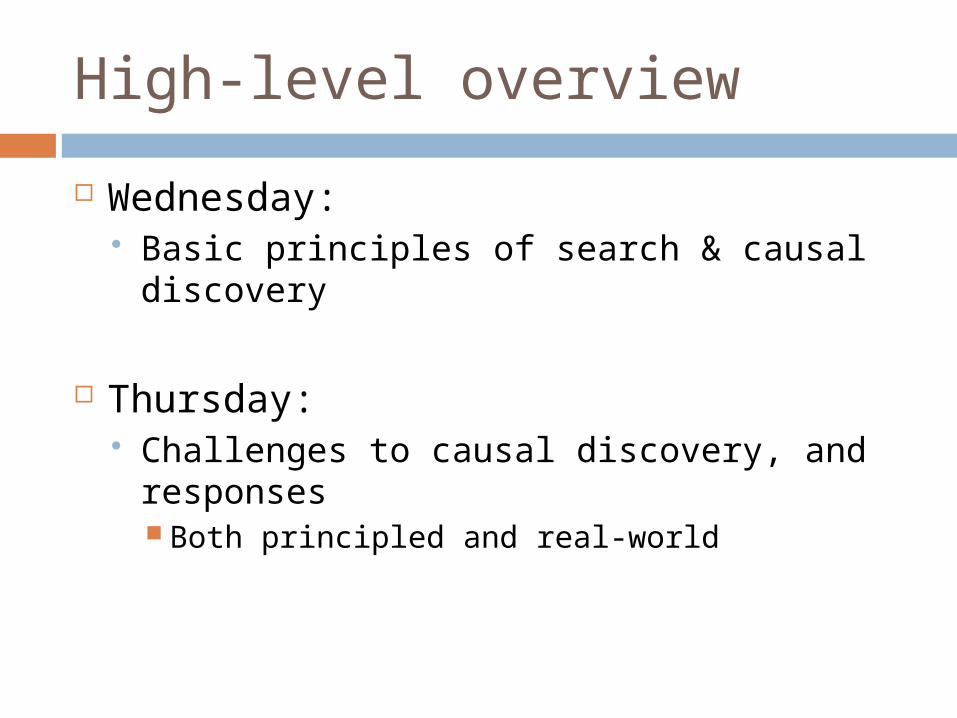
High-level overview
Wednesday: Basic principles of search & causal
discovery
Thursday: Challenges to causal discovery, and
responses Both principled and real-world
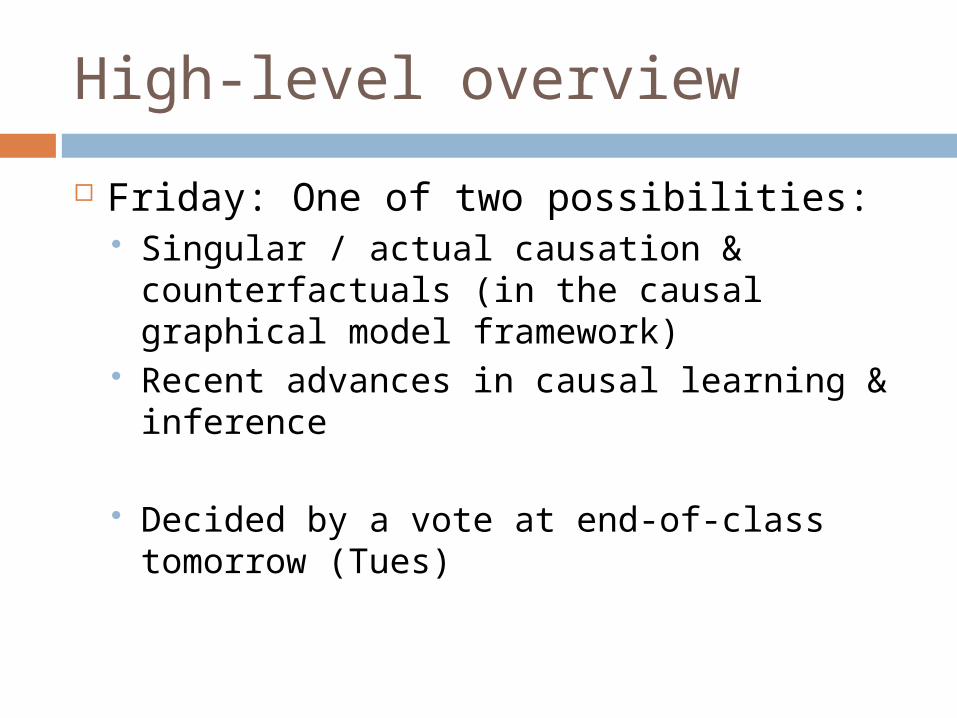
High-level overview
Friday: One of two possibilities: Singular / actual causation &
counterfactuals (in the causal graphical model framework)
Recent advances in causal learning & inference
Decided by a vote at end-of-class tomorrow (Tues)
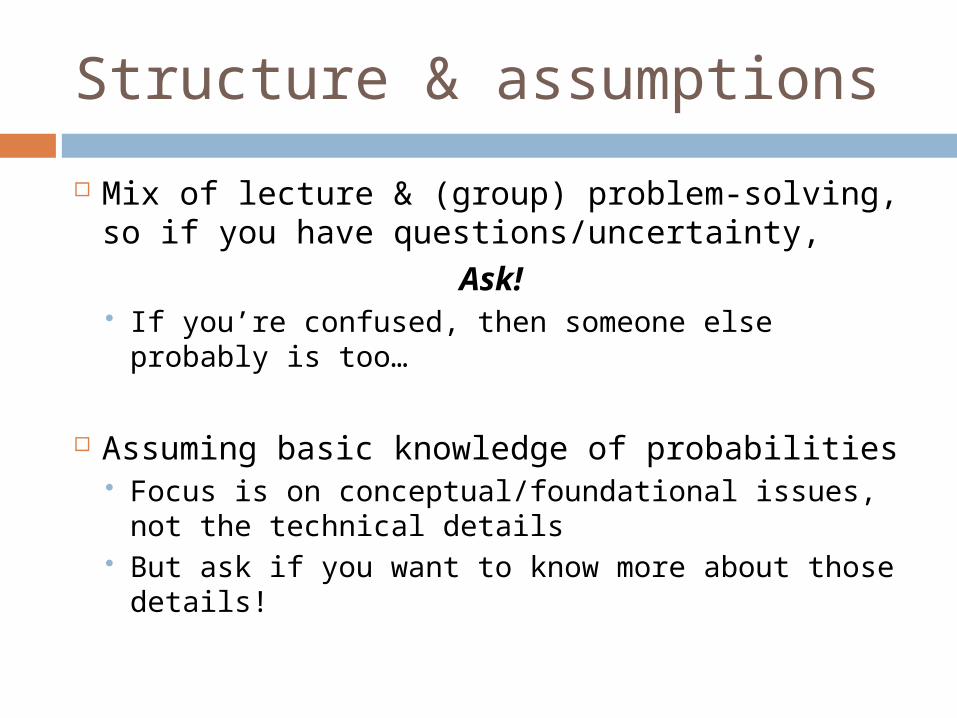
Structure & assumptions
Mix of lecture & (group) problem-solving, so if you have questions/uncertainty,
Ask! If you’re confused, then someone else probably
is too…
Assuming basic knowledge of probabilities Focus is on conceptual/foundational issues, not
the technical details But ask if you want to know more about those
details!
A Brief History of Causal Discovery
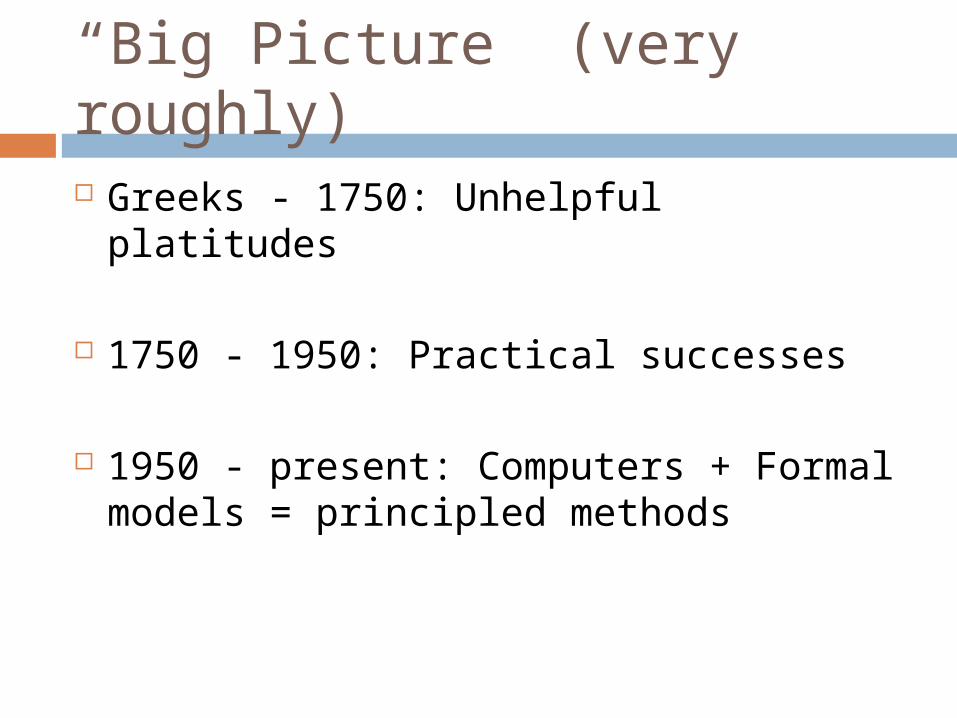
“Big Picture” (very roughly)
Greeks - 1750: Unhelpful platitudes
1750 - 1950: Practical successes
1950 - present: Computers + Formal models = principled methods
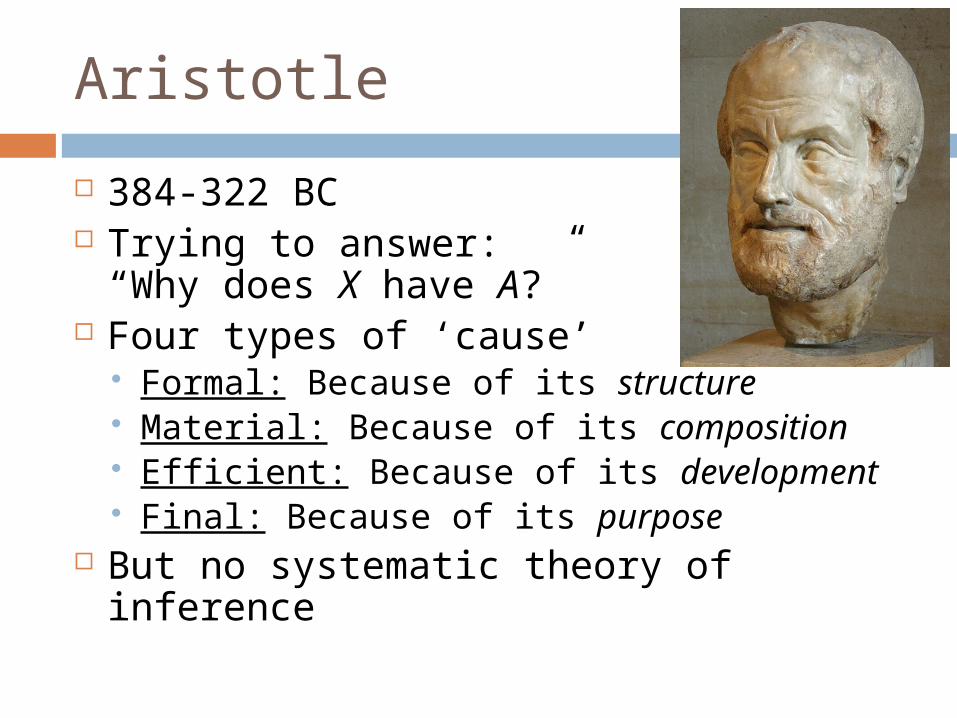
Aristotle
384-322 BC Trying to answer:
“Why does X have A?” Four types of ‘cause’
Formal: Because of its structure Material: Because of its composition Efficient: Because of its development Final: Because of its purpose
But no systematic theory of inference
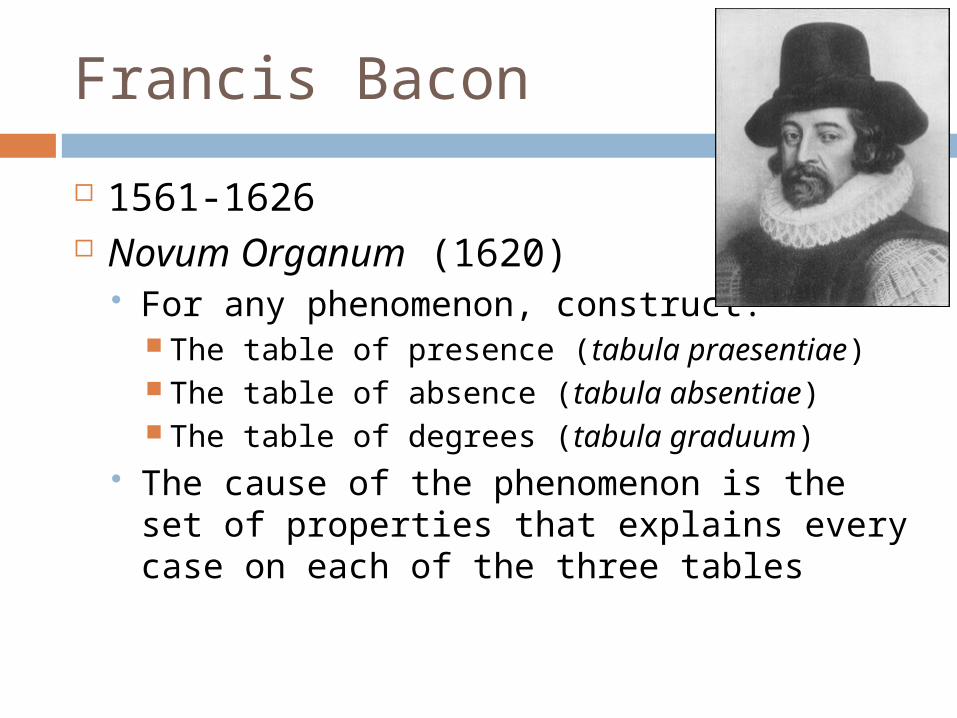
Francis Bacon
1561-1626 Novum Organum (1620)
For any phenomenon, construct: The table of presence (tabula praesentiae) The table of absence (tabula absentiae) The table of degrees (tabula graduum)
The cause of the phenomenon is the set of properties that explains every case on each of the three tables
John Stuart Mill
1806-1873 System of Logic (1843)
Algorithmic form of Bacon’s method (though unattributed) Method of agreement Method of difference Method of concomitant variation
David Hume
1711-1776 Causal inference cannot be
done using deduction It is always logically possible that future
“causes” will not be followed by the effect Actually a general argument about
induction But we do it by “custom or habit”
Had an evolutionary justification, but no framework in which to express it
Responses to Hume’s skepticism Hume’s arguments were quite influential
in philosophical circles And still matter in present-day philosophy
But in the sciences, people were starting to find methods that (sometimes) gave answers that at least seemed right…
Regression (Least Squares)
18th c. astronomy: find the “best” values for 6 unknowns given 75 observations Euler (1748)
Failed due to computational intractability Legendre (1805)
Developed the method of least squares Gauss (1795 / 1809)
Independent (earlier, unpublished) discovery & justification
Still the most common causal inference method…
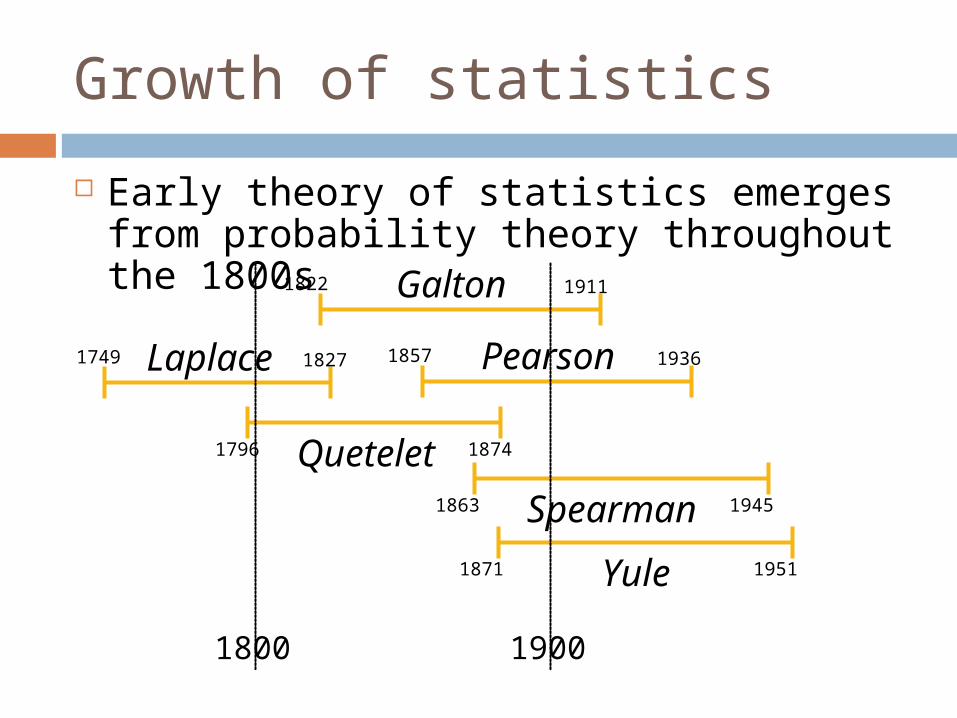
Growth of statistics
Early theory of statistics emerges from probability theory throughout the 1800s
Laplace1749 1827
Quetelet1796 1874
Galton1822 1911
Pearson1857 1936
Spearman1863 1945
Yule1871 1951
1800 1900
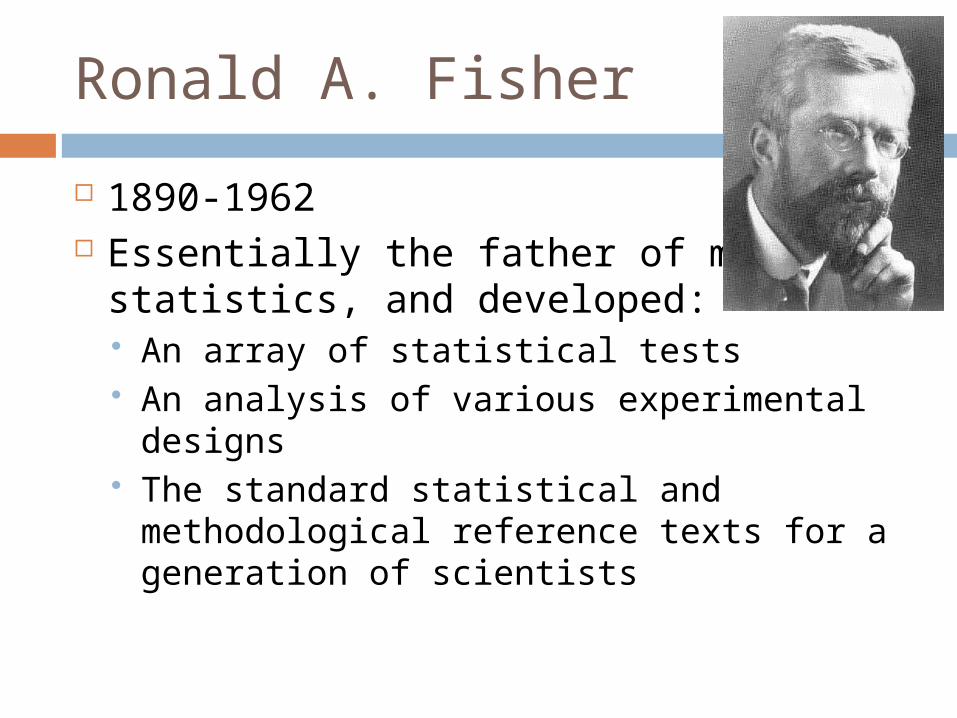
Ronald A. Fisher
1890-1962 Essentially the father of modern
statistics, and developed: An array of statistical tests An analysis of various experimental designs The standard statistical and methodological
reference texts for a generation of scientists
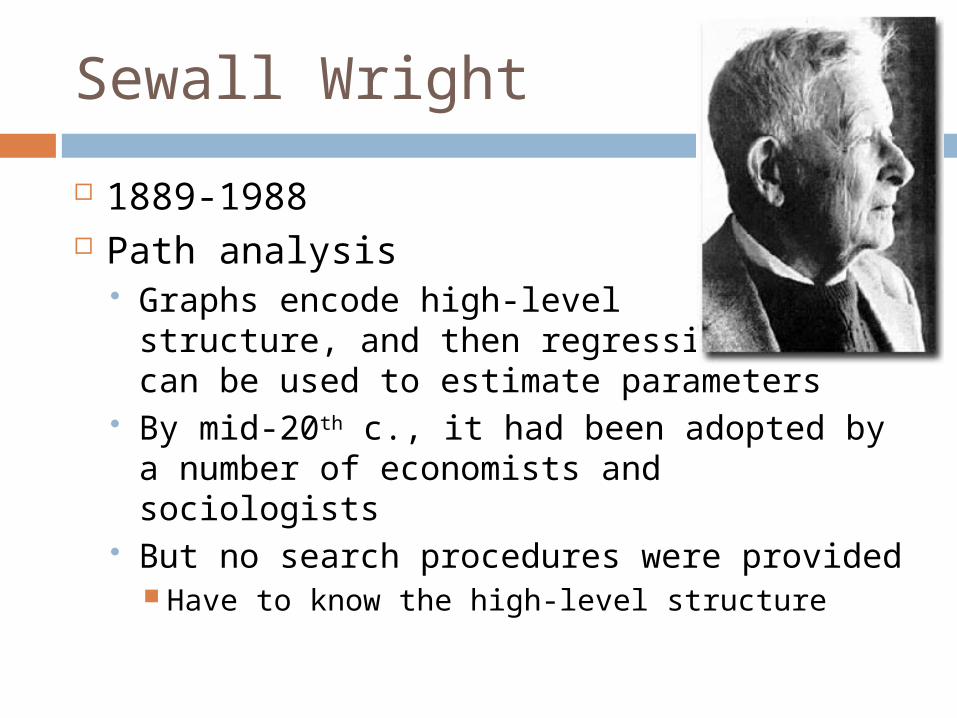
Sewall Wright
1889-1988 Path analysis
Graphs encode high-levelstructure, and then regressioncan be used to estimate parameters
By mid-20th c., it had been adopted by a number of economists and sociologists
But no search procedures were provided Have to know the high-level structure
Causal graphical models
Developed by statisticians, computer scientists, and philosophers Dawid, Spiegelhalter, Wermuth, Cox,
Lauritzen, Pearl, Spirtes, Glymour, Scheines Represent both qualitative and
quantitative aspects of causation
Representing Causal Structures
Qualitative representation
We want a representation that captures many qualitative features of causality
Qualitative representation
We want a representation that captures many qualitative features of causality Causation occurs among variables ⇒
One node per variable
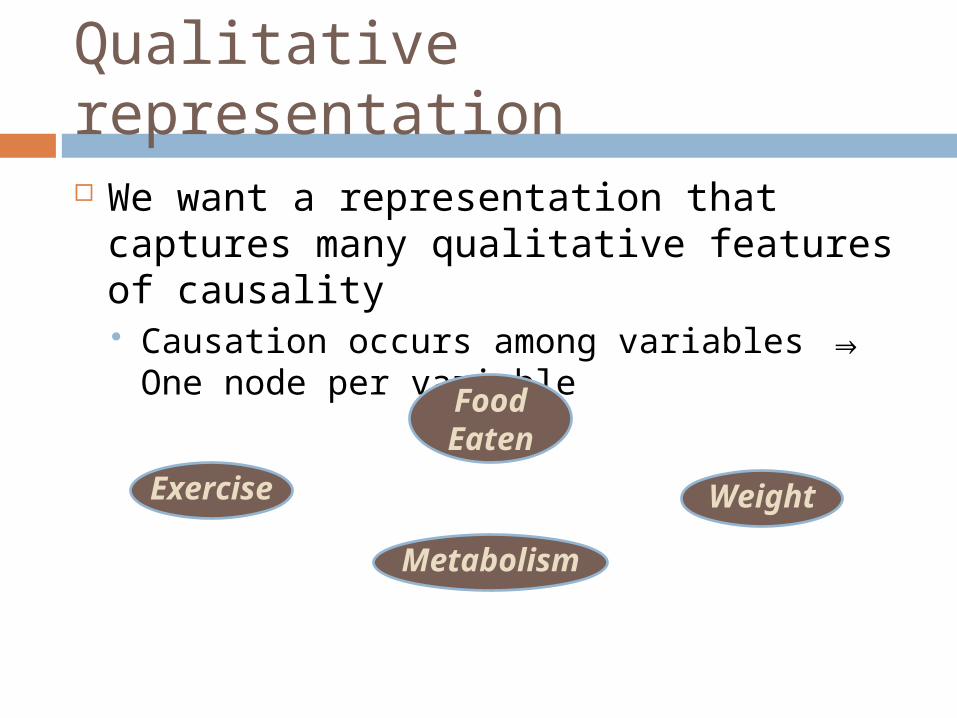
Qualitative representation
We want a representation that captures many qualitative features of causality Causation occurs among variables ⇒
One node per variable
Exercise
FoodEaten
Weight
Metabolism
Qualitative representation
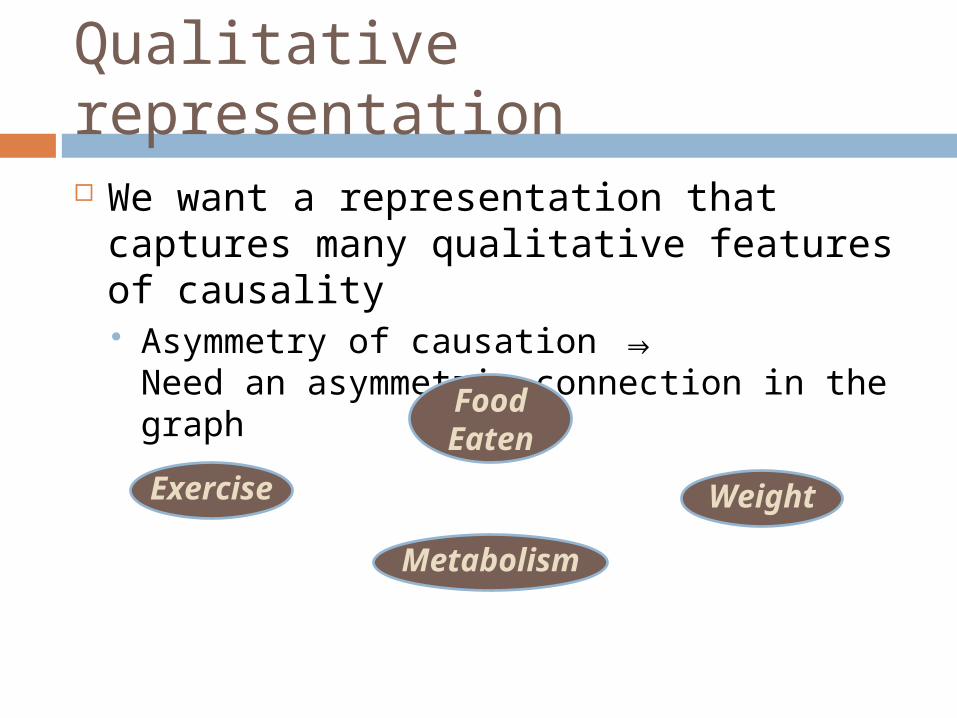
We want a representation that captures many qualitative features of causality Asymmetry of causation ⇒
Need an asymmetric connection in the graph
Exercise
FoodEaten
Weight
Metabolism
Qualitative representation
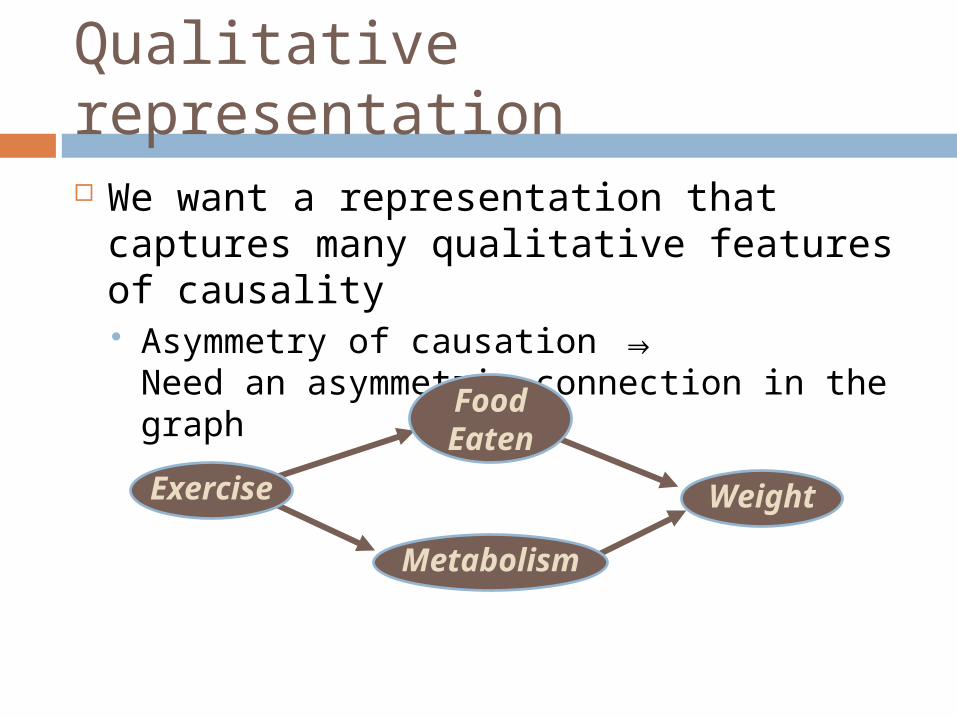
We want a representation that captures many qualitative features of causality Asymmetry of causation ⇒
Need an asymmetric connection in the graph
Exercise
FoodEaten
Weight
Metabolism
Qualitative representation
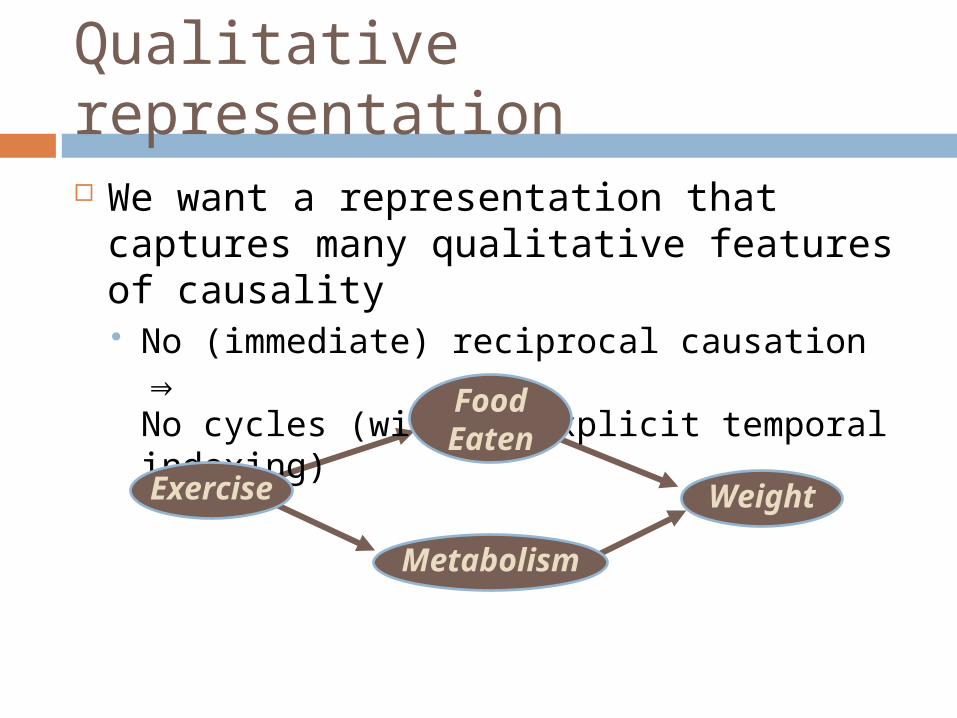
We want a representation that captures many qualitative features of causality No (immediate) reciprocal causation ⇒
No cycles (without explicit temporal indexing)
Exercise
FoodEaten
Weight
Metabolism
Qualitative representation
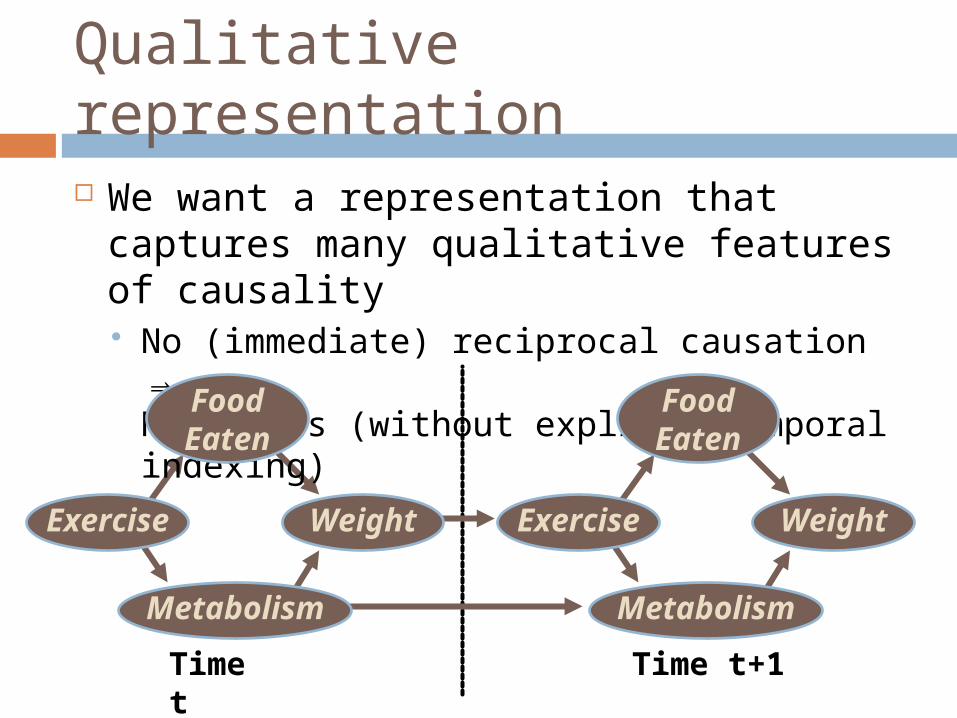
We want a representation that captures many qualitative features of causality No (immediate) reciprocal causation ⇒
No cycles (without explicit temporal indexing)
Exercise
FoodEaten
Weight
Metabolism
Exercise
FoodEaten
Weight
Metabolism
Time t Time t+1
Directed Acyclic Graphs
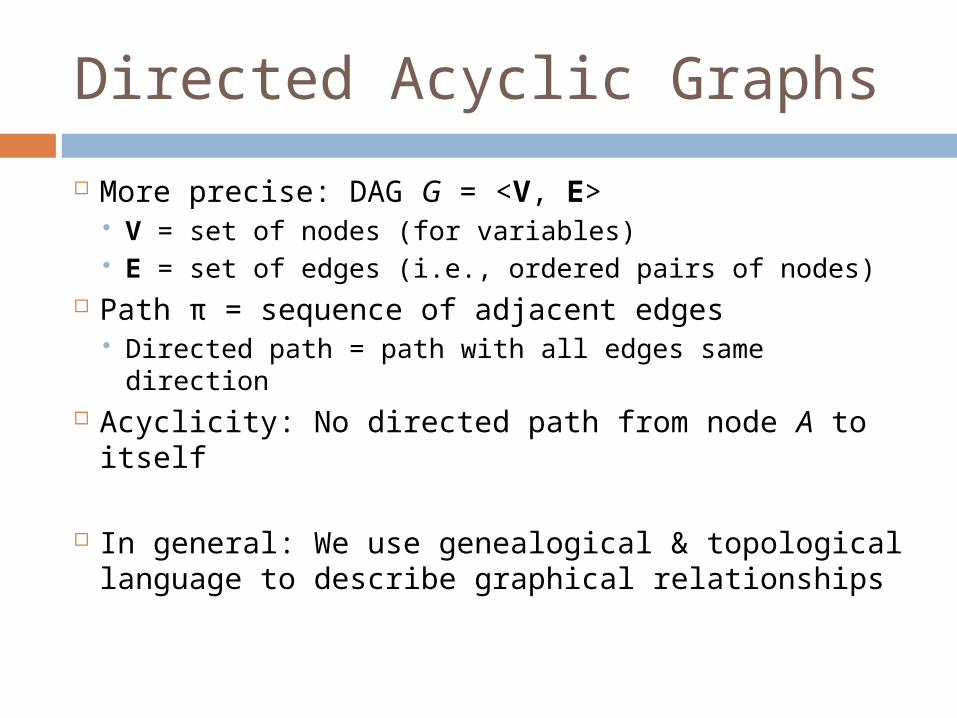
More precise: DAG G = <V, E> V = set of nodes (for variables) E = set of edges (i.e., ordered pairs of nodes)
Path π = sequence of adjacent edges Directed path = path with all edges same direction
Acyclicity: No directed path from node A to itself
In general: We use genealogical & topological language to describe graphical relationships
Quantitative representation
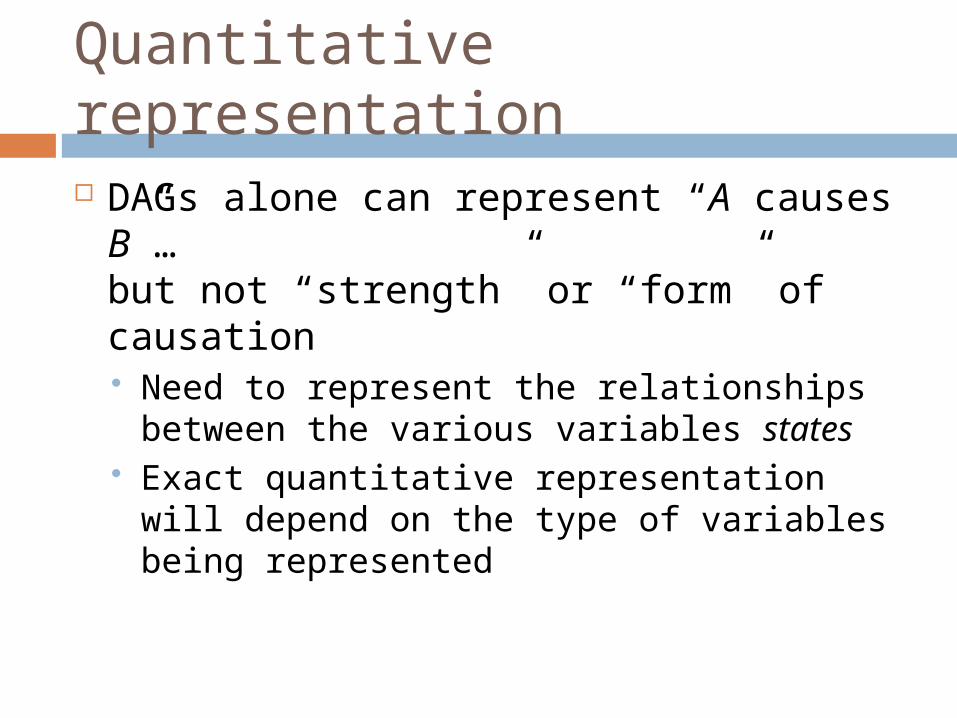
DAGs alone can represent “A causes B”…but not “strength” or “form” of causation Need to represent the relationships
between the various variables states Exact quantitative representation will
depend on the type of variables being represented
Bayesian networks
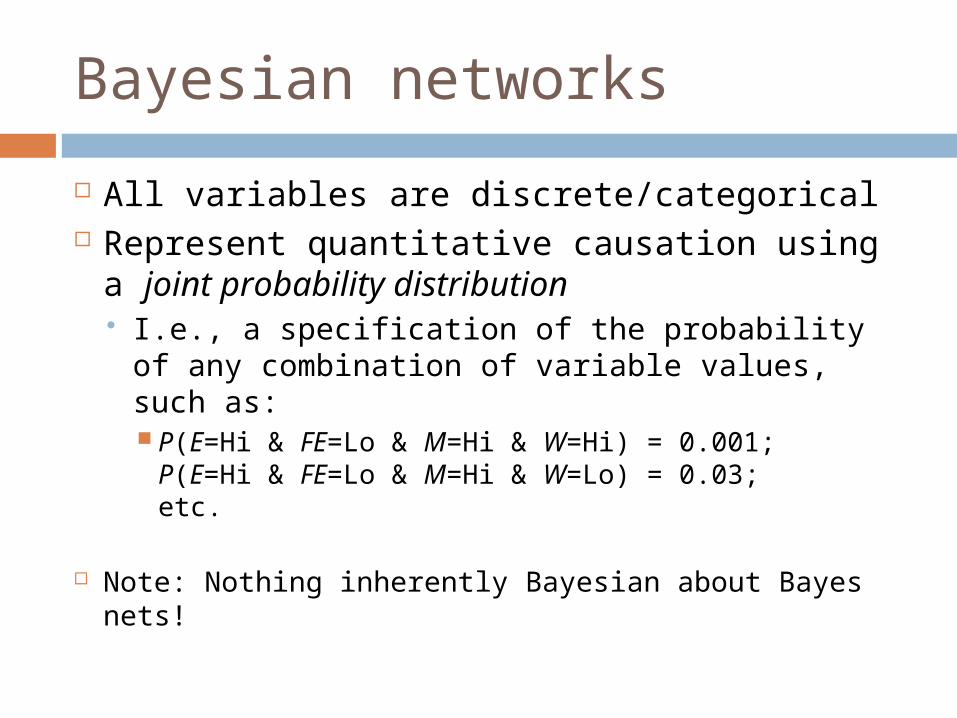
All variables are discrete/categorical Represent quantitative causation using a
joint probability distribution I.e., a specification of the probability of any
combination of variable values, such as: P(E=Hi & FE=Lo & M=Hi & W=Hi) = 0.001;
P(E=Hi & FE=Lo & M=Hi & W=Lo) = 0.03;etc.
Note: Nothing inherently Bayesian about Bayes nets!
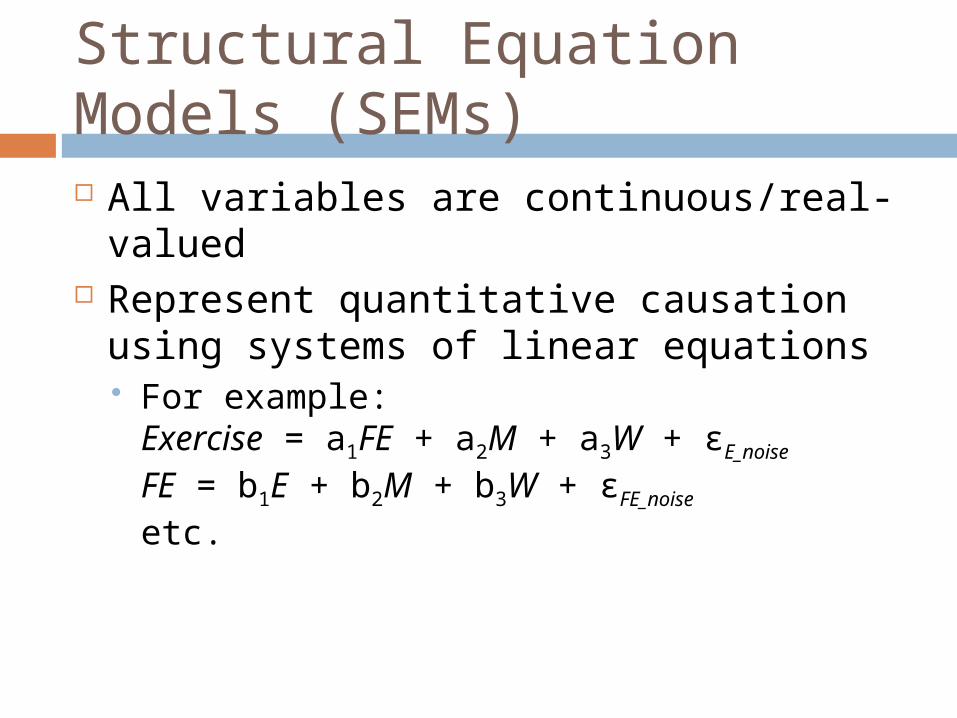
Structural Equation Models (SEMs) All variables are continuous/real-valued Represent quantitative causation using
systems of linear equations For example:
Exercise = a1FE + a2M + a3W + εE_noise
FE = b1E + b2M + b3W + εFE_noise
etc.
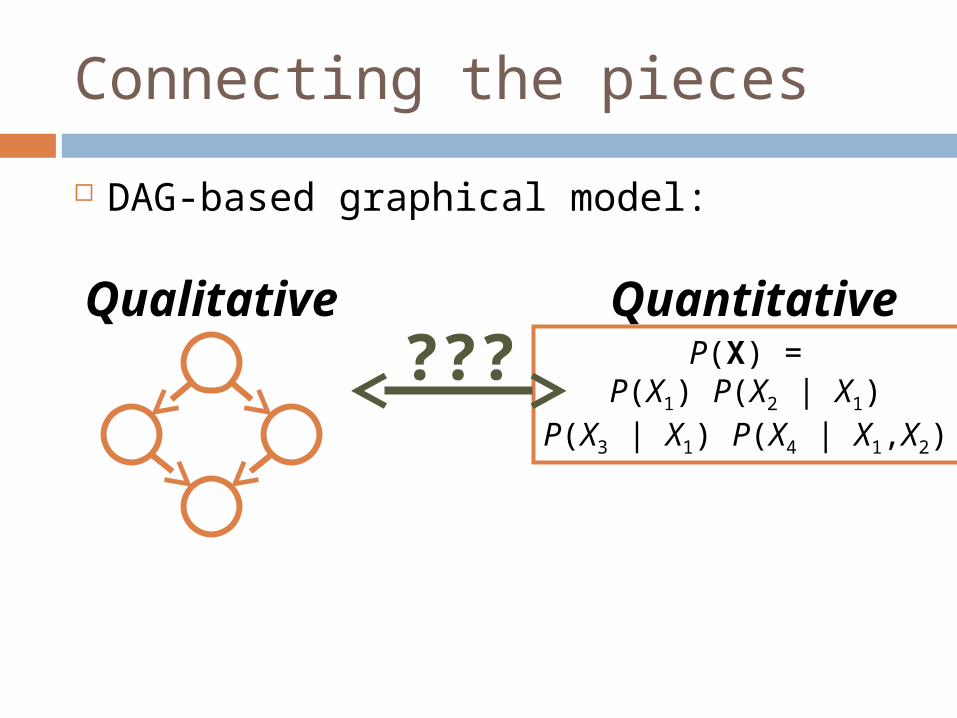
Connecting the pieces
DAG-based graphical model:
P(X) = P(X1) P(X2 | X1)
P(X3 | X1) P(X4 | X1,X2)
QuantitativeQualitative???
Connecting the pieces
Causal Markov assumption: Variables are independent of their non-
effects conditional on their direct causes Use the qualitative graph to constrain the
quantitative relationships
Encodes the intuition of “screening off” Given the values of the direct causes, learning
the value of a non-effect doesn’t help me predict
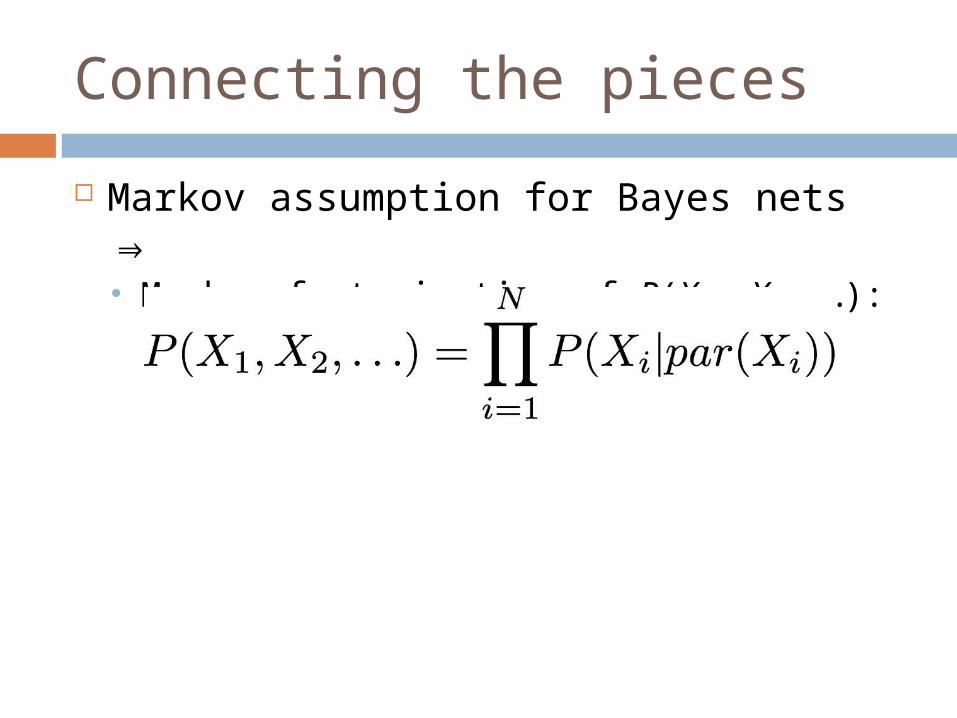
Connecting the pieces
Markov assumption for Bayes nets ⇒ Markov factorization of P(X1, X2, …):
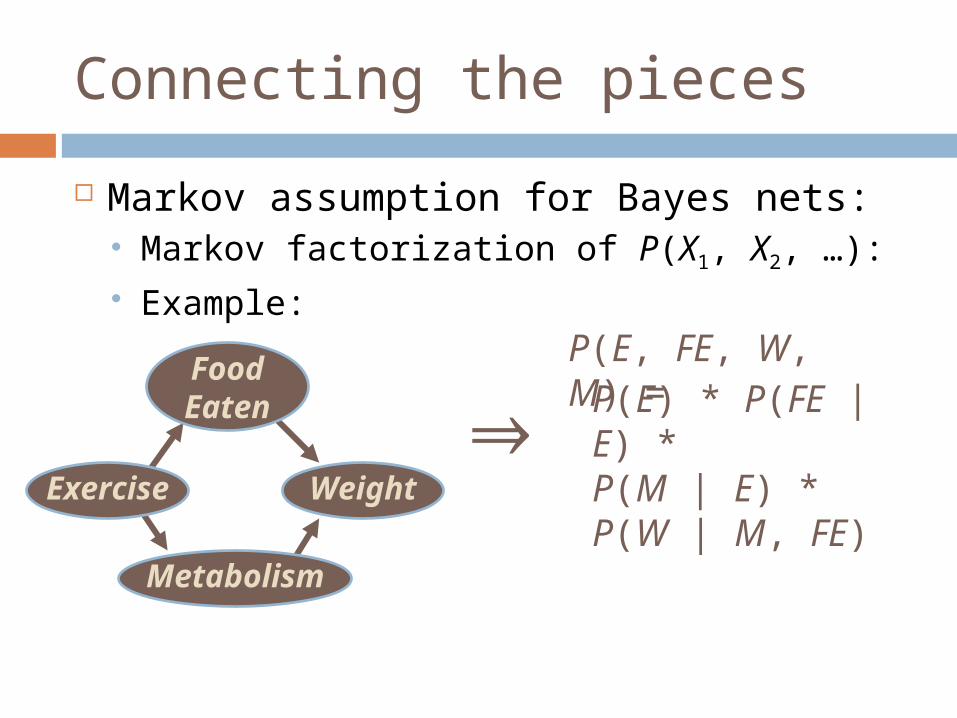
Connecting the pieces
Markov assumption for Bayes nets: Markov factorization of P(X1, X2, …): Example:
Exercise
FoodEaten
Weight
Metabolism
P(E, FE, W, M) = P(E) * P(FE | E) *P(M | E) * P(W | M, FE)
⇒
Connecting the pieces
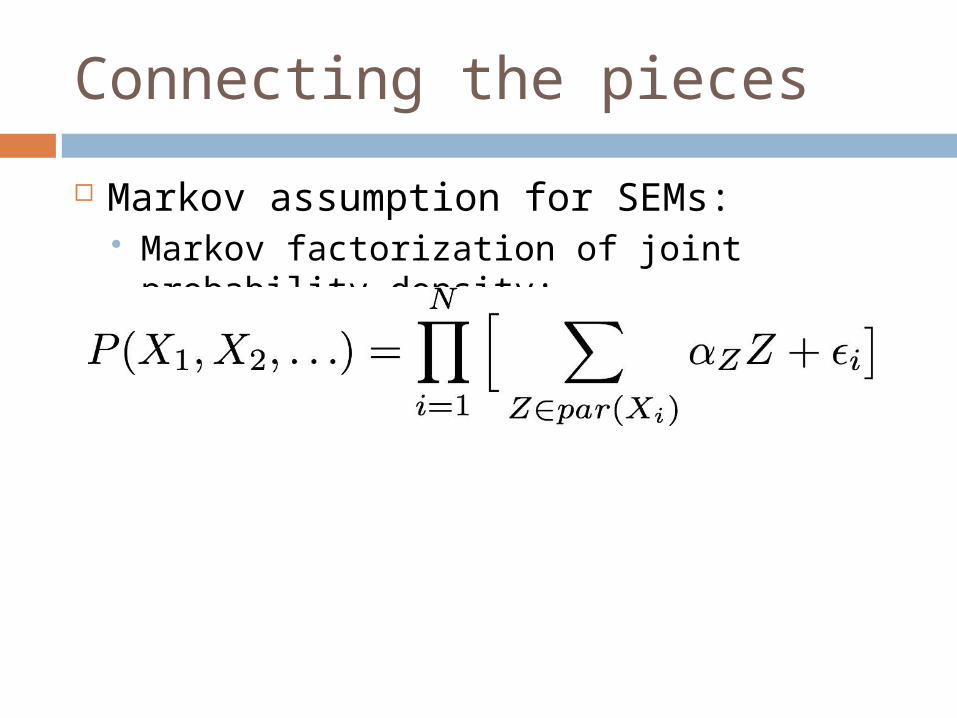
Markov assumption for SEMs: Markov factorization of joint probability
density:
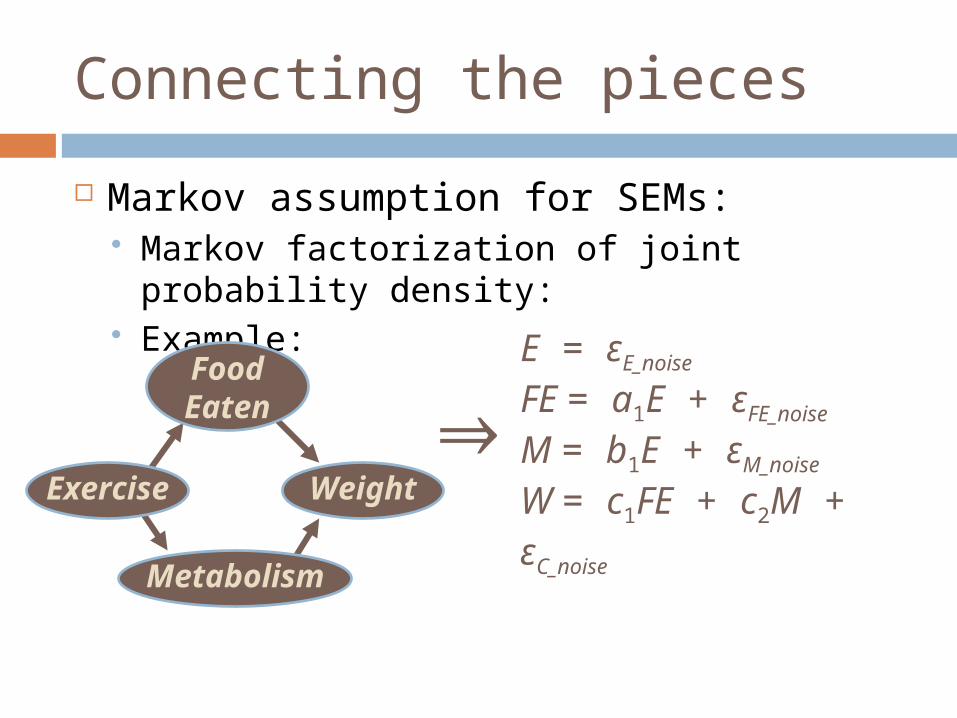
Connecting the pieces
Markov assumption for SEMs: Markov factorization of joint probability
density: Example:
Exercise
FoodEaten
Weight
Metabolism
E = εE_noise
FE = a1E + εFE_noise
M = b1E + εM_noise
W = c1FE + c2M + εC_noise
⇒
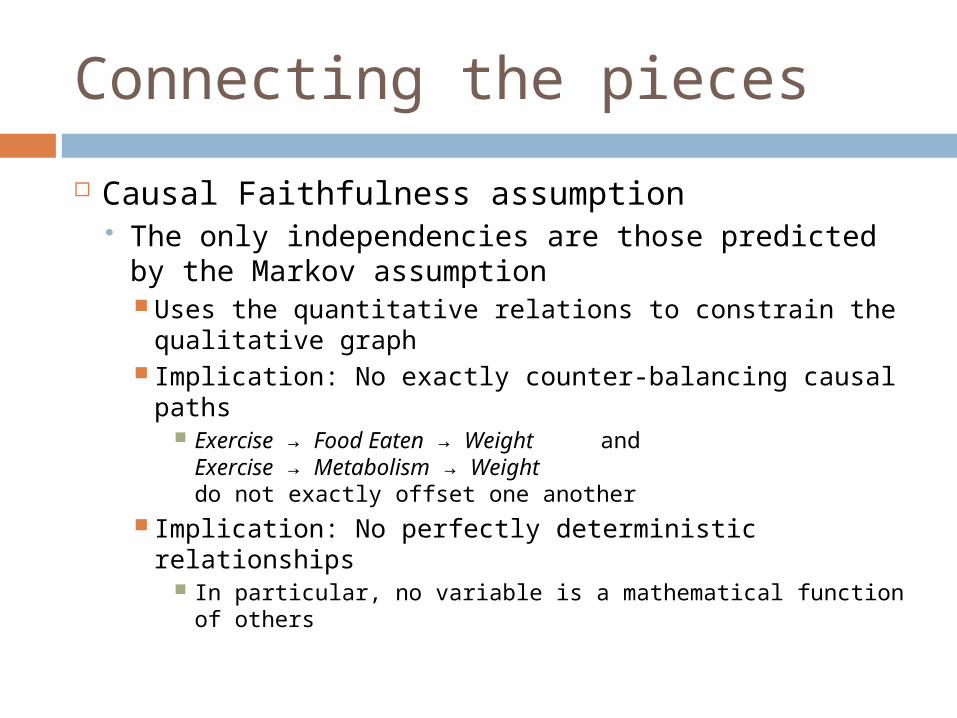
Connecting the pieces
Causal Faithfulness assumption The only independencies are those predicted by
the Markov assumption Uses the quantitative relations to constrain the
qualitative graph Implication: No exactly counter-balancing causal
paths Exercise → Food Eaten → Weight and
Exercise → Metabolism → Weightdo not exactly offset one another
Implication: No perfectly deterministic relationships In particular, no variable is a mathematical function of
others
Causal vs. statistical models
Bayes nets and SEMs are not inherently causal models Markov and Faithfulness assumptions can
be expressed purely as graph-quant. constraints
Assuming a non-causal version of the assumptions ⇒ purely statistical model I.e., a compact representation of statistical
independencies among some set of variables
Causation and intervention
Causal claims support counterfactuals In particular, those about interventions
“If I had flipped the switch, the light would have turned on”
“If she hadn’t dropped the plate, then it would not have broken”
Etc.
Causation and intervention
One of the central causal asymmetries Interventions on a cause lead to changes in the
effect Flipping the switch turns off the light
In contrast, interventions on an effect do not lead to changes in the cause Breaking the light bulb doesn’t flip the switch
Some have argued that this is the paradigmatic feature of causation (Woodward, Hausman)
Looking ahead…
Have: Basic formal representation for causation
Need: Fundamental causal asymmetry (of
intervention) Inference & reasoning methods Search & causal discovery methods
Looking ahead…
Have: Basic formal representation for causation
Need: Fundamental causal asymmetry (of
intervention) Inference & reasoning methods Search & causal discovery methods