Embed Size (px)
Citation preview

University of Nebraska at Omaha University of Nebraska at Omaha
DigitalCommons@UNO DigitalCommons@UNO
Publications Archives, 1963-2000 Center for Public Affairs Research
3-1988
CAUR Focus, Vol. 01, No. 01 CAUR Focus, Vol. 01, No. 01
Center for Public Affairs Research (CPAR) University of Nebraska at Omaha
Follow this and additional works at: https://digitalcommons.unomaha.edu/cparpubarchives
Part of the Demography, Population, and Ecology Commons, and the Public Affairs Commons
Recommended Citation Recommended Citation (CPAR), Center for Public Affairs Research, "CAUR Focus, Vol. 01, No. 01" (1988). Publications Archives, 1963-2000. 394. https://digitalcommons.unomaha.edu/cparpubarchives/394
This Article is brought to you for free and open access by the Center for Public Affairs Research at DigitalCommons@UNO. It has been accepted for inclusion in Publications Archives, 1963-2000 by an authorized administrator of DigitalCommons@UNO. For more information, please contact [email protected].

CENTER FOR APPLIED URBAN RESEARCH
ECONOMIC DEVELOPMENT TARGETING DATA BASE by Jerome A. Deichert
Introduction
Local and state economic development practitioners recently have begun to realize that programs and activities must be targeted. A major problem facing communities and other organizations working on economic development is determining how to use limited resources to ensure the highest return • in reaching local economic development goals. A targeted program focuses on the economic activities that are most likely to be successful for an area. Targeting can help stretch limited staff, time, and money.
How should economic development efforts be targeted? Ideally, targeting should be driven by information on industry and business performance trends, local and state competitive advantages, and local and regional economic development goals. A set of high-performance industries (highperformance could be defined in many ways) should be screened for compatibility with local competitive advantages, available resources, and goals . These industries and business areas that make it through the screening process become candidates for various economic development programs, including recruitment of new businesses, retention and expansion of existing businesses, or start-up of new businesses.
The Targeting Data Base
The Center for Applied Urban Research at the Univers ity of Nebraska at Omaha has developed an Economic Development Targeting Data Base to as sist Nebraska's local and regional development groups in targeting their
economic development efforts. The data base is founded upon one indicator of industry performance--employment growth. An examination of local growth trends is insufficient to assess industry performance . The long-term prospects of any local industry are influenced by the economic well-being of that industry nationally. Therefore, this study also considers national and regional trends to better assess industry performance.
Data are provided for the United States, the West North Central Region (comprised of Iowa, Kansas, Minnesota, Missouri, Nebraska, North Dakota, and South Dakota), and Nebraska individually. The data base draws from two sources . The source for data about national and regional employment is County Business Patterns. Although County Business Patterns provides comparable data that are easy to obtain, data about many industries in Nebraska are suppres sed because of the small number of firms. Therefore, Nebraska's employment data were obtained from the Nebraska Department of Labor.
Employment totals generally were reported for all four-digit Standard Industrial Class ification (SIC) codes, although
ABOUT THE AUTHOR
Jerry Deichert is a senior research associate at CAUR and a member of the governor's Economic Forecasting Advisory Doard. His interes t in economic and demographic issues in Nebraska has resulted in numerous published articles.

2
sometimes it was necessary to report data at the three-digit level to retain consistency between the two sources.
County Business Patterns does not include all employment; it excludes government employees, railroad employees, and selfemployed persons. In addition, agricultural services, fore stry, and fisheries; mmmg; contract construction; and certain areas of transportation and public utilities were excluded selectively from the data base. It should be emphasized that the data in the tables represent private employment. Therefore, data on employment in industries that contain both public and private components (predominantly service industries) consist only of private employment. This especially is true for schools and educational services, social services, hospitals, and some other health services.
Contents of the Data Base
The data bas e cons ists of six main files (tables) , each containing the same information but sorted. differently. Only industries that added employees at the national level between 1977 and 1984 are included in the files. The files are available on diskette or in printed form. This article describes the targeting data base by examining portions of two tables.
The firs t column of each table contains the SIC code, followed by a brief description of the industry. The third column consists of a three letter abbreviation of the broad industrial category. The next three columns present the percentage changes in employment between 1977 and 1984 for the United States, West North Central Region, and Nebraska. If an industry had no employees in 1977 but reported employees in 1984, the industry arbitrarily was assigned an increase of 100.0 percent.
The seventh column indicates the size of the industry in Nebraska in 1984. Nebraska's employment is represented by letters corresponding to a range of employees, to prevent dis closure of any confidential information.
The last two columns contain location quotients for Nebraska. Location quotients can be used to identify communities' possible competitive advantages. Indus try targeting involves more than performance as sessment; it should identify the industries that will take advantage of a community' s competitive advantages .
A location quotient compares an industry' s share of tota l employment in Nebraska with that indus try's share of either national or
regional employment. Location quotients can be used to identify industries that bring dollars and jobs into an area. When an industry's local share exceeds the national average, a portion of that industry's employment may be considered export employment and may indicate a comparative advantage that should be exploited. When an industry's local share falls below the national average, that industry may rely on imports into the state, and is a potential candidate for import substitution.
Location quotients are calculated by dividing the percentage of individuals employed locally in a particular industry by the percentage of individuals employed nationally in the same industry. For example, if an industry represents 1 percent of Nebraska's employment and 2 percent of U.S. employment, the location quotient is .. 50 (1/2). On the other hand, if an industry represents 2 percent of Nebraska's employment and 1 percent of national employment, the location quotient becomes 2.0 (2/1).
If the location quotient is larger than 1, the industry may be considered one with export potential; but, if the location quotient is smaller than one, the industry most likely is underrepresented in Nebraska and is not meeting local needs . Obviously, the location quotient lacks sufficient precision to say that a value of 1 is a clear dividing line. Other authors have suggested that a location quotient should exceed 1.25 to indicate export ac tivity. They also suggest a value of . 7 5 to indicate that an industry is not meeting local needs .
Table 1 lists 25 industries with the fastest ra tes of employment growth nationally. The following example will show how to use the data base. Look at SIC code 7392, management and public relations services. Table 1 shows that this is a service industry that has increas ed 93.0 percent nationally, 82.4 percent regionally, and 147.5 percent in Nebraska. The size category (H) means that the industry employs 2,500 to 4,999 persons in Nebraska. The location quotients of 1.28 and 1.49 suggest that Nebraska exports management and public relations services to the United States and the region.
Table 1 shows that the number of indus tries in which Nebraska's growth exceeds the nation is about the same as the number in which Nebraska' s growth lags the nation. The same relationship holds true for comparisons between Nebraska and the region. Table 1 also shows that Nebraska generally is underrepresented by the nation's fastest growing
3 Table I
T op 25 Nationally Gr owing Industries, 1977-84
Location Quotient Per centage Change in Employees Industr y 19841
Broad 1977-84 Size for S I C Indus trial Nebraska Nebraska Nebras ka
Code Industry Categor y u .s. R egion Neb ras ka 1984 to U.S. to Region
367 1 Electr on tubes, receiving type Ma n I 120.3 100.0 n.a. 0 n.a. n.a. 8990 Servicest n.e.c. Ser 424. 2 373.6 50.0 (B) 0.15 0.27
7379 Computer related ser vices, n.e.c. Ser 262.9 235.8 1472.7 (F) 1.36 1.60
7372 Computer p rogr amming and software Ser 222.7 373.2 1019.6 (F) 0.46 0.97
4890 Communication ser vices, n.e.c. T CU 2 17.8 2 11.9 298.6 (G) 1.29 1.96
3693 X- ray apparatus and tubes M an 189.0 60.2 100.0 (A) 0 .0 1 0.01
8041 Offices of chiropr actors Ser 173.7 101.3 130.9 (E) 0 .99 0.65
8090 H ealth and allied se r vices, n.e.c. Ser 160.3 33.2 73.8 (E) 0.27 0.52
8049 Of!ices of health p r actioner s, n.e.c. Ser 138.5 174.5 543.5 (E) 1.20 1.2 I
7394 Equipment rental and leasing Se r 130.8 157.3 237.7 (F) 0 .74 1.03
4421 Noncontiguous area transportation T CU I 30.8 - 100.0 n.a. 0 n.a. n.a.
6220 Commodity contr acts broke r s , d eale r s FIR 127. 1 138.4 122.2 (C) 1.81 1.30
7331 Direct m ail adver tising services Se r I 13.0 42.9 157. 1 (G) 3.54 3.33
5065 Elect ronic pa rts a nd equipment Whl I 10. 1 I I 1.1 11.9 (E) 0.29 0.42
6280 Security and commodity services F IR 109.7 300.8 197.0 (B) 0.34 0.54
4224 Household goods war ehousing T CU 104.9 134.7 11.8 (B) 3. 12 4.60
4722 Passenger transportation arrangements T C U 104.1 I I 1.9 120.6 (F) 0.60 0.73
3573 Electr onic computing equipment Man 102.7 70.3 21 5.8 (G) 0.85 0.55
57 19 Miscellaneous hom e furnishings stor es RU 102.4 95.9 10.2 (C) 0.37 0.57
7819 Ser vices allied to m otion p ictures Se r 98.3 -75.3 100.0 (A) 0.06 0.98
2795 Lithographic platemaking ser vices Ma n 95.5 52.5 (R) (C) (R) (R)
3830 Optical ins truments a nd lenses Man 94.6 230.5 (R) (E) (R) (R)
7392 Managem ent a nd public r elations Se r 93.0 82.4 147.5 (H) 1.28 1.49
7362 Tempor a r y help s upply se r vices Se r 88.9 92.4 55.7 (G) 0.43 0.60
8030 Offices o f osteopathic physicians Se r 88.5 73.3 - 75.0 (A) 0.01 0.0 1
A: 0-19 employees; B: 20 -99 employees; C: 1 00 ·249 employees; E: 250- 499 employees; F: 500-999 employees; G: I ,000-2,499 employees; H: 2.500 -4,999 employees; I: 5,000 - 9,999 e mployees; J : I 0,000-24,499 e mployees; K: 25,000- 49,999 employees. R: employment data we r e esllmated ~smg County Business Patte r ns, with no pe r centage c hanges or location quotients calculated. n.a.- - not applicable n.e.c.--not elsewhere clas s1fled.
Man: Manufacturing; TCU: T rans po r tation, Communication, and Utilities; Whl: Wholesale Trade; RU: R etail T r ade; F I R: Finance, I nsu r ance, a nd Real Estate; Ser: Se rvic es.
!Location quotients w ere calculated bas ed on a subset of an area' s total employment.
Sources: U.S. Bureau of the Census, County Bus iness Patterns , and Nebraska Department of Labor , unpublished data. Calculations by Centc1· fo r Applied U rban R esear ch.
industries. Location quotients of less than 1 outnumber those greater than 1 by a margin of 2 to 1. When compared to the region, a s imilar 2 to 1 margin emerges.
Several of the 25 fastest growing industries nationally also stand out in Nebraska. Nebraska outperformed the nation for three of the top five industries: Computer related services , not els ewhere classified (n.e .c.); computer programming and software services ; and communication s ervices, not elsewhere classified. In all three industries, Nebraska s ignificantly outpaced the United States, and, in two of the industries, Nebraska appears to be a net exporter to the nation and the region. Nebraska appears to be importing computer programming and software services , with a location quotient of 0.46 .
The largest location quotient can be found for direct mail advertis ing services (SIC code 7331), among the 25 fas test growing indus tries . It seems that this industry is one of Nebraska' s most important exporters, with a location quotient of 3.54 when compared to the nation and 3.33 when compared to the region. Moreover, its rate of growth exceeds both the national and regional rates. Using criteria described below, direct mail
advertis ing would be a candidate for additional screening.
Table 2, which was also extracted from the data base, contains information similar to that presented in table 1 but it is arranged differently. Data in table 2 are ranked by industry s ize for Nebraska, and, within s ize class , they are sorted by percentage change in Nebraska employment. Table 2 contains information for industries with 2,500 to 49,999 employees .
In general, the state' s largest industries are not among the fastest growing industries nationally, regionally, or at the s tate level. Furthermore,. table 2 illustrates that rates of change in Nebraska' s largest sectors typically are below the national rates. Three major exceptions are data proces sing services (306.8 percent); management and public relations services (147.5 percent); and business services , not els ewhere classified (7 3.0 percent). All of these industries are probable exporters with location quotients exceeding 1.25.
Nebraska's largest industries are either adequately represented in the state, or they represent export industries , as measured by the location quotient. Only one indus try,
'
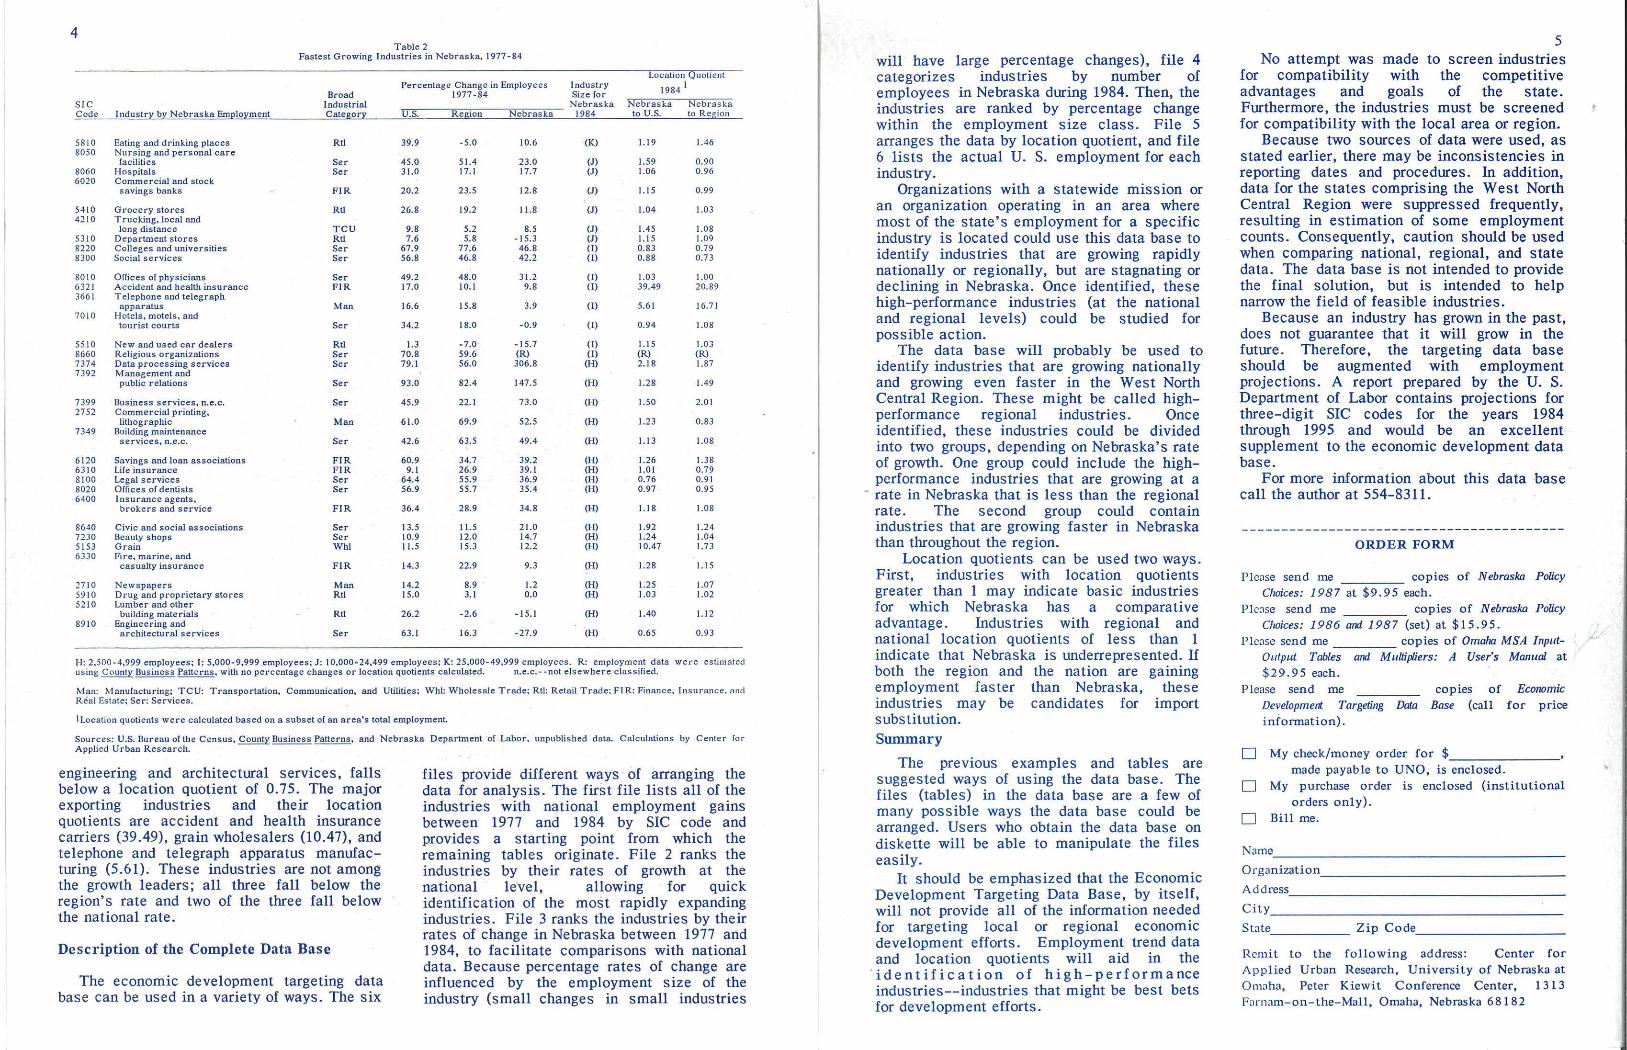
4 Table 2
Fastest Growing Industries in Nebraska, 1977 - 84
Location Quotient Percentage Change in Employees Industry 1984 I
Broad 1977-84 Size lor SIC Indus trial Nebr aska Nebraska Nebraska Code Industry by Nebraska Employment Category u.s. R egion Nebraska 1984 to U. S. to Region
58!0 Eating and drinking places Rtl 39.9 - 5.0 10.6 (K) 1.19 1.46 8050 Nursing and personal care
facilities Ser 45.0 51. 4 23.0 (J) 1.59 0.90 8060 Hospitals Se r 31.0 17. 1 17.7 (J) 1.06 0.96 6020 Commercial and stock
savings banks F IR 20.2 23.5 12.8 (J) 1.15 0.99
5410 G r ocer y stores Rtl 26.8 19.2 11.8 (J) 1.04 1.03 4210 T r ucking, local and
long distance T C U 9.8 5.2 8.5 (J) 1.45 1.08 5310 Department s tores Rtl 7.6 5.8 - 15.3 (J) 1. 15 1.09 8220 Colleges and univer sities Ser 67.9 77.6 46.8 ( I) 0.83 0.79 8300 Social services Se r 56.8 46.8 42.2 (I) 0.88 0.73
8010 Offices of physicians Se r 49.2 48.0 31.2 (I) 1.03 1.00 6321 Accident and health insurance F IR 17.0 10. 1 9.8 (I) 39.49 20.89 366 1 Telephone and telegr aph
appara tus Man 16.6 15.8 3.9 (I) 5.6 1 16.71 7010 Hotels, motels, and
touris t cour ts Se r 34.2 18.0 -0.9 (I) 0.94 1.08
5510 New and used car deale r s Rtl 1.3 -7.0 -1 5.7 (I) 1.1 5 1.03 8660 Religious organizations Ser 70.8 59.6 (R) (I) (R) (R) 7374 Data processing se rvic es Ser 79. 1 56.0 306.8 (H) 2.18 1.87 7392 Management and
public r elations Ser 93.0 82.4 147.5 (H) 1.28 1.49
7399 Business servic es. n.e.c. Ser 45.9 22.1 73.0 (H) 1.50 2.01 2752 Commercial printing,
lithographic Man 6 1.0 69.9 52.5 (H) 1.23 0.83 7349 Building maintenance
services, n.e.c. Ser 42.6 63.5 49.4 (H) 1.1 3 1.08
6120 Savings and loan associations FIR 60.9 34.7 39.2 (H) 1.26 1.38 63 10 Life insurance FIR 9. 1 26.9 39. 1 (H) 1.0 I 0.79 8100 Legal se rvices Ser 64.4 55.9 36.9 (H) 0.76 0.91 8020 Ol!ices of dentists Ser 56.9 55.7 35.4 (H) 0.97 0.95 6400 Ins urance agents,
brokers and ser vice FIR 36.4 28.9 34.8 (H) 1.1 8 1.08
8640 C ivic and social associations Ser 13.5 11.5 2 1.0 (H) 1.92 1.24 7230 Beauty s hops Ser 10.9 12.0 14.7 (H) 1.24 1.04 5153 G r a in Whl 11.5 15.3 12.2 (H) 10.47 1.73 6330 Fir e, ma rine, and
casualty insurance F IR 14.3 22.9 9.3 (H) 1.28 1. 15
27 10 Newspape r s Man 14.2 8.9 1.2 (H) 1.25 1.07 59 10 Drug and propr ietary stores Rtl 15.0 3. 1 0.0 (H) 1.03 1.02 52 10 Lumber and other
building materia ls Rtl 26.2 - 2.6 -1 5.1 (H) 1.40 1. 12 89 10 Engineering and
architectural services Ser 63. 1 16.3 - 27.9 (H) 0.65 0.93
1-1: 2,500-4,999 employees; I : 5,000 -9,999 employees; J: 10,000- 24,499 employees; K: 25,000-49,999 employees. R: employment data we r e estimated using County Bus iness Patterns, with no per centage changes o r location quotients calculated. n.e.c.- -not els ewhe r e classified.
Man: J\<fanulacturing; TCU: Transportation, Communication, and Utilities; Whl: W holesale T r ade; Rtl: R etail Trade; F l R: Finance, I nsu r ance, and Real Estate; Se r: Services.
!Location quotients were calculated based on a subset of an area's total employmenl
Sources: U.S. Bur eau of th e Cens us, County Business Patterns, and Nebraska Depar tment of Labor, unpublished data. Calculations by Center for Applied Urban Resear ch.
engineering and architectural s ervices, falls below a location quotient of 0.75 . The major exporting industries and their location quotients are a ccident and health ins urance carriers (39.49), grain wholesalers (10.47), and telephone and telegraph apparatus manufacturing (5.61).- These industries are not among the growth leaders ; all three fall below the region's rate and two of the three fall below the national rate .
Descr iption of the Complete Data Base
The economic development targeting data base can be used in a variety of ways. The s ix
files provide different ways of arranging the data for analys is. The firs t fil e lis ts all of the industries with national employment gains between 1977 and 1984 by SIC code and provides a start ing point from which the remaining t ables originate . F ile 2 ranks the industries by their rates of growth at the national level , allowing for quick identification of the most rapidly expanding indus tries. File 3 ranks the industries by their rat es of change in Nebraska between 1977 and 1984, to facilitate comparisons with national data. Because percentage rates of change are influenced by the employment size of the industry (s mall changes in s mall industries
will have large percentage changes), file 4 categorizes industries by number of employees in Nebraska during 1984. Then, the industries are ranked by percentage change within the employment s ize class. File 5 arranges the data by location quotient, and file 6 lists the actual U. S. employment for each industry.
Organizations with a statewide mission or an organization operating in an area where most of the state ' s employment for a specific industry is located could use this data base to identify industries that are growing rapidly nationally or regionally, but are stagnating or declining in Nebraska. Once identified, these high-performance industries (at the national and regional levels) could be studied for possible action.
. The data base will probably be used to identify industries that are growing nationally and growing even faster in the West North Central Region. These might be called highperformance regional industries. Once identified, these indus tries could be divided into two groups, depending on Nebraska's rate of growth. One group could include the highperformance industries that are growing at a
- rate in Nebraska that is less than the regional rate . The second group could contain industries that are growing faster in Nebras ka than throughout the region.
Location quotients can be us ed two ways . First, industries with location quotients greater than 1 may indicate basic industries for which Nebraska has a comparative advantage. Indus tries with regional and national location quotients of less than 1 indicate that Nebraska is underrepresented. If both the region and the nation are gaining employment faster than Nebraska, these industries may be candidates for import subs titution. Summary
The previous examples and tables are suggested ways of using the data base. The files (tables) in the data base are a few of many possible ways the data base could be arranged. Users who obta in the data base on diskette will be able to manipulate the files easily.
It s hould be emphasized that the Economic Development Targeting Data Base, by itself, will not provide all of the information needed for targeting local or regional economic development efforts. Employment trend data and location quotients will aid in the
' id e ntif i c at ion o f hi g h - perform a nce indus tries- - industrie s that might be best bets for development efforts.
5 No attempt was made to screen industries
for compatibility with the competitive advantages and goals of the state. Furthermore, the industries must be screened for compatibility with the local area or region.
Because two sources of data were used, as stated earlier, there may be inconsistencies in reporting dates and procedures. In addition, data for the states comprising the West North Central Region were suppressed frequently, resulting in estimation of some employment counts . Consequently, caution should be used when comparing national, regional, and state data. The data base is not intended to provide the final solution, but is intended to help narrow the field of feasible industries.
Because an industry has grown in the past, does not guarantee that it will grow in the future. Therefore, the targeting data base should be augmented with employment projections. A report prepared by the U. S. Department of Labor contains projections for three-digit SIC codes for the years 1984 through 1995 and would be an excellent supplement to the economic development data base.
For more information about this data base call the author at 554- 8311.
ORDE R FORM
Plc~se sen d me copies of N ebraska Policy Choices: 1987 at $ 9 .95 each.
P lc:~se send me copies of Nebraska Policy Choices: 1986 and 19 8 7 (set) at $1 5.95 .
Plc~se send me copies of Omaha MSA Input-Output Tables and Multipliers: A User's Manual at $29 .95 each .
Please send me Development Targeting Datn information) .
copies of Economic Base (call for price
0 My check/money order fo r $ ______ _ made payable t o UNO , is enclosed.
0 My purchase order is enclosed (i nstitutional orders only) .
0 Bill me.
Name --------------------------------------0 rganizati on. ______________________________ _
Address. ____________________________________ __
City ____________________________________ ___
S t~te ________ Z ip Code __________________ _
Remit to the following address: Center fo r App lied Urban Research, University of Nebraska at O maha, Peter Kiewit Conference Center, 131 3 Farnam -on - the-Mall, O maha, Nebraska 68 182
'

NEBRASKA POLICY
CHOICES RELEASED
CAUR is pleased to announce the release of Nebraska Policy Choices: 1987. Initiated in 1986, the series identifies and analyzes important policy issues facing the state.
This year's chapters focus on the following critical issues:
• Targeting economic development • Trends in Nebraska's small towns • Community banking • Financing public education • Nebraska's competitiveness in world
agricultural markets • Contamination of groundwater • Confinement of youths in jails and
lockups • Structure of the Legislature
Nebraska Policy C~oices: 1987 is available for $9. 95. If you missed the 1 9 8 6 vo 1 ume, the set can be purchased for $15.95.
Published by the Center for Applied Urban Research and mailed free upon request.
The University of Nebraska--An Equal Opportunity/ Affirmative Action Educational Institution
Center for Applied Urban Research University of Nebraska at Omaha Peter Kiewit Conference Center 1313 Farnam-on-the-Mall Omaha, Nebrasl.<a 68182
OMAHAMSA
INPUT -OUTPUT TABLES
AND MULTIPLIERS:
A USER'S MANUAL
The 60-page manual provides a snapshot of the interrelationships among industries in Omaha. The tables show the flow of goods and services . between industries, and the multipliers show the "domino" effect of changes in economic activity within the region.
The manual provides a guide for assessing the effect of business changes, such as the loss of a firm or creation of jobs by a company, on the Omaha economy. The computer model of Omaha's economy is based on data contained in the 1982 Census of Industries.
The cost of the manual is only $29.95. Fill out the attached form and mail today.
NEW RELEASE
UNIVERSITY OF NEBRASKA AT OMAHA Delbert D. Weber, Chancellor COLLEGE OF PUBLIC AFFAIRS AND COMMUNITY SERVICE David W. Hinton, Dean CENTER FOR APPLIED URBAN RESEARCH Russell L. Smith, Director Christine M. Reed, Associnte Director Gloria Ruggiero and Sharon deLaubenfels, Editors
NON-PROFIT ORG.
U.S. Postage PAID
Omaha, Nebraska Permit No. 301

![The Omaha Daily Bee. (Omaha, Nebraska) 1890-08-08 [p ]. · 2019-01-15 · TETE OMAHA DAILY BEE. FMDAY. AUGUST 8. 1800. THE SPECULATIVE MARKETS. With Previous Days, Wheat Was Heavy](https://img.pdfslide.us/doc/110x75/5e4c16fc56d86b65534b1b2e/the-omaha-daily-bee-omaha-nebraska-1890-08-08-p-2019-01-15-tete-omaha.jpg)


![The Omaha Daily Bee. (Omaha, Nebraska) 1896-01-04 [p 2].nebnewspapers.unl.edu/lccn/sn99021999/1896-01-04/ed-1/seq-2.pdf · Big Store Prices for Saturday. Country Holt Duller lOc and](https://img.pdfslide.us/doc/110x75/5fa6a4c9b7144d66e25e650a/the-omaha-daily-bee-omaha-nebraska-1896-01-04-p-2-big-store-prices-for-saturday.jpg)