Embed Size (px)
Citation preview

Commodity Prices, Sovereign Wealth Funds, and Fiscal Policy: Lessons from Chile and Norway
Klaus Schmidt-HebbelCatholic University of Chile
Getúlio Vargas Foundation and VALE Conference on “The Economics and Econometrics of Commodity Prices”, Rio de Janeiro, Brazil, 16-17 August 2012

Key Issues
• Resource-rich economies (RREs) at critical juncture:• Decade of high commodity prices – resource boom• Most RREs lack appropriate fiscal institutions• Fiscal stance: often weak and ineffective in promoting
macro-financial stability, growth, and equity• Fiscal position vulnerable to commodity price reversal
• Chile and Norway: two RREs with decade-long experience of fiscal reform and good performance
• They show the way forward in four key fiscal policy areas

Outline
1. Chile’s Fiscal Institutions and Policy
2. Norway’s Fiscal Institutions and Policy
3. International Evidence on Fiscal Policy and Macroeconomic Performance in RREs
4. Lessons on Fiscal Institutions for RREs
5. Conclusion
1. Chile’s Fiscal Institutions and Policy

Chile’s Fiscal Policy Institutions in International Comparison (1)
Institution Marks
Fiscal Responsibility Law √
Financial Management of Budget √
Budget Horizon X
Fiscal Rule √√
Sovereign Wealth Funds √√
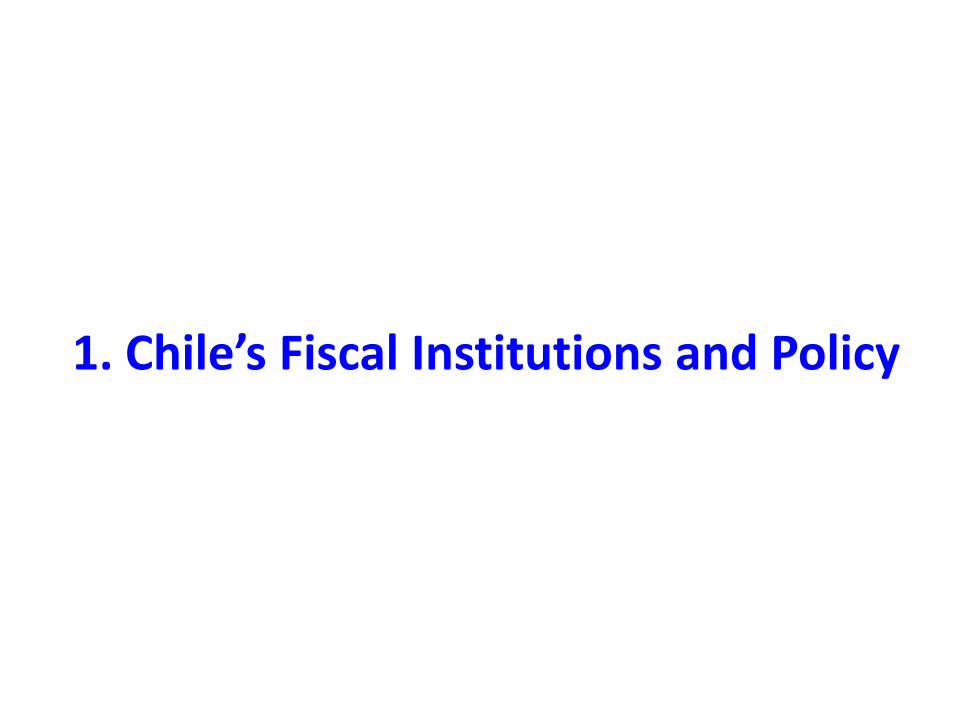
Chile’s Fiscal Policy Institutions in International Comparison (2)
Institution Marks
Management of Gov. Balance Sheet X
Budget Accountability + Transparency √√
External Control and Auditing √
Fiscal Ad hoc Committees √√
Fiscal Council X

Chile’s Fiscal Rule
• Cyclically adjusted government balance rule –implies a-cyclical government spending (automatic tax stabilizers are still counter-cyclical)
• Unique: targets government spending to cyclically-adjusted revenue, adjusting for cyclical revenue due to cycles in GDP and mineral prices
• Has been in place since 2001• Strong governance and political economy / support• Has generally worked well• Except in 2009-10: rule was overruled because of
insufficient counter-cyclicality; reestablished 2011• Yet requires technical and institutional refinements

A Simple Rule (1)
Cyclical net saving (cyclically adjusted balance minus actual balance) is determined by cyclical revenue (c.a. revenue minus actual revenue):
Non-mining Tax Rev* = NMTR* = f (output gap)Mining Tax Rev* = MTR* = f (trend mineral prices)Mining Transfers* = CR*+MR* = f (trend min prices)
B*
t - Bt = (Rt
* -Gt )- (Rt -Gt ) =
= NMTRt
* - NMTRt + MTRt
* - MTRt +CRt
* -CRt + MRt
* - MRt

A Simple Rule (2)
• Actual overall government spending equals trend structural revenue net of structural balance:
G = R* - B*
• Hence government spending G is a-cyclical
• Government sets target for c.a. balance B* (net c.a. saving)
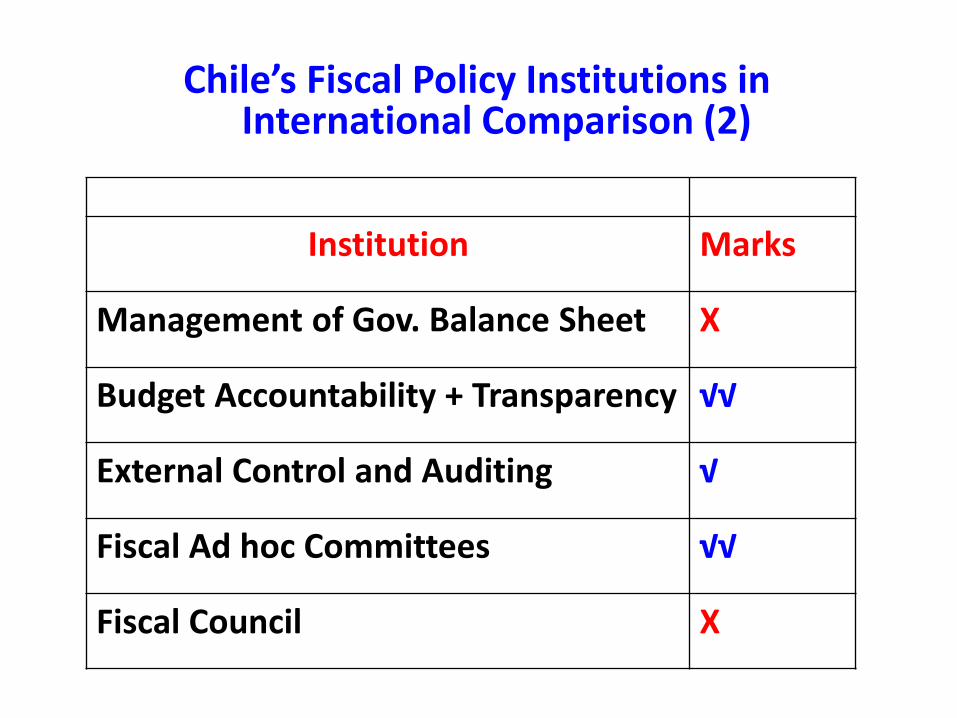
• Committees project trend GDP and mineral prices required for estimating c.a. revenue R* (strong political economy)

GDP Growth: Committee Forecasts and Actual Growth (%)
-2%
-1%
0%
1%
2%
3%
4%
5%
6%
2002 2003 2004 2005 2006 2007 2008 2009 2010 2011
GDPGrowth Commi ee'sProjectedAverageTrendGDPGrowth AverageActualFutureGrowth
Copper Prices: Committee Forecasts and Actual Prices ($/lb)
0.0
0.5
1.0
1.5
2.0
2.5
3.0
3.5
4.0
4.5
2001 2002 2003 2004 2005 2006 2007 2008 2009 2010 2011
US$/Coppe
rpound
PCu Commi ee'sLongRunPCuProjec on AverageActualFuturePCu

Chile: Actual and cyclically-adjusted Gov. Balance (% of GDP)
-5%
-3%
-1%
1%
3%
5%
7%
9%
1990 1992 1994 1996 1998 2000 2002 2004 2006 2008 2010
Ra
otoGDP
CyclicalBalanceComponent ActualBalance CyclicallyAdjustedBalance

Chile: Gov. Revenue and Expenditure Growth Rates (%)
-25%
-15%
-5%
5%
15%
25%
1991 1993 1995 1997 1999 2001 2003 2005 2007 2009
Realrateofgrowth
CentralGovernmentRevenue CentralGovernmentExpenditure

Chile: Gross Assets, Gross Liabilities, and Net Assets of the Government, 1990-2010 (% of GDP)
-40%
-30%
-20%
-10%
0%
10%
20%
30%
1991 1993 1995 1997 1999 2001 2003 2005 2007 2009
Ra
otoGDP
GrossAssets GrossLiabili es NetAssets
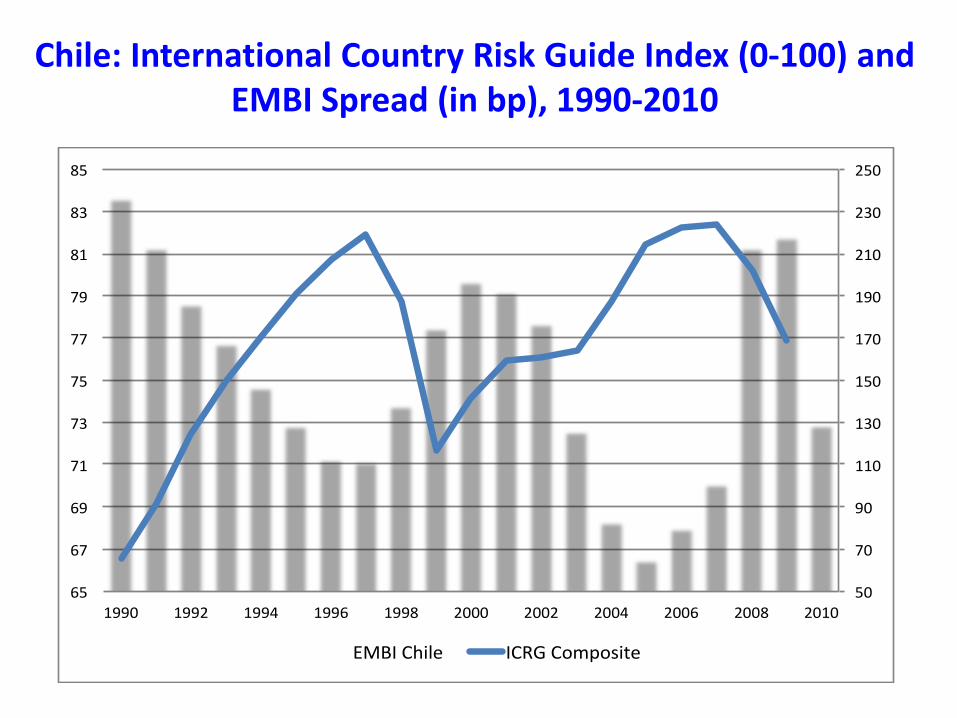
Chile: International Country Risk Guide Index (0-100) and EMBI Spread (in bp), 1990-2010
50
70
90
110
130
150
170
190
210
230
250
65
67
69
71
73
75
77
79
81
83
85
1990 1992 1994 1996 1998 2000 2002 2004 2006 2008 2010
EMBIChile ICRGComposite

Chile: Assets held in SWFs, 2001-2010 (% of GDP)

Rule’s Fiscal and Macroeconomic Effects
Reviews and research suggest Chile’s fiscal rule has:
• Lowered pro-cyclical bias of fiscal policy• Contributed to fiscal sustainability and credibility,
lowering the sovereign risk premium• Reduced macroeconomic uncertainty• Lowered volatility of GDP, interest rates, and
exchange rate• Reduced dependence on foreign financing during
downturns• Improved protection of social programs during
cyclical downturns

2. Norway’s Fiscal Institutions and Policy

Norway’s Fiscal Policy Framework
• Oil production peaked in 2005 and is projected to decline significantly in coming years
• 2001: Norway adopted new fiscal framework aiming at macro stability, fiscal sustainability, inter-generational equity, and resource use efficiency
• Three institutional pillars:(i) Structural fiscal rule(ii) Sovereign wealth fund(iii) Full integration of SWF into government budget

Norway’s Past and Projected Oil Production, 1970-2030

Norway’s Fiscal Rule (1)
• Oil rents are transferred to SWF
• Cyclically-adjusted non-oil budget deficit financed by average transfer from the SWF at an (imputed) 4% real return on SWF investments
• Annual deviations of the latter transfer are allowed for further discretionary government spending geared at counter-cyclical stabilization and expenditure smoothing

Norway’s Fiscal Rule (2)
• Therefore government spending is equal to:• trend values of government tax revenue and excise duty
revenue and of Norges Bank transfers• minus: trend values of unemployment benefit payments and of
net interest payments and transfers• plus: 4% real return on SWF investments• plus or minus: discretionary spending adjustment for cyclical
stabilization and to avoid excessive spending volatility
• Hence Norway’s fiscal rule:1. is consistent with c.a. balance measure (like Chile)2. is consistent with inter-generational rent sharing (not Chile)3. allows for additional counter-cyclical spending (not Chile)4. allows for additional spending smoothing (not Chile)
• Hence Norway has an outstanding rule in place with outstanding results since 2001
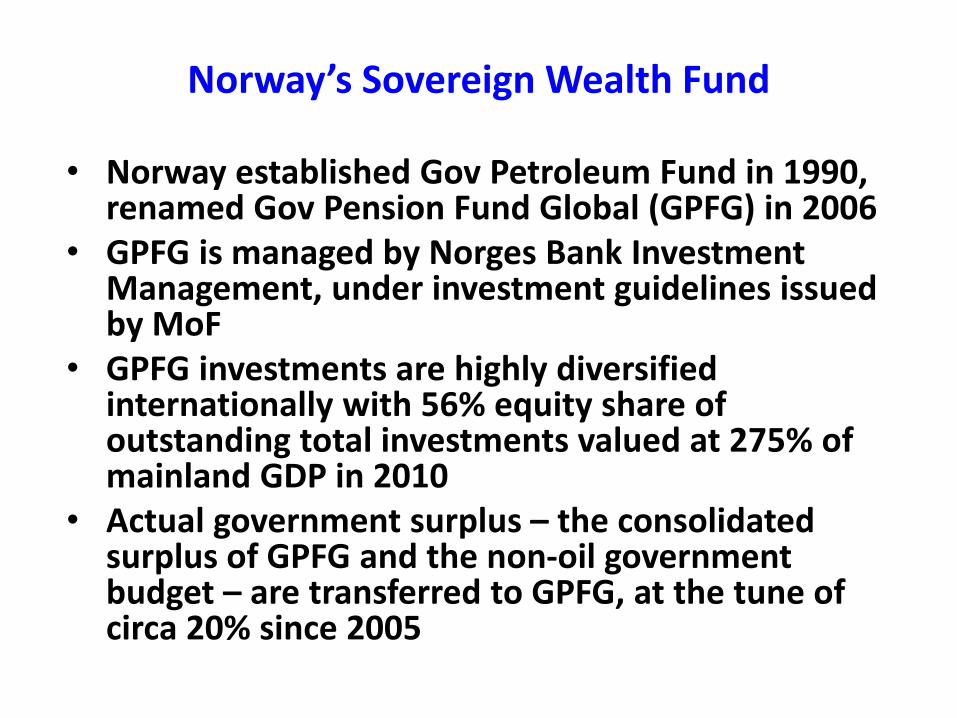
Norway’s Sovereign Wealth Fund
• Norway established Gov Petroleum Fund in 1990, renamed Gov Pension Fund Global (GPFG) in 2006
• GPFG is managed by Norges Bank Investment Management, under investment guidelines issued by MoF
• GPFG investments are highly diversified internationally with 56% equity share of outstanding total investments valued at 275% of mainland GDP in 2010
• Actual government surplus – the consolidated surplus of GPFG and the non-oil government budget – are transferred to GPFG, at the tune of circa 20% since 2005
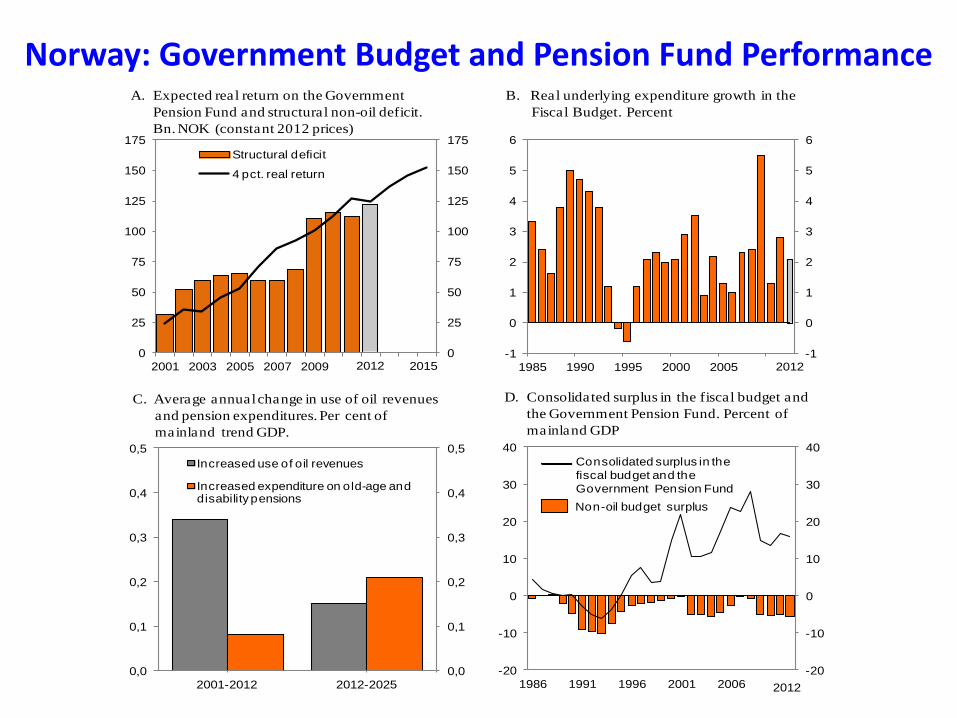
Norway: Government Budget and Pension Fund Performance
The National Budget 2012 7
market value of the GPFG at the end of 2010, and thus the 4 pct. real return on the Fund in 2011, was somewhat higher than expected last autumn.
The proposed 2012 Budget implies an increase in spending of petroleum revenues in line with the average expected increase in the four percent path in the years ahead. Measured as a share of trend GDP for Mainland Norway, the structural non-oil budget deficit will increase by about ¼ percentage point from 2011 to 2012. Macroeconomic model simulations indicate that the overall impact of the Government's proposed budget on mainland GDP is broadly neutral.
These calculations take into account that different budget items may affect the activity level of the Norwegian economy differently.
The main features of the proposed Budget for 2012 are as follows:
- The spending of petroleum revenues, as
measured by the structural, non-oil budget deficit, is estimated at NOK 122.2 billion, which is NOK 2.4 billion below the expected real return on the GPFG.
- An increase in the structural non-oil deficit from 2011 to 2012 corresponding to ¼ pct. of mainland trend GDP. The overall impact of
Figure 3.1 Fiscal policy
B. Real underlying expenditure growth in the
Fiscal Budget. Percent
A. Expected real return on the Government
Pension Fund and structural non-oil deficit.
Bn. NOK (constant 2012 prices)
Fiscal policy
D. Consolidated surplus in the fiscal budget and
the Government Pension Fund. Percent of
mainland GDP
-1
0
1
2
3
4
5
6
1985 1990 1995 2000 2005
-1
0
1
2
3
4
5
6
0
25
50
75
100
125
150
175
2001 2003 2005 2007 20090
25
50
75
100
125
150
175
Structural deficit
4 pct. real return
2015 20122012
C. Average annual change in use of oil revenues
and pension expenditures. Per cent of
mainland trend GDP.
0,0
0,1
0,2
0,3
0,4
0,5
2001-2012 2012-2025
0,0
0,1
0,2
0,3
0,4
0,5
Increased use of oil revenues
Increased expenditure on old-age and disability pensions
-20
-10
0
10
20
30
40
1986 1991 1996 2001 2006-20
-10
0
10
20
30
40
2012
Non-oil budget surplus
Consolidated surplus in the
fiscal budget and the
Government Pension Fund

Norway: Government Pension Fund Global (GPFG) Investment Portfolio, 1997-2011 (ratio to GDP, %)
0%
50%
100%
150%
200%
250%
300%
Equity Fixed Income Real Estate

3. Fiscal Policy and Macroeconomic Performance in RREs
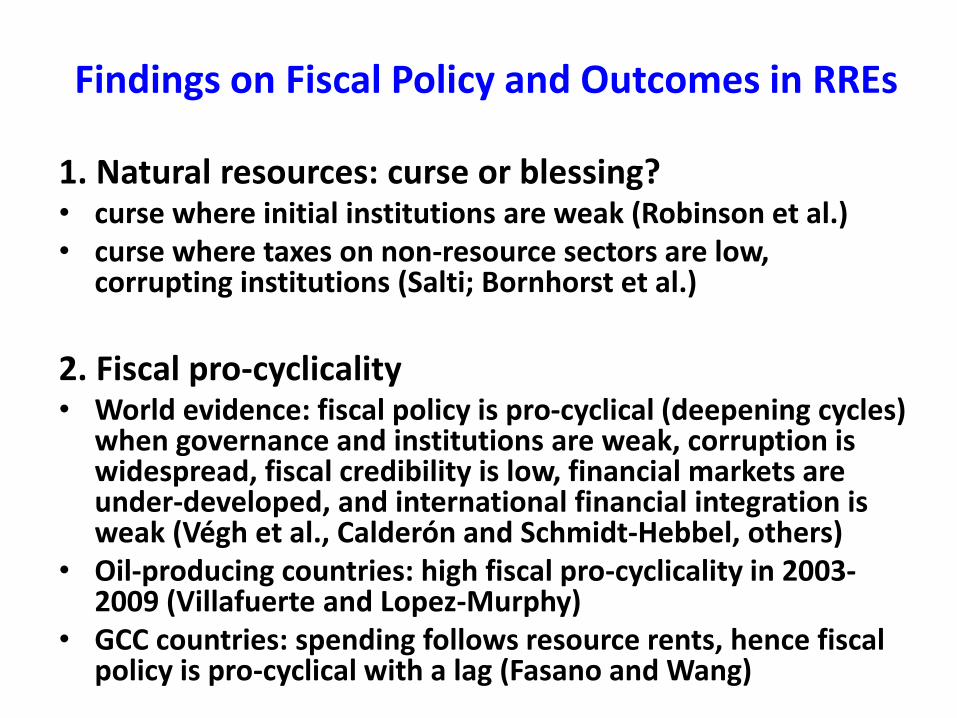
Findings on Fiscal Policy and Outcomes in RREs
1. Natural resources: curse or blessing?• curse where initial institutions are weak (Robinson et al.)• curse where taxes on non-resource sectors are low,
corrupting institutions (Salti; Bornhorst et al.)
2. Fiscal pro-cyclicality• World evidence: fiscal policy is pro-cyclical (deepening cycles)
when governance and institutions are weak, corruption is widespread, fiscal credibility is low, financial markets are under-developed, and international financial integration is weak (Végh et al., Calderón and Schmidt-Hebbel, others)
• Oil-producing countries: high fiscal pro-cyclicality in 2003-2009 (Villafuerte and Lopez-Murphy)
• GCC countries: spending follows resource rents, hence fiscal policy is pro-cyclical with a lag (Fasano and Wang)

Findings on Fiscal Policy and Outcomes in RREs
3. Weak fiscal sustainability• Fiscal positions weakened in oil-producing countries duirng
2003-08 oil boom (V and L-M)
4. Fiscal vulnerability to commodity price reversals• Fiscal positions are highly vulnerable to oil-price reversal in
oil-producing countries (V and LM)
5. Macroeconomic volatility and Dutch Disease• Fiscal policy pro-cyclicality has amplified business cycles in
oil-producing countries (V and L-M, Abdih et al.)• Pro-cyclical government spending leads to Dutch Disease
during revenue booms -- hence RER misalignment, loss of competitiveness, and large non-resource curr. account deficits

Findings on Fiscal Policy and Outcomes in RREs
• Weak fiscal-policy institutions have adverse effects beyond policy pro-cyclicality and Dutch disease
• Opaque budgetary management and external control, lack of transparent fiscal policies and budgets, and poor budgetary accountability lead to ineffective and inefficient government spending, misuse of government resources, and corruption
• Adoption of modern institutional framework for fiscal policy makes major contribution to lessen adverse impact of commodity bubbles and strengthen good use of government resources

4. Lessons on Fiscal Institutions in RREs
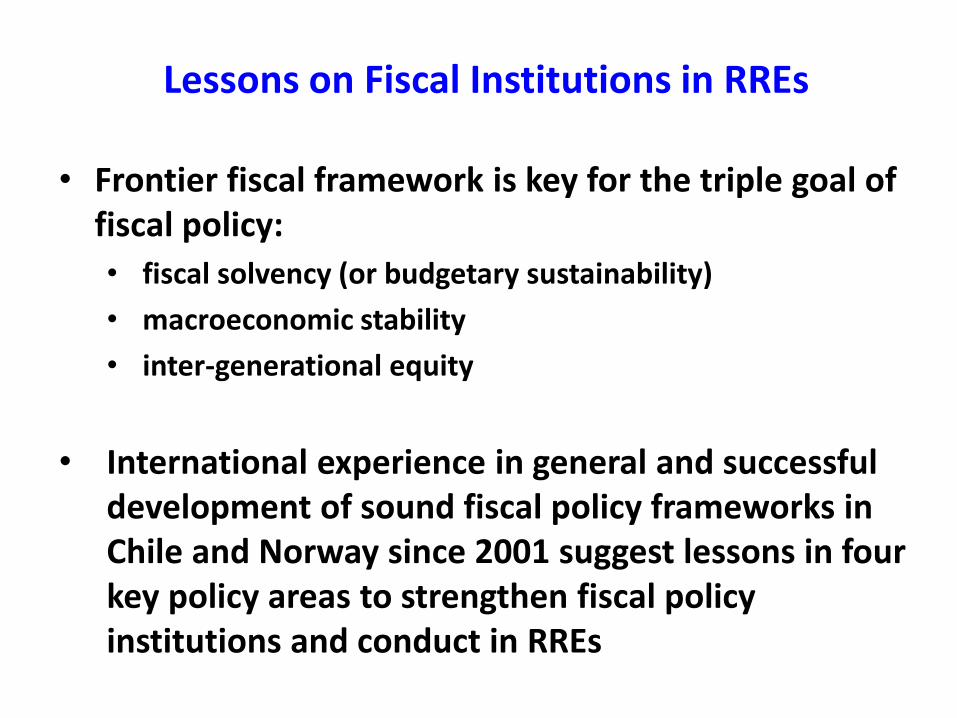
Lessons on Fiscal Institutions in RREs
• Frontier fiscal framework is key for the triple goal of fiscal policy:
• fiscal solvency (or budgetary sustainability)
• macroeconomic stability
• inter-generational equity
• International experience in general and successful development of sound fiscal policy frameworks in Chile and Norway since 2001 suggest lessons in four key policy areas to strengthen fiscal policy institutions and conduct in RREs
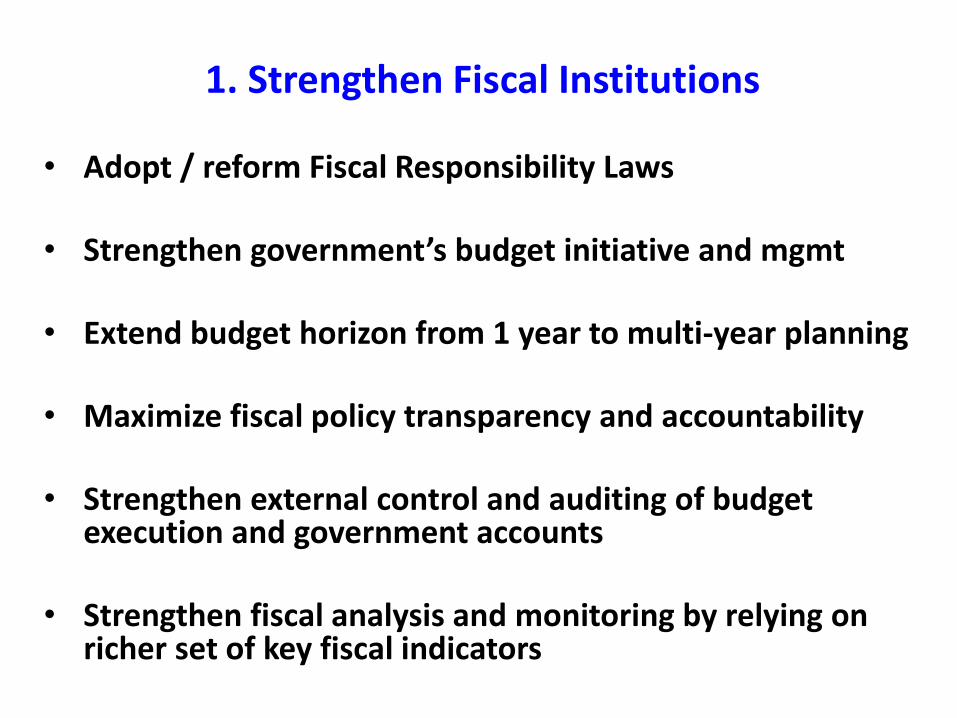
1. Strengthen Fiscal Institutions
• Adopt / reform Fiscal Responsibility Laws
• Strengthen government’s budget initiative and mgmt
• Extend budget horizon from 1 year to multi-year planning
• Maximize fiscal policy transparency and accountability
• Strengthen external control and auditing of budget execution and government accounts
• Strengthen fiscal analysis and monitoring by relying on richer set of key fiscal indicators

Government Budget Transparency in International Comparison, 2010
92
90
87
87
83
83
82
72
71
71
68
65
63
61
58
56
52
SouthAfrica
NewZealand
UK
France
Norway
Sweden
US
Chile
Brazil
SouthKorea
Germany
Peru
Spain
Colombia
Portugal
Argen ne
Mexico

2. Adopt a Fiscal Rule
• Adopt a fiscal rule based on cyclically-adjusted balance of the government
• Adjust for both domestic GDP cycles andcommodity price cycles – key budget variables
• Make rule consistent with a-cyclical or, preferably, counter-cyclical spending and spending smoothing
• Preferably based on assumptions and forecasts of key variables provided by independent committees
• Possibly anchored in Fiscal Responsibility Law

3. Start/develop a Sovereign Wealth Fund
• Key complement of cyclically-adjusted balance rule
• Effective and transparent corporate governance
• Transparent information of transfers between budget and SWF
• Investment portfolio composition set by maturity preference (length of commodity-price and GDP cycles, inter-generational sharing), and risk aversion
• Investment management bound by transparent guidelines and close public monitoring

Transparency of Sovereign Wealth Funds in International Comparison, 2011

4. Adopt Committees and Fiscal Council
• Special Independent Committees: focus on narrow tasks, like key budget forecasts or fiscal reforms
• Independent Fiscal Councils: based on ad hoc law, Board members voted by Congress. Responsible for following tasks and recommendations:• Budget assumptions, projections, monitoring, and
recommendation of corrective actions• Medium and long-term fiscal projections and assessment
of fiscal sustainability and corrective actions• Assessment of macro-financial effects of fiscal policy• Assessment and recommendations on government asset
and liability management• Technical advice and public hearings (Congress) on
budget management and fiscal reforms

5. Conclusion

Conclusion
• The world has made much progress in some areas of macro-financial institutions and policies – e.g., independent central banks and the conduct of (conventional) monetary policy
• Yet fiscal institutions and fiscal policies face major challenges to strengthen sustainability of fiscal policy, its counter-cyclicality, and its transparency – in industrial and emerging economies alike
• RREs face a particularly serious challenge to break out of the vicious circle between fiscal policy weaknesses and commodity cycles
• It can be done.

Commodity Prices, Sovereign Wealth Funds, and Fiscal Policy: Lessons from Chile and Norway
Klaus Schmidt-HebbelCatholic University of Chile
Getúlio Vargas Foundation and VALE Conference on “The Economics and Econometrics of Commodity Prices”, Rio de Janeiro, Brazil, 16-17 August 2012

Rule’s Fiscal and Macro Effects: New Findings
• Which is the response of government saving and Chile’s macroeconomy to a copper price shock under the rule (since 2001-2010) – compared to before the rule (1990-2000)?
• I use impulse responses from VAR estimations to simulate the response to a 10% copper price shock
• Before the rule: no effects on fiscal balance and EMBI, while RER appreciates and growth declines
• After the rule: fiscal balance improves, EMBI declines, RER appreciates, and growth rises

Response to a Copper Price before the Fiscal Rule (1990-2000)
Figura 2: Impulse Response pre-Fiscal Rule
2

Response to a Copper Price under the Fiscal Rule (2001-10)
Figura 3: Impulse Response post-Fiscal Rule
3