Embed Size (px)
Citation preview
EMEP/EEA air pollutant emission inventory guidebook 2019 1
Category Title
NFR 1.B.2.a.iv Fugitive emissions oil – refining/storage
SNAP 0401
040101
040102
040103
040104
040105
Processes in petroleum industries
Petroleum products processing
Fluid catalytic cracking — CO boiler
Sulphur recovery plants
Storage and handling of petroleum products in refinery
Other
ISIC
Version Guidebook 2019
Coordinator
Carlo Trozzi
Contributing authors (including to earlier versions of this chapter)
Marlene Plejdrup, Marc Deslauriers and Stephen Richardson

1.B.2.a.iv Fugitive emissions oil: refining / storage
EMEP/EEA air pollutant emission inventory guidebook 2019 2
Contents
1 Overview .......................................................................................................... 3
2 Description of sources .................................................................................... 3
2.1 Process description ...................................................................................................................... 3
2.2 Techniques .................................................................................................................................... 5
2.3 Emissions and controls ............................................................................................................... 6
3 Methods.......................................................................................................... 11
3.1 Choice of method ....................................................................................................................... 11
3.2 Tier 1 default approach ............................................................................................................. 12
3.3 Tier 2 technology-specific approach ........................................................................................ 13
3.4 Tier 3 emission modelling and use of facility data ................................................................. 20
4 Data quality ................................................................................................... 25
4.1 Completeness ............................................................................................................................. 25
4.2 Avoiding double counting with other sectors ......................................................................... 25
4.3 Verification .................................................................................................................................. 25
4.4 Developing a consistent time series and recalculation ......................................................... 26
4.5 Uncertainty assessment ............................................................................................................ 26
4.6 Inventory quality assurance/quality control QA/QC .............................................................. 26
4.7 Gridding ....................................................................................................................................... 26
4.8 Reporting and documentation ................................................................................................. 26
5 References ..................................................................................................... 27
6 Point of enquiry ............................................................................................. 28

1.B.2.a.iv Fugitive emissions oil: refining / storage
EMEP/EEA air pollutant emission inventory guidebook 2019 3
1 Overview
This chapter treats emissions from the petroleum refining industry. This industry converts crude oil
into more than 2 500 refined products, including liquid fuels (from motor gasoline to residual oil),
by-product fuels and feedstock (such as asphalt, lubricants, gases, coke), and primary
petrochemicals (for instance, ethylene, toluene, xylene). Petroleum refinery activities start with the
receipt of crude for storage at the refinery, include all petroleum handling and refining operations,
and terminate with storage preparatory to shipping the refined products from the refinery (US EPA,
1995b, 2006a).
Not all processes that could result in the emissions to the air are included in this chapter:
emissions from the crude oil feed stock handling are covered by chapter 1.B.2.a.i;
combustion processes are covered by chapter 1.A.1.b;
emissions from flaring are covered by chapter 1.B.2.c. Incineration of ground flares is also
included in chapter 1.B.2.c and not in 6.C.b, since the latter chapter focuses on solid and liquid
wastes, not gases;
emissions from asphalt (bitumen) blowing are covered by chapter 3.C;
emissions due to loading at refinery dispatch facilities are covered by chapter 1.B.2.a.v;
emissions due to waste water treatment in refineries and sulphur recovery are included in this
chapter;
estimating non-methane volatile organic compounds (NMVOC) emissions due to spills and
accidental discharges is considered outside the terms of reference for this manual. Also,
emissions from the production of primary petrochemicals are not included, even if these
chemicals are produced at a petroleum refinery. Refer to Chapter 2.B Chemical industry for
guidance on estimating emissions from the chemical industry.
Petroleum refineries are sources of SO2 and NMVOC emissions, and less significant sources of
particulates, NOx and CO.
2 Description of sources
2.1 Process description
The petroleum refinery industry employs a wide variety of processes. The types of processes
operating at one facility depend on a variety of economic and logistic considerations such as the
quality of the crude oil feedstock, the accessibility and cost of crude (and alternative feedstock), the
availability and cost of equipment and utilities, and refined product demand.
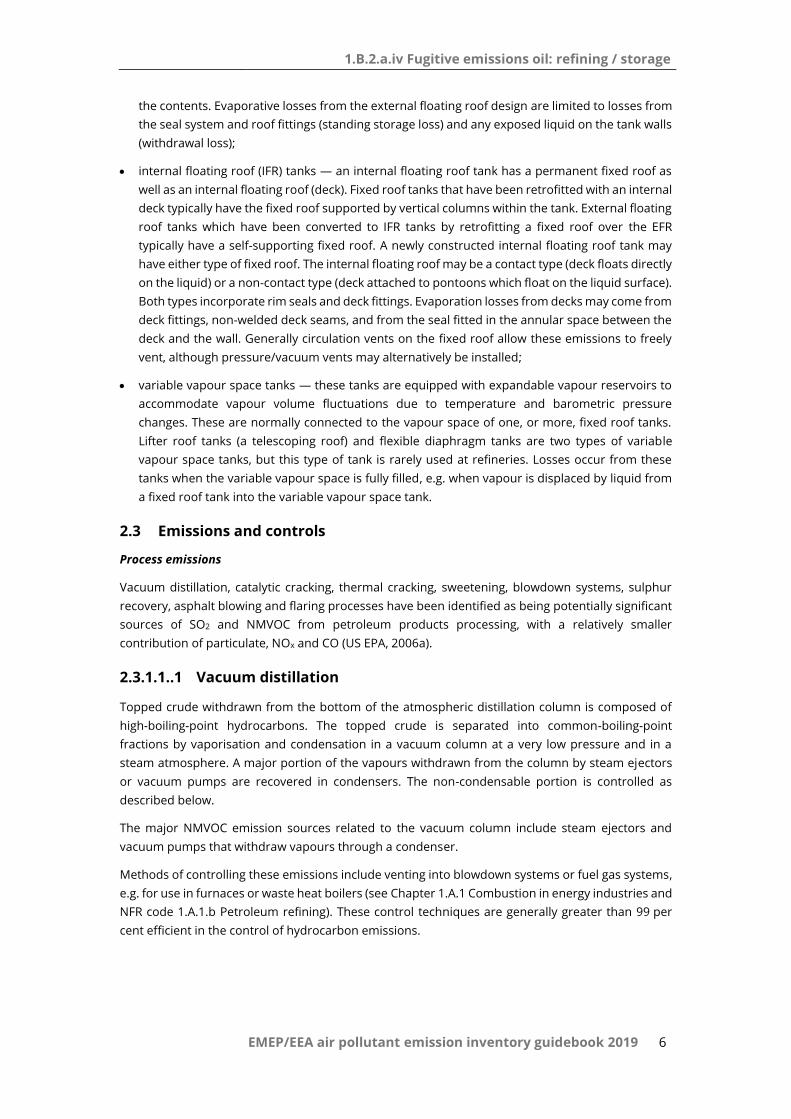
Four main categories can be distinguished within the processes in a petroleum refinery:
1. Separation processes
Crude oil consists of a mixture of hydrocarbon compounds including paraffinic, naphthenic, and
aromatic hydrocarbons plus small amounts of impurities including sulphur, nitrogen, oxygen and
metals. The first phase in petroleum refining operations is the separation of crude oil into common
boiling point fractions using three petroleum separation processes: atmospheric distillation, vacuum
distillation, and light ends recovery (gas processing).
1.B.2.a.iv Fugitive emissions oil: refining / storage
EMEP/EEA air pollutant emission inventory guidebook 2019 4
2. Conversion processes
Where there is a high demand for high-octane gasoline, jet fuel and diesel fuel, components such as
residual oils, fuel oils, and light ends are converted to gasoline and other light fractions. Cracking,
coking and visbreaking processes break large petroleum molecules into smaller petroleum
molecules. Polymerization and alkylation processes rearrange the structure of petroleum molecules
into larger ones. Isomerisation and reforming processes rearrange the structure of petroleum
molecules to produce higher-value molecules of a similar size.
3. Treating processes
Petroleum-treating processes stabilise and upgrade petroleum products. De-salting is used to
remove salt, minerals, grit, and water from crude oil feedstock prior to refining. Undesirable
elements such as sulphur, nitrogen and oxygen are removed from product intermediates by
hydrodesulphurization, hydro treating, chemical sweetening and acid gas removal. De-asphalting is
used to separate asphalt from other products. Asphalt may then be polymerised and stabilised by
blowing (see sub-sector 3.C Chemical products).
4. Blending
Streams from various units are combined to produce gasoline, kerosene, gas oil and residual oil, and
in some cases a few speciality items.
Figure 2-1 gives an overview of the 4 main categories described in this section.
Figure 2-1 Process scheme for source category 1.B.2.a.iv Refining and storage. Red arrows
indicate combustion emissions; these are accounted for in NFR source category
1.A.1.b Petroleum refining. Blue arrows indicate process emissions which are
considered in this chapter.
SeparationCrude
oilFractions Conversion Treating BlendingProducts Products
Chapter 1.A.1.b Chapter 1.A.1.b

1.B.2.a.iv Fugitive emissions oil: refining / storage
EMEP/EEA air pollutant emission inventory guidebook 2019 5
Diffuse emission sources are defined as NMVOC sources not associated with a specific process but
scattered throughout the refinery. Fugitive process emissions are a subset of diffuse emissions and
sources include valves of all types, flanges, pump and compressor seals, pressure relief valves,
sampling connections and process drains. These sources may be used, for example, in the pipelines
transporting crude oil, intermediates, wastes or products.
Note that this category will actually include diffuse emissions from all such refinery sources, rather
than those sources only associated with process emissions.
Sulphur recovery
Sulphur recovery, used at both petroleum refineries and natural gas processing plants, converts by-
product hydrogen sulphide (H2S) in sour gas streams to an elemental sulphur product. During initial
stages of high-sulphur crude oil or gas processing, process and fuel gases that contain significant
amounts of H2S are treated in a lean amine solution to absorb the sulphide components. The H2S is
subsequently stripped to provide either a feed gas to a sulphur recovery plant or the stripped H2S
may be flared or incinerated at plants where sulphur is not recovered. Further details of sulphur
recovery processes are provided in subsection 0 of the present chapter.
Storage and handling
Storage and handling of crude oils, intermediates and products in a refinery is one part of the
refining process.
Emissions arise as a result of evaporation from storage tanks and the displacement of vapour during
filling.
Intermediates and products may be stored in a variety of tanks. This chapter considers the following
categories of tanks:
fixed-roof tanks
external floating roof
internal floating roof
other tank types such as variable vapour space.
Pressure tanks are considered to be minor sources and are not included in this chapter.
2.2 Techniques
For storage and handling of products, the following storage tanks can be distinguished:
fixed roof tanks — a typical vertical fixed roof tank consists of a cylindrical steel shell with a
permanently affixed roof, which may vary in design from cone- or dome-shaped to flat. These
tanks are either freely vented or equipped with a pressure/vacuum vent, which prevents the
release of vapours during very small changes in temperature, pressure, or liquid level. This type
of tank is used for the storage of products such as kerosene, gasoil and fuel oil;
Crude oils and volatile products are stored in floating roof tanks. There are two types:
external floating roof (EFR) tanks — an external floating roof tank typically consists of an open-
topped cylindrical steel shell equipped with a roof that floats on the surface of the storage liquid.
These tanks are equipped with a seal system, which is attached to the roof perimeter and
contacts the ta006Ek wall. The floating roof system and seal act to reduce evaporative losses of
1.B.2.a.iv Fugitive emissions oil: refining / storage
EMEP/EEA air pollutant emission inventory guidebook 2019 6
the contents. Evaporative losses from the external floating roof design are limited to losses from
the seal system and roof fittings (standing storage loss) and any exposed liquid on the tank walls
(withdrawal loss);
internal floating roof (IFR) tanks — an internal floating roof tank has a permanent fixed roof as
well as an internal floating roof (deck). Fixed roof tanks that have been retrofitted with an internal
deck typically have the fixed roof supported by vertical columns within the tank. External floating
roof tanks which have been converted to IFR tanks by retrofitting a fixed roof over the EFR
typically have a self-supporting fixed roof. A newly constructed internal floating roof tank may
have either type of fixed roof. The internal floating roof may be a contact type (deck floats directly
on the liquid) or a non-contact type (deck attached to pontoons which float on the liquid surface).
Both types incorporate rim seals and deck fittings. Evaporation losses from decks may come from
deck fittings, non-welded deck seams, and from the seal fitted in the annular space between the
deck and the wall. Generally circulation vents on the fixed roof allow these emissions to freely
vent, although pressure/vacuum vents may alternatively be installed;
variable vapour space tanks — these tanks are equipped with expandable vapour reservoirs to
accommodate vapour volume fluctuations due to temperature and barometric pressure
changes. These are normally connected to the vapour space of one, or more, fixed roof tanks.
Lifter roof tanks (a telescoping roof) and flexible diaphragm tanks are two types of variable
vapour space tanks, but this type of tank is rarely used at refineries. Losses occur from these
tanks when the variable vapour space is fully filled, e.g. when vapour is displaced by liquid from
a fixed roof tank into the variable vapour space tank.
2.3 Emissions and controls
Process emissions
Vacuum distillation, catalytic cracking, thermal cracking, sweetening, blowdown systems, sulphur
recovery, asphalt blowing and flaring processes have been identified as being potentially significant
sources of SO2 and NMVOC from petroleum products processing, with a relatively smaller
contribution of particulate, NOx and CO (US EPA, 2006a).
2.3.1.1..1 Vacuum distillation
Topped crude withdrawn from the bottom of the atmospheric distillation column is composed of
high-boiling-point hydrocarbons. The topped crude is separated into common-boiling-point
fractions by vaporisation and condensation in a vacuum column at a very low pressure and in a
steam atmosphere. A major portion of the vapours withdrawn from the column by steam ejectors
or vacuum pumps are recovered in condensers. The non-condensable portion is controlled as
described below.
The major NMVOC emission sources related to the vacuum column include steam ejectors and
vacuum pumps that withdraw vapours through a condenser.
Methods of controlling these emissions include venting into blowdown systems or fuel gas systems,
e.g. for use in furnaces or waste heat boilers (see Chapter 1.A.1 Combustion in energy industries and
NFR code 1.A.1.b Petroleum refining). These control techniques are generally greater than 99 per
cent efficient in the control of hydrocarbon emissions.
1.B.2.a.iv Fugitive emissions oil: refining / storage
EMEP/EEA air pollutant emission inventory guidebook 2019 7
2.3.1.1..2 Catalytic cracking
Catalytic crackers use heat, pressure and catalysts to convert heavy oils into lighter products with
product distributions favouring the gasoline and distillate blending components.
Fluidised-bed catalytic cracking (FCC) processes use finely divided catalysts that are suspended in a
riser with hot vapours of the fresh feed. The hydrocarbon vapour reaction products are separated
from the catalyst particles in cyclones and sent to a fractionator. The spent catalyst is conveyed to a
regenerator unit, in which deposits are burned off before recycling.
Moving-bed catalytic cracking processes (TCC) involve concurrent mixing of the hot feed vapours
with catalyst beads that flow to the separation and fractionating section of the unit.
Aside from combustion products from heaters, emissions from catalytic cracking processes are from
the catalyst regenerator. These emissions include NMVOC, NOx, SOx, CO, particulates, ammonia,
aldehydes, and cyanides.
In FCC units, particulate emissions are controlled by cyclones and/or electrostatic precipitators. CO
waste heat boilers may be used to reduce the CO and hydrocarbon emissions to negligible levels.
TCC catalyst regeneration produces much smaller quantities of emissions than is the case for FCC
units. Particulate emissions may be controlled by high-efficiency cyclones. CO and NMVOC emissions
from a TCC unit are incinerated to negligible levels by passing the flue gases through a process
heater firebox or smoke plume burner.
SOx from catalyst regeneration may be removed by passing the flue gases through a water or caustic
scrubber.
2.3.1.1..3 Thermal cracking
Thermal cracking units break heavy oil molecules by exposing them to higher temperatures. In
viscosity breaking (visbreaking), topped crude or vacuum residuals are heated and thermally topped
in a furnace and then put into a fractionator. In coking, vacuum residuals and thermal tars are
cracked at high temperature and low pressure with a long residence time. In Europe there are many
visbreaking units; coking is less often applied.
Emissions from these units are not well characterised. In delayed coking, particulate and
hydrocarbon emissions are associated with removing coke from the coke drum and subsequent
handling and storage operations. Generally there is no control of hydrocarbon emissions from
delayed coking, although in some cases coke drum emissions are collected in an enclosed system
and routed to a refinery flare.
2.3.1.1..4 Sweetening
Sweetening of distillates is accomplished by the conversion of mercaptans to alkyl disulfides in the
presence of a catalyst. Conversion may then be followed by an extraction step in which the disulfides
are removed.
Hydrocarbon emissions are mainly from the contact between the distillate product and air in the air-
blowing step. These emissions are related to equipment type and configuration, as well as to
operating conditions and maintenance practices.

1.B.2.a.iv Fugitive emissions oil: refining / storage
EMEP/EEA air pollutant emission inventory guidebook 2019 8
2.3.1.1..5 Blowdown systems
Many of the refining process units subject to hydrocarbon discharges are manifold into a collection
unit (i.e. blowdown system), comprising a series of drums and condensers, whereby liquids are
separated for recycling and vapours are recovered, recycled or flared with steam injection (for flaring
see chapter 1.B.2.c Venting and flaring).
Sulphur recovery plants
Tail gas from a Claus sulphur-recovery unit contains a variety of pollutants from direct process
oxidation reactions including SO2 and unreacted H2S, other furnace side reaction products such as
reduced sulphur compounds and mercaptans (e.g. COS, CS2) as well as small quantities of CO and
VOC. These components may be emitted directly in older or very small uncontrolled Claus plants.
The quantity and composition of sulphur components in the Claus plant tail gas are directly related
to the sulphur recovery efficiency which will depend on factors such as the number of catalytic
stages, the concentration of H2S and other contaminants in the feed gas, the stoichiometric balance
of inlet gaseous components, operating temperatures, combustion efficiencies and catalyst
maintenance. Typical Claus plant efficiencies range from 94–96 % for two-stage units to 97–98.5 %
for four-bed catalytic plants and, because the process is thermodynamically limited, the tail gas still
contains per cent quantities of sulphur compounds which may be further treated for recovery and
emission control. When feed gas flow is much lower than the dimensional flow for the Claus unit
and when sour gas composition and flow is fluctuating between 80 and 90 % it can be difficult to
achieve these high efficiencies. Efficiencies between 80 and 90 % have been reported for such
difficult conditions.
Tail gas emission reduction from the Claus process is normally achieved by one of the three following
types of control methods.
Claus reaction extension to lower temperature liquid phase: several processes are available
which extend the Claus reaction into a lower temperature liquid phase, whereby enhanced
conversion occurs at cooler temperatures in the catalytic stages. These processes result in overall
higher sulphur recoveries (e.g. 98–99 %) and correspondingly reduced sulphur compound
emissions in the tail gas.
Tail gas scrubbing: although several types of tail gas scrubber variations exist, two generic types
are used to reduce sulphur emissions from the sulphur recovery process — oxidation or
reduction tail gas scrubbers. For example, the Wellman-Lord oxidation scrubber system is used
in combination with tail gas incineration, whereby the Claus plant sulphur compounds are
oxidized to SO2 during combustion and this component is absorbed by sodium
sulphite/bisulphite solution with associated release of the off gas. The bisulphite solution is then
decomposed by boiling to produce a sodium sulphite precipitate for re-use and a regenerated
SO2 stream which is recycled back to the Claus process. Up to 99.9 % sulphur recovery can be
accomplished with the system. In reduction scrubbers, tail gas sulphur compounds are converted
by hydrogenation to H2S, which is either removed by conventional amine scrubbers for
regeneration/recycle back to the Claus process or converted to sulphur outside the Claus unit
using the Stretford lean H2S-to-sulphur process.
Tail gas incineration: Claus plant emissions may also be directly incinerated to convert the more
hazardous reduced sulphur compounds to SO2 under proper combustion conditions for release
to the stack.

1.B.2.a.iv Fugitive emissions oil: refining / storage
EMEP/EEA air pollutant emission inventory guidebook 2019 9
Diffuse emission sources
Emissions can be classified depending upon whether they can be monitored within the source (e.g.
in a process vent pipe, flue or combustion unit stack) when they are called ‘channelled’ emissions, or
whether they can only be monitored external to the source, e.g. storage tanks, oil-water separators,
etc., when they are called ‘diffuse’ emissions. So called ‘fugitive’ emissions, which occur due to leaks
from pressurised components, are a subset of diffuse emissions (European Commission, 2015).
2.3.1.1..1 Storage and handling
For all tanks, the total emission of NMVOC is the result of two types of losses. The first type of loss is
the breathing or standing loss, which for fixed roof tanks is the release of vapours in the tank due to
changes in meteorological conditions such as temperature and pressure, without any appreciable
change in the liquid level of the tank. For floating roof tanks, the standing losses are due to vapour
leakage past seals, roof fittings, etc. The majority of emissions from floating roof tanks are due to
standing losses. The second type of loss is the working (including withdrawal) loss. For fixed roof
tanks this results from the displacement of vapours during filling and the evaporation of product left
on the tank shell during emptying. For floating roof tanks, the working loss is only due to the
evaporation of product left on the tank shell when the roof level drops as product is removed from
the tank (CPPI and Environment Canada 1991).
All intermediates and final products should be stored in the appropriate container: pressure vessels
for gases, floating roof tanks for volatile liquids, fixed roof tanks for kerosene, distillate, fuel oil and
other non-volatile liquids.
Improved operational procedures are an important part of a NMVOC emission control program. This
may include such items as ensuring roof hatches, etc. are not opened unnecessarily, frequent
external inspections and painting volatile product tanks a light shade to reduce the impact of solar
radiation.
Vapour balancing, in which the vapours displaced during handling are collected and recovered, can
have control efficiencies of 90 to 98 per cent. Vapour recovery methods include vapour/liquid
absorption, vapour compression, vapour cooling and/or vapour/solid adsorption. Efficiencies as high
as 90 to 98 per cent may be achieved, depending on the methods used, the design of the unit, the
composition of vapours recovered, and the mechanical condition of the system (European
Commission, 2005).
Other control programs involve design changes and are more specific to the tank in question, as
summarised, by tank type, below.
Fixed roof tanks — fixed roof tank emissions vary as a function of vessel capacity, vapour
pressure of the contents, utilisation rate of the tank and atmospheric conditions. Emissions can
be controlled by the installation of an internal roof and seals, with a control efficiency of 60 to
99 per cent. The control efficiency depends on the type of roof and seals installed as well as on
the type of organic liquid being stored.
External floating roof tanks — efficiencies of primary seals may be improved through the
installation of a secondary seal above the primary. Weather shields may be installed to provide
protection of the seal systems. External floating roof tanks may also be retrofitted with a fixed
roof. Losses from roof fittings can be minimised through proper design, installation, maintenance
and use.
1.B.2.a.iv Fugitive emissions oil: refining / storage
EMEP/EEA air pollutant emission inventory guidebook 2019 10
Internal floating roof tanks — additional control of standing losses can be achieved through the
installation of secondary seals. As for external floating roof tanks, losses from roof fittings can be
minimised through proper design, installation, maintenance and use.
2.3.1.1..2 Oily-water collection and treatment
Diffuse emissions due to the evaporation of the hydrocarbons entrained in the water in process and
oily-water drain systems and oil-water separators can be controlled by sealing the drain openings
and fitting covers to separators.
2.3.1.1..3 Process fugitive emissions
Fugitive process emissions sources include valves of all types, flanges, pumps in hydrocarbon service
(packed or sealed), compressor seals, pressure relief devices, open-ended lines or valves, sampling
connections.
For these sources, a very high correlation has been found between mass emission rates and the type
of stream service in which the sources are employed. For compressors, gases passing through are
classified as either hydrogen or hydrocarbon service. For all other sources, streams are classified
into one of three stream groups: gas/vapour streams, light liquid/two phase streams, and kerosene
and heavier liquid streams. It has been found that sources in gas/vapour service have higher
emission rates than those in heavier stream service. This trend is especially pronounced for valves
and pump seals. Of these sources of NMVOC, valves are the major source type. This is due to their
number and relatively high leak rate.
Normally, control of fugitive emissions involves minimising leaks and spills through equipment
changes, procedure changes, and improved monitoring, housekeeping and maintenance practices.
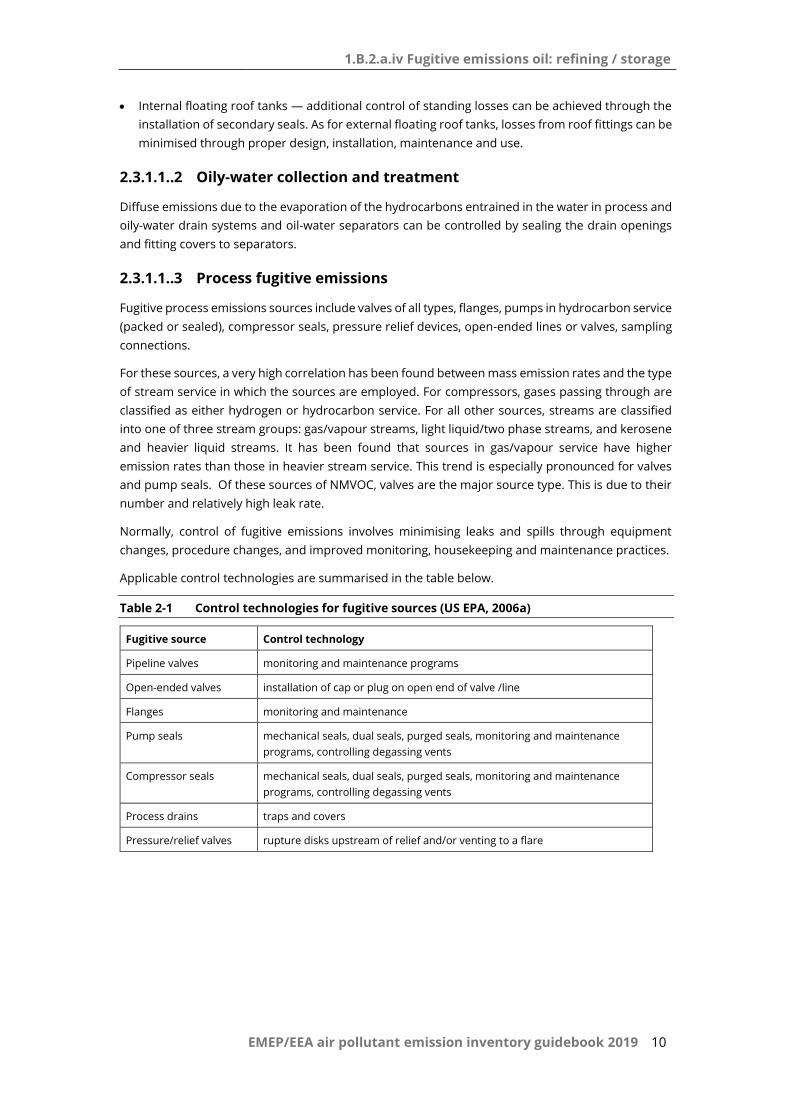
Applicable control technologies are summarised in the table below.
Table 2-1 Control technologies for fugitive sources (US EPA, 2006a)
Fugitive source Control technology
Pipeline valves monitoring and maintenance programs
Open-ended valves installation of cap or plug on open end of valve /line
Flanges monitoring and maintenance
Pump seals mechanical seals, dual seals, purged seals, monitoring and maintenance
programs, controlling degassing vents
Compressor seals mechanical seals, dual seals, purged seals, monitoring and maintenance
programs, controlling degassing vents
Process drains traps and covers
Pressure/relief valves rupture disks upstream of relief and/or venting to a flare

1.B.2.a.iv Fugitive emissions oil: refining / storage
EMEP/EEA air pollutant emission inventory guidebook 2019 11
3 Methods
3.1 Choice of method
Figure 3-1 presents the procedure to select the methods for estimating emissions from the refining
industry. The basic idea is:
if detailed information is available, use it;
if the source category is a key category, a Tier 2 or better method must be applied and detailed
input data must be collected. The decision tree directs the user in such cases to the Tier 2
method, since it is expected that it is more easy to obtain the necessary input data for this
approach than to collect facility level data needed for a Tier 3 estimate;
the alternative of applying a Tier 3 method, using detailed process modelling, is not explicitly
included in this decision tree. However, detailed modelling will always be done at facility level
and results of such modelling could be seen as ‘facility data’ in the decision tree.
Figure 3-1 Decision tree for source category 1.B.2.a.iv Refining, storage
Start
Facility data
Available?
All production
covered
Use Tier 3
Facility data
only
Technology
Stratification
available?
Use Tier 2
technology specific
activity data
and EFs
Key source?
Get
technology stratified
activity data
and EFs
Apply Tier 1
default EFs
Yes Yes
Yes
Yes
No
No
No
No
Use Tier 3
Facility data &
extrapolation
1.B.2.a.iv Fugitive emissions oil: refining / storage
EMEP/EEA air pollutant emission inventory guidebook 2019 12
3.2 Tier 1 default approach
3.2.1 Algorithm
The Tier 1 approach for the refining industry uses the general equation:
pollutantproductionpollutant EFARE (1)
This equation is applied at the national level, using the total refined oil production as production
statistics. It is also possible to use the crude oil throughput as production statistics.
The Tier 1 emission factors assume an averaged or typical technology and abatement
implementation in the country and integrate all sub-processes within the petroleum refining
process.
In cases where specific abatement options are to be taken into account a Tier 1 method is not
applicable and a Tier 2 ort Tier 3 approach must be used.
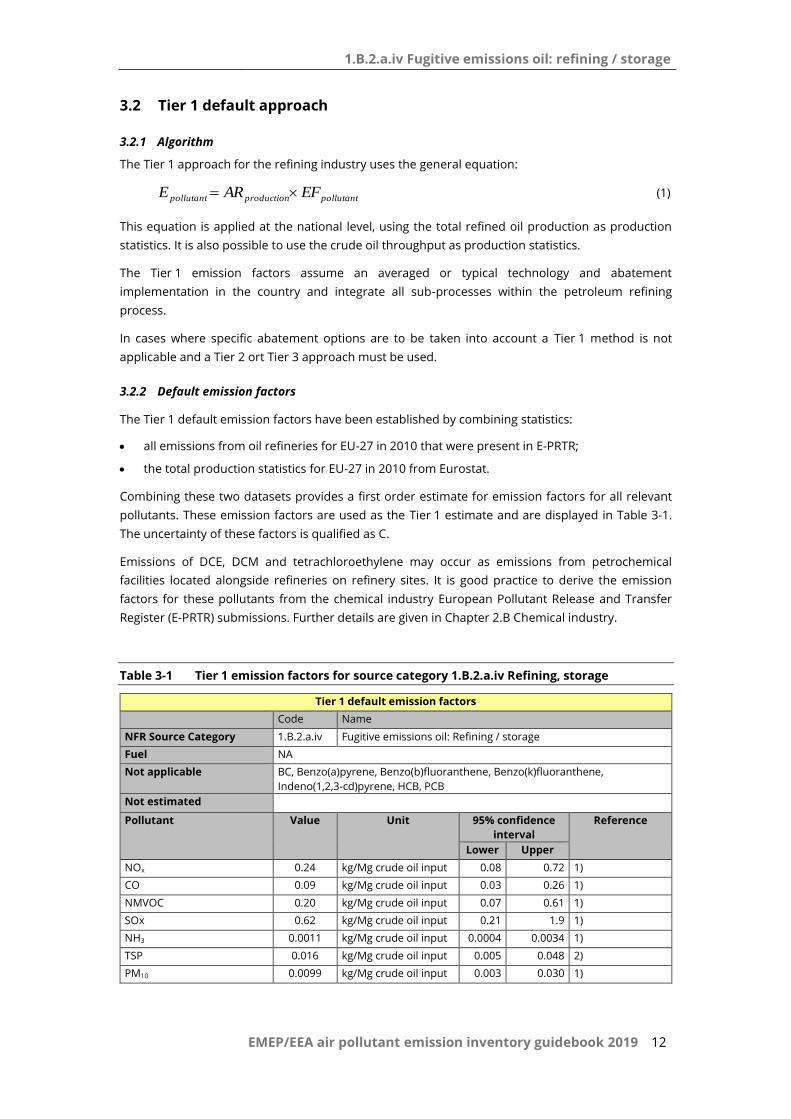
3.2.2 Default emission factors
The Tier 1 default emission factors have been established by combining statistics:
all emissions from oil refineries for EU-27 in 2010 that were present in E-PRTR;
the total production statistics for EU-27 in 2010 from Eurostat.
Combining these two datasets provides a first order estimate for emission factors for all relevant
pollutants. These emission factors are used as the Tier 1 estimate and are displayed in Table 3-1.
The uncertainty of these factors is qualified as C.
Emissions of DCE, DCM and tetrachloroethylene may occur as emissions from petrochemical
facilities located alongside refineries on refinery sites. It is good practice to derive the emission
factors for these pollutants from the chemical industry European Pollutant Release and Transfer
Register (E-PRTR) submissions. Further details are given in Chapter 2.B Chemical industry.
Table 3-1 Tier 1 emission factors for source category 1.B.2.a.iv Refining, storage
Tier 1 default emission factors
Code Name
NFR Source Category 1.B.2.a.iv Fugitive emissions oil: Refining / storage
Fuel NA
Not applicable BC, Benzo(a)pyrene, Benzo(b)fluoranthene, Benzo(k)fluoranthene,
Indeno(1,2,3-cd)pyrene, HCB, PCB
Not estimated
Pollutant Value Unit 95% confidence
interval
Reference
Lower Upper
NOx 0.24 kg/Mg crude oil input 0.08 0.72 1)
CO 0.09 kg/Mg crude oil input 0.03 0.26 1)
NMVOC 0.20 kg/Mg crude oil input 0.07 0.61 1)
SOx 0.62 kg/Mg crude oil input 0.21 1.9 1)
NH3 0.0011 kg/Mg crude oil input 0.0004 0.0034 1)
TSP 0.016 kg/Mg crude oil input 0.005 0.048 2)
PM10 0.0099 kg/Mg crude oil input 0.003 0.030 1)

1.B.2.a.iv Fugitive emissions oil: refining / storage
EMEP/EEA air pollutant emission inventory guidebook 2019 13
PM2.5 0.0043 kg/Mg crude oil input 0.001 0.013 2)
Pb 0.0051 g/MG crude oil input 0.002 0.015 1)
Cd 0.0051 g/MG crude oil input 0.002 0.015 1)
Hg 0.0051 g/MG crude oil input 0.002 0.015 1)
As 0.0051 g/MG crude oil input 0.002 0.015 1)
Cr 0.0051 g/MG crude oil input 0.002 0.015 1)
Cu 0.0051 g/MG crude oil input 0.002 0.015 1)
Ni 0.0051 g/MG crude oil input 0.002 0.015 1)
Se 0.0051 g/MG crude oil input 0.002 0.015 1)
Zn 0.0051 g/MG crude oil input 0.002 0.015 1)
PCDD/F 0.0057 μg/Mg crude oil input 0.002 0.017 1)
1) Tier 1 EFs are estimated as the emissions reported by EU-27 to E-PRTR for the year 2010 divided by the
amount of ‘Transformation input in Refineries’ in 2010 provided by Eurostat (Supply, transformation,
consumption - oil - annual data [nrg_102a]).
2) EFs for TSP and PM2.5 are estimated from the Tier 1 PM10 EF and the average TPS/PM10 and PM2.5/PM10 for
Catalytic Cracking unit regenerators and Fluid coking units.
The majority of emissions from refineries are from both processes and combustion sources e.g.
particulates are emitted from both the catalytic cracking process and from combustion of fuels. To
avoid duplication in emission estimation, where the majority of the emissions are considered to be
from combustion sources, the Tier 1 emission factors are provided in Chapter 1.A.1 Combustion in
energy industries under NFR code 1.A.1.b Petroleum refining.
Care should be taken if the Tier 1 approach is used to estimate emissions for this source category,
because in this case the emissions of these pollutants should not be reported in NFR source category
1.A.1.b Petroleum refining to avoid double counting.
3.2.3 Activity data
To apply the Tier 1 default emission factors, the annual total throughput of each refinery is required,
which can be obtained from Eurostat.
3.3 Tier 2 technology-specific approach
3.3.1 Algorithm
Unlike in other source categories, the Tier 2 approach for the refinery sector is not similar to the
Tier 1 approach. The Tier 2 approach for refineries identifies different processes in the refinery, and
provides process-specific emission factors for these. The total emissions are determined by adding
up all the process-specific emission factors.
To apply the Tier 2 approach, both the activity data and the emission factors need to be stratified
according to the different techniques that may occur in the country. This may be done by:
defining the production using each of the separate product and/or process types (together
called ‘technologies’ in the formulae below) separately; and
applying technology specific emission factors for each process type:
estechnologi
,pollutanttechnologytechnologyproductionpollutant EFARE , (2)
where:

1.B.2.a.iv Fugitive emissions oil: refining / storage
EMEP/EEA air pollutant emission inventory guidebook 2019 14
ARproduction,technology = the production rate within the source category, for the specific
technology,
EFtechnology,pollutant = the emission factor for this technology and this pollutant.
A country where only one technology is implemented will result in a penetration factor of 100 % and
the algorithm reduces to:
,pollutanttechnologyproductionpollutant EFARE (3)
where:
Epollutant = the emission of the specified pollutant,
ARproduction = the activity rate for petroleum refining,
EFpollutant = the emission factor for this pollutant.
3.3.2 Technology-specific emission factors
This section is split in two, first the process emission factors are discussed, thereafter the fugitive
emission factors. The section provides the process emission factors for petroleum refineries
processes, for the various techniques available for use. The majority of the factors are taken from
CONCAWE (2017) and, if not specified otherwise, based on uncontrolled processes.
Catalytic cracking unit regenerators
The emission factors given in Table 3-2 are for partial burn without a CO boiler. For the emission
factors to be used with full burn regeneration or partial burn with CO boiler, please use these
emission factors combined with the relevant abatement efficiencies in subsection 0 of the present
chapter.
Table 3-2 Tier 2 emission factors for source category 1.B.2.a.iv Refining, storage, Fluid
catalytic cracking - CO boiler (not installed)
Tier 2 emission factors
Code Name
NFR Source Category 1.B.2.a.iv Fugitive emissions oil: Refining / storage
Fuel NA
SNAP (if applicable) 040102 Fluid catalytic cracking - CO boiler
Technologies/Practices Catalytic Cracking unit regenerators
Partial burn without CO boiler
Region or regional conditions
Abatement technologies Cyclone systems installed internally within the regenerator
Not applicable HCB, PCB
Not estimated PCDD/F
Pollutant Value Unit 95% confidence
interval
Reference
Lower Upper
NOx 0.2 kg/m3 fresh feed 0.12 0.29 CONCAWE (2017)
CO 39 kg/m3 fresh feed 24 55 CONCAWE (2017)
NMVOC 0.63 kg/m3 fresh feed 0.38 0.88 CONCAWE (2017)
SOx 1.4 kg/m3 fresh feed 0.85 2 CONCAWE (2017)
NH3 0.16 kg/m3 fresh feed 0.093 0.22 CONCAWE (2017)
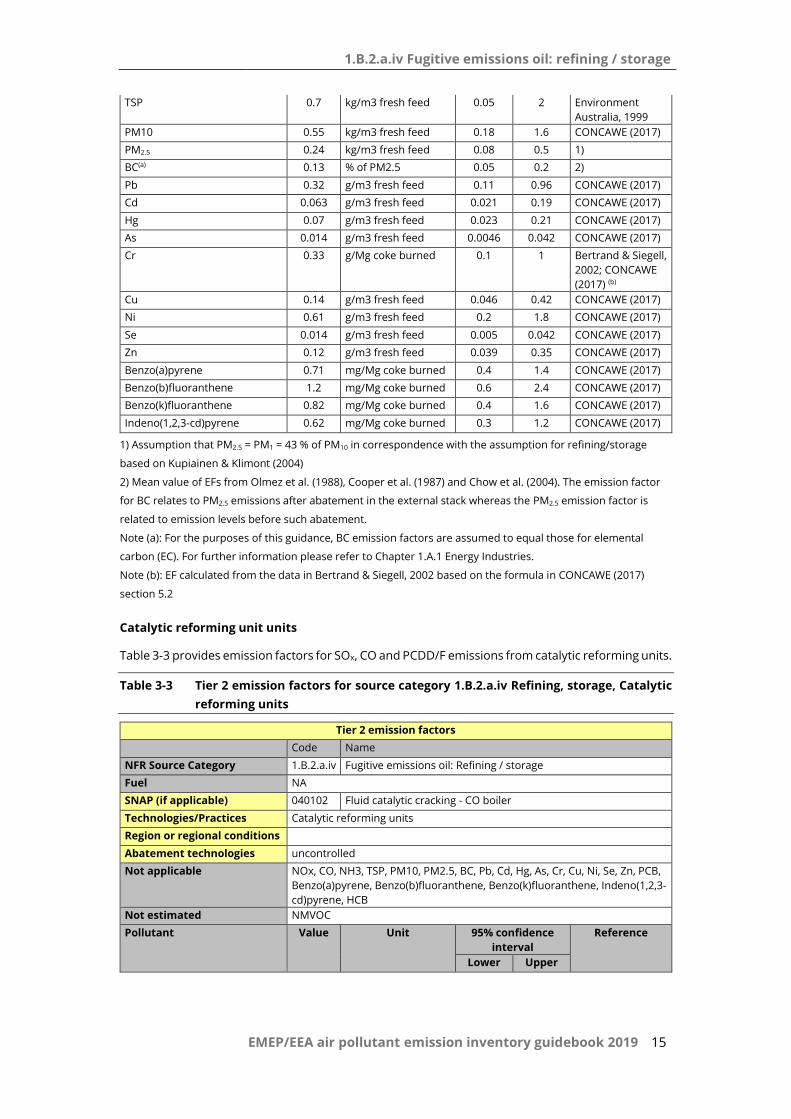
1.B.2.a.iv Fugitive emissions oil: refining / storage
EMEP/EEA air pollutant emission inventory guidebook 2019 15
TSP 0.7 kg/m3 fresh feed 0.05 2 Environment
Australia, 1999
PM10 0.55 kg/m3 fresh feed 0.18 1.6 CONCAWE (2017)
PM2.5 0.24 kg/m3 fresh feed 0.08 0.5 1)
BC(a) 0.13 % of PM2.5 0.05 0.2 2)
Pb 0.32 g/m3 fresh feed 0.11 0.96 CONCAWE (2017)
Cd 0.063 g/m3 fresh feed 0.021 0.19 CONCAWE (2017)
Hg 0.07 g/m3 fresh feed 0.023 0.21 CONCAWE (2017)
As 0.014 g/m3 fresh feed 0.0046 0.042 CONCAWE (2017)
Cr 0.33 g/Mg coke burned 0.1 1 Bertrand & Siegell,
2002; CONCAWE
(2017) (b)
Cu 0.14 g/m3 fresh feed 0.046 0.42 CONCAWE (2017)
Ni 0.61 g/m3 fresh feed 0.2 1.8 CONCAWE (2017)
Se 0.014 g/m3 fresh feed 0.005 0.042 CONCAWE (2017)
Zn 0.12 g/m3 fresh feed 0.039 0.35 CONCAWE (2017)
Benzo(a)pyrene 0.71 mg/Mg coke burned 0.4 1.4 CONCAWE (2017)
Benzo(b)fluoranthene 1.2 mg/Mg coke burned 0.6 2.4 CONCAWE (2017)
Benzo(k)fluoranthene 0.82 mg/Mg coke burned 0.4 1.6 CONCAWE (2017)
Indeno(1,2,3-cd)pyrene 0.62 mg/Mg coke burned 0.3 1.2 CONCAWE (2017)
1) Assumption that PM2.5 = PM1 = 43 % of PM10 in correspondence with the assumption for refining/storage
based on Kupiainen & Klimont (2004)
2) Mean value of EFs from Olmez et al. (1988), Cooper et al. (1987) and Chow et al. (2004). The emission factor
for BC relates to PM2.5 emissions after abatement in the external stack whereas the PM2.5 emission factor is
related to emission levels before such abatement.
Note (a): For the purposes of this guidance, BC emission factors are assumed to equal those for elemental
carbon (EC). For further information please refer to Chapter 1.A.1 Energy Industries.
Note (b): EF calculated from the data in Bertrand & Siegell, 2002 based on the formula in CONCAWE (2017)
section 5.2
Catalytic reforming unit units
Table 3-3 provides emission factors for SOx, CO and PCDD/F emissions from catalytic reforming units.
Table 3-3 Tier 2 emission factors for source category 1.B.2.a.iv Refining, storage, Catalytic
reforming units
Tier 2 emission factors
Code Name
NFR Source Category 1.B.2.a.iv Fugitive emissions oil: Refining / storage
Fuel NA
SNAP (if applicable) 040102 Fluid catalytic cracking - CO boiler
Technologies/Practices Catalytic reforming units
Region or regional conditions
Abatement technologies uncontrolled
Not applicable NOx, CO, NH3, TSP, PM10, PM2.5, BC, Pb, Cd, Hg, As, Cr, Cu, Ni, Se, Zn, PCB,
Benzo(a)pyrene, Benzo(b)fluoranthene, Benzo(k)fluoranthene, Indeno(1,2,3-
cd)pyrene, HCB
Not estimated NMVOC
Pollutant Value Unit 95% confidence
interval
Reference
Lower Upper

1.B.2.a.iv Fugitive emissions oil: refining / storage
EMEP/EEA air pollutant emission inventory guidebook 2019 16
CO 42 g/m3 feed 10 100 CONCAWE (2017)
SOx 4 g/m3 feed 2 10 CONCAWE (2017)
PCDD/F 0.019 ug I-TEQ/m3 fresh
feed
0.0019 0.19 CONCAWE (2017)
*
* Continuous regeneration mode. For semi-regenerative mode CONCAWE (2017) provide an emission factor of
6.35E-06 μg/m3 feed
Fluid coking units
Table 3-4 provides the uncontrolled emission factors for fluid coking units. When controlled by CO
or fired waste heat boiler, please refer to subsection 3.3.3.1 for abatement efficiencies.
Table 3-4 Tier 2 emission factors for source category 1.B.2.a.iv Refining, storage, Fluid
coking units
Tier 2 emission factors
Code Name
NFR Source Category 1.B.2.a.iv Fugitive emissions oil: Refining / storage
Fuel NA
SNAP (if applicable)
Technologies/Practices Fluid coking units
Region or regional conditions
Abatement technologies primary cyclone installed to abate particulates
Not applicable NOx, CO, NH3, TSP, PM10, PM2.5, BC, Pb, Cd, Hg, As, Cr, Cu, Ni, Se, Zn, PCB,
Benzo(a)pyrene, Benzo(b)fluoranthene, Benzo(k)fluoranthene, Indeno(1,2,3-
cd)pyrene, HCB
Not estimated SOx,PCDD/F
Pollutant Value Unit 95% confidence
interval
Reference
Lower Upper
NMVOC 0.046 kg/m3 fresh feed 0.02 0.2 CONCAWE (2017)
TSP 1.5 kg/m3 fresh feed 0.6 4.9 Environment
Australia (1999)
PM10 0.77 kg/m3 fresh feed 3 2.5 CONCAWE (2017)
PM2.5 0.33 kg/m3 fresh feed 0.2 1.6 1)
Pb 0.045 g/m3 fresh feed 0.02 0.2 CONCAWE (2017)
Hg 0.03 g/m3 fresh feed 0.01 0.1 CONCAWE (2017)
As 2.2 g/m3 fresh feed 1 6 CONCAWE (2017)
Cu 0.015 g/m3 fresh feed 0.01 0.6 CONCAWE (2017)
Ni 0.57 g/m3 fresh feed 0.2 2 CONCAWE (2017)
Se 0.03 g/m3 fresh feed 0.01 0.1 CONCAWE (2017)
Zn 0.045 g/m3 fresh feed 0.02 0.2 CONCAWE (2017)
1) Assumption that PM2.5 = PM1 = 43 % of PM10 in correspondence with the assumption for refining/storage
based on Kupiainen & Klimont (2004)
Blowdown systems
Gaseous emissions from refinery blowdown systems are recovered and/or flared. The emission
factors for refinery flares are provided in chapter 1.B.2.c Venting and flaring.
1.B.2.a.iv Fugitive emissions oil: refining / storage
EMEP/EEA air pollutant emission inventory guidebook 2019 17
Asphalt blowing
Emission factors for asphalt blowing are provided in sub-sector 3.C Chemical products.
At refineries, gaseous emissions from asphalt blowing are controlled, for example using a scrubber,
and then the tail-gas is passed to a thermal oxidiser. The emission factors for thermal oxidisers are
provided in chapter 1.B.2.c Venting and flaring.
Sulphur recovery
SO2 emissions from sulphur recovery can be estimated by using the Tier 2 emission factor in Table
3-5 below. It is assumed that all sulphur recovery operations are two-staged and no control
technology for tail-gas cleanup is applied. Emissions of SO2 would then be conservatively estimated
by using the highest uncontrolled emission factor and the total amount of sulphur produced through
sulphur recovery processes. This would provide an upper bound to the likely emissions, but in the
absence of more detailed production information represents an acceptable estimation method to
use. More detail about emissions from sulphur recovery is provided in Tier 3 by using a process
model.
Table 3-5 Tier 2 emission factors for source category 1.B.2.a.iv Refining, storage, Sulphur
recovery
Tier 2 emission factors
Code Name
NFR Source Category 1.B.2.a.iv Fugitive emissions oil: Refining / storage
Fuel NA
SNAP (if applicable) 040103 Sulphur recovery plants
Technologies/Practices Two-staged sulphur recovery operations
Region or regional conditions
Abatement technologies no control technology for tail-gas cleanup
Not applicable NOx, CO, NH3, TSP, PM10, PM2.5, BC, Pb, Cd, Hg, As, Cr, Cu, Ni, Se, Zn, PCB,
Benzo(a)pyrene, Benzo(b)fluoranthene, Benzo(k)fluoranthene, Indeno(1,2,3-
cd)pyrene, HCB
Not estimated NMVOC, PCDD/F
Pollutant Value Unit 95% confidence
interval
Reference
Lower Upper
SOx 140 kg/Mg sulphur
produced
50 400 CONCAWE (2017)
Gasoline storage
For depots of gasoline in refineries, refer to the Tier 3 section.
Diffuse NMVOC emissions, including those from volatile product storage and handling, drain
systems/water treatment and process fugitive sources, are estimated by combining the crude oil
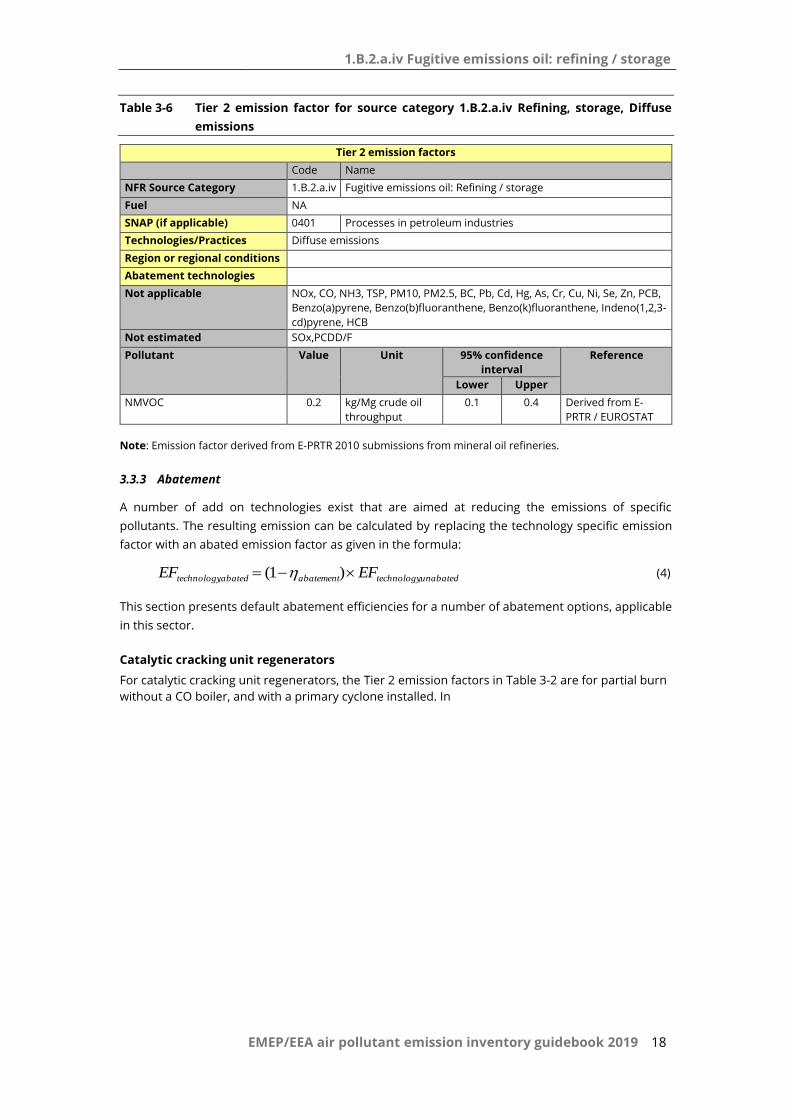
throughput of each refinery with the emission factor provided in Table 3–6.
1.B.2.a.iv Fugitive emissions oil: refining / storage
EMEP/EEA air pollutant emission inventory guidebook 2019 18
Table 3-6 Tier 2 emission factor for source category 1.B.2.a.iv Refining, storage, Diffuse
emissions
Tier 2 emission factors
Code Name
NFR Source Category 1.B.2.a.iv Fugitive emissions oil: Refining / storage
Fuel NA
SNAP (if applicable) 0401 Processes in petroleum industries
Technologies/Practices Diffuse emissions
Region or regional conditions
Abatement technologies
Not applicable NOx, CO, NH3, TSP, PM10, PM2.5, BC, Pb, Cd, Hg, As, Cr, Cu, Ni, Se, Zn, PCB,
Benzo(a)pyrene, Benzo(b)fluoranthene, Benzo(k)fluoranthene, Indeno(1,2,3-
cd)pyrene, HCB
Not estimated SOx,PCDD/F
Pollutant Value Unit 95% confidence
interval
Reference
Lower Upper
NMVOC 0.2 kg/Mg crude oil
throughput
0.1 0.4 Derived from E-
PRTR / EUROSTAT
Note: Emission factor derived from E-PRTR 2010 submissions from mineral oil refineries.
3.3.3 Abatement
A number of add on technologies exist that are aimed at reducing the emissions of specific
pollutants. The resulting emission can be calculated by replacing the technology specific emission
factor with an abated emission factor as given in the formula:
unabatedtechnologyabatementabatedtechnology EFEF ,, )1( (4)
This section presents default abatement efficiencies for a number of abatement options, applicable
in this sector.
Catalytic cracking unit regenerators
For catalytic cracking unit regenerators, the Tier 2 emission factors in Table 3-2 are for partial burn
without a CO boiler, and with a primary cyclone installed. In
1.B.2.a.iv Fugitive emissions oil: refining / storage
EMEP/EEA air pollutant emission inventory guidebook 2019 19
Table 3-7, abatement efficiencies for other techniques are calculated with respect to these emission
factors.
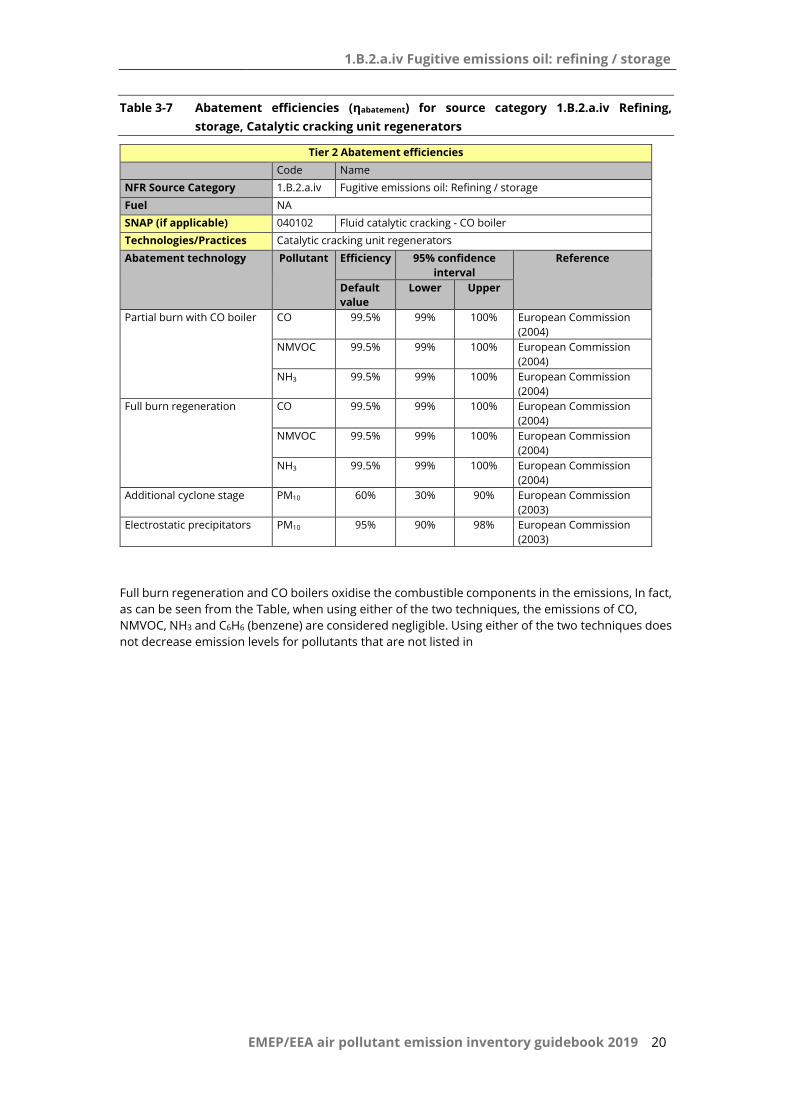
1.B.2.a.iv Fugitive emissions oil: refining / storage
EMEP/EEA air pollutant emission inventory guidebook 2019 20
Table 3-7 Abatement efficiencies (ηabatement) for source category 1.B.2.a.iv Refining,
storage, Catalytic cracking unit regenerators
Tier 2 Abatement efficiencies
Code Name
NFR Source Category 1.B.2.a.iv Fugitive emissions oil: Refining / storage
Fuel NA
SNAP (if applicable) 040102 Fluid catalytic cracking - CO boiler
Technologies/Practices Catalytic cracking unit regenerators
Abatement technology Pollutant Efficiency 95% confidence
interval
Reference
Default
value
Lower Upper
Partial burn with CO boiler CO 99.5% 99% 100% European Commission
(2004)
NMVOC 99.5% 99% 100% European Commission
(2004)
NH3 99.5% 99% 100% European Commission
(2004)
Full burn regeneration CO 99.5% 99% 100% European Commission
(2004)
NMVOC 99.5% 99% 100% European Commission
(2004)
NH3 99.5% 99% 100% European Commission
(2004)
Additional cyclone stage PM10 60% 30% 90% European Commission
(2003)
Electrostatic precipitators PM10 95% 90% 98% European Commission
(2003)
Full burn regeneration and CO boilers oxidise the combustible components in the emissions, In fact,
as can be seen from the Table, when using either of the two techniques, the emissions of CO,
NMVOC, NH3 and C6H6 (benzene) are considered negligible. Using either of the two techniques does
not decrease emission levels for pollutants that are not listed in

1.B.2.a.iv Fugitive emissions oil: refining / storage
EMEP/EEA air pollutant emission inventory guidebook 2019 21
Table 3-7.
The basic catalytic cracking regenerator design normally incorporates, inside the regenerator vessel,
cyclone systems to separate the catalyst particles from the hydrocarbon vapours. Additional cyclone
systems and/or electrostatic precipitators may be installed external to the regenerator to abate
further the particulate emissions.
3.3.4 Activity data
The crude oil throughput for each refinery is required. For calculating emissions from sulphur
recovery, the amount of sulphur produced is necessary. For catalytic cracking units and cokers the
total amount of fresh feed to the units is required. On a national basis the total amount of fresh feed
for each type of unit can be assumed to equal the total design capacities of the catalytic cracking
units and cokers installed in refineries.
3.4 Tier 3 emission modelling and use of facility data
3.4.1 Algorithm
There are two different methods to apply emission estimation methods that go beyond the
technology-specific approach described above:
detailed modelling of the process;
using facility-level reports.
Detailed process modelling
A Tier 3 emission estimate using process details will make separate estimates for each process taking
account of abatement systems installed. For example, it will use knowledge of equipment
components fitted in the refinery to provide estimates of process fugitive emissions. For storage
tanks, details of tank size, fittings, etc., can be used to estimate emissions on a tank by tank basis.
Facility-level data
Where facility-level emission data of sufficient quality are available (see Chapter 6, Inventory
management, improvement and QA/QC in part A), it is good practice to indeed use these data. There
are two possibilities:
the facility reports cover all the refineries in the country;
facility-level emission reports are not available for all refineries in the country.
If facility level data are covering all refineries in the country, it is good practice to compare the implied
emission factors (reported emissions divided by the national refined oil product production) with
the default emission factor values or technology-specific emission factors. If the implied emission
factors are outside the 95 % confidence intervals for the values given below, it is good practice to
explain the reasons for this in the inventory report.
If the total annual crude oil throughput from refineries in the country is not included in the total of
the facility reports, it is good practice to estimate the missing part of the national total emissions
from the source category, using extrapolation by applying:

1.B.2.a.iv Fugitive emissions oil: refining / storage
EMEP/EEA air pollutant emission inventory guidebook 2019 22
EFProductionProductionNationalEEFacilities
Facility
Facilities
pollutantFacilitypollutantTotal
,,
(5)
Depending on the specific national circumstances and the coverage of the facility level reports as
compared to the national crude oil throughput in refineries, it is good practice to choose the
emission factor (EF) in this equation from the following possibilities, in decreasing order of
preference:
technology specific emission factors, based on knowledge of the types of technologies
implemented at the facilities where facility level emission reports are not available,
the implied emission factor derived from the available emission reports:
Facilities
Facility
Facilities
pollutantFacility
Production
E
EF,
(6)
the default Tier 1 emission factor. It is good practice to choose this option only if the facility level
emission reports cover more than 90 % of the total national production.
3.4.2 Tier 3 emission modelling and use of facility data
Process emissions
Tier 2 estimation of emissions from catalytic cracking processes and fluid cokers uses the design
capacities of these types of units to derive the value of total fresh feed.
For Tier 3, the actual fresh feed data from individual refinery process plants should be used.
Sulphur recovery
If allowed by the availability of activity data, the preferred methodology for estimating SO2 emissions
from sulphur recovery would involve either a sulphur mass balance or the measurement of
emissions from each plant to develop site-specific emission factors or emissions data for all
potentially significant sources.
In the mass balance approach, at minimum, the sulphur content and volumes of sulphur recovery
plant feed gas materials (e.g. sour gas streams or absorption tower sulphide off-gas) are needed to
define the mass of input sulphur. This may also comprise sulphur input from sour water stripping of
waste-waters. In conjunction with the mass of elemental sulphur produced, the quantity of sulphur
in tail gas emissions requires determination. This may be done by calculating the sulphur recovery
efficiency with a knowledge of the number and type of sulphur recovery units including Claus plant
catalytic stages and/or measuring the volume and sulphur content of the tail gas. Account should
also be made of SO2 emissions associated with catalyst regeneration, where practised on-site, as
well as unaccounted losses to confirm the balance. Upon conversion to SO2, the emissions from
sulphur recovery operations (expressed as kg SO2 per Mg pure elemental sulphur produced) may be
calculated by:
2000 x %recovery
%recovery - 100 = (kg/Mg) emissions SO2 . (7)
In instances where the tail gas is treated further by scrubbers or incinerators, the emissions may be
best determined by stack testing. Emission factors could then be used to calculate emissions, as
1.B.2.a.iv Fugitive emissions oil: refining / storage
EMEP/EEA air pollutant emission inventory guidebook 2019 23
required, until such time as the process or emissions controls are significantly changed. At this time,
it is good practice to derive new site-specific emission factors based on testing or mass balance
determinations.
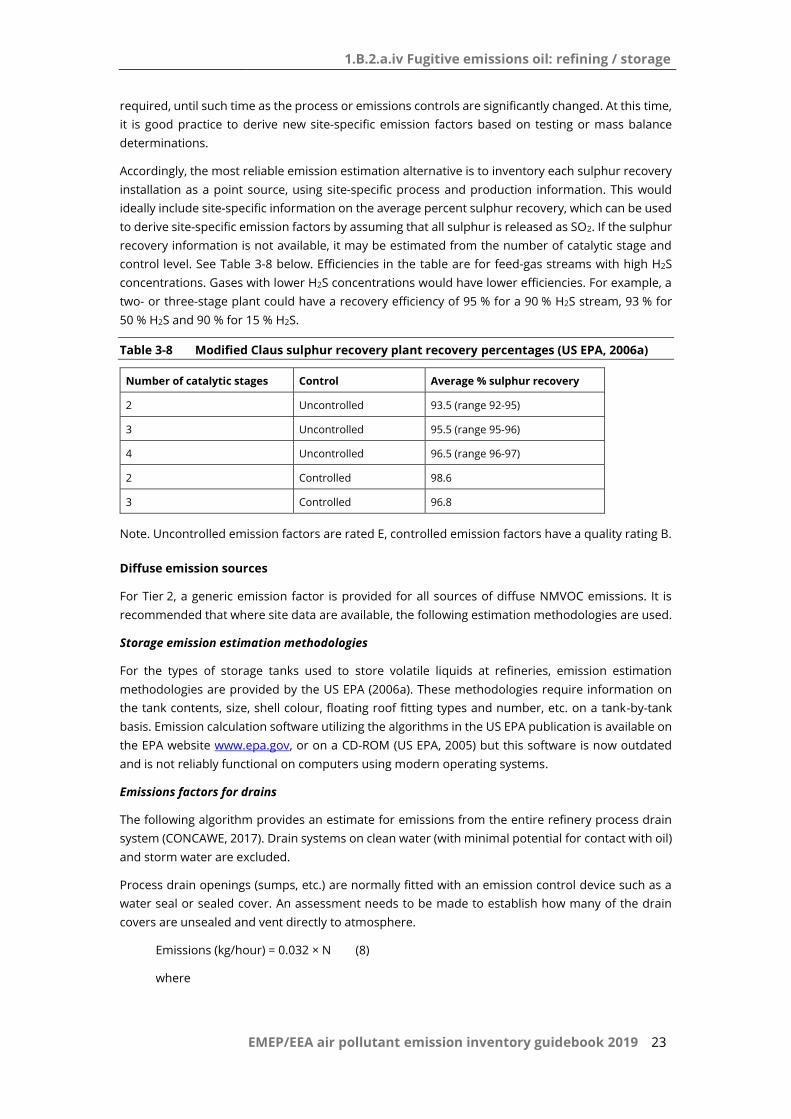
Accordingly, the most reliable emission estimation alternative is to inventory each sulphur recovery
installation as a point source, using site-specific process and production information. This would
ideally include site-specific information on the average percent sulphur recovery, which can be used
to derive site-specific emission factors by assuming that all sulphur is released as SO2. If the sulphur
recovery information is not available, it may be estimated from the number of catalytic stage and
control level. See Table 3-8 below. Efficiencies in the table are for feed-gas streams with high H2S
concentrations. Gases with lower H2S concentrations would have lower efficiencies. For example, a
two- or three-stage plant could have a recovery efficiency of 95 % for a 90 % H2S stream, 93 % for
50 % H2S and 90 % for 15 % H2S.
Table 3-8 Modified Claus sulphur recovery plant recovery percentages (US EPA, 2006a)
Number of catalytic stages Control Average % sulphur recovery
2 Uncontrolled 93.5 (range 92-95)
3 Uncontrolled 95.5 (range 95-96)
4 Uncontrolled 96.5 (range 96-97)
2 Controlled 98.6
3 Controlled 96.8
Note. Uncontrolled emission factors are rated E, controlled emission factors have a quality rating B.
Diffuse emission sources
For Tier 2, a generic emission factor is provided for all sources of diffuse NMVOC emissions. It is
recommended that where site data are available, the following estimation methodologies are used.
Storage emission estimation methodologies
For the types of storage tanks used to store volatile liquids at refineries, emission estimation
methodologies are provided by the US EPA (2006a). These methodologies require information on
the tank contents, size, shell colour, floating roof fitting types and number, etc. on a tank-by-tank
basis. Emission calculation software utilizing the algorithms in the US EPA publication is available on
the EPA website www.epa.gov, or on a CD-ROM (US EPA, 2005) but this software is now outdated
and is not reliably functional on computers using modern operating systems.
Emissions factors for drains
The following algorithm provides an estimate for emissions from the entire refinery process drain
system (CONCAWE, 2017). Drain systems on clean water (with minimal potential for contact with oil)
and storm water are excluded.
Process drain openings (sumps, etc.) are normally fitted with an emission control device such as a
water seal or sealed cover. An assessment needs to be made to establish how many of the drain
covers are unsealed and vent directly to atmosphere.
Emissions (kg/hour) = 0.032 × N (8)
where
1.B.2.a.iv Fugitive emissions oil: refining / storage
EMEP/EEA air pollutant emission inventory guidebook 2019 24
N = number of unsealed covers in the refinery process drain system.
If the total number of drains is unknown, a drain count of 2.6 drains per pump in process areas can
be used.
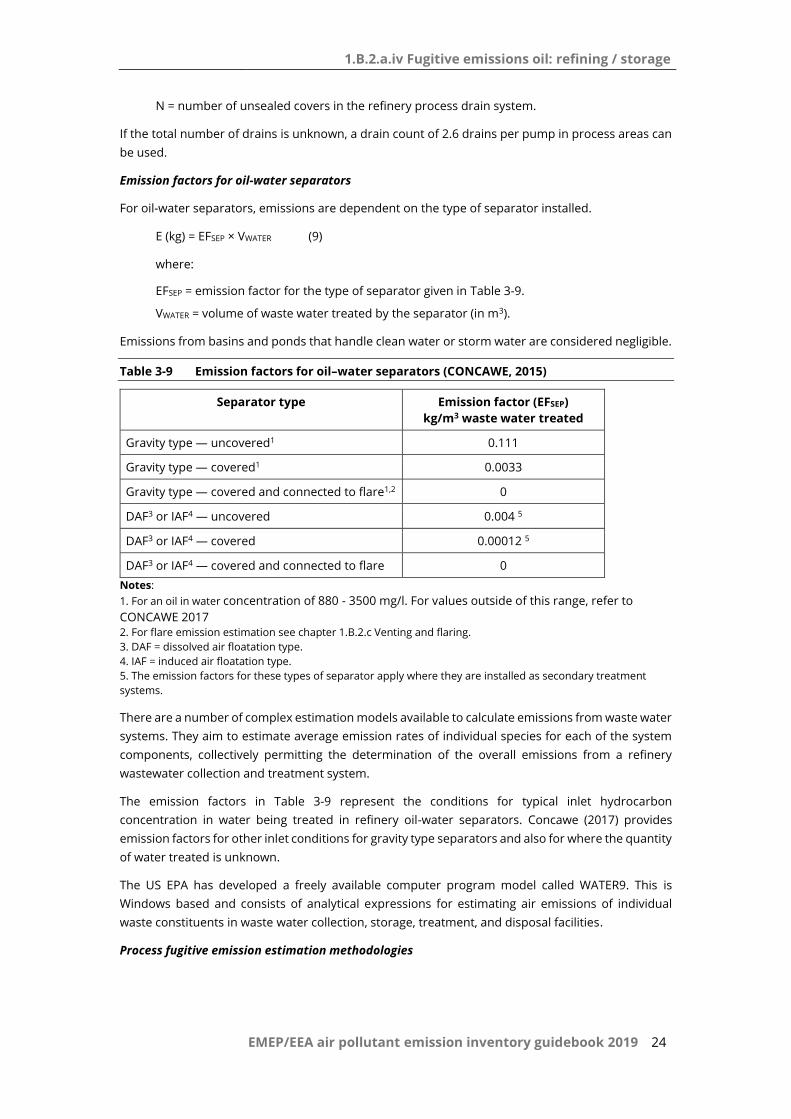
Emission factors for oil-water separators
For oil-water separators, emissions are dependent on the type of separator installed.
E (kg) = EFSEP × VWATER (9)
where:
EFSEP = emission factor for the type of separator given in Table 3-9.
VWATER = volume of waste water treated by the separator (in m3).
Emissions from basins and ponds that handle clean water or storm water are considered negligible.
Table 3-9 Emission factors for oil–water separators (CONCAWE, 2015)
Separator type Emission factor (EFSEP)
kg/m3 waste water treated
Gravity type — uncovered1 0.111
Gravity type — covered1 0.0033
Gravity type — covered and connected to flare1,2 0
DAF3 or IAF4 — uncovered 0.004 5
DAF3 or IAF4 — covered 0.00012 5
DAF3 or IAF4 — covered and connected to flare 0
Notes:
1. For an oil in water concentration of 880 - 3500 mg/l. For values outside of this range, refer to
CONCAWE 2017
2. For flare emission estimation see chapter 1.B.2.c Venting and flaring.
3. DAF = dissolved air floatation type.
4. IAF = induced air floatation type.
5. The emission factors for these types of separator apply where they are installed as secondary treatment
systems.
There are a number of complex estimation models available to calculate emissions from waste water
systems. They aim to estimate average emission rates of individual species for each of the system
components, collectively permitting the determination of the overall emissions from a refinery
wastewater collection and treatment system.
The emission factors in Table 3-9 represent the conditions for typical inlet hydrocarbon
concentration in water being treated in refinery oil-water separators. Concawe (2017) provides
emission factors for other inlet conditions for gravity type separators and also for where the quantity
of water treated is unknown.
The US EPA has developed a freely available computer program model called WATER9. This is
Windows based and consists of analytical expressions for estimating air emissions of individual
waste constituents in waste water collection, storage, treatment, and disposal facilities.
Process fugitive emission estimation methodologies
1.B.2.a.iv Fugitive emissions oil: refining / storage
EMEP/EEA air pollutant emission inventory guidebook 2019 25
The methods for estimating mass emissions from process equipment leaks ranges from the use of
equipment component average emission factors, which requires knowledge of pan-refinery
equipment counts, to comprehensive field leak detection techniques and related emission
correlations. These methods have evolved from a number of studies of the organic chemical and
petroleum refining industries (US EPA, 1995a; CEN, 2008).
3.4.2.1..1 Average equipment component emission factors
These emissions factors are expressed as losses per equipment component per hour. CEN (2008)
provides average emission factors for the different types of pressurized components in volatile
product service. These are provided in Table 3–10.

1.B.2.a.iv Fugitive emissions oil: refining / storage
EMEP/EEA air pollutant emission inventory guidebook 2019 26
Table 3-10 Average NMVOC emission factors for petroleum refineries for fugitive emissions
from pressurised components (CEN, 2008)
Equipment type Service Emission factor
kg/hr/source
Valves Gas 0.0268
Light liquid 0.0109
Pump seals Light liquid 0.114
Compressor seals Gas 0.636
Pressure relief valves Gas 0.160
Flanges and non-flanged connectors All 0.00025
Open-ended lines All 0.0023
Sampling connections All 0.015
3.4.2.1..2 Leak monitoring surveys
Emissions from pressurised components can be determined using leak monitoring surveys on a
sample of equipment and then using methodologies depending upon the magnitude of the leak
concentration.
There are two tiers of measurement methodology:
applying average emission factors based on a leak/no leak criteria. This requires the use of
monitoring equipment to measure VOC concentrations at each fitting to establish if a leak
‘threshold’ has been exceeded;
applying emission correlations based on actual VOC concentration values determined at each
fitting.
These surveys can be refinery-wide. Alternatively, they may be partial programs comprising either
emission surveys of all components but only on some process units, or surveys on a limited range
of components, e.g. valves and pumps only on light liquid duty.
Full details on the calculation of emissions are provided by the US EPA (1995a) and in the European
CEN Standard (CEN, 2008).
A more recent development is the use of handheld optical imaging devices to detect leaking
components, permitting surveys to be undertaken more quickly (Lev-On et al, 2007). Leak/No-Leak
emission factors for use with these devices are provided in CONCAWE (2017) . Concawe (2015b)
provides a recommendation for the factors to be used. Further developments are currently taking
place with the technology which will provide an optical imaging device providing leak quantification.
3.4.3 Activity data
Depending on the type of method being used, different activity statistics are required. For instance,
for fugitive losses the NMVOC emissions depend on the amount of pressurised components.
1.B.2.a.iv Fugitive emissions oil: refining / storage
EMEP/EEA air pollutant emission inventory guidebook 2019 27
4 Data quality
4.1 Completeness
No specific issues.
4.2 Avoiding double counting with other sectors
Care should be taken regarding the emissions from petroleum refinery processes. Not all processes
in refineries that could result in the emissions to the air are included in this chapter:
emissions from the crude oil feed stock handling are covered by chapter 1.B.2.a.i;
combustion processes in refineries are covered by chapter 1.A.1.b;
emissions from flaring are covered by chapter 1.B.2.c. Incineration of ground flares is also
included in chapter 1.B.2.c and not in 6.C.b, since the latter chapter focuses on solid and liquid
wastes, not gases;
emissions from asphalt (bitumen) blowing are covered by sub-sector 3.C;
emissions due to loading at refinery dispatch facilities are covered by chapter 1.B.2.a.v;
emissions due to waste water treatment in refineries and sulphur recovery are included in this
chapter.
4.3 Verification
There are more sophisticated and accurate methods to estimate fugitive process emissions (US EPA,
1995a). All of these methods involve the use of screening data, which are collected by using a
portable monitoring instrument to sample air from potential leak interfaces on individual pieces of
equipment. A screening value is a measure of the concentration, in ppmv, of leaking compounds in
the ambient air near the equipment in question. The EPA has detailed what is involved in an
acceptable screening program in the protocol for equipment leak emission estimation manual (US
EPA, 1995a).
The approaches to estimating equipment leak emissions based on screening data are:
screening ranges approach
EPA correlation approach, and
unit-specific correlation approach.
In the screening value approach, it is assumed that components having screening values greater
than 10 000 ppmv have a different average emission rate than components with screening values
less than 10 000 ppmv.
The EPA correlation approach offers an additional refinement by providing an equation to predict
mass emission rate as a function of screening value.
In the last approach, mass emissions rates are determined by bagging a specific type of equipment.
The associated screening value can then be used to develop a leak rate/screening value correlation
for that equipment in that process unit.
All of these methods are described in detail in the protocol document (US EPA, 1995a).
1.B.2.a.iv Fugitive emissions oil: refining / storage
EMEP/EEA air pollutant emission inventory guidebook 2019 28
Remote sensing using optical gas imaging may be used to identify, for example, if any external
floating roof storage tanks are operating outside of the performance bounds for which emission
factors are valid, permitting focussed maintenance to ensure that factors can then be used for these
sources for inventory purposes.
4.3.1 Best Available Technique emission factors
An extensive reference document exists on the Best Available Techniques in refineries (European
Commission, 2003 and European Commission, 2015). This document describes the necessary
actions to achieve BAT emission levels; however no specific emission levels are given for the refinery
sector in general. For more information, please refer to this document.
4.4 Developing a consistent time series and recalculation
No specific issues
4.5 Uncertainty assessment
4.5.1 Emission factor uncertainties
No specific issues.
4.5.2 Activity data uncertainties
No specific issues.
4.6 Inventory quality assurance/quality control QA/QC
No specific issues
4.7 Gridding
No specific issues
4.8 Reporting and documentation
No specific issues
1.B.2.a.iv Fugitive emissions oil: refining / storage
EMEP/EEA air pollutant emission inventory guidebook 2019 29
5 References
Bertrand, R.R., & Siegell, J.H. (2002): Emission of trace compounds from catalytic cracking
regenerators. Environmental Progress, Vol. 21, No. 3.
Canadian Petroleum Products Institute (CPPI) and Environment Canada (1991). ‘Atmospheric
emissions from Canadian petroleum refineries and the associated gasoline distribution system for
1988’. CPPI Report No 91 –7. Prepared by B.H. Levelton & Associates Ltd and RTM Engineering Ltd.
CEN (2008). ‘Fugitive and diffuse emissions of common concern to industry sectors — Measurement
of fugitive emission of vapours generating from equipment and piping leaks. Standard No EN 15446:
2008. Brussels: Comité Européen de Normalisation.
Chow, J.C., Watson, J.G., Kuhns, H., Etyemezian, V., Lowenthal, D.H., Crow, D., Kohl, S.D., Engelbrecht,
J.P. and Green, M.C. (2004): Source profiles for industrial, mobile, and area sources in the Big Bend
Regional Aerosol Visibility and Observational study. Chemosphere 54, pp. 185-208
Cooper, J.A., Redline, D.C., Sherman, J.R., Valdovinos, L.M., Pollard, W.L., Scavone, L.C. and Badgett-
West, C. (1987): PM10 source composition library for the south coast air basin. Volume II.
Concawe (2017), ‘Air pollutant emission estimation methods for E-PRTR reporting by refineries, 2017
edition,’ CONCAWE Report 4/17, 2017, (https://www.concawe.eu/wp-
content/uploads/2017/04/Rpt_17-4.pdf), accessed 5 June 2019.
Environment Australia, 1999: Emission Estimation Technique Manual for Petroleum Refining.
(http://www.npi.gov.au/resource/emission-estimation-technique-manual-petroleum-refining),
accessed 5 June 2019.
European Commission (2003). Integrated Pollution Prevention and Control (IPPC), reference
document on best available technologies for mineral oil and refineries, February 2003,
(https://eippcb.jrc.ec.europa.eu/reference/), accessed 23 July 2019.
European Commission (2004). Commission decision of 29 January 2004 establishing Guidelines for
the monitoring and reporting of greenhouse gas emissions pursuant to Directive 2003/87/EC of the
European Parliament and of the Council (2004/156/EC). Official Journal of the European
Communities No L59, 26.2.2004.
European Commission (2005). Integrated Pollution Prevention and Control (IPPC), reference
document on best available techniques on emissions from storage, January 2005,
(https://eippcb.jrc.ec.europa.eu/reference/), accessed 23 July 2019.
European Commission (2015), ‘Best available techniques (BAT) reference document for the refining
of mineral oil and gas,’ Report 27140 EN, European IPPC Bureau, 2015, ,
(https://eippcb.jrc.ec.europa.eu/reference/), accessed 23 July 2019.
European IPPC Bureau (EIPPCB) (2003). Reference document on the general principles of monitoring.
Seville, July 2003.
Kupiainen, K. & Klimont Z., 2004: Primary Emissions of Submicron and Carbonaceous Particles in
Europe and the Potential for their Control. IIASA Interim Report IR-04-079

1.B.2.a.iv Fugitive emissions oil: refining / storage
EMEP/EEA air pollutant emission inventory guidebook 2019 30
Lev-On M, Epperson D, Siegell J and Ritter K et al. (2007). ‘Derivation of new emission factors for the
quantification of mass emissions when using optical gas imaging for detecting leaks’, Journal of the
Air and Waste Management Association (JAWMA), Vol. 57, Issue No 9, September 2007.
Olmez, I., Sheffield, A.E., Gordon, G.E., Houck, J.E., Pritchett, L.C., Cooper, J.A., Dzubay, T.G. and
Bennet, R.L. (1988): Compositions of particles from selected sources in Philadelphia for receptor
modelling application. JAPCA, 38:11, pp. 1392-1402.
US EPA, 1995a. Protocol for equipment leak emission estimates, EPA-453/R-95-017. Office of Air
Quality Planning and Standards, United States Environmental Protection Agency, Research Triangle
Park, North Carolina.
US EPA, 1995b. AP-42 Section 5.1 Petroleum Refining. United States Environmental Protection
Agency, Research Triangle Park, North Carolina, , (https://www.epa.gov/air-emissions-factors-and-
quantification/ap-42-compilation-air-emissions-factors), accessed 19 July 2019.
US EPA, 2005. Air Chief CD-ROM, EPA No EPA-454/C-05-001, Version 12. Office of Air Quality Planning
and Standards, United States Environmental Protection Agency, Research Triangle Park, North
Carolina.
US EPA, 2006a. ‘Compilation of air pollutant emission factors’, Vol. I: Stationary point and area
sources. AP-42 fifth edition. Office of Air Quality Planning and Standards, Research Triangle Park,
North Carolina, (https://www.epa.gov/air-emissions-factors-and-quantification/ap-42-compilation-
air-emissions-factors), accessed 19 July 2019.
US EPA, 2006b. An inventory of sources and environmental releases of dioxin-like compounds in the
United States for the years 1987, 1995 and 2000. EPA/600/P-03/002F, United States Environmental
Protection Agency, Research Triangle Park, North Carolina.
6 Point of enquiry
Enquiries concerning this chapter should be directed to the relevant leader(s) of the Task Force on
Emission Inventories and Projection’s expert panel on combustion and industry. Please refer to the
TFEIP website (www.tfeip-secretariat.org/) for the contact details of the current expert panel leaders.