Embed Size (px)
Citation preview
© 2018 Drillinginfo, Inc. All rights reserved. All brand names and trademarks are the properties of their respective companies.
learn more at drillinginfo.com
CATCH ME IF YOU CAN
FundamentalEdge Report | March 2018PREVIEW
© 2018 Drillinginfo, Inc. All rights reserved. All brand names and trademarks are the properties of their respective companies.
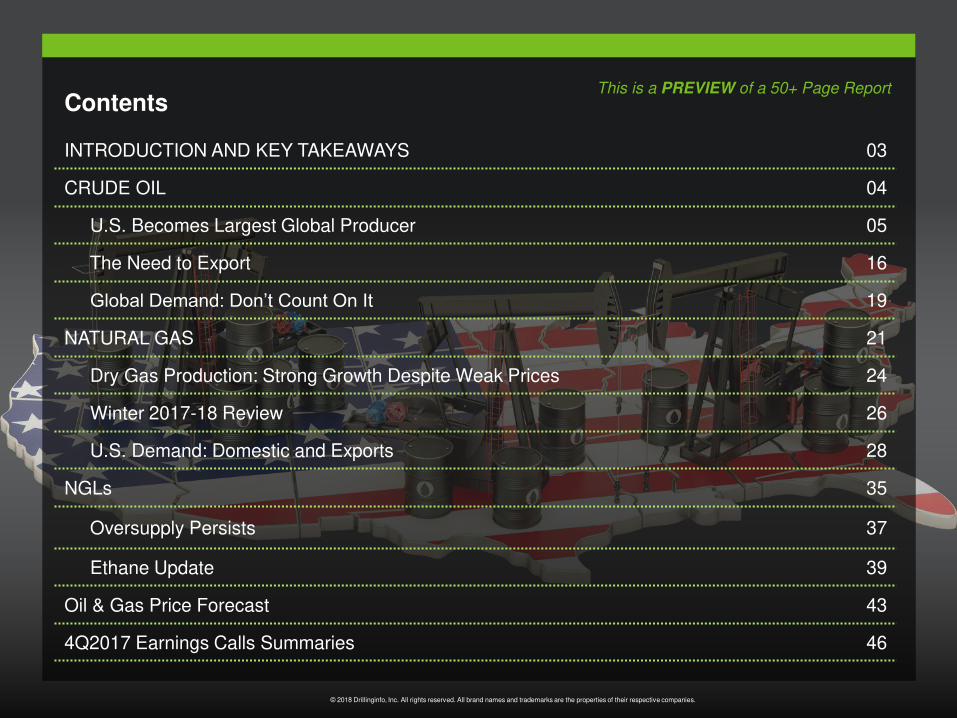
Contents
INTRODUCTION AND KEY TAKEAWAYS 03
CRUDE OIL 04
U.S. Becomes Largest Global Producer 05
The Need to Export 16
Global Demand: Don’t Count On It 19
NATURAL GAS 21
Dry Gas Production: Strong Growth Despite Weak Prices 24
Winter 2017-18 Review 26
U.S. Demand: Domestic and Exports 28
NGLs 35
Oversupply Persists 37
Ethane Update 39
Oil & Gas Price Forecast 43
4Q2017 Earnings Calls Summaries 46
This is a PREVIEW of a 50+ Page Report
© 2018 Drillinginfo, Inc. All rights reserved. All brand names and trademarks are the properties of their respective companies.
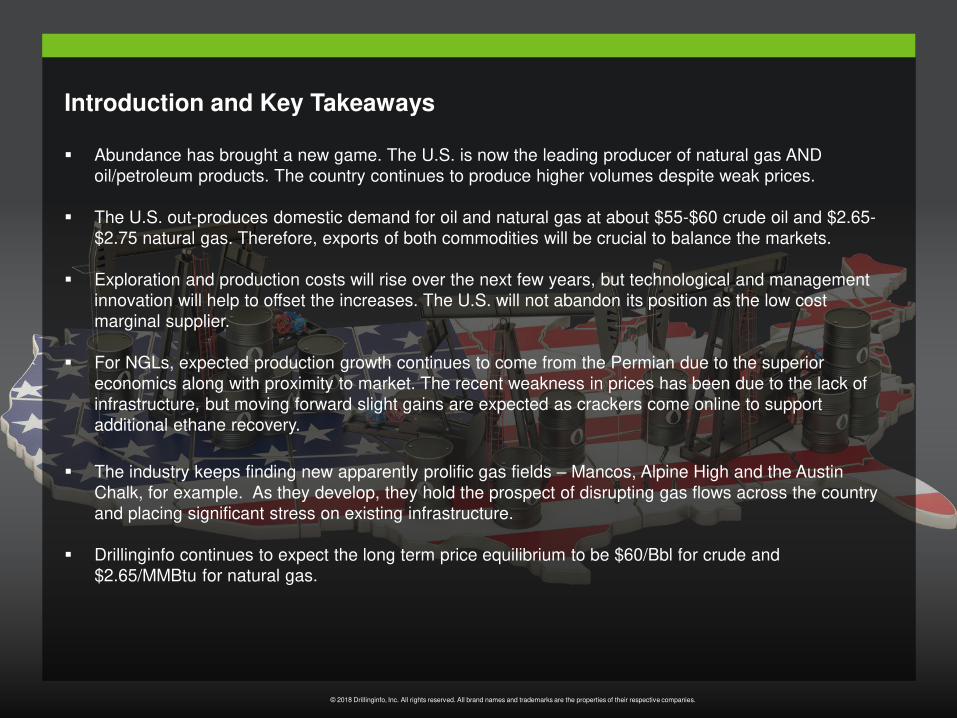
Introduction and Key Takeaways
▪ Abundance has brought a new game. The U.S. is now the leading producer of natural gas AND oil/petroleum products. The country continues to produce higher volumes despite weak prices.
▪ The U.S. out-produces domestic demand for oil and natural gas at about $55-$60 crude oil and $2.65-$2.75 natural gas. Therefore, exports of both commodities will be crucial to balance the markets.
▪ Exploration and production costs will rise over the next few years, but technological and management innovation will help to offset the increases. The U.S. will not abandon its position as the low cost marginal supplier.
▪ For NGLs, expected production growth continues to come from the Permian due to the superior economics along with proximity to market. The recent weakness in prices has been due to the lack of infrastructure, but moving forward slight gains are expected as crackers come online to support additional ethane recovery.
▪ The industry keeps finding new apparently prolific gas fields – Mancos, Alpine High and the Austin Chalk, for example. As they develop, they hold the prospect of disrupting gas flows across the country and placing significant stress on existing infrastructure.
▪ Drillinginfo continues to expect the long term price equilibrium to be $60/Bbl for crude and $2.65/MMBtu for natural gas.
Catch Me If You Can © 2018 Drillinginfo, Inc. All rights reserved. All brand names and trademarks are the properties of their respective companies. 4
US On Track To Become Largest Producer of Crude Oil
5,000
6,000
7,000
8,000
9,000
10,000
11,000
12,000
20
10
20
11
20
12
20
13
20
14
20
15
20
16
20
17
20
18
Cru
de
Oil
Pro
du
ctio
n (
MB
bl/
d)
Saudi Arabia Russia US
Global Crude Oil Production
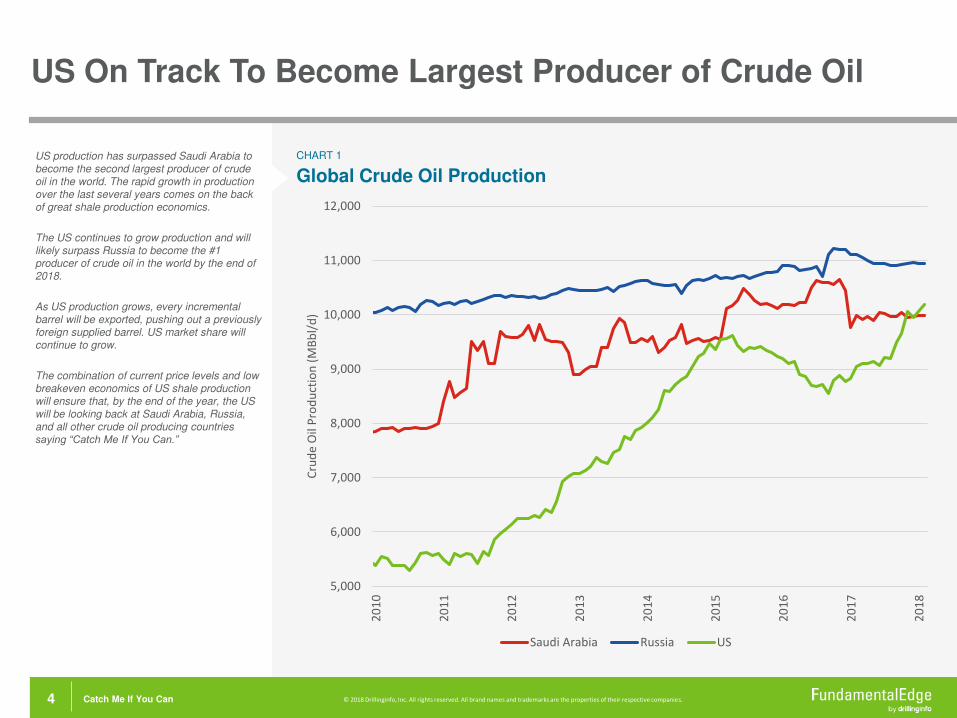
CHART 1US production has surpassed Saudi Arabia to become the second largest producer of crude oil in the world. The rapid growth in production over the last several years comes on the back of great shale production economics.
The US continues to grow production and will likely surpass Russia to become the #1 producer of crude oil in the world by the end of 2018.
As US production grows, every incremental barrel will be exported, pushing out a previously foreign supplied barrel. US market share will continue to grow.
The combination of current price levels and low breakeven economics of US shale production will ensure that, by the end of the year, the US will be looking back at Saudi Arabia, Russia, and all other crude oil producing countries saying “Catch Me If You Can.”
Catch Me If You Can © 2018 Drillinginfo, Inc. All rights reserved. All brand names and trademarks are the properties of their respective companies. 5
US Production: Efficiency Gains Offset Cost Increases
Source: DI ProdCast
8
9
10
11
12
13
14
15
20
14
20
15
20
16
20
17
20
18
20
19
20
20
20
21
20
22
20
23
Cru
de O
il P
roduction (
MM
Bbl/d)
+10% Service Costs
+20% Service Costs
+20% Service Costs & +10% IP Rate
Current DI Forecast
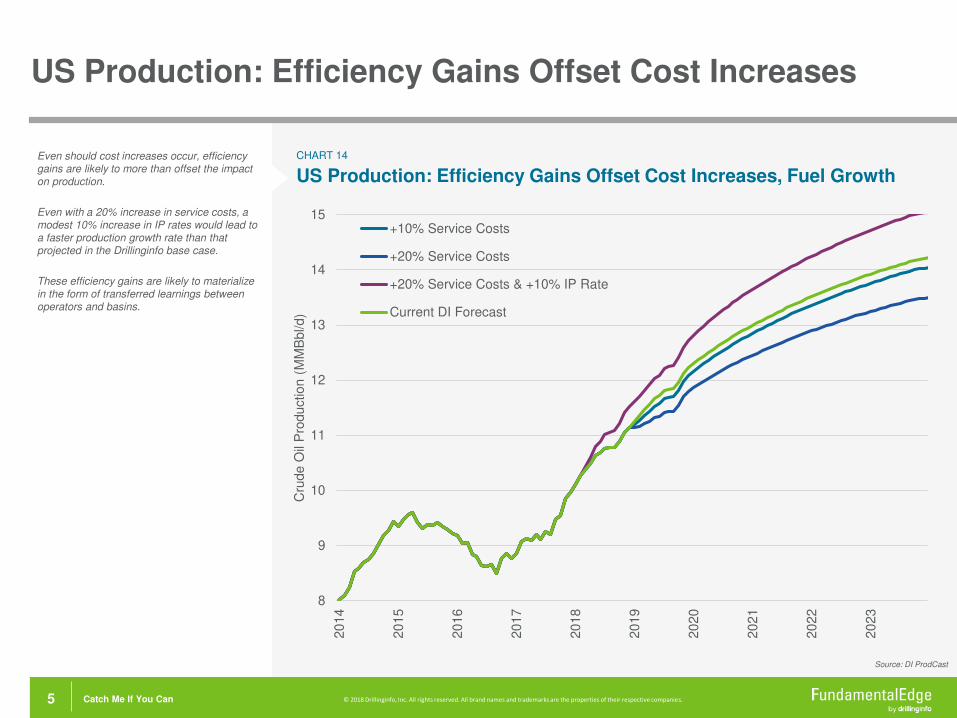
US Production: Efficiency Gains Offset Cost Increases, Fuel Growth
CHART 14Even should cost increases occur, efficiency gains are likely to more than offset the impact on production.
Even with a 20% increase in service costs, a modest 10% increase in IP rates would lead to a faster production growth rate than that projected in the Drillinginfo base case.
These efficiency gains are likely to materialize in the form of transferred learnings between operators and basins.
© 2018 Drillinginfo, Inc. All rights reserved. All brand names and trademarks are the properties of their respective companies. 6 Catch Me If You Can
Winter Weather
CHART 19
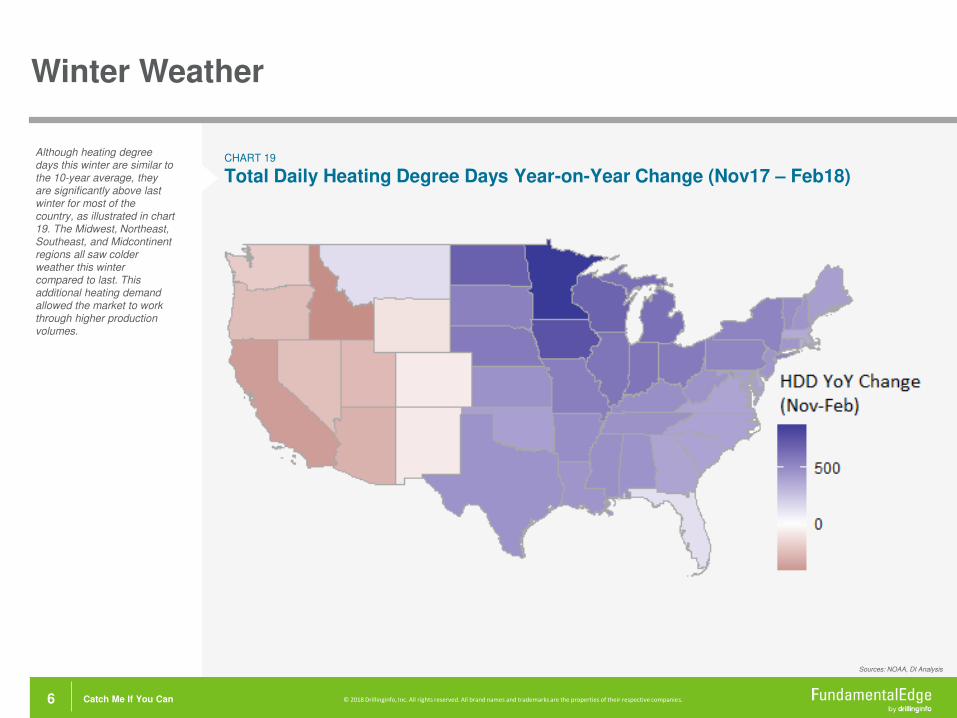
Total Daily Heating Degree Days Year-on-Year Change (Nov17 – Feb18)
Sources: NOAA, DI Analysis
Although heating degree days this winter are similar to the 10-year average, they are significantly above last winter for most of the country, as illustrated in chart 19. The Midwest, Northeast, Southeast, and Midcontinent regions all saw colder weather this winter compared to last. This additional heating demand allowed the market to work through higher production volumes.
© 2018 Drillinginfo, Inc. All rights reserved. All brand names and trademarks are the properties of their respective companies. 7 Catch Me If You Can
Storage Inventories- End of Summer Season Forecast
0
500
1,000
1,500
2,000
2,500
3,000
3,500
4,000
4,500S
tora
ge
In
ven
tory
(B
cf)
5-yr Max/Min 2015-16
2016-17 Injections @ 5-yr Average Rate
Injections @ 2017 Rate 2017-18
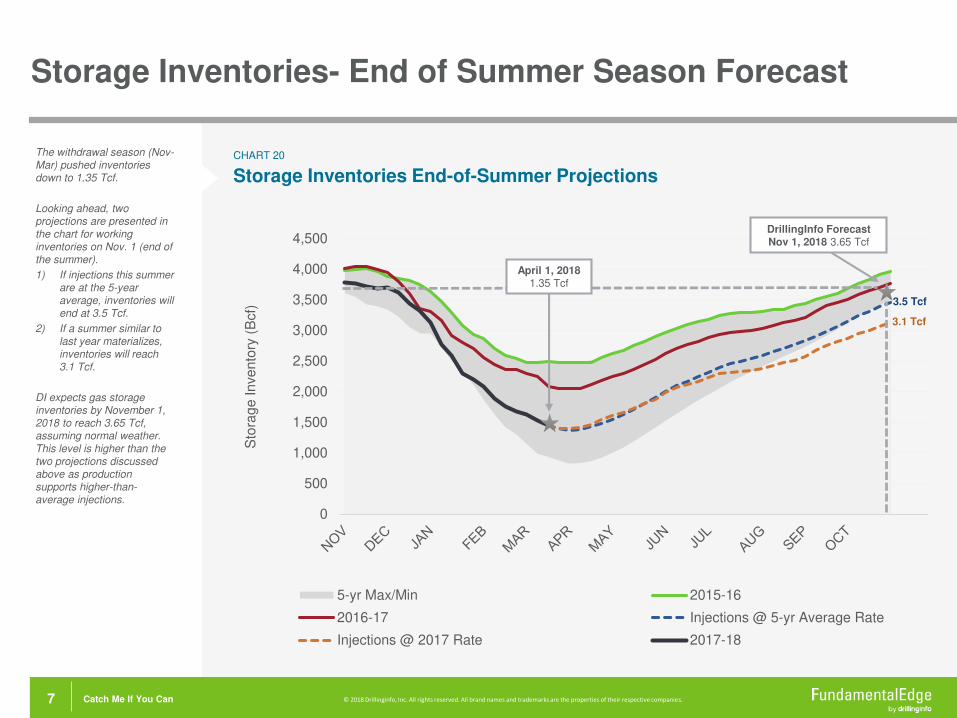
Storage Inventories End-of-Summer Projections
CHART 20The withdrawal season (Nov-Mar) pushed inventories down to 1.35 Tcf.
Looking ahead, two projections are presented in the chart for working inventories on Nov. 1 (end of the summer).
1) If injections this summer are at the 5-year average, inventories will end at 3.5 Tcf.
2) If a summer similar to last year materializes, inventories will reach 3.1 Tcf.
DI expects gas storage inventories by November 1, 2018 to reach 3.65 Tcf, assuming normal weather. This level is higher than the two projections discussed above as production supports higher-than-average injections.
3.1 Tcf
3.5 Tcf
DrillingInfo ForecastNov 1, 2018 3.65 Tcf
April 1, 20181.35 Tcf
Catch Me If You Can © 2018 Drillinginfo, Inc. All rights reserved. All brand names and trademarks are the properties of their respective companies. 8
Ethane
Source: ProdCast, Hodson, EIA
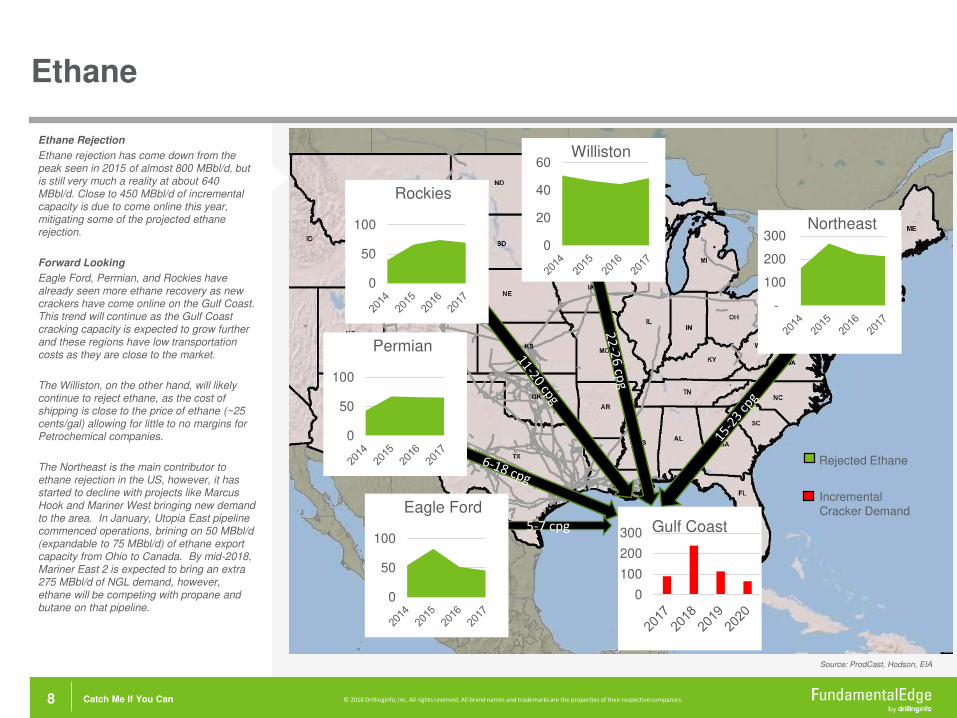
Ethane Rejection
Ethane rejection has come down from the peak seen in 2015 of almost 800 MBbl/d, but is still very much a reality at about 640 MBbl/d. Close to 450 MBbl/d of incremental capacity is due to come online this year, mitigating some of the projected ethane rejection.
Forward Looking
Eagle Ford, Permian, and Rockies have already seen more ethane recovery as new crackers have come online on the Gulf Coast. This trend will continue as the Gulf Coast cracking capacity is expected to grow further and these regions have low transportation costs as they are close to the market.
The Williston, on the other hand, will likely continue to reject ethane, as the cost of shipping is close to the price of ethane (~25 cents/gal) allowing for little to no margins for Petrochemical companies.
The Northeast is the main contributor to ethane rejection in the US, however, it has started to decline with projects like Marcus Hook and Mariner West bringing new demand to the area. In January, Utopia East pipeline commenced operations, brining on 50 MBbl/d (expandable to 75 MBbl/d) of ethane export capacity from Ohio to Canada. By mid-2018, Mariner East 2 is expected to bring an extra 275 MBbl/d of NGL demand, however, ethane will be competing with propane and butane on that pipeline.
5-7 cpg
-
100
200
300Northeast
0
20
40
60Williston
0
50
100
Eagle Ford
0
50
100
Permian
0
50
100
Rockies
0
100
200
300 Gulf Coast
Rejected Ethane
Incremental Cracker Demand
Industry Returns/Valuation
55 © 2017 Drillinginfo, Inc. All rights reserved. All brand names and trademarks are the properties of their respective companies.
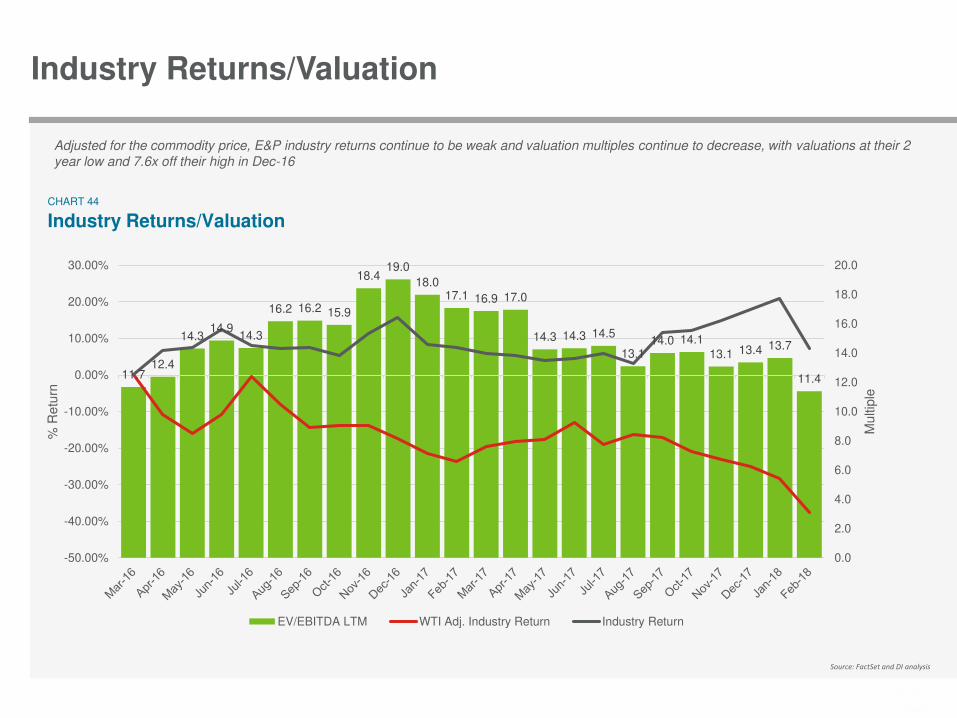
Industry Returns/ValuationCHART 44
Adjusted for the commodity price, E&P industry returns continue to be weak and valuation multiples continue to decrease, with valuations at their 2
year low and 7.6x off their high in Dec-16
Source: FactSet and DI analysis
11.712.4
14.314.9
14.3
16.2 16.2 15.9
18.419.0
18.017.1 16.9 17.0
14.3 14.3 14.5
13.114.0 14.1
13.1 13.4 13.7
11.4
0.0
2.0
4.0
6.0
8.0
10.0
12.0
14.0
16.0
18.0
20.0
-50.00%
-40.00%
-30.00%
-20.00%
-10.00%
0.00%
10.00%
20.00%
30.00%
Multip
le
% R
etu
rn
EV/EBITDA LTM WTI Adj. Industry Return Industry Return
© 2018 Drillinginfo, Inc. All rights reserved. All brand names and trademarks are the properties of their respective companies.
Contact
This is a preview of the full report.If you are interested in learning more, please contact your MarketView account manager of [email protected], and for immediate help: 1 (800) 282-4245 x1
Thank you!
Additional Publications