Embed Size (px)
Citation preview

Published in: Chemical Engineering Journal, Volume 160, 2010, Pages 751-759
Catalytic gasification of glycerol in supercritical water
Anna May1, Joan Salvadó
1,2, Carles Torras
2 and Daniel Montané*
1,2
1 Department of Chemical Engineering, Rovira i Virgili University - URV
Av. Països Catalans 26, 43007 Tarragona – SPAIN
2 Bioenergy and Biofuels Division, Catalonia Institute for Energy Research - IREC
Av. Països Catalans 16, 43007 Tarragona – SPAIN
Abstract
The conversion of glycerol in supercritical water (SCW) was studied at 510 – 550°C and a
pressure of 350 bars using both a bed of inert and non-porous ZrO2 particles (hydrothermal
experiments), and a bed of 1 % Ru/ZrO2 catalyst particles. Experiments were conducted with a
glycerol concentration of 5 wt% in a continuous isothermal fixed-bed reactor at a residence time
between 2 and 10 s. Hydrothermolysis of glycerol formed water-soluble products such as
acetaldehyde, acetic acid, hydroxyacetone and acrolein, and also gases like H2, CO and CO2.
The catalyst enhanced the formation of acetic acid, inhibited the formation of acrolein, and
promoted the gasification of the glycerol decomposition products. Hydrogen and carbon oxides
were the main gases produced in the catalytic experiments, with only minor amounts of
methane and ethylene. Complete glycerol conversion was achieved at a residence time of 8.5 s
at 510 °C, and at around 5 s at 550 °C with a 1 wt% Ru/ZrO2 catalyst. The catalyst was not
active enough to achieve complete gasification, since high yields of primary products like acetic
acid and acetaldehyde were still present. Carbon balances were between 80 and 60 % in the
catalytic experiments, decreasing continuously as the residence time was increased. This was
attributed partially to the formation of methanol and acetaldehyde, which were not recovered
and analyzed efficiently in our set-up, but also to the formation of carbon deposits. Carbon
deposition was not observed on the catalyst particles but on the surface of the inert zirconia
particles, especially at high residence time. This was related to the higher concentration of
acetic acid and other acidic species in the catalytic experiments, which may polymerize to form
tar-like carbon precursors. Because of carbon deposition, hydrogen yields were significantly
lower than expected; for instance at 550 ºC the hydrogen yield potential was only 50 % of the
stoichiometric value.
Keywords: supercritical water, catalytic gasification, glycerol, hydrogen production, ruthenium
catalyst.
* Corresponding author: [email protected], phone and fax: (+34) 977 202 444
Published in: Chemical Engineering Journal, Volume 160, 2010, Pages 751-759
1. Introduction
Glycerol is a polyalcohol with several commercial applications in food and cosmetics that may
be synthesized chemically from epichlorohydrin derived from propylene [1], or biochemically by
microbial fermentation [2]. Nowadays, however, massive amounts of low-purity glycerol are
being obtained as byproduct in the manufacture of fatty acids, and mostly in biodiesel
production where glycerol represents around 10 wt% of the plant product [3]. The surplus
amount generated from biodiesel is so large – more than 600 000 tones in Europe in 2006 [4] –
that glycerol market price has decreased to less that 0.05 €/kg [5,6]. Due to its low purity, crude
glycerol from biodiesel cannot be used in cosmetics or food unless a costly refining process is
undertaken, and that is why it is usually considered a refuse product. Still, its wide availability
and cheap price offer new opportunities for chemistry and energy [3].
Conventional gas-phase catalytic processes have been studied for the conversion of glycerol
into acrolein [7,8] and a wide variety of glycerol-derived chemicals, as reviewed recently by
Zhou and co-workers in a comprehensive paper [9]. Hydrothermal chemistry in sub- or
supercritical water (SCW), either non-catalytic or with the addition of homogeneous and
heterogeneous catalysts, has received considerable attention in recent years. Non-catalytic
hydrothermal processing yields a variety of aldehydes, alcohols and gases [10], but adequate
catalysts and control of reaction conditions maximize the yield of specific products like acrolein
[11,12].
Gasification of glycerol for the production of hydrogen and syngas is the main application that
has been explored for energy purposes. Hydrogen, methane and syngas have been produced
by hydrothermal gasification of biomass substrates and model compounds such as glucose,
cellulose and lignin in supercritical water [13-18], and glycerol gasification has been investigated
as well [10, 19]. Supercritical water has particular properties that provide a highly reactive and
homogeneous medium for the conversion of organic molecules. SCW is miscible with organic
compounds and gases due to its low dielectric constant and weaker hydrogen bonds than liquid
water, but simultaneously facilitates the occurrence of ionic chemistry due to its relatively high
ion product. Mass transfer limitations and coke formation on catalyst surfaces are also reduced
because of a low viscosity and high diffusivity [20]. Two approaches have been undertaken for
the SCW gasification of glycerol: high-temperature SCW gasification at reaction temperatures
ranging from 550 to 800 °C – with the occasional addition of non-metallic catalyst [21] – and
low-temperature catalytic SCW gasification using a metal-based catalyst, usually below 550 °C.
Non-catalytic glycerol decomposition in SCW proceeds through a complex reaction mechanism
that is summarized in two competing pathways, ionic and free-radical, whose predominance
depends on water density and acidity [10, 22]. At low temperature and high pressure (i.e., high
water density) a set of ionic reactions forms acetaldehyde, formaldehyde and acrolein as main

Published in: Chemical Engineering Journal, Volume 160, 2010, Pages 751-759
products. At low water density a free-radical pathway leads to the preferential formation of allyl
alcohol and methanol. Gases are typical products of the free-radical reactions, and their yield is
favored by low water density. Most studies on hydrogen production through non-catalytic
processing of glycerol, glucose and other biomass model compounds have been conducted at
high-temperature since complete gasification is achieved only above 700 °C. However,
hydrogen is not favored as the main product and even if gasification efficiency is high with
diluted glycerol solutions, it decreases dramatically when the substrate concentration is above
20 wt% because of the dominance of condensation reactions between glycerol decomposition
products that lead to the formation of tarry materials and char [23, 24].
Solid catalysts have been studied to promote gas formation at lower temperature, maximize
hydrogen selectivity and decrease the formation of tars and char [23]. Carbon was tested as
catalyst on the SCW gasification of several organic feedstocks [24], but the gas yield was still
low even at 600 °C. Supported-metal catalysts are the most appropriate for SCW gasification
and, among them, those based on noble metals like Ru, Rh or Pt. They do not oxidize at SCW
conditions and remain active for long periods of time. Support materials should be stable in the
harsh SCW environment. Carbon, zirconia (ZrO2), titania (TiO2) and α-alumina (α-Al2O3) have
been usually employed [14]. Ruthenium-based catalysts have been shown to offer the best
results for SCW gasification. Complete gasification of lignin and cellulose was achieved to
produce methane as the main reaction product [25]. Hydrogen production from cellulose and
sawdust was investigated with Ru/C, Pd/C, CeO2, nano-CeO2 and (CeZr)xO2 catalysts [26].
Ru/C was the most active catalyst. Glycerol was gasified completely and the stoichiometric yield
of hydrogen (7mol H2/mol glycerol) achieved with a Ru/Al2O3 catalyst, although a high reaction
temperature (700 – 800 °C) was needed [27]. In fact, no catalyst capable of reaching complete
conversion of glycerol and a hydrogen yield close to the stoichiometric value at a temperature
below 550 °C has been found yet, partially because of the formation of methane as competing
final product.
In this paper we focused on the SCW gasification of glycerol over a Ru/ZrO2 catalyst in the low
temperature range. Experiments at incomplete conversion of glycerol were performed both with
and without a Ru/ZrO2 catalyst, and the reaction products were determined and quantified at
increasing residence time. The influence of the catalyst on the pathways of glycerol conversion
is discussed on the basis of the data gathered.
Published in: Chemical Engineering Journal, Volume 160, 2010, Pages 751-759
2. Materials and Methods
2.1 Materials
Glycerol (99.5 %, Sharlau) was dissolved in Mili-Q water at the adequate weight ratio and the
solution was filtered (0.2 μm, Whatman) and degassed under vacuum before use. The solution
was stored at 5 °C and used in less than 48 h to prevent the growth of microorganisms.
Formaldehyde (Sigma Aldrich, 37%), acetic acid (Riedel-deHaën, 100 %), acetaldehyde (Fluka,
99.5 %), hydroxyacetone (Sigma Aldrich, 90 %), acrylic acid (Acros Organics, 99.5 %),
methanol (Scharlau, 99 %), allylalcohol (Sigma Aldrich, 99 %), propionaldehyde (Sigma Aldrich,
97 %), isopropanol (Sigma Aldrich, 99.5 %) and acrolein (Fluka, 99 %) were used as standards
to identify and calibrate the peaks in the HPLC chromatograph that was used for the
quantification of the condensable reaction products. A calibration mixture of gases (20 % N2,
1 % CH4, 12 % CO2, 12 % CO, 1 % acetylene, 1 % ethylene, 1 % ethane and 52 % H2) and
mixtures of H2 and N2 were used for the calibration of the online microGC that was used for the
analysis of the gaseous products. RuCl2·3H2O (Riedel-deHaën) and zirconia stabilized with
calcia (99.4 %, Alfa Aesar) with a particle diameter between 100 and 200 μm, were used to
prepare the catalyst.
2.2 Preparation and characterization of the Ru/ZrO2 catalyst
The catalyst was prepared by incipient wetness impregnation, following literature procedures
[28-32]. The support was impregnated with the adequate amount of the precursor aqueous
solution and dried at 110 °C for 24 h. Then the sample was crushed and oxidized at 500 °C for
4 h, reduced with hydrogen at 400 °C for 5 h, cooled to room temperature under nitrogen and
stored in caped vials until use. The catalyst was characterized by x-ray diffraction in a Bruker-
AXS D8-Discover diffractometer. The angular 2θ diffraction range was between 5 and 70° and
the data was collected with an angular step of 0.05° at 3 s per step. Surface area analysis was
performed by nitrogen adsorption in a Micromeritics ASAP 2020. SEM analysis was performed
on a scanning electronic microscope JEOL model JSM-6400. The samples were covered with
gold before analyzing. Analysis was at 20 kV, in high vacuum and at 16 mm distance between
lens and sample. ESEM analysis of variable pressure was joined with a XR microanalysis in
order to determine and quantify the elements with a current of 20 kV, spot 4 (electrons ray) and
at 10 mm distance between lens and sample.
2.3 SCW reactor setup
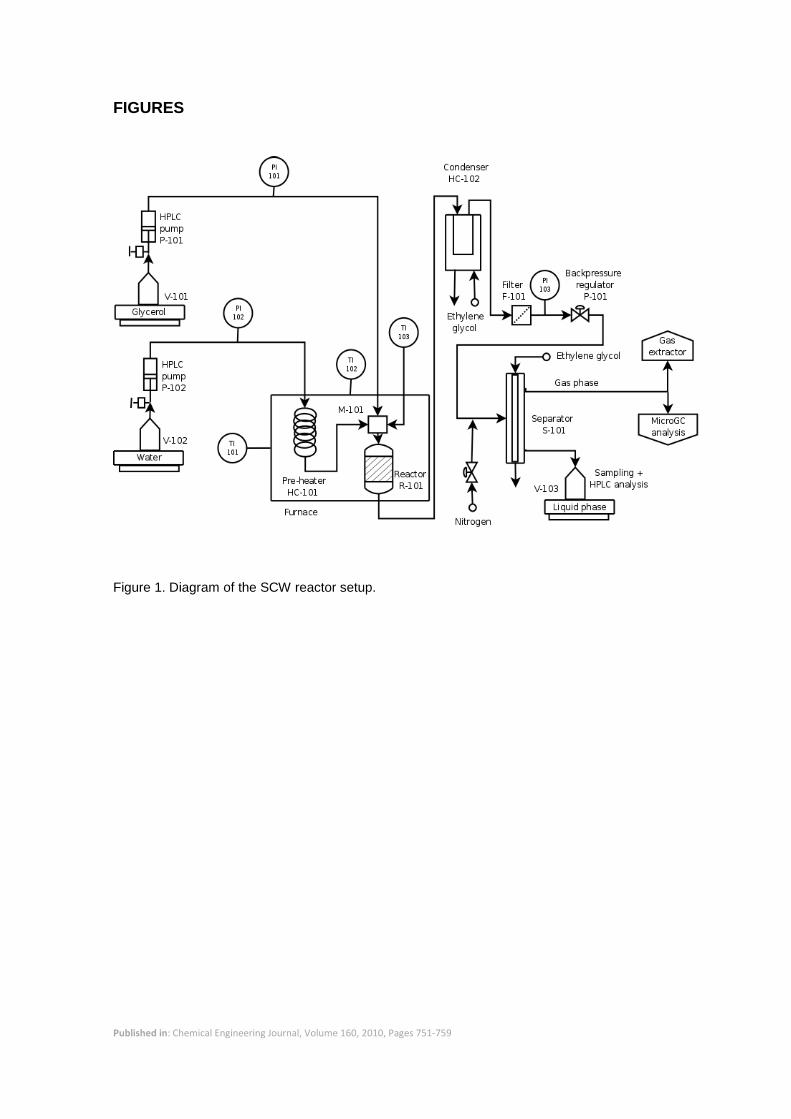
The SCW gasification experiments were performed in a tubular fixed bed reactor (Figure 1). The
feed stocks, water and glycerol solution (V-101, V-102), were pumped through the system using
Published in: Chemical Engineering Journal, Volume 160, 2010, Pages 751-759
two HPLC pumps (GILSON model 307), (P-101 and P-102) at a flow rate between 0.2 and
5 mL/min. The ratio of glycerol solution (10 – 25 wt%) to water flow rate was varied from 1:2 to
1:4. The mass flow rates fed to the reactor were calculated from the variation of mass of the
liquid bottles by means of two scales (Scalter SBA 52, max. weight 2200 g ± 0.01 g). The
signals from the scales, and other signals of the system like temperatures, were recorded in a
computer with a data acquisition system (Compact Field-Point and LabView software, National
Instruments). Water was preheated (HC-101) before entering the reactor. Glycerol at room
temperature was injected into the preheated water stream just at the top of the catalyst bed to
minimize degradation during preheating. The tubular reactor (R-101) had a diameter of 0.635
cm and a length of 8.68 cm (total volume 2.75 mL). It was packed with 1-3 g of catalyst
previously diluted with 3-5 g of inert particles (zirconia support) to improve heat transfer and
decrease temperature gradients. The particles were supported onto a stainless steel frit (10 μm,
VICI) and a thermocouple (TI-103) was inserted to record the temperature of the catalyst bed.
The reactor and the water preheater were mounted inside an electric furnace. After leaving the
reactor, the fluid was cooled in a heat exchanger (HC-102) refrigerated with ethylene glycol at
2 °C. The fluid passed then through a metal filter (10 μm, F-101) to retain possible particles
entrained from the bed or formed during reaction. Pressure was maintained with a mechanical
backpressure regulator (P-101), placed after the filter. After the expansion through the
backpressure regulator, the gas and the liquid were separated in a separator (S-101) that was
refrigerated by ethylene glycol at 2 °C to minimize the loss of volatile compounds through the
gas stream. The gas stream was analyzed on-line with a microGC (Agilent 3000). The liquid
stream flowed into a flask (V-103) that rested on a scale (Acculab Atilon 2202-I), used to
determine its flow rate. Samples of the outlet liquid stream were taken for HPLC and pH
analysis.
2.4 Analytical methods
The composition of the gas was determined by on-line gas chromatography (Agilent 3000A
Micro GC) every four minutes. The molar flow rates of the gas products were calculated based
on the molar gas flow of nitrogen that was added to the gas-liquid separator as an internal
standard. The Plot Q column (He as mobile phase, 60 °C, 1.724 bar) determined CO2, ethane,
ethylene and acetylene; the molecular sieve column (Ar, 100 °C, 2.068 bar) analyzed CO, H2,
CH4 and N2. The injection time was 50 ms, sampling time 20 s, sampling velocity 50 Hz, and
analysis time 180 s. Control of the microGC and calculation of the gas composition was
performed with the Agilent Cerity software. A quantitative analysis of the unreacted glycerol and
the condensable reaction products was carried out by HPLC (Agilent 1100) with a BIORAD
Aminex HPX-87H ion exclusion column (300 nm x 7.8 mm) using 0.5 mL/min of a 0.005 M
Published in: Chemical Engineering Journal, Volume 160, 2010, Pages 751-759
solution of sulfuric acid as solvent. The column was held at 30 °C and the volume injected
varied from 1 to 30 μL. The analysis was performed using a RI detector at 30 °C and a UV-Vis
detector at 200, 210, 230, 254 and 280 nm. Chromatograph peaks were identified by
comparison of retention time and UV spectra with those of pure compounds. Calibration for the
identified compounds was performed by analyzing four different samples of calibration solutions
that were prepared in a range that covered the expected concentrations of the reaction
samples. The pH of the liquid samples was also determined at room temperature with a
Cyberscan 510 ph-meter (Euteoh Instuments).
3. Results and Discussion
3.1 Hydrothermal treatment of Glycerol in SCW
A preliminary series of experiments was conducted under hydrothermal conditions to assess the
extension of glycerol conversion in supercritical water without the use of a catalyst. The non-
catalytic experiments were performed using the empty reactor and with the reactor packed with
zirconia particles of very low surface area (~0.1 m2/g). Particle diameters were between 100
and 200 m and the void fraction of the packed bed was 0.493. For each data point collected
along an experiment the conversion of glycerol, X (equation 1), the yield of the identified
reaction products, Yj (equation 2), the carbon balance CB, (equation 3), and the hydrogen yield
potential HYP, (equation 4) were calculated. FGly-0 and FGly are the molar flowrates of glycerol at
the reactor inlet and outlet, respectively, Fj the molar flowrate of any specie at the reactor outlet,
nCj is the number of carbons in compound j, and nH2,j denotes the moles of hydrogen gas that
would be formed if species j were completely converted into H2 and CO2 following the
stoichiometric equation 5.
0
0100[%]
Gly
GlyGly
F
FFX (1)
0
Gly
j
Glycerol
jF
F
mol
molY (2)
0
1
3
3100[%]
Gly
m
j jCGly
F
FnFCB
j
(3)
m
j
jjH FnHYP1
2 (4)
Published in: Chemical Engineering Journal, Volume 160, 2010, Pages 751-759
2222
22 COxHy
zxOHzxOHC zxx
(5)
Residence time of the reacting mixture inside the reactor, , was estimated with equation 6,
assuming that the density of the reacting mixture approached that of pure water at the
temperature and pressure of the experiment. This is a coarse approximation in our case since
glycerol concentration was relatively high (5 wt% in the feed), and therefore density of the
reaction mixture should be calculated accounting for the change of composition due to the
conversion of glycerol and the formation of products. However, this calculation is not
straightforward at supercritical conditions and we used this simplified procedure to have an
approximate estimation of the residence time. In equation 6, VR is the volume of the catalyst
bed, is the void fraction of the bed (which is 1 for the empty-tube experiments), m0 the mass
flow rate of water and glycerol fed to the reactor, and m,R is the density of pure water at the
reactor conditions of P and T. The latter was calculated according to Wagner and Kruse [33].
0
,
m
Vs
RmR
(6)
Initial experiments showed that the zirconia particles could be considered chemically inert since
there was no significant difference in conversion and yield of products between the experiments
performed with the empty tube and those with the zirconia particles. In consequence, all the
experiments were conducted using a packed bed of ZrO2 particles, since the hydrodynamics of
the system was then equivalent to that of the catalyzed experiments.
Figures 2 to 5 show the evolution of glycerol conversion and the yield of the main reaction
products with reaction time at 510 °C and 550 °C for the uncatalyzed experiments at 350 bar.
Product yields were expressed as mole of product formed per mole of glycerol fed to the
reactor, according to equation 6. Hydrothermal processing at 510 °C on a bed of inert ZrO2
particles gave a conversion of glycerol of around 22 % after 8.5 s. The main reaction products
were acetaldehyde, hydroxyacetone and acetic acid, together with minor amounts of allyl
alcohol, propionaldehyde and acrolein. Gaseous products comprised hydrogen, carbon oxides
and methane. Trace amounts of acrylic acid and ethylene were also detected. This wide variety
of products reflects the complexity of the reaction mechanisms involved in the hydrothermal
decomposition of glycerol, which can be summarized into the coexistence of competing ionic
and free radical pathways [10]. The ionic path dominates at high-water density – low
temperature and high pressure – a situation in which the ion product of water is high enough to
allow the existence of free protons and hydroxyl ions that may catalyze ionic reactions, and the
static dielectric constant of water is high enough to stabilize ionic species and reaction
Published in: Chemical Engineering Journal, Volume 160, 2010, Pages 751-759
intermediates. The free radical decomposition route dominates at low water density – high
temperature and low pressure – where ionic chemistry is not favored due to the low dielectric
constant of the media and low water ion product. Table I shows relevant properties for the
conditions we have covered in our study, which were calculated according to Wagner and Kruse
[33]. At 510 °C and 350 bar the ion product of water is six orders of magnitude lower than for
water at room temperature and the dielectric constant is close to that of steam, which indicates
that the ionic route will play a minor role in our case and that the free-radical pathway should
dominate. The latter is summarized in Figure 6, where a simplified schematic of a more rigorous
mechanism [10] is given. Hydrogen transfer reactions form unstable •CH2CHOHCH2OH (Int1)
and •COHCHOHCH2OH (Int2) radicals. The first evolves into propionaldehyde and allyl alcohol,
whereas the second is converted into acrolein, acrylic acid and formaldehyde. Radical
isomerization also forms •COH(CH2OH)2 radicals (Int3) from Int2, which then evolve into
acetaldehyde and acetic acid. Formaldehyde is only an intermediate that leads rapidly to the
formation of carbon monoxide, which is transformed to carbon dioxide by the water-gas shift
reaction. Methane is formed from CO and CO2 as a result of methanation reactions. The carbon
balance was between 90 to 100 % and most of reaction products were identified, which was
supported by values of HYP between 6 and 7 mol H2/mol glycerol. The carbon unaccounted for
was attributed to the formation of known products like methanol, formaldehyde [10] and 3-
hydroxypropanal [22], which could not be measured accurately due to the limitations of our
analytical system. No carbon deposits were visible on the ZrO2 particles.
At 550 °C the rate of glycerol decomposition was increased significantly, and almost complete
conversion was achieved with only 8 s. Significant increases in the yields of all reaction
products were observed. The yields of acetic acid, acetaldehyde and hydroxyacetone reached a
maximum and started to decrease at high glycerol conversion, showing that they were unstable
under hydrothermal conditions. The yield of gases increased continuously, especially carbon
oxides since they evolved from the decomposition of acetic acid and acetaldehyde through
decarboxylation and decarbonilation. The overall reaction rate for glycerol conversion was well
described by pseudo-first order kinetics as seen in Figure 2, where the experimental
conversions are compared with this model. The rate constants for the hydrothermal
decomposition were 0.034 s-1
and 0.385 s-1
at 510 and 550 °C, respectively, which are in
agreement with those reported in other studies [10].
The influence of the Ru/TiO2 catalyst on glycerol conversion and the selectivity towards the
different reaction products are discussed in the following section, where results from
experiments performed at incomplete glycerol conversion are discussed.
Published in: Chemical Engineering Journal, Volume 160, 2010, Pages 751-759
3.2 Catalyst characterization
Low porosity CaO-stabilized ZrO2 particles were used as support to prepare the Ru catalyst.
The support particles were screened and the fraction between 100 and 200 m was selected.
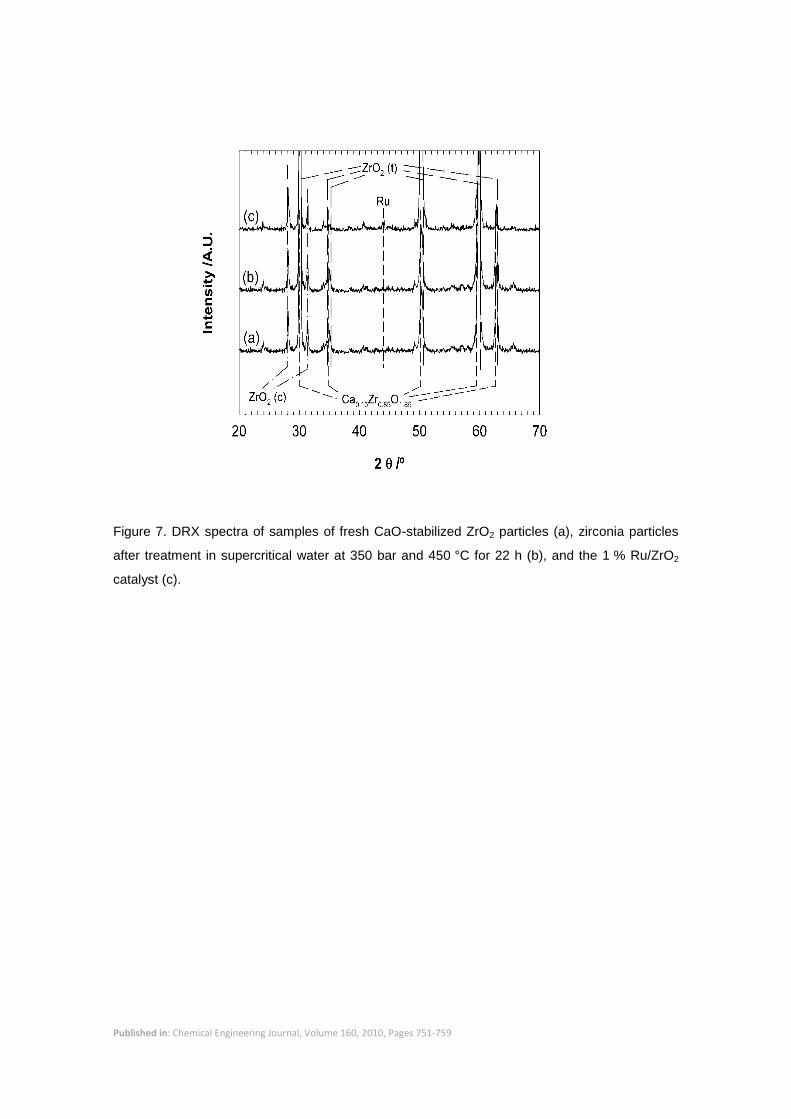
The material had a low surface area of 0.1 m2/g. Figure 7 shows the XRD spectra of the fresh
support particles, which reveals two major crystalline phases – tetragonal zirconia (54.81 %)
and cubic calcium zirconium oxide (Ca0.2Zr0.8O1.8, 24.13 %) – and a minor phase of monoclinic
zirconia (21.05 %). Stability of the support material under supercritical water (SCW) conditions
was investigated by treating samples of the particles at 350 bar at 450 °C for 22 hours. The
treated particles were then analyzed to compare their surface area and x-ray diffractogram with
those of the fresh, untreated particles. The crystalline structure of the particles did not change
significantly, as seen in Figure 7. Figure 8 shows the SEM images of the surface of fresh and
SCW-treated, which show a smooth and non-porous surface in both cases. The particles were
chemically stable during the SCW treatment. The water recovered at the reactor outlet during
the SCW treatment of the zirconia particles had average concentrations of 0.040 ± 0.008 ppm of
Zr and 1.074 ± 0.046 ppm of Ca. The feed water had an undetectable content of Zr and 0.860 ±
0.012 ppm of Ca. The outlet water also had 0.102 ± 0.064 ppm of Ni, and 0.077 ± 0.009 ppm of
Cr, showing negligible corrosion of the Hastelloy-made reactor system.
A shell-type catalyst was obtained by incipient wetness impregnation of the ZrO2 particles,
where most of the Ru was deposited in the outer surface of the particles due to their low
porosity. The BET surface area of the catalyst was 0.8 m2/g. The SEM image in Figure 8 shows
that the surface of the catalyst was rougher and appeared to be more porous than that of the
support. The XRD spectra of the 1 % Ru/ZrO2 catalyst in Figure 7 confirmed the presence of
metallic Ru. The Ru peaks were low and poorly defined which pointed to a high metal
dispersion. ESEM microanalysis of the surface supported the formation of a catalyst particle
with a shell-type morphology. The 1 % Ru/ZrO2-CaO catalyst had an average surface content of
12.4 ± 1.7 % of Ru as measured by ESEM, which indicates that all Ru was distributed in a thin
layer on the outer surface and did not penetrate deep inside the particle’s core.
3.3 Catalytic gasification in SCW
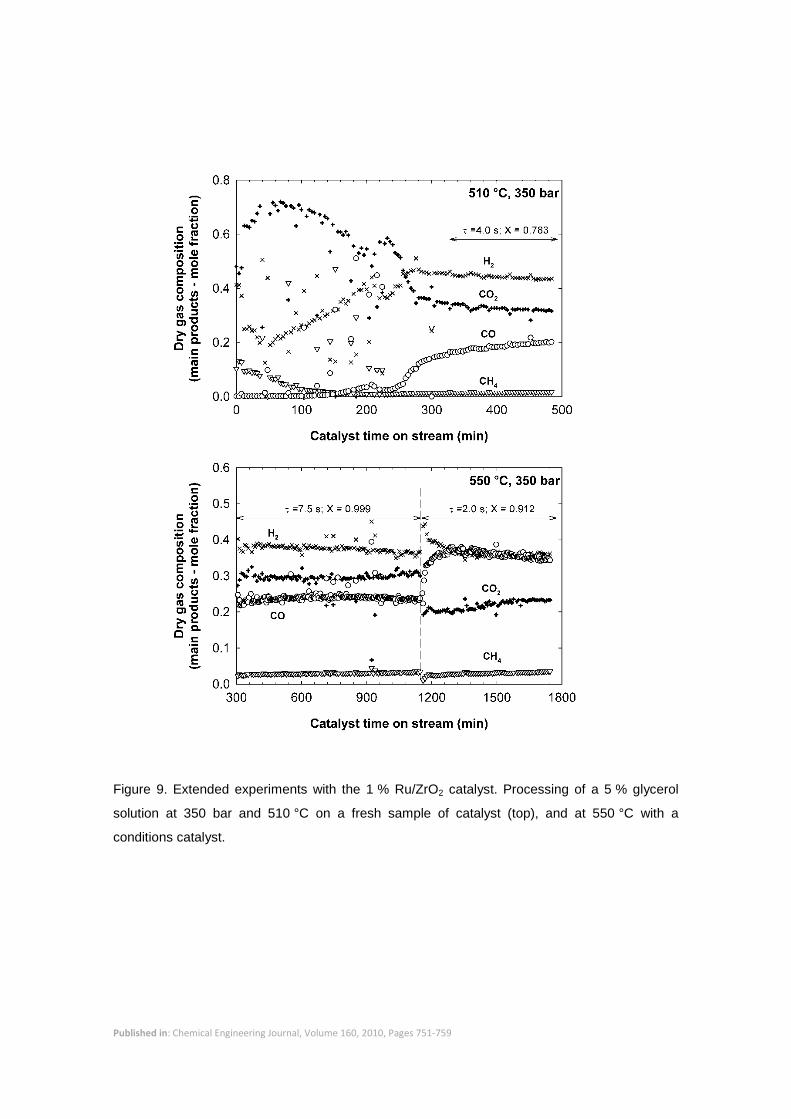
A preliminary series of experiments was developed to assess the stability of the catalyst.
Glycerol conversion and the composition of the gas products were monitored for extended
periods to determine changes in the activity of the catalyst and product selectivity. For instance,
Figure 9 shows the composition of the gas produced with a fresh sample of catalyst with time on
stream at 350 bar and 510 °C and a residence time of 4.0 s. After an initial period of large
changes in gas composition the activity of the catalysts tended to stabilize after 5 h of operation.
Figure 9 also shows the stability of the catalyst for an extended experiment at 350 bar and

Published in: Chemical Engineering Journal, Volume 160, 2010, Pages 751-759
550 °C. The first section corresponded to a residence time of around 7.5 s, in which complete
glycerol conversion was achieved. After 1100 min of operation the feed flow was increased to
reduce the residence time to 2.0 s, which resulted on an average conversion of 0.912 when the
system did reach a new steady state. Again, around 4 h were required for stabilization.
Therefore, all experiments were performed after the catalyst was stabilized for at least 5 h at the
intended operation conditions.
The use of the Ru/ZrO2 catalyst enhanced glycerol conversion significantly. Figure 2 shows that
near complete conversion was achieved at around 8.5 s at 510 °C and 350 bar when the
catalyst was used, whereas it was only 22 % in the non-catalyzed experiment at the same
temperature. The overall pseudo-first rate constants for the catalytic gasification of glycerol
were 0.377 s-1
and at 0.992 s-1
at 510 and 550 °C, respectively, which are significantly higher
than the constants of the uncatalyzed experiments.
The catalyst had a notable influence on the selectivity towards the different reaction products.
Acetic acid became the main condensable product instead of acetaldehyde. For instance, at
8.5 s residence time – complete glycerol conversion – the yield of acetic acid grew from 0.015
mol/molGly in the non-catalyzed experiments to 0.25 mol/molGly, while that of acetaldehyde went
from 0.045 to 0.15 mol/molGly. Hydroxyacetone yield grew from 0.025 to 0.18 mol/molGly, also
below the yield of acetic acid. Concerning minor products, Figure 4 shows that the yields of allyl
alcohol and propionaldehyde also increased significantly, but that acrolein was reduced.
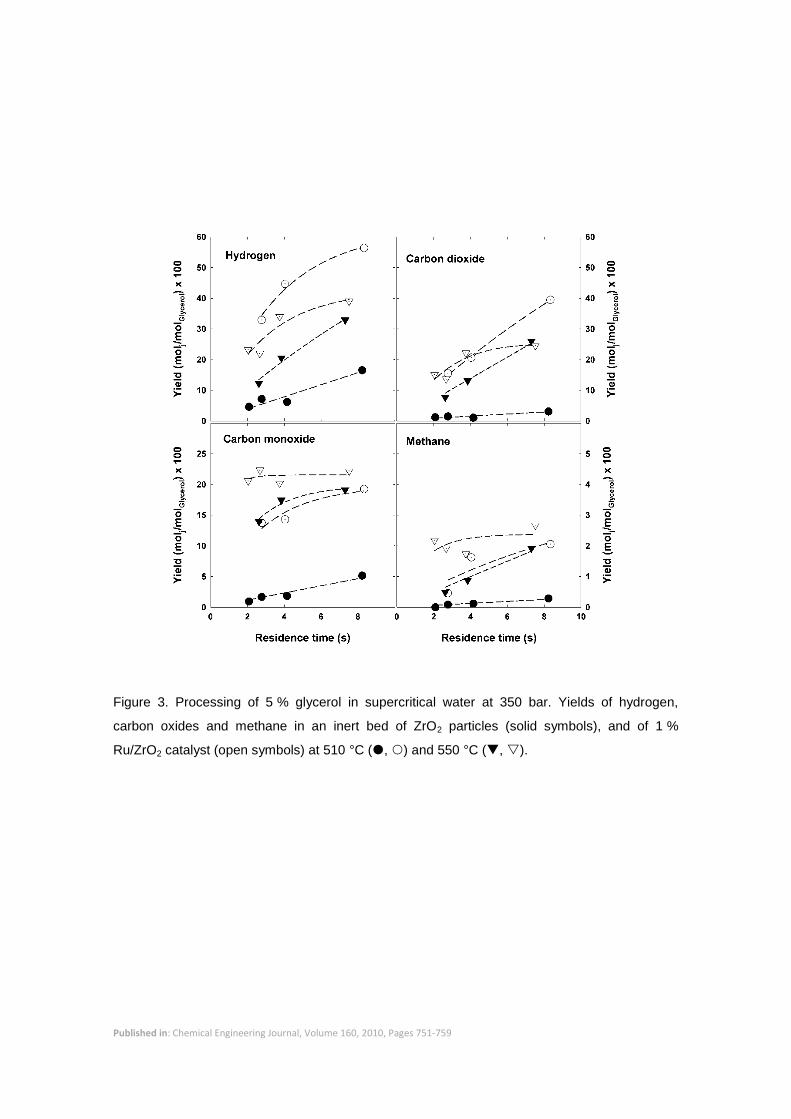
Permanent gases – shown in Figure 3 – were the major products, and the yields of hydrogen,
carbon oxides and methane all increased when the catalyst was used. The catalyst favored
both C-C cleavage reactions that formed acetic acid and acetaldehyde, and dehydration
reactions that formed C3 products, mainly hydroxyacetone. The catalyst also promoted
reforming to form hydrogen, carbon oxides and methane (secondary products), although
glycerol was preferentially converted into primary products (i.e. acetic acid, acetaldehyde,
hydroxyacetone, etc.), which were then converted into gases at a slower rate. This may be
observed in the experiments at 550 °C (Figures 2 to 4). A glycerol conversion above 95 % was
reached in 4 s, when a maximum in acetic acid yield was attained. Notably, the yields of
acetaldehyde, hydroxyacetone, and other condensable primary products decreased with
residence time in the entire interval covered by the experiment, showing that they were
converted into secondary products. The yield of hydrogen was lower than at 510 °C because
more carbon monoxide and methane were formed, thus reducing hydrogen yield. However,
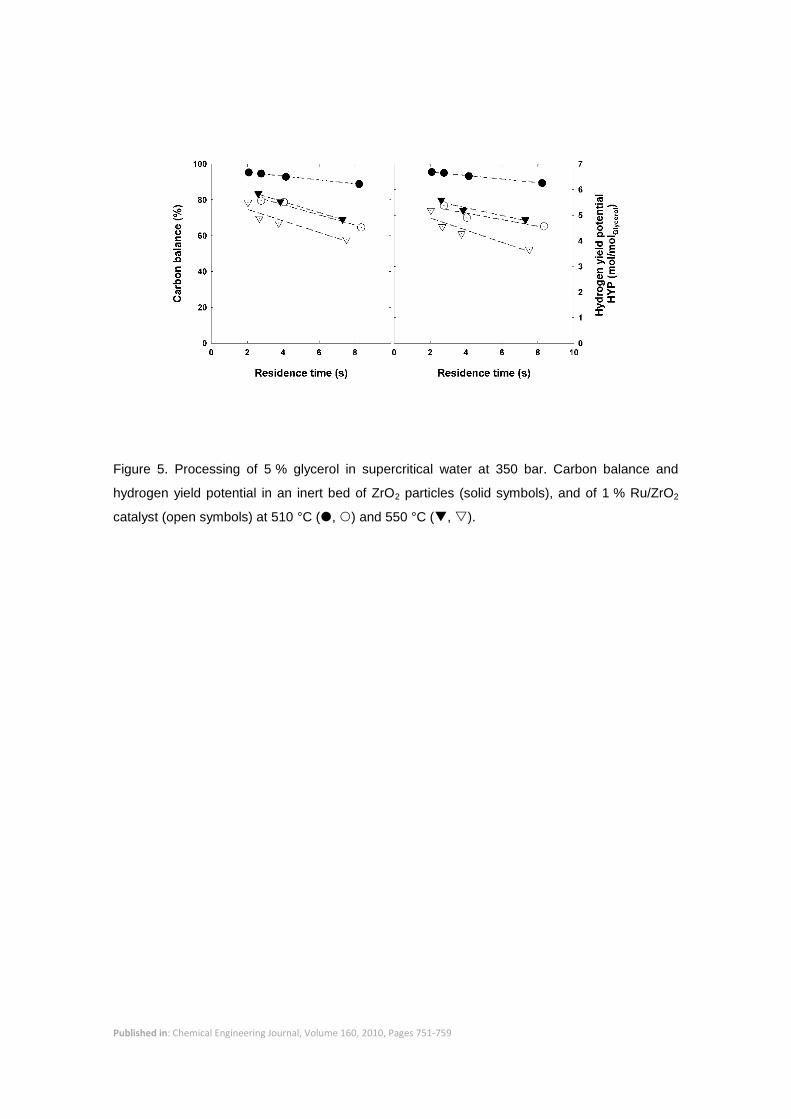
gases were not the sole secondary products. Figure 5 shows the carbon balances for the non-
catalyzed and catalyzed experiments. At 510 °C the carbon balance closure in the non-
catalyzed experiments was better than 90 %, and it was between 70 and 85 % at 550 °C. The
carbon unaccounted for was mostly attributed to formaldehyde and methanol – which were not
properly recovered nor quantified in our experimental setup – since no carbon formation on the

Published in: Chemical Engineering Journal, Volume 160, 2010, Pages 751-759
surface of the bed particles could be observed, even at the highest temperatures. The hydrogen
yield potential (HYP, the yield of hydrogen that could be obtained if all identified products were
completely converted into hydrogen and carbon dioxide) is also shown in Figure 5, and it was
close to the theoretical value of 7 molH2/molGly at 510 ºC. At 550 ºC it was below 6 molH2/molGly,
but if the missing carbon was assumed to be in the form of acetaldehyde then the HYP value
would be close to the theoretical.
The carbon balance closure was significantly lower for the catalyzed experiments. Values of
only 80-60 % were obtained, decreasing continuously as the residence time was increased.
Although the formation of methanol and formaldehyde represented a fraction of the carbon
unaccounted for, the main reason for the poor carbon balance closure was the formation of
carbon deposits on the bed. In fact carbon deposits were not observed on the particles of
Ru/ZrO2 catalyst but on the inert ZrO2 particles that were used to dilute the catalyst bed, and
eventually caused partial plugging of the bed and pressure build-up during extended
experiments when temperature was below 510 °C. This implies that carbon deposits evolved
from the primary reaction products through condensation reactions in the aqueous phase that
formed tar-like carbon precursors. The formation of tar at temperatures below 600 °C has been
reported for the hydrothermal gasification of glucose. In our case a proton-catalyzed ionic
reaction pathway may be considered due to the relative high concentration of acetic acid and
other acidic species. However, the low ion product (kW) and static dielectric constant () of
water at the reaction conditions we used – for instance, kW and were 1.67x10⁻²⁰
(mol/kg)2 and
1.984 at 510 °C and 350 bar, respectively [33] – point to a more likely free-radical pathway as
dominant. The formation of carbon deposits contributed to a lower relative yield of hydrogen.
The HYP was from 4.5 to 5.5 molH2/molGly at 510 ºC, and from only 3.5 to around 5 at 550 ºC.
4. Conclusions
The hydrothermal and catalytic conversion of glycerol has been studied in supercritical water at
350 bar and intermediate temperatures (510 and 550 °C), covering an interval of residence time
that gave incomplete conversion of glycerol. The catalyst – 1 % Ru on CaO-stabilized ZrO2 –
augmented the rate of glycerol conversion and favored carbon-carbon scission reactions to form
acetic acid and acetaldehyde as the main primary products, while inhibiting the rate of acrolein
formation. The catalyst also converted the primary products into gases through reforming,
although the rate of reforming was slower than that of the formation of primary products. When
the catalyst was used, the higher concentration of acidic species in the fluid prompted the
formation of tar-like adducts that lead to the deposition of carbon on the bed – particularly on
the surface of the inert particles of ZrO2 that were used to dilute the catalyst particles – and a
poor carbon balance. In conclusion, although the Ru/ZrO2 catalyst presented good stability and

Published in: Chemical Engineering Journal, Volume 160, 2010, Pages 751-759
overall activity, its selectivity towards reforming reactions was not high enough in the
intermediate temperature range we studied. From a practical standpoint, low temperature and
pressure are desirable in the hydrothermal processing of biomass in supercritical water to
reduce the requirements of construction materials and operation costs. Optimization of the
properties of the catalyst to enhance the reforming activity at low temperature and the selectivity
towards gas products, and the capacity for processing high concentrations of biomass, are key
aspects that need to be solved for the implementation of the supercritical water gasification
technology.
Acknowledgements
This research was supported by the Ministry of Science and Innovation of the Spanish
Government (project CTQ2008-02491/PPQ), and the Catalan Regional Government
(2009SGR-00237). Anna May also acknowledges “la Caixa” for her scholarship.
Published in: Chemical Engineering Journal, Volume 160, 2010, Pages 751-759
References
[1] Frost & Sullivan Market Insight. R&D Creating New Avenues for glycerine (August 4, 2006).
Available online at http://frost.com/prod/servlet/market-insight-top.pag?docid=77264824
[2] Wang Z-X, Zhuge J, Fang H, Prior B.A. Glycerol production by microbial fermentation: A
review. Biotechnology Advances. 2001;19:201-223.
[3] Pagliaro M, Ciriminna R, Kimura H, Rossi M, Della Pina C. From Glycerol to Value-Added
Products. Angew. Chem. Int. Ed. 2007;46:4434-4440.
[4] Pagliaro M, Rossi M. The future of Glycerol. New Usages for a Versatile Raw Material. RSC
Publishing. 2008 (127 pages).
[5] Johnson D.T, Taconi K.A. The Glycerin Glut: Options for the Value-Added Conversion of
Crude Glycerol Resulting from Biodiesel Production. Environmental Progress. 2007;26(4):338-
348.
[6] Miller-Klein Associates 2006. Available on line at:
http://www.ruralsementes.com.br/produtos/Impact_of_Biodiesel_Production_on_the_Glycerol_
Market.pdf
[7] Corma A, Huber G-W, Sauvanaud L, O'Connor P. Biomass to chemicals: Catalytic
conversion of glycerol/water mixtures into acrolein, reaction network. Journal of catalysis.
2008;257:163-171.
[8] Chai S-H, Wang H-P, Liang Y, Xu B-Q. Sustainable production of acrolein: investigation of
solid acid-base catalysts for gas-phase dehydration of glycerol. Green Chemistry.
2007;9(10):1130-1136.
[9] Zhou C-H, Beltramini J-N, Fan Y-X, Lu G-Q. Chemoselective catalytic conversion of glycerol
as a biorenewable source to valuable commodity chemicals. Chemical Society Reviews.
2008;37:527-549.
[10] Bühler W, Dinjus E, Ederer H.J, Kruse A, Mas C. Ionic reaction and pyrolysis of glycerol as
competing reaction pathways in near- and supercritical water. Journal of Supercritical Fluids.
2002;22:37-53.
[11] Ott L, Bicker M, Vogel H. Catalytic dehydration of glycerol in sub- and supercritical water: a
new chemical process for acrolein production. Green Chemistry. 2006;8:214-220.
[12] Watanabe M, Iida T, Aizawa Y, Aida T.M, Inomata H. Acrolein synthesis from glycerol in
hot-compressed water. Bioresource Technology. 2007;98:1285-1290.
[13] Kruse A. Supercritical water gasification. Biofuels, Bioprod. Bioref. 2008;2:415-437.

Published in: Chemical Engineering Journal, Volume 160, 2010, Pages 751-759
[14] Elliott D.C. Catalytic hydrothermal gasification of biomass. Biofuels, Bioprod. Bioref.
2008;2:254-265.
[15] Lu Y.J, Jin H, Guo L.J, Zhang X.M, Cao C.Q, Guo X. Hydrogen production by biomass
gasification in supercritical water with a fluidized bed reactor. International Journal of Hydrogen
Energy. 2008;33:6066-6075.
[16] Yan B, Wei C.H. Hydrogen Production from Organic Compounds by Supercritical Water
Gasification. Progress in Chemistry. 2008;20(10):1553-1561.
[17] Yanik J, Ebale S, Kruse A, Saglam M, Yüksel M. Biomass gasification in supercritical water:
II. Efect of the catalyst. International Journal of Hydrogen Energy. 2008;33:4520-4526.
[18] Guo L.J, Lu Y.J, Zhang X.M, Ji C.M, Guan Y, Pei A.X. Hydrogen production by biomass
gasification in supercritical water: A systematic experimental and analytical study. Catalysis
Today. 2007;129:275-286.
[19] Kambayashi K, Nishi Y. Possibility of hydrogen generation using supercritical water.
Proceeding of EcoDesign2003: Third International Symposium On Environmentally Conscious
Design and Inverse Manufacturing. Tokyo, Japan. 2003.
[20] Osada M, Hiyoshi N, Sato O, Arai K, Shirai M. Reaction Pathway for Catalytic Gasification
of Lignin in Presence of Sulfur in Supercritical Water. Energy & Fuels. 2007;21:1854-1858.
[21] Matsumura Y, Minowa T, Potic B, Kersten S.R.A, Prins W, van Swaaij W.P.M, van de Beld
B, Elliott D.C, Neuenschwander G.G, Kruse A, Antal Jr M.J. Biomass gasification in near- and
supercritical water. Biomass and Bioenergy. 2005;29:269-292.
[22] Antal M.J, Mok W.S.L, Roy J.C, Raissi A.T. Pyrolytic Sources of Hydrocarbons from
Biomass. Journal of Analytical and Applied Pyrolysis. 1985;8:291-303.
[23] Kong L, Li G, Zhang B, He W, Wang H. Hydrogen Production from Biomass Wastes by
Hydrothermal Gasification. Energy Sources. Part A. 2008;30:1166-1178.
[24] Xu X, Matsumura Y, Stenberg J, Antal Jr M.J. Carbon-Catalyzed Gasification of Organic
Feedstocks in Supercritical Water. Ind. Eng. Chem. Res. 1996;35:2522-2530.
[25] Osada M, Sato T, Watanabe M, Adshiri T, Arai K. Low-Temperature Catalytic Gasification
of Lignin and Cellulose with a Ruthenium Catalyst in Supercritical Water. Energy & Fuels.
2004;18:327-333.
[26] Hao X, Guo L, Zhang X, Guan Y. Hydrogen production from catalytic gasification of
cellulose in supercritical water. Chemical Engineering Journal. 2005;110:57-65.
[27] Byrd A.J, Pant K.K, Gupta R.B. Hydrogen production from glycerol by reforming in
supercritical water over Ru/Al2O3 catalyst. Fuel. 2008;87:2956-2960.
Published in: Chemical Engineering Journal, Volume 160, 2010, Pages 751-759
[28] Perkas N, Zhong Z, Chen L, Besson M, Gedanken A. Sonochemically prepared high
dispersed Ru/TiO2 mesoporous catalyst for partial oxidation of methane to syngas. Catalysis
Letters. 2005;103:9-14.
[29] Elmasides C, Ioannides T, Verykios X.E. Kinetic Model of the Partial Oxidation of Methane
to Synthesis Gas Over Ru/TiO2 Catalyst. AlChe Journal.2000;46(6):1260-1270.
[30] Boucouvalas Y, Zhang Z, Verykios X.E. Partial oxidation of methane to synthesis gas via
the direct reaction scheme over Ru/TiO2 catalyst. Catalyst Letters. 1996;40:189-195.
[31] Elliott D.C, Hart T.R, Neuenschwander G.G. Chemical Processing in High-Pressure
Aqueous Environments. 8. Improved Catalysts for Hydrothermal Gasification. Ind. Eng. Chem.
Res. 2006;45:3776-3781.
[32] Li D, Ichikuni N, Shimazu S, Uematsu T. Hydrogenation of CO2 over spayed Ru/TiO2 fine
particles and strong metal-support interaction. Applied Catalysis A: general. 1999;180:227-235.
[33] Wagner W, Kruse A. Properties of Water and Steam. Springer-Verlag, Berlin (1998).
Published in: Chemical Engineering Journal, Volume 160, 2010, Pages 751-759

Published in: Chemical Engineering Journal, Volume 160, 2010, Pages 751-759
TABLES
Table I. Relevant properties of supercritical water (Calculated according to ref. [35]).
Temperature
(°C) Pressure
(bar) Density
(kg/m3)
Ion Product
(mol/kg)2
Dielectric
constant
Ambient water 25 1 997.1 1.01 x 10⁻¹⁴ 78.41
Steam 100 1 0.590 1.08 x 10-66 1.006
Supercritical
water 510 250 87.09 2.98 x 10
-23 1.545
510 350 138.0 1.67 x 10⁻²⁰ 1.985
550 250 78.52 1.24 x 10⁻²³ 1.458
550 350 119.8 4.02 x 10⁻²¹ 1.776
Published in: Chemical Engineering Journal, Volume 160, 2010, Pages 751-759
FIGURES
Figure 1. Diagram of the SCW reactor setup.

Published in: Chemical Engineering Journal, Volume 160, 2010, Pages 751-759
Figure 2. Processing of 5 % glycerol in supercritical water at 350 bar. Glycerol conversion and
yields of acetic acid, acetaldehyde and hydroxyacetone in an inert bed of ZrO2 particles (solid
symbols), and of 1 % Ru/ZrO2 catalyst (open symbols) at 510 °C (, ) and 550 °C (, ).
Published in: Chemical Engineering Journal, Volume 160, 2010, Pages 751-759
Figure 3. Processing of 5 % glycerol in supercritical water at 350 bar. Yields of hydrogen,
carbon oxides and methane in an inert bed of ZrO2 particles (solid symbols), and of 1 %
Ru/ZrO2 catalyst (open symbols) at 510 °C (, ) and 550 °C (, ).

Published in: Chemical Engineering Journal, Volume 160, 2010, Pages 751-759
Figure 4. Processing of 5 % glycerol in supercritical water at 350 bar. Yields of allyl alcohol,
propionaldehyde, acrolein and acrylic acid in an inert bed of ZrO2 particles (solid symbols), and
of 1 % Ru/ZrO2 catalyst (open symbols) at 510 °C (, ) and 550 °C (, ).
Published in: Chemical Engineering Journal, Volume 160, 2010, Pages 751-759
Figure 5. Processing of 5 % glycerol in supercritical water at 350 bar. Carbon balance and
hydrogen yield potential in an inert bed of ZrO2 particles (solid symbols), and of 1 % Ru/ZrO2
catalyst (open symbols) at 510 °C (, ) and 550 °C (, ).

Published in: Chemical Engineering Journal, Volume 160, 2010, Pages 751-759
Figure 6. Simplified reaction pathways for glycerol hydrothermolysis in SCW.
Published in: Chemical Engineering Journal, Volume 160, 2010, Pages 751-759
Figure 7. DRX spectra of samples of fresh CaO-stabilized ZrO2 particles (a), zirconia particles
after treatment in supercritical water at 350 bar and 450 °C for 22 h (b), and the 1 % Ru/ZrO2
catalyst (c).

Published in: Chemical Engineering Journal, Volume 160, 2010, Pages 751-759
Figure 8. SEM images of the fresh CaO-stabilized ZrO2 particles used as catalyst support (top),
of the support particles after supercritical water treatment at 350 bar and 450 °C for 22 h
(middle), and of the 1 % Ru/ZrO2 catalyst (bottom).
Published in: Chemical Engineering Journal, Volume 160, 2010, Pages 751-759
Figure 9. Extended experiments with the 1 % Ru/ZrO2 catalyst. Processing of a 5 % glycerol
solution at 350 bar and 510 °C on a fresh sample of catalyst (top), and at 550 °C with a
conditions catalyst.