Embed Size (px)
Citation preview

2 0 1 4 I N V E S T O R D A Y
INVESTOR DAY 2014

Today’s Participants
2
Dave Clary Chief Technology Officer & Vice President Performance Chemicals Research & Technology
Vice President, Catalysts Research & TechnologyEdwin Berends
President & Chief Executive OfficerLuke Kissam
Michael Wilson Senior Vice President & President, Catalyst Solutions
Matthew Juneau Senior Vice President & President, Performance Chemicals
Scott Tozier Senior Vice President & Chief Financial Officer

DisclaimersForward Looking Statements
Some of the information presented in this document and discussions that follow, including, without limitation, statements with respect to product development,
changes in productivity, market trends, price, volume and mix changes, expected growth and earnings, input costs, surcharges, tax rates, stock repurchases,
dividends, economic trends, outlook and all other information relating to matters that are not historical facts may constitute forward-looking statements within
the meaning of the Private Securities Litigation Reform Act of 1995. There can be no assurance that actual results will not differ materially. Factors that could
cause actual results to differ materially include, without limitation: changes in economic and business conditions; changes in financial and operating
performance of our major customers and industries and markets served by us; the timing of orders received from customers; the gain or loss of significant
customers; competition from other manufacturers; changes in the demand for our products; limitations or prohibitions on the manufacture and sale of our
products; availability of raw materials; changes in the cost of raw materials and energy and in our ability to pass through such increases; acquisitions and
divestitures, and changes in performance of acquired companies; changes in our markets in general; fluctuations in foreign currencies; changes in laws and
government regulation impacting our operations or our products; the occurrence of claims or litigation; the occurrence of natural disasters; the inability to
maintain current levels of product or premises liability insurance or the denial of such coverage; political unrest affecting the global economy, including adverse
effects from terrorism or hostilities; political instability affecting our manufacturing operations or joint ventures; changes in accounting standards; the inability to
achieve results from our global manufacturing cost reduction initiatives as well as our ongoing continuous improvement and rationalization programs; changes
in the jurisdictional mix of our earnings and changes in tax laws and rates; changes in monetary policies, inflation or interest rates that may impact our ability to
raise capital or increase our cost of funds, impact the performance of our pension fund investments and increase our pension expense and funding obligations;
volatility and substantial uncertainties in the debt and equity markets; technology or intellectual property infringement, including cyber security breaches, and
other innovation risks; decisions we may make in the future; and the other factors detailed from time to time in the reports we file with the SEC, including those
described under "Risk Factors" in our Annual Report on Form 10-K and our Quarterly Reports on Form 10-Q.
It should be noted that this presentation contains certain financial measures, including Net Sales, Segment Income, Capital Expenditures and Free Cash Flow,
that are not required by, or presented in accordance with, accounting principles generally accepted in the United States, or GAAP. These measures are
presented here to provide additional useful measurements to review our operations, provide transparency to investors and enable period-to-period
comparability of financial performance. A description of non-GAAP financial measures that we use to evaluate our operations and financial performance, and
reconciliation of these non-GAAP financial measures to the most directly comparable financial measures calculated and reported in accordance with GAAP,
can be found in the Investors section of our website at www.albemarle.com, under “Non-GAAP Reconciliations” under “Financials.”
3

2 0 1 4 I N V E S T O R D A Y
OVERVIEWLuke KissamPresident & Chief Executive Officer

Albemarle: Compelling Investment Opportunity
• History of industry-leading returns to shareholders
• Global leader in attractive markets: catalysts and bromine
• Differentiated, performance-based core technologies driving innovative solutions
• Capacity in place to serve future growth to drive improved profitability and ROCE
• Outstanding cash generation capacity
• Disciplined capital allocation
• Valuation not reflective of current or future earnings power
• Management incentives aligned with growth and total shareholder return
5
Well-positioned to improve returns, drive increased free cash flow and deliver value to shareholders

A History of Value Creation
-50%
0%
50%
100%
150%
200%
250%
300%
350%
400%
450%
Jan-04 Jan-05 Jan-06 Jan-07 Jan-08 Jan-09 Jan-10 Jan-11 Jan-12 Jan-13 Jan-14
ALBDow Jones US Chemicals IndexS&P 500
Ten-Year Total Shareholder Return
Source: BloombergAs of 4/23/2014 6
416%
109%
207%
6

Outstanding Cash Generation Capacity
7
FCF defined as cash flow from operations + pension contributions – CAPEXFinancial data for 2010‐2013 adjusted for impact of rare earth and recent divestures.
$100‐$125
$141
$110
$283
$158
$268$297
$317
$282
$203
$275
$340 - $390
$58$70
$100 $99 $100$101
$71
$186
$274
$152
2004 2005 2006 2007 2008 2009 2010 2011 2012 2013 2014E
Historical Free Cash Flow and CAPEX*
Free Cash Flow CAPEX
Strong history of cash flow generation Poised to rise as CAPEX declines and utilization rates increase
*FCF defined as cash flow from operations + pension contributions – CAPEX*Financial data for 2010-2013 excludes the impact of rare earth and the recently announced proposed divestiture of Albemarle’s antioxidant, ibuprofen and propofol businesses and assets
($ in millions)

A Focused Strategy and Clear Deliverables
8
Strategy
• Strengthen and grow catalyst franchise
• Maximize profitability of existing bromine products
• Identify, develop and accelerate commercialization of new applications for bromine
• Drive operational excellence
Deliverables
• Best-in-class Health, Safety & Environmental performance
• Mid to high 20% segment income margins
• Drive higher free cash flow
• $100M in working capital savings by 2015
• Continued dividend increases
• Disciplined M&A
• Improve or exit underperforming businesses
• Return to consistent growth
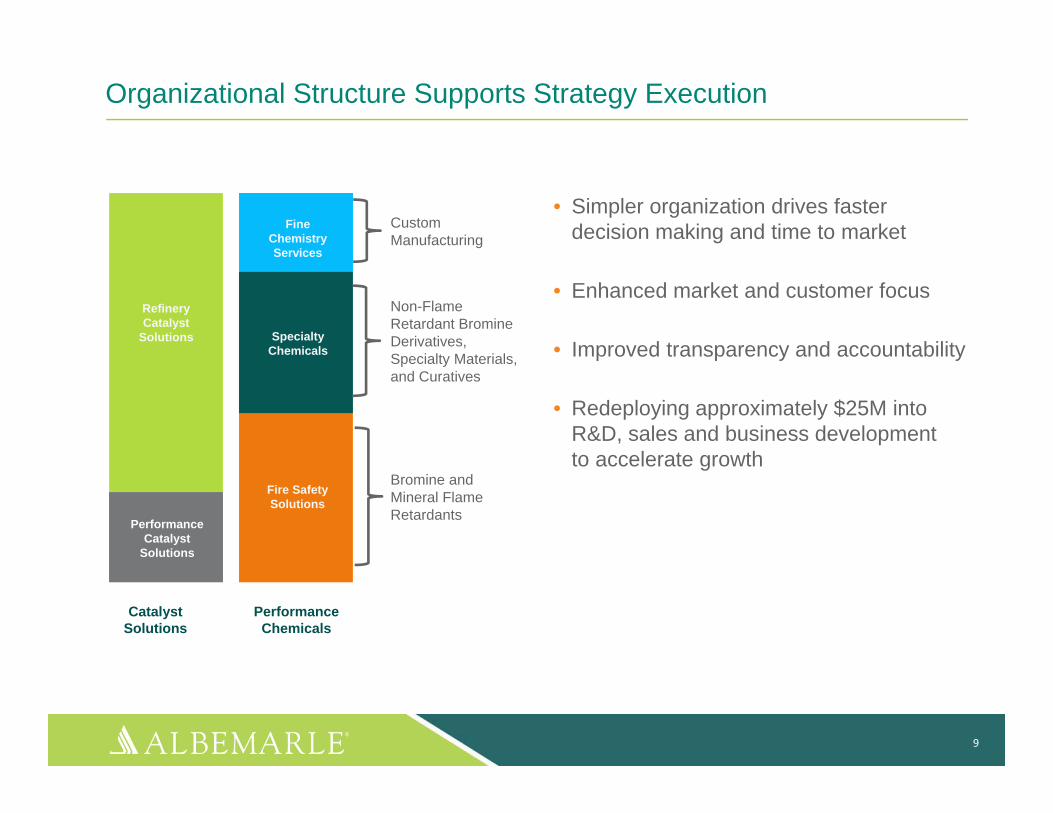
Organizational Structure Supports Strategy Execution
• Simpler organization drives faster decision making and time to market
• Enhanced market and customer focus
• Improved transparency and accountability
• Redeploying approximately $25M into R&D, sales and business development to accelerate growth
Performance Chemicals
Catalyst Solutions
Fire Safety Solutions
Specialty Chemicals
Fine Chemistry Services
Refinery Catalyst
Solutions
9
Non-Flame Retardant Bromine Derivatives, Specialty Materials, and Curatives
Custom Manufacturing
Bromine and Mineral Flame Retardants
Performance Catalyst
Solutions

Catalyst Solutions Performance ChemicalsPerformance Catalyst
Solutions Refinery Catalyst
SolutionsFire Safety Solutions
Specialty Chemicals
Fine Chemistry Services
Common Customers: Deeper wallet penetration & strategic relevance
Shared R&D: Proprietary expertise (organic / inorganic), processes, cross fertilization of ideas
Core Capabilities Overlap: Materials handling expertise, technology, manufacturing & operations, chemicals analysis
Supply Chain Efficiencies: Common raw materials, joint worksites
Shared Processes: One Albemarle strategy
10
Faster speed to marketGreater share of customer wallet and solutions breadth
Raw materials savings and optionality Stronger R&D innovation platform
Integrated Platform Increases Speed to Market, Customer Influence, Supplier Leverage & Innovation

Divestitures & Exits
A History of Actions to Drive Value
Thann
Growth & Innovation
2006 201020082005 2007 201120092004 2012 2013
Nanjing Avonmouth
Acquired refinery catalysts platform
AFX - Maximum propylene platform
Biocides for food safety
STAXTM (Advanced Performance
Modeling)
Activcat Single Site Catalyst
platform
PureGrowthTM High Purity Metal Organics
platform Products to address tight oil
New polymer catalysts plants in Korea & Saudi Arabia
Expanded bromine capacity in Jordan
Proprietary phosphorous
FR platform
Polymeric FR platform for
construction
2014
Port de BoucTeesport
Antioxidants, Ibuprofen & Propofol
Announced exit of high cost toll production
Established UOP hydroprocessing alliance
Sorbent Technologies
11
2004 2009 2013
Revenue $1,514 $2,005 $2,372
Seg. Income $101 $257 $533
Financial data for 2010 - 2013 excludes the impact of rare earth and the recently announced proposed divesture of Albemarle’s antioxidant, ibuprofen and propofol businesses and assets
HTE – Amsterdam
HTE – Bayport & Baton Rouge
Added HPC capacity w/ state-of-the-art technology
Polymeric FR platform for enclosures
Expanded FCC capacity
GBU realignment
($ in millions)

12
Managing Portfolio to Focus on Our Core and Maximize Growth and Profitability
Invest & Grow Maximize Profitability Improve or Exit
• Refinery catalysts
• Organometallics
• Single site catalysts
• Brominated derivatives into faster growing apps(1)
• Fine Chemistry Services
• Curatives
• Mineral flame retardants
• Brominated derivatives into slower growing apps(2)
• Antioxidants
• Ibuprofen
• Phosphorus
• Catilin
(1) Digital technology, mobile computing, mercury control, completion fluids, bromobutyl rubber, pharma and ag intermediates, new apps driven by Bromine Task Force(2) PCs, notebooks and TVs

• Well-positioned to capitalize on catalysts and bromine market trends with major investments already in place
• Productivity enhancements to drive improved profitability and ROCE
» At target bromine and PCS catalyst utilization rates, ALB has the potential to drive segment margin improvement to 26% - 29%
» Both catalysts and bromine enjoy incremental margins in the range of 50%
• Portfolio management» Recent exits expected to deliver 100 to 150 bps
segment margin increase
Substantial Earnings Potential with Minimal Incremental Capital Spend
13
24%
26%26%
22%
26% - 29%
2010 2011 2012 2013 Target
Total Segment Margins*
Meaningful operating leverage per incremental MT of catalysts and bromine sold
*Financial data for 2010 - 2013 excludes the impact of rare earth and the recently announced proposed divesture of Albemarle’s antioxidant, ibuprofen and propofol businesses and assets*Segment margins do not include corporate expenses

14
Valuation Not Reflective of Structurally Improved Margins
10-Year Average Relative P/E: 95% Current Relative P/E: 85%
10-Year Average Relative P/E
Source: FactSet as of 4/24/2014 - Jefferies U.S. Chemicals Universe
Invested for future growth, well positioned to take advantage of market trends and poised to improve margins

Today’s Agenda
1:50 – 2:25 pm Catalyst Solutions Michael Wilson, Senior Vice President & President, Catalyst Solutions
2:25 - 2:45 pmCatalyst Solutions R&D Edwin Berends, Vice President, Catalysts Research and Technology
2:45 - 3:00 pm Q&A
3:00 - 3:10 pm Break
3:10 - 3:45 pmPerformance Chemicals Matt Juneau, Senior Vice President & President, Performance Chemicals
3:45 - 4:05 pmPerformance Chemicals R&D Dave Clary, CTO & Vice President Performance Chemicals Research & Technology
4:05 - 4:20 pm Q&A
4:20 - 4:30 pm Break
4:30 - 4:50 pm Financial Performance & Outlook Scott Tozier, Senior Vice President & Chief Financial Officer
4:50 - 5:25 pm Q&A
5:25 - 5:30 pm Closing Remarks Luke Kissam, President & Chief Executive Officer
5:30 - 7:00 pm Reception / Exhibit Hall Open
15

2 0 1 4 I N V E S T O R D A Y
CATALYST SOLUTIONS
Michael WilsonSenior Vice President & President, Catalyst Solutions
Edwin BerendsVice President, Catalyst Solutions Research & Technology

What is a Catalyst?
catalyst [kat-l-ist] – nounChemistry. A substance that initiates, accelerates or selectively directs a chemical reaction, without being consumed
• Used at some stage in the manufacture of 90% of all commercially produced chemicals
• Vast number of forms and types; shapes, colors and sizes
• Geometry often as important as chemical composition
17
SolidCatalysts
Liquid Catalysts
Typically low in cost, but essential to the end product

18
70 µm
x10
x1,000Clay
Zeolite
FunctionalSilica/Alumina
Binder
Pores
Catalyst development involves tailoring:• Components to impact chemistry• Architecture to determine reactivity
200 nm
Catalysts are a solutions business requiring constant innovation
Complex, Highly Engineered Materials Designed at the Atomic and Molecular Level
Transmission Electron Microscopy

FCC‐ Resid
FCC‐ VGO
AlkyClean
Reforming
Hydrocracking(including mild hydrocracking)
Hydrotreating
Isomerization
FCC‐max C3=
SSC PE
Chromium
Peroxides
Power
Aromatics Oxidation
Hydrogenation
Dehydrogenation
Deg
ree
of C
ompe
titiv
e A
dvan
tage
Market Attractiveness
Resid Hydrotreating
Ziegler Natta PP
Ziegler Natta PE
Syngas
Automotive (light/med)
Automotive (other)
Automotive (med/hv)Other Stationary
Organic Synthesis
Albemarle Segment (RCS)
Albemarle Segment (PCS)
Non‐Albemarle Segment
Total
$5.6B
$0.7B
$17.5B
$23.8B
Global Catalyst Market – Our View
19
We provide refinery and polymer catalyst solutions where we are competitively advantaged based on our technology or cost position
SSC PP

Catalyst Solutions OverviewRefinery Catalyst Solutions (RCS)• Heavy Oil Upgrading (HOU)
» FCC catalysts for resid» FCC catalysts for max propylene» FCC catalysts for vacuum gas oil
• Clean Fuels Technologies (CFT)» Hydroprocessing catalysts » Isomerization» Technology licensing
Performance Catalyst Solutions (PCS)• Polyolefin catalysts and components• Organometallics and co-catalysts• Electronic materials – high purity metal organics
20
Net Sales*
$-
$200
$400
$600
$800
$1,000
$1,200
2010 2011 2012 2013
Net Sales Distribution*
2013 Net Sales: $1B
($ in millions)
($ in millions)
24%
76%
By Business
PCS
RCS 44%
35%
21%
By Region
Americas
EUMEI
Asia Pacific
0%
5%
10%
15%
20%
25%
30%
35%
$-
$50
$100
$150
$200
$250
$300
2010 2011 2012 2013
Segment Income*Segment Income
Segment Margin
*Financial data for 2010 ‐ 2013 excludes the impact of rare earth and the recently announced proposed divesture of Albemarle’s antioxidant, ibuprofen and propofol businesses and assets
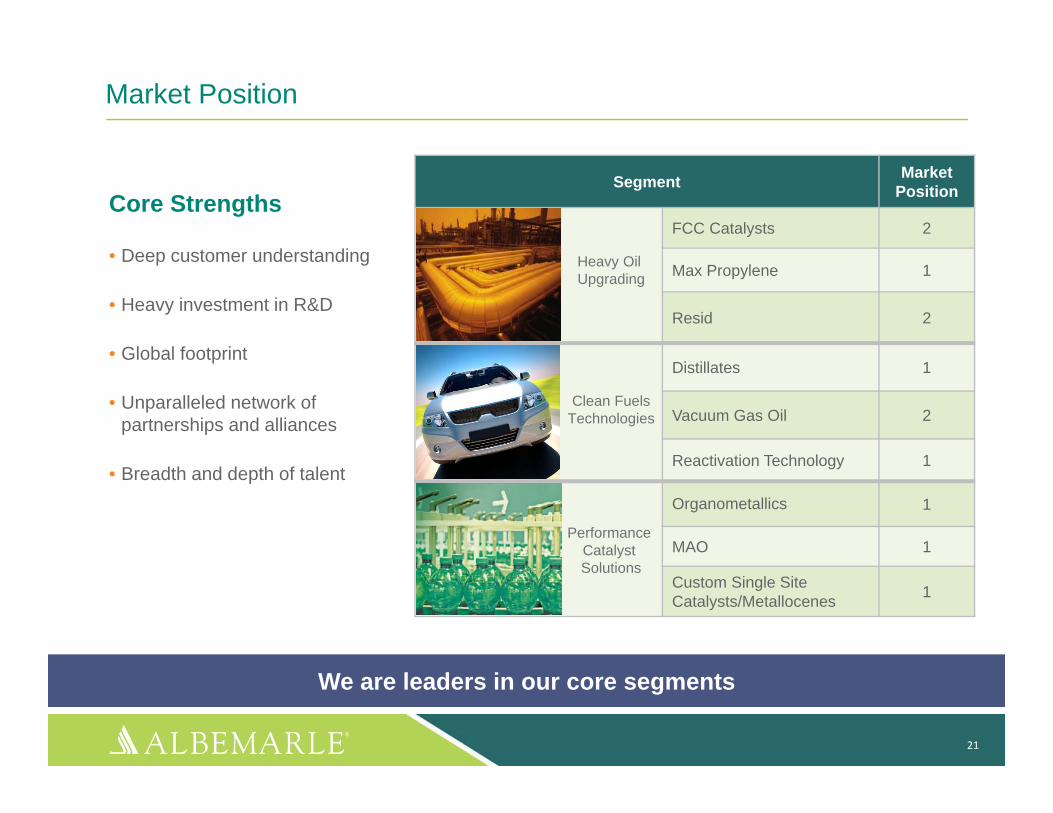
Segment Market Position
FCC Catalysts 2
Max Propylene 1
Resid 2
Distillates 1
Vacuum Gas Oil 2
Reactivation Technology 1
Organometallics 1
MAO 1
Custom Single Site Catalysts/Metallocenes 1
Market Position
21
Clean Fuels Technologies
Heavy Oil Upgrading
Performance Catalyst Solutions
Core Strengths
• Deep customer understanding
• Heavy investment in R&D
• Global footprint
• Unparalleled network of partnerships and alliances
• Breadth and depth of talent
We are leaders in our core segments

Our Goal
To be the leading catalyst company in the world
Refinery Catalyst SolutionsHeavy Oil Upgrading• Capitalize on FCC units shifting to maximize propylene• Extend leadership position in tight oil FCC applications• Develop next generation FCC catalysts for resid processing• Capture increasing share of new FCC units
Clean Fuels Technologies• Provide customized STAX® solutions for challenged feedstocks• Expand position in Vacuum Gas Oil (VGO)• Increase win rate for new units in distillates, VGO and resid via
UOP alliance • Provide REACTTM reactivation solutions to our STARSTM
customers globally
Performance Catalyst Solutions• Leverage strength in core organometallics business,
while moving downstream to finished catalysts • Capture growth in high purity electronics market via
PureGrowthTM technology• Drive higher asset utilization at SOCC, Pasadena
and Yeosu; rationalize excess capacity
Catalyst Solutions Goal and Strategy
22
Deliverables
• Double-digit earnings growth• Mid-20% segment income margins
• Maintain >50% of annual sales from new products• World class Health, Safety & Environmental performance

Safi, Jordan
St. Jakob/Breitenau, Austria
Regional/Sales Office
Manufacturing
R&D
Global Headquarters
Joint Venture
Shared Services Center
Saudi Arabia• SOCC - aluminum
alkyls JV with SABIC
Korea• Catalyst R&D and
manufacturing facility for PureGrowthTM, MAO, SSC & ActivCat®
Amsterdam• Refinery catalyst manufacturing• HTE & pilot plant capabilities• HTT capabilities
Japan• Nippon Ketjen JV
with Sumitomo• Nippon Aluminum
Alkyls JV with Mitsui
Brazil• FCCSA JV with
Petrobras (FCC)
Integrated Global Network
23
U.S. – Pasadena, TX• World class aluminum
alkyls facilityU.S. – Bayport, TX• World-class facility for
refinery catalysts• EureCat JV with IFP for
REACTTM technology• FCC capacity expansion • High throughput testing
(HTT)U.S. – Baton Rouge, LA• High throughput
experimentation (HTE) facility & polymer lab
• Manufacturing facility for Ziegler Natta, MAO, SSC & ActivCat®
U.S. – Mobile, AL• Stannica JV with PMC
Strategically positioned to deliver value to customers globally

Structure and Focus Strategic Value
• 50/50 JV with Petrobras• Leading provider of FCC catalysts and additives in
South America• Extensive R&D collaboration
• Supplies majority of Petrobras’ requirements (65% of South American FCC demand)
• Provides strategic access to South American markets
• Alliance with UOP• One of the most successful licensors of hydrotreating
units in the world• Comprehensive portfolio of technologies (licenses),
processes, catalyst equipment and services
• Uniquely combines Albemarle’s extensive portfolio of hydrotreating catalysts with UOP’s hydrocrackingknow-how
• 50/50 JV with IFP • Certified provider of REACTTM reactivation
technology
• Global leader in regeneration and reactivation of hydroprocessing catalysts enabling multi-cycle use
• Operating assets in France, U.S., Italy, Germany,India and Saudi Arabia
• 50/50 JV with Sumitomo Mining• HPC production assets and R&D facilities in Japan
• Developed STARS™ technology; Ketjenfine™ and Ketjenfine Residue™
• Strong market position in Asia Pacific• Integrated R&D and common IP between Albemarle
and Nippon Ketjen
Refinery Catalyst Solutions - Joint Ventures and Partnerships
24

Structure and Focus Strategic Value
• 50/50 JV with SABIC• World-class 6,000MT aluminium alkyls production
facility in Saudi Arabia• First producer of TEA in the Middle East
• Solidifies long-term presence in Middle East• Serves largest global growth area with regionally
produced aluminium alkyls • Provides security of supply for key customers in
GCC region such as SABIC and Chevron Phillips
• 50/50 JV with Mitsui Chemicals• 3,200MT aluminium and zinc alkyls production
facility in Japan• Resale of various Albemarle organometallics• Sales channels reaching into rest of Asia
• Access to high-value Japanese polyolefin polymersmarket for both NAA-produced alkyls and Albemarle products
• Alternative sourcing point for reliability of supply• Leverage organometallics R&D and handling
practices
• 50/50 JV with PMC• Produces organic and inorganic tin intermediates
which are key materials for the production of tin-based PVC heat stabilizers
• Uses tin alkyl as raw material• Serves an adjacent market outside of
Albemarle’s focus• Facilitates leveraging of fixed cost base by running
higher production volumes for alkyls
Nippon Aluminum Alkyls
Performance Catalyst Solutions - Joint Ventures
25
Saudi Organometallic Chemicals Company (SOCC)
Our partnerships and alliances broaden our reach, extend our technology platform and significantly enhance the value of our catalyst franchise

Refinery Catalyst Solutions (RCS)
26
Heavy Oil Upgrading Clean Fuels Technologies
• FCC for Resid
• FCC for Max Propylene
• FCC for Vacuum Gas Oil (VGO)
• Hydroprocessing
• Isomerization
• Alkylation
• Solid Phosphoric Acid (SPA) Catalysts
• Technology Licensing

38%
27%6%
10%
2%
17%
Refinery Catalysts – A Large Market with Attractive Growth
27
Projected Growth (2013 – 2019E)($ in millions)
$0.00
$0.25
$0.50
$0.75
$1.00
$1.25
CAGR = 2.3%
CAGR = 7.0%
Source: The Catalyst Group Resources
Global Revenues (2013) ($6.9B)
CAGR = 0.8%
CAGR = 3.3%
CAGR = 2.8%CAGR = 1.0%
$5.6B$1.3B
FCC
Hydrotreating
Hydrocracking
Other
Alkylation
Reforming
Addressable market growth >$1.0B
Albemarle maintains leadership positions in the most attractive refinery catalyst segments

Catalyst Solutions Throughout the Refinery
28
Heavy Oil Upgrading (FCC)
Clean Fuels Technologies (HPC)
Albemarle provides the global refining industry with a wide range of catalyst solutions to convert crude oil into high value finished products

Global FCC Catalyst Demand Driven by:• Continuous investment in refining capacity for
transportation fuels with demand shifting to developing regions
» Large scale and efficient refinery additions and revamps in AP, China and ME to meet increased regional demand
» FCC flexibility required to maximize profitability from different unit designs, varying feed qualities and desired product slate across the globe
» FCC innovation driven by atypical feeds such as tight oil and increased resid feed processing
• Pursuit of integrated refinery-petrochemical facilities
» Ongoing shale boom favors ethane-based steam cracking and less light olefin co-products
» Maximize production of light olefins such as propylene in the FCC unit to fill the supply
» New FCC units built to maximize propylene output
29
Gasoline Consumption by Region, bcm
0
500
1000
1500
2000
2500
3000
3500
4000
4500
5000
2010 2015 2020 2025
Sources: HIS CERA, LUKOIL estimates
0
10
20
30
40
50
60
70
80
90
Jan-04 Jan-05 Jan-06 Jan-07 Jan-08 Jan-09 Jan-10 Jan-11 Jan-12 Jan-13 Jan-14
Tota
l Cat
alys
t Con
sum
ptio
n (k
tpy)
FCC Max Propylene Market Evolution
ChinaOther non-OECDOther OECDNorth America
HOU: FCC Catalyst Demand Driven by Propylene Growth and Increased Transportation Fuels Demand

CFT: Catalyst Growth Will Be Accelerated by Clean Air Mandates
Global HPC Demand Growing:• Substantial global capacity additions in
refineries for hydroprocessing & hydrocracking
Driven by Combination of: • Steady increase of demand for transportation
fuels, driven by rising global passenger car ownership and expansion of commercial vehicles fleet
• Increasingly stringent fuel standards across the globe
» ULSD implementation in China, Latin America, CIS and other regions
» Tier 3 gasoline in NA» Tighter emission standards for marine
fleet
• Changing crude slates and increasing conversion of bottom-of-the-barrel
30
Desulfurization Capacity Requirements (2012 – 2035)
Sulfur Standards per Region
Mb/
d
10-15 ppm
16-50 ppm
51-350 ppm
351-500 ppm
501-2000 ppm
>2000 ppm
Source: Hart Energy Research & Consulting, September 2013
Source: Hart Energy Research & Consulting, September 2013
0
1
2
3
4
5
6
7
US &Canada
LatinAmerica
Africa Europe Russia &Casplan
Middle East China Other Asia-Pacific
Vacuum Gas Oil/Residual Fuel
Middle Distillates
Gasoline

0%
20%
40%
60%
80%
100%
ConventionalCrude Oil
Tight Oil
LPG
Naphtha
Distillate
Gas oil
Resid
Source: Management estimates
Implications of Tight Oil
31
0
1
2
3
4
5
2010 2015 2020 2025
Forecast for Shale Oil Production in the U.S., mb/d
What is Tight Oil?• Liquid hydrocarbons obtained by hydraulically fracturing shale
formations; today a NA phenomenon
• Typically a light, sweet, paraffinic feed
• Generally easy to crack, but often contains uncommon FCC contaminant metals - primarily iron, calcium, sodium and lead
CFT• Although lower in sulfur, tight oil requires additional guard bed
catalysts to protect the main bed catalysts from iron poisoning
• Albemarle’s robust portfolio of guard bed catalysts is well-suited to handle these conditions
HOU• The paraffinic and contaminant metals nature of tight oils creates
new FCC unit constraints that can result in subpar profitability
• Albemarle’s AMBERTM T and UPGRADERTM T are specially formulated to optimize FCC units processing tight oil
Implications and Opportunities
Source: EIA, LUKOIL estimates
Our robust portfolio of catalyst solutions handles a broad array of feed characteristics

Market Driver Innovation Value to Customer
Global Fuel Consumption ACTION™ FCC catalysts • Enhances transportation fuels and alky feedstock
• Raises octane value of gasoline
Heavier Crudes UPGRADER™ FCC catalysts • Upgrades resids and heavy, contaminated feedstocks
Maximum Propylene AFX™ FCC catalysts • Maximizes propylene (chemical feedstock) and bottoms conversion
Tight Oil AMBER T™ and UPGRADER T™ FCC catalysts
• Tuned to optimize tight oil processing
Global Fuel Consumption REACT™ catalyst rejuvenation technology
STAX® advanced performance modeling
• Enhances fresh catalyst value offering
• Maximizes value from the use of catalyst
Clean Air Mandates Nebula™ platform • Avoids capex
Tight Oil Ketjenguard® guard-bed catalyst platform
• High capacity contaminant trapping for main-bed catalyst protection
Capitalizing on RCS Market Trends
32
Heavy Oil Upgrading
Clean Fuels Technologies

Polymer Catalysts Electronic Materials
• Organometallics
• Single Site Catalysts
• Ziegler Natta Catalysts
• High Purity Metal Organics used in LED, semiconductors and photovoltaic solar panels
33
Performance Catalyst Solutions (PCS)

16%5%
19%
3%57%
Polymer Catalyst Market
34
$0.0
$0.2
$0.4
$0.6
$0.8
$1.0
$1B~
CAGR = 5.0%
CAGR = 5.8%
Source: The Catalyst Group ResourcesOther category includes PET, PVC , PS & ABS
Global Revenues (2013)($3.4B)
CAGR = 4.6%
Projected Growth (2013 – 2019E)($ in millions)
CAGR = 3.5%
$0.7B
$2.7B
Addressable market growth ~ $246M
Zeigler Natta - PE
Single Site
Chromium
Other
Zeigler Natta – PP CAGR = 5.0%
Leading co-catalyst position in the largest polyolefin catalyst market (ZN) as well as a custom catalyst & catalyst components producer in the fastest growing segment (SSC)

0
50
100
150
200
250
300
350
400
450
2005 2006 2007 2008 2009 2010 2011 2012 2013E 2014E 2015E 2016E 2017E 2018E
PCS: Developing Economies Drive Growing Polyolefin Demand
35
Global Ethylene CapacityConsumer trends and feedstock advantages will drive regional polyolefin demand and supply• Growing middle-class in rapidly developing economies
• Downstream effect of new ethane cracking capacity in U.S.
• Differential between ethane-based and naphtha-based economics
Capacity is well positioned to capture market growth • Investments in Saudi Arabia, North America and South Korea
• New catalyst capacity (South Korea + USA) enables 300% expansion of profitable and defensible SSC business
• Rationalizing capacity where regional feedstock/polyolefin economics are mismatched
Proprietary activation technology enables favorable economics in specialty polymers • ActivCat® in commercial scale adoption in 2014
• 2nd-generation technology in pilot phase and 3rd-generation in lab
• 20 active finished catalyst projects, of which 9 are in Asia
Cap
acity
, mn
lbs
Source: HIS Chemical, BofA Merrill Lynch Global Research
South America
Middle East
Europe
Asia
North America
0
50
100
150
200
250
300
1998 2003 2008 2013 2018
Rest of World
Middle East
Rest of Asia
China
North America
Europe
Global Polymer Demand
+3.1% CAGR +3.9% CAGR +3.9% CAGR
Dem
and,
Mt/y
Albemarle is well positioned, geographically and technically, to capture supplySource: The Catalyst Group Resources

PCS: Poised to Capitalize on LED Opportunity
36
Demand for LED lighting is increasing• Government mandates being advanced
• Asia lighting market growth of 10-14% per year*
• Capacity expansion has pushed down prices in the supply chain
Albemarle has built world-class capacity• New TMG unit and clean-room lab & packaging in
South Korea
• Acquired proprietary purification technology to enable transition to high-purity materials
Market entry progressing, though slower than anticipated• Advancing up steep learning curve on high-purity production
• Increasing qualifications (33 TMG & TEG qualifications to date, representing 30% of the market for these products)
• Evaluating commercial channels in targeted markets to accelerate repeat sales
Catalyst Grade TMA & TEA
High Purity Metal Organics
LEDs
Back Integration
* Source: Strategies Unlimited

Yeosu, Korea
• Single-site catalyst production • State-of-the-art research &
operations center• Metal organics expansion to
support electronic materials growth platform
SOCC, Saudi Arabia
• JV with SABIC• First TEA facility in the region• Meeting security of supply and
demand needs for polyolefin producers in Middle East
HTE & Polymer Lab, Global
• HTE capabilities in Amsterdam, Baton Rouge and Bayport
• Parallel Polymerization Reactor system facilitates up to 48 experiments per run
Catalyst Innovation Center, U.S.
• 5,400 square foot state-of-the-art laboratory complex
• Supports R&D efforts for Albemarle’s rapidly growing polyolefin catalyst portfolio
• Hosts eight new chemical synthesis stations
PCS: Investments in Future Growth
37
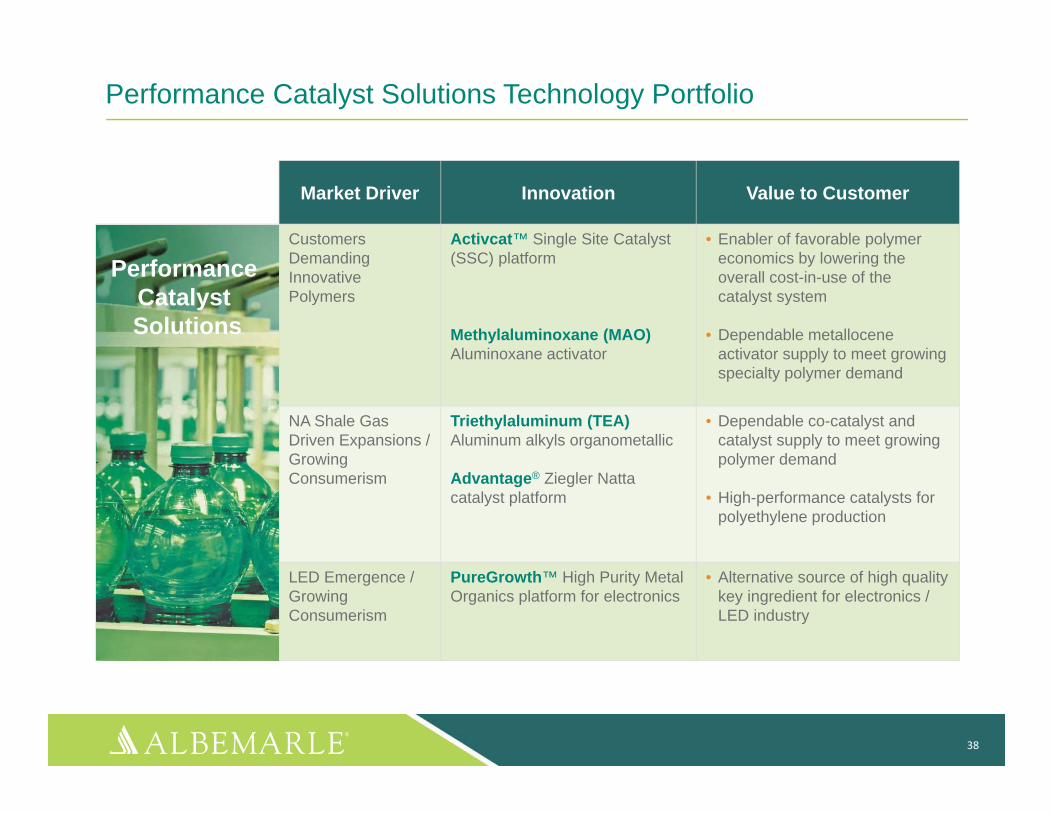
Performance Catalyst Solutions Technology Portfolio
38
Market Driver Innovation Value to Customer
Customers Demanding Innovative Polymers
Activcat™ Single Site Catalyst (SSC) platform
Methylaluminoxane (MAO)Aluminoxane activator
• Enabler of favorable polymer economics by lowering the overall cost-in-use of the catalyst system
• Dependable metalloceneactivator supply to meet growing specialty polymer demand
NA Shale Gas Driven Expansions / Growing Consumerism
Triethylaluminum (TEA) Aluminum alkyls organometallic
Advantage® Ziegler Natta catalyst platform
• Dependable co-catalyst and catalyst supply to meet growing polymer demand
• High-performance catalysts for polyethylene production
LED Emergence / Growing Consumerism
PureGrowth™ High Purity Metal Organics platform for electronics
• Alternative source of high quality key ingredient for electronics / LED industry
Performance Catalyst Solutions

Catalyst Solutions: Innovation Is Essential to Our Success
39
37% 39%
50% 49%
56%59% 58%
0%
10%
20%
30%
40%
50%
60%
2007 2008 2009 2010 2011 2012 2013
(% of total sales from products introduced in past five years)
Catalyst Solutions New Product Velocity

Strategic Pillars“Grow the Core”
Breakthrough technology development
• Longer-term product development anticipating future market needs
• Business input/market intimacy critical for success
• Develops fertile ground for future efforts
• Technology push
Manufacturing technology development
Technology and product extensions
• High capacity
• Low cost
• Low working capital
• Safe processes
• Continually raising the performance bar to meet current market needs
• Market/customer-driven pull
• Competitive leap-frogs
VISION: Advance our recognized leadership position in catalyst technologies
40
Actively managing resources to best serve customer and market needs

Safi, Jordan
St. Jakob/Breitenau, Austria
Albemarle Research & Technology facility
JV Research & Technology facility
Catalyst Resources Aligned to Support Growth
41
U.S. - Bayport, TXU.S. - Baton Rouge, LA
Amsterdam, The NetherlandsLouvain-la-Neuve, Belgium
Nippon KetjenTokyo, Japan
Petrobras/FCCSARio de Janeiro, Brazil
Yeosu, South Korea
Global reach extended by network of external experts & institutions

The Catalyst Innovation Chain
42
Pilot Scale Commercial Scale
Understanding Customer
Challenges
• High Throughput Experimentation
• Conducts up to 48 experiments per run
• Efficiently optimizes catalyst formulations
• Evaluates technology scalability
• Supported by specialized/proprietary modeling
grams kilograms metric tons
• Full-service technical support team assists with start-up through optimization and beyond
• Work collaboratively with customers to understand operating constraints and feedstock conditions
Small Scale
Proof of Concept Research Development CommercializationIdeation
Providing customized solutions for specific customer needs

Decreasing Time-to-Market for New Technologies
43
HIGH THROUGHPUT EXPERIMENTATION (HTE)• High throughput system accelerates development and decreases time-to-market
• Reactor models and bench scale units are utilized for product testing
• Samples are tested using innovative analytical techniques for key components
• Test results are used for product optimization and new product development
1 experiment per run
48 experiments per run
past
presen
t ‐HTE

Catalyst Technology Requires a Robust and Highly-Specialized Skill Set
44
HOU CFT PCS
Gel Chemistry
Specialty Zeolites
Washing/Separation
Ion Exchange
Drying/Calcination
Particle Sizing
Metals Impregnation
Powder Handling
Process Optimization
HTE Testing
Pelletizing
Extruding
Spray Drying
Quality Control
Packaging

45
70 µm
x10
x1,000Clay
Zeolite
FunctionalSilica/Alumina
Binder
Pores
Catalyst development involves tailoring:• Components to impact chemistry• Architecture to determine reactivity
200 nm
Catalysts are a solutions business, requiring constant innovation
Complex, Highly Engineered Materials Designed at the Atomic and Molecular Level
Transmission Electron Microscopy

CFT: Catalyst Optimization for Specific Customer Needs
46
• Mastering surface area and properties
• Active species well dispersed
• Balance of active functions
• Extensive experience in long-term testing of catalyst properties
THE RIGHT CATALYST FOR THE RIGHT APPLICATION
Log S, N
SN
S < 10 ppm
Zone 1
Zone 2
Zone 3
UNDERSTANDING THE REACTOR
• STAX® Technology: Applies an understanding of reactor zone behaviors to optimize catalyst selection and packing
Time-on-stream 100 hrs
Parameter A
Par
amet
er B
2
High
Low Activity
Time-on-stream 1000 hrs
2

01234
Reference 1st Gen 2nd Gen
PCS: Beyond Organometallics
47
Advantage®
• Ziegler Natta catalyst platform• High performance catalysts for PE production
PureGrowthTM
• High Purity Metal Organics platform• Used to manufacture components used in LED
lights and solar panels
Relativ
e Ac
tivity
ActivCat®
• High performance SSC for PE and PP production• More efficient "activation,” significant performance
enhancement and increased catalyst life• Lower cost in use for customer
• Developing performance-based finished catalysts and components
• Engineering “step-out” activators and supported catalysts
• Implementing high-purity production, packaging and analysis for electronics applications

2011 2012 2013 Price ManufacturingExcellence
PortfolioManagement
CapacityUtilization
AdditionalCosts
Target
20%
24% - 27%
22%20%
Segment Income Margins*
Catalyst Solutions: Delivering Sustained Results
48
*Financial data for 2011 - 2013 excludes the impact of rare earth

• Hold leading positions in strong markets
• Deep customer relationships
• Global footprint
• Strong partnerships/alliances
• Broad technology platform to capitalize on market trends
• Improving efficiency through better asset utilization, de-bottlenecking and rationalization of capacity
• Leveraging core strengths to expand positions in attractive new markets and deliver greater-than-GDP growth
49
8% to 10% Catalysts profit growth outlook over next 3 to 5 years
Catalyst Solutions: Positioned to Deliver Profitable Growth and Margin Enhancement

2 0 1 4 I N V E S T O R D A Y
PERFORMANCE CHEMICALS
Matt Juneau Senior Vice President & President, Performance Chemicals
Dave Clary CTO & Vice President, Performance Chemicals Research & Technology

45%
38%
17%
By Business
FSS
SPC
FCS48%
29%
23%
By Region
AM
EUMEI
AP
Performance Chemicals Overview
51
Fire Safety Solutions• Brominated Flame Retardants• Mineral Flame RetardantsSpecialty Chemicals• Non-Flame Retardant Bromine Derivatives• Curatives• Specialty MaterialsFine Chemistry Services• Custom Services for Pharmaceuticals, Agricultural & Electronics• Generic & Pharmaceutical Actives• Specialty Ag Intermediates
Net Sales*
Segment Income*Net Sales Distribution *
2013 Net Sales: $1.4 B
$0
$200
$400
$600
$800
$1,000
$1,200
$1,400
$1,600
$1,800
2010 2011 2012 2013
($ in millions)
0%
5%
10%
15%
20%
25%
30%
35%
$0$50
$100$150$200$250$300$350$400$450
2010 2011 2012 2013
Segment Margin
*Financial data for 2010 - 2013 excludes the recently announced proposed divesture of Albemarle’s ibuprofen and propofol businesses and assets
($ in millions)

Our Goal
Maintain and strengthen our position as the leadingbromine company in the world
Fire Safety Solutions• Maintain and strengthen industry-leading FR portfolio
• Drive FR growth via strong focus on customer partnerships and applications expertise
• Continue to bring new innovations in FR to the market
• Promote the safety and efficacy of BFRs to OEMs, regulators and NGOs
• Grow the FR market through a focus on key developing economies and high growth applications for fire safety
Specialty Chemicals• Maintain and strengthen industry-leading position in
bromine reserves, recovery and production
• Take advantage of integrated production assets to drive operational efficiency and cost reduction
• Use strong global position to drive above-trend growth in core applications (oilfield, automotive, mercury control, and pharma and ag chemicals)
• Develop new, large-volume uses for bromine
Performance Chemicals Goal and Strategy
52
Deliverables• Industry-leading profitability and return on capital
and a return to strong earnings growth
• High-20% segment income margins
• 80% utilization of bromine assets
• 4-6% annual revenue growth
• World-class Health, Safety & Environmental performance

Bromine is Essential to Performance Chemicals
53
Water Treatment
Oil Drilling
Food Safety
Consumer Electronics
Mercury Abatement
Transportation
Pharma/ Ag
Albemarle delivers value from bromine uses across multiple end markets
• Recovery is both capital & energy intensive
• Difficult & expensive to transport• Additional technology & capital
needed to derivatize• Product stewardship and Health,
Safety & Environmental expertise crucial
Strong Barriers to Entry for Bromine
Mobile Computing &
Data Processing

Strong Core of Bromine & Derivatives with High Value
54
2004 2007 2010 2013
Fire Safety Solutions Specialty Chemicals
Gross Profit from Bromine-based Products Relative Contribution/Kg Bromine Utilized(2013)
Diverse Bromine and Bromine Derivatives Offering
Delivering Attractive High-Value Margins

0 2000 4000 6000 8000 10000 12000
Seawater
China
India Concentrate
Michigan
Arkansas
Dead Sea
Dead Sea Concentrate
Competitive
Noncompetitive
80%
20%
Competitive Noncompetitive
2014 Global CapacityALB & ICL
ALB & CHMT
Closed in 2006
UK plant in 2003. France plant in 2005.
Leading Bromine Sourcing Position
55
Only producer with access to the two best sources of bromine
(ppm)

• Albemarle has capacity to efficiently meet demand growth• China production capacity continues structural decline• Remaining producers (except ICL) operating at/near capacity
56
Bromine: Snapshot of Global Capacity, 2009 to 2014
0
50
100
150
200
250
300
ICL ALB CHMT China Tosoh India
2009
2014
Source: Management estimates; market research; Arkansas Oil and Gas Commission
Capacity available for future growth
ICL52%ALB
47%
Other1%
Albemarle is positioned to capture significant growth
(thousands of MTs)

Oilfield
Rubber/ PTA
Pharma / Ag
Mercury
Water Treatment
Other
57
Strong Core and Solid Growth Prospects
• Flame retardants for auto, data processing, communications and industrial electronics
• Completion fluids for oil drilling
• Mercury abatement
• Water treatment and biocides for food safety
• Bromobutyl rubber for tires
Projected 4-6% Growth over Next 5 Years
• Flame retardants for construction
• Ag / Pharma intermediates
Significant Opportunity to Capitalize on Value of Bromine MoleculeSignificant Opportunity to Capitalize on Value of Bromine Molecule
Trend Growth Markets Above-Trend Growth Markets
$2.75B Global Market (2013E)
Albemarle is well positioned to capitalize based on:Diverse End Markets
Product Portfolio BreadthFavorable Globalization Trends
Unique Global Footprint & Cost Position
FlameRetardants

Market Trends: Performance Chemicals
58
OilfieldData Processing and Communications
Mercury AbatementTransportation Pharmaceutical and Agricultural
Automotive

FR: High Growth in Data Processing and Communications
59
$0
$50
$100
$150
$200
$250
$300
$350
$400
2012 2017
Current and Future Drivers Core Applications (PCs, etc.)
~ 9% CAGR
(1) Includes: Smartphones, TVs, Servers, Tablets, Industrial Electronics, Automotive Electronics(2) Includes: Consumer Electronics, Communications Electronics, Peripherals & Other Data Processing Electronics, Traditional Mobile Phones, Appliances, Military and Civil Aerospace Electronics
Source: Gartner 2013
(1) (2)
Semiconductor Consumption by Application ($ in millions)
Compelling growth opportunities in:• Communication & Mobile Devices:
Smartphones, Tablets• Computing, Data Processing:
Servers• Automotive/Transportation• Industrial & Medical• Home/Office Electronics &
Appliances
Stable core product set

0
100
200
300
400
500
600
700
800
900
1000
2012 2013 2014 2015 2016Desktop Portable Tablet Smartphone
Source: IHS; Gartner; IDC; IC Insights; DisplaySearch; Albemarle management
Devices Sold(MM)
FR: Communication & Mobile Devices Key to Growth
60
0
2
4
6
8
10
12
2012 2013 2014 2015 2016
Data Processing,
Communication &
Mobile Devices Markets Driving Server Growth
Servers

Estimated Circuit Board FR Consumption per Device(weighted by device unit sales)
Source: Management estimates
Server
Desktop
Laptop
Tablet +Mobile Phone
FR: Changing Consumption Pattern in Circuit Board Applications
61
Servers have overtaken PCs as key to BFR consumption in Printed Circuit Boards

Source: Infineon; BofA Merrill Lynch Global Research estimates; World Bank; IHS; KPMG; Management estimates*Western Europe includes: EU-15 plus Norway and Switzerland
Semiconductor Opportunity by Category(Sales)
Infotainment
Body
Safety
Powertrain
2010 2015
$4.4B$7.8B
$5.1B
$5.2B
$3.5B
$8.9B
$8.2B
$5.2B
62
FR: Automotive Electronics Becoming Growth Driver
Key Drivers• Stricter fuel economy and emissions mandates• Requirements for advanced safety systems• Consumer demand for greater infotainment capabilities• Consumer demand for luxury vehicles and convenience features• Growth of hybrid and electric vehicles
» Hybrid vehicle worldwide market projected to grow 200% from 2014 to 2017
Vehicle Penetration by Country (2013)(Car ownership per 1,000 people)
0
10
20
30
40
50
60
India China Brazil WesternEurope*
US
Increasing use of electronics and increasing car market in developing world will fuel growth

Well-positioned to Capitalize on New Demand for FRs
63
Best product portfolio for widest range of electrical and electronic applications across all markets
Global Completion & Production Services
0
20
40
60
80
100
120
140
160
2005 2006 2007 2008 2009 2010 2011 2012 2013 2014 2015 2016
North America South and Central AmericaEurope Middle East and AfricaAsia Pacific
Rev
enue
in b
illion
s
7% CAGR (2011-2016)
Source: GBI Research; JP Morgan* Reflects 2014 forecasted CAPEX growth vs. 2013
64
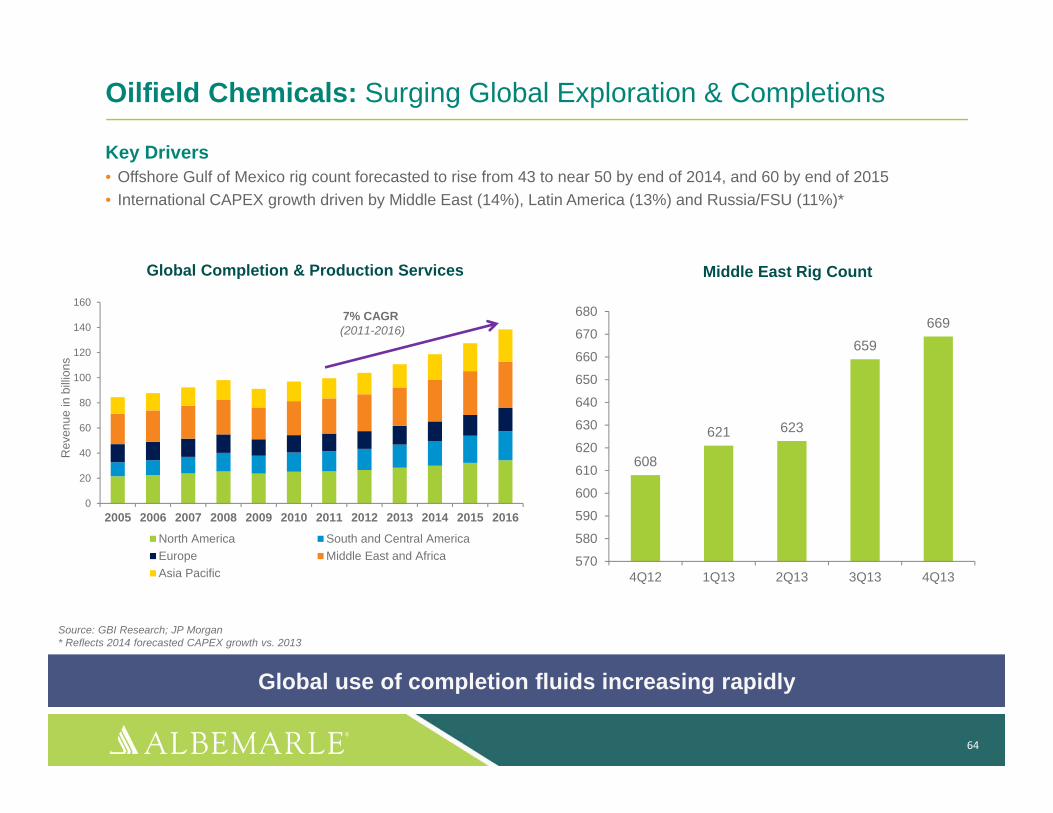
Oilfield Chemicals: Surging Global Exploration & Completions
Key Drivers• Offshore Gulf of Mexico rig count forecasted to rise from 43 to near 50 by end of 2014, and 60 by end of 2015• International CAPEX growth driven by Middle East (14%), Latin America (13%) and Russia/FSU (11%)*
608
621 623
659669
570
580
590
600
610
620
630
640
650
660
670
680
4Q12 1Q13 2Q13 3Q13 4Q13
Middle East Rig Count
Global use of completion fluids increasing rapidly

Source: Primary Research and Industry Sources; Ken Research; Morgan Stanley Research
Total (Mtpa)
Lanxess 70,000
Reliance/ Sibur 100,000
SABIC/ ExxonMobil 110,000
ExxonMobil 140,000
Panjin Heyn 150,000
Other 75,000
Bromobutyl Rubber Key ProjectExpansion Announcements (2013-2018)
65
Bromobutyl Rubber: Mobility & Modernization Driving Growth
China Tire Market Segmentation on the Basis of Radial and Non-Radial Tire Production (2012)
71.4%
28.6%Radial
Non‐Radial
India Tire Market Segmentation on the Basis of Level of Radialisation (2012)
0%20%40%60%80%
100%
Passenger Cars CommercialVehicles
Key Drivers• Recovery in car markets in developed world• Higher rates of car ownership in developing world (India, China, etc.)• Additional “radialisation” of the tire market in developing world, especially in commercial vehicles
Global consumerism driving 6-7% CAGR

Ag & Pharmaceuticals: Steady Growth with Upside Potential
66
16.5
10.8
4.5
3
3
0.6
0 5 10 15 20
Korea
Japan
United States
Global Average
Europe
India
Average Global Pesticide Use(2012)
Kg/Hectare
Source: Ken Research*Other includes Argentina, Egypt, Indonesia, Mexico, Pakistan, Poland, Romania, South Africa, Thailand, Turkey, Ukraine, Venezuela and Vietnam
66.9
25.6 20.7 15.6
76.6
175.8
57.345.1 48.8
172.2
0
20
40
60
80
100
120
140
160
180
200
China Brazil Russia India Other*
Sales in 2011 Projected Sales in 2020
Demand for Medicine is Rising Rapidly in Growth Markets
US
$ bi
llion
s
Key Drivers• Aging population continues to drive pharmaceuticals demand in U.S., Europe, Japan, etc.• Increasing standards of living in developing world impacting both medicine and food demand
Albemarle’s Offerings in Pharma and Ag Products: Bromine, HBr and organic bromides used as synthesis intermediates
Well positioned to take advantage of globalization trends

Mercury Control: Strength in Major Market Channels
67
- 5,000
10,000 15,000 20,000 25,000 30,000 35,000 40,000
2012 2013 2014 2015 2016 2017
Key Drivers• EPA MATS standard (2Q 2015) will drive NA growth• China is a major long-term opportunity• Europe, industrial boilers, cement kilns are add-on opportunities
Albemarle’s Offerings in Mercury Control: • Section 45 – Calcium Bromide• Pre-combustion – Calcium Bromide• Brominated PAC – Bromine
NA Bromine Demand in Mercury Control
Source: Albemarle estimates; US Energy Information Administration.
Capital Plans
Unknown
Plan to Retire
Capital Spent/ Being spent to
comply with MATS
NA Coal Power Plant – MATS Compliance Strategy
76%
16%
8%mT
Leveraging strength in bromine derivatives to address more stringent industry standards

• High-growth, attractive markets» Etching for semiconductors» Water Treatment» Food Safety» Precision cleaning solvents for electronics & automotive
• Leverages every bromine molecule» Reduces recycle» Optimizes production
68
Specialty Applications: Optimize Bromine Assets & Create Added Value
Bromine SpecialtyProduct A
SpecialtyProduct B
SpecialtyProduct C
SpecialtyProduct D
Source: Management estimates
Relative Contribution/Kg Bromine Utilized
Demonstrates versatility and value of bromine technology

42%
23%
11%
3%
3%19%16%
48%3%
1%
8%
24%
Flame Retardants Gas Additives Clear Brine Fluids Water Treatment PTA Methyl Bromide Other
36%
26%
9%3%
26%
1970s-1980s 2013 Future
Source: Management estimatesOther includes: photographic chemicals, halons, non-water treating biocides, pharma intermediates, ag intermediates, high purity HBr for electronics and mercury control
Historical Evolution of US Bromine Consumption
69
A proven history of successfully managing changing market demands

Bromine: The Wonder Element
70
Unique and versatile combination of properties provides value across a wide range of applications
Dense Oxidizes Metal
BulkyForms Stable
Radicals
Liquid & High Redox
Potential
Affects Light
Absorption
Creates Polar
Molecules
Oxidizes Organic
Compounds

A Strong and Growing Pipeline of Projects
Addressing Substantial Market Opportunities
• Delivering value by leveraging bromine properties
• Executable and realistic
Uniquely Positioned to Succeed
• Bromine strength, focus and reputation
• Catalyst expertise and process development
• Custom Services provides speed-to-market and low-cost sample production
• Stand-alone technical and business development team able to leverage the larger organization as needed
71
Creating New Bromine Demand Drivers
Growing new high-revenue, high-value businesses

The Right Skill Set & Capabilities to Develop New Bromine Businesses
72
Bromine Custom Services Catalysts Outside
Collaboration
Process Optimization
Corrosive/Hazardous Material Handling
High Throughput Experimentation
Bromination Chemistry
Process Scale-up
Quality Control
Metal Impregnation
Electrochemistry
Catalyst Screening
Broad Chemistry Expertise
Process Evaluation
Polymer Science
Application Testing
Activated Carbon
Market Research
Low-cost Sample Production
Speed to Market
Idea Generation

020406080100120140160180200
$-
$20
$40
$60
$80
$100
$120
$140
2012 2013 2014 2015 2016 2017Billion USD GWh
Lux Research $113B by 2017BCG $345B by 2030Piper Jaffray $100B by 2017
$600B by 2022
$B GWh
Global Market for Grid-Scale Energy Storage
Key Drivers• Increased reliance on distributed solar and wind power generation • Micro-grids for commercial and defense applications • Backup power for developing nations with rising diesel fuel costs and growing pollution concerns (India, Africa)
Source: BP Statistical Review of World Energy 2012; BP Energy Outlook 2030; Lux Research
0
50000
100000
150000
200000
250000
300000
350000
0%
10%
20%
30%
40%
50%
60%
70%
80%
90%
100%
Wind Solar Geothermal TOTAL
Global Cumulative Installed Energy Capacity From Renewable Sources
Megaw
atts
Growth Opportunity: Energy Storage Market
73

Advantages• Decoupling of power and storage (allowing long-duration discharge)
• Less expensive materials: $300/kW vs. $1000/kW for Li-ion
• Can fully charge/discharge with little electrode damage
• Scalable
Energy Storage: The Flow Battery Solution
74
Source: Management estimates
Enabling the electrical grid of the future

Albemarle is moving quickly• Developing high-performance electrolytes• Providing qualification samples to customers• Building customer relationships and positioning for sales
Bromine is well positioned• Advantages versus other flow-battery chemistries:
» Bromine is liquid at standard conditions» High-energy density » Lower electrolyte costs
• Zinc Bromide and Hydrogen Bromide are most commercially-advanced
• Other bromine-based systems under development
Source: Management estimates
Flow Batteries: Bromine’s Potential
75
• Security of supply will be very important – large volumes, logistics, global market• Customers need suppliers with strong base in bromine technology• Ongoing customer support will be critical – Health, Safety & Environmental, technical
service, materials of construction, transportation and handling expertise
Why Will Albemarle Win?
Total market opportunity 25K-50K MT/yr of bromine

Albemarle’s Program• Lab-scale and pilot-scale testing• Albemarle developing a bromine-based process in cooperation
with a leading industry laboratory
Increased Regulatory Pressure on the Use of Cyanide in Heap Leaching• Caused by environmental damage from past spills (especially in
Colorado and Romania)• Montana, Wisconsin, Czech Republic, Hungary, Turkey, parts
of Argentina, Costa Rica and Germany have banned this use of cyanide
• Increased regulatory and stakeholder scrutiny in other areas
Source: Management estimates
Key Drivers• Environmental pressure on existing cyanide technology• Better performance for some types of gold ore
Bromine offers a sustainable, effective alternative to cyanide in gold recovery
Growth Opportunity: Gold Recovery
76
Total market opportunity > 20K MT/yr of bromine

Performance Chemicals: Delivering Sustained Results
77
26% 26%21%
2011 2012 2013 Mineral FRImprovement
PortfolioManagement
Price Bromine @80% Utilization
AdditionalCosts
Target
27% - 30%
Segment Income Margins

78
Performance Chemicals: Leading the Way in Bromine
The right people, resources, assets and technology to win
Committed to delivering:• Industry-leading segment margins and profitability
• 20+% ROCE
• Revenue growth of 4-6%
• World-class Health, Safety & Environmental performance
Through intense focus on:• Our bromine and bromine chemicals assets
• The “right” markets and customers across our businesses
• Value-based differentiation
• Leveraging the global reach of our business
• Driving new businesses based on bromine chemistry

2 0 1 4 I N V E S T O R D A Y
FINANCIAL PERFORMANCE & OUTLOOKScott TozierSenior Vice President & Chief Financial Officer

Financial Performance Summary
80
$2,155 $2,516 $2,443 $2,372
$2.5 -$2.6B
2010 2011 2012 2013 2014F
Net Sales*
Total Net Sales Catalyst Solutions Performance Chemicals
$521
$651 $646
$533 $540 - $570
2010 2011 2012 2013 2014F
Segment Income*
Total Segment Income Catalyst Solutions Performance Chemicals
$317 $282
$203
$275
$340 - $390
6.2% 6.2%
3.7%
5.4%
6-7%
2010 2011 2012 2013 2014F
Free Cash Flow*
Free Cash Flow FCF Yield
$305 $271 $205
$588 $590 - $615
0.5x0.4x
0.3x
1.0x1.0x
2010 2011 2012 2013 2014F
Net-Debt-to-EBITDA
Net Debt Net-Debt-to-EBITDA
*Financial data for 2010 - 2013 excludes the impact of rare earth and the recently announced proposed divesture of Albemarle’s antioxidant, ibuprofen and propofol businesses and assets
($ in millions)

Cap
ital R
etur
nsInvest in core to drive innovation and organic growth
Focus on return on capital employed
Sustainable working capital reductions
Disciplined merger and acquisition strategy
Consistent dividend growth and total shareholder return
Maintain investment grade status and strong balance sheet
Our Financial Priorities
81

10%13%
12%
15% 16%
12%14%
16%15% 16%
5%
9%
14%
14%14%
11%
23%
26%25%
19%20%
0%
5%
10%
15%
20%
25%
30%
2004 2005 2006 2007 2008 2009 2010 2011 2012 2013 2014F
Dow Jones U.S. Chemicals Index ALB
Return on Capital Employed
Margins Capital Efficiency Portfolio Management
ROCE = Adjusted EBIT / Total Assets - Current Liabilities (ex short term debt) – Cash
82
Recent Trend Reflects Major InvestmentsPortfolio Actions & Improved Asset Utilization to Drive Improvement
5yr Average 10yr Average
ALB 21% 16%
Dow Jones U.S. Chemicals Index 15% 14%
• Cost management• Asset utilization• Operating leverage
• Working capital reductions • Product innovation• Disciplined M&A• Divest underperformners
Financial data for 2010 - 2013 excludes the impact of rare earth and the recently announced proposed divesture of Albemarle’s antioxidant, ibuprofen and propofol businesses and assets

3746
65
AlbemarleCorporation
Median Upper Quartile
~$88M potential impact
5957
53
AlbemarleCorporation
Median Upper Quartile
Working Capital: Substantial Cash Flow Opportunity
Days Payable OutstandingDays Inventory Outstanding
94
6257
AlbemarleCorporation
Median Upper Quartile
Source: Hackett Group Peer Study – 2013. Peers: PolyOne, Celanese, Ashland, Grace, Sherwin-Williams, Akzo Nobel, BASF, Huntsman, RPM, Clariant, Chemtura
Days Sales Outstanding
83
~$165M potential impact
~$27M potential impact
Committed to delivering $100M in permanent working capital savings by 2015 with upside opportunity
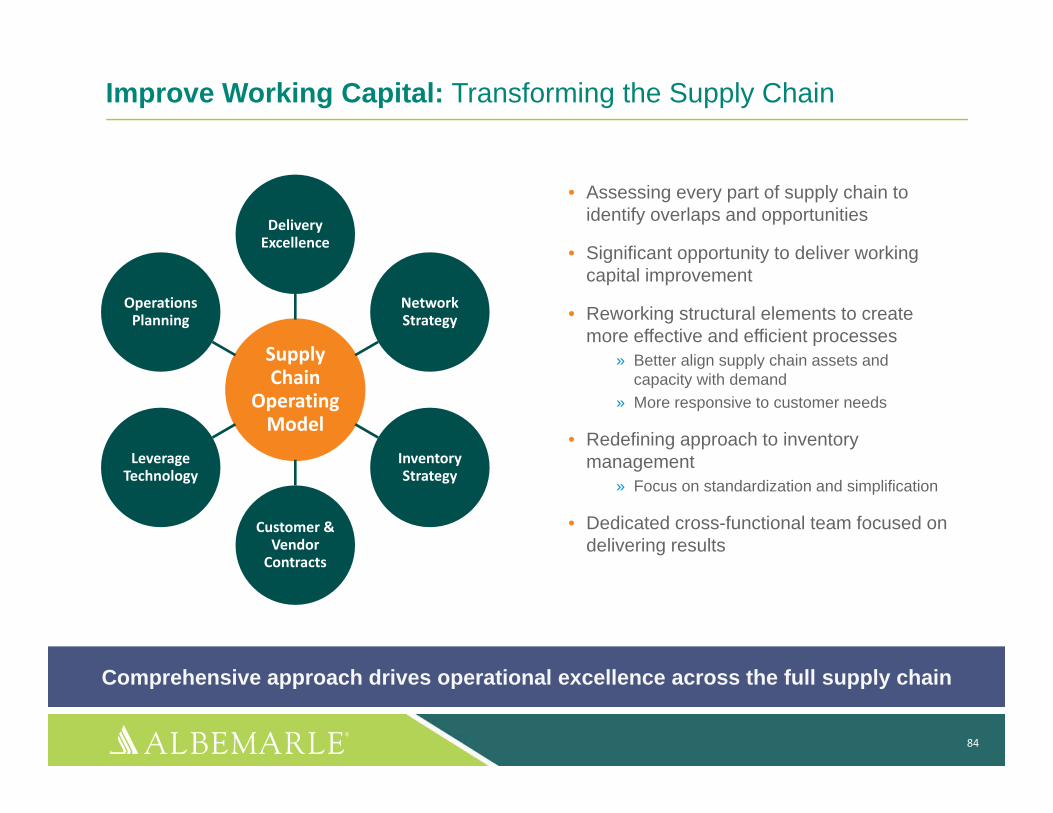
Improve Working Capital: Transforming the Supply Chain
• Assessing every part of supply chain to identify overlaps and opportunities
• Significant opportunity to deliver working capital improvement
• Reworking structural elements to create more effective and efficient processes
» Better align supply chain assets and capacity with demand
» More responsive to customer needs
• Redefining approach to inventory management
» Focus on standardization and simplification
• Dedicated cross-functional team focused on delivering results
Supply Chain
Operating Model
Delivery Excellence
Network Strategy
Inventory Strategy
Customer & Vendor Contracts
Leverage Technology
Operations Planning
84
Comprehensive approach drives operational excellence across the full supply chain

Disciplined Mergers and Acquisitions
• Consistent with our strategy» Strengthen and grow catalysts
» Expand uses for bromine
• Technological synergies
• Market leaders
• Attractive industry structure
• Creates stronger free cash flow
• Accretive and value enhancing
85
Financial strength allows for M&A opportunities
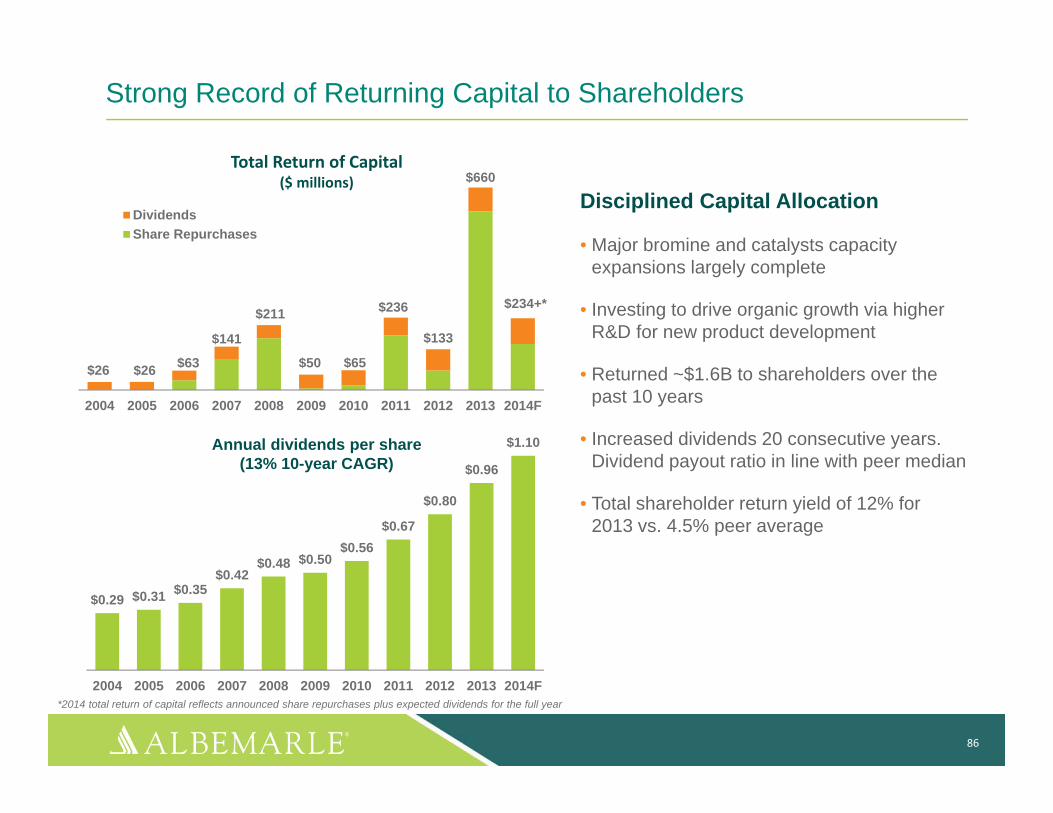
Total Return of Capital ($ millions)
$0.29 $0.31 $0.35$0.42
$0.48 $0.50$0.56
$0.67
$0.80
$0.96
$1.10
2004 2005 2006 2007 2008 2009 2010 2011 2012 2013 2014F
Annual dividends per share(13% 10-year CAGR)
$26 $26 $63
$141
$211
$50 $65
$236
$133
$660
$234+*
2004 2005 2006 2007 2008 2009 2010 2011 2012 2013 2014F
DividendsShare Repurchases
Strong Record of Returning Capital to Shareholders
Disciplined Capital Allocation
• Major bromine and catalysts capacity expansions largely complete
• Investing to drive organic growth via higher R&D for new product development
• Returned ~$1.6B to shareholders over the past 10 years
• Increased dividends 20 consecutive years. Dividend payout ratio in line with peer median
• Total shareholder return yield of 12% for 2013 vs. 4.5% peer average
86
*2014 total return of capital reflects announced share repurchases plus expected dividends for the full year

$1.2B
$0.3B
$0.9B
$1.6B
Continued Disciplined Approach to Capital Allocation
Outlook
• Committed to continued dividend growth
• CAPEX in the range of 4% of sales
• Working capital reduction of $100M by 2015
• Disciplined M&A
• No voluntary pension contributions in 2014
• Maintain investment grade credit rating
• Continued use of excess cash flow to fund share buybacks
2004-2013($ in millions)
87
Total Return of Capital (repurchases & dividends)
CAPEX
Pension Contributions & Other
Acquisitions
1x Net-Debt-to-EBITDA guideline = flexibility and consistent return of cash

Operating Segment
Revenue Growth Targets
2013 SegmentMargin*
Segment Margin Target Growth and Profitability Drivers
1.0x - 2.0x GDP 22% 24% - 27%
• Improved asset utilization• High incremental margins• Market trends• New products
1.0x – 1.5x GDP 23% 27% - 30%
• Improved asset utilization• High incremental margins• Improvement in electronics
and mix shift• New uses of bromine• Market trends
1.0x – 2.0x GDP 22% 26% - 29% • Committed to higher return on capital• Continued focus on cost efficiency
Financial Outlook
88
Total Company
Market trends, asset utilization & portfolio actions drive growth & profitability
*Financial data for 2010 - 2013 excludes the impact of rare earth and the recently announced proposed divesture of Albemarle’s antioxidant, ibuprofen and propofol businesses and assets*Segment margins do not include corporate expenses
Catalyst Solutions
Performance Chemicals

Albemarle: Compelling Investment Opportunity
• History of industry-leading returns to shareholders
• Global leader in attractive markets: catalysts and bromine
• Differentiated, performance-based core technologies driving innovative solutions
• Capacity in place to serve future growth to drive improved profitability and ROCE
• Outstanding cash generation capacity
• Disciplined capital allocation
• Valuation not reflective of current or future earnings power
• Management incentives aligned with growth and total shareholder return
89
Well-positioned to improve returns, drive increased free cash flow and deliver value to shareholders

Albemarle is Positioned to Succeed
90
Products• Constantly
innovating• Performance-based
value propositions • Highly-customized• Aligned with
market trends
R&D• Investing in the
future• 2,400 patents
awarded over 10 years
• Well over 100 PhDs
Financials• Outstanding profit
margins • Strong cash flow • Balance sheet
flexibility • Excellent banking
relationships • Investment grade
rating
People• Experienced
leadership with incentives aligned with shareholder returns
• World-class, talented, creative employee base
• Strong Board of Directors

Tomorrow’s Agenda
• Depart for Plant
• Welcome/Safety Review
• Plant Tour
• Texas BBQ
• Closing Remarks
91