Embed Size (px)
Citation preview

Catalyst for Completion:Performance-Based Funding in Higher EducationA case study of three states
By Matthew Crellin, Darrell Aaron, David Mabe, Courtney Wilk
March 2011
Policy and Research45 Temple Place
Boston, MA 02111
T 617-357-9620 x130F 617-338-1577
nebhe.org

Acknowledgements
This report was written by Matthew Crellin, Director of Policy and Research for the New
England Board of Higher Education along with NEBHE Research Fellows Darrell Aaron, David Mabe, and Courtney Wilk. Special thanks to Stan Jones of Complete College
America, Patrick Kelly at the National Center for Higher Education Management Systems,
Rich Petrick of the Ohio Board of Regents, and Russ Deaton at the Tennessee Higher
Education Commission for their thoughts, mindshare, and contributions. Editorial
assistance was provided by John O. Harney from the New England Journal of Higher
Education and by NEBHE President and CEO Michael K. Thomas.
About NEBHEThe New England Board of Higher Education (NEBHE) was founded in 1955, when six
visionary New England governors – realizing that the future prosperity of New England rested on higher education – committed their states to the shared pursuit of academic
excellence. Soon thereafter, NEBHE was approved by New England’s six state legislatures
and authorized by the U.S. Congress. NEBHE works to promote greater educational
opportunities and services for the residents of New England.
2

State policymakers and leaders in higher education are
focused on college completion in a manner nearly
unprecedented in American history, with the call for a more
educated citizenry ringing from the halls of the White
House down through the academic quad. Yet, the gap
between the stated goal and reality is wide: According to
Complete College America, nearly one in two students
pursuing a bachelor’s degree will not obtain a college
credential – and even lower graduation rates exist in our
public community college system. Meanwhile, most states
assign funding to colleges and universities based on
enrollment numbers, with few incentives for completion, be
it by semester, year or degree.
The performance-based models in motion in Ohio, Indiana,
and Tennessee depart from the traditional philosophy that
institutional funding be apportioned according to
enrollment levels. Rather than rewarding institutions for
simply enrolling more students, these states have
anchored institutional appropriations to positive outcomes.
Moreover, in a marked shift, these performance-based
models are foundational; they are neither afterthoughts nor
are they toothless. With funding tied primarily to
persistence and completion metrics, among other
measures of performance, institutions in these states are
incentivized to care much more for student success than
for student quantity.
Moving toward performance-based funding measures
allows the state higher education system to continue to
engage support for colleges and universities while
promoting its egalitarian and societal benefits. However,
many policymakers and key stakeholders have deep
questions about performance-based funding models, and
their intended and unintended consequences.
The value of a college education continues to be in high
demand, helping people attain success both socially and
economically. College graduates additionally experience a
host of other intrinsic benefits from a college education,
such as lower rates of incarceration and higher rates of
good health and charitable activity (Baum and Payea,
2004). States cannot ignore these social needs and a
charge to develop human capital – a set of cultivated skills
and knowledge that comes from education and training –
to create investments into society. However, the benefits of
education are most fully realized, both economically and
socially, when the experience and time culminates in the
awarding of a degree, which acts as both a signal of
acquired skills and development of human capital.
Economic literature also supports the notion that
development of human capital directly affects
improvements in national and regional productivity and
economic growth across various sectors and industries.
This policy brief examines three different state models that
approach performance-based funding, with varying
designs and strategies. In short, this brief aims to:
1. Present the performance funding models of
Ohio, Indiana, and Tennessee, including their
strategies for implementation, their funding
percentages, designs, and methodologies for
calculating success.
2. Learn more about the common patterns and
idiosyncrasies of performance-based funding,
including what states and institutions find rewarding
and challenging about such measures.
3. Analyze the current environment around
performance-based funding in New England and
place this information into a regional context.
Performance-Based Funding: funding models that incentivize graduation, not just enrollment
With funding tied primarily to persistence and completion metrics, among other measures of performance, institutions in these states are incentivized to care much more for student success than for student quantity.
3
OHIOAligning with a strategic plan to create a comprehensive performance funding system
Over the past two decades, Ohio’s higher education system has included some
form of performance-based funding – that is, a certain proportion of state
appropriations to public institutions that has been based on performance in
outcome areas like course completion, success in attracting and graduating at-risk
students, and degree attainment.
In the early 1990s, Ohio had fallen to 41st nationally in per-student spending on
higher education, and Ohio’s in-state tuition had surpassed the national average by
nearly 40%. In response, the Ohio Board of Regents appointed a task force that,
after a three-year study, issued a report in 1992 entitled “Managing for the Future:
Challenges and Opportunities for Higher Education in Ohio.” This report called for
shifting state appropriations from a model primarily driven by enrollment levels to
one attuned to institutional performance. Specifically, the report sought to “secure
resources to make higher education affordable” and to “work to ensure that state
funding [provided] incentives for quality enhancements”
In 1996, Ohio created the Higher Education Funding Commission (HEFC) and
worked to revamp performance-funding structures through its Core Performance
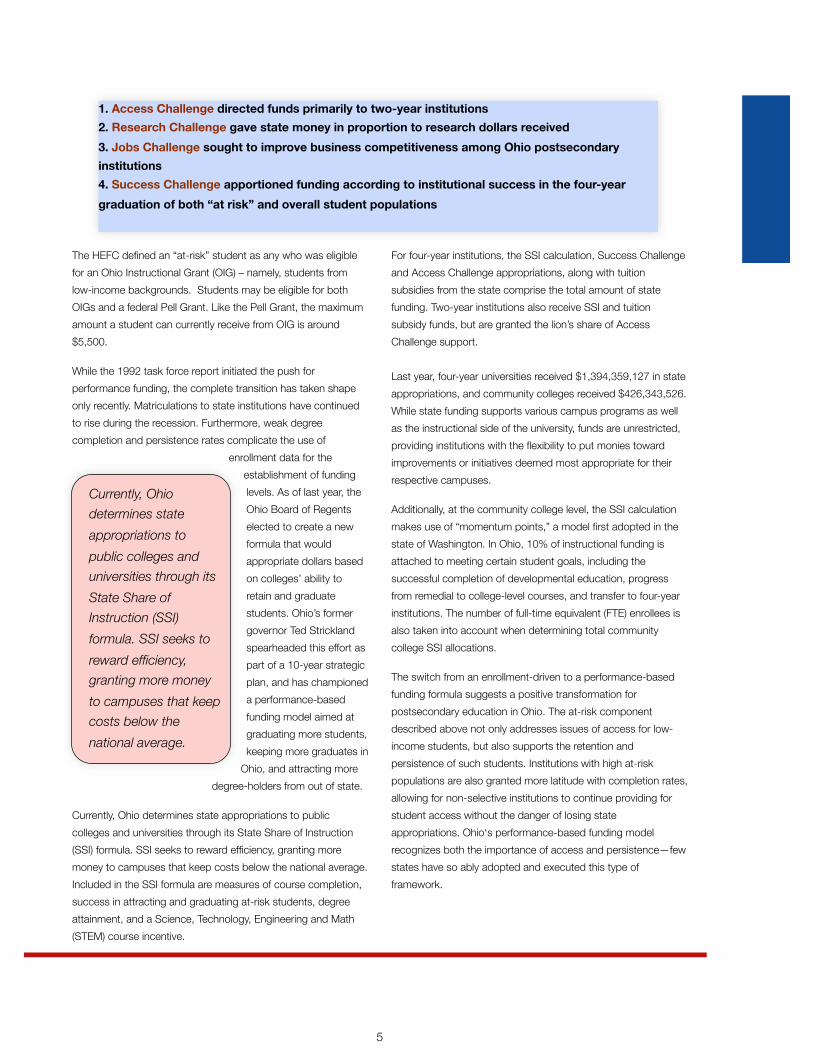
Funding Plan. The HEFC created four challenge initiatives, as shown in the following
box:
4
The HEFC defined an “at-risk” student as any who was eligible
for an Ohio Instructional Grant (OIG) – namely, students from
low-income backgrounds. Students may be eligible for both
OIGs and a federal Pell Grant. Like the Pell Grant, the maximum
amount a student can currently receive from OIG is around
$5,500.
While the 1992 task force report initiated the push for
performance funding, the complete transition has taken shape
only recently. Matriculations to state institutions have continued
to rise during the recession. Furthermore, weak degree
completion and persistence rates complicate the use of
enrollment data for the
establishment of funding
levels. As of last year, the
Ohio Board of Regents
elected to create a new
formula that would
appropriate dollars based
on colleges’ ability to
retain and graduate
students. Ohio’s former
governor Ted Strickland
spearheaded this effort as
part of a 10-year strategic
plan, and has championed
a performance-based
funding model aimed at
graduating more students,
keeping more graduates in
Ohio, and attracting more
degree-holders from out of state.
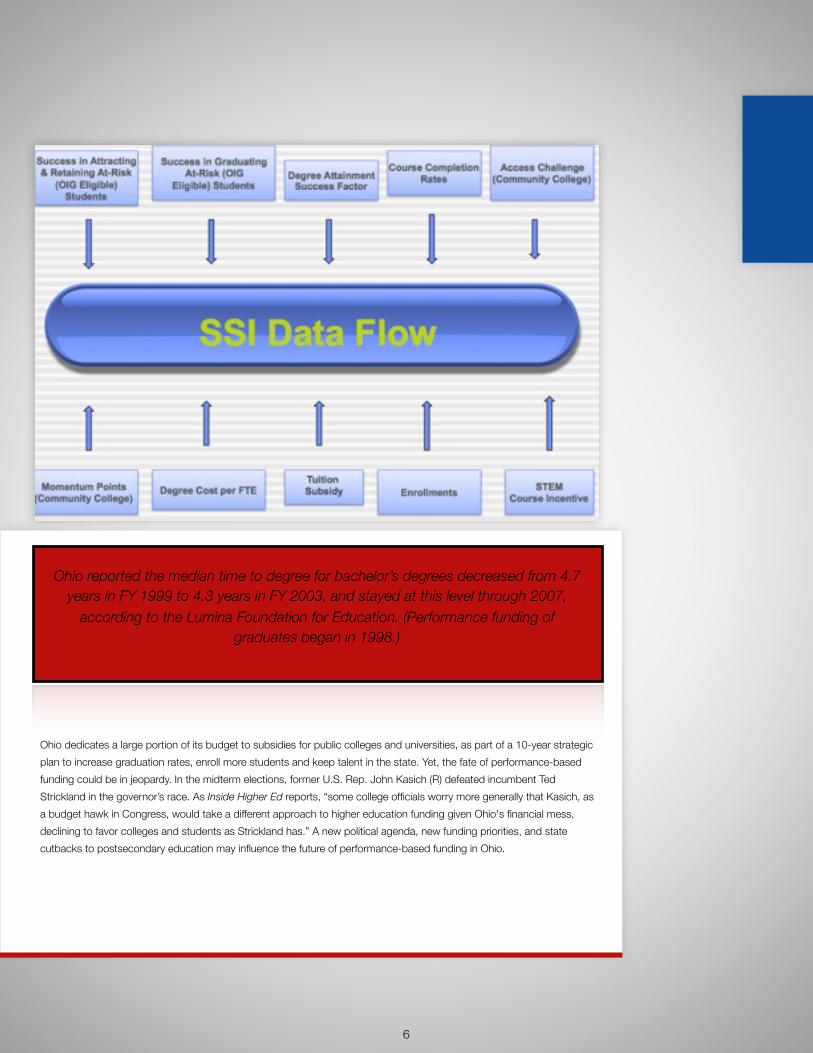
Currently, Ohio determines state appropriations to public
colleges and universities through its State Share of Instruction
(SSI) formula. SSI seeks to reward efficiency, granting more
money to campuses that keep costs below the national average.
Included in the SSI formula are measures of course completion,
success in attracting and graduating at-risk students, degree
attainment, and a Science, Technology, Engineering and Math
(STEM) course incentive.
For four-year institutions, the SSI calculation, Success Challenge
and Access Challenge appropriations, along with tuition
subsidies from the state comprise the total amount of state
funding. Two-year institutions also receive SSI and tuition
subsidy funds, but are granted the lion’s share of Access
Challenge support.
Last year, four-year universities received $1,394,359,127 in state
appropriations, and community colleges received $426,343,526.
While state funding supports various campus programs as well
as the instructional side of the university, funds are unrestricted,
providing institutions with the flexibility to put monies toward
improvements or initiatives deemed most appropriate for their
respective campuses.
Additionally, at the community college level, the SSI calculation
makes use of “momentum points,” a model first adopted in the
state of Washington. In Ohio, 10% of instructional funding is
attached to meeting certain student goals, including the
successful completion of developmental education, progress
from remedial to college-level courses, and transfer to four-year
institutions. The number of full-time equivalent (FTE) enrollees is
also taken into account when determining total community
college SSI allocations.
The switch from an enrollment-driven to a performance-based
funding formula suggests a positive transformation for
postsecondary education in Ohio. The at-risk component
described above not only addresses issues of access for low-
income students, but also supports the retention and
persistence of such students. Institutions with high at-risk
populations are also granted more latitude with completion rates,
allowing for non-selective institutions to continue providing for
student access without the danger of losing state
appropriations. Ohio‘s performance-based funding model
recognizes both the importance of access and persistence—few
states have so ably adopted and executed this type of
framework.
1. Access Challenge directed funds primarily to two-year institutions
2. Research Challenge gave state money in proportion to research dollars received
3. Jobs Challenge sought to improve business competitiveness among Ohio postsecondary
institutions
4. Success Challenge apportioned funding according to institutional success in the four-year
graduation of both “at risk” and overall student populations
Currently, Ohio
determines state
appropriations to
public colleges and
universities through its
State Share of
Instruction (SSI)
formula. SSI seeks to
reward efficiency,
granting more money
to campuses that keep
costs below the
national average.
5
Ohio dedicates a large portion of its budget to subsidies for public colleges and universities, as part of a 10-year strategic
plan to increase graduation rates, enroll more students and keep talent in the state. Yet, the fate of performance-based
funding could be in jeopardy. In the midterm elections, former U.S. Rep. John Kasich (R) defeated incumbent Ted
Strickland in the governor’s race. As Inside Higher Ed reports, “some college officials worry more generally that Kasich, as
a budget hawk in Congress, would take a different approach to higher education funding given Ohio's financial mess,
declining to favor colleges and students as Strickland has.” A new political agenda, new funding priorities, and state
cutbacks to postsecondary education may influence the future of performance-based funding in Ohio.
Ohio reported the median time to degree for bachelor’s degrees decreased from 4.7 years in FY 1999 to 4.3 years in FY 2003, and stayed at this level through 2007,
according to the Lumina Foundation for Education. (Performance funding of graduates began in 1998.)
6
INDIANAFunding for course and degree completion with an emphasis on successful transfer rates and graduating low-income students.
Indiana’s funding matrix moves 5% of the total state budget for higher education toward an incentivized structure,
somewhat akin to the performance-funding model adopted in Ohio. Begun in 2007, Indiana’s program – grouped
with other initiatives commonly called “Reaching Higher” – is intended to establish the funding level that schools
receive now and adjust their future funding depending on their ability to meet or exceed certain benchmarks.
When appropriating state money, schools are evaluated using the same benchmarks, regardless of institutional
differences in mission or size. College completion and transfer student data figure prominently in the funding
formula, and Indiana has elected to calculate enrollment levels at the end of the semester rather than at the
beginning, in order to account for attrition.
College completion data rely on the number of degrees an institution awards, the number of “on-time” degrees
conferred, and degrees for students from a low socioeconomic status (SES). These initiatives base different
funding levels on year-to-year changes in the raw number of degrees awarded. For example, one additional
degree awarded in each area would translate to a funding increase of $5,000 per bachelor degree and $3,500
per associate degree. If Indiana University-Bloomington were to graduate an additional student on time who also
happened to be Pell-eligible, the university would realize $15,000 in additional funding the following year.
It is worth noting that Indiana awards surplus funding regardless of how long students take to complete their
degrees, whether or not they are classified as full-time or part-time, or if they transferred in. In order to be
considered an “on-time graduate” a student must complete a bachelor’s degree in four years and an associate
degree in two years - a tight time-frame by traditional measurements in higher education.
Indiana already offers a financial incentive for community colleges to graduate their students and prepare them for
transfer to a four-year university in the state funding model’s financial incentive to graduate more students.
Indiana, under the current paradigm, has similarly incentivized the acceptance of community college transfers on
the university end by mandating that each matriculating transfer student nets the four-year college or university an
additional $1,500 in incentive funding.
7

Indiana’s model shifts state funding from levels based on student
population FTE at the beginning of the semester and moves it to the end
of the semester. This places the focus of funding on course and credit
completion as opposed to enrollment growth. Using a rolling average, the
formula works by calculating the average credits completed over the
previous four years (for example FY07, FY08, FY09, FY10) subtracted by
the year prior to the first of the four years (in the example this would be
FY06), then it is multiplied by $3,500. Mathematically, the formula is as
follows:
((FY07 + FY08 + FY09 + FY10)/4 – FY06) x $3,500
This approach seeks to place emphasis not only on steady
enrollment growth, but also on the university’s continued support for
students as they work towards course and degree completion.
Because students nationwide have a very low rate of
completing college-level math or English coursework after remediation,
Indiana has recommended the elimination of remedial offerings at its
public colleges and universities. A research study of California community
colleges suggested that just 10% of students in math and 25% in English
attempt a college-level course after taking a remedial one. However, the
study also demonstrated that students who were identified as needing
remedial coursework were also 70% to 80% as likely to complete college-
level coursework as students who were not identified as needing
remediation. Students needing remedial instruction will receive it as
enrolled students at the state’s community colleges.
8
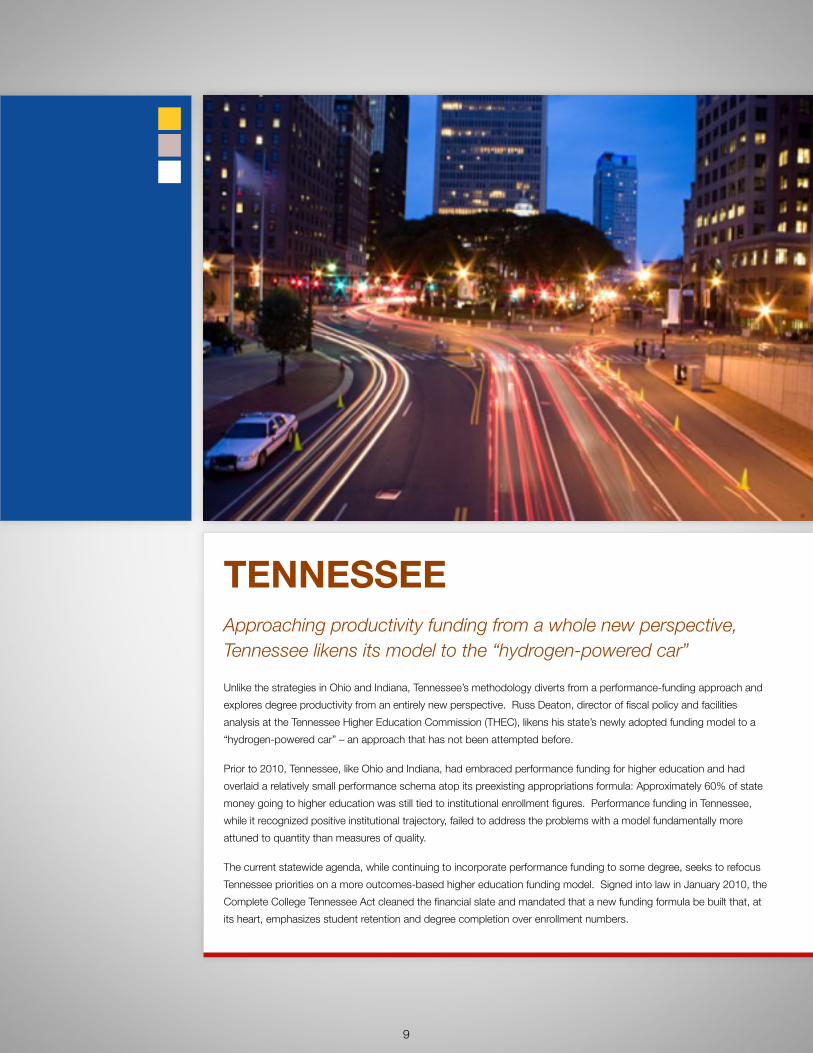
TENNESSEEApproaching productivity funding from a whole new perspective, Tennessee likens its model to the “hydrogen-powered car”
Unlike the strategies in Ohio and Indiana, Tennessee’s methodology diverts from a performance-funding approach and
explores degree productivity from an entirely new perspective. Russ Deaton, director of fiscal policy and facilities
analysis at the Tennessee Higher Education Commission (THEC), likens his state’s newly adopted funding model to a
“hydrogen-powered car” – an approach that has not been attempted before.
Prior to 2010, Tennessee, like Ohio and Indiana, had embraced performance funding for higher education and had
overlaid a relatively small performance schema atop its preexisting appropriations formula: Approximately 60% of state
money going to higher education was still tied to institutional enrollment figures. Performance funding in Tennessee,
while it recognized positive institutional trajectory, failed to address the problems with a model fundamentally more
attuned to quantity than measures of quality.
The current statewide agenda, while continuing to incorporate performance funding to some degree, seeks to refocus
Tennessee priorities on a more outcomes-based higher education funding model. Signed into law in January 2010, the
Complete College Tennessee Act cleaned the financial slate and mandated that a new funding formula be built that, at
its heart, emphasizes student retention and degree completion over enrollment numbers.
9
Deaton and others at THEC hammered out such a model and began
its phased introduction in fall 2010.
The new Tennessee model employs two similar but distinct funding
formulae, one for universities and one for community colleges. Each
formula assigns weights to separate scaled data points (10 data points
for universities, 11 for community colleges) that tie outcome indicators
like student retention, graduation rate and remedial success to
institutional appropriations. Each institution still derives a certain
percentage of its state funding from fixed-cost budget lines (on
average, 15% for community colleges, 18% for universities). Under the
new model, the lion’s share of allocated money is based on institutional
performance in identified outcome areas.
Campuses report raw data that are then scaled to render a translatable
point value for each specified outcome. While this scaling, depending
on the variable, can seem arbitrary, the underlying idea is clear: Data
that are reported using different kinds of metrics (e.g. graduation rates,
inbound research dollars, student progress) need to be converted to a
single framework before outcomes can be evaluated collectively. The
point values for each outcome area are summed and multiplied by the
average faculty salary at Southern institutions with similar Carnegie
classifications. The final step in the formula is to add in fixed-cost
allocations (see Figure 1).
The scaling process has another distinctive feature: It grants a 40%
premium on Pell-eligible students (i.e. a low-income student counts as
1.4 students in the formula). This emphasis could prove significant.
For example, if UT-Knoxville were to grant 100 more bachelor’s
degrees to Pell-eligible students this year than it did last year, excluding
the bump received due to an increased graduation rate, it would garner
nearly $1.4 million in extra funding. If each of those hypothetical
students were Pell-eligible, on the other hand, the funding increase
would total nearly $1.9 million.
For the college completion agenda nationwide, the premium on low-
income student success in this model has the potential to encourage
robust institutional support of such students. Tennessee has
recognized that narrowing the achievement gap is central to the
realization of its productivity goals and, as a result, has provided a
monetary incentive to schools that succeed at caring for at-risk
populations.
While the two basic formulae – one for universities and one for
community colleges – are consistent across campuses, the weights
attached to each data point differ from institution to institution. At a
fundamental level, UT-Knoxville and East Tennessee State, for example,
value research and retention very differently; Southwest Tennessee
Community College does not place the same amount of importance on
job placement as does Chattanooga State. The Tennessee model,
while generally focused on similar outcomes, also allows for significant
inter-institutional difference (see Figures 2 & 3).
The Tennessee model is as simple a structural framework as one could
expect given disparate goals and general political inertia. It
fundamentally changes the state funding paradigm from an input to an
output basis. And while THEC and other state leaders have not
elected to remove other sources of state money (e.g. performance
funding or significant fixed facilities costs) wholesale from the
framework, they have, to their great credit, involved institutional leaders
in determining which outcomes will drive the vast majority of institution-
specific state appropriations. For example, more than three-quarters of
state money allocated to UT-Knoxville this year will be tied to focus
outcomes that will, after the weighting process, reflect its distinct
institutional mission.
For political purposes and for want of a starting position, Tennessee
has anchored the outputs of its formulae to previous appropriation
levels for the time being; institutions will receive more-or-less the same
amount of funding in 2011 as in 2010, despite the new underlying
schema. The full force of the new model will be phased in over the next
four years. The Tennessee approach is a game-changer, and its
success or failure should be evident in short order.
10

Formulae used in the Tennessee Funding Model
Outcomes
(2006-2007 to 2008-2009 Data)Raw Data
Scaled Point
ValuesWeights
Weighted Point
Values 2
Students Accumulating 24 hrs (Scale=1)
Students Accumulating 48 hrs (Scale=1)
Students Accumulating 72 hrs (Scale=1)
Bachelors and Associates (Scale=1)
Master’s/Ed Specialist Degrees (Scale=0.3)
Doctoral / Law Degrees (Scale=.05)
Research and Service (Scale=20,000)
Transfers Out with 12 hrs (Scale=1)
Degrees per 100 FTE (Scale=.02)
Six-Year Graduation Rate (Scale=.04)
Total Points
4,477 4477 2.0% 98.9
4,671 4671 3.0% 156.2
4,673 4673 5.0% 265.2
3,742 3742 15.0% 660.4
1,534 5112 15.0% 766.8
403 8053 10.0% 805.3
118,768,446 5938 15.0% 890.8
794 794 5.0% 39.7
16.6 831 10.0% 83.1
64.5 1612 20.0% 322.4
4,089
Average faculty salary for similar ins3tu3ons 3 $89,643
Total Points x 4,089
Outcomes-‐based alloca3on 366,545,077
Other appropria3ons 4 114,004,761
Total state appropria3on $480,549,800
Figure 1: University of Tennessee-Knoxville Example Funding Formula1
1. While the focus outcomes and the structure of the formula are correct – and while the numbers here were provided by the THEC – the specific figures used by the state may differ slightly.
2. Including the 40% Pell Grant-eligible subpopulation premium
3. Based on Carnegie classifications and salary data compiled by the Southern Regional Education Board
4. Includes nearly $23 million in continued performance funding and about $92 million in fixed facilities and equipment replacement costs
11

Outcomes UT - Knoxville East Tennessee State
Students Accumulating 24 hrs
Students Accumulating 48 hrs
Students Accumulating 72 hrs
Bachelor’s and Associate
Master’s/Ed Specialist Degrees
Doctoral / Law Degrees
Research and Service
Transfers Out with 12 hrs
Degrees per 100 FTE
Six-Year Graduation Rate
Totals
2.0% 3.0%
3.0% 5.0%
5.0% 7.0%
15.0% 25.0%
15.0% 15.0%
10.0% 7.5%
15.0% 12.5%
5.0% 5.0%
10.0% 10.0%
20.0% 10.0%
100.0% 100.0%
Figure 2: University Outcomes and Example Weights
Figure 3: Community College Outcomes and Example Weights
OutcomesSouthwest
Tennessee CC
Chattanooga State
CC
Students Accumulating 12 hrs
Students Accumulating 24 hrs
Students Accumulating 36 hrs
Dual Enrollment
Associates
Certificates
Job Placements
Remedial & Developmental Success
Transfers Out with 12 hrs
Workforce Training (Contact Hours)
Awards per 100 FTE
Total
4.0% 6.0%
5.0% 7.0%
6.0% 7.0%
5.0% 5.0%
10.0% 5.0%
20.0% 10.0%
10.0% 20.0%
20.0% 10.0%
5.0% 15.0%
5.0% 10.0%
10.0% 5.0%
100.0% 100.0%
12
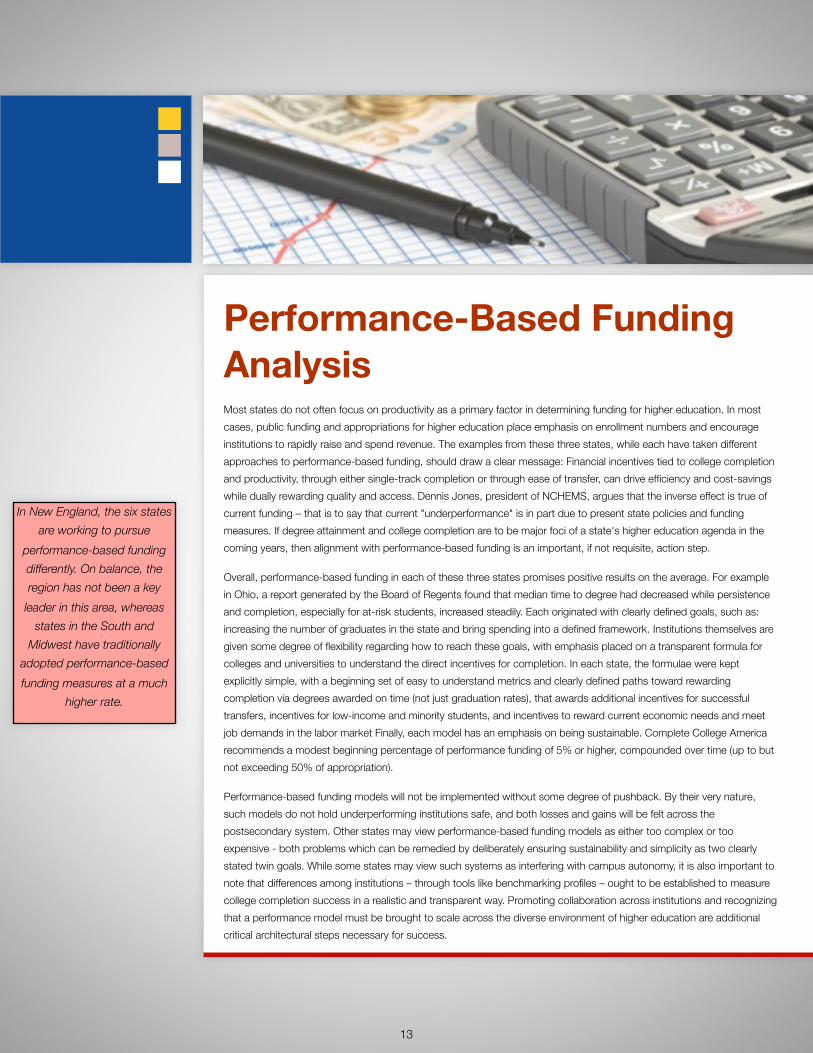
Performance-Based Funding AnalysisMost states do not often focus on productivity as a primary factor in determining funding for higher education. In most
cases, public funding and appropriations for higher education place emphasis on enrollment numbers and encourage
institutions to rapidly raise and spend revenue. The examples from these three states, while each have taken different
approaches to performance-based funding, should draw a clear message: Financial incentives tied to college completion
and productivity, through either single-track completion or through ease of transfer, can drive efficiency and cost-savings
while dually rewarding quality and access. Dennis Jones, president of NCHEMS, argues that the inverse effect is true of
current funding – that is to say that current "underperformance" is in part due to present state policies and funding
measures. If degree attainment and college completion are to be major foci of a state's higher education agenda in the
coming years, then alignment with performance-based funding is an important, if not requisite, action step.
Overall, performance-based funding in each of these three states promises positive results on the average. For example
in Ohio, a report generated by the Board of Regents found that median time to degree had decreased while persistence
and completion, especially for at-risk students, increased steadily. Each originated with clearly defined goals, such as:
increasing the number of graduates in the state and bring spending into a defined framework. Institutions themselves are
given some degree of flexibility regarding how to reach these goals, with emphasis placed on a transparent formula for
colleges and universities to understand the direct incentives for completion. In each state, the formulae were kept
explicitly simple, with a beginning set of easy to understand metrics and clearly defined paths toward rewarding
completion via degrees awarded on time (not just graduation rates), that awards additional incentives for successful
transfers, incentives for low-income and minority students, and incentives to reward current economic needs and meet
job demands in the labor market Finally, each model has an emphasis on being sustainable. Complete College America
recommends a modest beginning percentage of performance funding of 5% or higher, compounded over time (up to but
not exceeding 50% of appropriation).
Performance-based funding models will not be implemented without some degree of pushback. By their very nature,
such models do not hold underperforming institutions safe, and both losses and gains will be felt across the
postsecondary system. Other states may view performance-based funding models as either too complex or too
expensive - both problems which can be remedied by deliberately ensuring sustainability and simplicity as two clearly
stated twin goals. While some states may view such systems as interfering with campus autonomy, it is also important to
note that differences among institutions – through tools like benchmarking profiles – ought to be established to measure
college completion success in a realistic and transparent way. Promoting collaboration across institutions and recognizing
that a performance model must be brought to scale across the diverse environment of higher education are additional
critical architectural steps necessary for success.
In New England, the six states
are working to pursue
performance-based funding
differently. On balance, the
region has not been a key
leader in this area, whereas
states in the South and
Midwest have traditionally
adopted performance-based
funding measures at a much
higher rate.
13

MaineThe University of Maine system and its “nine strategic directions” plan
contains a goal to enact performance-based funding, but does not provide
any specific data, formulae, or other benchmarks regarding this goal. At
present, the UMaine system does not have a template for performance-
based funding. Its strategic plan does list performance-based funding as a
direct priority, however, in its strategic vision for the system. Gov. Paul LePage
pledged that he would make no cuts to higher education and aims to provide
strong support for scholarship programs, proclaiming that higher education in
the state must remain affordable and accessible.
Current Performance-Based Funding Initiatives Across New England
New HampshireThe University System of New Hampshire excels at measurement and public
reporting of its efficiency and financial stewardship, but does not explicitly
outline frameworks for accountability or performance-based funding
measures. The multisystem governance structure in the state allows for
enhanced autonomy but lacks a statewide funding mechanism to
incorporate accountability into the budgeting process. The New Hampshire
Postsecondary Education Commission reports degree production numbers
across the state, but that information is not expressly tied into performance-
based funding at the legislative level. Gov. John Lynch has cited the efforts
made between higher education and business around areas of innovation
and economic development.
VermontWhile Vermont's higher education accountability information is focused
primarily on institution-level results, the state does not explicitly tie
performance to funding. The state system does well at publicly releasing
timely and useful information about each institution across multiple years and
comparisons to peer averages but none of Vermont's accountability
information provides explicitly stated goals for performance, targets, or
funding mechanisms for college completion. Gov. Peter Shumlin, in his state
of the state address, noted his concerns over mounting student debt in the
state and called for a higher education income tax credit that would help
Vermont residents reduce their student loan debts.
14
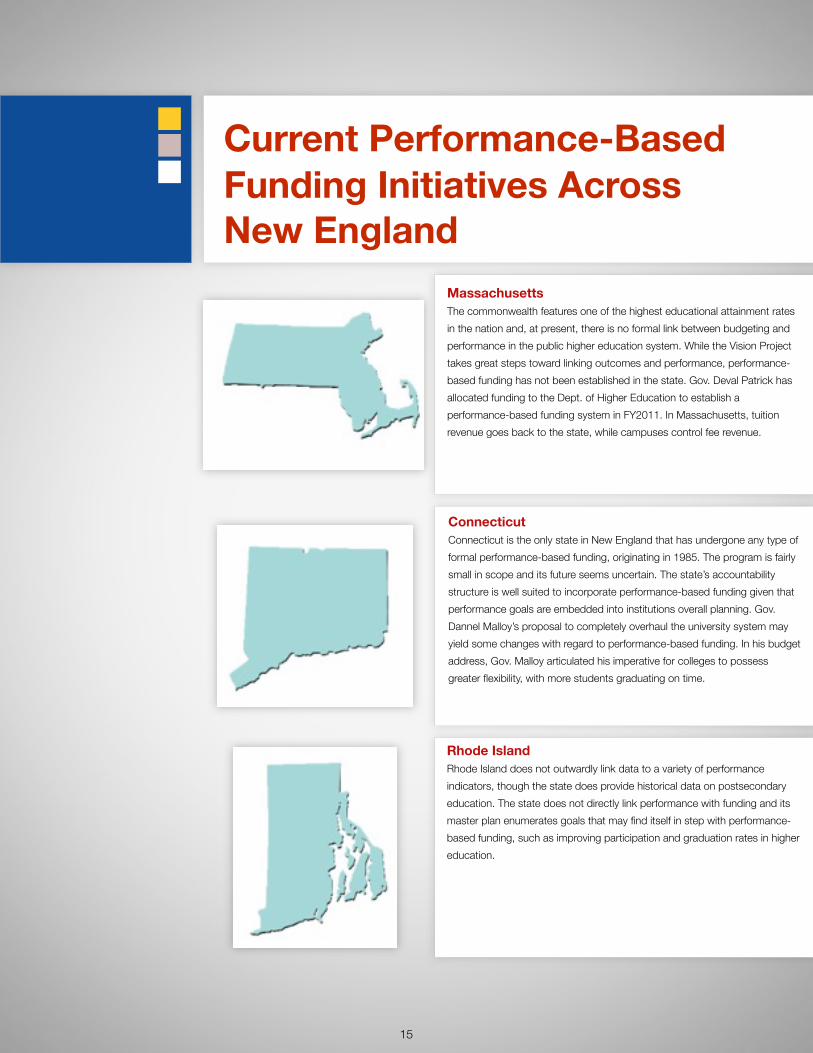
MassachusettsThe commonwealth features one of the highest educational attainment rates
in the nation and, at present, there is no formal link between budgeting and
performance in the public higher education system. While the Vision Project
takes great steps toward linking outcomes and performance, performance-
based funding has not been established in the state. Gov. Deval Patrick has
allocated funding to the Dept. of Higher Education to establish a
performance-based funding system in FY2011. In Massachusetts, tuition
revenue goes back to the state, while campuses control fee revenue.
Current Performance-Based Funding Initiatives Across New England
ConnecticutConnecticut is the only state in New England that has undergone any type of
formal performance-based funding, originating in 1985. The program is fairly
small in scope and its future seems uncertain. The state’s accountability
structure is well suited to incorporate performance-based funding given that
performance goals are embedded into institutions overall planning. Gov.
Dannel Malloy’s proposal to completely overhaul the university system may
yield some changes with regard to performance-based funding. In his budget
address, Gov. Malloy articulated his imperative for colleges to possess
greater flexibility, with more students graduating on time.
Rhode IslandRhode Island does not outwardly link data to a variety of performance
indicators, though the state does provide historical data on postsecondary
education. The state does not directly link performance with funding and its
master plan enumerates goals that may find itself in step with performance-
based funding, such as improving participation and graduation rates in higher
education.
15

RecommendationsThis policy brief aims to make three points about performance funding:
1. Performance-based funding is a necessary component of the college
completion agenda. Although there are multiple ways at arriving to a formula that
works with the mix of state institutions, political realities, available funding and
sector, the current “business-as-usual” formulae focus too heavily on enrollment
only. Switching to a model that ties funding to performance must be given heavy
consideration.
2. Good performance-funding measures share common elements: the inclusion
of a clearly-defined goal; institutional flexibility; sustainability; a modest percentage
of the budget dedicated to performance; and features that allowed for greater
incentives to align workforce demand and attract low-income, minority, and transfer
students.
3. No New England state has yet to completely link performance with funding.
But many elements necessary for a performance-based system seem present, with
nearly all of the states looking toward cost-savings and college completion as two
important features in their FY2011 plan for higher education
For policymakers:
• Dedicate 5% of funding that compounds annually to go toward a performance-based
system. A modest percentage is critical to sustainability and a cumulative effect will
prove to act as a large enough incentive for most colleges and universities.
• Align a system that emphasizes completion and degree production in key areas for
economic growth in the state. Providing measures to develop human capital in
targeted industries using a performance-based system is likely to attract the attention
of businesses, labor, and new employers to the state.
• Keep any new system simple - less is more. Beginning with focused, readily
understood goals targeted on college completion will yield the most change with
minimal effort. Thinking of performance-based systems here as a type of “minimum
effective dose” ought to be the way to proceed.
For Institution leaders / boards / college presidents:
• Help states develop quality indicators of performance anchored at degree completion,
including a system that rewards progress moving from year-to-year, counting
enrollment on the last day of class, and ensure that systems give institutions and
boards the flexibility to distribute this performance funding after legislatures
appropriate the funds.
• Use the opportunities presented in performance-based systems to help close the
attainment gap by including incentives for populations in the state that could benefit
from both equity and economic advantages.
16