Embed Size (px)
Citation preview
TAC Notice Whats Changing on TAC Web
Help us help you
Please rate this document
Excellent
Good
Average
Fair
Poor
This document solved my problem
Yes
No
Just browsing
Suggestions for improvement
(256 character limit)
High CPU Utilization on Cisco IOS Software-Based Catalyst 4500 Switches
Contents
Introduction Prerequisites Requirements Components Used Conventions Background Information Understand the Catalyst 4500 CPU Packet-Handling Architecture Identify the Reason for High CPU Utilization on Catalyst 4500 Baseline the CPU Usage Understand the show processes cpu Command on the Catalyst 4500 Switches Understand the show platform health Command on the Catalyst 4500 Switches Troubleshoot Common High CPU Utilization Problems High CPU Utilization Due to Process-Switched Packets Other Causes of High CPU Utilization Troubleshooting Tools to Analyze the Traffic Destined to the CPU Tool 1 Monitor the CPU Traffic with SPANmdashCisco IOS Software Release 121(19)EW and Later Tool 2 In-Built CPU SniffermdashCisco IOS Software Release 122(20)EW and Later Tool 3 Identify the Interface That Sends Traffic to the CPUmdashCisco IOS Software Release 122(20)EW and Later Summary Cisco Support Community - Featured Conversations Related Information
Introduction
The Catalyst 4500 series switches which includes the Catalyst 4948 switches has a sophisticated packet-handling methodology for CPU-bound traffic A commonly perceived problem is high CPU utilization on these switches This document provides details about the CPU packet-handling architecture and shows you how to identify the causes of high CPU utilization on these switches The document also lists some common network or configuration scenarios that cause high CPU utilization on the Catalyst 4500 series
Note If you run Catalyst OS (CatOS)-based Catalyst 45004000 series switches refer to the document CPU Utilization on Catalyst 45004000 2948G 2980G and 4912G Switches That Run CatOS Software
Prerequisites
Requirements
There are no specific requirements for this document
Components Used
The information in this document is based on these software and hardware versions
Catalyst 4500 series switches
Catalyst 4948 series switches
Note This document applies only to Cisco IOSreg Software-based switches and not CatOS-based switches
The information in this document was created from the devices in a specific lab environment All of the devices used in this document started with a cleared (default) configuration If your network is live make sure that you understand the potential impact of any command
Conventions
Refer to Cisco Technical Tips Conventions for more information on document conventions
Background Information
Before you look at the CPU packet-handling architecture and troubleshoot high CPU utilization you must understand the different ways in which hardware-based forwarding switches and Cisco IOSreg Software-based routers use the CPU The common misconception is that high CPU utilization indicates the depletion of resources on a device and the threat of a crash A capacity issue is one of the symptoms of high CPU utilization on Cisco IOS routers However a capacity issue is almost never a symptom of high CPU utilization with hardware-based forwarding switches like the Catalyst 4500 The Catalyst 4500 is designed to forward packets in the hardware application-specific integrated circuit (ASIC) and reach traffic-forwarding speeds of up to 102 million packets per second (Mpps)
The Catalyst 4500 CPU performs these functions
Manages configured software protocols for example
Spanning Tree Protocol (STP)
Routing protocol
Cisco Discovery Protocol (CDP)
Port Aggregation Protocol (PAgP)
VLAN Trunk Protocol (VTP)
Dynamic Trunking Protocol (DTP) Programs configurationdynamic entries to the hardware ASICs for example
Access control lists (ACLs)
CEF entries Internally manages various components for example
Power over Ethernet (PoE) line cards
Power supplies
Fan tray Manages access to the switch for example
Telnet
Console
Simple Network Management Protocol (SNMP) Forwards packets via the software path for example
Internetwork Packet Exchange (IPX)-routed packets which are only supported in the software path
Maximum transmission unit (MTU) fragmentation
According to this list high CPU utilization can result from the receipt or process of packets by the CPU Some of the packets that are sent for process can be essential for the network operation An example of these essential packets are bridge protocol data unit (BPDUs) for spanning-tree topology configurations However other packets can be software-forwarded data traffic These scenarios require the switching ASICs to send packets to the CPU for processing
Packets that are copied to the CPU but the original packets are switched in hardware
An example is host MAC address learning
Packets that are sent to the CPU for processing
Examples include
Routing protocol updates
BPDUs
An intentional or unintentional flood of traffic Packets that are sent to the CPU for forwarding
An example is packets that need IPX or AppleTalk routing
Understand the Catalyst 4500 CPU Packet-Handling Architecture
The Catalyst 4500 has an in-built quality of service (QoS) mechanism in order to differentiate between types of traffic that are destined to the CPU The mechanism makes the differentiation on the basis of the Layer 2 (L2)Layer 3 (L3) Layer 4 (L4) packet information The Supervisor packet Engine has 16 queues in order to handle various types of packets or events Figure 1 shows these queues Table 1 lists the queues and the packet types that queue in each The 16 queues allow the Catalyst 4500 to queue the
packets on the basis of the packet type or priority
Figure 1 ndash Catalyst 4500 Uses Multiple CPU Queues
Table 1 ndash Catalyst 4500 Queue Description
Queue Number
Queue Name Packets Queued
0 Esmp
ESMP1 packets (internal management packets) for the line card ASICs or other component management
1 Control L2 control plane packets such as STP CDP PAgP LACP2 or UDLD3
2Host Learning
Frames with unknown source MAC addresses that are copied to the CPU in order to build the L2 forwarding table
3 4 5
L3 Fwd Highest L3 Fwd HighMedium L3 Fwd Low
Packets that must be forwarded in software such as GRE4 tunnels
If the ARP5 is unresolved for the destination IP address packets are sent to this queue
6 7 8
L2 Fwd Highest L2 Fwd HighMedium L2 Fwd Low
Packets that are forwarded as a result of bridging
Protocols that are not supported in hardware such as IPX and AppleTalk routed packets are bridged to the CPU
ARP request and response
Packets with a destination MAC address of the switch SVI6L3 interface are bridged if the packets cannot be routed in hardware because of
IP header options
Expired TTL7
Non-ARPA encapsulation
9 10L3 Rx High L3 Rx Low
L3 control plane traffic for example routing protocols that is destined for CPU IP addresses
Examples include Telnet SNMP and SSH8
11RPF Failure
Multicast packets that failed the RPF9 check
12ACL fwd(snooping)
Packets that are processed by the DHCP10 snooping dynamic ARP inspection or IGMP11 snooping features
13ACL log unreach
Packets that hit an ACE12 with the log keyword or packets that were dropped due to a deny in an output ACL or the lack of a route to the destination
These packets require the generation of ICMP unreachable messages
14ACL sw processing
Packets that are punted to the CPU due to a lack of additional ACL hardware resources such as TCAM13 for security ACL
15MTU FailInvalid
Packets that need to be fragmented because the output interface MTU size is smaller than the size of the packet
1 ESMP = Even Simple Management Protocol
2 LACP = Link Aggregation Control Protocol
3 UDLD = UniDirectional Link Detection
4 GRE = generic routing encapsulation
5 ARP = Address Resolution Protocol
6 SVI = switched virtual interface
7 TTL = Time to Live
8 SSH = Secure Shell Protocol
9 RPF = Reverse Path Forwarding
10 DHCP = Dynamic Host Configuration Protocol
11 IGMP = Internet Group Management Protocol
12 ACE = access control entry
13 TCAM = ternary content addressable memory
These queues are separate queues
L2 Fwd Highest or L3 Fwd Highest
L2 Fwd HighMedium or L3 Fwd HighMedium
L2 Fwd Low or L3 Fwd Low
L3 Rx High or L3 Rx Low
Packets are queued into these queues on the basis of the QoS label which is the differentiated services code point (DSCP) value from the IP type of service (ToS) For example packets with a DSCP of 63 are queued to the L3 Fwd Highest queue You can see the packets that are received and dropped for these 16 queues in the output of the show platform cpu packet statistics all command The output of this command is very long Issue the show platform cpu packet statistics command in order to show only the nonzero events An alternate command is the show platform cpuport command Only use the show platform cpuport command if you run Cisco IOS Software Release 121(11)EW or earlier This command has since been deprecated However this older command was a part of the show tech-support command in Cisco IOS Software releases earlier than Cisco IOS Software Release 122(20)EWA
Use the show platform cpu packet statistics command for all troubleshooting
Switchshow platform cpu packet statistics all
--- Output suppressed
Total packet queues 16
Packets Received by Packet Queue
Queue Total 5 sec avg 1 min avg 5 min avg 1 hour avg---------------------- --------------- --------- --------- --------- ----------Esmp 0 0 0 0 0Control 48 0 0 0 0Host Learning 0 0 0 0 0L3 Fwd High 0 0 0 0 0L3 Fwd Medium 0 0 0 0 0L3 Fwd Low 0 0 0 0 0L2 Fwd High 0 0 0 0 0L2 Fwd Medium 0 0 0 0 0L2 Fwd Low 0 0 0 0 0L3 Rx High 0 0 0 0 0L3 Rx Low 0 0 0 0 0RPF Failure 0 0 0 0 0ACL fwd(snooping) 0 0 0 0 0ACL log unreach 0 0 0 0 0ACL sw processing 0 0 0 0 0MTU FailInvalid 0 0 0 0 0
Packets Dropped by Packet Queue
Queue Total 5 sec avg 1 min avg 5 min avg 1 hour avg---------------------- --------------- --------- ---------
--------- ----------Esmp 0 0 0 0 0Control 0 0 0 0 0Host Learning 0 0 0 0 0L3 Fwd High 0 0 0 0 0L3 Fwd Medium 0 0 0 0 0L3 Fwd Low 0 0 0 0 0L2 Fwd High 0 0 0 0 0L2 Fwd Medium 0 0 0 0 0L2 Fwd Low 0 0 0 0 0L3 Rx High 0 0 0 0 0L3 Rx Low 0 0 0 0 0RPF Failure 0 0 0 0 0ACL fwd(snooping) 0 0 0 0 0ACL log unreach 0 0 0 0 0ACL sw processing 0 0 0 0 0MTU FailInvalid 0 0 0 0 0
The Catalyst 4500 CPU assigns weights to the various queues that Table 1 lists The CPU assigns the weights on the basis of importance or type and on the basis of traffic priority or DSCP The CPU services the queue on the basis of the relative weights of the queue For example if both a control packet such as a BPDU and an ICMP echo request are pending the CPU services the control packet first An excessive amount of low-priority or less-important traffic does not starve the CPU of the ability to process or manage the system This mechanism guarantees that the network is stable even under high utilization of the CPU This ability of the network to remain stable is critical information that you must understand
There is another very important implementation detail of Catalyst 4500 CPU packet handling If the CPU has already serviced high-priority packets or processes but has more spare CPU cycles for a particular time period the CPU services the low-priority queue packets or performs background processes of lower priority High CPU utilization as a result of low-priority packet processing or background processes is considered normal because the CPU constantly tries to use all the time available In this way the CPU strives for maximum performance of the switch and network without a compromise of the stability of the switch The Catalyst 4500 considers the CPU underutilized unless the CPU is used at 100 percent for a single time slot
Cisco IOS Software Release 122(25)EWA2 and later have enhanced the CPU packet- and process-handling mechanism and accounting Therefore use these releases on your Catalyst 4500 deployments
Identify the Reason for High CPU Utilization on Catalyst 4500
Now that you understand the Catalyst 4500 CPU packet-handling architecture and design you may still wish to identify why your Catalyst 4500 CPU utilization is high The Catalyst 4500 has the commands and tools that are necessary to identify the root cause of the high CPU utilization After you identify the reason the administrators can perform either of these actions
Corrective ActionmdashThis can include configuration or network changes or the creation of a Cisco Technical Support service request for further analysis
No actionmdashThe Catalyst 4500 performs according to the expectation The CPU exhibits high CPU utilization because the Supervisor Engine maximizes the CPU cycles in order to perform all the necessary software packet forwarding and background jobs
Be sure to identify the reason for high CPU utilization even though corrective action is not necessary in all cases High CPU utilization can be just a symptom of an issue in the network A resolution of the root cause of that problem can be necessary in order to lower the CPU utilization
Figure 2 shows the troubleshooting methodology to use in order to identify the root cause of the Catalyst 4500 high CPU utilization
Figure 2 ndash High CPU Utilization Troubleshooting Methodology on Catalyst 4500 Switches
The general troubleshooting steps are
1 Issue the show processes cpu command in order to identify the Cisco IOS processes that consume CPU cycles
2 Issue the show platform health command in order to further identify the platform-specific processes
3 If the highly active process is K2CpuMan Review issue the show platform cpu packet statistics command in order to identity the type of traffic that hits the CPU
If the activity is not due to the K2CpuMan Review process skip Step 4 and go on to Step 5
4 Identify the packets that hit the CPU with use of the Troubleshooting Tools to Analyze the Traffic Destined to the CPU if necessary
An example of the troubleshooting tools to use is the CPU Switched Port Analyzer (SPAN)
5 Review this document and the section Troubleshoot Common High CPU Utilization Problems for common causes
If you still cannot identify the root cause contact Cisco Technical Support
Baseline the CPU Usage
The important first step is to know the CPU utilization of your switch for your configuration and network setup Use the show processes cpu command in order to identify the CPU utilization on the Catalyst 4500 switch The continual update of baseline CPU utilization can be necessary as you add more configuration to the network setup or as your network traffic pattern changes Figure 2 indicates this requirement
This output is from a fully loaded Catalyst 4507R The steady-state CPU is about 32 to 38 percent which is necessary in order to perform the management functions for this switch
Switchshow processes cpu CPU utilization for five seconds 381 one minute 32 five minutes 32 PID Runtime(ms) Invoked uSecs 5Sec 1Min 5Min TTY Process 1 0 63 0 000 000 000 0 Chunk Manager 2 60 50074 1 000 000 000 0 Load Meter 3 0 1 0 000 000 000 0 Deferred Events
--- Output suppressed
27 524 250268 2 000 000 000 0 TTY Background 28 816 254843 3 000 000 000 0 Per-Second Jobs 29 101100 5053 20007 000 001 000 0 Per-minute Jobs 30 26057260 26720902 975 1207 1141 1136
0 Cat4k Mgmt HiPri 31 19482908 29413060 662 2407 1932 1920 0 Cat4k Mgmt LoPri 32 4468 162748 27 000 000 000 0 Galios Reschedul 33 0 1 0 000 000 000 0 IOS ACL Helper 34 0 2 0 000 000 000 0 NAM Manager
Five-second CPU utilization is expressed as
xy
The x represents total CPU utilization and y represents the CPU that is spent at the interrupt level When you troubleshoot Catalyst 4500 switches focus only on the total CPU utilization
Understand the show processes cpu Command on the Catalyst 4500 Switches
This show processes cpu output shows that there are two processes that use the CPUmdash Cat4k Mgmt HiPri and Cat4k Mgmt LoPri These two processes aggregate multiple platform-specific processes which perform the essential management functions on the Catalyst 4500 These processes process control plane as well as data packets that need to be software-switched or processed
In order to see which of the platform-specific processes use the CPU under the context of Cat4k Mgmt HiPri and Cat4k Mgmt LoPri issue the show platform health command
Each of the platform-specific processes has a targetexpected utilization of the CPU When that process is within the target the CPU executes the process in the high-priority context The show processes cpu command output counts that utilization under Cat4k Mgmt HiPri If a process exceeds the targetexpected utilization that process runs under the low-priority context The show processes cpu command output counts that additional utilization under Cat4k Mgmt LoPri This Cat4k Mgmt LoPri is also used to run background and other low-priority processes such as consistency check and reading interface counters This mechanism allows the CPU to run high-priority processes when necessary and the idle CPU cycles that remain are used for the low-priority processes To exceed the target CPU utilization by a small amount or a momentary spike in utilization is not an indication of a problem that needs investigation
Switchshow platform health CPU CPU RunTimeMax Priority Average CPU Total
Target Actual Target Actual Fg Bg 5Sec Min Hour CPULj-poll 100 002 2 1 100 500 0 0 0 109GalChassisVp-review 300 029 10 3 100 500 0 0 0 1115S2w-JobEventSchedule 1000 032 10 7 100 500 0 0 0 1014Stub-JobEventSchedul 1000 1209 10 6 100 500 14 13 9 39635StatValueMan Update 100 022 1 0 100 500 0 0 0 628Pim-review 010 000 1 0 100 500 0 0 0 022Ebm-host-review 100 000 8 0 100 500 0 0 0 005Ebm-port-review 010 000 1 0 100 500 0 0 0 001Protocol-aging-revie 020 000 2 0 100 500 0 0 0 000Acl-Flattener e 100 000 10 0 100 500 0 0 0 000KxAclPathMan create 100 000 10 5 100 500 0 0 0 039KxAclPathMan update 200 000 10 0 100 500 0 0 0 000KxAclPathMan reprogr 100 000 2 0 100 500 0 0 0 000TagMan-RecreateMtegR 100 000 10 0 100 500 0 0 0 000K2CpuMan Review 3000 1019 30 28 100 500 14 13 9 39711K2AccelPacketMan Tx 1000 220 20 0 100 500 2 2 1 8206K2AccelPacketMan Au 010 000 0 0 100 500 0 0 0 000K2AclMan-taggedFlatA 100 000 10 0 100 500 0 0 0 000K2AclCamMan stale en 100 000 10 0 100 500 0 0 0 000K2AclCamMan hw stats 300 104 10 5 100 500 1 1 0 3936K2AclCamMan kx stats 100 000 10 5 100
500 0 0 0 1340K2AclCamMan Audit re 100 000 10 5 100 500 0 0 0 1310K2AclPolicerTableMan 100 000 10 1 100 500 0 0 0 038K2L2 Address Table R 200 000 12 5 100 500 0 0 0 000K2L2 New Static Addr 200 000 10 1 100 500 0 0 0 000K2L2 New Multicast A 200 000 10 5 100 500 0 0 0 001K2L2 Dynamic Address 200 000 10 0 100 500 0 0 0 000K2L2 Vlan Table Revi 200 000 12 9 100 500 0 0 0 001K2 L2 Destination Ca 200 000 10 0 100 500 0 0 0 000K2PortMan Review 200 072 15 11 100 500 1 1 0 3722Gigaport65535 Review 040 007 4 2 100 500 0 0 0 338Gigaport65535 Review 040 008 4 2 100 500 0 0 0 339K2Fib cam usage revi 200 000 15 0 100 500 0 0 0 000K2Fib IrmFib Review 200 000 15 0 100 500 0 0 0 000K2Fib Vrf Default Ro 200 000 15 0 100 500 0 0 0 000K2Fib AdjRepop Revie 200 000 15 0 100 500 0 0 0 000K2Fib Vrf Unpunt Rev 200 001 15 0 100 500 0 0 0 023K2Fib Consistency Ch 100 000 5 2 100 500 0 0 0 2925K2FibAdjMan Stats Re 200 030 10 4 100 500 0 0 0 621K2FibAdjMan Host Mov 200 000 10 4 100 500 0 0 0 000K2FibAdjMan Adj Chan 200 000 10 0 100 500 0 0 0 000K2FibMulticast Signa 200 001 10 2 100 500 0 0 0 204
K2FibMulticast Entry 200 000 10 7 100 500 0 0 0 000K2FibMulticast Irm M 200 000 10 7 100 500 0 0 0 000K2FibFastDropMan Rev 200 000 7 0 100 500 0 0 0 000K2FibPbr route map r 200 006 20 5 100 500 0 0 0 1642K2FibPbr flat acl pr 200 007 20 2 100 500 0 0 0 324K2FibPbr consolidati 200 001 10 0 100 500 0 0 0 024K2FibPerVlanPuntMan 200 000 15 4 100 500 0 0 0 000K2FibFlowCache flow 200 001 10 0 100 500 0 0 0 023K2FibFlowCache flow 200 000 10 0 100 500 0 0 0 000K2FibFlowCache adj r 200 001 10 0 100 500 0 0 0 020K2FibFlowCache flow 200 000 10 0 100 500 0 0 0 006K2MetStatsMan Review 200 014 5 2 100 500 0 0 0 2340K2FibMulticast MET S 200 000 10 0 100 500 0 0 0 000K2QosDblMan Rate DBL 200 012 7 0 100 500 0 0 0 452IrmFibThrottler Thro 200 001 7 0 100 500 0 0 0 021K2 VlanStatsMan Revi 200 146 15 7 100 500 2 2 1 6444K2 Packet Memory Dia 200 000 15 8 100 500 0 1 1 4546K2 L2 Aging Table Re 200 012 20 3 100 500 0 0 0 722RkiosPortMan Port Re 200 073 12 7 100 500 1 1 1 5236Rkios Module State R 400 002 40 1 100 500 0 0 0 128Rkios Online Diag Re 400 002 40 0 100 500 0 0 0 115RkiosIpPbr IrmPort R 200 002 10 3 100
500 0 0 0 244RkiosAclMan Review 300 006 30 0 100 500 0 0 0 235MatMan Review 050 000 4 0 100 500 0 0 0 000Slot 3 ILC Manager R 300 000 10 0 100 500 0 0 0 000Slot 3 ILC S2wMan Re 300 000 10 0 100 500 0 0 0 000Slot 4 ILC Manager R 300 000 10 0 100 500 0 0 0 000Slot 4 ILC S2wMan Re 300 000 10 0 100 500 0 0 0 000Slot 5 ILC Manager R 300 000 10 0 100 500 0 0 0 000Slot 5 ILC S2wMan Re 300 000 10 0 100 500 0 0 0 000Slot 6 ILC Manager R 300 000 10 0 100 500 0 0 0 000Slot 6 ILC S2wMan Re 300 000 10 0 100 500 0 0 0 000Slot 7 ILC Manager R 300 000 10 0 100 500 0 0 0 000Slot 7 ILC S2wMan Re 300 000 10 0 100 500 0 0 0 000EthHoleLinecardMan(1 166 004 10 0 100 500 0 0 0 118EthHoleLinecardMan(2 166 002 10 0 100 500 0 0 0 118EthHoleLinecardMan(6 166 017 10 6 100 500 0 0 0 638 -------------CPU Totals 21280 3563
Understand the show platform health Command on the Catalyst 4500 Switches
The show platform health command provides a lot of information that is relevant only for a development engineer In order to troubleshoot high CPU utilization look for a higher number in the CPU actual column in the output Also be sure to glance at the right side of that row in order to verify the CPU usage of that process in the 1 minute and 1 hour average CPU columns Sometimes processes momentarily peak but do not hold the CPU for a long time Some of the momentarily high CPU utilization happens during hardware programming or optimization of the
programming For example a spike of CPU utilization is normal during the hardware programming of a large ACL in the TCAM
In the show platform health command output in the section Understand the show processes cpu Command on the Catalyst 4500 Switches the Stub-JobEventSchedul and the K2CpuMan Review processes use a higher number of CPU cycles Table 2 provides some basic information about the common platform-specific processes that appear in the output of the show platform health command
Table 2 ndash Description of the Platform-Specific Processes from the show platform health Command
Platform-Specific Process Name Description
Pim-review Chassisline card state management
Ebm Ethernet bridge module such as aging and monitoring
Acl-Flattener K2AclMan ACL merging process
KxAclPathMan - Path
TagMan-Review
ACL state management and maintenance
K2CpuMan Review
The process that performs software packet forwarding
If you see high CPU utilization due to this process investigate the packets that hit the CPU with use of the show platform cpu packet statistics command
K2AccelPacketMan
The driver that interacts with the packet engine in order to send packets that are destined from the CPU
K2AclCamMan
Manages the input and output TCAM hardware for QoS and security features
K2AclPolicerTableMan Manages the input and output policers
K2L2
Represents the L2 forwarding subsystem of the Catalyst 4500 Cisco IOS Software
These processes are responsible for maintenance of the various L2 tables
K2PortMan Review Manages the various port-related programming functions
K2Fib FIB1 management
K2FibFlowCache PBR2 cache management
K2FibAdjMan FIB adjacency table management
K2FibMulticast Manages multicast FIB entries
K2MetStatsMan Review Manages MET3 statistics
K2QosDblMan Review Manages QoS DBL4
IrmFibThrottler Thro IP routing module
K2 L2 Aging Table Re Manages the L2 aging function
GalChassisVp-review Chassis state monitoring
S2w-JobEventSchedule Manages the S2W5 protocols to monitor line cards state
Stub-JobEventSchedul Stub ASIC-based line card monitoring and maintenance
RkiosPortMan Port Re Port state monitoring and maintenance
Rkios Module State R Line card monitoring and maintenance
EthHoleLinecardMan Manages GBICs6 in each of the line cards
1 FIB = Forwarding Information Base
2 PBR = policy-based routing
3 MET = Multicast Expansion Table
4 DBL = Dynamic Buffer Limiting
5 S2W = serial-to-wire
6 GBIC = Gigabit Interface Converter
Troubleshoot Common High CPU Utilization Problems
This section covers some of the common high CPU utilization problems on the Catalyst 4500 switches
High CPU Utilization Due to Process-Switched Packets
One of the common reasons for high CPU utilization is that the Catalyst 4500 CPU is busy with the process of packets for software-forwarded packets or control packets Examples of software-forwarded packets are IPX or control packets such as BPDUs A small number of these packets is typically sent to the CPU However a consistently large number of packets can indicate a configuration error or a network event You must identify the cause of events that lead to the forward of packets to the CPU for processing This identification enables you to debug the high CPU utilization problems
Some of the common reasons for high CPU utilization due to process-switched packets are
A high number of spanning-tree port instances
ICMP redirects routing packets on the same interface
IPX or AppleTalk routing
Host learning
Out of hardware resources (TCAM) for security ACL
The log keyword in ACL
Layer 2 forwarding loops
Other reasons for the switch of packets to the CPU are
MTU fragmentationmdashBe sure that all interfaces along the path of the packet have the same MTU
ACL with TCP flags other than established
IP version 6 (IPv6) routingmdashThis is supported only via the software-switching path
GREmdashThis is supported only via the software-switching path
Denial of traffic in the input or output router ACL (RACL)
Note This is rate-limited in Cisco IOS Software Release 121(13)EW1 and later
Issue the no ip unreachables command under the interface of the ACL
Excessive ARP and DHCP traffic hits the CPU for processing due to a large number of directly connected hosts
If you suspect a DHCP attack use DCHP snooping to rate-limit DHCP traffic from any specific host port
Excessive SNMP polling by a legitimate or misbehaving end station
A High Number of Spanning-Tree Port Instances
The Catalyst 4500 supports 3000 spanning-tree port instances or active ports in the Per VLAN Spanning Tree+ (PVST+) mode The support is on all Supervisor Engines except the Supervisor Engine II+ and II
+TS and the Catalyst 4948 The Supervisor Engine II+ and II+TS and the Catalyst 4948 support up to 1500 port instances If you exceed these STP-instance recommendations the switch exhibits high CPU utilization
This diagram shows a Catalyst 4500 with three trunk ports that each carry VLANs 1 through 100 This equates to 300 spanning-tree port instances In general you can calculate spanning-tree port instances with this formula
Total number of STP instances = Number of access ports + Sum of all VLANs that are carried in each of the trunks
In the diagram there are no access ports but the three trunks carry VLANs 1 through 100
Total number of STP instances = 0 + 100 + 100 + 100 = 300
Step 1 Check for the Cisco IOS process with the show processes cpu command
This section reviews the commands that an administrator uses in order to narrow down the problem of high CPU utilization If you issue the show processes cpu command you can see that two main processes Cat4k Mgmt LoPri and Spanning Tree primarily use the CPU With only this
information you know that the spanning tree process consumes a sizable portion of the CPU cycles
Switchshow processes cpu CPU utilization for five seconds 741 one minute 73 five minutes 50 PID Runtime(ms) Invoked uSecs 5Sec 1Min 5Min TTY Process 1 4 198 20 000 000 000 0 Chunk Manager 2 4 290 13 000 000 000 0 Load Meter
--- Output suppressed
25 488 33 14787 000 002 000 0 Per-minute Jobs 26 90656 223674 405 679 690 722 0 Cat4k Mgmt HiPri 27 158796 59219 2681 3255 3380 2143 0 Cat4k Mgmt LoPri 28 20 1693 11 000 000 000 0 Galios Reschedul 29 0 1 0 000 000 000 0 IOS ACL Helper 30 0 2 0 000 000 000 0 NAM Manager
--- Output suppressed
41 0 1 0 000 000 000 0 SFF8472 42 0 2 0 000 000 000 0 AAA Dictionary R 43 78564 20723 3791 3263 3003 1735 0 Spanning Tree 44 112 999 112 000 000 000 0 DTP Protocol 45 0 147 0 000 000 000 0 Ethchnl
Step 2 Check for the Catalyst 4500-specific process with the show platform health command
In order to understand which platform-specific process consumes the CPU issue the show platform health command From this output you can see that the K2CpuMan Review process a job to handle CPU-bound packets uses up the CPU
Switchshow platform health CPU CPU RunTimeMax Priority Average CPU Total Target Actual Target Actual Fg Bg 5Sec Min Hour CPU
--- Output suppressed
TagMan-RecreateMtegR 100 000 10 0 100 500 0 0 0 000K2CpuMan Review 3000 3762 30 53 100 500 41 33 1 212K2AccelPacketMan Tx 1000 495 20 0 100 500 5 4 0 036K2AccelPacketMan Au 010 000 0 0 100 500 0 0 0 000K2AclMan-taggedFlatA 100 000 10 0 100 500 0 0 0 000
Step 3 Check the CPU queue that receives traffic in order to identify the type of CPU-bound traffic
Issue the show platform cpu packet statistics command in order to check which CPU queue receives the CPU-bound packet The output in this section shows that the control queue receives a lot of packets Use the information in Table 1 and the conclusion that you drew in Step 1 You can determine that the packets that the CPU processes and the reason for the high CPU utilization is BPDU processing
Switchshow platform cpu packet statistics
--- Output suppressed
Total packet queues 16Packets Received by Packet Queue
Queue Total 5 sec avg 1 min avg 5 min avg 1 hour avg---------------------- --------------- --------- --------- --------- ----------Esmp 202760 196 173 128 28
Control 388623 2121 1740 598 16
Packets Dropped by Packet Queue
Queue Total 5 sec avg 1 min avg 5 min avg 1 hour avg---------------------- --------------- --------- --------- --------- ----------Control 17918 0 19 24 3
Step 4 Identify the root cause
Issue the show spanning-tree summary command You can check if the receipt of BPDUs is because of a high number of spanning-tree port instances The output clearly identifies the root cause
Switchshow spanning-tree summarySwitch is in pvst modeRoot bridge for noneExtended system ID is enabledPortfast Default is disabledPortFast BPDU Guard Default is disabledPortfast BPDU Filter Default is disabledLoopguard Default is disabledEtherChannel misconfig guard is enabledUplinkFast is disabledBackboneFast is disabledConfigured Pathcost method used is short
--- Output suppressed
Name Blocking Listening Learning Forwarding STP Active---------------------- -------- --------- -------- ---------- ----------2994 vlans 0 0 0 5999 5999
There are a large number of VLANs with the PVST+ mode configuration In order to resolve the issue change the STP mode to Multiple Spanning Tree (MST) In some cases the number of STP instances is high because a high number of VLANs are forwarded on all trunk ports In this case manually prune the VLANs that are not necessary from the trunk in order to drop the number of STP active ports to well
below the recommended value
Tip Be sure that you do not configure IP phone ports as trunk ports This is a common misconfiguration Configure IP phone ports with a voice VLAN configuration This configuration creates a pseudo trunk but does not require you to manually prune the unnecessary VLANs For more information on how to configure voice ports refer to the Configuring Voice Interfaces software configuration guide Non-Cisco IP phones do not support this voice VLAN or auxiliary VLAN configuration You must manually prune the ports with non-Cisco IP phones
ICMP Redirects Routing Packets on the Same Interface
Routing packets on the same interface or traffic ingress and egress on the same L3 interface can result in an ICMP redirect by the switch If the switch knows that the next hop device to the ultimate destination is in the same subnet as the sending device the switch generates ICMP redirect to the source The redirect messages indicate to the source to send the packet directly to the next hop device The messages indicate that the next hop device has a better route to the destination a route of one less hop than this switch
In the diagram in this section PC A communicates with the web server The default gateway of PC A points to the VLAN 100 interface IP address However the next hop router that enables the Catalyst 4500 to reach the destination is in the same subnet as PC A The best path in this case is to send directly to Router Catalyst 4500 sends an ICMP redirect message to PC A The message instructs PC A to send the packets destined to the web server via Router instead of via Catalyst 4500 However in most cases the end devices do not respond to the ICMP redirect The lack of response causes the Catalyst 4500 to spend a lot of CPU cycles on the generation of these ICMP redirects for all the packets that the Catalyst forwards via the same interface as the ingress packets
By default ICMP redirect is enabled In order to disable it use the no ip icmp redirects command Issue the command under the relevant SVI or L3 interface
Note Since ip icmp redirects is a default command it is not visible in the show running-configuration command output
Step 1 Check for the Cisco IOS process with the show processes cpu command
Issue the show processes cpu command You can see that two main processes Cat4k Mgmt LoPri and IP Input primarily use the CPU With only this information you know that the process of IP packets expends a sizable portion of the CPU
Switchshow processes cpu CPU utilization for five seconds 381 one minute 32
five minutes 32 PID Runtime(ms) Invoked uSecs 5Sec 1Min 5Min TTY Process 1 0 63 0 000 000 000 0 Chunk Manager 2 60 50074 1 000 000 000 0 Load Meter 3 0 1 0 000 000 000 0 Deferred Events
--- Output suppressed
27 524 250268 2 000 000 000 0 TTY Background 28 816 254843 3 000 000 000 0 Per-Second Jobs 29 101100 5053 20007 000 001 000 0 Per-minute Jobs 30 26057260 26720902 975 581 678 576 0 Cat4k Mgmt HiPri 31 19482908 29413060 662 1964 1820 2048 0 Cat4k Mgmt LoPri
--- Output suppressed
35 60 902 0 000 000 000 0 DHCP Snooping 36 504625304 645491491 781 7240 7263 7382 0 IP Input
Step 2 Check for the Catalyst 4500-specific process with the show platform health command
The output of the show platform health command confirms the use of the CPU in order to process CPU-bound packets
Switchshow platform health CPU CPU RunTimeMax Priority Average CPU Total Target Actual Target Actual Fg Bg 5Sec Min Hour CPU
--- Output suppressed
TagMan-RecreateMtegR 100 000 10 0 100 500 0 0 0 000K2CpuMan Review 33000 1918 150 79 25 500 20 19 18 579408K2AccelPacketMan Tx 1000 495 20 0 100 500 5 4 0 036K2AccelPacketMan Au 010 000 0 0 100 500 0 0 0 000K2AclMan-taggedFlatA 100 000 10 0 100 500 0 0 0 000
Step 3 Check the CPU queue that receives traffic in order to identify the type of CPU-bound traffic
Issue the show platform cpu packet statistics command in order to check which CPU queue receives the CPU-bound packet You can see that the L3 Fwd Low queue receives quite a lot of traffic
Switchshow platform cpu packet statistics
--- Output suppressed
Packets Received by Packet Queue
Queue Total 5 sec avg 1 min avg 5 min avg 1 hour avg---------------------- --------------- --------- --------- --------- ----------Esmp 48613268 38 39 38 39Control 142166648 74 74 73 73Host Learning 1845568 2 2 2 2L3 Fwd High 17 0 0 0 0L3 Fwd Medium 2626 0 0 0 0L3 Fwd Low 4717094264 3841 3879 3873 3547L2 Fwd Medium 1 0 0 0 0L3 Rx High 257147 0 0 0 0
L3 Rx Low 5325772 10 19 13 7RPF Failure 155 0 0 0 0ACL fwd(snooping) 65604591 53 54 54 53ACL log unreach 11013420 9 8 8 8
Step 4 Identify the root cause
In this case use the CPU SPAN in order to determine the traffic that hits the CPU For information about the CPU SPAN see the Tool 1 Monitor the CPU Traffic with SPANmdashCisco IOS Software Release 121(19)EW and Later section of this document Complete an analysis of the traffic and a configuration with use of the show running-configuration command In this case a packet is routed through the same interface which leads to the issue of an ICMP redirect for each packet This root cause is one of the common reasons for high CPU utilization on the Catalyst 4500
You may expect the sourcing device to act on the ICMP redirect that the Catalyst 4500 sends and change the next hop for the destination However not all devices respond to an ICMP redirect If the device does not respond the Catalyst 4500 must send redirects for every packet that the switch receives from the sending device These redirects can consume a great deal of CPU resources The solution is to disable ICMP redirect Issue the no ip redirects command under the interfaces
This scenario can occur when you also have configured secondary IP addresses When you enable the secondary IP addresses IP redirect is automatically disabled Be sure you do not manually enable the IP redirects
As this ICMP Redirects Routing Packets on the Same Interface section has indicated most end devices do not respond to ICMP redirects Therefore as a general practice disable this feature
IPX or AppleTalk Routing
The Catalyst 4500 supports IPX and AppleTalk routing via software-forwarding path only With the configuration of such protocols a higher CPU utilization is normal
Note The switching of IPX and AppleTalk traffic in the same VLAN does not require process switching Only packets that need to be routed require software path forwarding
Step 1 Check for the Cisco IOS process with the show processes cpu command
Issue the show processes cpu command in order to check which Cisco IOS process consumes the
CPU In this command output notice that the top process is the Cat4k Mgmt LoPri
witchshow processes cpu CPU utilization for five seconds 8710 one minute 86 five minutes 87 PID Runtime(ms) Invoked uSecs 5Sec 1Min 5Min TTY Process 1 4 53 75 000 000 000 0 Chunk Manager
--- Output suppressed
25 8008 1329154 6 000 000 000 0 Per-Second Jobs 26 413128 38493 10732 000 002 000 0 Per-minute Jobs 27 148288424 354390017 418 260 242 277 0 Cat4k Mgmt HiPri 28 285796820 720618753 396 5015 5972 6131 0 Cat4k Mgmt LoPri
Step 2 Check for the Catalyst 4500-specific process with the show platform health command
The output of the show platform health command confirms the use of the CPU in order to process CPU-bound packets
Switchshow platform health CPU CPU RunTimeMax Priority Average CPU Total Target Actual Target Actual Fg Bg 5Sec Min Hour CPU
--- Output suppressed
TagMan-RecreateMtegR 100 000 10 4 100 500 0 0 0 000K2CpuMan Review 3000 2739 30 53 100 500 42 47 42 4841K2AccelPacketMan Tx 1000 803 20 0 100 500 21 29 26 2704
Step 3 Check the CPU queue that receives traffic in order to identify the type of CPU-
bound traffic
In order to determine the type of traffic that hits the CPU issue the show platform cpu packet statistics command
Switchshow platform cpu packet statistics
--- Output suppressed
Packets Received by Packet Queue
Queue Total 5 sec avg 1 min avg 5 min avg 1 hour avg---------------------- --------------- --------- --------- --------- ----------Esmp 48613268 38 39 38 39Control 142166648 74 74 73 73Host Learning 1845568 2 2 2 2L3 Fwd High 17 0 0 0 0L3 Fwd Medium 2626 0 0 0 0L3 Fwd Low 1582414 1 1 1 1L2 Fwd Medium 1 0 0 0 0L2 Fwd Low 576905398 1837 1697 1938 1515L3 Rx High 257147 0 0 0 0L3 Rx Low 5325772 10 19 13 7RPF Failure 155 0 0 0 0ACL fwd(snooping) 65604591 53 54 54 53ACL log unreach 11013420 9 8 8 8
Step 4 Identify the root cause
Since the administrator has configured IPX or AppleTalk routing identification of the root cause should be straightforward But in order to confirm SPAN the CPU traffic and be sure that the traffic that you see is the expected traffic For information about the CPU SPAN see the Tool 1 Monitor the CPU Traffic with SPANmdashCisco IOS Software Release 121(19)EW and Later section of this document
In this case the administrator must update the baseline CPU to the current value The Catalyst 4500 CPU behaves as expected when the CPU processes software-switched packets
Host Learning
The Catalyst 4500 learns the MAC addresses of various hosts if the MAC address is not already in the MAC address table The switching engine forwards a copy of the packet with the new MAC address to the CPU
All the VLAN interfaces (layer 3) use the chassis base hardware address as their MAC address As a result there is not an entry in the MAC address table and the packets destined to these VLAN interfaces are not sent to the CPU for processing
If there is an excessive number of new MAC addresses for the switch to learn high CPU utilization can result
Step 1 Check for the Cisco IOS process with the show processes cpu command
Issue the show processes cpu command in order to check which Cisco IOS process consumes the CPU In this command output notice that the top process is the Cat4k Mgmt LoPri
Switchshow processes cpu CPU utilization for five seconds 891 one minute 74 five minutes 71 PID Runtime(ms) Invoked uSecs 5Sec 1Min 5Min TTY Process 1 4 53 75 000 000 000 0 Chunk Manager
--- Output suppressed
25 8008 1329154 6 000 000 000 0 Per-Second Jobs 26 413128 38493 10732 000 002 000 0 Per-minute Jobs 27 148288424 354390017 418 2647 1028 1011
0 Cat4k Mgmt HiPri 28 285796820 720618753 396 5271 5679 5570 0 Cat4k Mgmt LoPri
Step 2 Check for the Catalyst 4500-specific process with the show platform health command
The output of the show platform health command confirms the use of the CPU in order to process CPU-bound packets
Switchshow platform health CPU CPU RunTimeMax Priority Average CPU Total Target Actual Target Actual Fg Bg 5Sec Min Hour CPU
--- Output suppressed
TagMan-RecreateMtegR 100 000 10 4 100 500 0 0 0 000K2CpuMan Review 3000 4688 30 47 100 500 30 29 21 26501K2AccelPacketMan Tx 1000 803 20 0 100 500 21 29 26 2704
Step 3 Check the CPU queue that receives traffic in order to identify the type of CPU-bound traffic
In order to determine the type of traffic that hits the CPU issue the show platform cpu packet statistics command
Switchshow platform cpu packet statistics
--- Output suppressed
Packets Received by Packet Queue
Queue Total 5 sec avg 1 min avg 5 min avg 1 hour avg---------------------- --------------- --------- --------- --------- ----------Esmp 48613268 38 39 38 39
Control 142166648 74 74 73 73Host Learning 1845568 1328 1808 1393 1309L3 Fwd High 17 0 0 0 0L3 Fwd Medium 2626 0 0 0 0L3 Fwd Low 1582414 1 1 1 1L2 Fwd Medium 1 0 0 0 0L2 Fwd Low 576905398 37 7 8 5L3 Rx High 257147 0 0 0 0L3 Rx Low 5325772 10 19 13 7RPF Failure 155 0 0 0 0ACL fwd(snooping) 65604591 53 54 54 53ACL log unreach 11013420 9 8 8 8
Step 4 Identify the root cause
The output of the show platform health command shows you that the CPU sees a lot of new MAC addresses This situation is often the result of network topology instability For example if the spanning-tree topology changes the switch generates Topology Change Notifications (TCNs) The issue of TCNs reduces the aging time to 15 seconds in PVST+ mode MAC address entries are flushed if the addresses are not learned back within the time period In the case of Rapid STP (RSTP) (IEEE 8021w) or MST (IEEE 8021s) the entries immediately age out if the TCN comes from another switch This age out causes MAC addresses to be learned anew This is not a major issue if the topology changes are rare But there can be an excessive number of topology changes because of a flapping link faulty switch or host ports that are not enabled for PortFast A large number of MAC table flushes and subsequent relearning can result The next step in root cause identification is to troubleshoot the network The switch works as expected and sends the packets to the CPU for host address learning Identify and fix the faulty device that results in excessive TCNs
Your network can have a lot of devices that send traffic in bursts which causes MAC addresses to be aged out and subsequently relearned on the switch In this case increase the MAC address table aging time in order to provide some relief With a longer aging time the switches retain the device MAC
addresses in the table for a longer period of time before the age out
Caution Make this age-out change only after careful consideration The change can lead to a traffic black hole if you have devices in your network which are mobile
Out of Hardware Resources (TCAM) for Security ACL
The Catalyst 4500 programs the configured ACLs with use of the Cisco TCAM TCAM allows for the application of the ACLs in the hardware-forwarding path There is no impact on performance of the switch with or without ACLs in the forwarding path Performance is constant despite the size of the ACL because performance of the ACL lookups is at line rate However TCAM is a finite resource Therefore if you configure an excessive number of ACL entries you exceed the TCAM capacity Table 3 shows the number of TCAM resources available on each of the Catalyst 4500 Supervisor Engines and switches
Table 3 ndash TCAM Capacity on Catalyst 4500 Supervisor EnginesSwitches
ProductFeature TCAM (per Direction)
QoS TCAM (per Direction)
Supervisor Engine II+II+TS
8192 entries with 1024 masks
8192 entries with 1024 masks
Supervisor Engine IIIIVV and Catalyst 4948
16384 entries with 2048 masks
16384 entries with 2048 masks
Supervisor Engine V-10GE and Catalyst 4948-10GE
16384 entries with 16384 masks
16384 entries with 16384 masks
The switch uses the feature TCAM in order to program the security ACL such as RACL and VLAN ACL (VACL) The switch also uses the feature TCAM for security features like IP Source Guard (IPSG) for dynamic ACLs The switch uses the QoS TCAM in order to program classification and policer ACLs
When the Catalyst 4500 runs out of TCAM resources during the programming of a security ACL a partial application of the ACL occurs via the software path The packets that hit those ACEs are processed in software which causes high CPU utilization ACL is programmed from the top down In other words if the ACL does not fit into the TCAM the ACE at the bottom portion of the ACL likely is not programmed in the TCAM
This warning message appears when a TCAM overflow happens
C4K_HWACLMAN-4-ACLHWPROGERRREASON (Suppressed 1times) Input(null 12Normal) Security 140 - insufficient hardware TCAM masksC4K_HWACLMAN-4-ACLHWPROGERR (Suppressed 4 times) Input Security 140 - hardware TCAM limit some packet processing will be software switched
You can see this error message in the show logging command output The message conclusively indicates that some software processing will take place and consequently there can be high CPU utilization
Note If you change a large ACL you can see this message briefly before the changed ACL is programmed again in the TCAM
Step 1 Check for the Cisco IOS process with the show processes cpu command
Issue the show processes cpu command You can see that the CPU utilization is high because the Cat4k Mgmt LoPri process takes up most of the CPU cycles
Switchshow processes cpuCPU utilization for five seconds 990 one minute 99 five minutes 99 PID Runtime(ms) Invoked uSecs 5Sec 1Min 5Min TTY Process 1 0 11 0 000 000 000 0 Chunk Manager 2 9716 632814 15 000 000 000 0 Load Meter 3 780 302 2582 000 000 000 0 SpanTree Helper
--- Output suppressed
23 18208 3154201 5 000 000 000 0 TTY Background 24 37208 3942818 9 000 000 000 0 Per-Second Jobs 25 1046448 110711 9452 000 003 000 0 Per-minute Jobs
26 175803612 339500656 517 412 431 448 0 Cat4k Mgmt HiPri 27 835809548 339138782 2464 8681 8920 8976 0 Cat4k Mgmt LoPri 28 28668 2058810 13 000 000 000 0 Galios Reschedul
Step 2 Check for the Catalyst 4500-specific process with the show platform health command
Issue the show platform health command You can see that the K2CpuMan Review a job to handle CPU-bound packets uses the CPU
Switchshow platform health CPU CPU RunTimeMax Priority Average CPU Total Target Actual Target Actual Fg Bg 5Sec Min Hour CPULj-poll 100 001 2 0 100 500 0 0 0 1345GalChassisVp-review 300 020 10 16 100 500 0 0 0 8844S2w-JobEventSchedule 1000 057 10 7 100 500 1 0 0 40422Stub-JobEventSchedul 1000 000 10 0 100 500 0 0 0 000StatValueMan Update 100 009 1 0 100 500 0 0 0 9133Pim-review 010 000 1 0 100 500 0 0 0 446Ebm-host-review 100 000 8 4 100 500 0 0 0 1401Ebm-port-review 010 000 1 0 100 500 0 0 0 020Protocol-aging-revie 020 000 2 0 100 500 0 0 0 001Acl-Flattener 100 000 10 5 100 500 0 0 0 004KxAclPathMan create 100 000 10 5 100 500 0 0 0 021KxAclPathMan update 200 000 10 6 100 500 0 0 0 005KxAclPathMan reprogr 100 000 2 1 100 500 0 0 0 000
TagMan-InformMtegRev 100 000 5 0 100 500 0 0 0 000TagMan-RecreateMtegR 100 000 10 14 100 500 0 0 0 018K2CpuMan Review 3000 9131 30 92 100 500 128 119 84 1303902K2AccelPacketMan Tx 1000 230 20 0 100 500 2 2 2 134530K2AccelPacketMan Au 010 000 0 0 100 500 0 0 0 000
Step 3 Check the CPU queue that receives traffic in order to identify the type of CPU-bound traffic
You need to further understand which CPU queue and therefore what type of traffic hits the CPU queue Issue the show platform cpu packet statistics command You can see that the ACL sw processing queue receives a high number of packets Therefore TCAM overflow is the cause of this high CPU utilization issue
Switchshow platform cpu packet statistics
--- Output suppressed
Packets Received by Packet Queue
Queue Total 5 sec avg 1 min avg 5 min avg 1 hour avg---------------------- --------------- --------- --------- --------- ----------Control 57902635 22 16 12 3Host Learning 464678 0 0 0 0L3 Fwd Low 623229 0 0 0 0L2 Fwd Low 11267182 7 4 6 1L3 Rx High 508 0 0 0 0L3 Rx Low 1275695 10 1 0 0ACL fwd(snooping) 2645752 0 0 0 0
ACL log unreach 51443268 9 4 5 5ACL sw processing 842889240 1453 1532 1267 1179
Packets Dropped by Packet Queue
Queue Total 5 sec avg 1 min avg 5 min avg 1 hour avg---------------------- --------------- --------- --------- --------- ----------L2 Fwd Low 3270 0 0 0 0ACL sw processing 12636 0 0 0 0
Step 4 Resolve the issue
In Step 3 you determined the root cause in this scenario Remove the ACL which caused the overflow or minimize the ACL to avoid overflow Also review the Configuring Network Security with ACLs configuration guideline in order to optimize the ACL configuration and programming in the hardware
The log Keyword in ACL
The Catalyst 4500 supports logging of packets detail that hit any specific ACL entry but excessive logging can cause high CPU utilization Avoid the use of log keywords except during the traffic discovery stage During the traffic discovery stage you identify the traffic that flows through your network for which you have not explicitly configured ACEs Do not use the log keyword in order to gather statistics In Cisco IOS Software Release 121(13)EW and later the log messages are rate-limited If you use log messages in order to count the number of packets that match the ACL the count is not accurate Instead use the show access-list command for accurate statistics Identification of this root cause is easier because a review of the configuration or log messages can indicate the use of the ACL logging feature
Step 1 Check for the Cisco IOS process with the show processes cpu command
Issue the show processes cpu in order to check which Cisco IOS process consumes the CPU In this command output you find that the top process is the Cat4k Mgmt LoPri
Switchshow processes cpu CPU utilization for five seconds 990 one minute 99 five minutes 99
PID Runtime(ms) Invoked uSecs 5Sec 1Min 5Min TTY Process 1 0 11 0 000 000 000 0 Chunk Manager 2 9716 632814 15 000 000 000 0 Load Meter
--- Output suppressed
26 175803612 339500656 517 412 431 448 0 Cat4k Mgmt HiPri 27 835809548 339138782 2464 8681 8920 8976 0 Cat4k Mgmt LoPri 28 28668 2058810 13 000 000 000 0 Galios Reschedul
Step 2 Check for the Catalyst 4500-specific process with the show platform health command
Check the platform-specific process that uses the CPU Issue the show platform health command In the output notice that the K2CpuMan Review process uses most of the CPU cycles This activity indicates that the CPU is busy as it processes packets destined to it
Switchshow platform health CPU CPU RunTimeMax Priority Average CPU Total Target Actual Target Actual Fg Bg 5Sec Min Hour CPULj-poll 100 001 2 0 100 500 0 0 0 1345GalChassisVp-review 300 020 10 16 100 500 0 0 0 8844S2w-JobEventSchedule 1000 057 10 7 100 500 1 0 0 40422Stub-JobEventSchedul 1000 000 10 0 100 500 0 0 0 000StatValueMan Update 100 009 1 0 100 500 0 0 0 9133Pim-review 010 000 1 0 100 500 0 0 0 446Ebm-host-review 100 000 8 4 100 500 0 0 0 1401Ebm-port-review 010 000 1 0 100
500 0 0 0 020Protocol-aging-revie 020 000 2 0 100 500 0 0 0 001Acl-Flattener 100 000 10 5 100 500 0 0 0 004KxAclPathMan create 100 000 10 5 100 500 0 0 0 021KxAclPathMan update 200 000 10 6 100 500 0 0 0 005KxAclPathMan reprogr 100 000 2 1 100 500 0 0 0 000TagMan-InformMtegRev 100 000 5 0 100 500 0 0 0 000TagMan-RecreateMtegR 100 000 10 14 100 500 0 0 0 018K2CpuMan Review 3000 9131 30 92 100 500 128 119 84 1303902K2AccelPacketMan Tx 1000 230 20 0 100 500 2 2 2 134530K2AccelPacketMan Au 010 000 0 0 100 500 0 0 0 000
Step 3 Check the CPU queue that receives traffic in order to identify the type of CPU-bound traffic
In order to determine the type of traffic that hits the CPU issue the show platform cpu packet statistics command In this command output you can see that the receipt of packets is due to the ACL log keyword
Switchshow platform cpu packet statistics
--- Output suppressed
Total packet queues 16Packets Received by Packet Queue
Queue Total 5 sec avg 1 min avg 5 min avg 1 hour avg----------------- -------------------- --------- --------- --------- ----------Control 1198701435 35 35 34 35Host Learning 874391 0
0 0 0L3 Fwd High 428 0 0 0 0L3 Fwd Medium 12745 0 0 0 0L3 Fwd Low 2420401 0 0 0 0L2 Fwd High 26855 0 0 0 0L2 Fwd Medium 116587 0 0 0 0L2 Fwd Low 317829151 53 41 31 31L3 Rx High 2371 0 0 0 0L3 Rx Low 32333361 7 1 2 0RPF Failure 4127 0 0 0 0ACL fwd (snooping) 107743299 4 4 4 4ACL log unreach 1209056404 1987 2125 2139 2089
Packets Dropped by Packet Queue
Queue Total 5 sec avg 1 min avg 5 min avg 1 hour avg----------------- -------------------- --------- --------- --------- ----------ACL log unreach 193094788 509 362 437 394
Step 4 Resolve the issue
In Step 3 you determined the root cause in this scenario In order to prevent this problem remove the log keyword from the ACLs In Cisco IOS Software Release 121(13)EW1 and later the packets are rate-limited so that CPU utilization does not get too high Use the access list counters as a way to keep track of ACL hits You can see the access list counters in the show access-list acl_id command output
Layer 2 forwarding loops
Layer 2 forwarding loops can be caused by poor implementation of Spanning Tree Protocol (STP) and
various issues that can affect STP
Step 1 Check for the Cisco IOS process with the show processes cpu command
This section reviews the commands that an administrator uses in order to narrow down the problem of high CPU utilization If you issue the show processes cpu command you can see that two main processes Cat4k Mgmt LoPri and Spanning Tree primarily use the CPU With only this information you know that the spanning tree process consumes a sizable portion of the CPU cycles
Switchshow processes cpu CPU utilization for five seconds 741 one minute 73 five minutes 50 PID Runtime(ms) Invoked uSecs 5Sec 1Min 5Min TTY Process 1 4 198 20 000 000 000 0 Chunk Manager 2 4 290 13 000 000 000 0 Load Meter
--- Output suppressed
25 488 33 14787 000 002 000 0 Per-minute Jobs 26 90656 223674 405 679 690 722 0 Cat4k Mgmt HiPri 27 158796 59219 2681 3255 3380 2143 0 Cat4k Mgmt LoPri 28 20 1693 11 000 000 000 0 Galios Reschedul 29 0 1 0 000 000 000 0 IOS ACL Helper 30 0 2 0 000 000 000 0 NAM Manager
--- Output suppressed
41 0 1 0 000 000 000 0 SFF8472 42 0 2 0 000 000 000 0 AAA Dictionary R 43 78564 20723 3791 3263 3003 1735 0 Spanning Tree 44 112 999 112 000 000 000
0 DTP Protocol 45 0 147 0 000 000 000 0 Ethchnl
Step 2 Check for the Catalyst 4500-specific process with the show platform health command
In order to understand which platform-specific process consumes the CPU issue the show platform health command From this output you can see that the K2CpuMan Review process a job to handle CPU-bound packets uses up the CPU
Switchshow platform health CPU CPU RunTimeMax Priority Average CPU Total Target Actual Target Actual Fg Bg 5Sec Min Hour CPU
--- Output suppressed
TagMan-RecreateMtegR 100 000 10 0 100 500 0 0 0 000K2CpuMan Review 3000 3762 30 53 100 500 41 33 1 212K2AccelPacketMan Tx 1000 495 20 0 100 500 5 4 0 036K2AccelPacketMan Au 010 000 0 0 100 500 0 0 0 000K2AclMan-taggedFlatA 100 000 10 0 100 500 0 0 0 000
Step 3 Check the CPU queue that receives traffic in order to identify the type of CPU-bound traffic
Issue the show platform cpu packet statistics command in order to check which CPU queue receives the CPU-bound packet The output in this section shows that the control queue receives a lot of packets Use the information in Table 1 and the conclusion that you drew in Step 1 You can determine that the packets that the CPU processes and the reason for the high CPU utilization is BPDU processing
Switchshow platform cpu packet statistics
--- Output suppressed
Total packet queues 16Packets Received by Packet Queue
Queue Total 5 sec avg 1 min avg 5 min avg 1 hour avg---------------------- --------------- --------- --------- --------- ----------Esmp 202760 196 173 128 28Control 388623 2121 1740 598 16
Packets Dropped by Packet Queue
Queue Total 5 sec avg 1 min avg 5 min avg 1 hour avg---------------------- --------------- --------- --------- --------- ----------Control 17918 0 19 24 3
Step 4 Identify the root cause and fix the issue
Generally you can complete these steps in order to troubleshoot (depending on the situation some steps are not be necessary)
1 Identify the loop
2 Discover the scope of the loop
3 Break the loop
4 Fix the cause for the loop
5 Restore redunancy
Each of the steps are explained in detail at Troubleshooting Forwarding Loops - Troubleshooting STP on Catalyst Switches Running Cisco IOS System Software
Step 5 Implement advanced STP features
BDPU GuardmdashSecures STP from unauthorized network devices connected to portfast enabled ports Refer to Spanning Tree PortFast BPDU Guard Enhancement for more information
Loop GuardmdashIncreases the stability of layer 2 networks Refer to Spanning-Tree Protocol Enhancements using Loop Guard and BPDU Skew Detection Features for more information
Root GuardmdashEnforces root bridge placement in the network Refer to Spanning Tree Protocol Root Guard Enhancement for more information
UDLDmdashDetects unidirectional links and prevents forwarding loops Refer to Understanding and Configuring the Unidirectional Link Detection Protocol Feature for more information
Other Causes of High CPU Utilization
These are some other known causes of high CPU utilization
Excessive link flaps
Spikes in CPU utilization due to FIB consistency check
High CPU utilization in the K2FibAdjMan Host Move process
High CPU utilization in the RkiosPortMan Port Review process
High CPU utilization when connected to an IP phone with the use of trunk ports
High CPU Utilization with RSPAN and Layer 3 Control Packets
Spike during large ACL programming
The spike in CPU utilization occurs during application or removal of a large ACL from an interface
Excessive Link Flaps
The Catalyst 4500 exhibits high CPU utilization when one or more of the attached links starts to flap excessively This situation occurs in Cisco IOS Software releases earlier than Cisco IOS Software Release 122(20)EWA
Step 1 Check for the Cisco IOS process with the show processes cpu command
Issue the show processes cpu command in order to check which Cisco IOS process consumes the CPU In this command output notice that the top process is the Cat4k Mgmt LoPri
Switchshow processes cpu CPU utilization for five seconds 960 one minute 76 five minutes 68 PID Runtime(ms) Invoked uSecs 5Sec 1Min 5Min TTY Process 1 0 4 0 000 000 000 0 Chunk Manager 2 9840 463370 21 000 000 000 0 Load Meter 3 0 2 0 000 000 000 0 SNMP Timers
--- Output suppressed
27 232385144 530644966 437 1398 1265 1216 0 Cat4k Mgmt HiPri 28 564756724 156627753 3605 6474 6071 5475 0 Cat4k Mgmt LoPri 29 9716 1806301 5 000 000 000 0 Galios Reschedul
Step 2 Check for the Catalyst 4500-specific process with the show platform health command
The output of the show platform health command indicates that the KxAclPathMan create process uses up the CPU This process is for internal path creation
Switchshow platform health CPU CPU RunTimeMax Priority Average CPU Total Target Actual Target Actual Fg Bg 5Sec Min Hour CPULj-poll 100 003 2 0 100 500 0 0 0 949GalChassisVp-review 300 111 10 62 100 500 0 0 0 3739S2w-JobEventSchedule 1000 285 10 8 100 500 2 2 2 9000Stub-JobEventSchedul 1000 527 10 9 100 500 4 4 4 1862Pim-review 010 000 1 0 100 500 0 0 0 251
Ebm-host-review 100 000 8 4 100 500 0 0 0 806Ebm-port-review 010 000 1 0 100 500 0 0 0 014Protocol-aging-revie 020 000 2 0 100 500 0 0 0 000Acl-Flattener 100 000 10 5 100 500 0 0 0 000KxAclPathMan create 100 6911 10 5 100 500 42 53 22 7150KxAclPathMan update 200 076 10 6 100 500 0 0 0 8600KxAclPathMan reprogr 100 000 2 1 100 500 0 0 0 000TagMan-InformMtegRev 100 000 5 0 100 500 0 0 0 000TagMan-RecreateMtegR 100 000 10 227 100 500 0 0 0 000K2CpuMan Review 3000 805 30 57 100 500 6 5 5 2150K2AccelPacketMan Tx 1000 686 20 0 100 500 5 5 4 7842
Step 3 Identify the root cause
Enable logging for link updown messages This logging is not enabled by default The enablement helps you to narrow down the offending links very quickly Issue the logging event link-status command under all the interfaces You can use the interface range command in order to conveniently enable on a range of interfaces as this example shows
Switchconfigure terminalEnter configuration commands one per line End with CNTLZSwitch(config)interface range gigabitethernet 51 - 48Switch(config-if-range)logging event link-statusSwitch(config--if-range)end
Switchshow logging
--- Output suppressed
3w5d LINK-3-UPDOWN Interface GigabitEthernet524 changed state to down3w5d LINK-3-UPDOWN Interface GigabitEthernet524 changed
state to up3w5d LINK-3-UPDOWN Interface GigabitEthernet524 changed state to down3w5d LINK-3-UPDOWN Interface GigabitEthernet524 changed state to up3w5d LINK-3-UPDOWN Interface GigabitEthernet524 changed state to down3w5d LINK-3-UPDOWN Interface GigabitEthernet524 changed state to up
After you have identified the faulty or flapping interface shut down the interface in order to resolve the high CPU utilization issue Cisco IOS Software Release 122(20)EWA and later have improved the Catalyst 4500 behavior for this flapping-links condition Therefore the impact on the CPU is not as great as before the improvement Remember that this process is a background process High CPU utilization because of this issue does not cause adverse effects on the Catalyst 4500 switches
Spikes in CPU Utilization Due to FIB Consistency Check
The Catalyst 4500 can show momentary spikes in the CPU utilization during a FIB table consistency check The FIB table is the L3 forwarding table that the CEF process creates The consistency check maintains consistency between the Cisco IOS Software FIB table and the hardware entries This consistency ensures that packets are not misrouted The check occurs every 2 seconds and runs as a low-priority background process This process is normal behavior and does not interfere with other high-priority processes or packets
The output of the show platform health command shows that K2Fib Consistency Ch consumes most of the CPU
Note The average CPU utilization for this process is insignificant over a minute or an hour which confirms that the check is a short periodic review This background process only uses the idle CPU cycles
Switchshow platform health CPU CPU RunTimeMax Priority Average CPU Total Target Actual Target Actual Fg Bg 5Sec Min Hour CPULj-poll 100 002 2 1 100 500 0 0 0 109GalChassisVp-review 300 029 10 3 100 500 0 0 0 1115
--- Output suppressed
K2Fib cam usage revi 200 000 15 0 100 500 0 0 0 000K2Fib IrmFib Review 200 000 15 0 100 500 0 0 0 000K2Fib Vrf Default Ro 200 000 15 0 100 500 0 0 0 000K2Fib AdjRepop Revie 200 000 15 0 100 500 0 0 0 000K2Fib Vrf Unpunt Rev 200 001 15 0 100 500 0 0 0 023K2Fib Consistency Ch 100 6040 5 2 100 500 0 0 0 10023K2FibAdjMan Stats Re 200 030 10 4 100 500 0 0 0 621K2FibAdjMan Host Mov 200 000 10 4 100 500 0 0 0 000K2FibAdjMan Adj Chan 200 000 10 0 100 500 0 0 0 000K2FibMulticast Signa 200 001 10 2 100 500 0 0 0 204
High CPU Utilization in the K2FibAdjMan Host Move Process
The Catalyst 4500 can display high CPU utilization in the K2FibAdjMan Host Move process This high utilization appears in the output of the show platform health command Many MAC addresses frequently expire or are learned on new ports which causes this high CPU utilization The default value of mac-address-table aging-time is 5 minutes or 300 seconds The workaround for this issue is to increase the MAC address aging time or you can engineer the network in order to avoid the high number of MAC address moves Cisco IOS Software Release 122(18)EW and later have enhanced this process behavior in order to consume less CPU Refer to Cisco bug ID CSCed15021 ( registered customers only)
Switchshow platform health CPU CPU RunTimeMax Priority Average CPU Total Target Actual Target Actual Fg Bg 5Sec Min Hour CPULj-poll 100 002 2 1 100 500 0 0 0 109GalChassisVp-review 300 029 10 3 100 500 0 0 0 1115S2w-JobEventSchedule 1000 032 10 7 100 500 0 0 0 1014
--- Output suppressed
K2FibAdjMan Stats Re 200 030 10 4 100 500 0 0 0 621K2FibAdjMan Host Mov 200 1868 10 4 100 500 25 29 28 213439K2FibAdjMan Adj Chan 200 000 10 0 100 500 0 0 0 000K2FibMulticast Signa 200 001 10 2 100 500 0 0 0 204K2FibMulticast Entry 200 000 10 7 100 500 0 0 0 000
You can modify the maximum aging time of a MAC address in the global configuration mode The command syntax is mac-address-table aging-time seconds for a router and mac-address-table aging-time seconds [vlan vlan-id] for a Catalyst Switch For more information refer to the Cisco IOS Switching Services Command Reference Guide
High CPU Utilization in the RkiosPortMan Port Review Process
The Catalyst 4500 can display high CPU utilization in the RkiosPortMan Port Review process in the output of the show platform health command in Cisco IOS Software Release 122(25)EWA and 122(25)EWA1 Cisco bug ID CSCeh08768 ( registered customers only) causes the high utilization which Cisco IOS Software Release 122(25)EWA2 resolves This process is a background process and does not affect the stability of the Catalyst 4500 switches
Switchshow platform health CPU CPU RunTimeMax Priority Average CPU Total Target Actual Target Actual Fg Bg 5Sec Min Hour CPULj-poll 100 002 2 1 100 500 0 0 0 109GalChassisVp-review 300 029 10 3 100 500 0 0 0 1115S2w-JobEventSchedule 1000 032 10 7 100 500 0 0 0 1014
--- Output suppressed
K2 Packet Memory Dia 200 000 15 8 100 500 0 1 1 4546
K2 L2 Aging Table Re 200 012 20 3 100 500 0 0 0 722RkiosPortMan Port Re 200 8792 12 7 100 500 99 99 89 105236Rkios Module State R 400 002 40 1 100 500 0 0 0 128Rkios Online Diag Re 400 002 40 0 100 500 0 0 0 115
High CPU Utilization When Connected to an IP Phone with the Use of Trunk Ports
If a port is configured for both the voice VLAN option and the access VLAN option the port acts as a multi-VLAN access port The advantage is that only those VLANs that are configured for the voice and access VLAN options are trunked
The VLANs that are trunked to the phone increase the number of STP instances The switch manages the STP instances Management of the increase in STP instances also increases the STP CPU utilization
The trunking of all the VLANs also causes unnecessary broadcast multicast and unknown unicast traffic to hit the phone link
Switchshow processes cpuCPU utilization for five seconds 690 one minute 72 five minutes 73 PID Runtime(ms) Invoked uSecs 5Sec 1Min 5Min TTY Process 1 4 165 24 000 000 000 0 Chunk Manager 2 29012 739091 39 000 000 000 0 Load Meter 3 67080 13762 4874 000 000 000 0 SpanTree Helper 4 0 1 0 000 000 000 0 Deferred Events 5 0 2 0 000 000 000 0 IpSecMibTopN 6 4980144 570766 8725 000 009 011 0 Check heaps 26 539173952 530982442 1015 1309 1305 1320 0 Cat4k Mgmt HiPri 27 716335120 180543127 3967 1761 1819 1841 0 Cat4k Mgmt LoPri 33 1073728 61623 17424 000 003 000
0 Per-minute Jobs 34 1366717824 231584970 5901 3899 3890 3892 0 Spanning Tree 35 2218424 18349158 120 000 003 002 0 DTP Protocol 36 5160 369525 13 000 000 000 0 Ethchnl 37 271016 2308022 117 000 000 000 0 VLAN Manager 38 958084 3965585 241 000 001 001 0 UDLD 39 1436 51011 28 000 000 000 0 DHCP Snooping 40 780 61658 12 000 000 000 0 Port-Security 41 1355308 12210934 110 000 001 000 0 IP Input
High CPU Utilization with RSPAN and Layer 3 Control Packets
Layer 3 control packets that are captured with RSPAN are destined to CPU rather than just the RSPAN destination interface which causes high CPU The L3 control packets are captured by static CAM entries with forward to CPU action The static CAM entries are global to all VLANs In order to avoid unnecessary CPU flooding use the Per-VLAN Control Traffic Intercept feature available in Cisco IOS software releases 122(37)SG and later
Switch(config) access-list hardware capture mode vlan
Static ACLs are installed at the top in input feature TCAM to capture control packets destined to well known IP multicast addresses in the 22400 range Static ACLs are installed at boot time and appear before any user configured ACL Static ACLs are always hit first and intercept control traffic to CPU on all VLANs
Per-VLAN control traffic intercept feature provide selective per-VLAN path managed mode of capturing control traffic The corresponding static CAM entries in input feature TCAM are invalidated in the new mode Control packets are captured by feature specific ACL attached to VLANs on which snooping or routing features are enabled There is no feature specific ACL attached to RSPAN VLAN Therefore all layer 3 control packets received from RSPAN VLAN are not forwarded to CPU
Troubleshooting Tools to Analyze the Traffic Destined to the CPU
As this document has shown traffic that is destined to the CPU is one of the major causes of high CPU utilization on the Catalyst 4500 The CPU-destined traffic can be either intentional because of the configuration or unintentional because of misconfiguration or a denial-of-service attack The CPU has an in-built QoS mechanism to prevent any adverse network effects because of this traffic However identify the root cause of CPU-bound traffic and eliminate the traffic if it is undesirable
Tool 1 Monitor the CPU Traffic with SPANmdashCisco IOS Software Release 121(19)EW and Later
The Catalyst 4500 allows for the monitor of the CPU-bound traffic either ingress or egress with the use of the standard SPAN function The destination interface connects to a packet monitor or an administrator laptop that runs packet sniffer software This tool helps to quickly and accurately analyze the traffic that the CPU processes The tool provides the ability to monitor individual queues that are bound to the CPU packet engine
Note The switching engine has 32 queues for the CPU traffic and the CPU packet engine has 16 queues
Switch(config)monitor session 1 source cpu both Monitor received and transmitted traffic queue SPAN source CPU queue rx Monitor received traffic only tx Monitor transmitted traffic only ltcrgt Switch(config)monitor session 1 source cpu queue lt1-32gt SPAN source CPU queue numbers acl Input and output ACL [13-20] adj-same-if Packets routed to the incoming interface [7] all All queues [1-32] bridged L2bridged packets [29-32] control-packet Layer 2 Control Packets [5] mtu-exceeded Output interface MTU exceeded [9] nfl Packets sent to CPU by netflow (unused) [8] routed L3routed packets [21-28] rpf-failure Multicast RPF Failures [6] span SPAN to CPU (unused) [11] unknown-sa Packets with missing source address [10] Switch(config)monitor session 1 source cpu queue all rx Switch(config)monitor session 1 destination interface gigabitethernet 13 Switch(config)end 4w6d SYS-5-CONFIG_I Configured from console by console
Switchshow monitor session 1 Session 1 --------- Type Local Session Source Ports RX Only CPU Destination Ports Gi13 Encapsulation Native Ingress Disabled Learning Disabled
If you connect a PC that runs a sniffer program you can quickly analyze the traffic In the output that appears in the window in this section you can see that the cause of the high CPU utilization is an excessive number of STP BPDUs
Note STP BPDUs in the CPU sniffer is normal But if you see more than you expect you may have exceeded the recommended limits for your Supervisor Engine See the A High Number of Spanning-Tree Port Instances section of this document for more information
Tool 2 In-Built CPU SniffermdashCisco IOS Software Release 122(20)EW and Later
The Catalyst 4500 provides an in-built CPU sniffer and decoder to quickly identify the traffic that hits the CPU You can enable this facility with the debug command as the example in this section shows This features implements a circular buffer that can retain 1024 packets at a time As new packets arrive they overwrite the older packets This feature is safe to use when you troubleshoot high CPU utilization issues
Switchdebug platform packet all receive buffer platform packet debugging is on Switchshow platform cpu packet buffered Total Received Packets Buffered 36 ------------------------------------- Index 0 7 days 2363237214 - RxVlan 99 RxPort Gi448 Priority Crucial Tag Dot1Q Tag Event Control Packet
Flags 0x40 Size 68 Eth Src 00-0F-F7-AC-EE-4F Dst 01-00-0C-CC-CC-CD TypeLen 0x0032 Remaining data 0 0xAA 0xAA 0x3 0x0 0x0 0xC 0x1 0xB 0x0 0x0 10 0x0 0x0 0x0 0x80 0x0 0x0 0x2 0x16 0x63 0x28 20 0x62 0x0 0x0 0x0 0x0 0x80 0x0 0x0 0x2 0x16 30 0x63 0x28 0x62 0x80 0xF0 0x0 0x0 0x14 0x0 0x2 40 0x0 0xF 0x0 0x0 0x0 0x0 0x0 0x2 0x0 0x63 Index 1 7 days 23633180863 - RxVlan 1 RxPort Gi448 Priority Crucial Tag Dot1Q Tag Event Control Packet Flags 0x40 Size 68 Eth Src 00-0F-F7-AC-EE-4F Dst 01-00-0C-CC-CC-CD TypeLen 0x0032 Remaining data 0 0xAA 0xAA 0x3 0x0 0x0 0xC 0x1 0xB 0x0 0x0 10 0x0 0x0 0x0 0x80 0x0 0x0 0x2 0x16 0x63 0x28 20 0x62 0x0 0x0 0x0 0x0 0x80 0x0 0x0 0x2 0x16 30 0x63 0x28 0x62 0x80 0xF0 0x0 0x0 0x14 0x0 0x2 40 0x0 0xF 0x0 0x0 0x0 0x0 0x0 0x2 0x0 0x63
Note The CPU utilization when you issue a debug command is always almost 100 It is normal to have high CPU utilization when you issue a debug command
Tool 3 Identify the Interface That Sends Traffic to the CPUmdashCisco IOS Software Release 122(20)EW and Later
Catalyst 4500 provides another useful tool to identify the top interfaces that send trafficpackets for CPU processing This tool helps you quickly identify an errand device that sends a high number of broadcast or other denial-of-service attacks to the CPU This feature is also safe to use when you troubleshoot high CPU utilization issues
Switchdebug platform packet all countplatform packet debugging is on Switchshow platform cpu packet statistics
--- Output suppressed
Packets Transmitted from CPU per Output Interface
Interface Total 5 sec avg 1 min avg 5 min avg 1 hour avg
---------------------- --------------- --------- --------- --------- ---------- Gi447 1150 1 5 10 0 Gi448 50 1 0 0 0
Packets Received at CPU per Input Interface
Interface Total 5 sec avg 1 min avg 5 min avg 1 hour avg ---------------------- --------------- --------- --------- --------- ---------- Gi447 23130 5 10 50 20Gi448 50 1 0 0 0
Note The CPU utilization when you issue a debug command is always almost 100 It is normal to have high CPU utilization when you issue a debug command
Summary
The Catalyst 4500 switches handle a high rate of IP version 4 (IPv4) packet forwarding in hardware Some of the features or exceptions can cause the forward of some packets via the CPU process path The Catalyst 4500 uses a sophisticated QoS mechanism to handle CPU-bound packets This mechanism ensures reliability and stability of the switches and at the same time maximizes the CPU for the software forwarding of packets Cisco IOS Software Release 122(25)EWA2 and later provide additional enhancements for packetprocess handling as well as accounting The Catalyst 4500 also has sufficient commands and powerful tools to aid in the identification of the root cause of high CPU-utilization scenarios But in most cases high CPU utilization on the Catalyst 4500 is not a cause of network instability nor a cause for concern
Cisco Support Community - Featured Conversations
Cisco Support Community is a forum for you to ask and answer questions share suggestions and collaborate with your peers Below are just some of the most recent and relevant conversations happening right now
Want to see more Join us by clicking here
High CPU Utilization on Cisco IOSpramodprasad5 Replies2 years 8 months ago
High CPU utilization on Cisco 4500andrewswanson7 Replies1 year 6 months ago
Process causes high CPU utilization ondsalamanca5 Replies3 years 4 months ago
HIGH UTILIZATION of 4500 Catalystsohaildxbfze2 Replies1 year 9 months ago
High CPu utilization in 4500vaibhav-g1 Reply3 months 6 days ago
High CPU utilization on Catalyst 3500hestholmt1 Reply7 years 6 months ago
High CPU Utilizationheidemat011 Reply3 years 4 months ago
4507R IOS Catalyst - High CPUshakeelahmadch4 Replies2 years 7 months ago
4506 CPU utilization averagehttpssupportforumsciscocompeopleluizalexandrepaiva40gmailcom6 Replies2 years 9 months ago
High CPU Utilization Catalyst 2924 httpssupportforumsciscocompeoplegfiguereo40bpdcomdo2 Replies5 years 11 months ago Subscribe Start A New Discussion
Related Information
CPU Utilization on Catalyst 45004000 2948G 2980G and 4912G Switches That Run
CatOS Software LAN Product Support Pages LAN Switching Support Page Technical Support amp Documentation - Cisco Systems
Contacts amp Feedback | Help | Site Map copy 2008 - 2009 Cisco Systems Inc All rights reserved Terms amp Conditions | Privacy Statement | Cookie Policy | Trademarks of Cisco Systems Inc
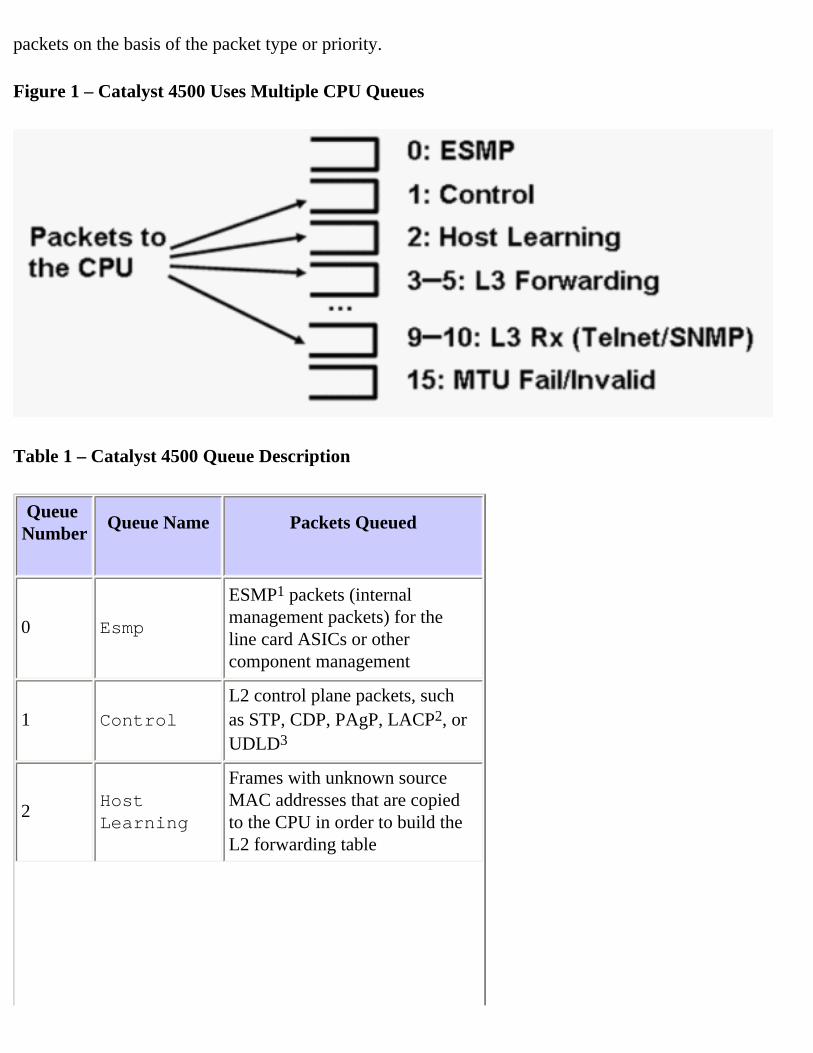
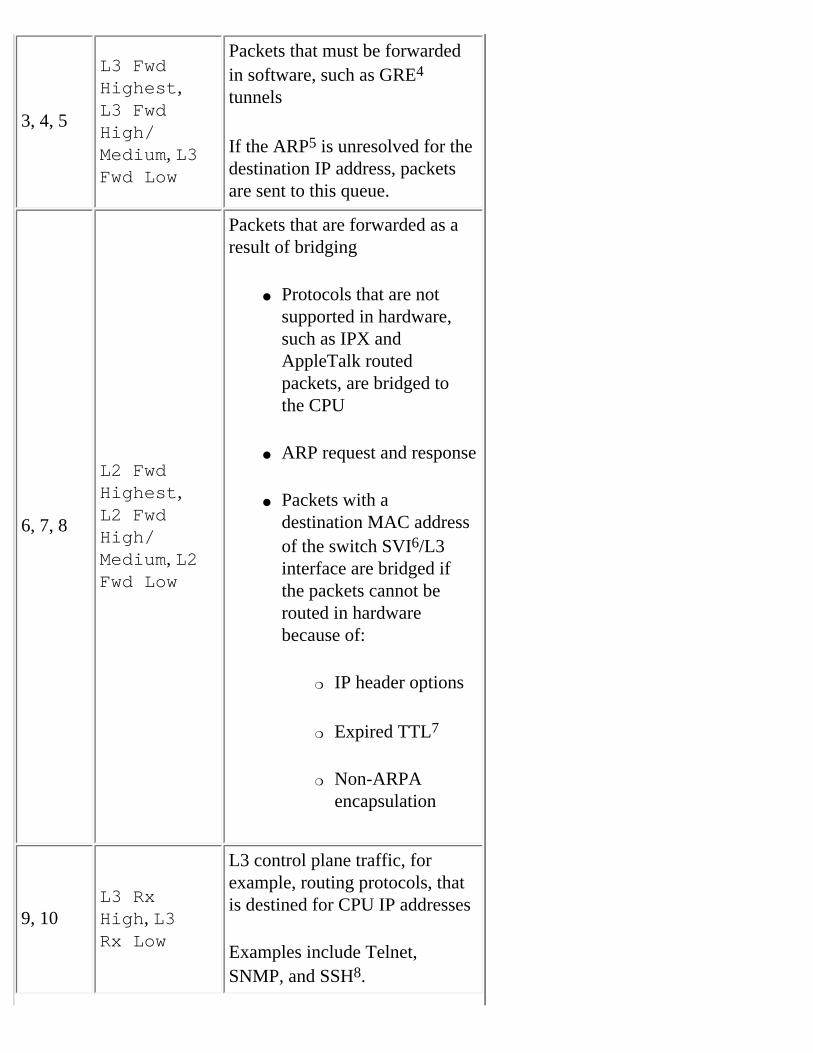
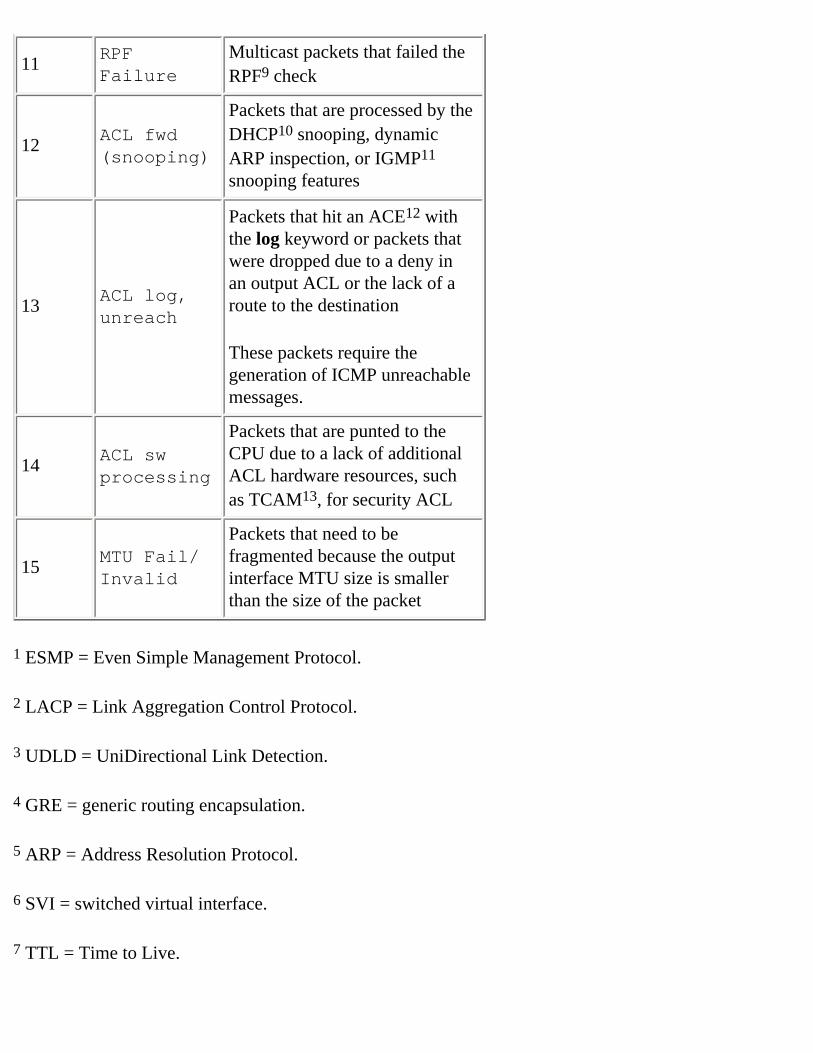
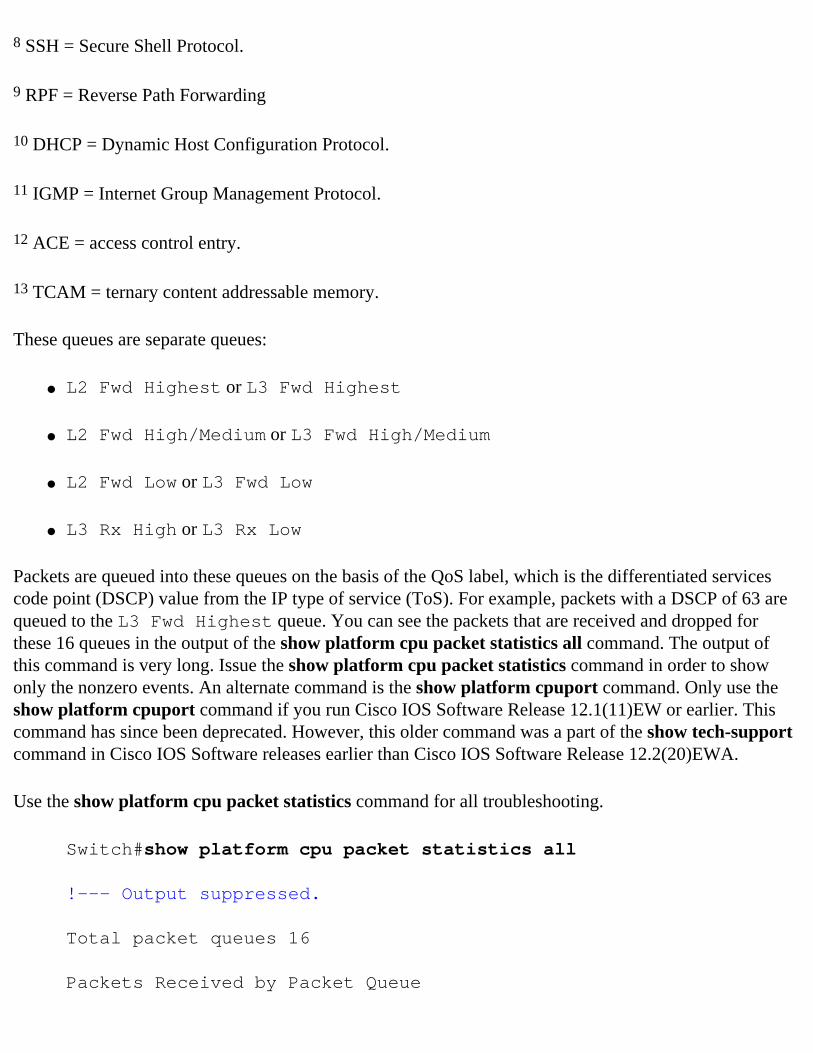
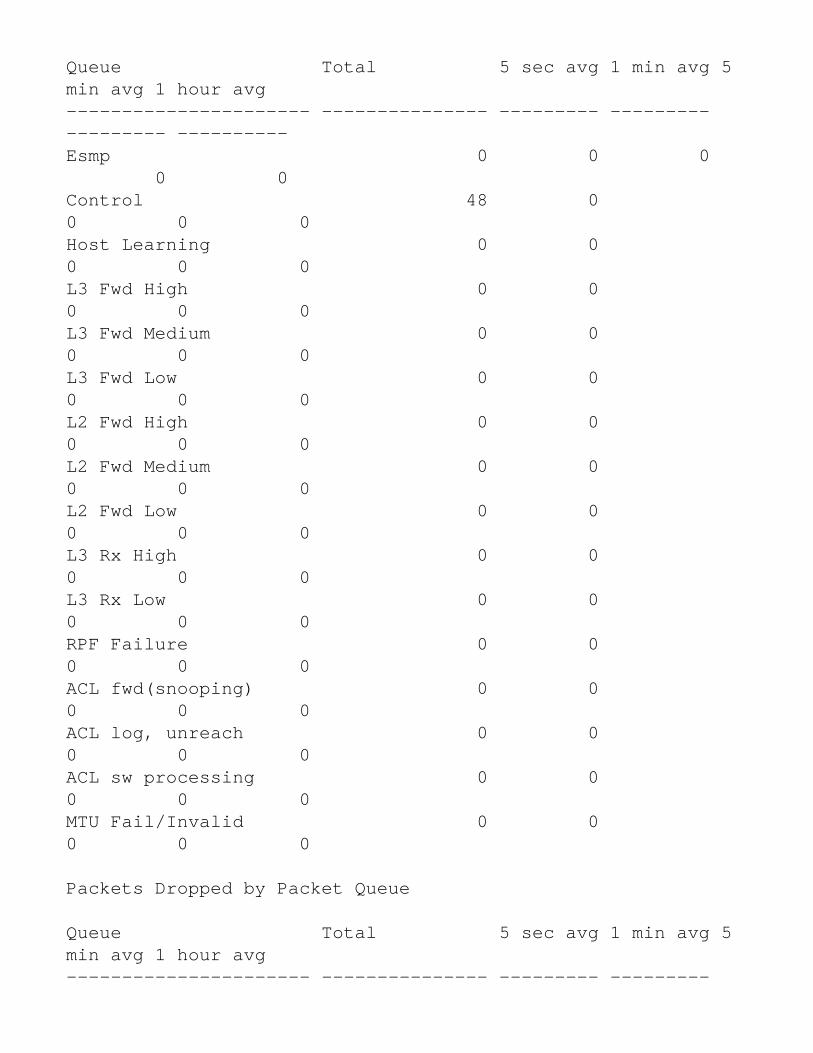
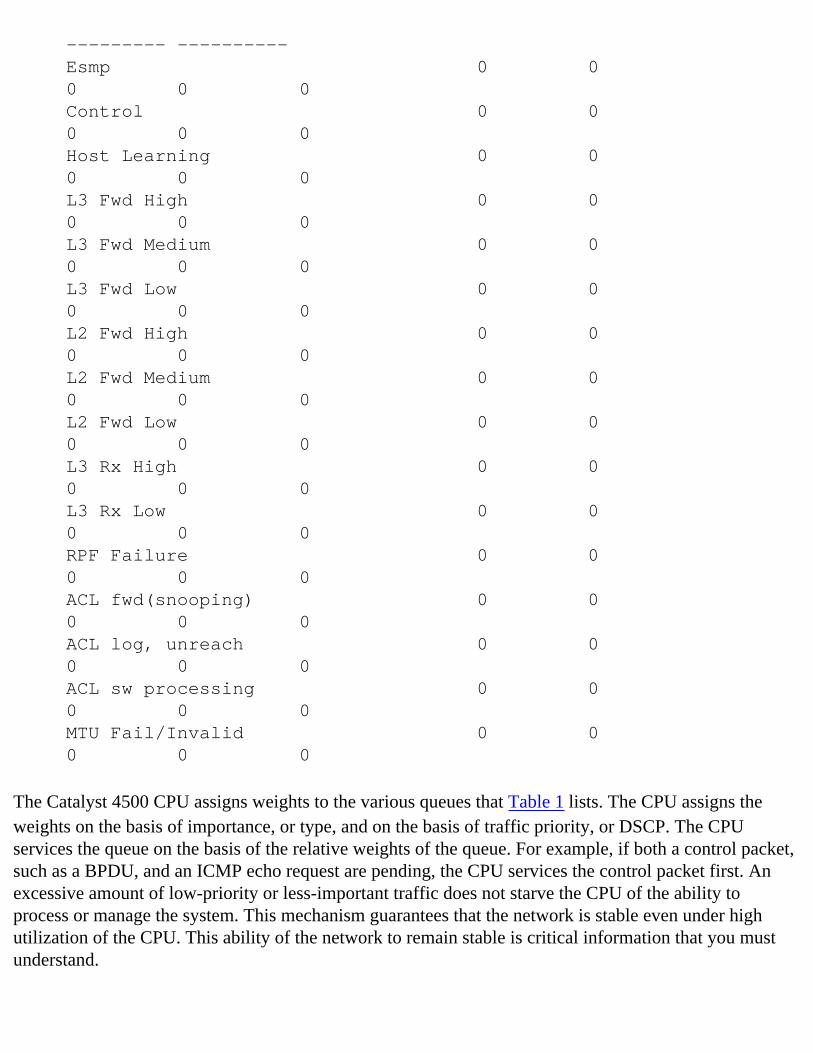
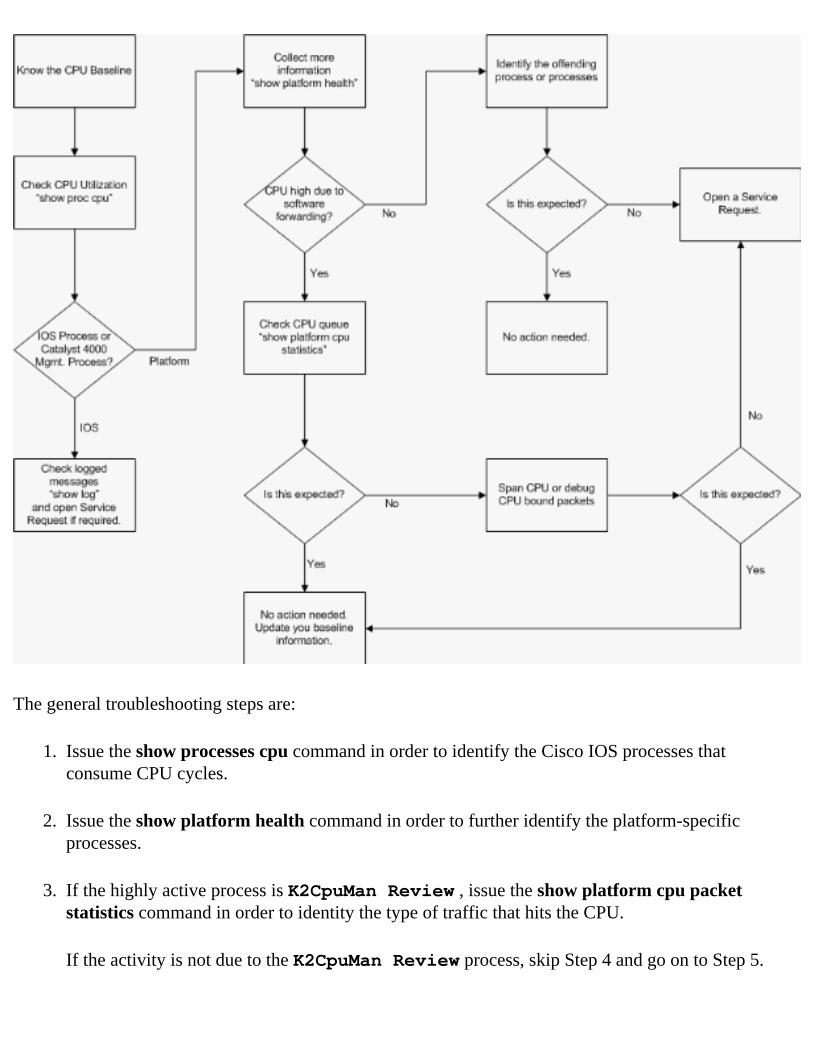
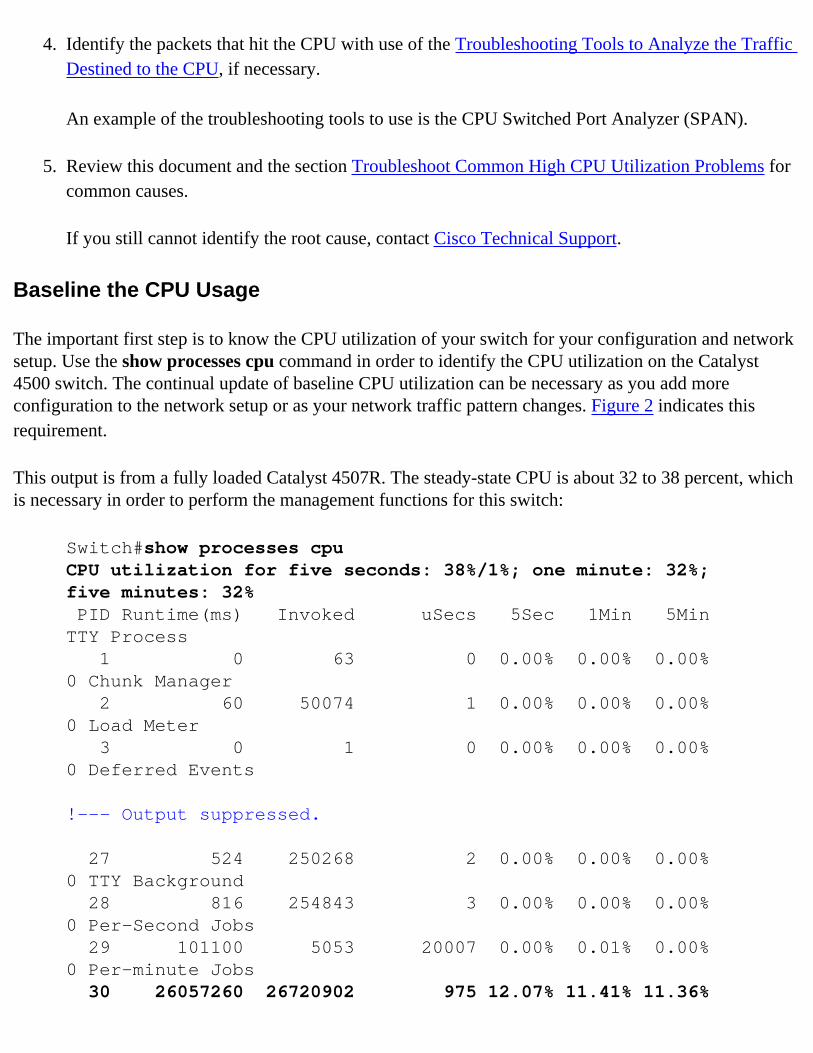
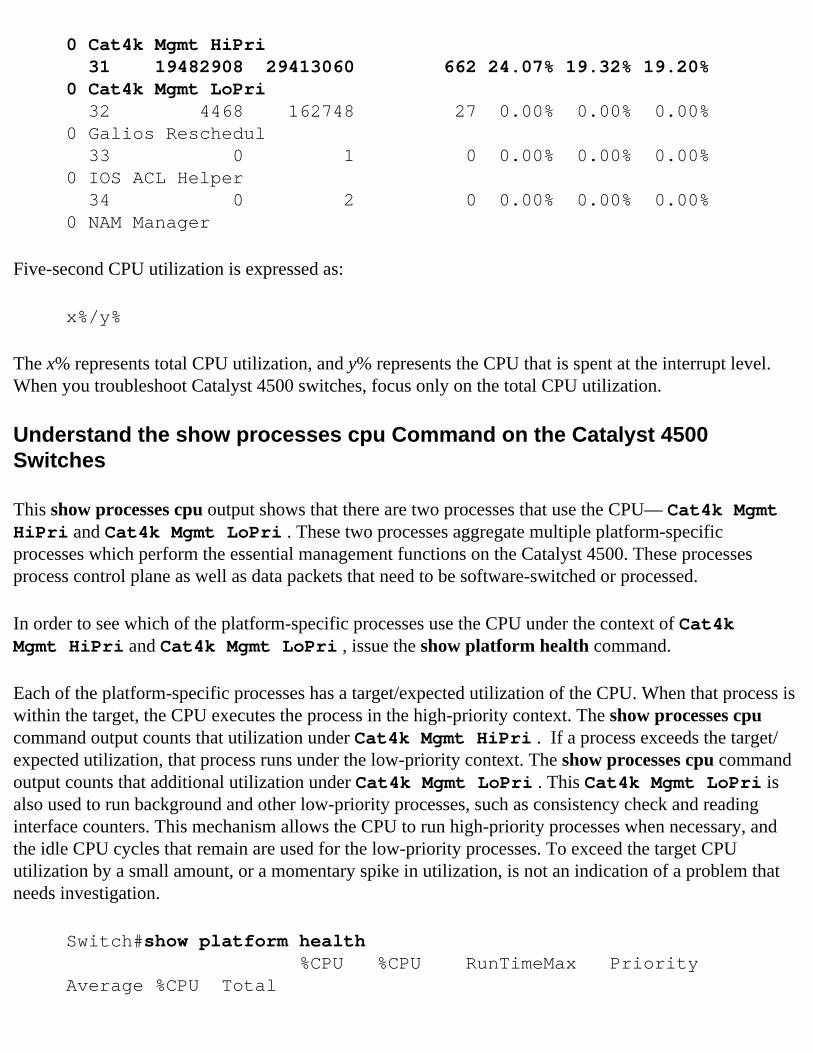
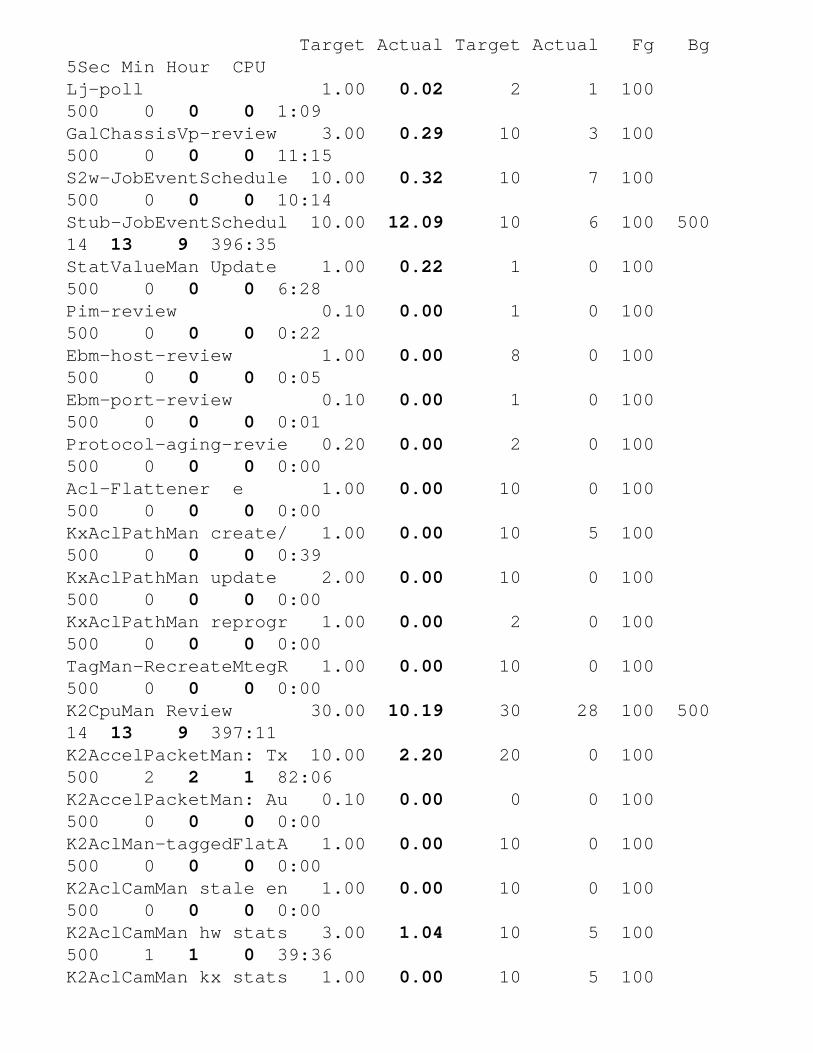
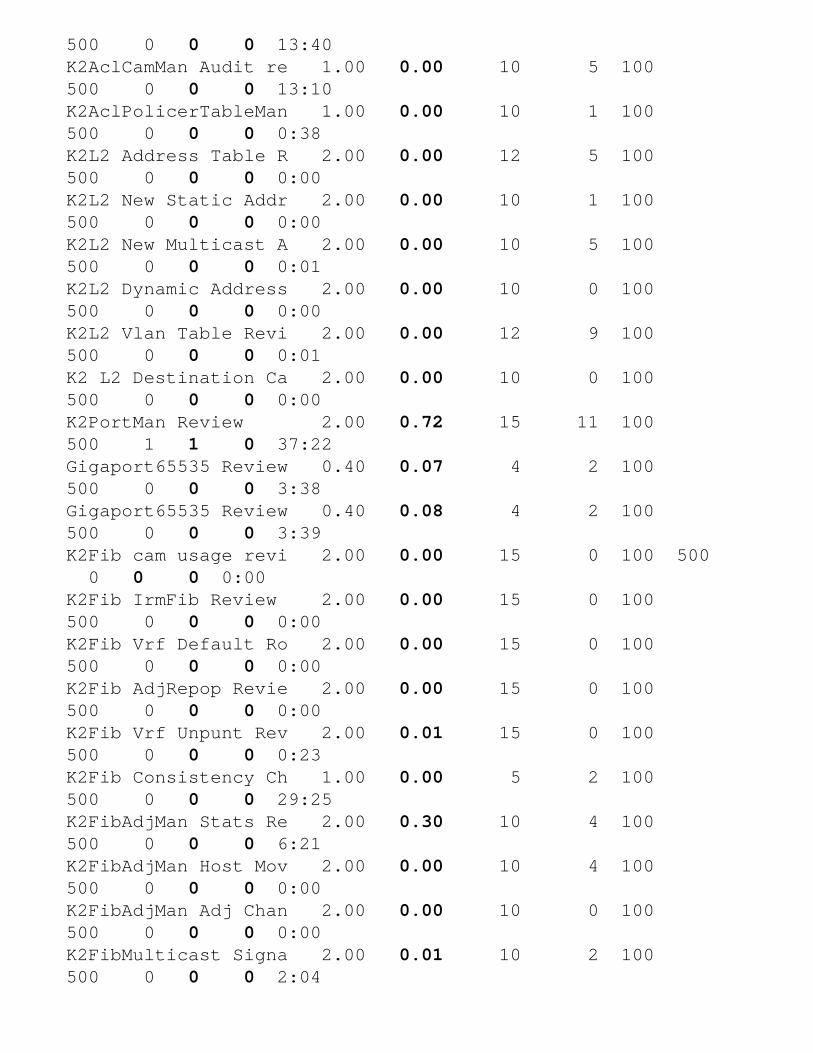
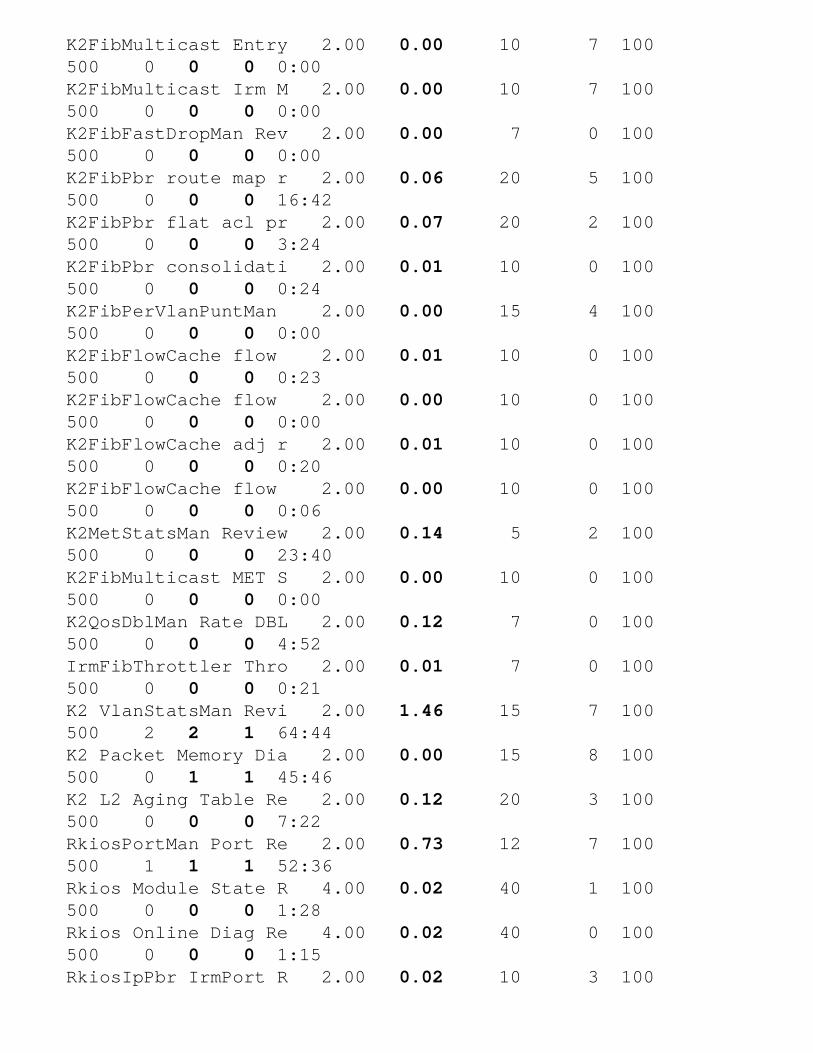
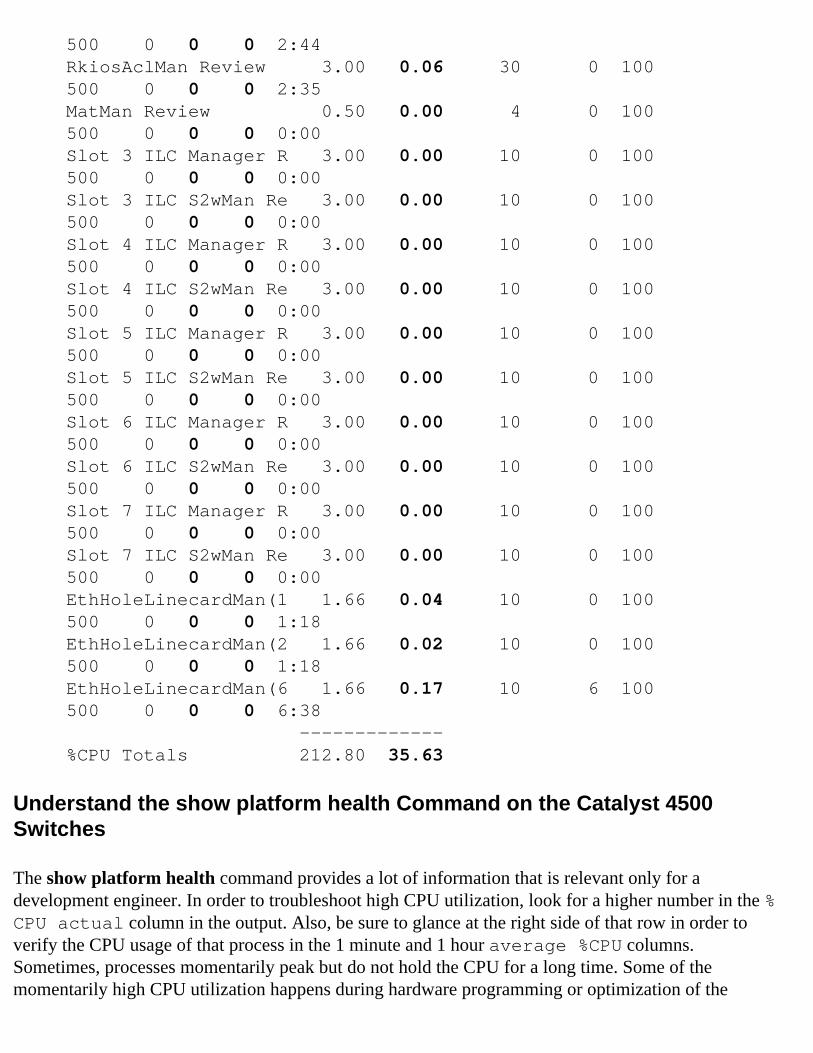
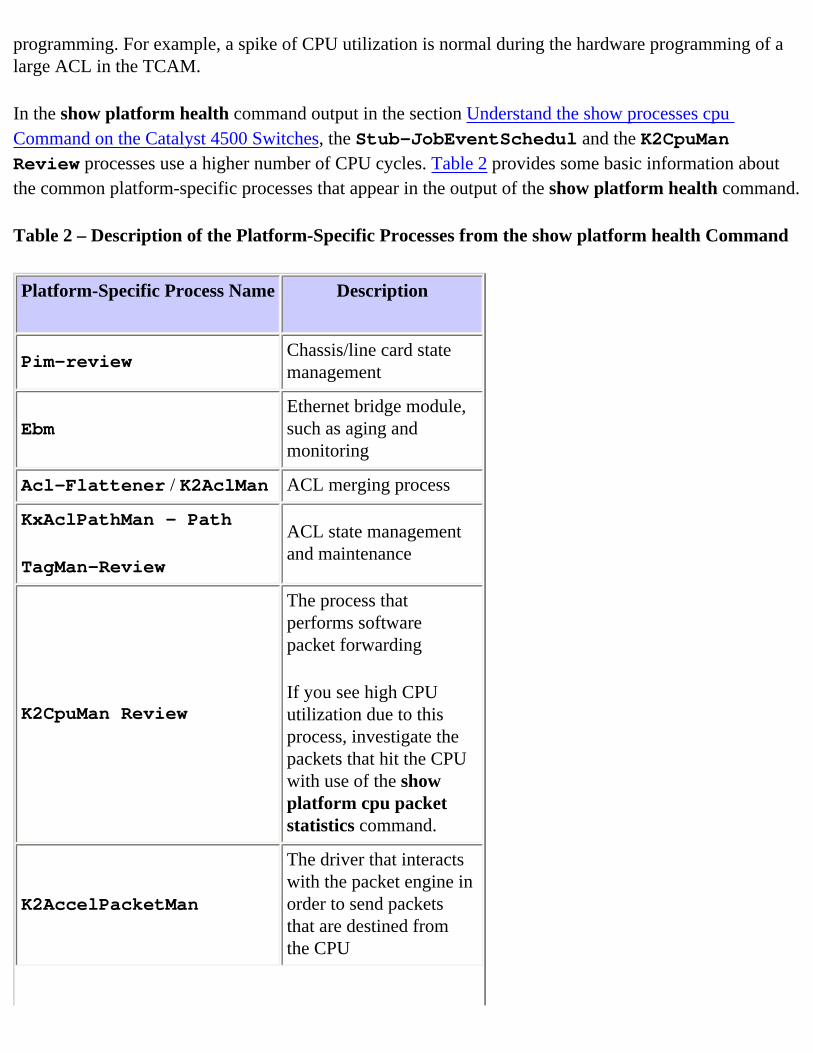
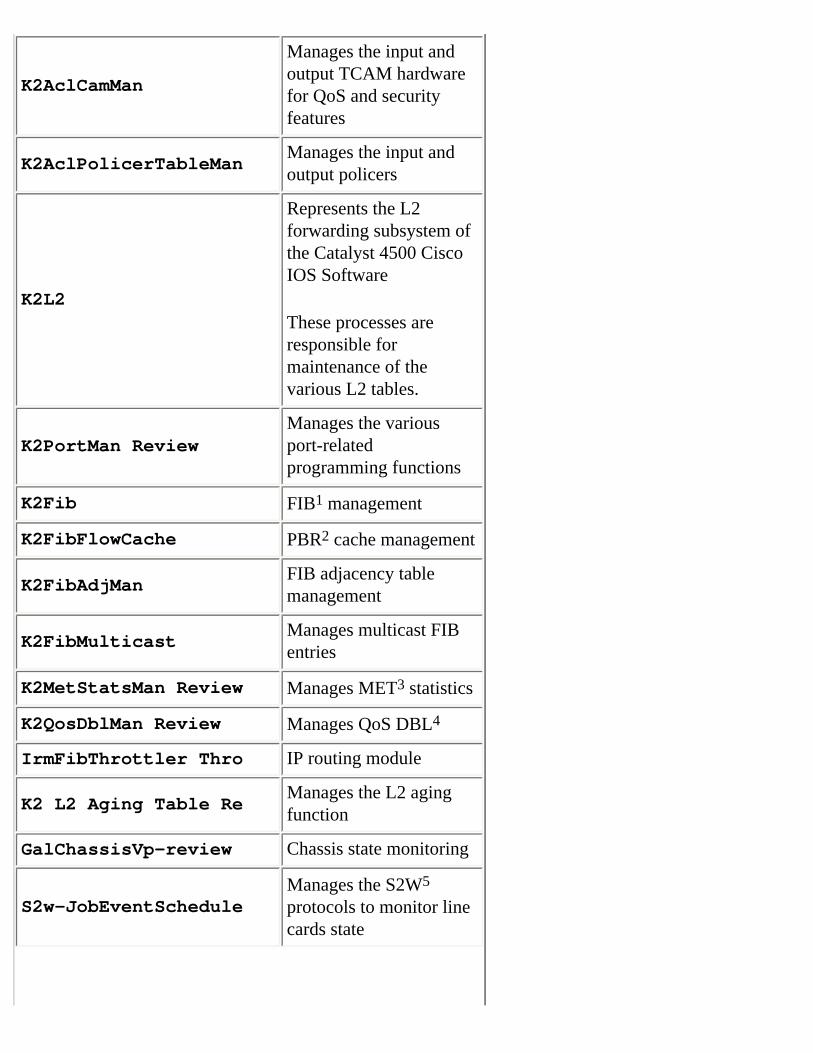
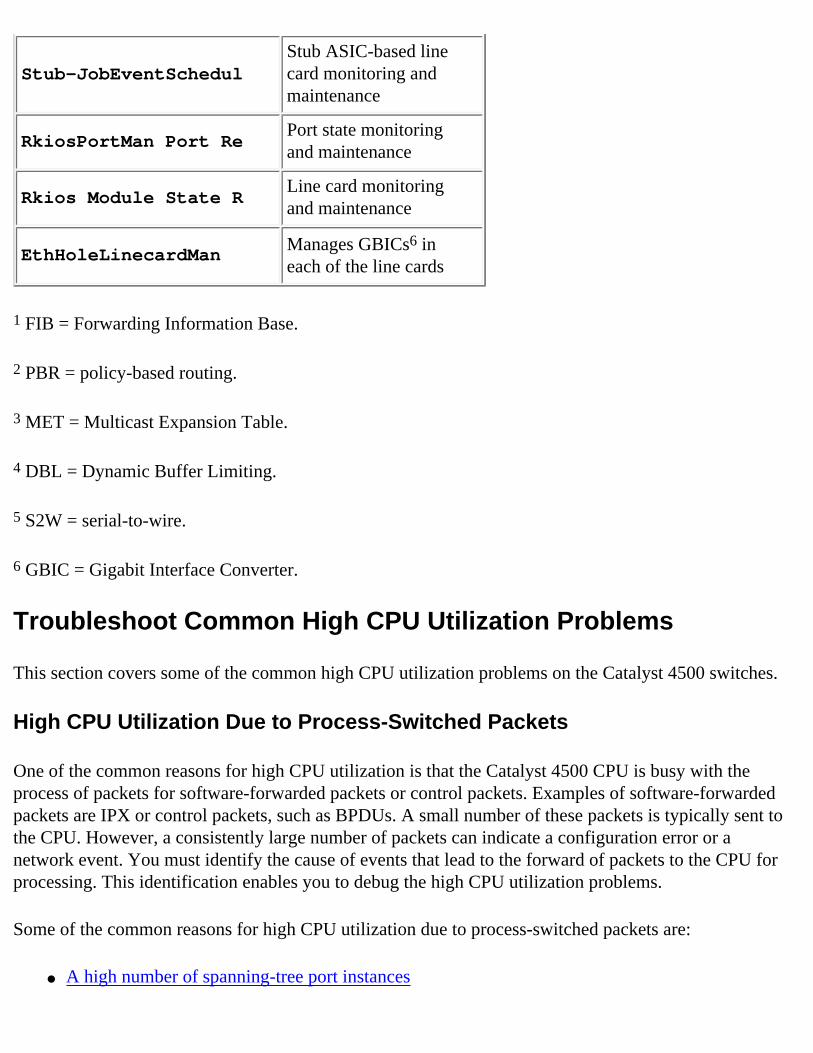
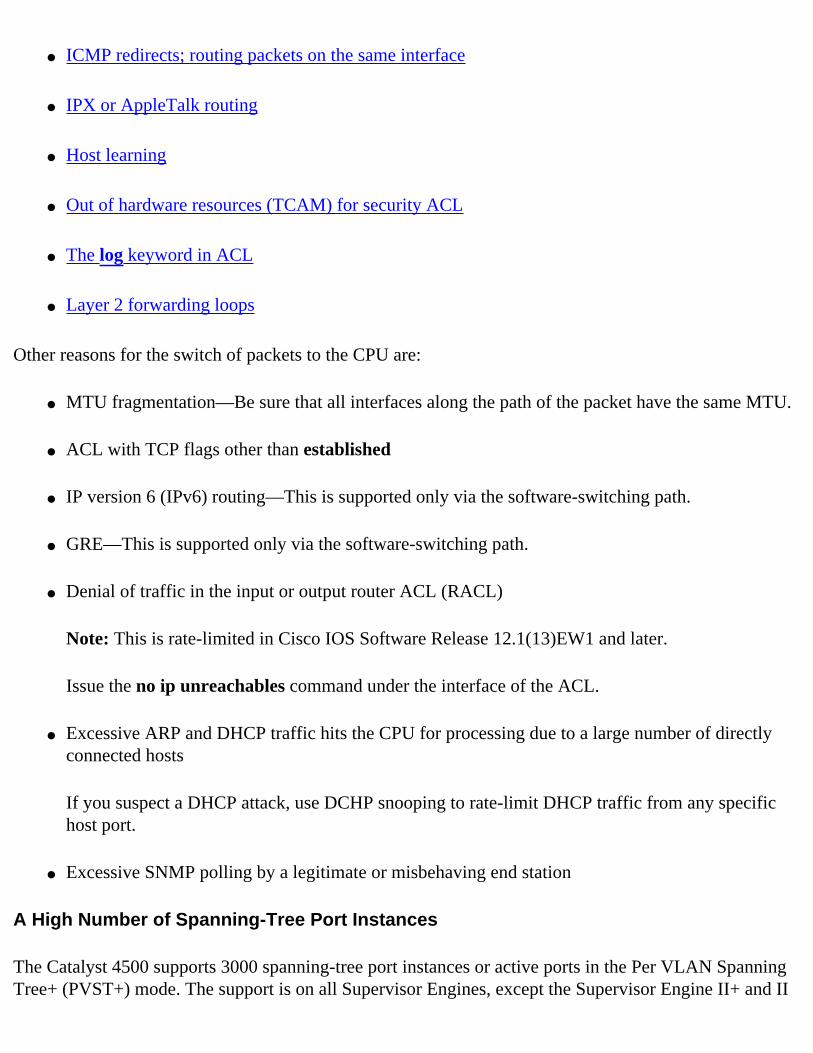
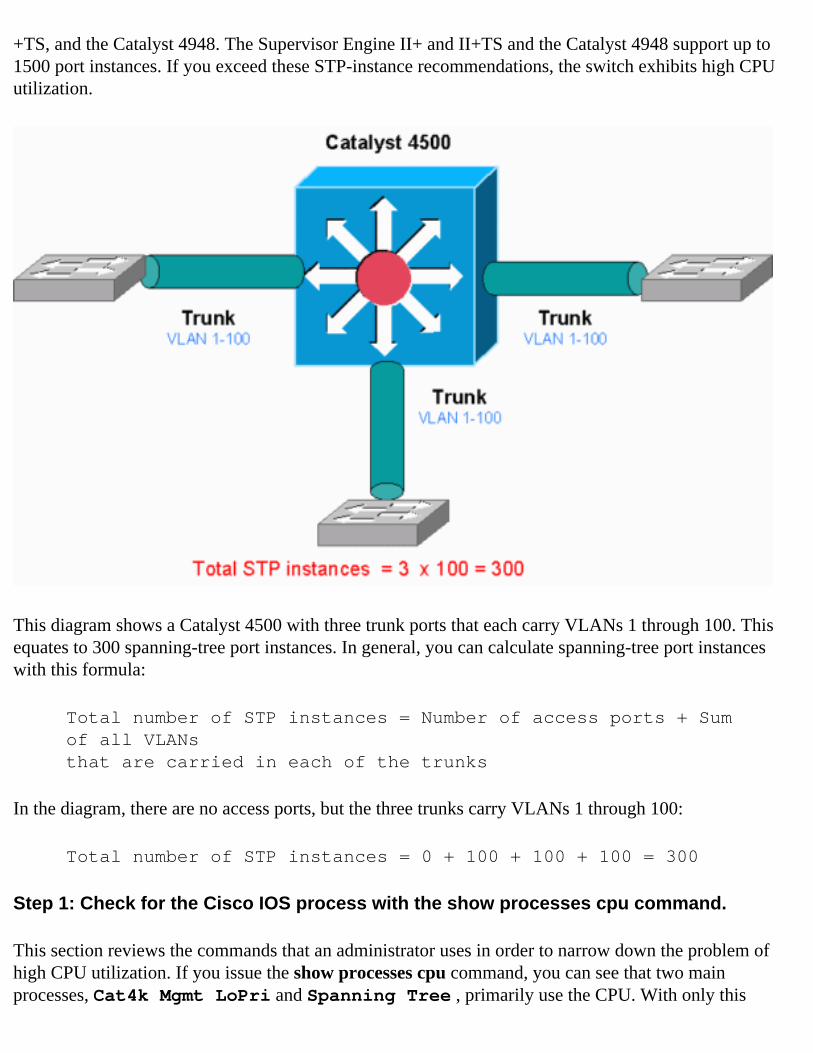
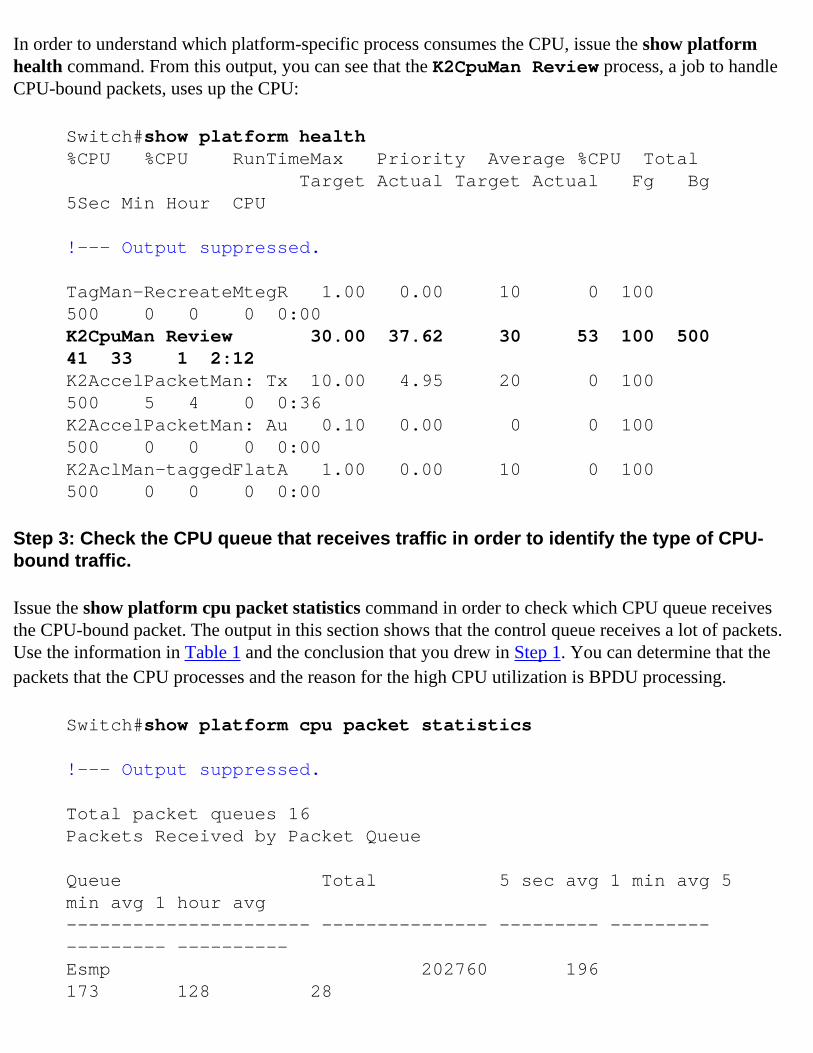
In order to understand which platform-specific process consumes the CPU issue the show platform health command From this output you can see that the K2CpuMan Review process a job to handle CPU-bound packets uses up the CPU
Switchshow platform health CPU CPU RunTimeMax Priority Average CPU Total Target Actual Target Actual Fg Bg 5Sec Min Hour CPU
--- Output suppressed
TagMan-RecreateMtegR 100 000 10 0 100 500 0 0 0 000K2CpuMan Review 3000 3762 30 53 100 500 41 33 1 212K2AccelPacketMan Tx 1000 495 20 0 100 500 5 4 0 036K2AccelPacketMan Au 010 000 0 0 100 500 0 0 0 000K2AclMan-taggedFlatA 100 000 10 0 100 500 0 0 0 000
Step 3 Check the CPU queue that receives traffic in order to identify the type of CPU-bound traffic
Issue the show platform cpu packet statistics command in order to check which CPU queue receives the CPU-bound packet The output in this section shows that the control queue receives a lot of packets Use the information in Table 1 and the conclusion that you drew in Step 1 You can determine that the packets that the CPU processes and the reason for the high CPU utilization is BPDU processing
Switchshow platform cpu packet statistics
--- Output suppressed
Total packet queues 16Packets Received by Packet Queue
Queue Total 5 sec avg 1 min avg 5 min avg 1 hour avg---------------------- --------------- --------- --------- --------- ----------Esmp 202760 196 173 128 28
Control 388623 2121 1740 598 16
Packets Dropped by Packet Queue
Queue Total 5 sec avg 1 min avg 5 min avg 1 hour avg---------------------- --------------- --------- --------- --------- ----------Control 17918 0 19 24 3
Step 4 Identify the root cause
Issue the show spanning-tree summary command You can check if the receipt of BPDUs is because of a high number of spanning-tree port instances The output clearly identifies the root cause
Switchshow spanning-tree summarySwitch is in pvst modeRoot bridge for noneExtended system ID is enabledPortfast Default is disabledPortFast BPDU Guard Default is disabledPortfast BPDU Filter Default is disabledLoopguard Default is disabledEtherChannel misconfig guard is enabledUplinkFast is disabledBackboneFast is disabledConfigured Pathcost method used is short
--- Output suppressed
Name Blocking Listening Learning Forwarding STP Active---------------------- -------- --------- -------- ---------- ----------2994 vlans 0 0 0 5999 5999
There are a large number of VLANs with the PVST+ mode configuration In order to resolve the issue change the STP mode to Multiple Spanning Tree (MST) In some cases the number of STP instances is high because a high number of VLANs are forwarded on all trunk ports In this case manually prune the VLANs that are not necessary from the trunk in order to drop the number of STP active ports to well
below the recommended value
Tip Be sure that you do not configure IP phone ports as trunk ports This is a common misconfiguration Configure IP phone ports with a voice VLAN configuration This configuration creates a pseudo trunk but does not require you to manually prune the unnecessary VLANs For more information on how to configure voice ports refer to the Configuring Voice Interfaces software configuration guide Non-Cisco IP phones do not support this voice VLAN or auxiliary VLAN configuration You must manually prune the ports with non-Cisco IP phones
ICMP Redirects Routing Packets on the Same Interface
Routing packets on the same interface or traffic ingress and egress on the same L3 interface can result in an ICMP redirect by the switch If the switch knows that the next hop device to the ultimate destination is in the same subnet as the sending device the switch generates ICMP redirect to the source The redirect messages indicate to the source to send the packet directly to the next hop device The messages indicate that the next hop device has a better route to the destination a route of one less hop than this switch
In the diagram in this section PC A communicates with the web server The default gateway of PC A points to the VLAN 100 interface IP address However the next hop router that enables the Catalyst 4500 to reach the destination is in the same subnet as PC A The best path in this case is to send directly to Router Catalyst 4500 sends an ICMP redirect message to PC A The message instructs PC A to send the packets destined to the web server via Router instead of via Catalyst 4500 However in most cases the end devices do not respond to the ICMP redirect The lack of response causes the Catalyst 4500 to spend a lot of CPU cycles on the generation of these ICMP redirects for all the packets that the Catalyst forwards via the same interface as the ingress packets
By default ICMP redirect is enabled In order to disable it use the no ip icmp redirects command Issue the command under the relevant SVI or L3 interface
Note Since ip icmp redirects is a default command it is not visible in the show running-configuration command output
Step 1 Check for the Cisco IOS process with the show processes cpu command
Issue the show processes cpu command You can see that two main processes Cat4k Mgmt LoPri and IP Input primarily use the CPU With only this information you know that the process of IP packets expends a sizable portion of the CPU
Switchshow processes cpu CPU utilization for five seconds 381 one minute 32
five minutes 32 PID Runtime(ms) Invoked uSecs 5Sec 1Min 5Min TTY Process 1 0 63 0 000 000 000 0 Chunk Manager 2 60 50074 1 000 000 000 0 Load Meter 3 0 1 0 000 000 000 0 Deferred Events
--- Output suppressed
27 524 250268 2 000 000 000 0 TTY Background 28 816 254843 3 000 000 000 0 Per-Second Jobs 29 101100 5053 20007 000 001 000 0 Per-minute Jobs 30 26057260 26720902 975 581 678 576 0 Cat4k Mgmt HiPri 31 19482908 29413060 662 1964 1820 2048 0 Cat4k Mgmt LoPri
--- Output suppressed
35 60 902 0 000 000 000 0 DHCP Snooping 36 504625304 645491491 781 7240 7263 7382 0 IP Input
Step 2 Check for the Catalyst 4500-specific process with the show platform health command
The output of the show platform health command confirms the use of the CPU in order to process CPU-bound packets
Switchshow platform health CPU CPU RunTimeMax Priority Average CPU Total Target Actual Target Actual Fg Bg 5Sec Min Hour CPU
--- Output suppressed
TagMan-RecreateMtegR 100 000 10 0 100 500 0 0 0 000K2CpuMan Review 33000 1918 150 79 25 500 20 19 18 579408K2AccelPacketMan Tx 1000 495 20 0 100 500 5 4 0 036K2AccelPacketMan Au 010 000 0 0 100 500 0 0 0 000K2AclMan-taggedFlatA 100 000 10 0 100 500 0 0 0 000
Step 3 Check the CPU queue that receives traffic in order to identify the type of CPU-bound traffic
Issue the show platform cpu packet statistics command in order to check which CPU queue receives the CPU-bound packet You can see that the L3 Fwd Low queue receives quite a lot of traffic
Switchshow platform cpu packet statistics
--- Output suppressed
Packets Received by Packet Queue
Queue Total 5 sec avg 1 min avg 5 min avg 1 hour avg---------------------- --------------- --------- --------- --------- ----------Esmp 48613268 38 39 38 39Control 142166648 74 74 73 73Host Learning 1845568 2 2 2 2L3 Fwd High 17 0 0 0 0L3 Fwd Medium 2626 0 0 0 0L3 Fwd Low 4717094264 3841 3879 3873 3547L2 Fwd Medium 1 0 0 0 0L3 Rx High 257147 0 0 0 0
L3 Rx Low 5325772 10 19 13 7RPF Failure 155 0 0 0 0ACL fwd(snooping) 65604591 53 54 54 53ACL log unreach 11013420 9 8 8 8
Step 4 Identify the root cause
In this case use the CPU SPAN in order to determine the traffic that hits the CPU For information about the CPU SPAN see the Tool 1 Monitor the CPU Traffic with SPANmdashCisco IOS Software Release 121(19)EW and Later section of this document Complete an analysis of the traffic and a configuration with use of the show running-configuration command In this case a packet is routed through the same interface which leads to the issue of an ICMP redirect for each packet This root cause is one of the common reasons for high CPU utilization on the Catalyst 4500
You may expect the sourcing device to act on the ICMP redirect that the Catalyst 4500 sends and change the next hop for the destination However not all devices respond to an ICMP redirect If the device does not respond the Catalyst 4500 must send redirects for every packet that the switch receives from the sending device These redirects can consume a great deal of CPU resources The solution is to disable ICMP redirect Issue the no ip redirects command under the interfaces
This scenario can occur when you also have configured secondary IP addresses When you enable the secondary IP addresses IP redirect is automatically disabled Be sure you do not manually enable the IP redirects
As this ICMP Redirects Routing Packets on the Same Interface section has indicated most end devices do not respond to ICMP redirects Therefore as a general practice disable this feature
IPX or AppleTalk Routing
The Catalyst 4500 supports IPX and AppleTalk routing via software-forwarding path only With the configuration of such protocols a higher CPU utilization is normal
Note The switching of IPX and AppleTalk traffic in the same VLAN does not require process switching Only packets that need to be routed require software path forwarding
Step 1 Check for the Cisco IOS process with the show processes cpu command
Issue the show processes cpu command in order to check which Cisco IOS process consumes the
CPU In this command output notice that the top process is the Cat4k Mgmt LoPri
witchshow processes cpu CPU utilization for five seconds 8710 one minute 86 five minutes 87 PID Runtime(ms) Invoked uSecs 5Sec 1Min 5Min TTY Process 1 4 53 75 000 000 000 0 Chunk Manager
--- Output suppressed
25 8008 1329154 6 000 000 000 0 Per-Second Jobs 26 413128 38493 10732 000 002 000 0 Per-minute Jobs 27 148288424 354390017 418 260 242 277 0 Cat4k Mgmt HiPri 28 285796820 720618753 396 5015 5972 6131 0 Cat4k Mgmt LoPri
Step 2 Check for the Catalyst 4500-specific process with the show platform health command
The output of the show platform health command confirms the use of the CPU in order to process CPU-bound packets
Switchshow platform health CPU CPU RunTimeMax Priority Average CPU Total Target Actual Target Actual Fg Bg 5Sec Min Hour CPU
--- Output suppressed
TagMan-RecreateMtegR 100 000 10 4 100 500 0 0 0 000K2CpuMan Review 3000 2739 30 53 100 500 42 47 42 4841K2AccelPacketMan Tx 1000 803 20 0 100 500 21 29 26 2704
Step 3 Check the CPU queue that receives traffic in order to identify the type of CPU-
bound traffic
In order to determine the type of traffic that hits the CPU issue the show platform cpu packet statistics command
Switchshow platform cpu packet statistics
--- Output suppressed
Packets Received by Packet Queue
Queue Total 5 sec avg 1 min avg 5 min avg 1 hour avg---------------------- --------------- --------- --------- --------- ----------Esmp 48613268 38 39 38 39Control 142166648 74 74 73 73Host Learning 1845568 2 2 2 2L3 Fwd High 17 0 0 0 0L3 Fwd Medium 2626 0 0 0 0L3 Fwd Low 1582414 1 1 1 1L2 Fwd Medium 1 0 0 0 0L2 Fwd Low 576905398 1837 1697 1938 1515L3 Rx High 257147 0 0 0 0L3 Rx Low 5325772 10 19 13 7RPF Failure 155 0 0 0 0ACL fwd(snooping) 65604591 53 54 54 53ACL log unreach 11013420 9 8 8 8
Step 4 Identify the root cause
Since the administrator has configured IPX or AppleTalk routing identification of the root cause should be straightforward But in order to confirm SPAN the CPU traffic and be sure that the traffic that you see is the expected traffic For information about the CPU SPAN see the Tool 1 Monitor the CPU Traffic with SPANmdashCisco IOS Software Release 121(19)EW and Later section of this document
In this case the administrator must update the baseline CPU to the current value The Catalyst 4500 CPU behaves as expected when the CPU processes software-switched packets
Host Learning
The Catalyst 4500 learns the MAC addresses of various hosts if the MAC address is not already in the MAC address table The switching engine forwards a copy of the packet with the new MAC address to the CPU
All the VLAN interfaces (layer 3) use the chassis base hardware address as their MAC address As a result there is not an entry in the MAC address table and the packets destined to these VLAN interfaces are not sent to the CPU for processing
If there is an excessive number of new MAC addresses for the switch to learn high CPU utilization can result
Step 1 Check for the Cisco IOS process with the show processes cpu command
Issue the show processes cpu command in order to check which Cisco IOS process consumes the CPU In this command output notice that the top process is the Cat4k Mgmt LoPri
Switchshow processes cpu CPU utilization for five seconds 891 one minute 74 five minutes 71 PID Runtime(ms) Invoked uSecs 5Sec 1Min 5Min TTY Process 1 4 53 75 000 000 000 0 Chunk Manager
--- Output suppressed
25 8008 1329154 6 000 000 000 0 Per-Second Jobs 26 413128 38493 10732 000 002 000 0 Per-minute Jobs 27 148288424 354390017 418 2647 1028 1011
0 Cat4k Mgmt HiPri 28 285796820 720618753 396 5271 5679 5570 0 Cat4k Mgmt LoPri
Step 2 Check for the Catalyst 4500-specific process with the show platform health command
The output of the show platform health command confirms the use of the CPU in order to process CPU-bound packets
Switchshow platform health CPU CPU RunTimeMax Priority Average CPU Total Target Actual Target Actual Fg Bg 5Sec Min Hour CPU
--- Output suppressed
TagMan-RecreateMtegR 100 000 10 4 100 500 0 0 0 000K2CpuMan Review 3000 4688 30 47 100 500 30 29 21 26501K2AccelPacketMan Tx 1000 803 20 0 100 500 21 29 26 2704
Step 3 Check the CPU queue that receives traffic in order to identify the type of CPU-bound traffic
In order to determine the type of traffic that hits the CPU issue the show platform cpu packet statistics command
Switchshow platform cpu packet statistics
--- Output suppressed
Packets Received by Packet Queue
Queue Total 5 sec avg 1 min avg 5 min avg 1 hour avg---------------------- --------------- --------- --------- --------- ----------Esmp 48613268 38 39 38 39
Control 142166648 74 74 73 73Host Learning 1845568 1328 1808 1393 1309L3 Fwd High 17 0 0 0 0L3 Fwd Medium 2626 0 0 0 0L3 Fwd Low 1582414 1 1 1 1L2 Fwd Medium 1 0 0 0 0L2 Fwd Low 576905398 37 7 8 5L3 Rx High 257147 0 0 0 0L3 Rx Low 5325772 10 19 13 7RPF Failure 155 0 0 0 0ACL fwd(snooping) 65604591 53 54 54 53ACL log unreach 11013420 9 8 8 8
Step 4 Identify the root cause
The output of the show platform health command shows you that the CPU sees a lot of new MAC addresses This situation is often the result of network topology instability For example if the spanning-tree topology changes the switch generates Topology Change Notifications (TCNs) The issue of TCNs reduces the aging time to 15 seconds in PVST+ mode MAC address entries are flushed if the addresses are not learned back within the time period In the case of Rapid STP (RSTP) (IEEE 8021w) or MST (IEEE 8021s) the entries immediately age out if the TCN comes from another switch This age out causes MAC addresses to be learned anew This is not a major issue if the topology changes are rare But there can be an excessive number of topology changes because of a flapping link faulty switch or host ports that are not enabled for PortFast A large number of MAC table flushes and subsequent relearning can result The next step in root cause identification is to troubleshoot the network The switch works as expected and sends the packets to the CPU for host address learning Identify and fix the faulty device that results in excessive TCNs
Your network can have a lot of devices that send traffic in bursts which causes MAC addresses to be aged out and subsequently relearned on the switch In this case increase the MAC address table aging time in order to provide some relief With a longer aging time the switches retain the device MAC
addresses in the table for a longer period of time before the age out
Caution Make this age-out change only after careful consideration The change can lead to a traffic black hole if you have devices in your network which are mobile
Out of Hardware Resources (TCAM) for Security ACL
The Catalyst 4500 programs the configured ACLs with use of the Cisco TCAM TCAM allows for the application of the ACLs in the hardware-forwarding path There is no impact on performance of the switch with or without ACLs in the forwarding path Performance is constant despite the size of the ACL because performance of the ACL lookups is at line rate However TCAM is a finite resource Therefore if you configure an excessive number of ACL entries you exceed the TCAM capacity Table 3 shows the number of TCAM resources available on each of the Catalyst 4500 Supervisor Engines and switches
Table 3 ndash TCAM Capacity on Catalyst 4500 Supervisor EnginesSwitches
ProductFeature TCAM (per Direction)
QoS TCAM (per Direction)
Supervisor Engine II+II+TS
8192 entries with 1024 masks
8192 entries with 1024 masks
Supervisor Engine IIIIVV and Catalyst 4948
16384 entries with 2048 masks
16384 entries with 2048 masks
Supervisor Engine V-10GE and Catalyst 4948-10GE
16384 entries with 16384 masks
16384 entries with 16384 masks
The switch uses the feature TCAM in order to program the security ACL such as RACL and VLAN ACL (VACL) The switch also uses the feature TCAM for security features like IP Source Guard (IPSG) for dynamic ACLs The switch uses the QoS TCAM in order to program classification and policer ACLs
When the Catalyst 4500 runs out of TCAM resources during the programming of a security ACL a partial application of the ACL occurs via the software path The packets that hit those ACEs are processed in software which causes high CPU utilization ACL is programmed from the top down In other words if the ACL does not fit into the TCAM the ACE at the bottom portion of the ACL likely is not programmed in the TCAM
This warning message appears when a TCAM overflow happens
C4K_HWACLMAN-4-ACLHWPROGERRREASON (Suppressed 1times) Input(null 12Normal) Security 140 - insufficient hardware TCAM masksC4K_HWACLMAN-4-ACLHWPROGERR (Suppressed 4 times) Input Security 140 - hardware TCAM limit some packet processing will be software switched
You can see this error message in the show logging command output The message conclusively indicates that some software processing will take place and consequently there can be high CPU utilization
Note If you change a large ACL you can see this message briefly before the changed ACL is programmed again in the TCAM
Step 1 Check for the Cisco IOS process with the show processes cpu command
Issue the show processes cpu command You can see that the CPU utilization is high because the Cat4k Mgmt LoPri process takes up most of the CPU cycles
Switchshow processes cpuCPU utilization for five seconds 990 one minute 99 five minutes 99 PID Runtime(ms) Invoked uSecs 5Sec 1Min 5Min TTY Process 1 0 11 0 000 000 000 0 Chunk Manager 2 9716 632814 15 000 000 000 0 Load Meter 3 780 302 2582 000 000 000 0 SpanTree Helper
--- Output suppressed
23 18208 3154201 5 000 000 000 0 TTY Background 24 37208 3942818 9 000 000 000 0 Per-Second Jobs 25 1046448 110711 9452 000 003 000 0 Per-minute Jobs
26 175803612 339500656 517 412 431 448 0 Cat4k Mgmt HiPri 27 835809548 339138782 2464 8681 8920 8976 0 Cat4k Mgmt LoPri 28 28668 2058810 13 000 000 000 0 Galios Reschedul
Step 2 Check for the Catalyst 4500-specific process with the show platform health command
Issue the show platform health command You can see that the K2CpuMan Review a job to handle CPU-bound packets uses the CPU
Switchshow platform health CPU CPU RunTimeMax Priority Average CPU Total Target Actual Target Actual Fg Bg 5Sec Min Hour CPULj-poll 100 001 2 0 100 500 0 0 0 1345GalChassisVp-review 300 020 10 16 100 500 0 0 0 8844S2w-JobEventSchedule 1000 057 10 7 100 500 1 0 0 40422Stub-JobEventSchedul 1000 000 10 0 100 500 0 0 0 000StatValueMan Update 100 009 1 0 100 500 0 0 0 9133Pim-review 010 000 1 0 100 500 0 0 0 446Ebm-host-review 100 000 8 4 100 500 0 0 0 1401Ebm-port-review 010 000 1 0 100 500 0 0 0 020Protocol-aging-revie 020 000 2 0 100 500 0 0 0 001Acl-Flattener 100 000 10 5 100 500 0 0 0 004KxAclPathMan create 100 000 10 5 100 500 0 0 0 021KxAclPathMan update 200 000 10 6 100 500 0 0 0 005KxAclPathMan reprogr 100 000 2 1 100 500 0 0 0 000
TagMan-InformMtegRev 100 000 5 0 100 500 0 0 0 000TagMan-RecreateMtegR 100 000 10 14 100 500 0 0 0 018K2CpuMan Review 3000 9131 30 92 100 500 128 119 84 1303902K2AccelPacketMan Tx 1000 230 20 0 100 500 2 2 2 134530K2AccelPacketMan Au 010 000 0 0 100 500 0 0 0 000
Step 3 Check the CPU queue that receives traffic in order to identify the type of CPU-bound traffic
You need to further understand which CPU queue and therefore what type of traffic hits the CPU queue Issue the show platform cpu packet statistics command You can see that the ACL sw processing queue receives a high number of packets Therefore TCAM overflow is the cause of this high CPU utilization issue
Switchshow platform cpu packet statistics
--- Output suppressed
Packets Received by Packet Queue
Queue Total 5 sec avg 1 min avg 5 min avg 1 hour avg---------------------- --------------- --------- --------- --------- ----------Control 57902635 22 16 12 3Host Learning 464678 0 0 0 0L3 Fwd Low 623229 0 0 0 0L2 Fwd Low 11267182 7 4 6 1L3 Rx High 508 0 0 0 0L3 Rx Low 1275695 10 1 0 0ACL fwd(snooping) 2645752 0 0 0 0
ACL log unreach 51443268 9 4 5 5ACL sw processing 842889240 1453 1532 1267 1179
Packets Dropped by Packet Queue
Queue Total 5 sec avg 1 min avg 5 min avg 1 hour avg---------------------- --------------- --------- --------- --------- ----------L2 Fwd Low 3270 0 0 0 0ACL sw processing 12636 0 0 0 0
Step 4 Resolve the issue
In Step 3 you determined the root cause in this scenario Remove the ACL which caused the overflow or minimize the ACL to avoid overflow Also review the Configuring Network Security with ACLs configuration guideline in order to optimize the ACL configuration and programming in the hardware
The log Keyword in ACL
The Catalyst 4500 supports logging of packets detail that hit any specific ACL entry but excessive logging can cause high CPU utilization Avoid the use of log keywords except during the traffic discovery stage During the traffic discovery stage you identify the traffic that flows through your network for which you have not explicitly configured ACEs Do not use the log keyword in order to gather statistics In Cisco IOS Software Release 121(13)EW and later the log messages are rate-limited If you use log messages in order to count the number of packets that match the ACL the count is not accurate Instead use the show access-list command for accurate statistics Identification of this root cause is easier because a review of the configuration or log messages can indicate the use of the ACL logging feature
Step 1 Check for the Cisco IOS process with the show processes cpu command
Issue the show processes cpu in order to check which Cisco IOS process consumes the CPU In this command output you find that the top process is the Cat4k Mgmt LoPri
Switchshow processes cpu CPU utilization for five seconds 990 one minute 99 five minutes 99
PID Runtime(ms) Invoked uSecs 5Sec 1Min 5Min TTY Process 1 0 11 0 000 000 000 0 Chunk Manager 2 9716 632814 15 000 000 000 0 Load Meter
--- Output suppressed
26 175803612 339500656 517 412 431 448 0 Cat4k Mgmt HiPri 27 835809548 339138782 2464 8681 8920 8976 0 Cat4k Mgmt LoPri 28 28668 2058810 13 000 000 000 0 Galios Reschedul
Step 2 Check for the Catalyst 4500-specific process with the show platform health command
Check the platform-specific process that uses the CPU Issue the show platform health command In the output notice that the K2CpuMan Review process uses most of the CPU cycles This activity indicates that the CPU is busy as it processes packets destined to it
Switchshow platform health CPU CPU RunTimeMax Priority Average CPU Total Target Actual Target Actual Fg Bg 5Sec Min Hour CPULj-poll 100 001 2 0 100 500 0 0 0 1345GalChassisVp-review 300 020 10 16 100 500 0 0 0 8844S2w-JobEventSchedule 1000 057 10 7 100 500 1 0 0 40422Stub-JobEventSchedul 1000 000 10 0 100 500 0 0 0 000StatValueMan Update 100 009 1 0 100 500 0 0 0 9133Pim-review 010 000 1 0 100 500 0 0 0 446Ebm-host-review 100 000 8 4 100 500 0 0 0 1401Ebm-port-review 010 000 1 0 100
500 0 0 0 020Protocol-aging-revie 020 000 2 0 100 500 0 0 0 001Acl-Flattener 100 000 10 5 100 500 0 0 0 004KxAclPathMan create 100 000 10 5 100 500 0 0 0 021KxAclPathMan update 200 000 10 6 100 500 0 0 0 005KxAclPathMan reprogr 100 000 2 1 100 500 0 0 0 000TagMan-InformMtegRev 100 000 5 0 100 500 0 0 0 000TagMan-RecreateMtegR 100 000 10 14 100 500 0 0 0 018K2CpuMan Review 3000 9131 30 92 100 500 128 119 84 1303902K2AccelPacketMan Tx 1000 230 20 0 100 500 2 2 2 134530K2AccelPacketMan Au 010 000 0 0 100 500 0 0 0 000
Step 3 Check the CPU queue that receives traffic in order to identify the type of CPU-bound traffic
In order to determine the type of traffic that hits the CPU issue the show platform cpu packet statistics command In this command output you can see that the receipt of packets is due to the ACL log keyword
Switchshow platform cpu packet statistics
--- Output suppressed
Total packet queues 16Packets Received by Packet Queue
Queue Total 5 sec avg 1 min avg 5 min avg 1 hour avg----------------- -------------------- --------- --------- --------- ----------Control 1198701435 35 35 34 35Host Learning 874391 0
0 0 0L3 Fwd High 428 0 0 0 0L3 Fwd Medium 12745 0 0 0 0L3 Fwd Low 2420401 0 0 0 0L2 Fwd High 26855 0 0 0 0L2 Fwd Medium 116587 0 0 0 0L2 Fwd Low 317829151 53 41 31 31L3 Rx High 2371 0 0 0 0L3 Rx Low 32333361 7 1 2 0RPF Failure 4127 0 0 0 0ACL fwd (snooping) 107743299 4 4 4 4ACL log unreach 1209056404 1987 2125 2139 2089
Packets Dropped by Packet Queue
Queue Total 5 sec avg 1 min avg 5 min avg 1 hour avg----------------- -------------------- --------- --------- --------- ----------ACL log unreach 193094788 509 362 437 394
Step 4 Resolve the issue
In Step 3 you determined the root cause in this scenario In order to prevent this problem remove the log keyword from the ACLs In Cisco IOS Software Release 121(13)EW1 and later the packets are rate-limited so that CPU utilization does not get too high Use the access list counters as a way to keep track of ACL hits You can see the access list counters in the show access-list acl_id command output
Layer 2 forwarding loops
Layer 2 forwarding loops can be caused by poor implementation of Spanning Tree Protocol (STP) and
various issues that can affect STP
Step 1 Check for the Cisco IOS process with the show processes cpu command
This section reviews the commands that an administrator uses in order to narrow down the problem of high CPU utilization If you issue the show processes cpu command you can see that two main processes Cat4k Mgmt LoPri and Spanning Tree primarily use the CPU With only this information you know that the spanning tree process consumes a sizable portion of the CPU cycles
Switchshow processes cpu CPU utilization for five seconds 741 one minute 73 five minutes 50 PID Runtime(ms) Invoked uSecs 5Sec 1Min 5Min TTY Process 1 4 198 20 000 000 000 0 Chunk Manager 2 4 290 13 000 000 000 0 Load Meter
--- Output suppressed
25 488 33 14787 000 002 000 0 Per-minute Jobs 26 90656 223674 405 679 690 722 0 Cat4k Mgmt HiPri 27 158796 59219 2681 3255 3380 2143 0 Cat4k Mgmt LoPri 28 20 1693 11 000 000 000 0 Galios Reschedul 29 0 1 0 000 000 000 0 IOS ACL Helper 30 0 2 0 000 000 000 0 NAM Manager
--- Output suppressed
41 0 1 0 000 000 000 0 SFF8472 42 0 2 0 000 000 000 0 AAA Dictionary R 43 78564 20723 3791 3263 3003 1735 0 Spanning Tree 44 112 999 112 000 000 000
0 DTP Protocol 45 0 147 0 000 000 000 0 Ethchnl
Step 2 Check for the Catalyst 4500-specific process with the show platform health command
In order to understand which platform-specific process consumes the CPU issue the show platform health command From this output you can see that the K2CpuMan Review process a job to handle CPU-bound packets uses up the CPU
Switchshow platform health CPU CPU RunTimeMax Priority Average CPU Total Target Actual Target Actual Fg Bg 5Sec Min Hour CPU
--- Output suppressed
TagMan-RecreateMtegR 100 000 10 0 100 500 0 0 0 000K2CpuMan Review 3000 3762 30 53 100 500 41 33 1 212K2AccelPacketMan Tx 1000 495 20 0 100 500 5 4 0 036K2AccelPacketMan Au 010 000 0 0 100 500 0 0 0 000K2AclMan-taggedFlatA 100 000 10 0 100 500 0 0 0 000
Step 3 Check the CPU queue that receives traffic in order to identify the type of CPU-bound traffic
Issue the show platform cpu packet statistics command in order to check which CPU queue receives the CPU-bound packet The output in this section shows that the control queue receives a lot of packets Use the information in Table 1 and the conclusion that you drew in Step 1 You can determine that the packets that the CPU processes and the reason for the high CPU utilization is BPDU processing
Switchshow platform cpu packet statistics
--- Output suppressed
Total packet queues 16Packets Received by Packet Queue
Queue Total 5 sec avg 1 min avg 5 min avg 1 hour avg---------------------- --------------- --------- --------- --------- ----------Esmp 202760 196 173 128 28Control 388623 2121 1740 598 16
Packets Dropped by Packet Queue
Queue Total 5 sec avg 1 min avg 5 min avg 1 hour avg---------------------- --------------- --------- --------- --------- ----------Control 17918 0 19 24 3
Step 4 Identify the root cause and fix the issue
Generally you can complete these steps in order to troubleshoot (depending on the situation some steps are not be necessary)
1 Identify the loop
2 Discover the scope of the loop
3 Break the loop
4 Fix the cause for the loop
5 Restore redunancy
Each of the steps are explained in detail at Troubleshooting Forwarding Loops - Troubleshooting STP on Catalyst Switches Running Cisco IOS System Software
Step 5 Implement advanced STP features
BDPU GuardmdashSecures STP from unauthorized network devices connected to portfast enabled ports Refer to Spanning Tree PortFast BPDU Guard Enhancement for more information
Loop GuardmdashIncreases the stability of layer 2 networks Refer to Spanning-Tree Protocol Enhancements using Loop Guard and BPDU Skew Detection Features for more information
Root GuardmdashEnforces root bridge placement in the network Refer to Spanning Tree Protocol Root Guard Enhancement for more information
UDLDmdashDetects unidirectional links and prevents forwarding loops Refer to Understanding and Configuring the Unidirectional Link Detection Protocol Feature for more information
Other Causes of High CPU Utilization
These are some other known causes of high CPU utilization
Excessive link flaps
Spikes in CPU utilization due to FIB consistency check
High CPU utilization in the K2FibAdjMan Host Move process
High CPU utilization in the RkiosPortMan Port Review process
High CPU utilization when connected to an IP phone with the use of trunk ports
High CPU Utilization with RSPAN and Layer 3 Control Packets
Spike during large ACL programming
The spike in CPU utilization occurs during application or removal of a large ACL from an interface
Excessive Link Flaps
The Catalyst 4500 exhibits high CPU utilization when one or more of the attached links starts to flap excessively This situation occurs in Cisco IOS Software releases earlier than Cisco IOS Software Release 122(20)EWA
Step 1 Check for the Cisco IOS process with the show processes cpu command
Issue the show processes cpu command in order to check which Cisco IOS process consumes the CPU In this command output notice that the top process is the Cat4k Mgmt LoPri
Switchshow processes cpu CPU utilization for five seconds 960 one minute 76 five minutes 68 PID Runtime(ms) Invoked uSecs 5Sec 1Min 5Min TTY Process 1 0 4 0 000 000 000 0 Chunk Manager 2 9840 463370 21 000 000 000 0 Load Meter 3 0 2 0 000 000 000 0 SNMP Timers
--- Output suppressed
27 232385144 530644966 437 1398 1265 1216 0 Cat4k Mgmt HiPri 28 564756724 156627753 3605 6474 6071 5475 0 Cat4k Mgmt LoPri 29 9716 1806301 5 000 000 000 0 Galios Reschedul
Step 2 Check for the Catalyst 4500-specific process with the show platform health command
The output of the show platform health command indicates that the KxAclPathMan create process uses up the CPU This process is for internal path creation
Switchshow platform health CPU CPU RunTimeMax Priority Average CPU Total Target Actual Target Actual Fg Bg 5Sec Min Hour CPULj-poll 100 003 2 0 100 500 0 0 0 949GalChassisVp-review 300 111 10 62 100 500 0 0 0 3739S2w-JobEventSchedule 1000 285 10 8 100 500 2 2 2 9000Stub-JobEventSchedul 1000 527 10 9 100 500 4 4 4 1862Pim-review 010 000 1 0 100 500 0 0 0 251
Ebm-host-review 100 000 8 4 100 500 0 0 0 806Ebm-port-review 010 000 1 0 100 500 0 0 0 014Protocol-aging-revie 020 000 2 0 100 500 0 0 0 000Acl-Flattener 100 000 10 5 100 500 0 0 0 000KxAclPathMan create 100 6911 10 5 100 500 42 53 22 7150KxAclPathMan update 200 076 10 6 100 500 0 0 0 8600KxAclPathMan reprogr 100 000 2 1 100 500 0 0 0 000TagMan-InformMtegRev 100 000 5 0 100 500 0 0 0 000TagMan-RecreateMtegR 100 000 10 227 100 500 0 0 0 000K2CpuMan Review 3000 805 30 57 100 500 6 5 5 2150K2AccelPacketMan Tx 1000 686 20 0 100 500 5 5 4 7842
Step 3 Identify the root cause
Enable logging for link updown messages This logging is not enabled by default The enablement helps you to narrow down the offending links very quickly Issue the logging event link-status command under all the interfaces You can use the interface range command in order to conveniently enable on a range of interfaces as this example shows
Switchconfigure terminalEnter configuration commands one per line End with CNTLZSwitch(config)interface range gigabitethernet 51 - 48Switch(config-if-range)logging event link-statusSwitch(config--if-range)end
Switchshow logging
--- Output suppressed
3w5d LINK-3-UPDOWN Interface GigabitEthernet524 changed state to down3w5d LINK-3-UPDOWN Interface GigabitEthernet524 changed
state to up3w5d LINK-3-UPDOWN Interface GigabitEthernet524 changed state to down3w5d LINK-3-UPDOWN Interface GigabitEthernet524 changed state to up3w5d LINK-3-UPDOWN Interface GigabitEthernet524 changed state to down3w5d LINK-3-UPDOWN Interface GigabitEthernet524 changed state to up
After you have identified the faulty or flapping interface shut down the interface in order to resolve the high CPU utilization issue Cisco IOS Software Release 122(20)EWA and later have improved the Catalyst 4500 behavior for this flapping-links condition Therefore the impact on the CPU is not as great as before the improvement Remember that this process is a background process High CPU utilization because of this issue does not cause adverse effects on the Catalyst 4500 switches
Spikes in CPU Utilization Due to FIB Consistency Check
The Catalyst 4500 can show momentary spikes in the CPU utilization during a FIB table consistency check The FIB table is the L3 forwarding table that the CEF process creates The consistency check maintains consistency between the Cisco IOS Software FIB table and the hardware entries This consistency ensures that packets are not misrouted The check occurs every 2 seconds and runs as a low-priority background process This process is normal behavior and does not interfere with other high-priority processes or packets
The output of the show platform health command shows that K2Fib Consistency Ch consumes most of the CPU
Note The average CPU utilization for this process is insignificant over a minute or an hour which confirms that the check is a short periodic review This background process only uses the idle CPU cycles
Switchshow platform health CPU CPU RunTimeMax Priority Average CPU Total Target Actual Target Actual Fg Bg 5Sec Min Hour CPULj-poll 100 002 2 1 100 500 0 0 0 109GalChassisVp-review 300 029 10 3 100 500 0 0 0 1115
--- Output suppressed
K2Fib cam usage revi 200 000 15 0 100 500 0 0 0 000K2Fib IrmFib Review 200 000 15 0 100 500 0 0 0 000K2Fib Vrf Default Ro 200 000 15 0 100 500 0 0 0 000K2Fib AdjRepop Revie 200 000 15 0 100 500 0 0 0 000K2Fib Vrf Unpunt Rev 200 001 15 0 100 500 0 0 0 023K2Fib Consistency Ch 100 6040 5 2 100 500 0 0 0 10023K2FibAdjMan Stats Re 200 030 10 4 100 500 0 0 0 621K2FibAdjMan Host Mov 200 000 10 4 100 500 0 0 0 000K2FibAdjMan Adj Chan 200 000 10 0 100 500 0 0 0 000K2FibMulticast Signa 200 001 10 2 100 500 0 0 0 204
High CPU Utilization in the K2FibAdjMan Host Move Process
The Catalyst 4500 can display high CPU utilization in the K2FibAdjMan Host Move process This high utilization appears in the output of the show platform health command Many MAC addresses frequently expire or are learned on new ports which causes this high CPU utilization The default value of mac-address-table aging-time is 5 minutes or 300 seconds The workaround for this issue is to increase the MAC address aging time or you can engineer the network in order to avoid the high number of MAC address moves Cisco IOS Software Release 122(18)EW and later have enhanced this process behavior in order to consume less CPU Refer to Cisco bug ID CSCed15021 ( registered customers only)
Switchshow platform health CPU CPU RunTimeMax Priority Average CPU Total Target Actual Target Actual Fg Bg 5Sec Min Hour CPULj-poll 100 002 2 1 100 500 0 0 0 109GalChassisVp-review 300 029 10 3 100 500 0 0 0 1115S2w-JobEventSchedule 1000 032 10 7 100 500 0 0 0 1014
--- Output suppressed
K2FibAdjMan Stats Re 200 030 10 4 100 500 0 0 0 621K2FibAdjMan Host Mov 200 1868 10 4 100 500 25 29 28 213439K2FibAdjMan Adj Chan 200 000 10 0 100 500 0 0 0 000K2FibMulticast Signa 200 001 10 2 100 500 0 0 0 204K2FibMulticast Entry 200 000 10 7 100 500 0 0 0 000
You can modify the maximum aging time of a MAC address in the global configuration mode The command syntax is mac-address-table aging-time seconds for a router and mac-address-table aging-time seconds [vlan vlan-id] for a Catalyst Switch For more information refer to the Cisco IOS Switching Services Command Reference Guide
High CPU Utilization in the RkiosPortMan Port Review Process
The Catalyst 4500 can display high CPU utilization in the RkiosPortMan Port Review process in the output of the show platform health command in Cisco IOS Software Release 122(25)EWA and 122(25)EWA1 Cisco bug ID CSCeh08768 ( registered customers only) causes the high utilization which Cisco IOS Software Release 122(25)EWA2 resolves This process is a background process and does not affect the stability of the Catalyst 4500 switches
Switchshow platform health CPU CPU RunTimeMax Priority Average CPU Total Target Actual Target Actual Fg Bg 5Sec Min Hour CPULj-poll 100 002 2 1 100 500 0 0 0 109GalChassisVp-review 300 029 10 3 100 500 0 0 0 1115S2w-JobEventSchedule 1000 032 10 7 100 500 0 0 0 1014
--- Output suppressed
K2 Packet Memory Dia 200 000 15 8 100 500 0 1 1 4546
K2 L2 Aging Table Re 200 012 20 3 100 500 0 0 0 722RkiosPortMan Port Re 200 8792 12 7 100 500 99 99 89 105236Rkios Module State R 400 002 40 1 100 500 0 0 0 128Rkios Online Diag Re 400 002 40 0 100 500 0 0 0 115
High CPU Utilization When Connected to an IP Phone with the Use of Trunk Ports
If a port is configured for both the voice VLAN option and the access VLAN option the port acts as a multi-VLAN access port The advantage is that only those VLANs that are configured for the voice and access VLAN options are trunked
The VLANs that are trunked to the phone increase the number of STP instances The switch manages the STP instances Management of the increase in STP instances also increases the STP CPU utilization
The trunking of all the VLANs also causes unnecessary broadcast multicast and unknown unicast traffic to hit the phone link
Switchshow processes cpuCPU utilization for five seconds 690 one minute 72 five minutes 73 PID Runtime(ms) Invoked uSecs 5Sec 1Min 5Min TTY Process 1 4 165 24 000 000 000 0 Chunk Manager 2 29012 739091 39 000 000 000 0 Load Meter 3 67080 13762 4874 000 000 000 0 SpanTree Helper 4 0 1 0 000 000 000 0 Deferred Events 5 0 2 0 000 000 000 0 IpSecMibTopN 6 4980144 570766 8725 000 009 011 0 Check heaps 26 539173952 530982442 1015 1309 1305 1320 0 Cat4k Mgmt HiPri 27 716335120 180543127 3967 1761 1819 1841 0 Cat4k Mgmt LoPri 33 1073728 61623 17424 000 003 000
0 Per-minute Jobs 34 1366717824 231584970 5901 3899 3890 3892 0 Spanning Tree 35 2218424 18349158 120 000 003 002 0 DTP Protocol 36 5160 369525 13 000 000 000 0 Ethchnl 37 271016 2308022 117 000 000 000 0 VLAN Manager 38 958084 3965585 241 000 001 001 0 UDLD 39 1436 51011 28 000 000 000 0 DHCP Snooping 40 780 61658 12 000 000 000 0 Port-Security 41 1355308 12210934 110 000 001 000 0 IP Input
High CPU Utilization with RSPAN and Layer 3 Control Packets
Layer 3 control packets that are captured with RSPAN are destined to CPU rather than just the RSPAN destination interface which causes high CPU The L3 control packets are captured by static CAM entries with forward to CPU action The static CAM entries are global to all VLANs In order to avoid unnecessary CPU flooding use the Per-VLAN Control Traffic Intercept feature available in Cisco IOS software releases 122(37)SG and later
Switch(config) access-list hardware capture mode vlan
Static ACLs are installed at the top in input feature TCAM to capture control packets destined to well known IP multicast addresses in the 22400 range Static ACLs are installed at boot time and appear before any user configured ACL Static ACLs are always hit first and intercept control traffic to CPU on all VLANs
Per-VLAN control traffic intercept feature provide selective per-VLAN path managed mode of capturing control traffic The corresponding static CAM entries in input feature TCAM are invalidated in the new mode Control packets are captured by feature specific ACL attached to VLANs on which snooping or routing features are enabled There is no feature specific ACL attached to RSPAN VLAN Therefore all layer 3 control packets received from RSPAN VLAN are not forwarded to CPU
Troubleshooting Tools to Analyze the Traffic Destined to the CPU
As this document has shown traffic that is destined to the CPU is one of the major causes of high CPU utilization on the Catalyst 4500 The CPU-destined traffic can be either intentional because of the configuration or unintentional because of misconfiguration or a denial-of-service attack The CPU has an in-built QoS mechanism to prevent any adverse network effects because of this traffic However identify the root cause of CPU-bound traffic and eliminate the traffic if it is undesirable
Tool 1 Monitor the CPU Traffic with SPANmdashCisco IOS Software Release 121(19)EW and Later
The Catalyst 4500 allows for the monitor of the CPU-bound traffic either ingress or egress with the use of the standard SPAN function The destination interface connects to a packet monitor or an administrator laptop that runs packet sniffer software This tool helps to quickly and accurately analyze the traffic that the CPU processes The tool provides the ability to monitor individual queues that are bound to the CPU packet engine
Note The switching engine has 32 queues for the CPU traffic and the CPU packet engine has 16 queues
Switch(config)monitor session 1 source cpu both Monitor received and transmitted traffic queue SPAN source CPU queue rx Monitor received traffic only tx Monitor transmitted traffic only ltcrgt Switch(config)monitor session 1 source cpu queue lt1-32gt SPAN source CPU queue numbers acl Input and output ACL [13-20] adj-same-if Packets routed to the incoming interface [7] all All queues [1-32] bridged L2bridged packets [29-32] control-packet Layer 2 Control Packets [5] mtu-exceeded Output interface MTU exceeded [9] nfl Packets sent to CPU by netflow (unused) [8] routed L3routed packets [21-28] rpf-failure Multicast RPF Failures [6] span SPAN to CPU (unused) [11] unknown-sa Packets with missing source address [10] Switch(config)monitor session 1 source cpu queue all rx Switch(config)monitor session 1 destination interface gigabitethernet 13 Switch(config)end 4w6d SYS-5-CONFIG_I Configured from console by console
Switchshow monitor session 1 Session 1 --------- Type Local Session Source Ports RX Only CPU Destination Ports Gi13 Encapsulation Native Ingress Disabled Learning Disabled
If you connect a PC that runs a sniffer program you can quickly analyze the traffic In the output that appears in the window in this section you can see that the cause of the high CPU utilization is an excessive number of STP BPDUs
Note STP BPDUs in the CPU sniffer is normal But if you see more than you expect you may have exceeded the recommended limits for your Supervisor Engine See the A High Number of Spanning-Tree Port Instances section of this document for more information
Tool 2 In-Built CPU SniffermdashCisco IOS Software Release 122(20)EW and Later
The Catalyst 4500 provides an in-built CPU sniffer and decoder to quickly identify the traffic that hits the CPU You can enable this facility with the debug command as the example in this section shows This features implements a circular buffer that can retain 1024 packets at a time As new packets arrive they overwrite the older packets This feature is safe to use when you troubleshoot high CPU utilization issues
Switchdebug platform packet all receive buffer platform packet debugging is on Switchshow platform cpu packet buffered Total Received Packets Buffered 36 ------------------------------------- Index 0 7 days 2363237214 - RxVlan 99 RxPort Gi448 Priority Crucial Tag Dot1Q Tag Event Control Packet
Flags 0x40 Size 68 Eth Src 00-0F-F7-AC-EE-4F Dst 01-00-0C-CC-CC-CD TypeLen 0x0032 Remaining data 0 0xAA 0xAA 0x3 0x0 0x0 0xC 0x1 0xB 0x0 0x0 10 0x0 0x0 0x0 0x80 0x0 0x0 0x2 0x16 0x63 0x28 20 0x62 0x0 0x0 0x0 0x0 0x80 0x0 0x0 0x2 0x16 30 0x63 0x28 0x62 0x80 0xF0 0x0 0x0 0x14 0x0 0x2 40 0x0 0xF 0x0 0x0 0x0 0x0 0x0 0x2 0x0 0x63 Index 1 7 days 23633180863 - RxVlan 1 RxPort Gi448 Priority Crucial Tag Dot1Q Tag Event Control Packet Flags 0x40 Size 68 Eth Src 00-0F-F7-AC-EE-4F Dst 01-00-0C-CC-CC-CD TypeLen 0x0032 Remaining data 0 0xAA 0xAA 0x3 0x0 0x0 0xC 0x1 0xB 0x0 0x0 10 0x0 0x0 0x0 0x80 0x0 0x0 0x2 0x16 0x63 0x28 20 0x62 0x0 0x0 0x0 0x0 0x80 0x0 0x0 0x2 0x16 30 0x63 0x28 0x62 0x80 0xF0 0x0 0x0 0x14 0x0 0x2 40 0x0 0xF 0x0 0x0 0x0 0x0 0x0 0x2 0x0 0x63
Note The CPU utilization when you issue a debug command is always almost 100 It is normal to have high CPU utilization when you issue a debug command
Tool 3 Identify the Interface That Sends Traffic to the CPUmdashCisco IOS Software Release 122(20)EW and Later
Catalyst 4500 provides another useful tool to identify the top interfaces that send trafficpackets for CPU processing This tool helps you quickly identify an errand device that sends a high number of broadcast or other denial-of-service attacks to the CPU This feature is also safe to use when you troubleshoot high CPU utilization issues
Switchdebug platform packet all countplatform packet debugging is on Switchshow platform cpu packet statistics
--- Output suppressed
Packets Transmitted from CPU per Output Interface
Interface Total 5 sec avg 1 min avg 5 min avg 1 hour avg
---------------------- --------------- --------- --------- --------- ---------- Gi447 1150 1 5 10 0 Gi448 50 1 0 0 0
Packets Received at CPU per Input Interface
Interface Total 5 sec avg 1 min avg 5 min avg 1 hour avg ---------------------- --------------- --------- --------- --------- ---------- Gi447 23130 5 10 50 20Gi448 50 1 0 0 0
Note The CPU utilization when you issue a debug command is always almost 100 It is normal to have high CPU utilization when you issue a debug command
Summary
The Catalyst 4500 switches handle a high rate of IP version 4 (IPv4) packet forwarding in hardware Some of the features or exceptions can cause the forward of some packets via the CPU process path The Catalyst 4500 uses a sophisticated QoS mechanism to handle CPU-bound packets This mechanism ensures reliability and stability of the switches and at the same time maximizes the CPU for the software forwarding of packets Cisco IOS Software Release 122(25)EWA2 and later provide additional enhancements for packetprocess handling as well as accounting The Catalyst 4500 also has sufficient commands and powerful tools to aid in the identification of the root cause of high CPU-utilization scenarios But in most cases high CPU utilization on the Catalyst 4500 is not a cause of network instability nor a cause for concern
Cisco Support Community - Featured Conversations
Cisco Support Community is a forum for you to ask and answer questions share suggestions and collaborate with your peers Below are just some of the most recent and relevant conversations happening right now
Want to see more Join us by clicking here
High CPU Utilization on Cisco IOSpramodprasad5 Replies2 years 8 months ago
High CPU utilization on Cisco 4500andrewswanson7 Replies1 year 6 months ago
Process causes high CPU utilization ondsalamanca5 Replies3 years 4 months ago
HIGH UTILIZATION of 4500 Catalystsohaildxbfze2 Replies1 year 9 months ago
High CPu utilization in 4500vaibhav-g1 Reply3 months 6 days ago
High CPU utilization on Catalyst 3500hestholmt1 Reply7 years 6 months ago
High CPU Utilizationheidemat011 Reply3 years 4 months ago
4507R IOS Catalyst - High CPUshakeelahmadch4 Replies2 years 7 months ago
4506 CPU utilization averagehttpssupportforumsciscocompeopleluizalexandrepaiva40gmailcom6 Replies2 years 9 months ago
High CPU Utilization Catalyst 2924 httpssupportforumsciscocompeoplegfiguereo40bpdcomdo2 Replies5 years 11 months ago Subscribe Start A New Discussion
Related Information
CPU Utilization on Catalyst 45004000 2948G 2980G and 4912G Switches That Run
CatOS Software LAN Product Support Pages LAN Switching Support Page Technical Support amp Documentation - Cisco Systems
Contacts amp Feedback | Help | Site Map copy 2008 - 2009 Cisco Systems Inc All rights reserved Terms amp Conditions | Privacy Statement | Cookie Policy | Trademarks of Cisco Systems Inc
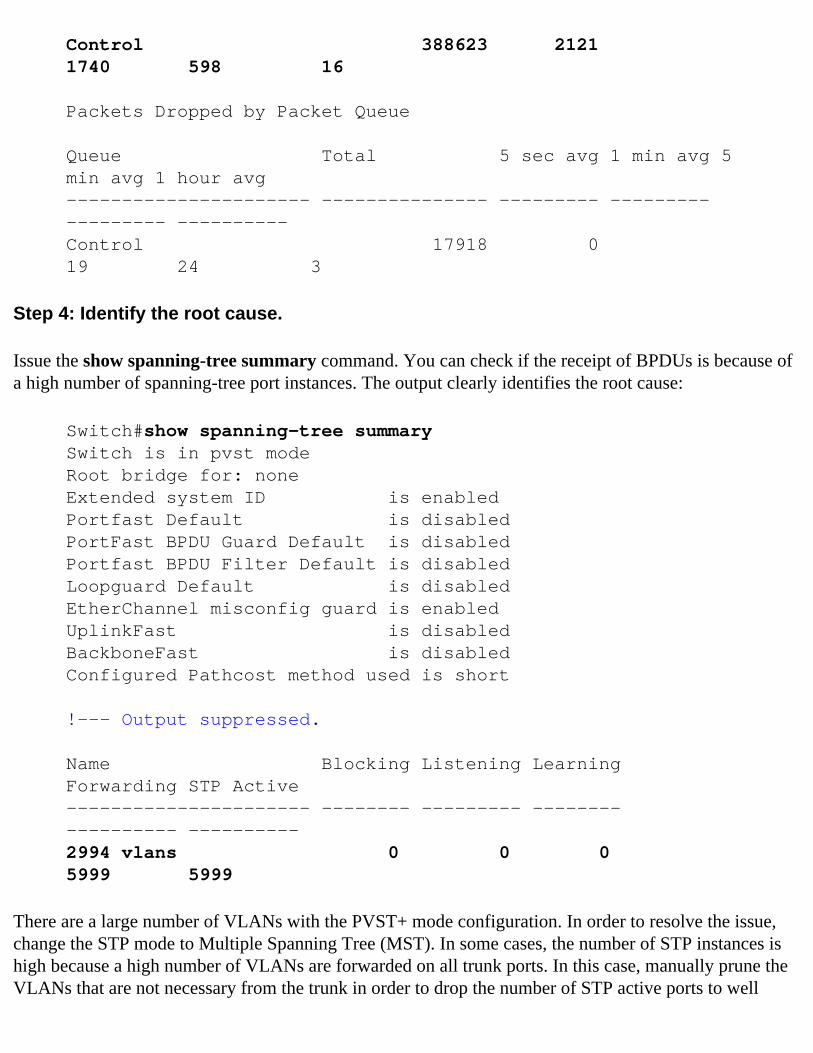
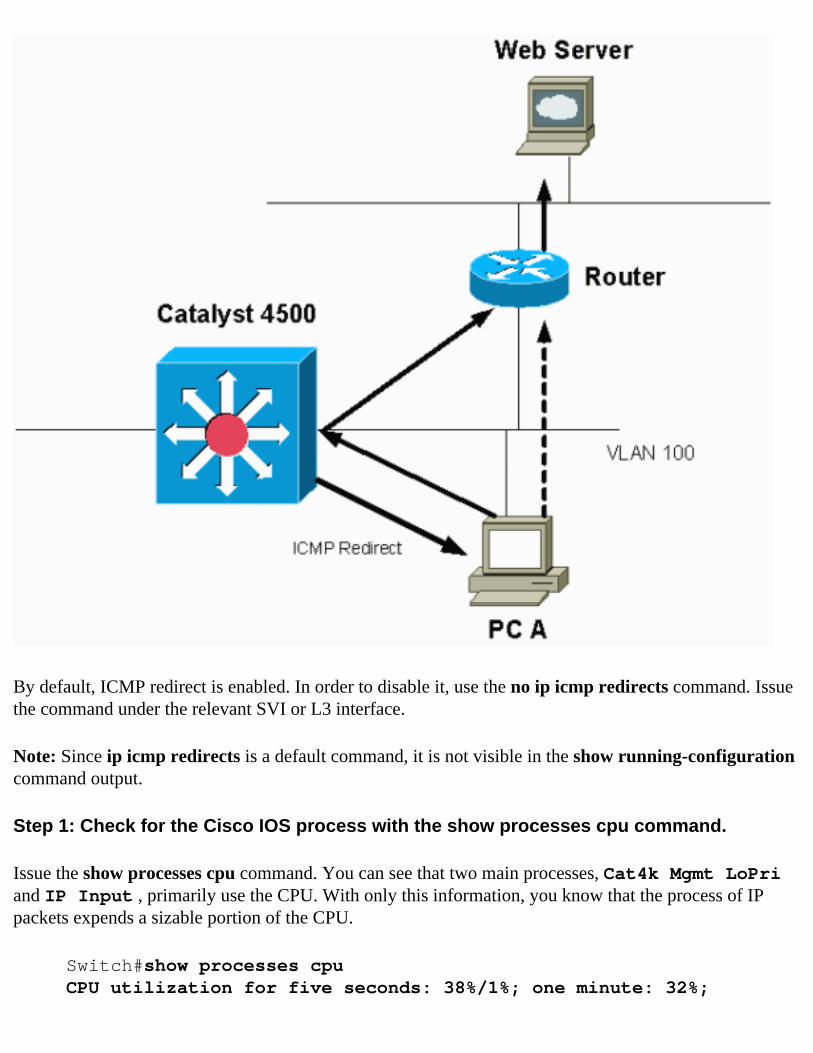
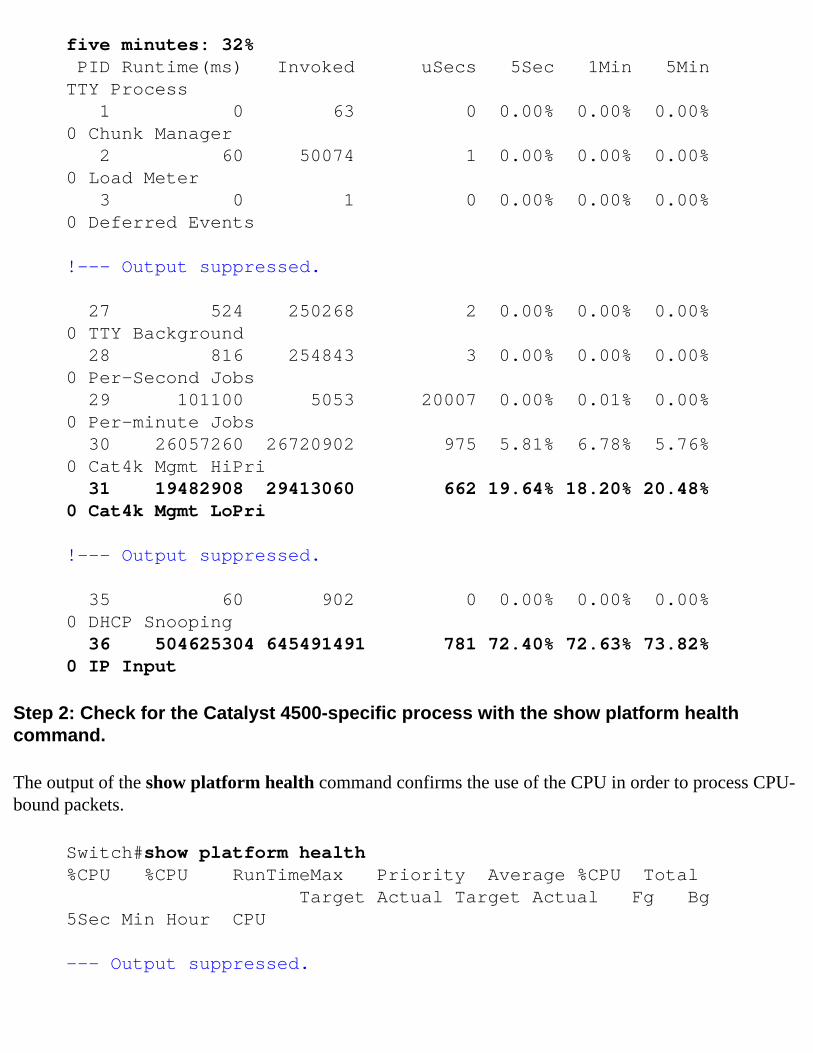
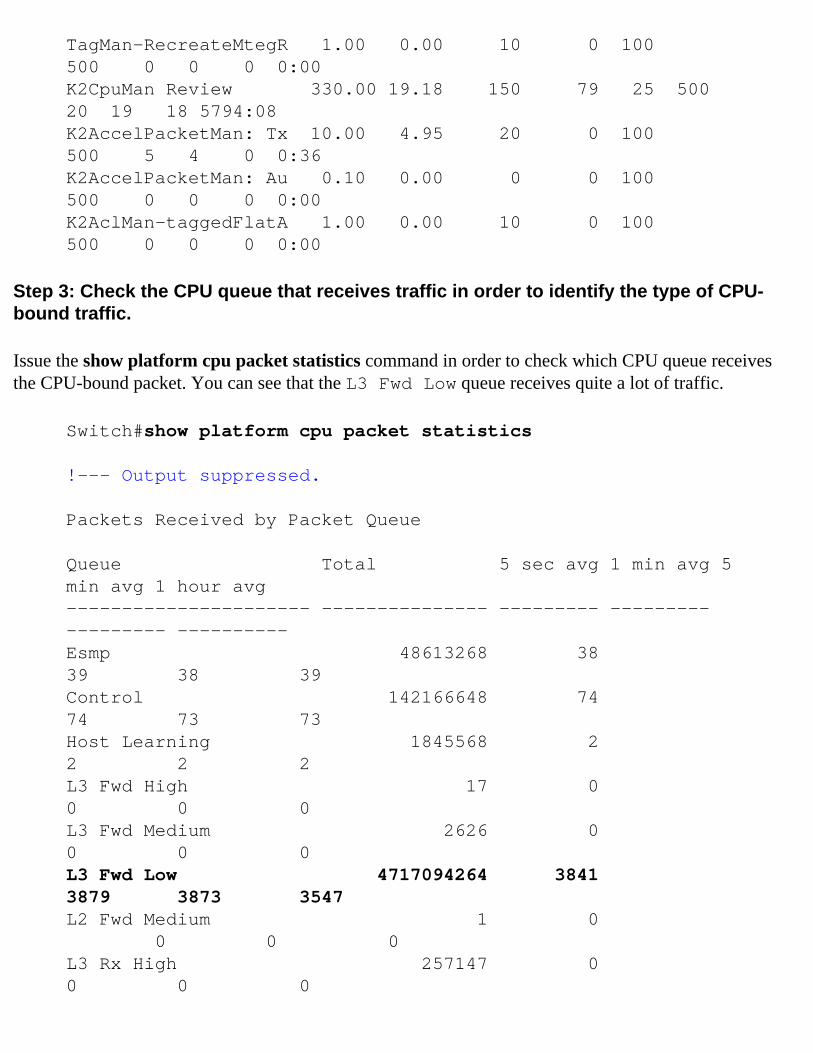
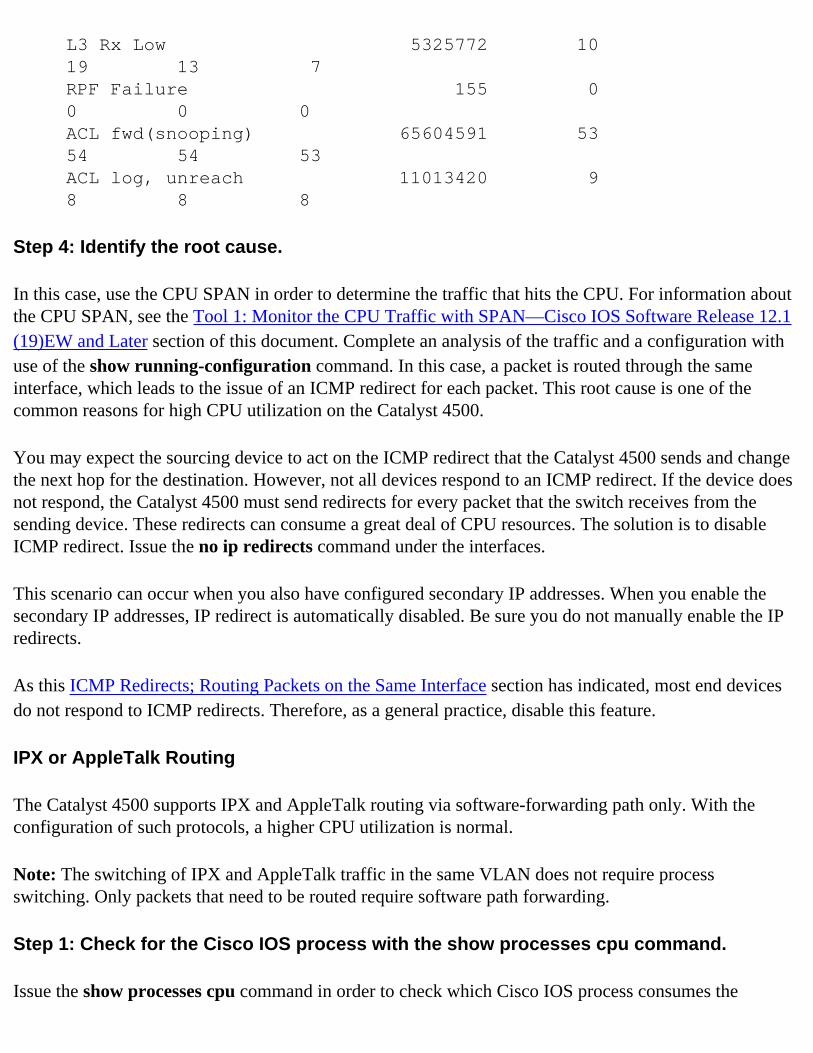
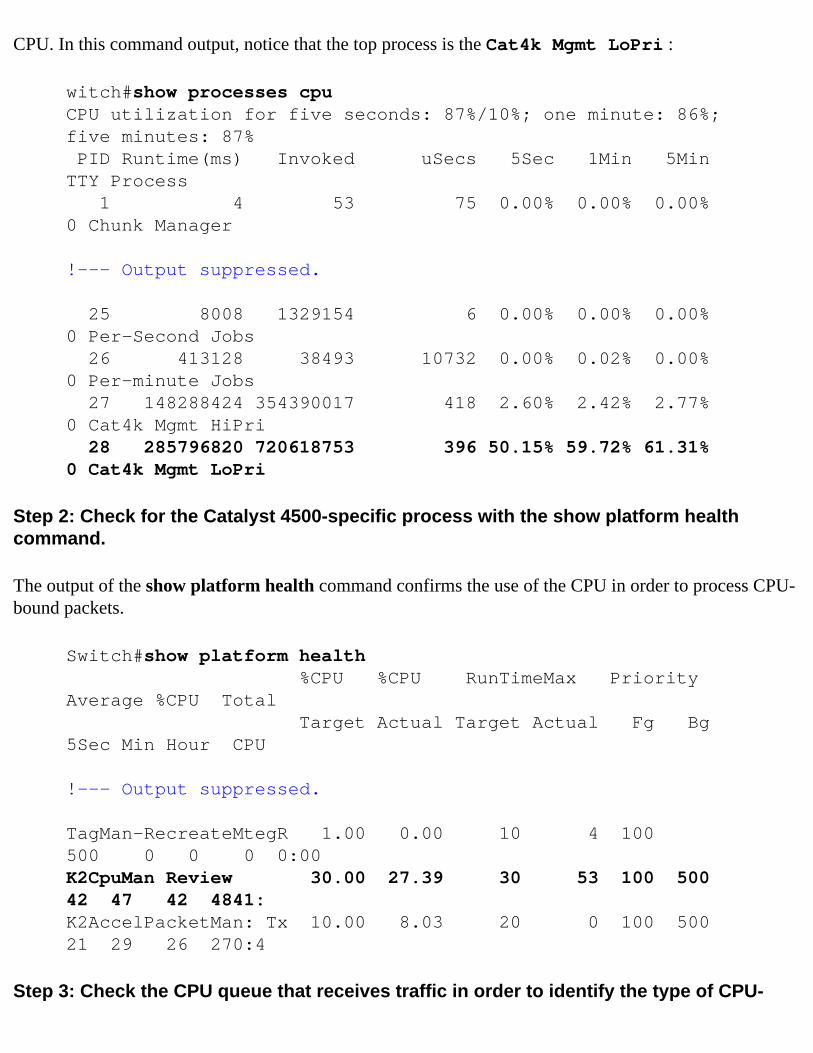
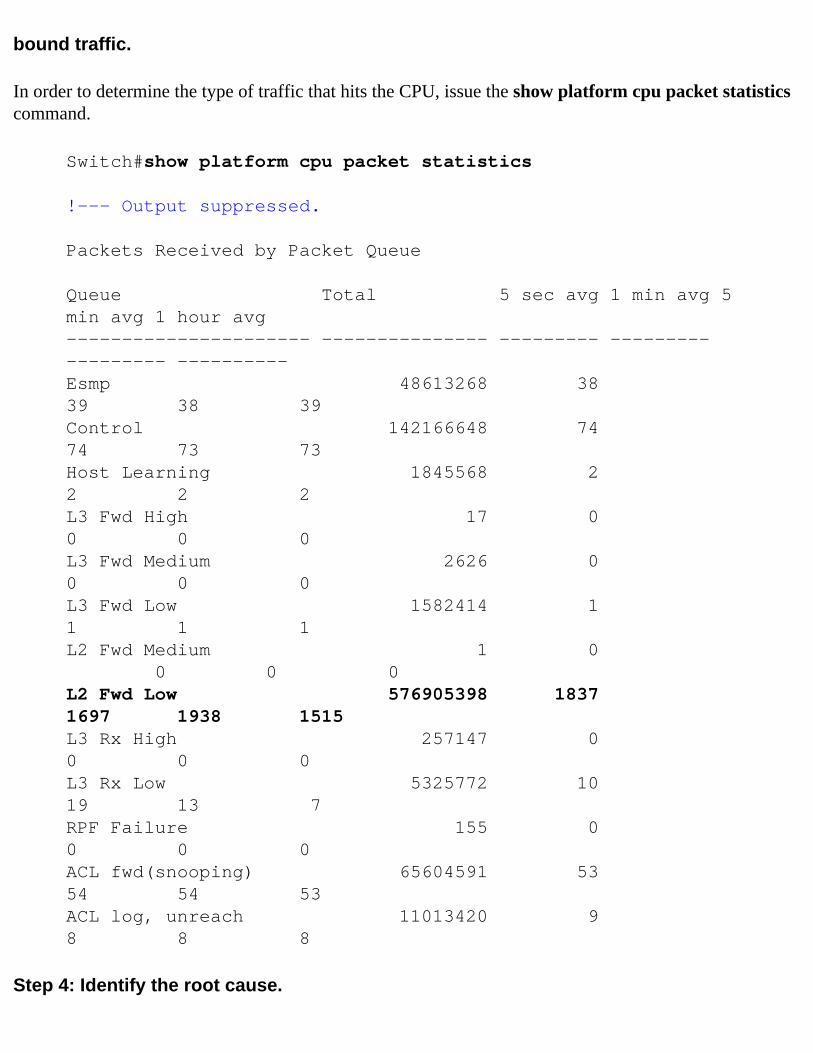
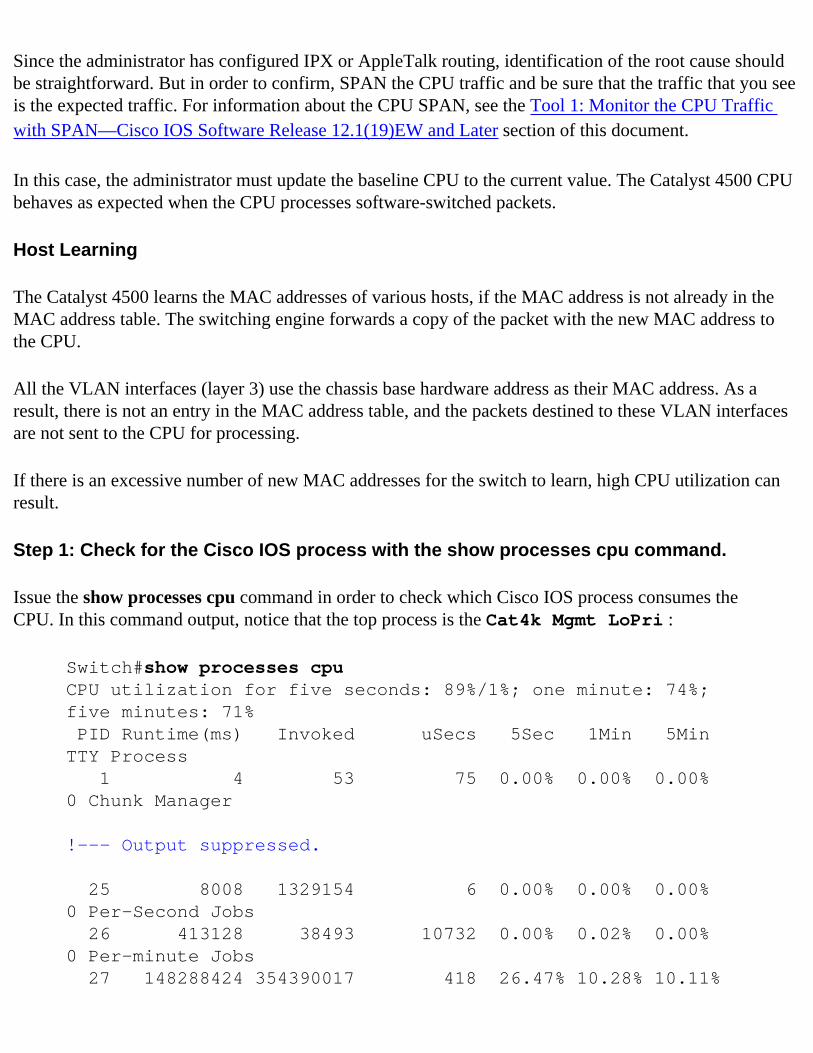
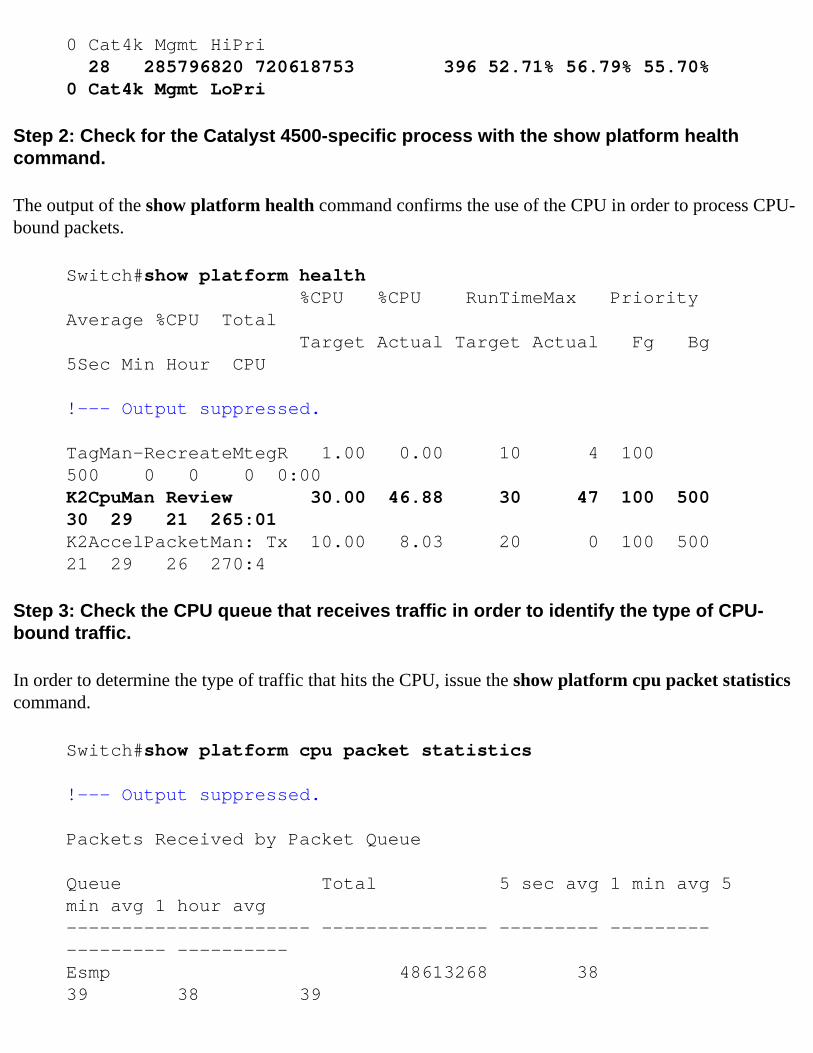
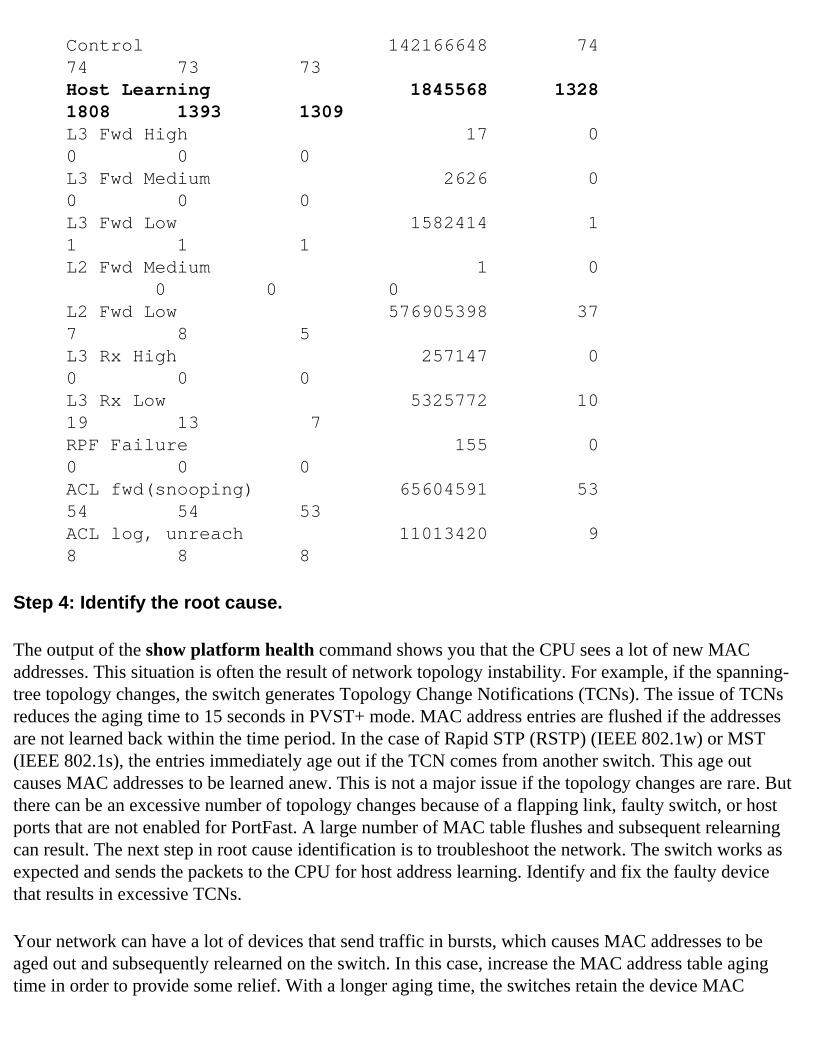
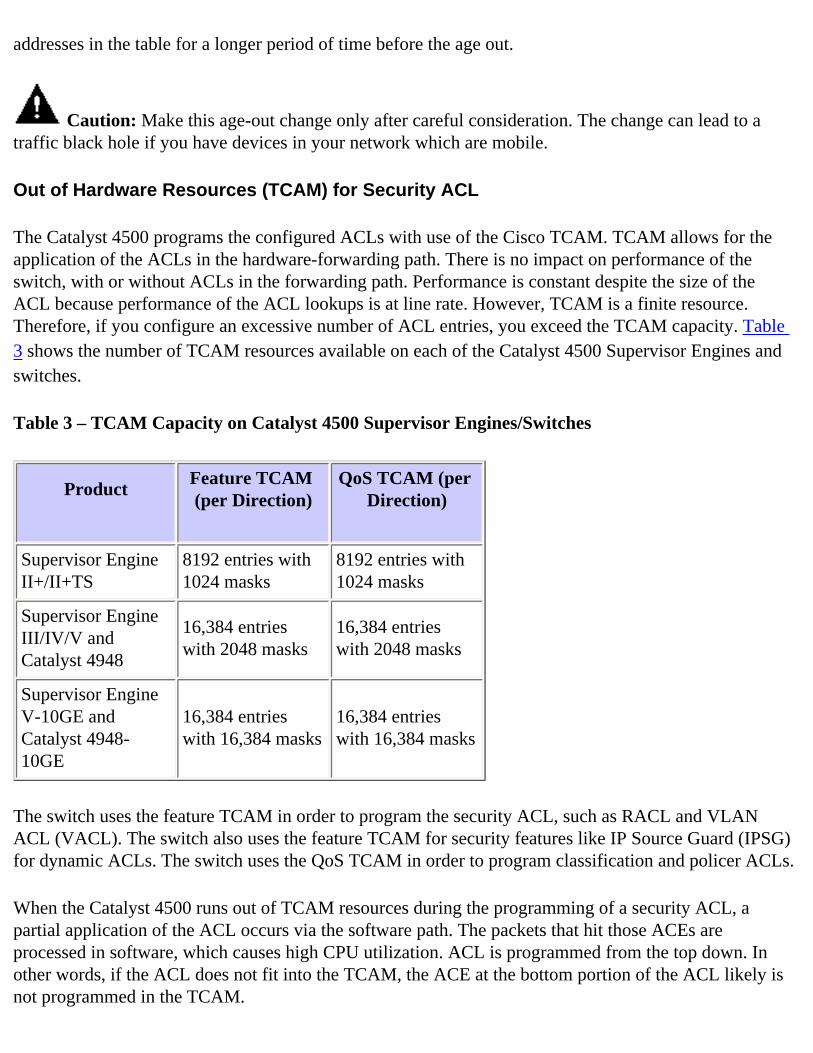
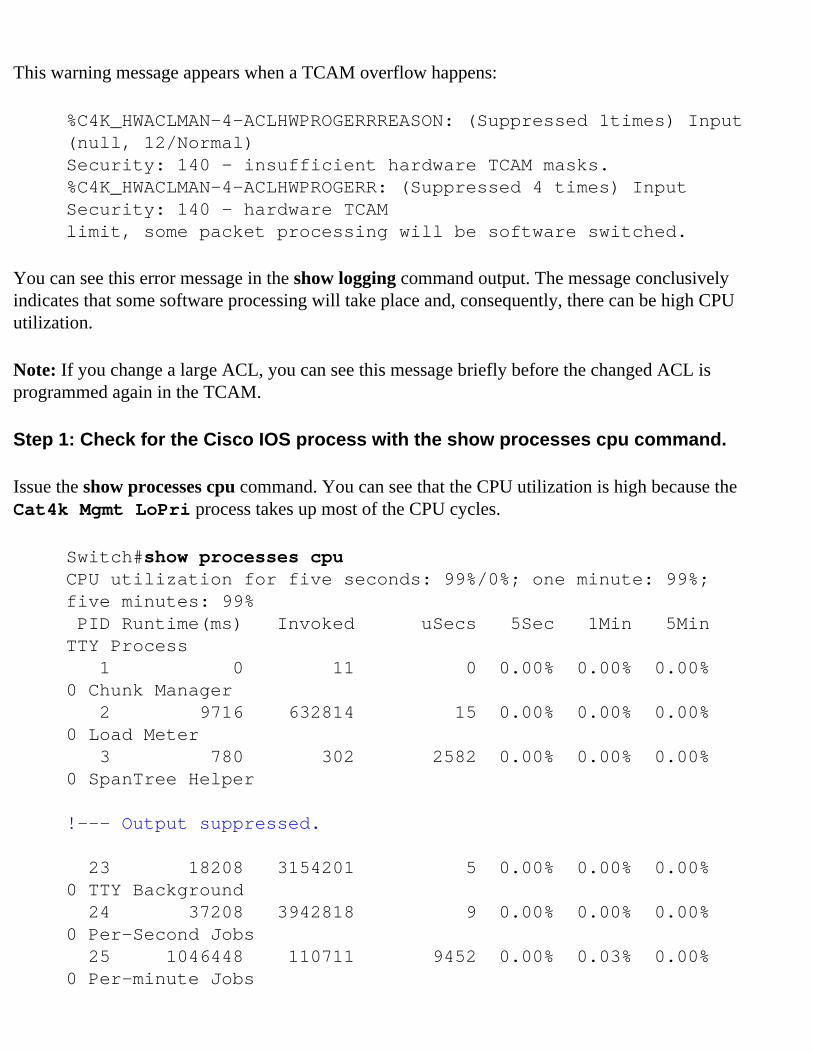
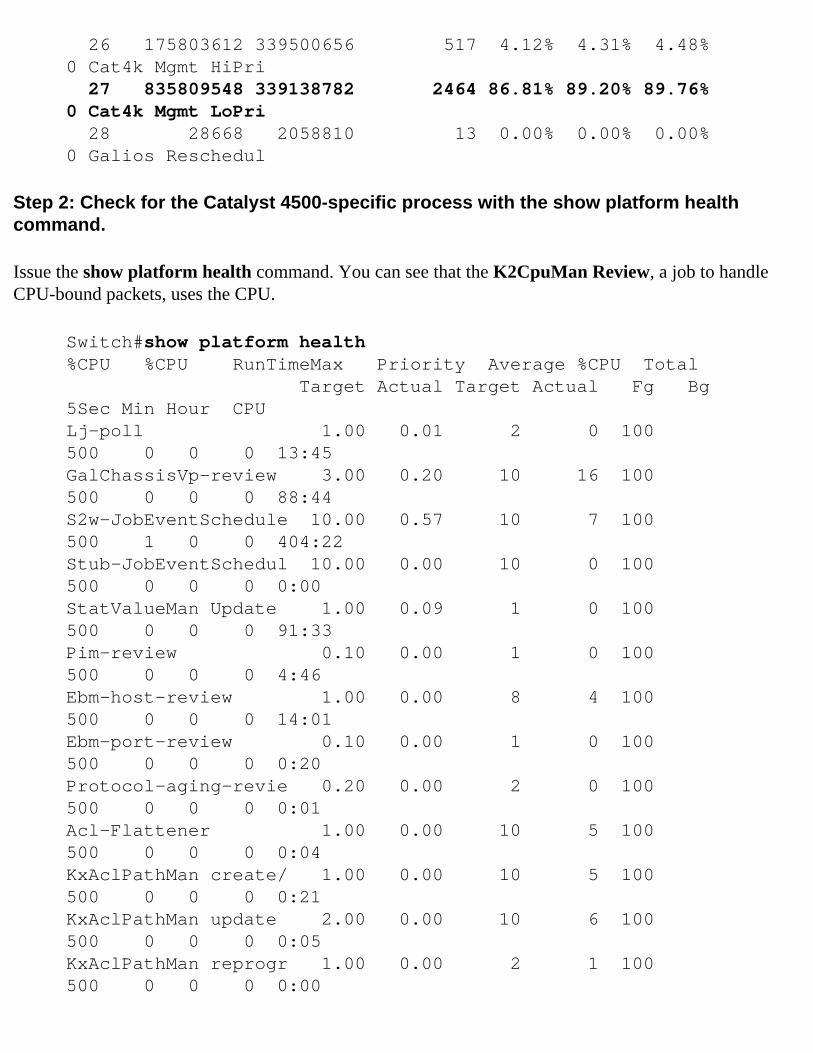
26 175803612 339500656 517 412 431 448 0 Cat4k Mgmt HiPri 27 835809548 339138782 2464 8681 8920 8976 0 Cat4k Mgmt LoPri 28 28668 2058810 13 000 000 000 0 Galios Reschedul
Step 2 Check for the Catalyst 4500-specific process with the show platform health command
Issue the show platform health command You can see that the K2CpuMan Review a job to handle CPU-bound packets uses the CPU
Switchshow platform health CPU CPU RunTimeMax Priority Average CPU Total Target Actual Target Actual Fg Bg 5Sec Min Hour CPULj-poll 100 001 2 0 100 500 0 0 0 1345GalChassisVp-review 300 020 10 16 100 500 0 0 0 8844S2w-JobEventSchedule 1000 057 10 7 100 500 1 0 0 40422Stub-JobEventSchedul 1000 000 10 0 100 500 0 0 0 000StatValueMan Update 100 009 1 0 100 500 0 0 0 9133Pim-review 010 000 1 0 100 500 0 0 0 446Ebm-host-review 100 000 8 4 100 500 0 0 0 1401Ebm-port-review 010 000 1 0 100 500 0 0 0 020Protocol-aging-revie 020 000 2 0 100 500 0 0 0 001Acl-Flattener 100 000 10 5 100 500 0 0 0 004KxAclPathMan create 100 000 10 5 100 500 0 0 0 021KxAclPathMan update 200 000 10 6 100 500 0 0 0 005KxAclPathMan reprogr 100 000 2 1 100 500 0 0 0 000
TagMan-InformMtegRev 100 000 5 0 100 500 0 0 0 000TagMan-RecreateMtegR 100 000 10 14 100 500 0 0 0 018K2CpuMan Review 3000 9131 30 92 100 500 128 119 84 1303902K2AccelPacketMan Tx 1000 230 20 0 100 500 2 2 2 134530K2AccelPacketMan Au 010 000 0 0 100 500 0 0 0 000
Step 3 Check the CPU queue that receives traffic in order to identify the type of CPU-bound traffic
You need to further understand which CPU queue and therefore what type of traffic hits the CPU queue Issue the show platform cpu packet statistics command You can see that the ACL sw processing queue receives a high number of packets Therefore TCAM overflow is the cause of this high CPU utilization issue
Switchshow platform cpu packet statistics
--- Output suppressed
Packets Received by Packet Queue
Queue Total 5 sec avg 1 min avg 5 min avg 1 hour avg---------------------- --------------- --------- --------- --------- ----------Control 57902635 22 16 12 3Host Learning 464678 0 0 0 0L3 Fwd Low 623229 0 0 0 0L2 Fwd Low 11267182 7 4 6 1L3 Rx High 508 0 0 0 0L3 Rx Low 1275695 10 1 0 0ACL fwd(snooping) 2645752 0 0 0 0
ACL log unreach 51443268 9 4 5 5ACL sw processing 842889240 1453 1532 1267 1179
Packets Dropped by Packet Queue
Queue Total 5 sec avg 1 min avg 5 min avg 1 hour avg---------------------- --------------- --------- --------- --------- ----------L2 Fwd Low 3270 0 0 0 0ACL sw processing 12636 0 0 0 0
Step 4 Resolve the issue
In Step 3 you determined the root cause in this scenario Remove the ACL which caused the overflow or minimize the ACL to avoid overflow Also review the Configuring Network Security with ACLs configuration guideline in order to optimize the ACL configuration and programming in the hardware
The log Keyword in ACL
The Catalyst 4500 supports logging of packets detail that hit any specific ACL entry but excessive logging can cause high CPU utilization Avoid the use of log keywords except during the traffic discovery stage During the traffic discovery stage you identify the traffic that flows through your network for which you have not explicitly configured ACEs Do not use the log keyword in order to gather statistics In Cisco IOS Software Release 121(13)EW and later the log messages are rate-limited If you use log messages in order to count the number of packets that match the ACL the count is not accurate Instead use the show access-list command for accurate statistics Identification of this root cause is easier because a review of the configuration or log messages can indicate the use of the ACL logging feature
Step 1 Check for the Cisco IOS process with the show processes cpu command
Issue the show processes cpu in order to check which Cisco IOS process consumes the CPU In this command output you find that the top process is the Cat4k Mgmt LoPri
Switchshow processes cpu CPU utilization for five seconds 990 one minute 99 five minutes 99
PID Runtime(ms) Invoked uSecs 5Sec 1Min 5Min TTY Process 1 0 11 0 000 000 000 0 Chunk Manager 2 9716 632814 15 000 000 000 0 Load Meter
--- Output suppressed
26 175803612 339500656 517 412 431 448 0 Cat4k Mgmt HiPri 27 835809548 339138782 2464 8681 8920 8976 0 Cat4k Mgmt LoPri 28 28668 2058810 13 000 000 000 0 Galios Reschedul
Step 2 Check for the Catalyst 4500-specific process with the show platform health command
Check the platform-specific process that uses the CPU Issue the show platform health command In the output notice that the K2CpuMan Review process uses most of the CPU cycles This activity indicates that the CPU is busy as it processes packets destined to it
Switchshow platform health CPU CPU RunTimeMax Priority Average CPU Total Target Actual Target Actual Fg Bg 5Sec Min Hour CPULj-poll 100 001 2 0 100 500 0 0 0 1345GalChassisVp-review 300 020 10 16 100 500 0 0 0 8844S2w-JobEventSchedule 1000 057 10 7 100 500 1 0 0 40422Stub-JobEventSchedul 1000 000 10 0 100 500 0 0 0 000StatValueMan Update 100 009 1 0 100 500 0 0 0 9133Pim-review 010 000 1 0 100 500 0 0 0 446Ebm-host-review 100 000 8 4 100 500 0 0 0 1401Ebm-port-review 010 000 1 0 100
500 0 0 0 020Protocol-aging-revie 020 000 2 0 100 500 0 0 0 001Acl-Flattener 100 000 10 5 100 500 0 0 0 004KxAclPathMan create 100 000 10 5 100 500 0 0 0 021KxAclPathMan update 200 000 10 6 100 500 0 0 0 005KxAclPathMan reprogr 100 000 2 1 100 500 0 0 0 000TagMan-InformMtegRev 100 000 5 0 100 500 0 0 0 000TagMan-RecreateMtegR 100 000 10 14 100 500 0 0 0 018K2CpuMan Review 3000 9131 30 92 100 500 128 119 84 1303902K2AccelPacketMan Tx 1000 230 20 0 100 500 2 2 2 134530K2AccelPacketMan Au 010 000 0 0 100 500 0 0 0 000
Step 3 Check the CPU queue that receives traffic in order to identify the type of CPU-bound traffic
In order to determine the type of traffic that hits the CPU issue the show platform cpu packet statistics command In this command output you can see that the receipt of packets is due to the ACL log keyword
Switchshow platform cpu packet statistics
--- Output suppressed
Total packet queues 16Packets Received by Packet Queue
Queue Total 5 sec avg 1 min avg 5 min avg 1 hour avg----------------- -------------------- --------- --------- --------- ----------Control 1198701435 35 35 34 35Host Learning 874391 0
0 0 0L3 Fwd High 428 0 0 0 0L3 Fwd Medium 12745 0 0 0 0L3 Fwd Low 2420401 0 0 0 0L2 Fwd High 26855 0 0 0 0L2 Fwd Medium 116587 0 0 0 0L2 Fwd Low 317829151 53 41 31 31L3 Rx High 2371 0 0 0 0L3 Rx Low 32333361 7 1 2 0RPF Failure 4127 0 0 0 0ACL fwd (snooping) 107743299 4 4 4 4ACL log unreach 1209056404 1987 2125 2139 2089
Packets Dropped by Packet Queue
Queue Total 5 sec avg 1 min avg 5 min avg 1 hour avg----------------- -------------------- --------- --------- --------- ----------ACL log unreach 193094788 509 362 437 394
Step 4 Resolve the issue
In Step 3 you determined the root cause in this scenario In order to prevent this problem remove the log keyword from the ACLs In Cisco IOS Software Release 121(13)EW1 and later the packets are rate-limited so that CPU utilization does not get too high Use the access list counters as a way to keep track of ACL hits You can see the access list counters in the show access-list acl_id command output
Layer 2 forwarding loops
Layer 2 forwarding loops can be caused by poor implementation of Spanning Tree Protocol (STP) and
various issues that can affect STP
Step 1 Check for the Cisco IOS process with the show processes cpu command
This section reviews the commands that an administrator uses in order to narrow down the problem of high CPU utilization If you issue the show processes cpu command you can see that two main processes Cat4k Mgmt LoPri and Spanning Tree primarily use the CPU With only this information you know that the spanning tree process consumes a sizable portion of the CPU cycles
Switchshow processes cpu CPU utilization for five seconds 741 one minute 73 five minutes 50 PID Runtime(ms) Invoked uSecs 5Sec 1Min 5Min TTY Process 1 4 198 20 000 000 000 0 Chunk Manager 2 4 290 13 000 000 000 0 Load Meter
--- Output suppressed
25 488 33 14787 000 002 000 0 Per-minute Jobs 26 90656 223674 405 679 690 722 0 Cat4k Mgmt HiPri 27 158796 59219 2681 3255 3380 2143 0 Cat4k Mgmt LoPri 28 20 1693 11 000 000 000 0 Galios Reschedul 29 0 1 0 000 000 000 0 IOS ACL Helper 30 0 2 0 000 000 000 0 NAM Manager
--- Output suppressed
41 0 1 0 000 000 000 0 SFF8472 42 0 2 0 000 000 000 0 AAA Dictionary R 43 78564 20723 3791 3263 3003 1735 0 Spanning Tree 44 112 999 112 000 000 000
0 DTP Protocol 45 0 147 0 000 000 000 0 Ethchnl
Step 2 Check for the Catalyst 4500-specific process with the show platform health command
In order to understand which platform-specific process consumes the CPU issue the show platform health command From this output you can see that the K2CpuMan Review process a job to handle CPU-bound packets uses up the CPU
Switchshow platform health CPU CPU RunTimeMax Priority Average CPU Total Target Actual Target Actual Fg Bg 5Sec Min Hour CPU
--- Output suppressed
TagMan-RecreateMtegR 100 000 10 0 100 500 0 0 0 000K2CpuMan Review 3000 3762 30 53 100 500 41 33 1 212K2AccelPacketMan Tx 1000 495 20 0 100 500 5 4 0 036K2AccelPacketMan Au 010 000 0 0 100 500 0 0 0 000K2AclMan-taggedFlatA 100 000 10 0 100 500 0 0 0 000
Step 3 Check the CPU queue that receives traffic in order to identify the type of CPU-bound traffic
Issue the show platform cpu packet statistics command in order to check which CPU queue receives the CPU-bound packet The output in this section shows that the control queue receives a lot of packets Use the information in Table 1 and the conclusion that you drew in Step 1 You can determine that the packets that the CPU processes and the reason for the high CPU utilization is BPDU processing
Switchshow platform cpu packet statistics
--- Output suppressed
Total packet queues 16Packets Received by Packet Queue
Queue Total 5 sec avg 1 min avg 5 min avg 1 hour avg---------------------- --------------- --------- --------- --------- ----------Esmp 202760 196 173 128 28Control 388623 2121 1740 598 16
Packets Dropped by Packet Queue
Queue Total 5 sec avg 1 min avg 5 min avg 1 hour avg---------------------- --------------- --------- --------- --------- ----------Control 17918 0 19 24 3
Step 4 Identify the root cause and fix the issue
Generally you can complete these steps in order to troubleshoot (depending on the situation some steps are not be necessary)
1 Identify the loop
2 Discover the scope of the loop
3 Break the loop
4 Fix the cause for the loop
5 Restore redunancy
Each of the steps are explained in detail at Troubleshooting Forwarding Loops - Troubleshooting STP on Catalyst Switches Running Cisco IOS System Software
Step 5 Implement advanced STP features
BDPU GuardmdashSecures STP from unauthorized network devices connected to portfast enabled ports Refer to Spanning Tree PortFast BPDU Guard Enhancement for more information
Loop GuardmdashIncreases the stability of layer 2 networks Refer to Spanning-Tree Protocol Enhancements using Loop Guard and BPDU Skew Detection Features for more information
Root GuardmdashEnforces root bridge placement in the network Refer to Spanning Tree Protocol Root Guard Enhancement for more information
UDLDmdashDetects unidirectional links and prevents forwarding loops Refer to Understanding and Configuring the Unidirectional Link Detection Protocol Feature for more information
Other Causes of High CPU Utilization
These are some other known causes of high CPU utilization
Excessive link flaps
Spikes in CPU utilization due to FIB consistency check
High CPU utilization in the K2FibAdjMan Host Move process
High CPU utilization in the RkiosPortMan Port Review process
High CPU utilization when connected to an IP phone with the use of trunk ports
High CPU Utilization with RSPAN and Layer 3 Control Packets
Spike during large ACL programming
The spike in CPU utilization occurs during application or removal of a large ACL from an interface
Excessive Link Flaps
The Catalyst 4500 exhibits high CPU utilization when one or more of the attached links starts to flap excessively This situation occurs in Cisco IOS Software releases earlier than Cisco IOS Software Release 122(20)EWA
Step 1 Check for the Cisco IOS process with the show processes cpu command
Issue the show processes cpu command in order to check which Cisco IOS process consumes the CPU In this command output notice that the top process is the Cat4k Mgmt LoPri
Switchshow processes cpu CPU utilization for five seconds 960 one minute 76 five minutes 68 PID Runtime(ms) Invoked uSecs 5Sec 1Min 5Min TTY Process 1 0 4 0 000 000 000 0 Chunk Manager 2 9840 463370 21 000 000 000 0 Load Meter 3 0 2 0 000 000 000 0 SNMP Timers
--- Output suppressed
27 232385144 530644966 437 1398 1265 1216 0 Cat4k Mgmt HiPri 28 564756724 156627753 3605 6474 6071 5475 0 Cat4k Mgmt LoPri 29 9716 1806301 5 000 000 000 0 Galios Reschedul
Step 2 Check for the Catalyst 4500-specific process with the show platform health command
The output of the show platform health command indicates that the KxAclPathMan create process uses up the CPU This process is for internal path creation
Switchshow platform health CPU CPU RunTimeMax Priority Average CPU Total Target Actual Target Actual Fg Bg 5Sec Min Hour CPULj-poll 100 003 2 0 100 500 0 0 0 949GalChassisVp-review 300 111 10 62 100 500 0 0 0 3739S2w-JobEventSchedule 1000 285 10 8 100 500 2 2 2 9000Stub-JobEventSchedul 1000 527 10 9 100 500 4 4 4 1862Pim-review 010 000 1 0 100 500 0 0 0 251
Ebm-host-review 100 000 8 4 100 500 0 0 0 806Ebm-port-review 010 000 1 0 100 500 0 0 0 014Protocol-aging-revie 020 000 2 0 100 500 0 0 0 000Acl-Flattener 100 000 10 5 100 500 0 0 0 000KxAclPathMan create 100 6911 10 5 100 500 42 53 22 7150KxAclPathMan update 200 076 10 6 100 500 0 0 0 8600KxAclPathMan reprogr 100 000 2 1 100 500 0 0 0 000TagMan-InformMtegRev 100 000 5 0 100 500 0 0 0 000TagMan-RecreateMtegR 100 000 10 227 100 500 0 0 0 000K2CpuMan Review 3000 805 30 57 100 500 6 5 5 2150K2AccelPacketMan Tx 1000 686 20 0 100 500 5 5 4 7842
Step 3 Identify the root cause
Enable logging for link updown messages This logging is not enabled by default The enablement helps you to narrow down the offending links very quickly Issue the logging event link-status command under all the interfaces You can use the interface range command in order to conveniently enable on a range of interfaces as this example shows
Switchconfigure terminalEnter configuration commands one per line End with CNTLZSwitch(config)interface range gigabitethernet 51 - 48Switch(config-if-range)logging event link-statusSwitch(config--if-range)end
Switchshow logging
--- Output suppressed
3w5d LINK-3-UPDOWN Interface GigabitEthernet524 changed state to down3w5d LINK-3-UPDOWN Interface GigabitEthernet524 changed
state to up3w5d LINK-3-UPDOWN Interface GigabitEthernet524 changed state to down3w5d LINK-3-UPDOWN Interface GigabitEthernet524 changed state to up3w5d LINK-3-UPDOWN Interface GigabitEthernet524 changed state to down3w5d LINK-3-UPDOWN Interface GigabitEthernet524 changed state to up
After you have identified the faulty or flapping interface shut down the interface in order to resolve the high CPU utilization issue Cisco IOS Software Release 122(20)EWA and later have improved the Catalyst 4500 behavior for this flapping-links condition Therefore the impact on the CPU is not as great as before the improvement Remember that this process is a background process High CPU utilization because of this issue does not cause adverse effects on the Catalyst 4500 switches
Spikes in CPU Utilization Due to FIB Consistency Check
The Catalyst 4500 can show momentary spikes in the CPU utilization during a FIB table consistency check The FIB table is the L3 forwarding table that the CEF process creates The consistency check maintains consistency between the Cisco IOS Software FIB table and the hardware entries This consistency ensures that packets are not misrouted The check occurs every 2 seconds and runs as a low-priority background process This process is normal behavior and does not interfere with other high-priority processes or packets
The output of the show platform health command shows that K2Fib Consistency Ch consumes most of the CPU
Note The average CPU utilization for this process is insignificant over a minute or an hour which confirms that the check is a short periodic review This background process only uses the idle CPU cycles
Switchshow platform health CPU CPU RunTimeMax Priority Average CPU Total Target Actual Target Actual Fg Bg 5Sec Min Hour CPULj-poll 100 002 2 1 100 500 0 0 0 109GalChassisVp-review 300 029 10 3 100 500 0 0 0 1115
--- Output suppressed
K2Fib cam usage revi 200 000 15 0 100 500 0 0 0 000K2Fib IrmFib Review 200 000 15 0 100 500 0 0 0 000K2Fib Vrf Default Ro 200 000 15 0 100 500 0 0 0 000K2Fib AdjRepop Revie 200 000 15 0 100 500 0 0 0 000K2Fib Vrf Unpunt Rev 200 001 15 0 100 500 0 0 0 023K2Fib Consistency Ch 100 6040 5 2 100 500 0 0 0 10023K2FibAdjMan Stats Re 200 030 10 4 100 500 0 0 0 621K2FibAdjMan Host Mov 200 000 10 4 100 500 0 0 0 000K2FibAdjMan Adj Chan 200 000 10 0 100 500 0 0 0 000K2FibMulticast Signa 200 001 10 2 100 500 0 0 0 204
High CPU Utilization in the K2FibAdjMan Host Move Process
The Catalyst 4500 can display high CPU utilization in the K2FibAdjMan Host Move process This high utilization appears in the output of the show platform health command Many MAC addresses frequently expire or are learned on new ports which causes this high CPU utilization The default value of mac-address-table aging-time is 5 minutes or 300 seconds The workaround for this issue is to increase the MAC address aging time or you can engineer the network in order to avoid the high number of MAC address moves Cisco IOS Software Release 122(18)EW and later have enhanced this process behavior in order to consume less CPU Refer to Cisco bug ID CSCed15021 ( registered customers only)
Switchshow platform health CPU CPU RunTimeMax Priority Average CPU Total Target Actual Target Actual Fg Bg 5Sec Min Hour CPULj-poll 100 002 2 1 100 500 0 0 0 109GalChassisVp-review 300 029 10 3 100 500 0 0 0 1115S2w-JobEventSchedule 1000 032 10 7 100 500 0 0 0 1014
--- Output suppressed
K2FibAdjMan Stats Re 200 030 10 4 100 500 0 0 0 621K2FibAdjMan Host Mov 200 1868 10 4 100 500 25 29 28 213439K2FibAdjMan Adj Chan 200 000 10 0 100 500 0 0 0 000K2FibMulticast Signa 200 001 10 2 100 500 0 0 0 204K2FibMulticast Entry 200 000 10 7 100 500 0 0 0 000
You can modify the maximum aging time of a MAC address in the global configuration mode The command syntax is mac-address-table aging-time seconds for a router and mac-address-table aging-time seconds [vlan vlan-id] for a Catalyst Switch For more information refer to the Cisco IOS Switching Services Command Reference Guide
High CPU Utilization in the RkiosPortMan Port Review Process
The Catalyst 4500 can display high CPU utilization in the RkiosPortMan Port Review process in the output of the show platform health command in Cisco IOS Software Release 122(25)EWA and 122(25)EWA1 Cisco bug ID CSCeh08768 ( registered customers only) causes the high utilization which Cisco IOS Software Release 122(25)EWA2 resolves This process is a background process and does not affect the stability of the Catalyst 4500 switches
Switchshow platform health CPU CPU RunTimeMax Priority Average CPU Total Target Actual Target Actual Fg Bg 5Sec Min Hour CPULj-poll 100 002 2 1 100 500 0 0 0 109GalChassisVp-review 300 029 10 3 100 500 0 0 0 1115S2w-JobEventSchedule 1000 032 10 7 100 500 0 0 0 1014
--- Output suppressed
K2 Packet Memory Dia 200 000 15 8 100 500 0 1 1 4546
K2 L2 Aging Table Re 200 012 20 3 100 500 0 0 0 722RkiosPortMan Port Re 200 8792 12 7 100 500 99 99 89 105236Rkios Module State R 400 002 40 1 100 500 0 0 0 128Rkios Online Diag Re 400 002 40 0 100 500 0 0 0 115
High CPU Utilization When Connected to an IP Phone with the Use of Trunk Ports
If a port is configured for both the voice VLAN option and the access VLAN option the port acts as a multi-VLAN access port The advantage is that only those VLANs that are configured for the voice and access VLAN options are trunked
The VLANs that are trunked to the phone increase the number of STP instances The switch manages the STP instances Management of the increase in STP instances also increases the STP CPU utilization
The trunking of all the VLANs also causes unnecessary broadcast multicast and unknown unicast traffic to hit the phone link
Switchshow processes cpuCPU utilization for five seconds 690 one minute 72 five minutes 73 PID Runtime(ms) Invoked uSecs 5Sec 1Min 5Min TTY Process 1 4 165 24 000 000 000 0 Chunk Manager 2 29012 739091 39 000 000 000 0 Load Meter 3 67080 13762 4874 000 000 000 0 SpanTree Helper 4 0 1 0 000 000 000 0 Deferred Events 5 0 2 0 000 000 000 0 IpSecMibTopN 6 4980144 570766 8725 000 009 011 0 Check heaps 26 539173952 530982442 1015 1309 1305 1320 0 Cat4k Mgmt HiPri 27 716335120 180543127 3967 1761 1819 1841 0 Cat4k Mgmt LoPri 33 1073728 61623 17424 000 003 000
0 Per-minute Jobs 34 1366717824 231584970 5901 3899 3890 3892 0 Spanning Tree 35 2218424 18349158 120 000 003 002 0 DTP Protocol 36 5160 369525 13 000 000 000 0 Ethchnl 37 271016 2308022 117 000 000 000 0 VLAN Manager 38 958084 3965585 241 000 001 001 0 UDLD 39 1436 51011 28 000 000 000 0 DHCP Snooping 40 780 61658 12 000 000 000 0 Port-Security 41 1355308 12210934 110 000 001 000 0 IP Input
High CPU Utilization with RSPAN and Layer 3 Control Packets
Layer 3 control packets that are captured with RSPAN are destined to CPU rather than just the RSPAN destination interface which causes high CPU The L3 control packets are captured by static CAM entries with forward to CPU action The static CAM entries are global to all VLANs In order to avoid unnecessary CPU flooding use the Per-VLAN Control Traffic Intercept feature available in Cisco IOS software releases 122(37)SG and later
Switch(config) access-list hardware capture mode vlan
Static ACLs are installed at the top in input feature TCAM to capture control packets destined to well known IP multicast addresses in the 22400 range Static ACLs are installed at boot time and appear before any user configured ACL Static ACLs are always hit first and intercept control traffic to CPU on all VLANs
Per-VLAN control traffic intercept feature provide selective per-VLAN path managed mode of capturing control traffic The corresponding static CAM entries in input feature TCAM are invalidated in the new mode Control packets are captured by feature specific ACL attached to VLANs on which snooping or routing features are enabled There is no feature specific ACL attached to RSPAN VLAN Therefore all layer 3 control packets received from RSPAN VLAN are not forwarded to CPU
Troubleshooting Tools to Analyze the Traffic Destined to the CPU
As this document has shown traffic that is destined to the CPU is one of the major causes of high CPU utilization on the Catalyst 4500 The CPU-destined traffic can be either intentional because of the configuration or unintentional because of misconfiguration or a denial-of-service attack The CPU has an in-built QoS mechanism to prevent any adverse network effects because of this traffic However identify the root cause of CPU-bound traffic and eliminate the traffic if it is undesirable
Tool 1 Monitor the CPU Traffic with SPANmdashCisco IOS Software Release 121(19)EW and Later
The Catalyst 4500 allows for the monitor of the CPU-bound traffic either ingress or egress with the use of the standard SPAN function The destination interface connects to a packet monitor or an administrator laptop that runs packet sniffer software This tool helps to quickly and accurately analyze the traffic that the CPU processes The tool provides the ability to monitor individual queues that are bound to the CPU packet engine
Note The switching engine has 32 queues for the CPU traffic and the CPU packet engine has 16 queues
Switch(config)monitor session 1 source cpu both Monitor received and transmitted traffic queue SPAN source CPU queue rx Monitor received traffic only tx Monitor transmitted traffic only ltcrgt Switch(config)monitor session 1 source cpu queue lt1-32gt SPAN source CPU queue numbers acl Input and output ACL [13-20] adj-same-if Packets routed to the incoming interface [7] all All queues [1-32] bridged L2bridged packets [29-32] control-packet Layer 2 Control Packets [5] mtu-exceeded Output interface MTU exceeded [9] nfl Packets sent to CPU by netflow (unused) [8] routed L3routed packets [21-28] rpf-failure Multicast RPF Failures [6] span SPAN to CPU (unused) [11] unknown-sa Packets with missing source address [10] Switch(config)monitor session 1 source cpu queue all rx Switch(config)monitor session 1 destination interface gigabitethernet 13 Switch(config)end 4w6d SYS-5-CONFIG_I Configured from console by console
Switchshow monitor session 1 Session 1 --------- Type Local Session Source Ports RX Only CPU Destination Ports Gi13 Encapsulation Native Ingress Disabled Learning Disabled
If you connect a PC that runs a sniffer program you can quickly analyze the traffic In the output that appears in the window in this section you can see that the cause of the high CPU utilization is an excessive number of STP BPDUs
Note STP BPDUs in the CPU sniffer is normal But if you see more than you expect you may have exceeded the recommended limits for your Supervisor Engine See the A High Number of Spanning-Tree Port Instances section of this document for more information
Tool 2 In-Built CPU SniffermdashCisco IOS Software Release 122(20)EW and Later
The Catalyst 4500 provides an in-built CPU sniffer and decoder to quickly identify the traffic that hits the CPU You can enable this facility with the debug command as the example in this section shows This features implements a circular buffer that can retain 1024 packets at a time As new packets arrive they overwrite the older packets This feature is safe to use when you troubleshoot high CPU utilization issues
Switchdebug platform packet all receive buffer platform packet debugging is on Switchshow platform cpu packet buffered Total Received Packets Buffered 36 ------------------------------------- Index 0 7 days 2363237214 - RxVlan 99 RxPort Gi448 Priority Crucial Tag Dot1Q Tag Event Control Packet
Flags 0x40 Size 68 Eth Src 00-0F-F7-AC-EE-4F Dst 01-00-0C-CC-CC-CD TypeLen 0x0032 Remaining data 0 0xAA 0xAA 0x3 0x0 0x0 0xC 0x1 0xB 0x0 0x0 10 0x0 0x0 0x0 0x80 0x0 0x0 0x2 0x16 0x63 0x28 20 0x62 0x0 0x0 0x0 0x0 0x80 0x0 0x0 0x2 0x16 30 0x63 0x28 0x62 0x80 0xF0 0x0 0x0 0x14 0x0 0x2 40 0x0 0xF 0x0 0x0 0x0 0x0 0x0 0x2 0x0 0x63 Index 1 7 days 23633180863 - RxVlan 1 RxPort Gi448 Priority Crucial Tag Dot1Q Tag Event Control Packet Flags 0x40 Size 68 Eth Src 00-0F-F7-AC-EE-4F Dst 01-00-0C-CC-CC-CD TypeLen 0x0032 Remaining data 0 0xAA 0xAA 0x3 0x0 0x0 0xC 0x1 0xB 0x0 0x0 10 0x0 0x0 0x0 0x80 0x0 0x0 0x2 0x16 0x63 0x28 20 0x62 0x0 0x0 0x0 0x0 0x80 0x0 0x0 0x2 0x16 30 0x63 0x28 0x62 0x80 0xF0 0x0 0x0 0x14 0x0 0x2 40 0x0 0xF 0x0 0x0 0x0 0x0 0x0 0x2 0x0 0x63
Note The CPU utilization when you issue a debug command is always almost 100 It is normal to have high CPU utilization when you issue a debug command
Tool 3 Identify the Interface That Sends Traffic to the CPUmdashCisco IOS Software Release 122(20)EW and Later
Catalyst 4500 provides another useful tool to identify the top interfaces that send trafficpackets for CPU processing This tool helps you quickly identify an errand device that sends a high number of broadcast or other denial-of-service attacks to the CPU This feature is also safe to use when you troubleshoot high CPU utilization issues
Switchdebug platform packet all countplatform packet debugging is on Switchshow platform cpu packet statistics
--- Output suppressed
Packets Transmitted from CPU per Output Interface
Interface Total 5 sec avg 1 min avg 5 min avg 1 hour avg
---------------------- --------------- --------- --------- --------- ---------- Gi447 1150 1 5 10 0 Gi448 50 1 0 0 0
Packets Received at CPU per Input Interface
Interface Total 5 sec avg 1 min avg 5 min avg 1 hour avg ---------------------- --------------- --------- --------- --------- ---------- Gi447 23130 5 10 50 20Gi448 50 1 0 0 0
Note The CPU utilization when you issue a debug command is always almost 100 It is normal to have high CPU utilization when you issue a debug command
Summary
The Catalyst 4500 switches handle a high rate of IP version 4 (IPv4) packet forwarding in hardware Some of the features or exceptions can cause the forward of some packets via the CPU process path The Catalyst 4500 uses a sophisticated QoS mechanism to handle CPU-bound packets This mechanism ensures reliability and stability of the switches and at the same time maximizes the CPU for the software forwarding of packets Cisco IOS Software Release 122(25)EWA2 and later provide additional enhancements for packetprocess handling as well as accounting The Catalyst 4500 also has sufficient commands and powerful tools to aid in the identification of the root cause of high CPU-utilization scenarios But in most cases high CPU utilization on the Catalyst 4500 is not a cause of network instability nor a cause for concern
Cisco Support Community - Featured Conversations
Cisco Support Community is a forum for you to ask and answer questions share suggestions and collaborate with your peers Below are just some of the most recent and relevant conversations happening right now
Want to see more Join us by clicking here
High CPU Utilization on Cisco IOSpramodprasad5 Replies2 years 8 months ago
High CPU utilization on Cisco 4500andrewswanson7 Replies1 year 6 months ago
Process causes high CPU utilization ondsalamanca5 Replies3 years 4 months ago
HIGH UTILIZATION of 4500 Catalystsohaildxbfze2 Replies1 year 9 months ago
High CPu utilization in 4500vaibhav-g1 Reply3 months 6 days ago
High CPU utilization on Catalyst 3500hestholmt1 Reply7 years 6 months ago
High CPU Utilizationheidemat011 Reply3 years 4 months ago
4507R IOS Catalyst - High CPUshakeelahmadch4 Replies2 years 7 months ago
4506 CPU utilization averagehttpssupportforumsciscocompeopleluizalexandrepaiva40gmailcom6 Replies2 years 9 months ago
High CPU Utilization Catalyst 2924 httpssupportforumsciscocompeoplegfiguereo40bpdcomdo2 Replies5 years 11 months ago Subscribe Start A New Discussion
Related Information
CPU Utilization on Catalyst 45004000 2948G 2980G and 4912G Switches That Run
CatOS Software LAN Product Support Pages LAN Switching Support Page Technical Support amp Documentation - Cisco Systems
Contacts amp Feedback | Help | Site Map copy 2008 - 2009 Cisco Systems Inc All rights reserved Terms amp Conditions | Privacy Statement | Cookie Policy | Trademarks of Cisco Systems Inc
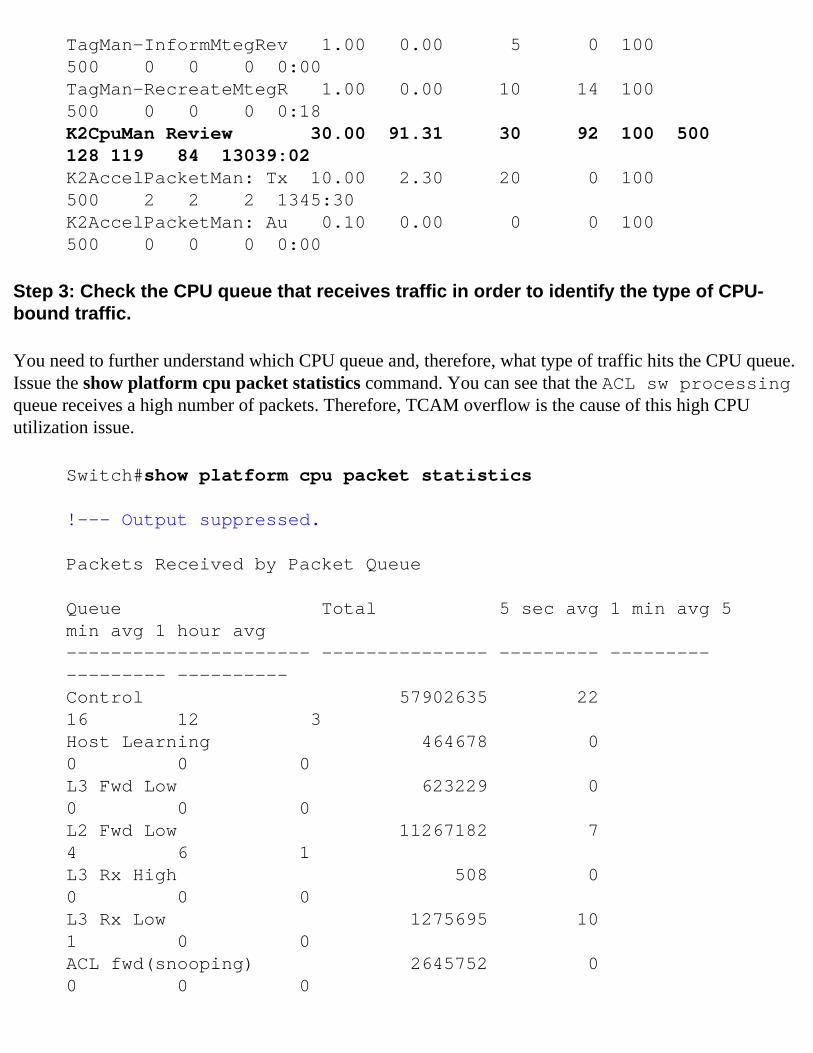
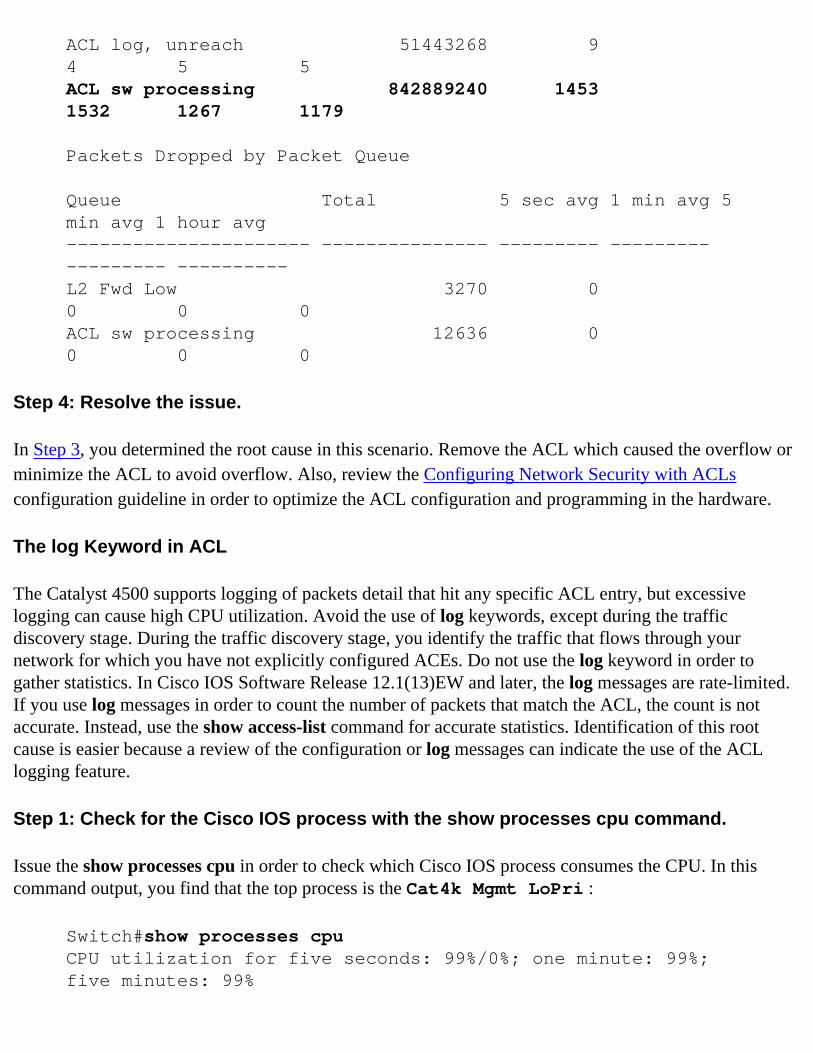
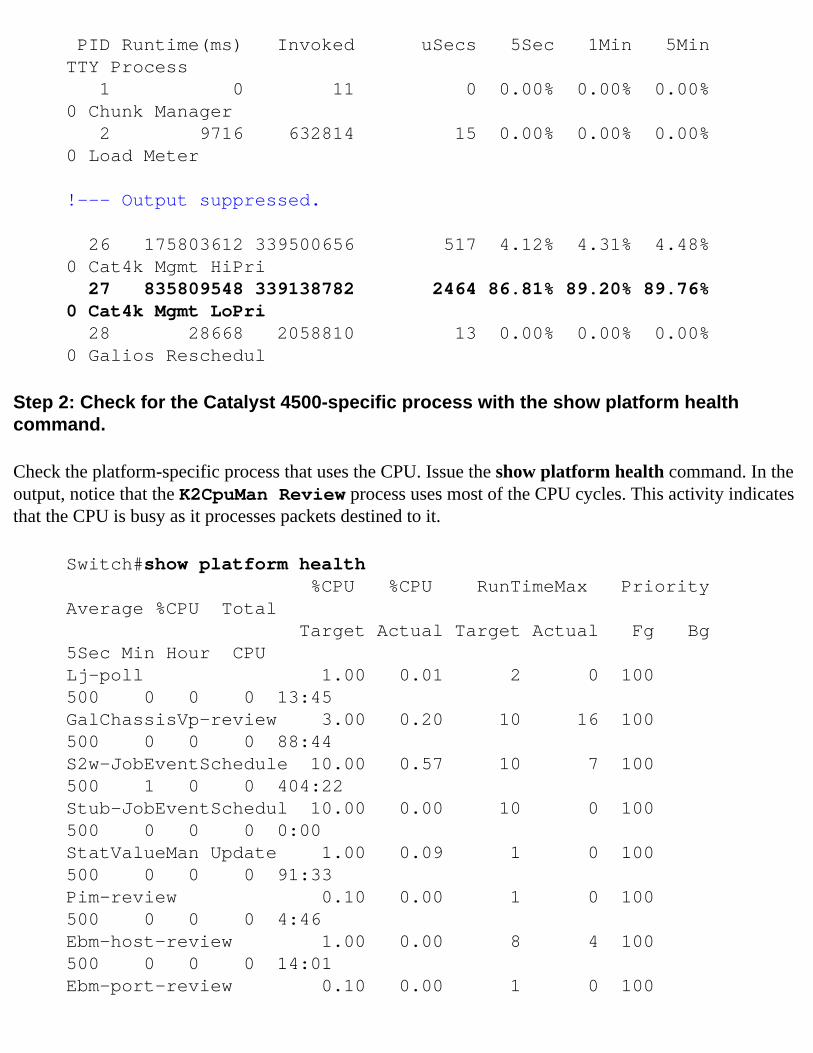
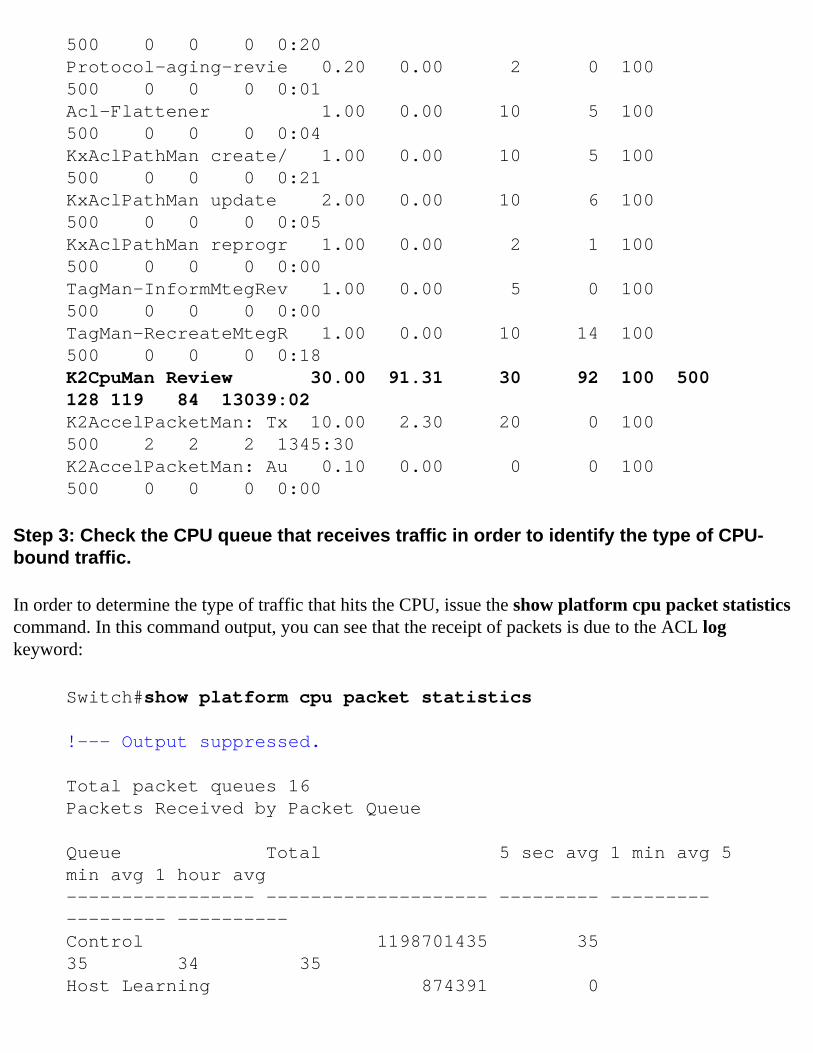
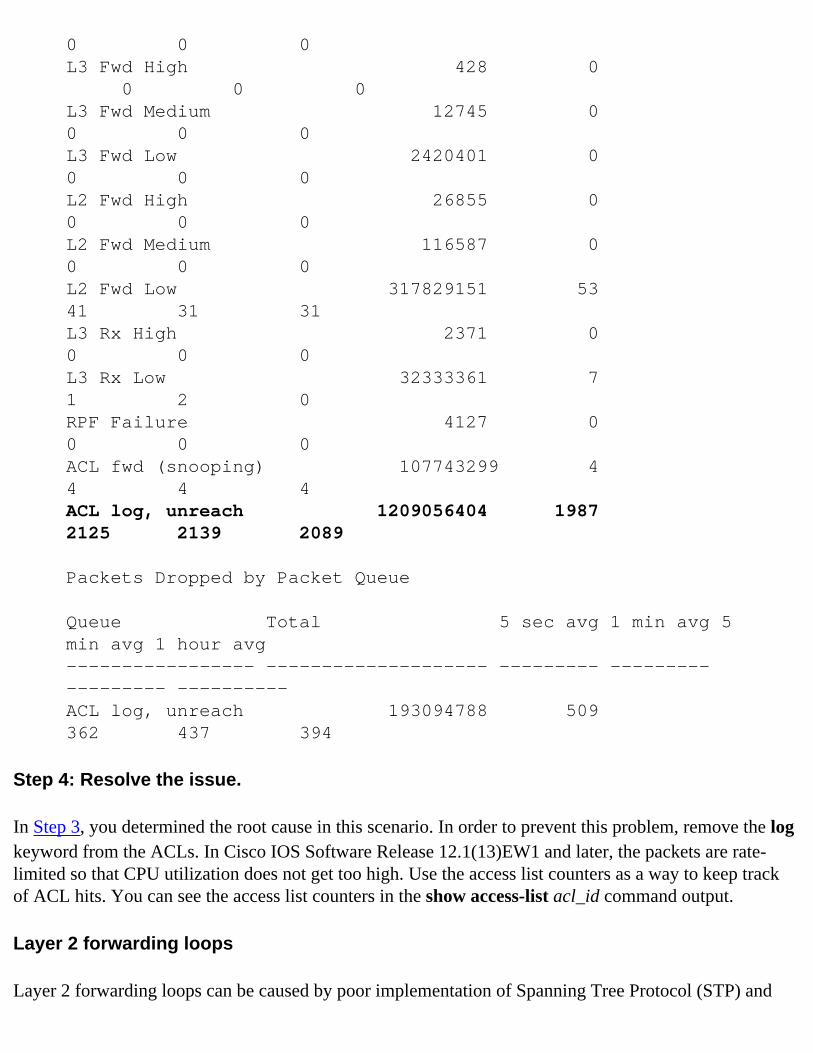
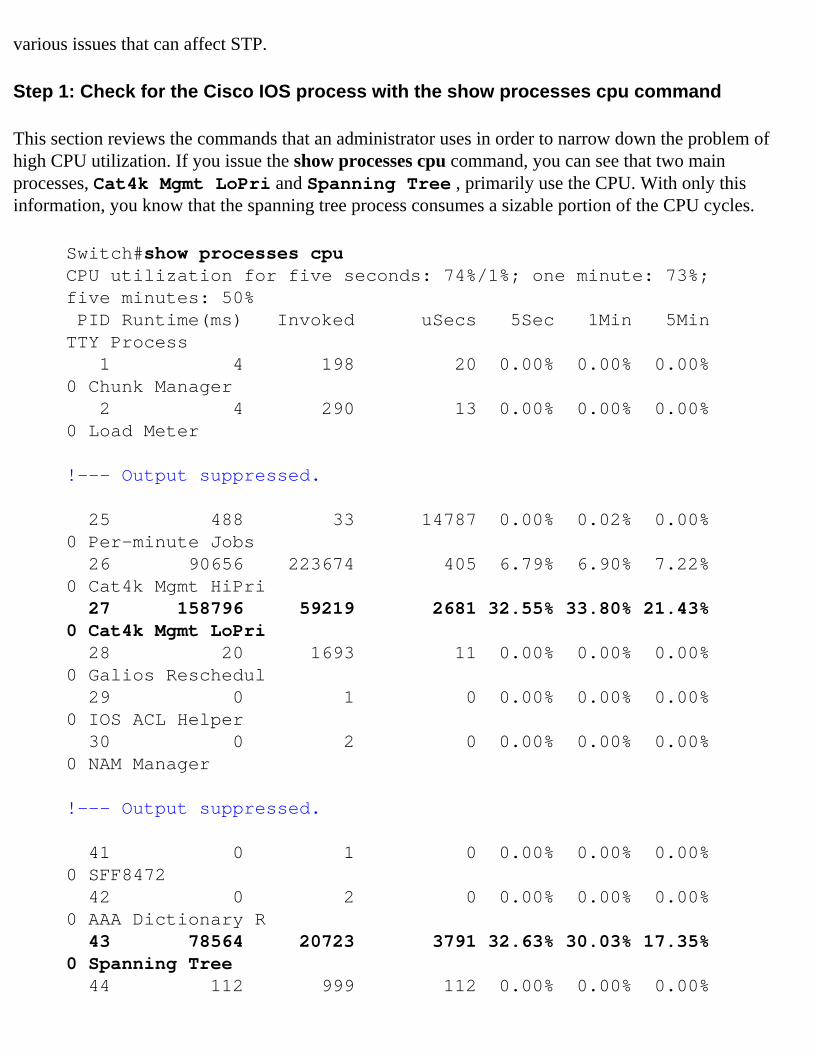
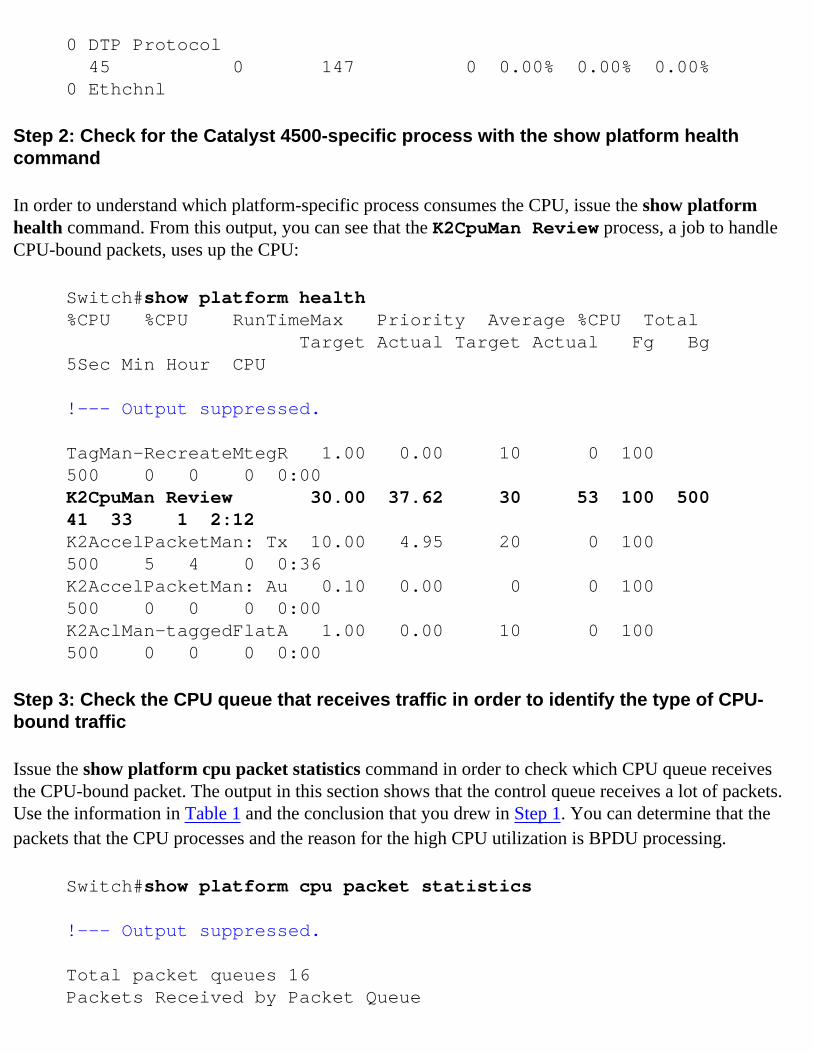
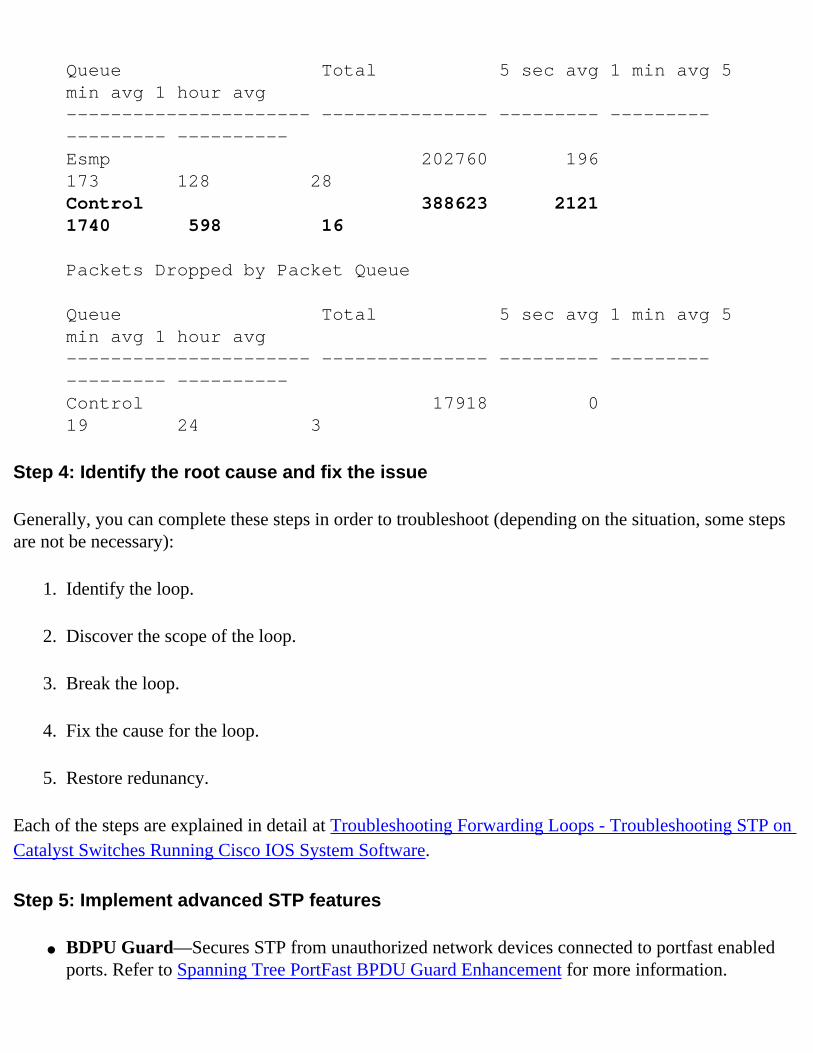
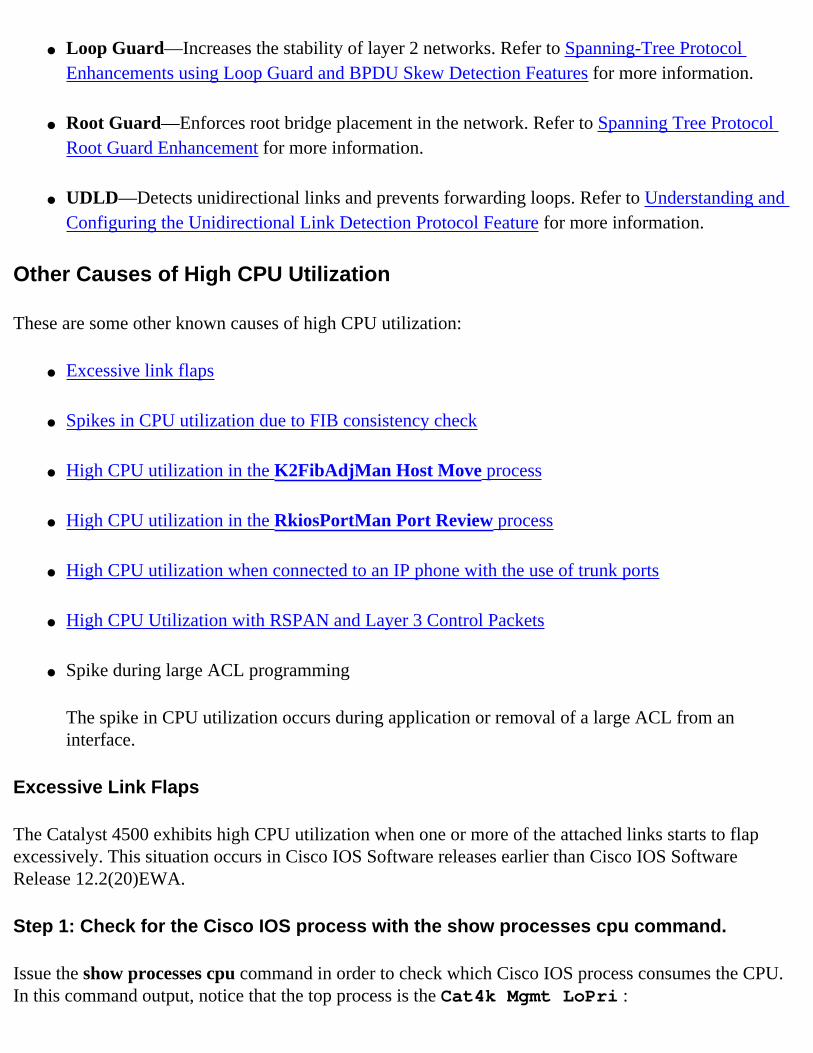
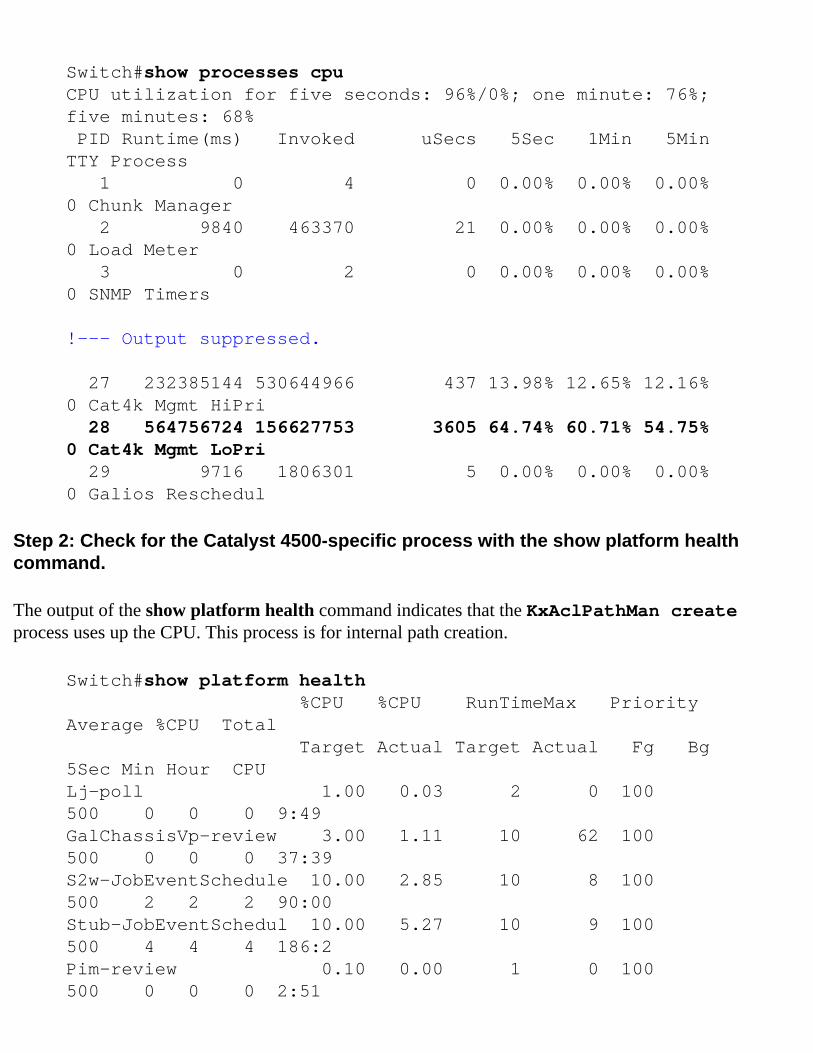
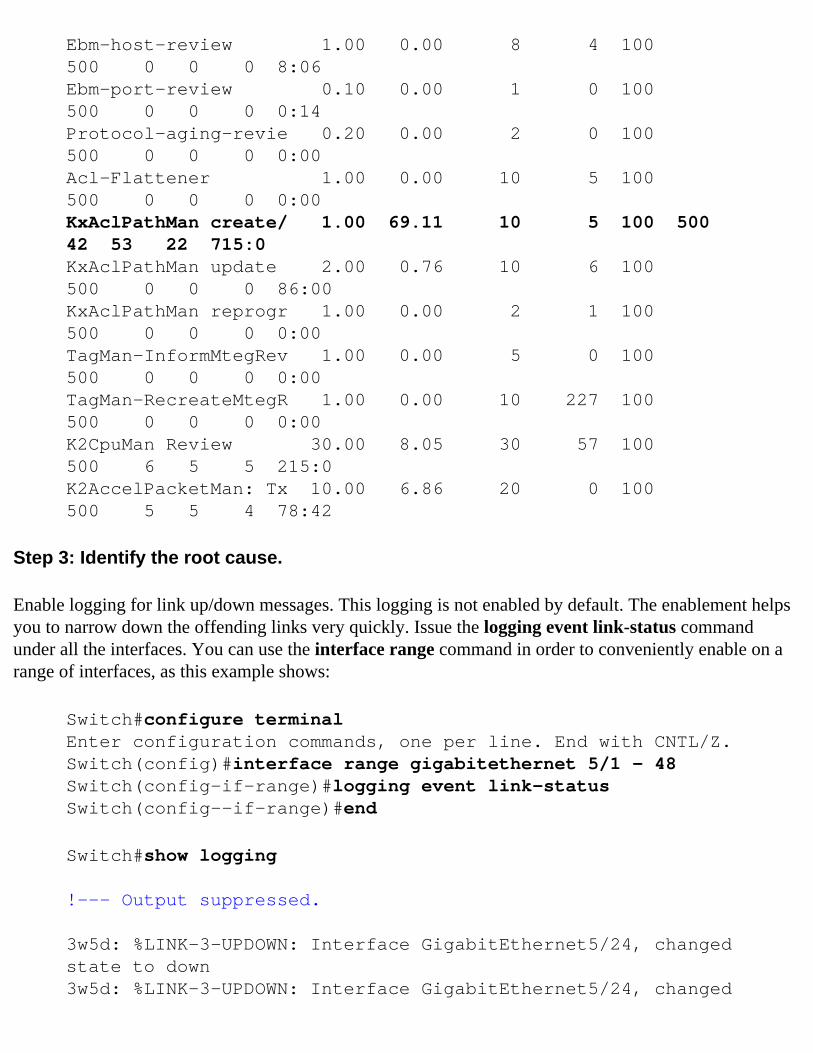
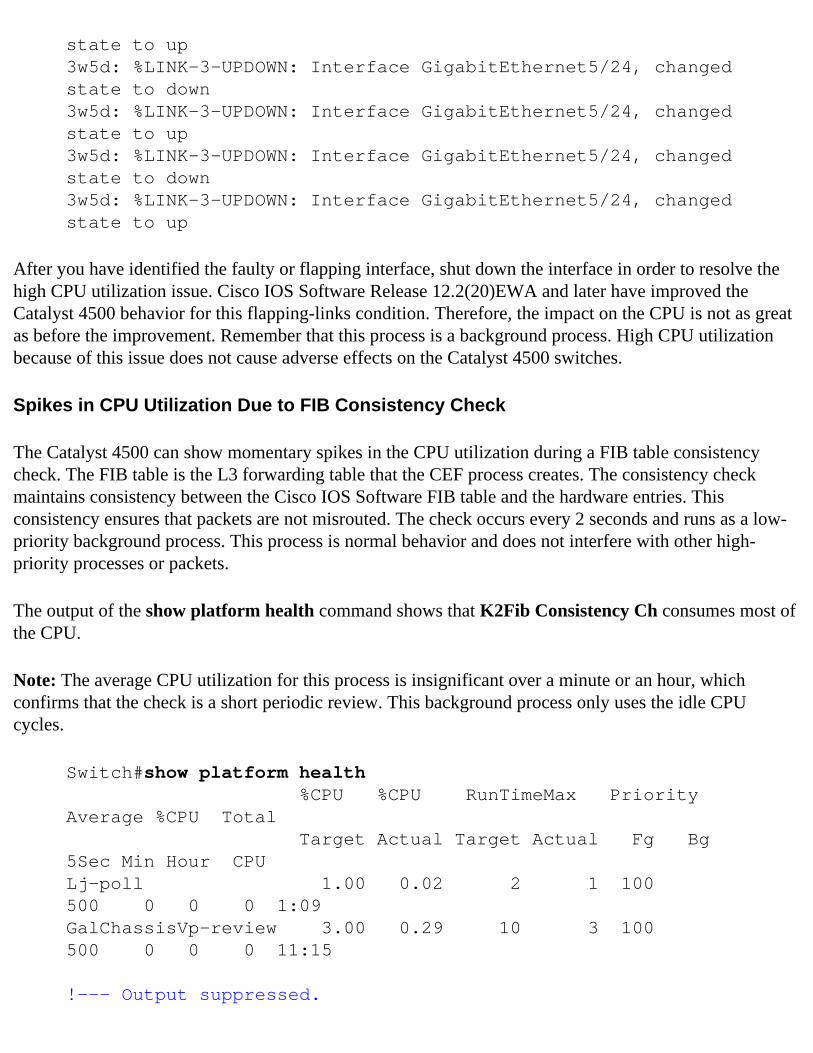
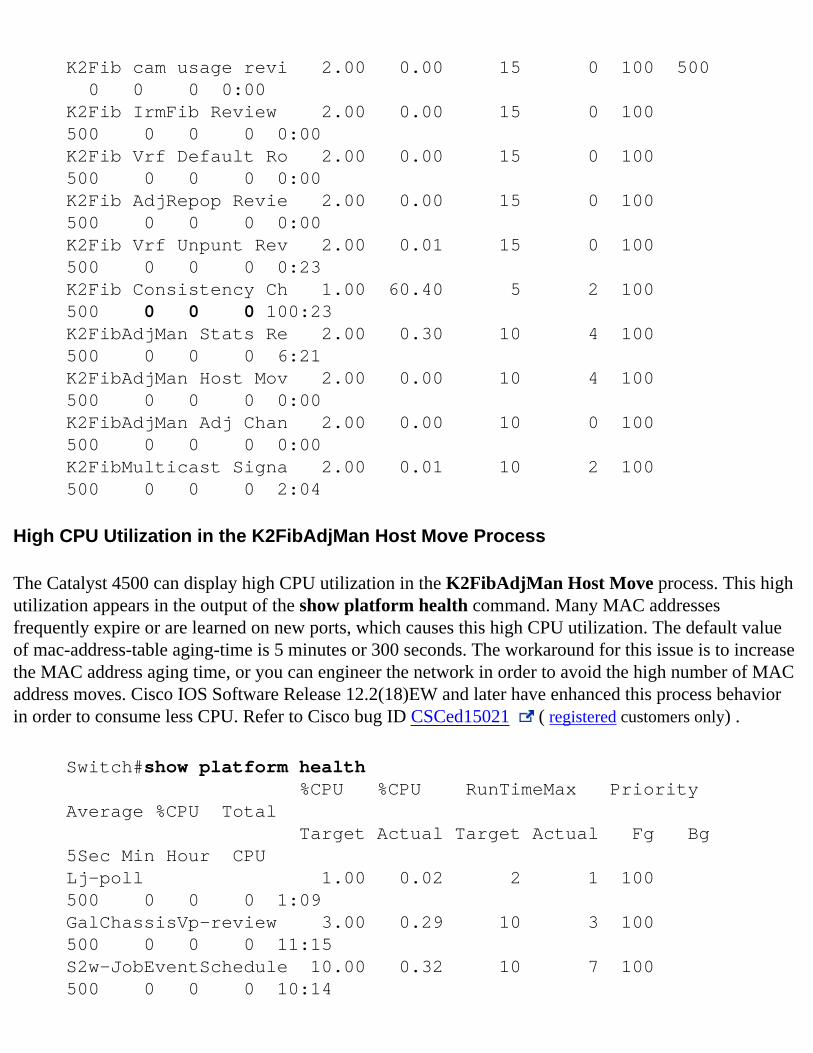
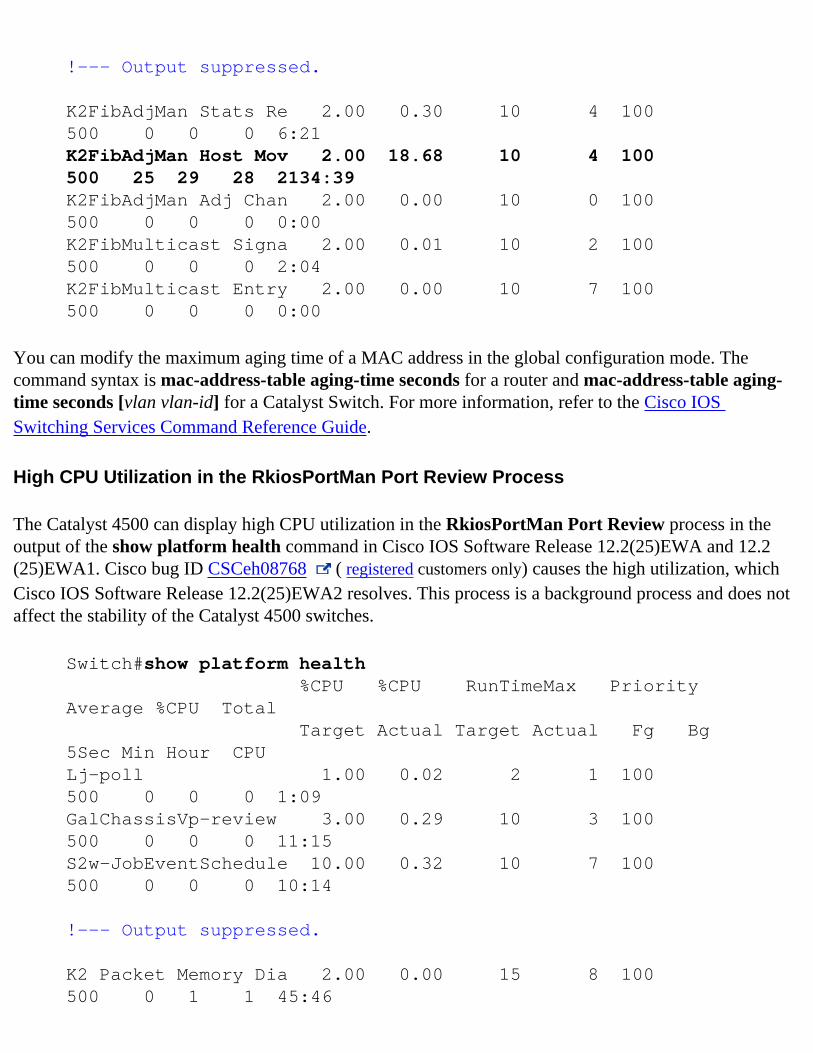
--- Output suppressed
K2FibAdjMan Stats Re 200 030 10 4 100 500 0 0 0 621K2FibAdjMan Host Mov 200 1868 10 4 100 500 25 29 28 213439K2FibAdjMan Adj Chan 200 000 10 0 100 500 0 0 0 000K2FibMulticast Signa 200 001 10 2 100 500 0 0 0 204K2FibMulticast Entry 200 000 10 7 100 500 0 0 0 000
You can modify the maximum aging time of a MAC address in the global configuration mode The command syntax is mac-address-table aging-time seconds for a router and mac-address-table aging-time seconds [vlan vlan-id] for a Catalyst Switch For more information refer to the Cisco IOS Switching Services Command Reference Guide
High CPU Utilization in the RkiosPortMan Port Review Process
The Catalyst 4500 can display high CPU utilization in the RkiosPortMan Port Review process in the output of the show platform health command in Cisco IOS Software Release 122(25)EWA and 122(25)EWA1 Cisco bug ID CSCeh08768 ( registered customers only) causes the high utilization which Cisco IOS Software Release 122(25)EWA2 resolves This process is a background process and does not affect the stability of the Catalyst 4500 switches
Switchshow platform health CPU CPU RunTimeMax Priority Average CPU Total Target Actual Target Actual Fg Bg 5Sec Min Hour CPULj-poll 100 002 2 1 100 500 0 0 0 109GalChassisVp-review 300 029 10 3 100 500 0 0 0 1115S2w-JobEventSchedule 1000 032 10 7 100 500 0 0 0 1014
--- Output suppressed
K2 Packet Memory Dia 200 000 15 8 100 500 0 1 1 4546
K2 L2 Aging Table Re 200 012 20 3 100 500 0 0 0 722RkiosPortMan Port Re 200 8792 12 7 100 500 99 99 89 105236Rkios Module State R 400 002 40 1 100 500 0 0 0 128Rkios Online Diag Re 400 002 40 0 100 500 0 0 0 115
High CPU Utilization When Connected to an IP Phone with the Use of Trunk Ports
If a port is configured for both the voice VLAN option and the access VLAN option the port acts as a multi-VLAN access port The advantage is that only those VLANs that are configured for the voice and access VLAN options are trunked
The VLANs that are trunked to the phone increase the number of STP instances The switch manages the STP instances Management of the increase in STP instances also increases the STP CPU utilization
The trunking of all the VLANs also causes unnecessary broadcast multicast and unknown unicast traffic to hit the phone link
Switchshow processes cpuCPU utilization for five seconds 690 one minute 72 five minutes 73 PID Runtime(ms) Invoked uSecs 5Sec 1Min 5Min TTY Process 1 4 165 24 000 000 000 0 Chunk Manager 2 29012 739091 39 000 000 000 0 Load Meter 3 67080 13762 4874 000 000 000 0 SpanTree Helper 4 0 1 0 000 000 000 0 Deferred Events 5 0 2 0 000 000 000 0 IpSecMibTopN 6 4980144 570766 8725 000 009 011 0 Check heaps 26 539173952 530982442 1015 1309 1305 1320 0 Cat4k Mgmt HiPri 27 716335120 180543127 3967 1761 1819 1841 0 Cat4k Mgmt LoPri 33 1073728 61623 17424 000 003 000
0 Per-minute Jobs 34 1366717824 231584970 5901 3899 3890 3892 0 Spanning Tree 35 2218424 18349158 120 000 003 002 0 DTP Protocol 36 5160 369525 13 000 000 000 0 Ethchnl 37 271016 2308022 117 000 000 000 0 VLAN Manager 38 958084 3965585 241 000 001 001 0 UDLD 39 1436 51011 28 000 000 000 0 DHCP Snooping 40 780 61658 12 000 000 000 0 Port-Security 41 1355308 12210934 110 000 001 000 0 IP Input
High CPU Utilization with RSPAN and Layer 3 Control Packets
Layer 3 control packets that are captured with RSPAN are destined to CPU rather than just the RSPAN destination interface which causes high CPU The L3 control packets are captured by static CAM entries with forward to CPU action The static CAM entries are global to all VLANs In order to avoid unnecessary CPU flooding use the Per-VLAN Control Traffic Intercept feature available in Cisco IOS software releases 122(37)SG and later
Switch(config) access-list hardware capture mode vlan
Static ACLs are installed at the top in input feature TCAM to capture control packets destined to well known IP multicast addresses in the 22400 range Static ACLs are installed at boot time and appear before any user configured ACL Static ACLs are always hit first and intercept control traffic to CPU on all VLANs
Per-VLAN control traffic intercept feature provide selective per-VLAN path managed mode of capturing control traffic The corresponding static CAM entries in input feature TCAM are invalidated in the new mode Control packets are captured by feature specific ACL attached to VLANs on which snooping or routing features are enabled There is no feature specific ACL attached to RSPAN VLAN Therefore all layer 3 control packets received from RSPAN VLAN are not forwarded to CPU
Troubleshooting Tools to Analyze the Traffic Destined to the CPU
As this document has shown traffic that is destined to the CPU is one of the major causes of high CPU utilization on the Catalyst 4500 The CPU-destined traffic can be either intentional because of the configuration or unintentional because of misconfiguration or a denial-of-service attack The CPU has an in-built QoS mechanism to prevent any adverse network effects because of this traffic However identify the root cause of CPU-bound traffic and eliminate the traffic if it is undesirable
Tool 1 Monitor the CPU Traffic with SPANmdashCisco IOS Software Release 121(19)EW and Later
The Catalyst 4500 allows for the monitor of the CPU-bound traffic either ingress or egress with the use of the standard SPAN function The destination interface connects to a packet monitor or an administrator laptop that runs packet sniffer software This tool helps to quickly and accurately analyze the traffic that the CPU processes The tool provides the ability to monitor individual queues that are bound to the CPU packet engine
Note The switching engine has 32 queues for the CPU traffic and the CPU packet engine has 16 queues
Switch(config)monitor session 1 source cpu both Monitor received and transmitted traffic queue SPAN source CPU queue rx Monitor received traffic only tx Monitor transmitted traffic only ltcrgt Switch(config)monitor session 1 source cpu queue lt1-32gt SPAN source CPU queue numbers acl Input and output ACL [13-20] adj-same-if Packets routed to the incoming interface [7] all All queues [1-32] bridged L2bridged packets [29-32] control-packet Layer 2 Control Packets [5] mtu-exceeded Output interface MTU exceeded [9] nfl Packets sent to CPU by netflow (unused) [8] routed L3routed packets [21-28] rpf-failure Multicast RPF Failures [6] span SPAN to CPU (unused) [11] unknown-sa Packets with missing source address [10] Switch(config)monitor session 1 source cpu queue all rx Switch(config)monitor session 1 destination interface gigabitethernet 13 Switch(config)end 4w6d SYS-5-CONFIG_I Configured from console by console
Switchshow monitor session 1 Session 1 --------- Type Local Session Source Ports RX Only CPU Destination Ports Gi13 Encapsulation Native Ingress Disabled Learning Disabled
If you connect a PC that runs a sniffer program you can quickly analyze the traffic In the output that appears in the window in this section you can see that the cause of the high CPU utilization is an excessive number of STP BPDUs
Note STP BPDUs in the CPU sniffer is normal But if you see more than you expect you may have exceeded the recommended limits for your Supervisor Engine See the A High Number of Spanning-Tree Port Instances section of this document for more information
Tool 2 In-Built CPU SniffermdashCisco IOS Software Release 122(20)EW and Later
The Catalyst 4500 provides an in-built CPU sniffer and decoder to quickly identify the traffic that hits the CPU You can enable this facility with the debug command as the example in this section shows This features implements a circular buffer that can retain 1024 packets at a time As new packets arrive they overwrite the older packets This feature is safe to use when you troubleshoot high CPU utilization issues
Switchdebug platform packet all receive buffer platform packet debugging is on Switchshow platform cpu packet buffered Total Received Packets Buffered 36 ------------------------------------- Index 0 7 days 2363237214 - RxVlan 99 RxPort Gi448 Priority Crucial Tag Dot1Q Tag Event Control Packet
Flags 0x40 Size 68 Eth Src 00-0F-F7-AC-EE-4F Dst 01-00-0C-CC-CC-CD TypeLen 0x0032 Remaining data 0 0xAA 0xAA 0x3 0x0 0x0 0xC 0x1 0xB 0x0 0x0 10 0x0 0x0 0x0 0x80 0x0 0x0 0x2 0x16 0x63 0x28 20 0x62 0x0 0x0 0x0 0x0 0x80 0x0 0x0 0x2 0x16 30 0x63 0x28 0x62 0x80 0xF0 0x0 0x0 0x14 0x0 0x2 40 0x0 0xF 0x0 0x0 0x0 0x0 0x0 0x2 0x0 0x63 Index 1 7 days 23633180863 - RxVlan 1 RxPort Gi448 Priority Crucial Tag Dot1Q Tag Event Control Packet Flags 0x40 Size 68 Eth Src 00-0F-F7-AC-EE-4F Dst 01-00-0C-CC-CC-CD TypeLen 0x0032 Remaining data 0 0xAA 0xAA 0x3 0x0 0x0 0xC 0x1 0xB 0x0 0x0 10 0x0 0x0 0x0 0x80 0x0 0x0 0x2 0x16 0x63 0x28 20 0x62 0x0 0x0 0x0 0x0 0x80 0x0 0x0 0x2 0x16 30 0x63 0x28 0x62 0x80 0xF0 0x0 0x0 0x14 0x0 0x2 40 0x0 0xF 0x0 0x0 0x0 0x0 0x0 0x2 0x0 0x63
Note The CPU utilization when you issue a debug command is always almost 100 It is normal to have high CPU utilization when you issue a debug command
Tool 3 Identify the Interface That Sends Traffic to the CPUmdashCisco IOS Software Release 122(20)EW and Later
Catalyst 4500 provides another useful tool to identify the top interfaces that send trafficpackets for CPU processing This tool helps you quickly identify an errand device that sends a high number of broadcast or other denial-of-service attacks to the CPU This feature is also safe to use when you troubleshoot high CPU utilization issues
Switchdebug platform packet all countplatform packet debugging is on Switchshow platform cpu packet statistics
--- Output suppressed
Packets Transmitted from CPU per Output Interface
Interface Total 5 sec avg 1 min avg 5 min avg 1 hour avg
---------------------- --------------- --------- --------- --------- ---------- Gi447 1150 1 5 10 0 Gi448 50 1 0 0 0
Packets Received at CPU per Input Interface
Interface Total 5 sec avg 1 min avg 5 min avg 1 hour avg ---------------------- --------------- --------- --------- --------- ---------- Gi447 23130 5 10 50 20Gi448 50 1 0 0 0
Note The CPU utilization when you issue a debug command is always almost 100 It is normal to have high CPU utilization when you issue a debug command
Summary
The Catalyst 4500 switches handle a high rate of IP version 4 (IPv4) packet forwarding in hardware Some of the features or exceptions can cause the forward of some packets via the CPU process path The Catalyst 4500 uses a sophisticated QoS mechanism to handle CPU-bound packets This mechanism ensures reliability and stability of the switches and at the same time maximizes the CPU for the software forwarding of packets Cisco IOS Software Release 122(25)EWA2 and later provide additional enhancements for packetprocess handling as well as accounting The Catalyst 4500 also has sufficient commands and powerful tools to aid in the identification of the root cause of high CPU-utilization scenarios But in most cases high CPU utilization on the Catalyst 4500 is not a cause of network instability nor a cause for concern
Cisco Support Community - Featured Conversations
Cisco Support Community is a forum for you to ask and answer questions share suggestions and collaborate with your peers Below are just some of the most recent and relevant conversations happening right now
Want to see more Join us by clicking here
High CPU Utilization on Cisco IOSpramodprasad5 Replies2 years 8 months ago
High CPU utilization on Cisco 4500andrewswanson7 Replies1 year 6 months ago
Process causes high CPU utilization ondsalamanca5 Replies3 years 4 months ago
HIGH UTILIZATION of 4500 Catalystsohaildxbfze2 Replies1 year 9 months ago
High CPu utilization in 4500vaibhav-g1 Reply3 months 6 days ago
High CPU utilization on Catalyst 3500hestholmt1 Reply7 years 6 months ago
High CPU Utilizationheidemat011 Reply3 years 4 months ago
4507R IOS Catalyst - High CPUshakeelahmadch4 Replies2 years 7 months ago
4506 CPU utilization averagehttpssupportforumsciscocompeopleluizalexandrepaiva40gmailcom6 Replies2 years 9 months ago
High CPU Utilization Catalyst 2924 httpssupportforumsciscocompeoplegfiguereo40bpdcomdo2 Replies5 years 11 months ago Subscribe Start A New Discussion
Related Information
CPU Utilization on Catalyst 45004000 2948G 2980G and 4912G Switches That Run
CatOS Software LAN Product Support Pages LAN Switching Support Page Technical Support amp Documentation - Cisco Systems
Contacts amp Feedback | Help | Site Map copy 2008 - 2009 Cisco Systems Inc All rights reserved Terms amp Conditions | Privacy Statement | Cookie Policy | Trademarks of Cisco Systems Inc
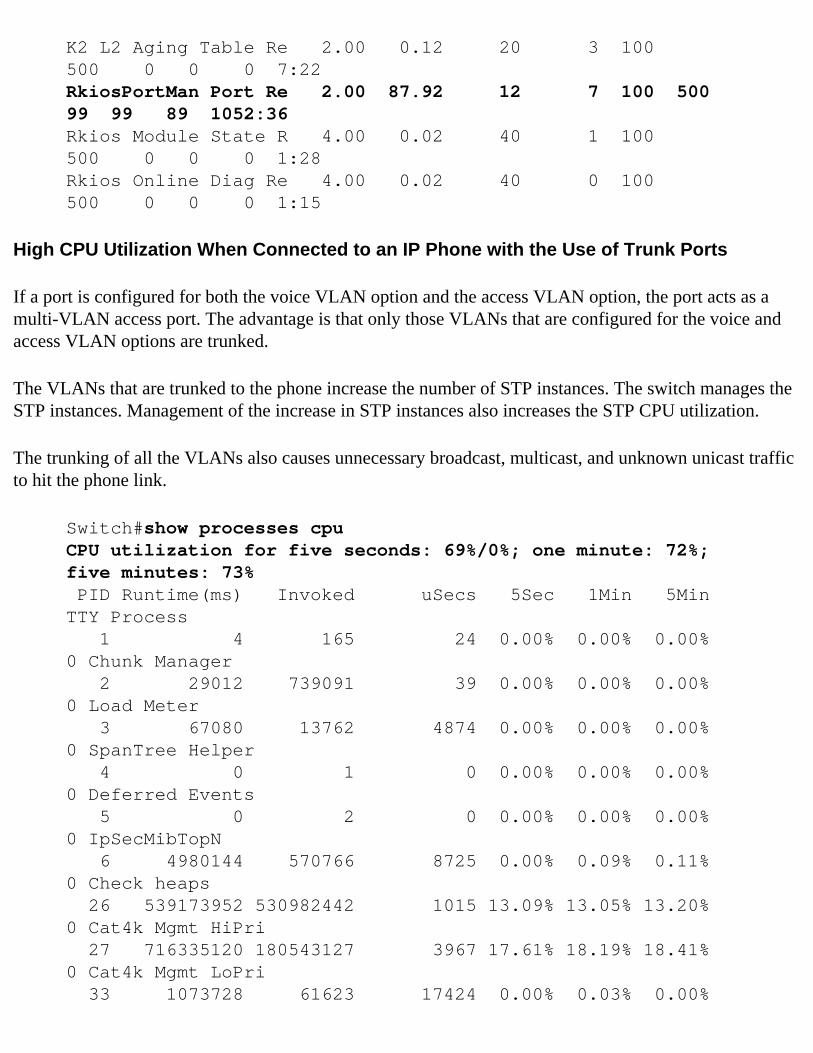
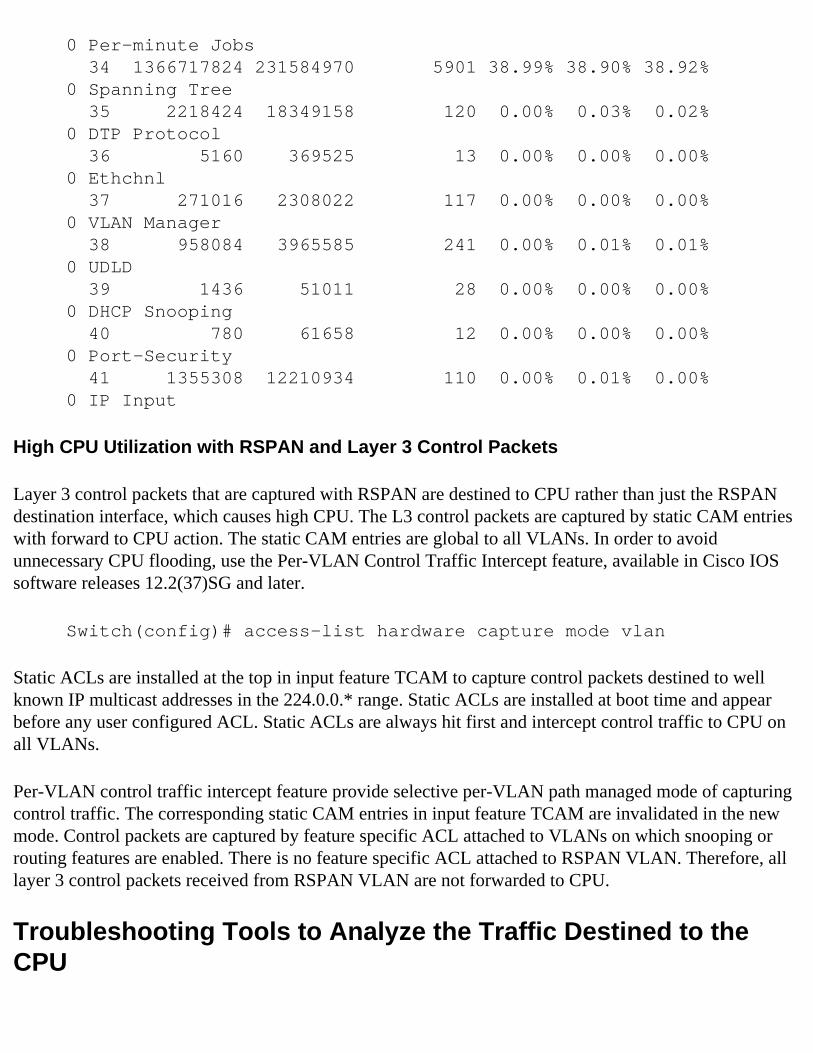
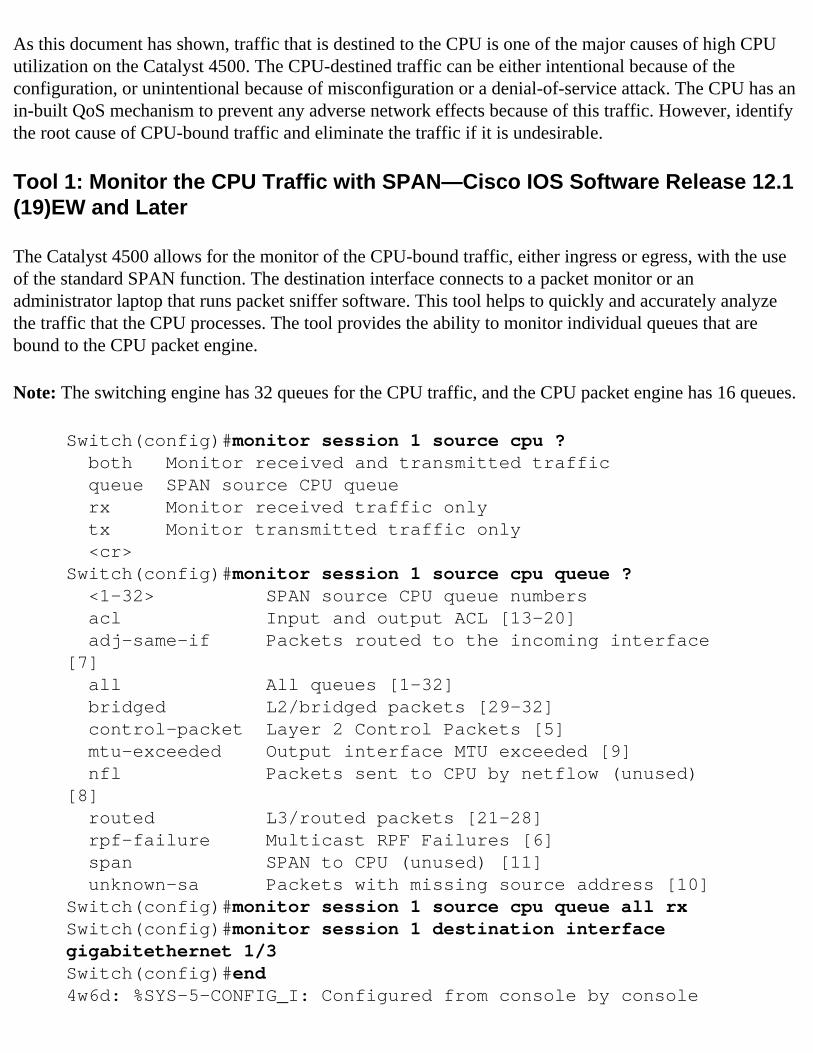
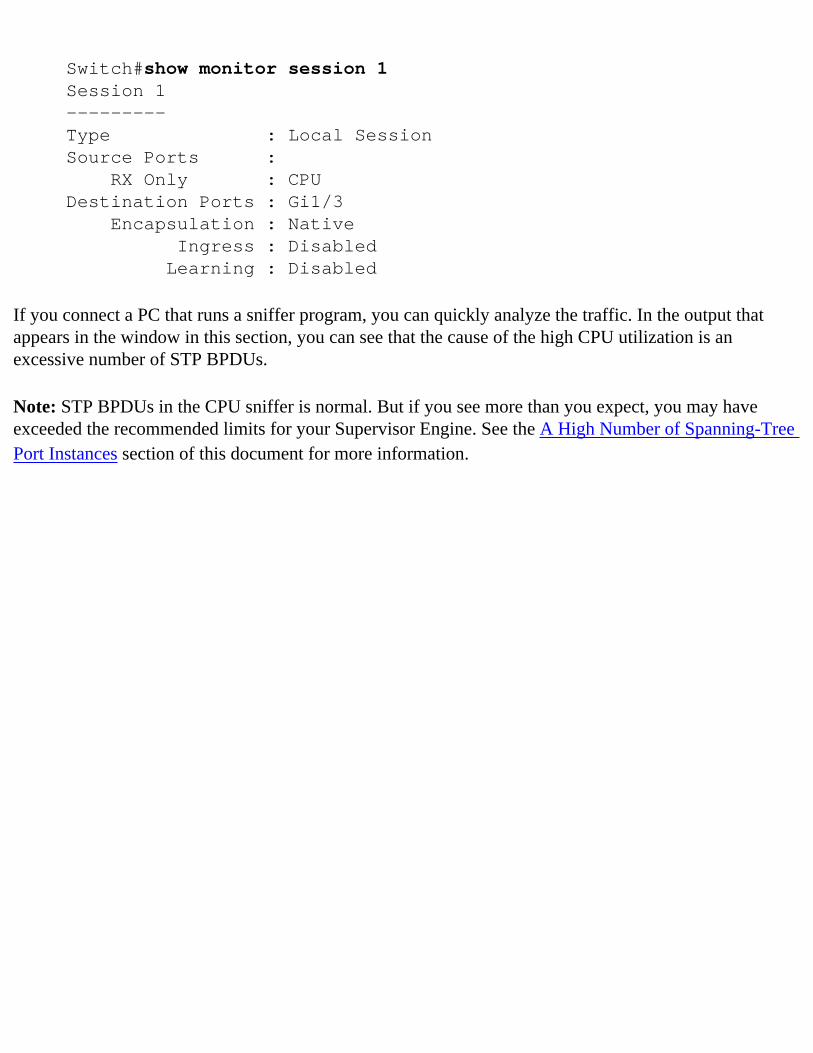
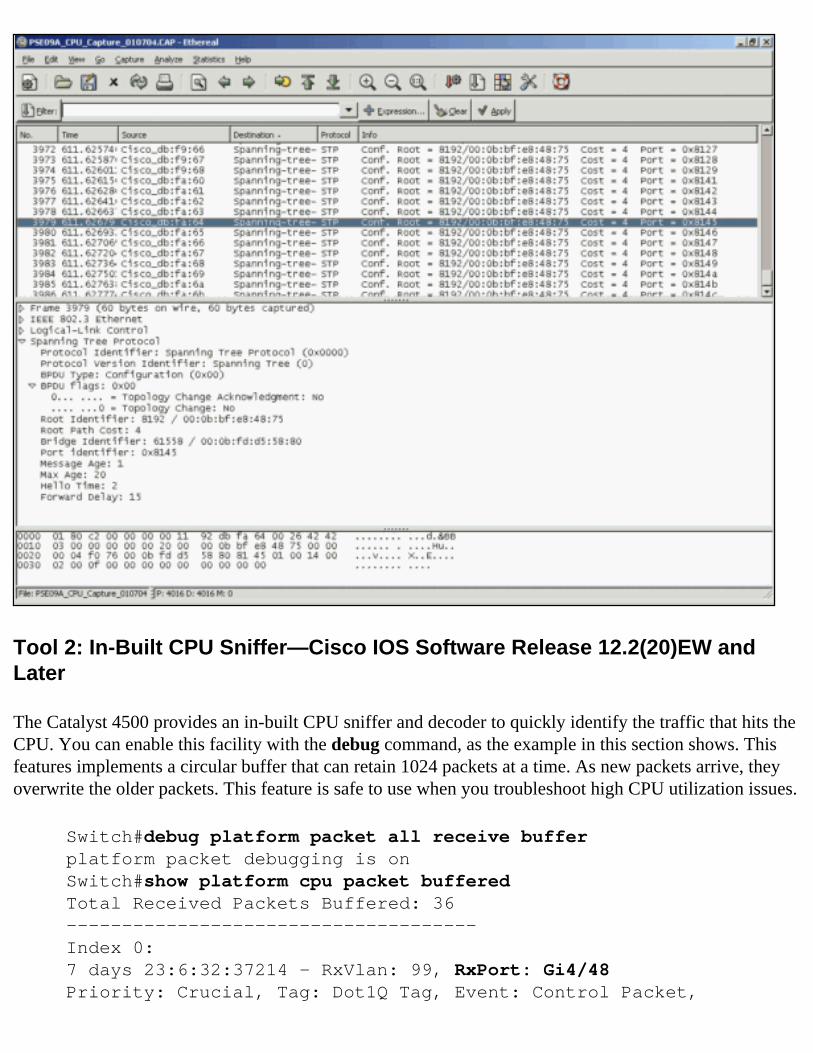
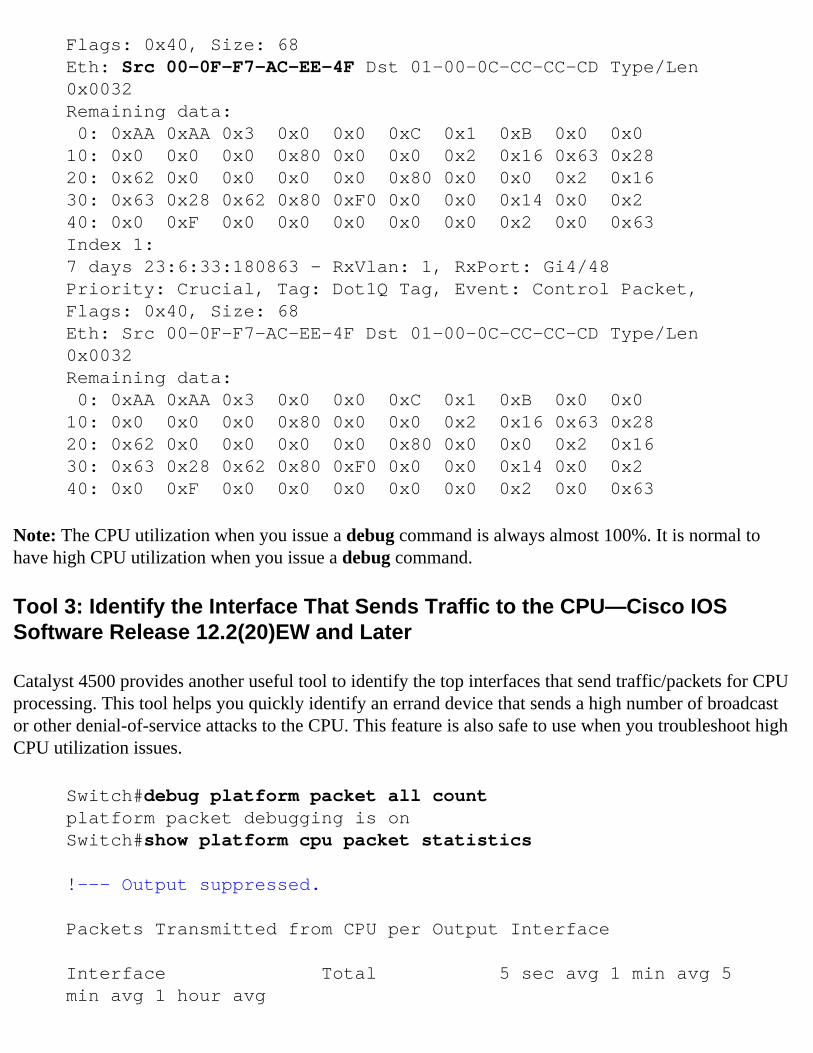
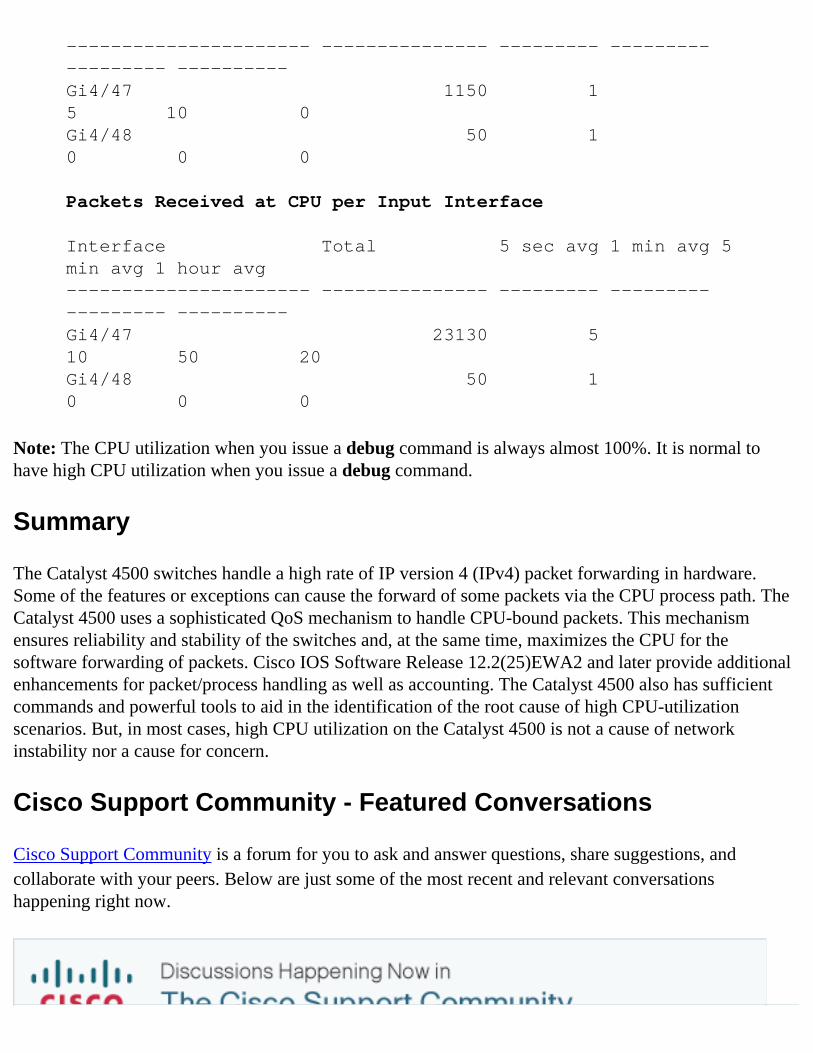