Embed Size (px)
Citation preview

Worked Examples
Wo
rke
d E
xa
mp
les


CAT II Worked examples Page 67
[email protected] Copyright ©2020 Mobius Institute www.mobiusinstitute.com
PRINCIPLES OF VIBRATION
1. The peak amplitude of the waveform below is__________
The Peak to Peak amplitude is ______________
The RMS amplitude is_____________________
2. The peak amplitude of the waveform below is__________
The Peak to Peak amplitude is ______________
The RMS amplitude can be calculated ___________________
3. The period of the waveform below is__________
The frequency in Hz is ________
The frequency in CPM is________
4. The definition of the period is:
Page 68 CAT II Worked examples
[email protected] Copyright ©2020 Mobius Institute www.mobiusinstitute.com
5. The definition of Hz is:
6. The definition of CPM is:
7. The relationship between the period and the frequency in Hz is:
8. One cycle (or one period) of vibration can be described in terms of degrees. How many degrees are in one cycle of vibration?
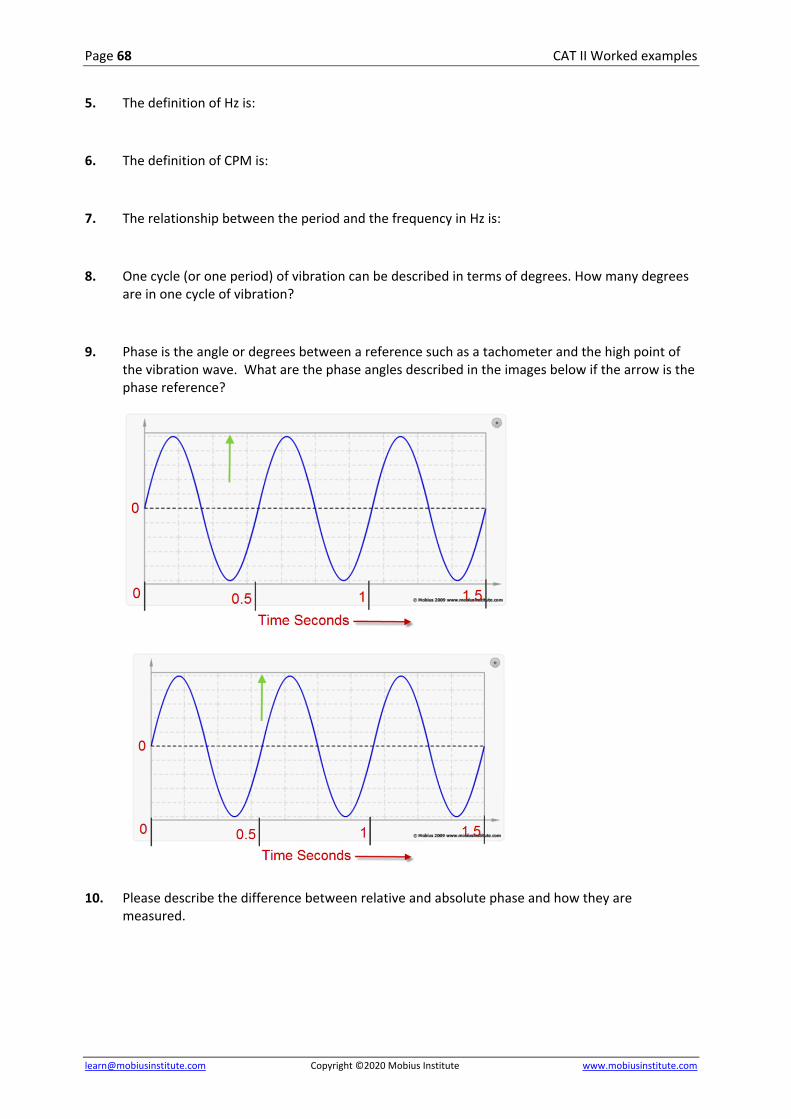
9. Phase is the angle or degrees between a reference such as a tachometer and the high point of the vibration wave. What are the phase angles described in the images below if the arrow is the phase reference?
10. Please describe the difference between relative and absolute phase and how they are measured.

CAT II Worked examples Page 69
[email protected] Copyright ©2020 Mobius Institute www.mobiusinstitute.com
11. Bubble diagrams are often used to document phase readings. Please write the correct phase values in the bubbles below.
12. The arrows in the graphs below represent pulses from a tachometer. What are the phase angles of the two graphs below?
The measurements were taken in the vertical direction on the motor coupled end and pump coupled end of the machine. Please describe how these points are moving relative to one another. Describe this with a bubble diagram.
How else can phase be measured between these two points? (offer 3 options)
13. Please list at least 3 applications for phase measurements
Page 70 CAT II Worked examples
[email protected] Copyright ©2020 Mobius Institute www.mobiusinstitute.com
14. Vibration amplitude is typically measured in one of the following three units:
___________ for low frequencies
___________ for mid frequencies
___________ for high frequencies
These can be measured directly using the following three types of sensors ________, ________, _______ respectively.
15. It is possible to collect data in acceleration and convert it to velocity or displacement via a process called ______________.
16. When converting from acceleration to velocity, the phase:
a. Does not change
b. Changes by 90 degrees
c. Changes by 180 degrees
d. Changes by 1 in/sec
17. Please match the definition to the vibration units:
How far something is moving acceleration
How fast something is moving displacement
How quickly something is speeding up or slowing down velocity
18. Please match the units below to the vibration units:
in/sec
mm/sec2 acceleration
g’s displacement
mils velocity
microns
mm/sec
CAT II Worked examples Page 71
[email protected] Copyright ©2020 Mobius Institute www.mobiusinstitute.com
19. Although any of the units can be described in terms of pk, pk-pk or RMS, please match each unit to the one that is typically used by convention.
a. in/sec
b. mm/sec2
c. g’s
d. mils
e. microns
f. mm/sec
20. Which unit is better at:
High frequencies (above 2000 Hz)
Mid frequencies (10 – 2000 Hz)
Low frequencies (below 500 Hz)
21. Using the formula sheets:
Convert: 1 gRMS at 100 Hz to mm/secRMS and to micronspk-pk
Convert 0.5 in/spk at 1800 RPM to mm/secRMS
Convert 1 in/secpk to in/secRMS
22. Using the formula sheets:
Convert: 1 gRMS at 10 RPM to in/spk
How does the answer above change the way you collect data or set up your data collector?
23. Please describe the ISO RMS overall level:
a. What frequencies does it measure?
b. What is it typically used for?
c. What sort of equipment is required to measure it? (simple / complex / expensive / inexpensive)
d. What are the pros and cons of using this measurement?
e. What are three different ways to calculate the RMS level?

Page 72 CAT II Worked examples
[email protected] Copyright ©2020 Mobius Institute www.mobiusinstitute.com
24. What is the crest factor?
What can it tell you that the overall value cannot tell you?
What is the crest factor of a sine wave?
What is the crest factor of a wave with an RMS value of 1.4 mm/sec and a peak amplitude of 5.2 mm/sec?
25. Draw a 4 Hz sine wave with an amplitude of 4 in/secpk. Label the X and Y axes of the graph.
Draw the spectrum that corresponds with this waveform in in/secRMS and in CPM. Please label the X and Y axes.
26. What is order normalization?
In an order normalized plot from a motor driving a pump, what does 1x refer to?
What are three benefits of order normalization?

CAT II Worked examples Page 73
[email protected] Copyright ©2020 Mobius Institute www.mobiusinstitute.com
27. The graph below (in Hz) is from an 1800 RPM motor driving a two stage pump via a flexible coupling. The motor shaft 1x is labeled “S1”. The pump has 13 vanes on the first stage and 19 vanes on the second stage. Please identify the vane pass related peaks on the spectrum below.
28. The order normalized plot below is from an 1800 RPM motor driving a pump via a gearbox. The input gear of the gearbox has 23 teeth and the output has 33 teeth. Please identify the gear mesh frequency on the graph. If the gear mesh frequency has any harmonics please circle them as well.
29. The order normalized plot below came from a motor driving a fan via a belt. The motor end pulley is 34” in diameter and the fan end pulley is 23”. Please mark the peak that most likely represents the belt rotational frequency. Please mark the fan shaft peak and its harmonics on the graph.

Page 74 CAT II Worked examples
[email protected] Copyright ©2020 Mobius Institute www.mobiusinstitute.com
30. The order normalized plot below is from an 1800 RPM motor driving a pump via a gearbox. The input gear of the gearbox has 23 teeth and the output has 33 teeth. The motor has 6 blades on a cooling fan and the pump has 17 vanes.
Mark the pump shaft rate peak and its harmonics
Mark the motor cooling fan peak
Mark the pump vane peak
31. A motor running at 1500 RPM is driving a gearbox via a belt. The motor end pulley diameter is 50 cm and the gear pulley diameter is 23 cm and the belt length is 250 cm. The input gear of the gear box has 73 teeth and the output has 29 teeth. The gear is driving a compressor with 7 vanes. Please calculate the forcing frequencies for this machine in orders. For extra practice, calculate the forcing frequencies in Hz and CPM as well:
a. Motor shaft rate: 1xM
b. Belt rate: BR
c. Gearbox input shaft rate: Gin
d. Gearmesh frequency: GMF
e. Compressor shaft rate: 1xC
f. Compressor vane rate: CV
UNDERSTANDING SIGNALS
1. A sine wave with a peak amplitude of 3 mm/secRMS is added to another sine wave with the same frequency, amplitude and phase. What will the resultant vibration look like?
What if the second wave is 180 degrees out of phase with the first?
How is the principle in part 2 of the question used in real life?
CAT II Worked examples Page 75
[email protected] Copyright ©2020 Mobius Institute www.mobiusinstitute.com
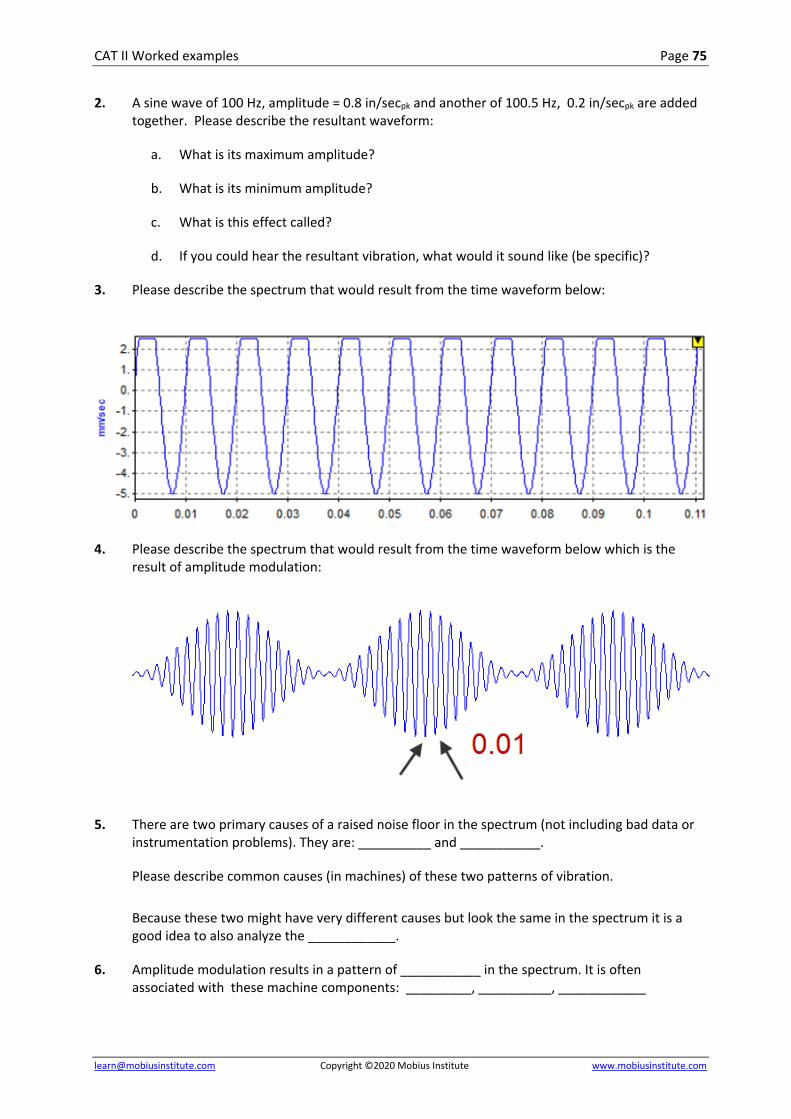
2. A sine wave of 100 Hz, amplitude = 0.8 in/secpk and another of 100.5 Hz, 0.2 in/secpk are added together. Please describe the resultant waveform:
a. What is its maximum amplitude?
b. What is its minimum amplitude?
c. What is this effect called?
d. If you could hear the resultant vibration, what would it sound like (be specific)?
3. Please describe the spectrum that would result from the time waveform below:
4. Please describe the spectrum that would result from the time waveform below which is the result of amplitude modulation:
5. There are two primary causes of a raised noise floor in the spectrum (not including bad data or instrumentation problems). They are: __________ and ___________.
Please describe common causes (in machines) of these two patterns of vibration.
Because these two might have very different causes but look the same in the spectrum it is a good idea to also analyze the ____________.
6. Amplitude modulation results in a pattern of ___________ in the spectrum. It is often associated with these machine components: _________, __________, ____________

Page 76 CAT II Worked examples
[email protected] Copyright ©2020 Mobius Institute www.mobiusinstitute.com
7. In the time waveform, amplitude modulation can be confused with __________, however ___________ will result in _____________ in the vibration spectrum.
SIGNAL PROCESSING
1. Match the filter type to the following data collector settings:
Fmax Low pass
ISO RMS overall reading (10 – 1000 Hz) High pass
10 Hz low cutoff frequency Band pass
Filtering out data below 5000 Hz for demodulation reading Band stop
2. What is the (10 Hz) low cutoff frequency used for?
3. Match the window type to the application:
Hanning Sensor calibration
Flat top Bump test
Rectangular Normal route test
4. The (spectrum / time waveform) is measured and the (spectrum / time waveform) is calculated using an algorithm called the __________.
5. If the Fmax is 1000 Hz then the sample rate is___ _______ and the time between samples in the time waveform is __________.
6. If Fmax = 1000 Hz and there are 800 lines of resolution:
a. How many samples will be in the time waveform?
b. How long (in seconds) will the time waveform be?
c. If this measurement is taken on a shaft rotating at 1200 RPM, how many revolutions of the shaft will appear in the time waveform?
d. What is the resolution of the spectrum?
e. If a Hanning window is used (WF=1.5), what is the bandwidth of the measurement?
7. The Hanning window is used to solve a problem called ____________.

CAT II Worked examples Page 77
[email protected] Copyright ©2020 Mobius Institute www.mobiusinstitute.com
8. Please match the average type to the application:
Bump test Linear averaging
Normal route test Peak hold averaging
Special gearbox test Negative averaging
Bump test on a machine that is running Exponential averaging
Give more weight to newer data in averaging process Time synchronous averaging
Find the highest vibration amplitudes on a machine when tested over a period of time
9. How many averages are typically used with linear averaging on typical machines? What overlap %?
10. What is the approximate frequency (in Hz and CPM) of the impacting in the waveform below?
What could cause this? What else is interesting about this time waveform?
DATA ACQUISITION
1. A 200 mV/mil proximity probe has a set point of -10 V. If the shaft moves 5 mils closer to the probe, how much will the voltage reading change?
2. The DC voltage output from a proximity probe relates to __________ and the AC voltage relates to ___________?

Page 78 CAT II Worked examples
[email protected] Copyright ©2020 Mobius Institute www.mobiusinstitute.com
3. A proximity probe pointed at a keyway in the shaft can be used to measure ________ and _________? When used in this way it is called a ___________________.
4. When analyzing data from a pair of proximity probes mounted 90 degrees apart from each other on a turbine journal bearing, the graph one typically analyzes is called ___________?
5. The plot below is produced from (AC or DC?) voltages from the proximity probes?
The outer edge of the plot has a value of _________ ? How does this relate to the shafts position on the bearing?
The arrow in the top left corner of the plot indicates?
How is this plot is measured?
What do the numbers along the line towards the bottom of the plot refer to?
6. Please list at least 4 common faults or conditions that are common in large journal bearings that can be detected using vibration analysis.
7. Name another technology that can be used to find early indications of wear in the bearing and another technology that can be used to detect late stages of wear.
8. A large journal bearing can go from perfect health to catastrophic failure in approximately how much time? Therefore one typically employs a __________ system to monitor these bearings.
9. A 100 mv/g sensor is being subjected to 5 g’s of vibration within its linear range of operation. What voltage output will be read from the sensor?

CAT II Worked examples Page 79
[email protected] Copyright ©2020 Mobius Institute www.mobiusinstitute.com
10. Please match the accelerometer sensitivity to the application:
A high speed compressor with high amplitude high frequency vibration 10 mV/g
A low speed bearing 100 mV/g
A typical 1800 RPM centrifugal pump and motor 500 mV/g
11. What is a piezovelocity sensor and why might someone use one?
12. Describe what is meant by the “frequency response” of an accelerometer or a sensor mounting technique.
13. Which sensor mounting technique would have a better high frequency response: 2 pole magnet on painted surface or flat magnet on installed target pad?
14. Apart from frequency response issues what is another important benefit of using test target pads?
15. Select the bearings to monitor in the machine below as well as the measurement axes. There is more than one correct answer, so please explain why you have chosen the test points you have chosen.
16. Describe the benefits of creating a machine test guide for each machine. What key pieces of information should be documented on the test form and why?

Page 80 CAT II Worked examples
[email protected] Copyright ©2020 Mobius Institute www.mobiusinstitute.com
FAULT DETECTION
1. The plot below is from a pump with sleeve bearings being driven by a motor via a flexible coupling. The pump shaft rate is marked with the arrow. Please describe the pattern shown in the plot and the most likely cause of it (i.e. mechanical fault condition)
2. In the order normalized plot below from an 1800 RPM induction motor, which peak is two times the electric line frequency (2xLF)? Assuming the motor is tested at the same speed and load, what might it mean if the amplitude of this peak goes up?
3. In the plot below from a 1500 RPM centrifugal pump with rolling element bearings driven by a motor via a flexible coupling. What is the most likely source of the peaks labeled “A” and “B”?
CAT II Worked examples Page 81
[email protected] Copyright ©2020 Mobius Institute www.mobiusinstitute.com
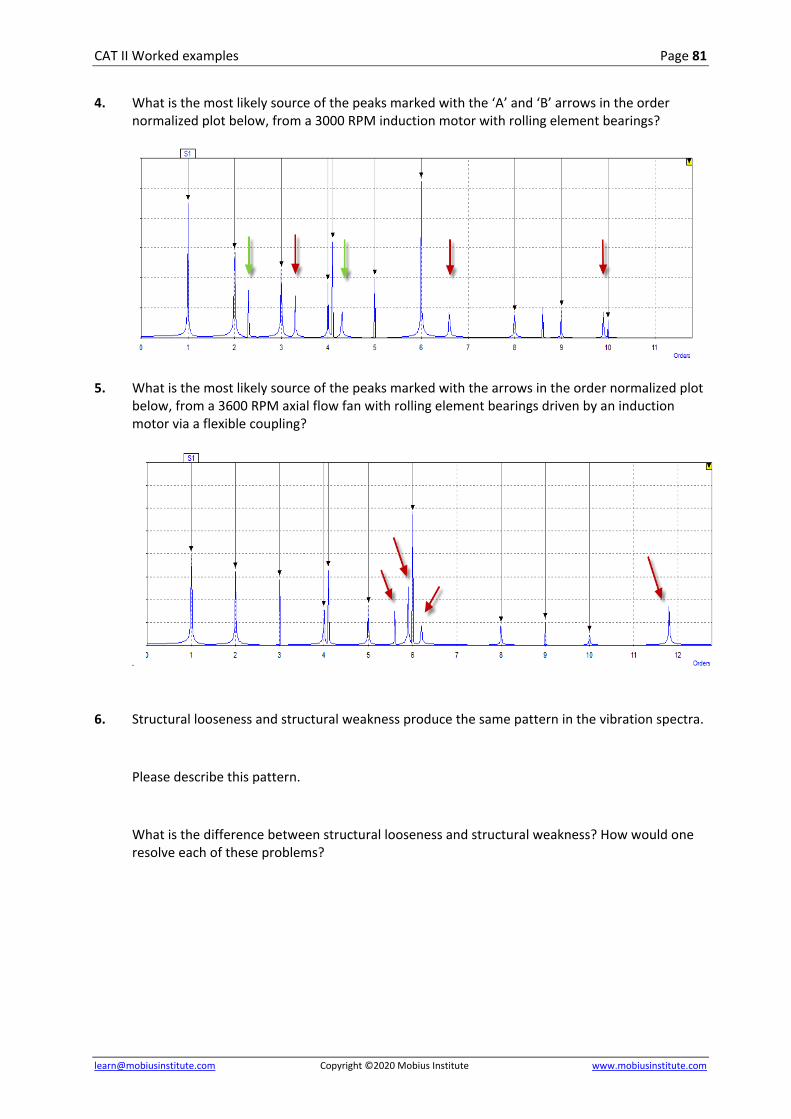
4. What is the most likely source of the peaks marked with the ‘A’ and ‘B’ arrows in the order normalized plot below, from a 3000 RPM induction motor with rolling element bearings?
5. What is the most likely source of the peaks marked with the arrows in the order normalized plot below, from a 3600 RPM axial flow fan with rolling element bearings driven by an induction motor via a flexible coupling?
6. Structural looseness and structural weakness produce the same pattern in the vibration spectra.
Please describe this pattern.
What is the difference between structural looseness and structural weakness? How would one resolve each of these problems?
Page 82 CAT II Worked examples
[email protected] Copyright ©2020 Mobius Institute www.mobiusinstitute.com
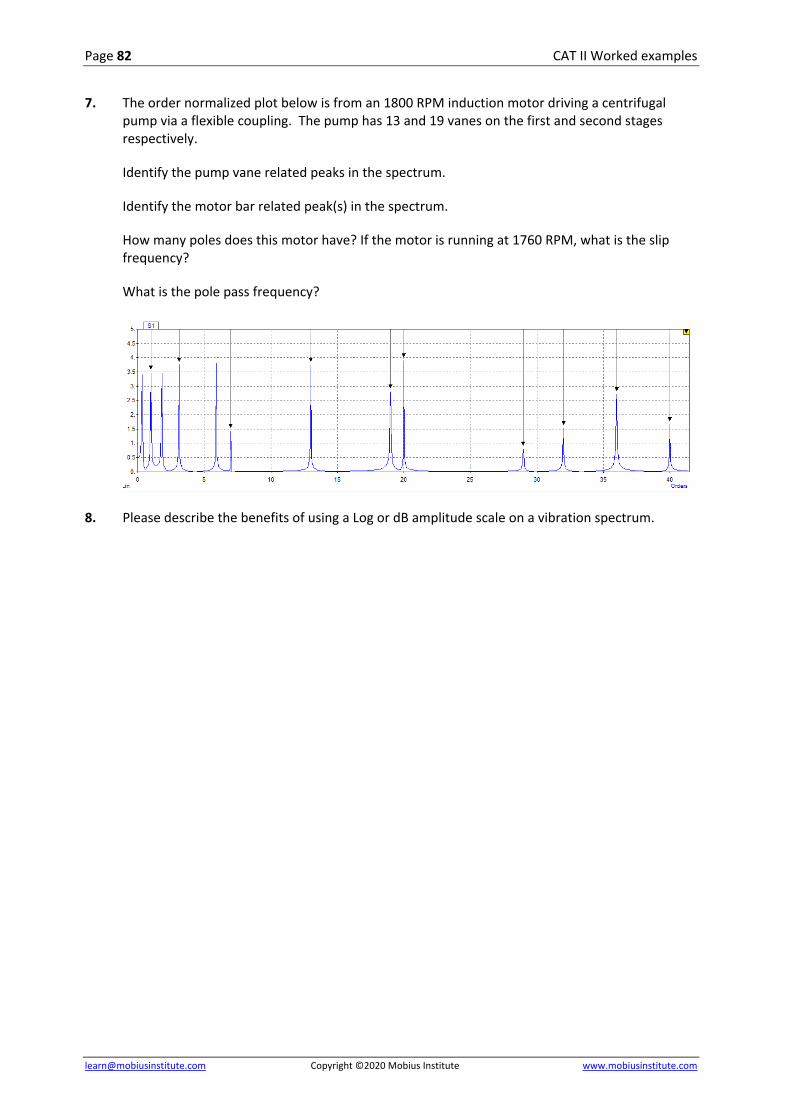
7. The order normalized plot below is from an 1800 RPM induction motor driving a centrifugal pump via a flexible coupling. The pump has 13 and 19 vanes on the first and second stages respectively.
Identify the pump vane related peaks in the spectrum.
Identify the motor bar related peak(s) in the spectrum.
How many poles does this motor have? If the motor is running at 1760 RPM, what is the slip frequency?
What is the pole pass frequency?
8. Please describe the benefits of using a Log or dB amplitude scale on a vibration spectrum.

CAT II Worked examples Page 83
[email protected] Copyright ©2020 Mobius Institute www.mobiusinstitute.com
BALANCING
1. A vector describes an ________ and a ________.
2. Please draw the vector 4 mils @ 90 degrees
3. (You will not be asked to add or subtract vectors on the exam but it is important to understand this if you will do balancing) Please add 3 mils @ 0 degrees to the vector above and calculate the solution graphically and mathematically.

Page 84 CAT II Worked examples
[email protected] Copyright ©2020 Mobius Institute www.mobiusinstitute.com
4. Please describe the significance of the “O”, “T” and “O+T” vectors in the diagram below. Which of these are measured and which are calculated?
Describe what a “trim” run is.
5. When balancing a rotor in-situ (in place), if the trial weight is too small (what happens?)___________, if it is too large (what happens?) ____________. The trial weight should generate a force equal to approximately ____% of the rotor weight and it should change the original phase and amplitude readings by ____%.
6. Wide rotors often suffer from _______ or _______ unbalance and they therefore require a _____ plane balance solution.
7. The amount of unbalance remaining in a rotor after it has been balanced is called its ___________ unbalance.
8. Describe the two general types of balance standards. What are they based on? What are the benefits of each type of standard and why do both types exist?
SETTING ALARMS
1. An acceptance test is being performed on a fan classified as BV-3. The fan is mounted on isolators and the 1x amplitude at normal operating speed is 5 mm/secRMS. Is this acceptable?

CAT II Worked examples Page 85
[email protected] Copyright ©2020 Mobius Institute www.mobiusinstitute.com
2. Use the table from ISO 10816-7 to answer the following questions.
A new 1800 RPM centrifugal pump with a power rating of 100 KW is running at 50% of its Best Efficiency Point (BEP). It is a non critical pump (Category 2). It has a measured overall level of 5 mm/secRMS. What should you report?
When operating at 90% of BEP, the same pump as above has an overall level of 0 mm/secRMS. If you want to use this value as a baseline and trend the readings from here. How will you set the alarm level? Note that in this standard, a change from baseline should not exceed 25% of the upper limit of zone B.
Following from the previous question, what would you report if the pump was tested again at 70% BEP and the reading was 3 mm/secRMS. What if it was tested at 90% BEP and the reading was 3 mm/secRMS?
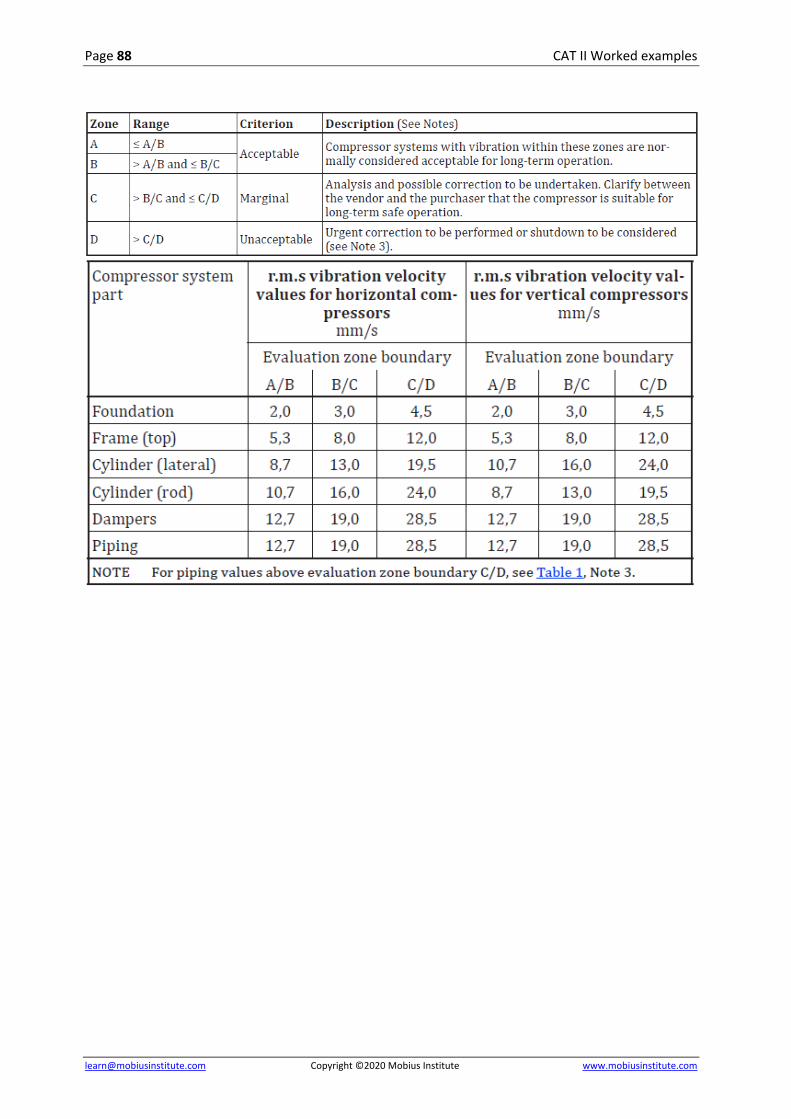
3. Using the ISO 10816-8 Acceptance criteria for a reciprocating compressor chart…
Make a recommendation based on the following measurements on a new horizontal compressor. The compressor has been installed in your plant and is being tested in place under normal operating conditions. If there is a problem, please suggest a recommendation or follow up test.
Foundation readings on each corner 5, 2, 1, 7 mm/secRMS
Frame readings (top): 3, 7, 5 mm/secRMS
Cylinder lateral: 5, 2, 9, 3 mm/secRMS
Cylinder rod: 3, 13, 2, 14
Piping max level 37 mm/secRMS
4. What is the name of the alarm displayed below? What is a limitation of this type of alarm (please describe a limitation based on this actual data). What other common type of alarm would solve this problem?

Page 86 CAT II Worked examples
[email protected] Copyright ©2020 Mobius Institute www.mobiusinstitute.com
CHARTS, TABLES AND FORMULAE
N = Number of samples, Ts = Sample period, T = Length of time waveform, Fs = Sample rate, Fmax = Maximum frequency measured, LOR = Lines of resolution, R = Spectrum resolution

CAT II Worked examples Page 87
[email protected] Copyright ©2020 Mobius Institute www.mobiusinstitute.com
Page 88 CAT II Worked examples
[email protected] Copyright ©2020 Mobius Institute www.mobiusinstitute.com