Embed Size (px)
Citation preview

IN DEGREE PROJECT MECHANICAL ENGINEERING,SECOND CYCLE, 30 CREDITS
, STOCKHOLM SWEDEN 2017
Casting defects mechanical impact on turbine blades fatigue lifeEngine feedback analysis
ROMAIN NOSELLI
KTH ROYAL INSTITUTE OF TECHNOLOGYSCHOOL OF ENGINEERING SCIENCES


Master Thesis
Casting defects mechanical impact on turbine blades fatigue life
-
Engine feedback analysis
Romain NOSELLI
Executed from the 5th of September 2016 to the 5th of March 2017
At SAFRAN Aircraft Engines
Coordinator
SAFRAN: Raphaël DUPEYRE
Royal Institute of Tehchnology Mechanical engineering master’s programme
SAFRAN Aircraft Engines Material & Process department
École des Arts et Métiers ENSAM engineer programme

2

3
Foreword The Master Thesis work having taken place in a confidential industrial context, some sensitive figures, references and results were voluntarily modified or omitted.
Besides, due to SAFRAN Aircraft Engines policy, the present Master Thesis report had to be reviewed by the safety department of the company before the end of the internship. Therefore most of the results are not the final outcome of the project.
Acknowledgment For allowing me to work in an enriching and challenging industrial context, on an inspiring project, I would first like to thank SAFRAN Aircraft Engines and SAFRAN Group for this great opportunity.
I would then like to thank Pascal L. and Stephane B. for welcoming me in their department and service, and for making this whole project possible.
I wish to express my heartfelt gratitude to Raphael D., for his guidance, his valuable advice and for accompanying me all along this project. His hindsight and knowledge truly helped me apprehend all the aspects of this mission and kept me on the right path.
I would also like to express my sincere appreciation to Sandrine C., for following my work and for her valuable insights.
Many thanks also to all the engineers, in all the departments and services that accompanied me during this Master Thesis and for their contribution to a very pleasant and fulfilling atmosphere.
Special thanks to Sebastien B., for his work and cheerful mood, and to the other interns and apprentices for the pleasant times spent together.
Finally, I wish to thank KTH for giving me the chance to learn many things through this rewarding experience, and enabling this great opportunity for my professional life.

4
Table of content Abstract .................................................................................................................. 6
Nomenclature and abbreviations ............................................................................ 7
Chapter 1: Context .................................................................................................. 9
1.1 The Company ................................................................................................................ 9 1.1.1 SAFRAN Group ................................................................................................................. 9 1.1.2 SAFRAN Aircraft Engines................................................................................................ 10 1.1.3 Gennevilliers plant ......................................................................................................... 13 1.1.4 Development and Material departments ..................................................................... 13
1.2 Technical context ......................................................................................................... 14 1.2.1 Turbo machines ............................................................................................................. 14 1.2.2 Materials ........................................................................................................................ 15 1.2.3 Nickel and Cobalt based-alloys history .......................................................................... 15 1.2.4 Turbine blades materials ............................................................................................... 17 1.2.5 Lost wax casting in aeronautic industry ........................................................................ 20 1.2.6 Casting defects .............................................................................................................. 21 1.2.7 Non-destructive controls ............................................................................................... 24 1.2.8 Turbine blade geometry ................................................................................................ 26
Chapter 2: Research project .................................................................................. 27
2.1 Industrial Context ........................................................................................................ 27
2.2 Objectives ................................................................................................................... 27
2.3 Planning ...................................................................................................................... 28
Chapter 3: Engines feedback analysis and defects weakening factors .................... 29
3.1 Engines feedback data recovery and analysis ................................................................ 30 3.1.1 Defect distribution and Paretos .................................................................................... 30 3.1.2 LEAP engines feedback .................................................................................................. 32 3.1.3 CFM56 engines feedback .............................................................................................. 35
3.2 Weakening factors generated by defects ...................................................................... 37 3.2.1 Defects simulation ......................................................................................................... 37 3.2.2 Methodology ................................................................................................................. 44 3.2.3 Case study: ASTM4 shrinkage ........................................................................................ 53
5
3.3 Defect acceptability conditions .................................................................................... 57 3.3.1 Mechanical criteria ........................................................................................................ 58 3.3.2 Calculation methodology and case study ...................................................................... 59 3.3.3 VBA program ................................................................................................................. 63
Chapter 4: Technological test ................................................................................ 64
Chapter 5: Test campaigns .................................................................................... 70
5.1 Sample elaboration ..................................................................................................... 70 5.1.1 Scrap overview .............................................................................................................. 70 5.1.2 Sample extraction .......................................................................................................... 71
5.2 Testing campaigns ....................................................................................................... 72 5.2.1 3 points bending test ..................................................................................................... 72 5.2.2 Results ........................................................................................................................... 73
Conclusion ............................................................................................................ 75
Figures .................................................................................................................. 76
References ............................................................................................................ 78
ANNEXES............................................................................................................... 81
i. Technical drawing - 3 points bending assembly ................................................................ 81

6
Abstract
Aircraft engines are complex, value-added high-tech systems, which possess very restrictive technical
specifications. This is especially the case for turbine parts which are submitted to very hostile
thermo-mechanical environments. The technical properties, such as fatigue life and creep tolerance
of these parts are therefore of primary concern.
The properties of the parts are also strongly linked to the manufacturing processes. Unfortunately,
these processes possess inherent flaws that lead to the presence of unwanted abnormalities. For
design optimization and cost efficiency, great care and efforts are put by the aircraft engine
manufacturers to consistently increase the knowledge on these irregularities and their impact on the
parts functional characteristics.
These issues are still present in the actual industrial context of SAFRAN Aircraft Engines. After
successfully completing the development and certification phases, the LEAP, the new engine
generation that will progressively replace the CFM engine family, is now in its ramping-up production
phase. To achieve what will be the greatest production rate increase of all aviation history, crucial
cost reduction campaigns are conducted.
Among the many potential cost reduction levers, the scrapped parts rate is of primary importance as
it represents a significant loss in production. Tolerances of the technical specifications, which had
preliminarily been established with strong safety margins, are now looked into.
In this context, a joint project between the Development Department and the Material Department
has been launched to understand more clearly how the metallurgical abnormalities impact the life of
casting parts, and how this could help optimize the casting defect tolerances.

7
Nomenclature and abbreviations
LCF Low Cycle Fatigue HCF High Cycle Fatigue Young modulus Temperature Stress
Maximum stress Applied stress
Average stress on reduced section Alternating stress Stress concentration factor Stress intensity factor Stress intensity range
Stress intensity range threshold Section
Reduced section due to a defect Defect depth
Minimum radius at the bottom of the notch Load ratio between minimum and maximum stresses of the loading cycle
Square root of the area of the defect (μm). It is the Murakami’s parameter Number of cycles Half crack size Geometrical correction factor Length
Criticality ratio 0.2% offset yield point Frequency range Stiffness Masse range
SNECMA Société Nationale d'Étude et de Construction de Moteurs d'Aviation SAGEM Société d’Applications Générales d’Electricité et de Mécanique
GE General Electric LEAP Leading Edge Aviation Propulsion EPI Europrop International CEI Industrial Excellence Centers FPI Fluorescent Penetrant Inspection
ASTM American Society for Testing and Materials FEM Finite Element Method

8

9
Chapter 1: Context 1.1 The Company
1.1.1 SAFRAN Group SAFRAN is an international high-technology group, leader in aeronautics, aerospace, defense and security, and at the forefront of the European and worldwide market. The company was created in 2005 by the merger between SNECMA (aircraft engines) and SAGEM (security), and now counts more than 70 000 employees all around the world.
In 2015, the company’s turnover was 17.4 billion Euros, and the research and development investment was 2.1 billion, which stands for approximately 12% of its turnover.
The aeronautical and aerospace sectors of SAFRAN Group gather all the activities of aircrafts, helicopters, rockets and launchers propulsion systems, on the civil, military and space markets. They are working on the conception, production, marketing, tests and maintenance.
Figure 1 Overview of SAFRAN Group sites
Figure 2 SAFRAN Group turnover distribution

10
In this sector, the main market shares of SAFRAN are:
- Civil aircraft engines: n°1 worldwide for short and medium haul aircraft, in a 50/50 partnership with General Electric.
- Helicopter engines: n°1 worldwide. - Space launchers: n°1 worldwide in partnership with Airbus Group.
The Group is also a major player in the aircraft equipment field:
- Landing and breaking systems: n°1 worldwide for landing gears and carbon breaks. - Engines equipment and systems: n°1 worldwide of mechanical power transmission systems
for aircraft engines. - Electrical systems: n°1 worldwide in aeronautical electrical connection.
1.1.2 SAFRAN Aircraft Engines SAFRAN Aircraft Engines (formerly SNECMA) is a company of SAFRAN Group that designs, develops, produces and commercializes, alone or in cooperation, civil and military aircraft engines. It also offers to airlines companies, military forces and aircraft operators a complete range of services for their aircraft engines. In 2015, its annual turnover amounted to 7.6 billion Euros, with 15 000 coworkers, on 35 sites in the world.
SNECMA (Société National d’Etude et de Conception de Moteurs d’Aviation) was founded in 1945, following the nationalization of the company Gnome&Rhône, that used to build aircraft engines and motorbikes. SNECMA then integrated several entities, to finally merge with SAGEM in 2005 to form SAFRAN Group. In May 2016, SNECMA is renamed SAFRAN Aircraft Engines.
Figure 3 SAFRAN remarkable figures
11
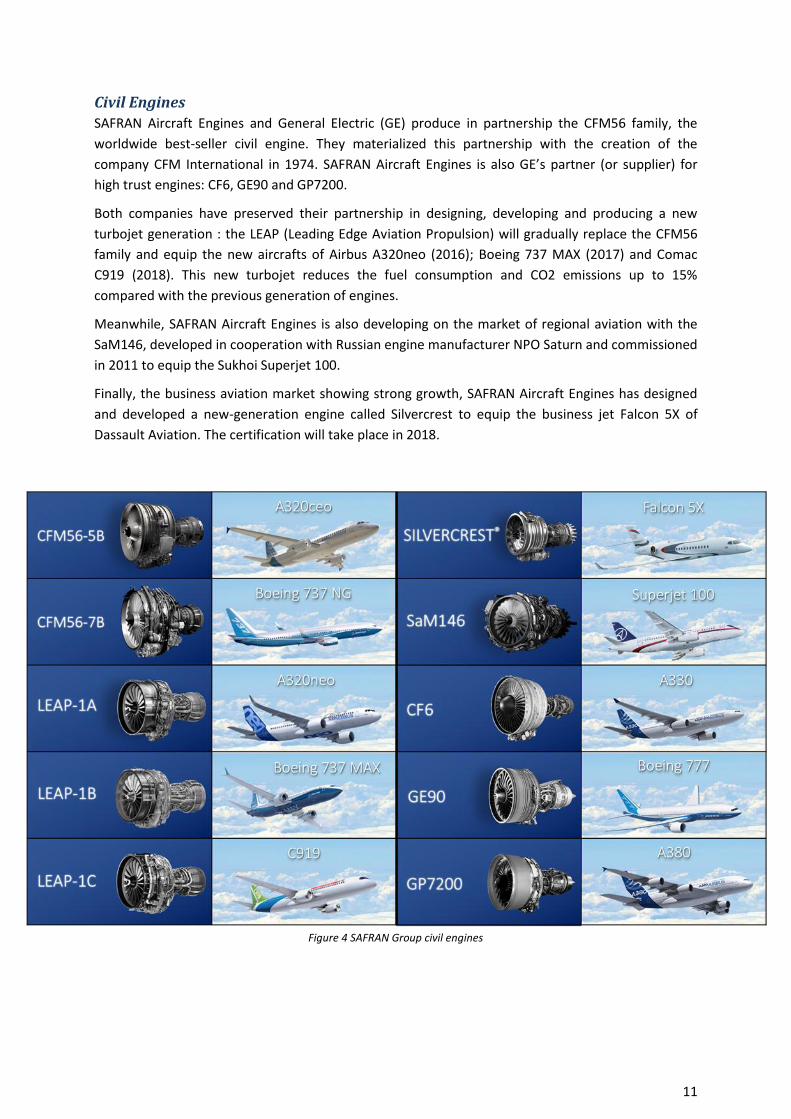
Civil Engines SAFRAN Aircraft Engines and General Electric (GE) produce in partnership the CFM56 family, the worldwide best-seller civil engine. They materialized this partnership with the creation of the company CFM International in 1974. SAFRAN Aircraft Engines is also GE’s partner (or supplier) for
high trust engines: CF6, GE90 and GP7200.
Both companies have preserved their partnership in designing, developing and producing a new turbojet generation : the LEAP (Leading Edge Aviation Propulsion) will gradually replace the CFM56 family and equip the new aircrafts of Airbus A320neo (2016); Boeing 737 MAX (2017) and Comac C919 (2018). This new turbojet reduces the fuel consumption and CO2 emissions up to 15% compared with the previous generation of engines.
Meanwhile, SAFRAN Aircraft Engines is also developing on the market of regional aviation with the SaM146, developed in cooperation with Russian engine manufacturer NPO Saturn and commissioned in 2011 to equip the Sukhoi Superjet 100.
Finally, the business aviation market showing strong growth, SAFRAN Aircraft Engines has designed and developed a new-generation engine called Silvercrest to equip the business jet Falcon 5X of Dassault Aviation. The certification will take place in 2018.
Figure 4 SAFRAN Group civil engines

12
Military Engines SAFRAN Aircraft Engines also develops, manufactures, commercializes and proposes after sales support and services for combat and training aircraft engines and for turboprop engines for military transport aircraft. It has motorized military aircrafts as, for instance, Mirage 2000 with M53-P2 and Rafale with M88-2 but also A400M with the new turboprop engine TP400-D6 in the frame of Europrop International (EPI) including Rolls-Royce plc, MTU Aero Engines and Industria de Turbo Propulsores.
Space Engines Finally, SAFRAN Aircraft Engines develops and produces propulsion systems as well as equipment for launchers and satellites, and owns more than 30 years of expertise on Ariane 1 to 5 launchers. With more than 1200 engines flying, SAFRAN Aircraft Engines is in charge of European cryogenic propulsion for Ariane 5 with Vulcain 2 and HM7B, and the new engine Vince for Ariane 6 superior stages.
Figure 5 SAFRAN Group military engines
Figure 6 SAFRAN Group space engines

13
1.1.3 Gennevilliers plant Located 15km away from Paris, on the Seine embankment, Gennevilliers factory has acquired for more than 50 years a unique know-how in forging, casting and machining aeronautical parts. Almost 1 500 people are working on the site, all organized around three different “Industrial Excellence
Centers” (CEI):
- Turbine blades CEI (in which the master thesis work took place) - Compressor blades CEI - Rotating part CEI
Hence, a wide range of parts and subsystems are produced in Gennevilliers:
- Forged parts (turbine disks and carters in nickel-based alloys, combustion chambers, …) - Forged fan blades in titanium alloy and composite materials - Casted turbine blades in nickel-based alloy, using lost wax process
1.1.4 Development and Material departments The main part of the Master Thesis work took place in the development department for turbine blades. The main missions of this section are:
- Developing new parts, when the integration, fluid mechanics and thermal departments have set their needs.
- Launching the production of new turbine blades. - Monitoring the production by working with the process department in order to deal with
defective parts. - Define the protocols for repair and maintenance.
Time was also spent within the Material expertise section, in collaboration with another trainee. Their main missions are:
- Metallurgical validation of the casting processes and materials. - Supervision of characterization tests to feed the dimensioning data. - Industrial expertise in foundry.
Figure 7 Aerial view of Gennevilliers plant
14
1.2 Technical context
1.2.1 Turbo machines
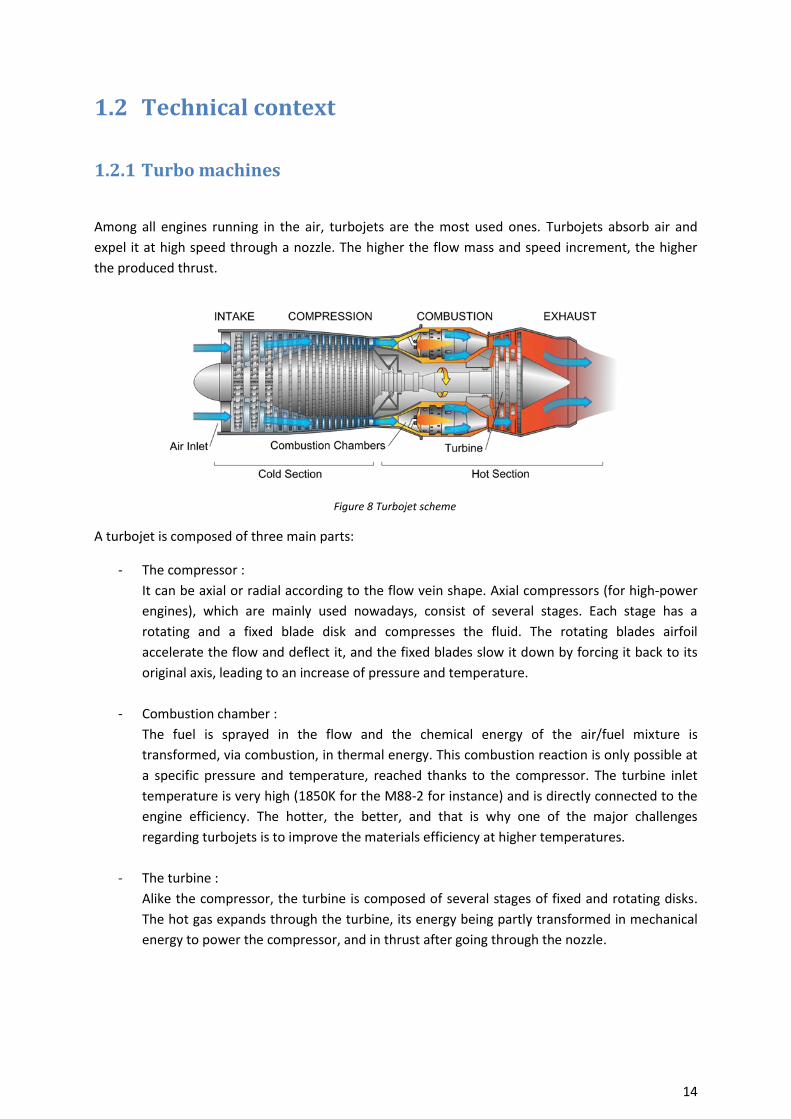
Among all engines running in the air, turbojets are the most used ones. Turbojets absorb air and expel it at high speed through a nozzle. The higher the flow mass and speed increment, the higher the produced thrust.
A turbojet is composed of three main parts:
- The compressor : It can be axial or radial according to the flow vein shape. Axial compressors (for high-power engines), which are mainly used nowadays, consist of several stages. Each stage has a rotating and a fixed blade disk and compresses the fluid. The rotating blades airfoil accelerate the flow and deflect it, and the fixed blades slow it down by forcing it back to its original axis, leading to an increase of pressure and temperature.
- Combustion chamber : The fuel is sprayed in the flow and the chemical energy of the air/fuel mixture is transformed, via combustion, in thermal energy. This combustion reaction is only possible at a specific pressure and temperature, reached thanks to the compressor. The turbine inlet temperature is very high (1850K for the M88-2 for instance) and is directly connected to the engine efficiency. The hotter, the better, and that is why one of the major challenges regarding turbojets is to improve the materials efficiency at higher temperatures.
- The turbine : Alike the compressor, the turbine is composed of several stages of fixed and rotating disks. The hot gas expands through the turbine, its energy being partly transformed in mechanical energy to power the compressor, and in thrust after going through the nozzle.
Figure 8 Turbojet scheme
15
Early turbojet compressors and turbines have been split into two separately rotating parts, a high pressure and a low pressure part, the high pressure part rotating at higher speed and therefore increasing the pressure ratios of high pressure compressor stages.
Finally, engines can also be designed with two separate flows : a primary flow (hot part) going through the compressor, the combustion chamber and the turbine, and a secondary flow (cold part), producing the main part of the thrust, increasing the efficiency for flights around Mach 1, absorbing vibrations, noises and helping cooling down the hot parts.
1.2.2 Materials The main issue for the engine designer is to obtain the highest efficiency possible for the lowest mass. In the first stages of the engine, the coldest part, from the fans at the inlet to the low pressure compressor stages, the use of light alloys like titanium-aluminum based materials is possible. On the other hand, in the hottest parts, from the last stages of the compressor to the nozzle at the outlet, these alloys can no longer withstand the pressure and thermal conditions. Nickel based alloys have been used for these parts, and they have been constantly improved along the years (turbine entry temperature has been increased of 10 degrees per year in average).
Turbine blades are especially concerned since they undergo higher and higher temperatures (above 1000°C) and are submitted to heavy loads (centrifugal force).
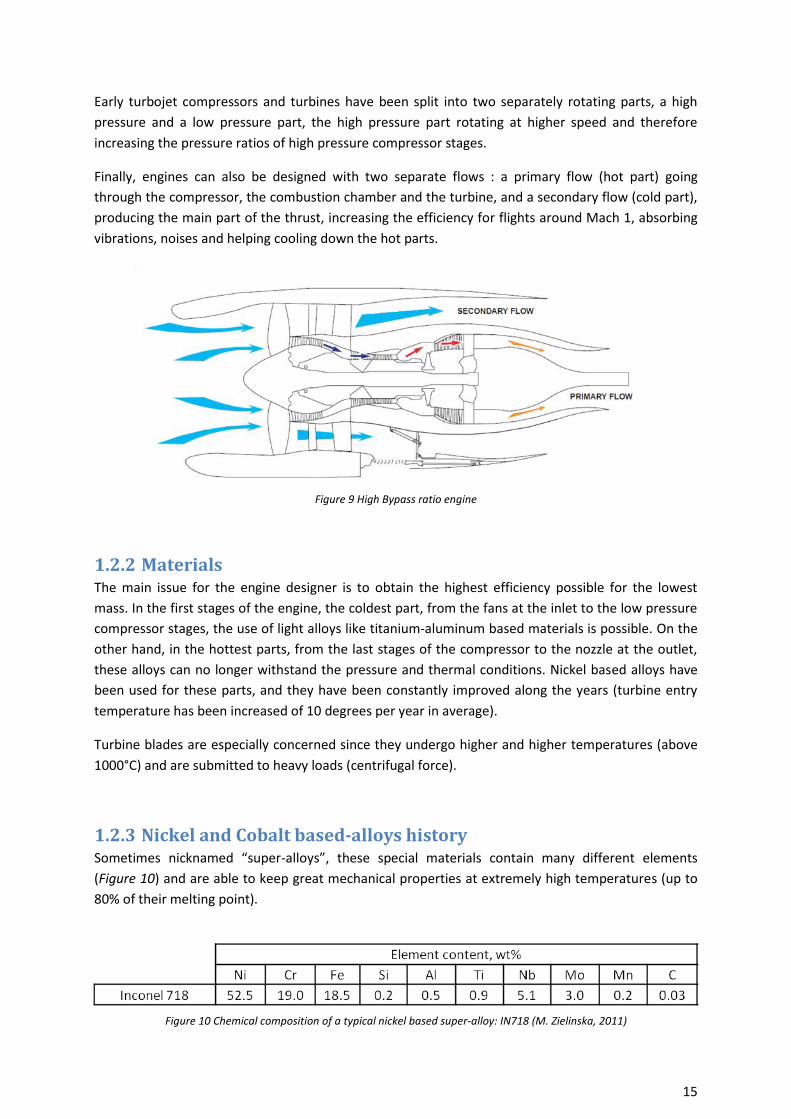
1.2.3 Nickel and Cobalt based-alloys history Sometimes nicknamed “super-alloys”, these special materials contain many different elements (Figure 10) and are able to keep great mechanical properties at extremely high temperatures (up to 80% of their melting point).
Figure 9 High Bypass ratio engine
Figure 10 Chemical composition of a typical nickel based super-alloy: IN718 (M. Zielinska, 2011)

16
Figure 11 pictures the unusual peak of yield strength that corresponds to the optimal utilization range of temperatures of a nickel based super-alloy.
Discovered in the late twenties, nickel based super-alloys are composed of an austenitic matrix J�(nickel based solid solution) in which a cuboidal ordinate phase J‘ (Ni3Al) has precipitated. Both phases have cubic face centered crystallographic structure.
The idea of reinforced gamma matrix was born in 1929, thanks to Pierre Chevenard (Chevenard, et al., 1960), who discovered that the addition of small amounts of aluminum, titanium and iron to a nickel based alloys (Ni-Cr 80-20) extensively improved creep properties (due, lately known, to the Ni3Al precipitation). The “accidental” discovery of phase J‘ then led to a major revolution in the field of high-temperature materials. Remaining coherent, the J‘ phase could improve the mechanical
resistance while allowing the material to keep its ductility (Mughrabi, 2009), making nickel based super-alloys the perfect choice for the aviation industry.
The German alloy A286, developed in 1935, was for example used for Junkers Jumo 004 and could operate up to 650°C.
Nickel-based super-alloys then progressively reached 50% of the total mass of aircraft engines.
Cobalt base super-alloys have better weldability and corrosion tolerance, but cannot be made as resistant as nickel alloys.
Temperature (°C)
Optimal range
Figure 11 Typical 0.2% elastic limit versus temperature curve for a nickel based alloy

17
In order to obtain the appropriate microstructure, hence the wanted mechanical properties, materials endure a series of heat treatments. These treatments, applied after solidification, can for example consist in a quench (T), followed by two tempering (R1 and R2). These steps lead to the specific microstructure of cuboidal ordinated phase J‘ visible on Figure 12.
1.2.4 Turbine blades materials Due to efficiency improvements, turbine blades undergo higher and higher temperatures (above 1000°C). In order to keep increasing the temperature in the combustion chamber (for a maximum heat efficiency), new solutions are needed to improve the turbine blades resistance and damage tolerance. Here are the three main ways developed in the last decades.
Cooling and coating To lower the metal temperature, an intern cooling circuit in the length of the blade has first been introduced by Rolls Royce in the sixties (Conway engine)(Bowmer, 1961). In the seventies, the microperforation technique offered the possibility to create a thin film of cool air along the blade surface. Cooling techniques have unceasingly improved until nowadays.
Figure 12 Nickel based alloy microstructure after heat treatments
Figure 13 Blade cooling techniques
18
A thermal barrier has also been introduced to clearly decrease the blade temperature. The addition of a metallic, ceramic or mixed protective layer permitted to avoid direct interaction between the alloy and the gas. Chrome was first used, then aluminum (Sims, 1984), and finally a ceramic layer was added for anti-corrosion efficiency. Nowadays, Electron Beam Physical Vapor Deposition (EBPVD) is commonly used to coat the turbine blades (Bickard, 1998).
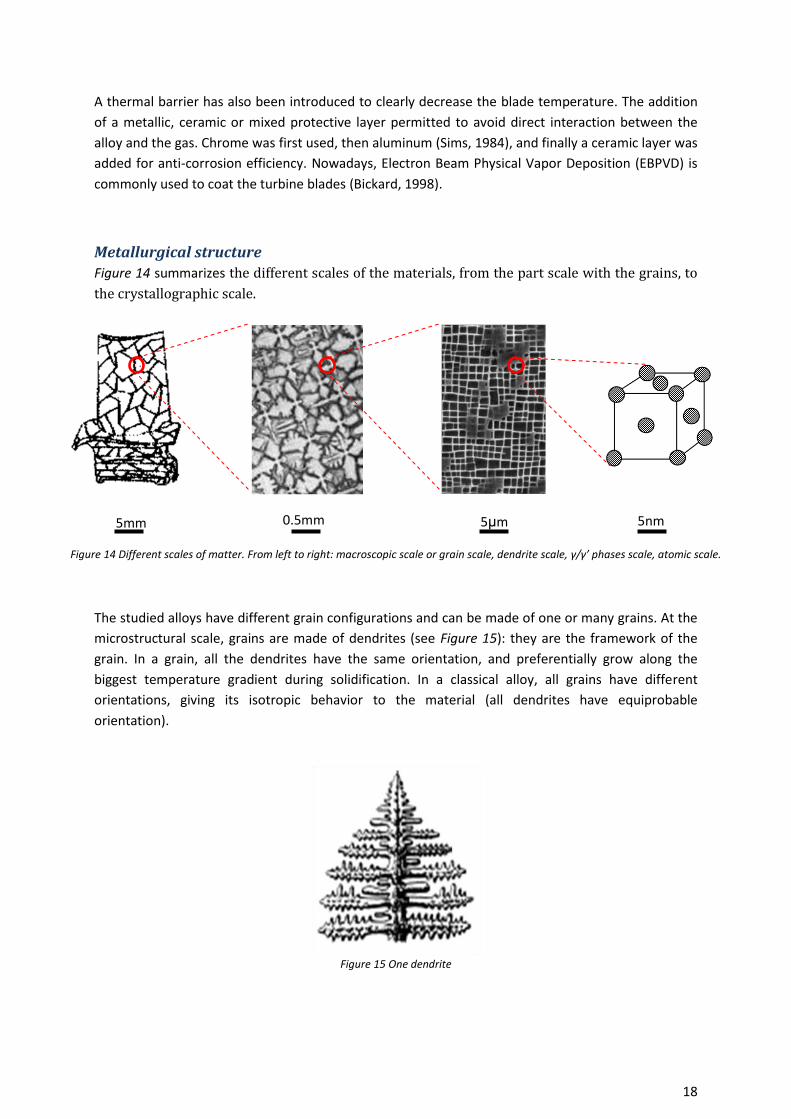
Metallurgical structure Figure 14 summarizes the different scales of the materials, from the part scale with the grains, to the crystallographic scale.
The studied alloys have different grain configurations and can be made of one or many grains. At the microstructural scale, grains are made of dendrites (see Figure 15): they are the framework of the grain. In a grain, all the dendrites have the same orientation, and preferentially grow along the biggest temperature gradient during solidification. In a classical alloy, all grains have different orientations, giving its isotropic behavior to the material (all dendrites have equiprobable orientation).
5mm 0.5mm 5μm 5nm
Figure 14 Different scales of matter. From left to right: macroscopic scale or grain scale, dendrite scale, γ/γ’ phases scale, atomic scale.
Figure 15 One dendrite

19
A remarkable improvement of the superalloys mechanical resistance (to creep mainly) was obtained thanks to their microstructure modification. Starting in the sixties, Pratt & Whitney developed the directed solidification technology. Dendrites growth is controlled and forced in one direction, thus delaying the crack initiation by preferentially directing the grain boundaries along the loading axis. In the seventies/eighties, grain boundaries were completely removed via the use of single crystals technology. By selecting a grain with the appropriate direction (usually the direction [1,0,0] of the metallographic structure along the length of the blade), only one grain would grow during cooling. The selection can either be made during the solidification using a specific labyrinth (grain selector), or before by placing an already formed grain (artificial grain) on the metal solidification front.
Snecma developed the first French single crystal superalloy, AM1, in cooperation with ONERA, Centre des Matériaux and Imphy (Davidson, et al., 1985). It is used nowadays in many SAFRAN engines.
The different metallurgical structures are presented Figure 16.
In the case of creep, the failure process happens with the debonding of grain boundaries (preferentially the ones perpendicular to the loading axis). Directionally solidified structures and single crystals, having no grain boundaries perpendicular to the loading axis, have therefore better creep resistance (Figure 17).
Figure 16 Different metallurgical structures. From left to right: equiaxed, directionally solidified, single crystal.
Figure 17 Creep loading on 3 different structures. From left to right: equiaxed structure showing failure at grain boundary, directionally solidified structure and single crystal having a better resistance to creep.

20
Metallurgical composition Finally, the chemical composition has also evolved in parallel with the different structures previously described. Indeed, mechanical response depends on the microstructure, which itself directly depends on the chemical composition. In single crystals for instance the grain boundaries no longer need to be strengthened with bore, zirconium or carbon, but the J�and J’ prime phases have to be reinforced to insure a good mechanical resistance (Caron, 2004) : with no grain boundaries to stop the dislocations, an adjustment of the chemical composition is needed to control the size of the different precipitates and their homogeneous distribution.
1.2.5 Lost wax casting in aeronautic industry Process description Nickel based alloys are easier cast than forged due to their high mechanical properties at high temperature. Furthermore, the casting process allows producing very complex shapes with high surface quality at a relatively low cost.
Lost wax casting has been used since antiquity and even if the process has been improved, the principle is still the same. The idea is to use a destructible model (a pattern that will be the exact replica of the final part) to obtain a mold, which will then be filled with the molten metal.
First, a machined shell mould is used to obtain a highly detailed wax pattern, which will then be assembled with others on a “tree” to maximize the production yield (step 1 to 3, Figure 18). The whole assembly is then coated in consecutive layers of ceramic, forming the final mold after drying (step 4 to 6). The wax is then eliminated in an autoclave, freeing the space for the metal, hence the name “lost wax” (step 7). The super-alloy is finally poured, and after solidification, the parts are retrieved by breaking the ceramic mold through chemical dissolution (step 8 and 9). (Doriath, 2007)
If need be, ceramic cores can also be added to obtain hollow parts. Formed in a specific mold, they are inserted in the wax pattern, but will stay in position after the autoclave. They are removed at the end with the rest of the mold.
Figure 18 Schematic illustration of the lost wax process (Source: courtesy of steel founders Society of America)

21
Solidification During cooling, there are two crystallization phases: germination and dendrite growth. Crystallization terminates when the dendrites meet one another and create grain boundaries, or when they reach the mold wall (Figure 19).
If the mold is removed from the oven without any other action, the part structure will be equiaxed: grains will germinate from the mold wall (cold source) and grow in various directions. However, if the mold is slowly removed from the oven, the temperature gradient can be controlled, the grain growth following the metal solidification front. We then obtain a directionally solidified structure, the so called “columnar structure”. Finally, for a single crystal, the monitoring of the temperature and the extraction speed are crucial for the selected grain growth (wrong parameters could for instance lead to parasite germinations).
1.2.6 Casting defects The lost wax process induces defects that have an impact on the matter’s health and can harm the mechanical properties of the part. The defect occurring rate is closely invigilated by the Quality and Process services who try to reduce it by improving the foundry process. However, the defects being inherent to the process, it is not achievable to eradicate all of them. Thankfully, depending on their size and location, some defects can still comply with the exigencies of the specifications, but some, oversized or located in critical areas, leave no other choice but to scrap the part. Main defects, their origin and the consequences on the mechanical properties are listed in this section.
Inclusions Inclusions are unwanted elements trapped inside the matter during solidification.
Their origins can be:
- Impurity of the material (oxides, precipitate or other external particles) - Internal surface of the mold (ceramic bits plucked from the mold during pouring) - Surface of the ceramic core
To avoid impurities when pouring the metal, a filter can be added in the casting shaft. The core and shell proprieties are also being researched: for instance, a significant difference in thermal expansion coefficient between the elements of the assembly can lead to overstresses and thus breakings of small bits of mold.
Figure 19 Grains formation
Dendrite growth Germination
22
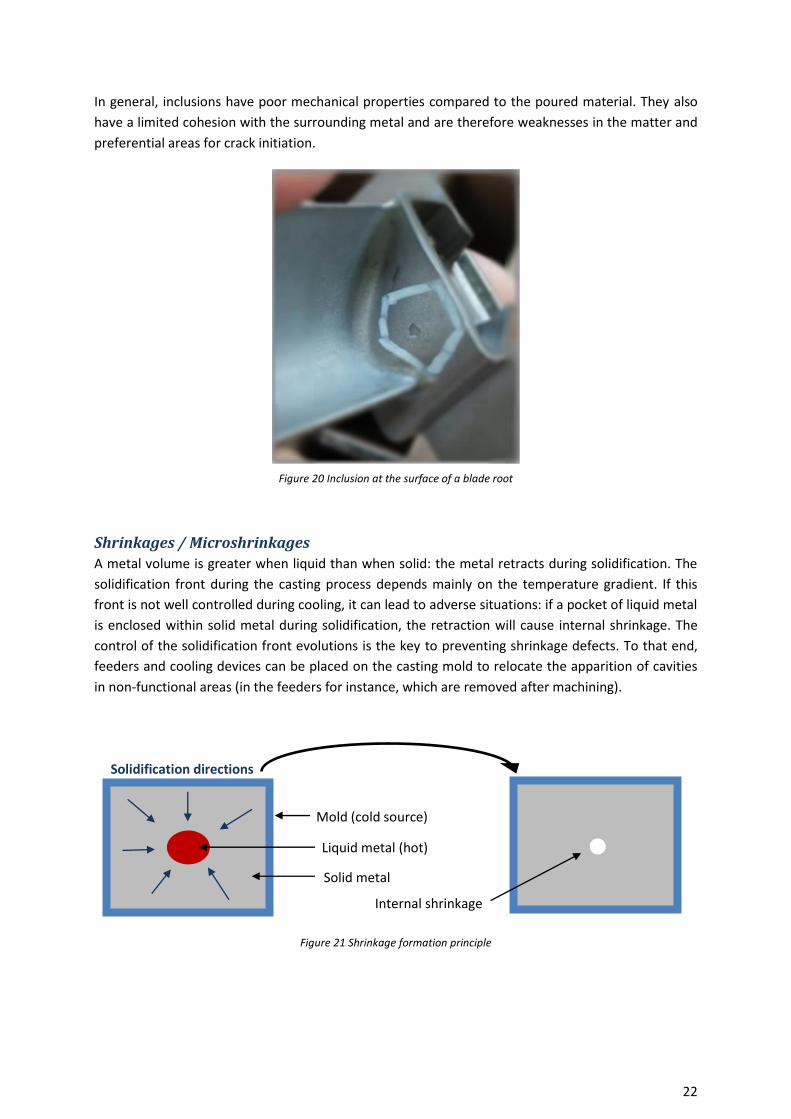
In general, inclusions have poor mechanical properties compared to the poured material. They also have a limited cohesion with the surrounding metal and are therefore weaknesses in the matter and preferential areas for crack initiation.
Shrinkages / Microshrinkages A metal volume is greater when liquid than when solid: the metal retracts during solidification. The solidification front during the casting process depends mainly on the temperature gradient. If this front is not well controlled during cooling, it can lead to adverse situations: if a pocket of liquid metal is enclosed within solid metal during solidification, the retraction will cause internal shrinkage. The control of the solidification front evolutions is the key to preventing shrinkage defects. To that end, feeders and cooling devices can be placed on the casting mold to relocate the apparition of cavities in non-functional areas (in the feeders for instance, which are removed after machining).
Mold (cold source)
Liquid metal (hot)
Solid metal
Solidification directions
Internal shrinkage
Figure 21 Shrinkage formation principle
Figure 20 Inclusion at the surface of a blade root

23
A micro-shrinkage has the same principle of formation but at the dendrite scale: a pocket of liquid metal is trapped between the dendrite arms, resulting in dendritic microshrinkage (see Figure 22).
An example of microshrinkage is visible Figure 23. Such defects have an impact on the mechanical properties of the part: they induce stress concentration and are preferential crack initiation sites.
Surface crack The casting process can lead to residual over-stresses in some part’s areas. To release the surplus of
internal energy accumulated, a surface crack can appear. These defects can be avoided by geometrical adjustments of the part: indeed, smooth geometrical changes lead to less over-constraint areas, thus reducing the chance of crack formation. Thermal dilatation equilibrium can also help avoid crack defects.
Growing dendrite (solid metal)
Isolated liquid
Figure 22 Dendritic growth resulting in microshrinkage
Figure 23 Example of microshrinkage
Figure 24 Example of a 3mm surface crack

24
Recrystallization If a single crystal endures local plastic deformation before quenching, it accumulates internal energy. This energy can be released during heat treatment and, if sufficient, locally re-orient the crystal and create a grain. Such grains have very poor mechanical properties because of disorientation and lack of strengthened grain boundary (Zhang, et al., 2012). Plastic deformations at the origin of the grain can be due to shocks while suppressing the shell or thermal dilatation incompatibilities between the ceramic shell and the metal during cooling.
Parasite grain During solidification of a single crystal, another grain can germinate from an inclusion or a cold point, resulting in a parasite grain with random orientation and with unwanted grain boundary. The thermal environment has to be controlled to avoid such cases.
Disorientated grain The primary orientation of a single crystal is of primary importance for the part properties. If, during solidification, the selection of the grain orientation is not correct, the primary axis of the grain is too different from the loading axis and thus the mechanical properties degrade.
1.2.7 Non-destructive controls Each produced part is checked in order to detect any out of standard defects. For this study, non-destructive controls are of primary interest to determine the 4 following parameters:
– Defect type (inclusion, shrinkage porosity . . .). – Defect morphology (spherical, elliptical, complex . . .). – Defect position (internal, sub surface or surface). – Defect size (function, or not, of loading direction).
The non-destructive controls concerned by defects listed previously are:
Macrographic inspection The concerned part undergoes a chemical attack that reveals the grains and their boundaries. The part is inspected by an operator under intensive light to detect defective grains (parasite, recrystallized) but also surface inclusions or any other external defect. Due to the difference of contrast, the operator can estimate the disorientation of a grain compared to another.
Fluorescent Penetrant Inspection (FPI) Open defects, like porosity, shrinkages, cracks, are inspected during that stage. This technique allows observing very small defects that could not have been detected during a macrographic inspection.
25
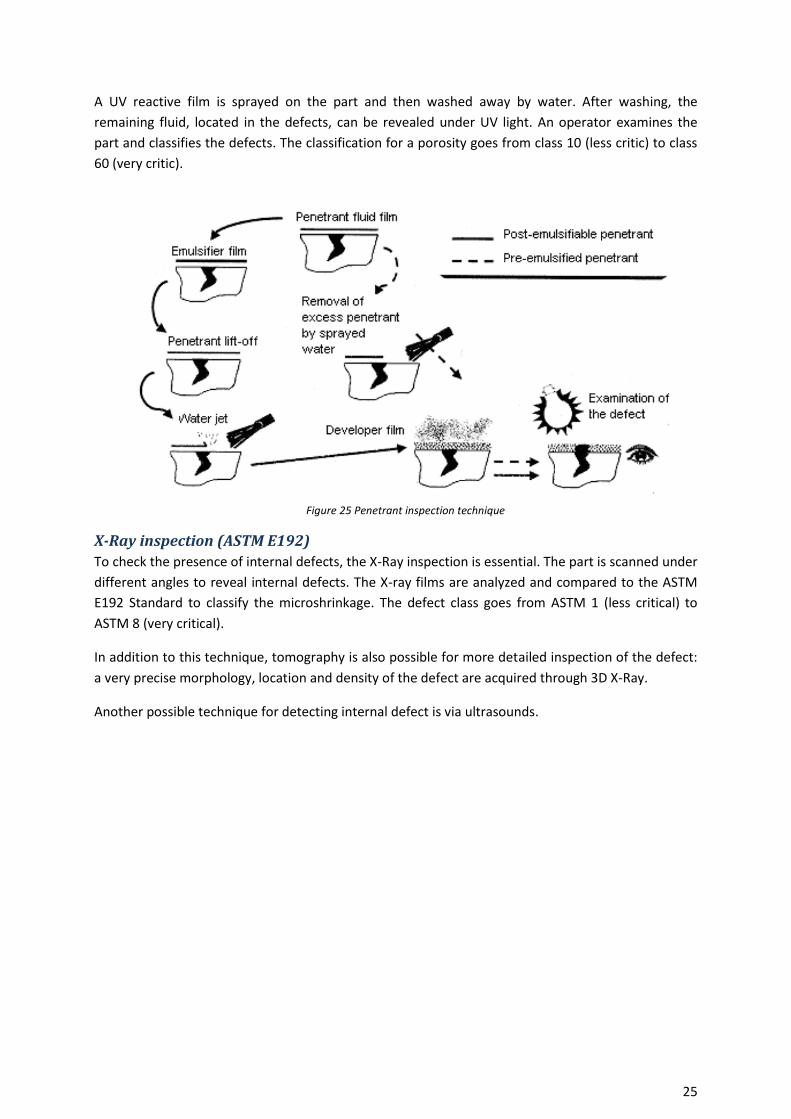
A UV reactive film is sprayed on the part and then washed away by water. After washing, the remaining fluid, located in the defects, can be revealed under UV light. An operator examines the part and classifies the defects. The classification for a porosity goes from class 10 (less critic) to class 60 (very critic).
X-Ray inspection (ASTM E192) To check the presence of internal defects, the X-Ray inspection is essential. The part is scanned under different angles to reveal internal defects. The X-ray films are analyzed and compared to the ASTM E192 Standard to classify the microshrinkage. The defect class goes from ASTM 1 (less critical) to ASTM 8 (very critical).
In addition to this technique, tomography is also possible for more detailed inspection of the defect: a very precise morphology, location and density of the defect are acquired through 3D X-Ray.
Another possible technique for detecting internal defect is via ultrasounds.
Figure 25 Penetrant inspection technique

26
1.2.8 Turbine blade geometry Here are the main parts of a turbine blade:
Front view (concave side)
Upper view (shroud)
Leading
edge
Trailing
edge
Angel wings
(root)
Angel wing
(shroud)
Shroud
Airfoil/shroud
fillet
Airfoil
Airfoil/root
fillet
Root
Deposit area
(weld deposit added on the contact surfaces between blades)
Figure 26 Turbine blade main parts

27
Chapter 2: Research project Tolerancing the casting defects, that is to say to what extent a defect can be accepted without affecting the integrity of a part throughout its life in the engine, is a problem that has to be dealt with for a reliable designing.
2.1 Industrial Context SAFRAN Aircraft Engines numbers a total of 6400 purchase orders of LEAP engines. That represents six years of production, an unprecedented record. The group has to increase its rate of production from zero to 1500 engines a year. That challenge goes along with a cost reduction project. Indeed, until now, focus was on certification, and now a higher attention is brought on costs and production volumes. The scrap rates are a possible lever for costs reductions. A better understanding of the casting defects and their impact on mechanical properties would also allow to design with more appropriated margins.
2.2 Objectives Calculate the mechanical weakness generated by casting defects.
Casting defects are widely investigated due to the difficulty to predict their impact on fatigue life. The influence of those metallurgical heterogeneities created during the casting process are mostly studied for aluminum (Avalle, et al., 2002)(González, et al., 2013) (Koutiri, et al., 2013) (De-Feng, et al., 2008) (Serrano-Munoz, et al., 2016) (Mua, et al., 2014), steel (Collini, et al., 2011) (Murakami, 1989) and titanium (Léopold, et al., 2015) (Eylon, et al., 1979) (Jinkeun, et al., 2001) (Filippini, et al., 2001) but fewer results are found for nickel-based alloys (Kunz, et al., 2006).
A double axis is considered:
- Analysis of the engines feedback: Some parts containing out-of-standards defects have been installed on test engines and flying engines after approval through concession procedures. These parts have then been controlled, and the evolution of the defect after some flights analyzed. These data are precious, for the defect has seen real life conditions. Thus, the development of a methodology to extract from these data mechanical weaknesses generated by the defects is of great interest.
- Mechanical tests campaigns: Some interesting scraped parts are collected before disposal, defects are characterized (type, shape, position, nocivity…) and when possible, samples containing defects are machined out of the part and submitted to mechanical loading. The fatigue life of the defective part is then compared with the one of a healthy sample. A simulation of the defect is then suggested and contrasted with the experimental data.
The mechanical tests campaigns were conducted in collaboration with the Material department trainee, and will be briefly described in this report.

28
2.3 Planning
Identification of the defective parts: To target the most gainful defect types, we first had to identify the highest scrap rates (according to the defect type) among internal production and external production. Pareto charts were gathered, and defect types were chosen for the study. Data regarding test feedback of different engines were then collected, analyzed and sorted by defect types. Meanwhile, scrapped parts were collected from the internal production for the mechanical campaigns. Characterization of the selected defects: Most of the time, the defect characterization of the selected defective parts is not precise enough for studying. In order to gain sufficient data (aspect, size and location of the defects), technical documents were analyzed and detailed mappings were gathered. For the scrapped parts, non-destructive controls (X-Ray, FPI, tomography …) had to be performed and controls reports had to be retrieved to accurately describe the defects and enable sample machining at a correct location. Definition of mechanical lab tests:
A fatigue test can last from a few hours to a few days for a single sample. Therefore, the whole characterization was estimated to last at least 2 months. By also considering the time needed to machine the samples, 4 months were required. In order to have sufficient time to analyze the results,
Figure 27 Road map
29
the first campaigns had to be launched in October. Preliminary lab tests (types, stress levels, temperatures, estimated time …) were used to book test machines in advance, and the test assembly
was designed and machined. Other tests campaigns were launch later one.
Preparation and follow up of lab tests: Test machines being booked, test campaigns had to be correctly prepared and approved. During the mechanical tests, the campaigns had to be supervised: levels of applied stresses are adapted according to first results, and failed samples are analyzed through failure surface inspection. These analyses provided data on casting defect fatigue life impact on tested materials. Creation of a methodology to exploit the feedback on defective parts: The data from engines feedback being collected and sorted, there were however no preexisting protocols to use them. A new methodology had to be proposed to determine fatigue life and creep impact of the casting defects, and how to use these weakening factors on different materials and engines. This methodology was then applied on a case study. Technological test: During spare time, work was also conducted on a high valuable lab test. The objective was to figure out how to reproduce in-flight conditions on a whole part (without machining a sample) in a feasible assembly. Master Thesis writing: For confidentiality reasons, this report had to be written before (01/02/2017) so that SAFRAN Aircraft Engines has proper time to read it back.
Chapter 3: Engines feedback analysis and defects weakening factors
Test engines are implemented to deliver crucial data for engines certifications, and later on for endurance testing. The primary focus is to demonstrate that certain parts can withstand specific loadings in specific conditions. However, due to parts availability and technical queries, out-of-standards parts can be assembled on such engines. Therefore, parts with casting defects can be submitted to stressful conditions or endurance testing, giving valuable data regarding their fatigue life, creep and damage tolerance.

30
3.1 Engines feedback data recovery and analysis
This part had 3 main objectives: judiciously select defect types for the study, evaluate the disposable feedbacks on test engines and sort the data collected.
3.1.1 Defect distribution and Paretos In order to select the most gainful defect types, an insight into the production scrapping levels was required. To obtain a global perspective, both the internal and external productions were looked into.
First, the researches highlighted that on a global production scale, casting defects are not the most common ones (Figure 28).
For the internal production, an evaluation of the collected scrapped parts was sufficient. However, to analyze the external production, it was first needed to understand how the suppliers exchange their data regarding defective parts with SAFRAN Aircraft Engines, and thus, how it would be possible to collect the wanted scrap levels.
When a part is defective, it can either be scrapped or submitted to a concession procedure. Concessions can concern a single part or a whole batch, and their purpose is, through defect analysis, calculation and comparison to previous cases, to establish if the defective aspects can be overlooked, and the parts sent back to production.
Therefore, it was possible to obtain an estimation of the defective parts distribution of the external production through the concession reports provided by the suppliers, that had deemed some of their defective parts to be possibly saved.
Figure 28 Distribution of 3 types of defects
31
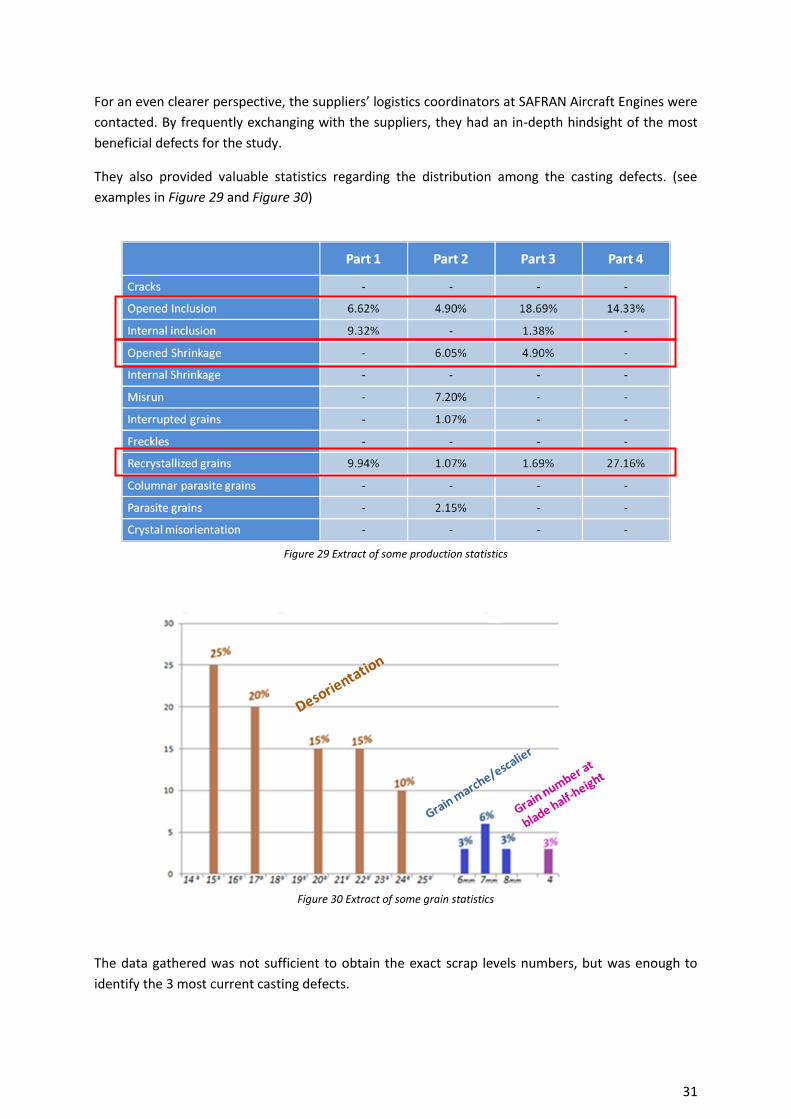
For an even clearer perspective, the suppliers’ logistics coordinators at SAFRAN Aircraft Engines were
contacted. By frequently exchanging with the suppliers, they had an in-depth hindsight of the most beneficial defects for the study.
They also provided valuable statistics regarding the distribution among the casting defects. (see examples in Figure 29 and Figure 30)
The data gathered was not sufficient to obtain the exact scrap levels numbers, but was enough to identify the 3 most current casting defects.
Figure 29 Extract of some production statistics
Figure 30 Extract of some grain statistics

32
Thanks to the charts, the concession reports, approximations regarding the n°1 casting defect for two of the biggest suppliers and the feedback of the internal production, 3 defects were selected for the study: porosity (shrinkage), inclusions and recrystallized grains (Figure 31).
3.1.2 LEAP engines feedback The goal here was to target the defective parts that had been assembled on LEAP test engines. Since there was no preexisting “direct path” to this type of information, a protocol had to be put in place.
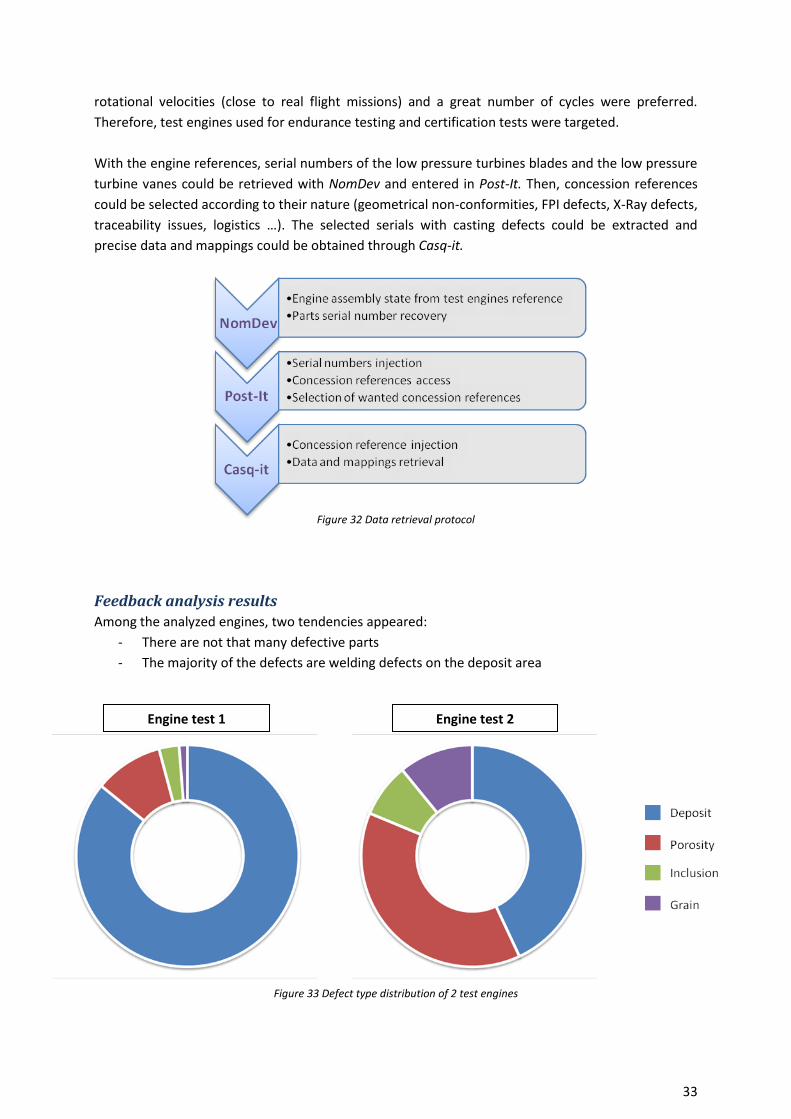
The data was retrieved using different company software:
NomDev: This software provides data on the assembly state of the different test engines. By selecting a test engines reference and a section of the engine (turbine for instance), all the serial numbers of the parts assembled can be accessed. This software also provides the disassembly states of the completed tests (end time, cumulated test time, inspection references …). Scoop/Post-It: This software is a search engine. For instance, by providing one or several part serial numbers, one could access to all concession documents attached to the serial (concession document reference, summary, parts sanctions). The data are transferred to an Excel file. Casq-it: This software is a search engine specifically developed for concession documents follow up (it is an exchange platform where the suppliers can directly submit concession requests). From a concession reference, one can access all the details, including the number of impacted parts, mechanical calculations and justifications, pictures of the defects, etc… It is also possible to obtain concessions’
references attached to one specific serial number. However, it is only possible to process one reference at a time, make it inappropriate to deal with a large number of references. The first step was to select engine references according to the nature of the test. In order to evaluate the fatigue life and the creep tolerance of defective parts, tests with high temperatures and
Figure 31 Casting defects ranking for the study
33
rotational velocities (close to real flight missions) and a great number of cycles were preferred. Therefore, test engines used for endurance testing and certification tests were targeted. With the engine references, serial numbers of the low pressure turbines blades and the low pressure turbine vanes could be retrieved with NomDev and entered in Post-It. Then, concession references could be selected according to their nature (geometrical non-conformities, FPI defects, X-Ray defects, traceability issues, logistics …). The selected serials with casting defects could be extracted and
precise data and mappings could be obtained through Casq-it.
Feedback analysis results Among the analyzed engines, two tendencies appeared:
- There are not that many defective parts - The majority of the defects are welding defects on the deposit area
Figure 32 Data retrieval protocol
Engine test 1 Engine test 2
Figure 33 Defect type distribution of 2 test engines
34
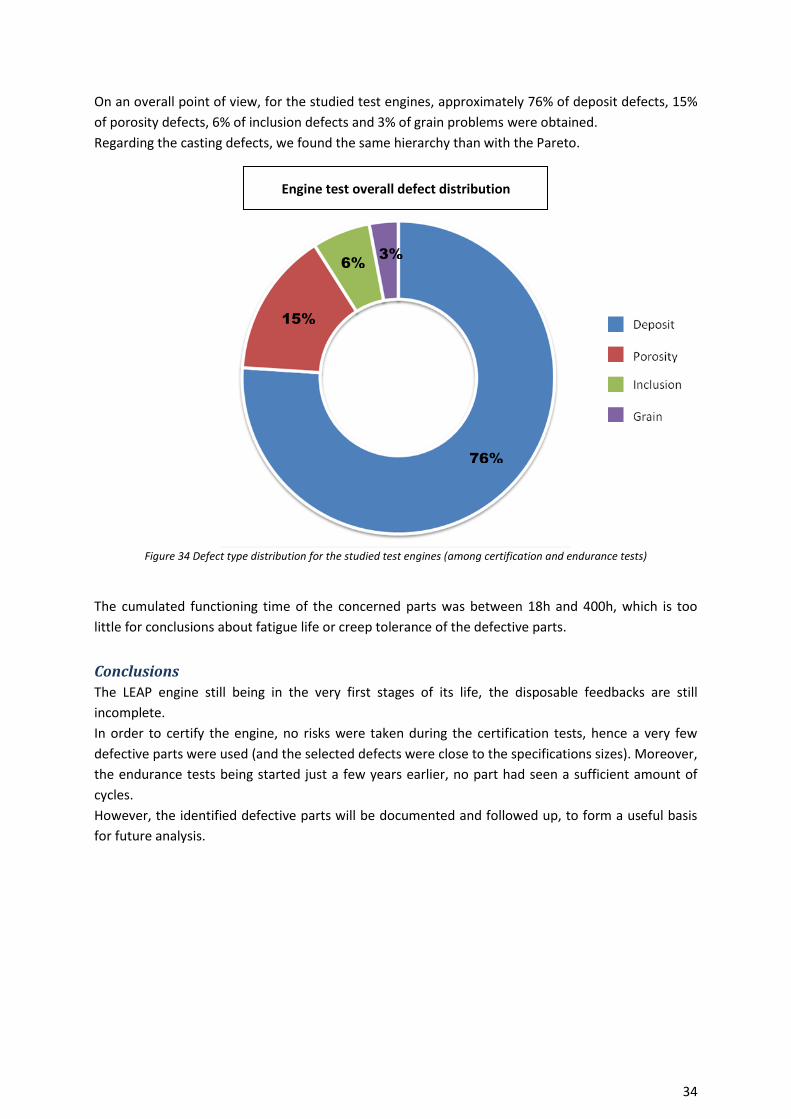
On an overall point of view, for the studied test engines, approximately 76% of deposit defects, 15% of porosity defects, 6% of inclusion defects and 3% of grain problems were obtained. Regarding the casting defects, we found the same hierarchy than with the Pareto.
The cumulated functioning time of the concerned parts was between 18h and 400h, which is too little for conclusions about fatigue life or creep tolerance of the defective parts.
Conclusions The LEAP engine still being in the very first stages of its life, the disposable feedbacks are still incomplete. In order to certify the engine, no risks were taken during the certification tests, hence a very few defective parts were used (and the selected defects were close to the specifications sizes). Moreover, the endurance tests being started just a few years earlier, no part had seen a sufficient amount of cycles. However, the identified defective parts will be documented and followed up, to form a useful basis for future analysis.
76%
15%
6% 3%
Figure 34 Defect type distribution for the studied test engines (among certification and endurance tests)
Engine test overall defect distribution
35
3.1.3 CFM56 engines feedback If the LEAP engine was new, it was not the case of the CFM56 engines. The CFM56 engines family had almost 40 years of service, and therefore a substantial amount of data was available.
The objective was to recover the data from test engines (approximately 40) that had worked between 1994 and 2002.
The work was organized in two different parts:
- Data sorting: the data were stored in Excel files, and concerned many different defects. The first step consisted in selecting the data regarding casting defect and controlling if no information was missing (engine reference, serial number, concession code, performed tests, tests times …). Then the feedbacks were organized by serial numbers. The data source had been entered and sorted by engine reference: the parts that had been assembled on several test engines were present several times, for each different test. This allowed obtaining, for each defect, the cumulated functioning time which was crucial information.
- Concession documents and mappings analysis: the second step was mainly defect mappings analysis. The goal was to collect the maximum details on the selected defects: after retrieving the type of the defect, the precise size and location had to be obtained. Different types of documents (Excel files, concession reports, scanned documents …) and software had
to be used.
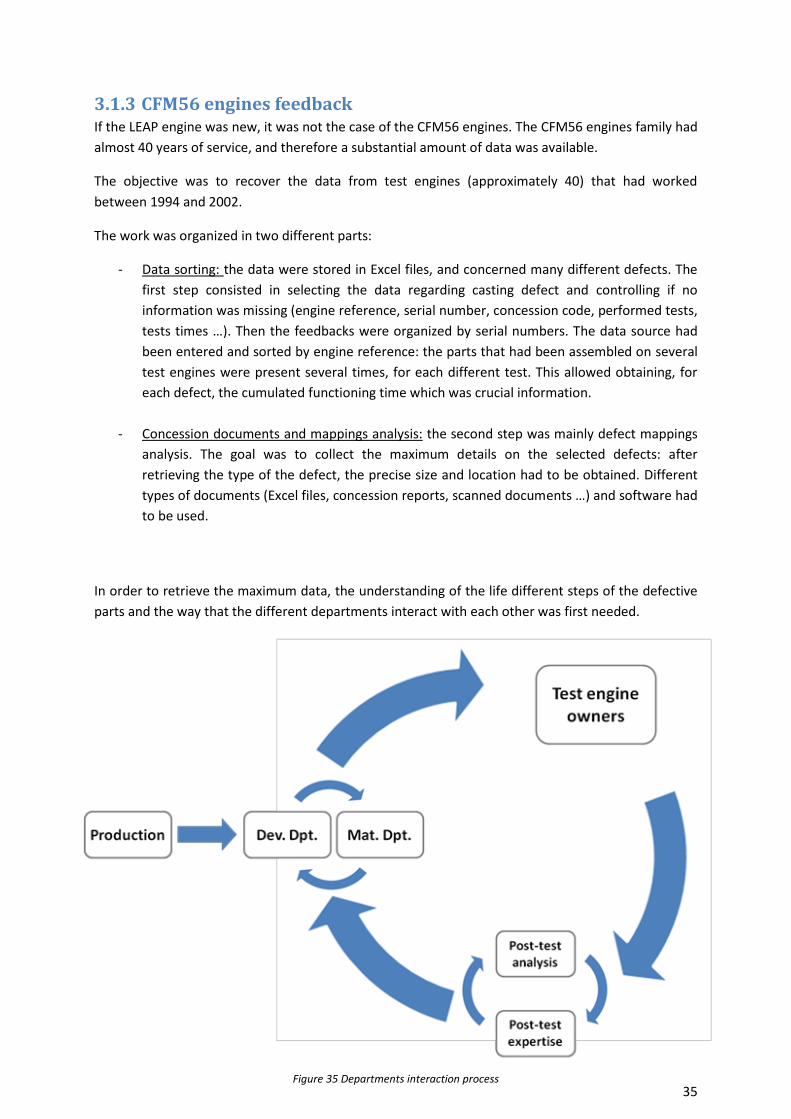
In order to retrieve the maximum data, the understanding of the life different steps of the defective parts and the way that the different departments interact with each other was first needed.
Figure 35 Departments interaction process
36
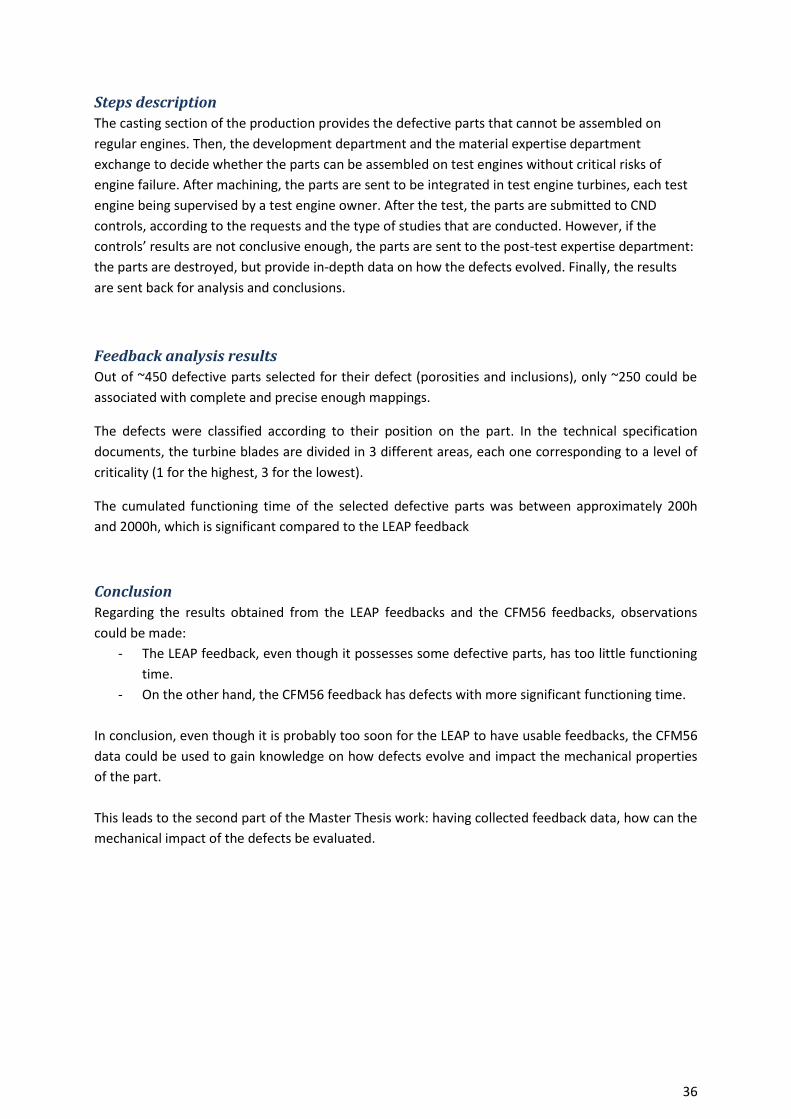
Steps description The casting section of the production provides the defective parts that cannot be assembled on regular engines. Then, the development department and the material expertise department exchange to decide whether the parts can be assembled on test engines without critical risks of engine failure. After machining, the parts are sent to be integrated in test engine turbines, each test engine being supervised by a test engine owner. After the test, the parts are submitted to CND controls, according to the requests and the type of studies that are conducted. However, if the controls’ results are not conclusive enough, the parts are sent to the post-test expertise department: the parts are destroyed, but provide in-depth data on how the defects evolved. Finally, the results are sent back for analysis and conclusions.
Feedback analysis results Out of ~450 defective parts selected for their defect (porosities and inclusions), only ~250 could be associated with complete and precise enough mappings.
The defects were classified according to their position on the part. In the technical specification documents, the turbine blades are divided in 3 different areas, each one corresponding to a level of criticality (1 for the highest, 3 for the lowest).
The cumulated functioning time of the selected defective parts was between approximately 200h and 2000h, which is significant compared to the LEAP feedback
Conclusion Regarding the results obtained from the LEAP feedbacks and the CFM56 feedbacks, observations could be made:
- The LEAP feedback, even though it possesses some defective parts, has too little functioning time.
- On the other hand, the CFM56 feedback has defects with more significant functioning time. In conclusion, even though it is probably too soon for the LEAP to have usable feedbacks, the CFM56 data could be used to gain knowledge on how defects evolve and impact the mechanical properties of the part. This leads to the second part of the Master Thesis work: having collected feedback data, how can the mechanical impact of the defects be evaluated.

37
3.2 Weakening factors generated by defects After data recovery, the goal was to try and develop a methodology to use the engines feedbacks to quantify the effect of casting defects. There were no preexisting protocols, but the way concessions were treated and the different existing defect models helped indicate paths for reflection. In this part will be presented the defects simulation models, the methodology developed (evolutions and steps) and a case study.
3.2.1 Defects simulation In order to obtain weakening factors generated by the defects, theoretical models are compared to lab test results: formulas are created to give, with an appropriate number of variables, results close to the tests. Two main weakening factors are used: one for the mechanical fatigue phenomenon, Low Cycle Fatigue (LCF) and High Cycle Fatigue (HCF), and one for the creep phenomenon.
There are several theoretical ways to simulate a defect. The two main approaches are stress concentration and failure mechanics (through crack propagation).
In this paragraph, shrinkages, inclusions and recrystallized grains simulations will be presented.
Stress concentration The defect can be seen as geometrical discontinuity that induces a stress concentration. Locally (close to the defect) the stress can be much higher than in a healthy part (see Figure 36). Furthermore, the stress on the section is increased due to the section area reduction. For each defect’s geometry, it is possible to calculate a stress concentration factor to measure the harmfulness of the defect.
Stre
ss
Depth
Figure 36 Stress concentration scheme

38
(1)
Spherical hole Several analytical formulas already exist. Here the easy case of a circular hole in an infinite plate under traction (François, (1993)):
The constraint filed can be calculated:
(2)
(3)
(4)
With the hole radius, the applied stress, the distance to the hole center and the coordinate angle in the cylindrical coordinate system (see Figure 37). In this case the stress concentration factor can be calculated as follow:
(5)
Figure 37 A circular hole in a plate under traction

39
On the hole surface, the orthoradial stress is:
(6)
Which is maximum for
, and gives:
Elliptical hole Those calculations have been enriched by Peterson to cover the case of an elliptical notch (Peterson, 1974), seen on Figure 39:
(7)
Figure 38 Analytical stress field around the hole
Figure 39 Elliptical notch

40
The stress concentration factor for an elliptical notch is:
(8)
With the depth of the notch and the minimum radius at the bottom of the notch.
This approach is especially used for surface defects, such as nicks and dents.
More complex configurations For more complex configurations and shapes, and especially for 3D approaches, a FEM calculation is most of the time necessary.
In the case of a cylindrical defect very close to the surface (Figure 40):
.
Stress concentration approach and material data Once the stress concentration factor around the defect has been estimated, it can be used to provide new Wöhler curves. For conservatism purpose, the idea is to consider that the whole section of the part is submitted to the local maximal stress (around the defect). It is then possible to translate the Wöhler curve with the factor and determine the new fatigue life of the part.
The Figure 41 pictures the method used: the fatigue life of a healthy part submitted to a certain level of stress is cycles. For a part with a defect inducing a stress concentration factor, the fatigue life curve is dropped by a factor (dotted curve): the fatigue life is then reduced to cycles. With this new value, it can be decided whether the part can be mounted on an engine or not.
Sigmises = 319MPa Sigmises = 95MPa
Figure 40 FEM simulation for a cylindrical defect near the surface of a bending test

41
Depending on where the defect is located on the part, what are the local loads and temperatures and what are the design margins, a map of acceptable areas for the defect can be drawn.
Crack propagation The other approach is the study of the defect as a crack initiation site. This approach is more adapted to very local defects (like inclusions or high density porosity) than to diffuse ones (low porosity rates). The defect is replaced by a crack of the same size and perpendicular to the direction of the load (to activate mode 1): this is very conservative. Once the defect is replaced by a crack, two cases are possible: whether the crack propagates or not. For this analysis, the stress intensity factor is introduced and defined as follow:
(9)
With a geometrical correction factor, the half crack length and the applied stress far from the defect. The stress intensity range can also be introduced:
(10)
Paris law’s (Paris, et al., 1963) shows the relationship between the crack growth rate and the stress intensity factor range under a stress fatigue regime. On the example shown Figure 42 it can be stipulated that under a certain threshold , the crack does not propagate. When considering the defect as a crack, if the ensuing is below that threshold, which is a material dependent parameter (for a given testing procedure), the part will not suffer a drop in fatigue life.
Figure 41 Wöhler curve of a healthy part (solid line) and defectuous part (dotted line)

42
Should the be above , Propag© software shall be used to calculate the crack propagation and the fatigue life, to help conclude whether the part can be used in normal conditions or not.
Kitagawa diagram Kitagawa (Kitagawa H., 1976) suggested using a new kind of diagram to easily determine whether the defect size is acceptable or not (Figure 43). The diagram shows the fatigue life limit in a graph with the area of the defect versus the range of applied stress. When the defect is small, the endurance limit is the same as for a healthy material. But when the defect area increases and crosses a material dependent threshold:
(11)
The stress range for a starts to decrease following the linear elastics fracture mechanics:
(12)
Some examples of the use of Kitagawa diagram can be found in the literature (Murakami Y., 1980), (Roy M. J., 2011), (Murakami, 1989).
No propagation
Figure 42 Paris curve

43
Simulation application According to the type, size, morphology of the defect, a relevant method from the ones listed previously is applied.
Shrinkage : If the defect is diffuse and the area affected is big, the stress concentration method will be referred to. On the contrary, if the defect is severe and more localized, a crack propagation simulation will also need to be conducted (see examples Figure 44).
Inclusions: Hypothesis: such defects are considered as geometrical defects. This is a strong hypothesis as the fragile particle inside the material can be more harmful than a hole.
FEM calculations for different particle sizes at different locations were conducted to get the stress concentration factor. Tests results must be compared to these values.
No fatigue failure
Fatigue failure
Experimental trend
Figure 43 Kitagawa diagram
Local and severe defect Æ crack propagation method
Diffuse defect Æ stress concentration method
Figure 44 Example of shrinkages and methods applied

44
Recrystallized grains: Hypothesis: such defects are considered as spherical surface geometrical defects. Justification: due to the chemical composition of directionally solidified and single crystals, the grain boundary is very weak, thus recrystallized grains do not hang on the part. The experience of the lab showed that deepness of recrystallized grain was approximately its radius.
The same method as for inclusion can be applied.
3.2.2 Methodology
Evolutions stages Weakening factors are established by the material expertise unit. However, due to approximations and lack of data, the factors come with conservatism. The main reason for using test engine feedbacks was to find out if it was possible to establish the mechanical impact of a defect without only relying on the lab tests results and the factors they provide. This would allow to comfort or refine our understanding of the defects mechanisms.
Therefore, this methodology was proposed to figure out if it was possible to establish weakening factors not coming from lab experiments, but test engines.
During the first stage of the project, 2 main steps were defined: one step to obtain weakening factors, and one to transfer the results from a CFM56 case to a LEAP case. Indeed, at that time the project had a very specific goal: since no data was available with the LEAP engine, the idea was to use the CFM56 one to get results which would then be adapted for the LEAP.
During the second stage, the two steps were refined. However, quick estimations showed that in order to provide beneficial results, the methodology needed defective parts with very demanding characteristics (high temperature and stress levels on the defect area, and great amount of test cycles).
The next stage consisted in trying to apply the methodology to a case study in order to have an in-depth insight of the blocking points. This allowed improving some steps, simplifying the way the results are transferred between engines and finding comforting results.

45
Methodology presentation
The methodology is composed of 4 steps, which purpose are to mechanically characterize the defect, find equivalences between test cycles and reference cycles (flight cycles), calculate mechanical weakening factors and propose hypothesis to extend the results to other parts or materials.
This methodology cannot provide precise weakening factors, but an upper limit. This is due to the fact that it was build on ancient feedback data, hence leading to approximate information on the defects characteristics and the cycles.
However, the prerequisite of the methodology is an access to a complete enough description of the defect characteristics (type, size and mapping) and the tests cycles (cycles graph, total functioning time). See Figure 45 and Figure 46.
Figure 45 Example of a post-engine test report of a porosity (on the left), and a mapping of inclusions (on the right)
46
Step 1: Defect characterization
The objective of the first part is to mechanically represent the defect. Even though the defect characteristics and the tests cycles are known, the stress and temperature levels undergone by the defect are still missing.
Since no captors or measurement devices can provide live readings of the mechanical loadings applied on the part during the tests, the use of simulation models is needed.
The idea is to use a FEM simulation of the studied part, target the defect area and read the wanted data on the model nodes. However, the simulation parameters have to correspond to the real-life characteristics (applied centrifugal force and temperature). In order to do so, an appropriate FEM file has to be selected.
For each specific part (part reference), several FEM calculations can exist.
This is first due to the fact that among a family of engines, the same part can be assembled on different turbine models, since not all parts are modified when developing new versions. And for each engine version, different flight characteristics are used. Thus, a panel of FEM simulations with different input parameters is available, each simulation corresponding to a reference flight mission.
In order to select the FEM file with input parameters close to the ones of the tests, a comparison between what is called the EGT temperatures is done. The EGT temperature is the temperature given by a captor placed in the hot part of the low pressure turbine. The EGT temperature is the reference temperature given when describing an engine test, and is also provided for each specific flight mission. If the EGT comparison is not conclusive enough, a study of the parts temperature gradients and the applied rotational speed can be added (selection of the most conservative model).
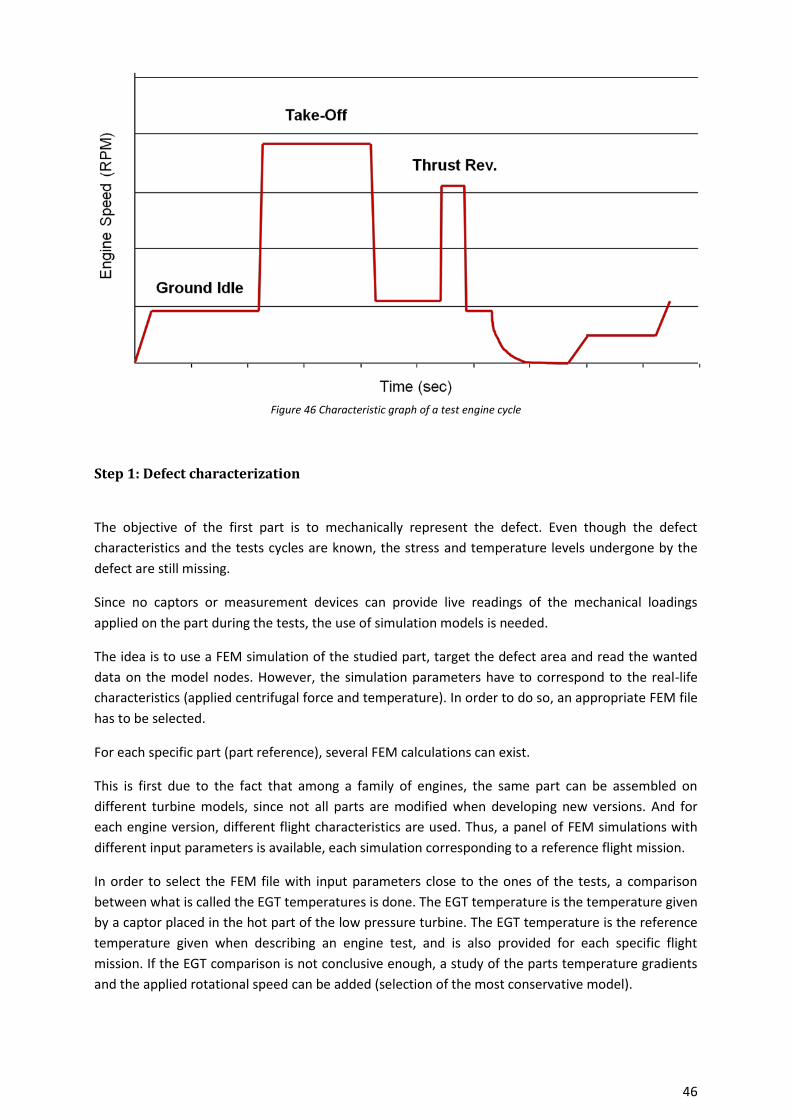
Figure 46 Characteristic graph of a test engine cycle

47
The other aspect that leads to having several FEM calculations for a same part is that during a flight mission, several phases (different engine power levels) follow each other. For instance, we can see 3 of them in Figure 46: Ground Idle, Take Off and Thrust Reverse. During the certification of an engine, several phases are tested through FEM simulations. However, for this study, only the Take-Off (TO) phase will be used: this is the most stressful phase (highest stress and temperature levels) and has parameters close the tests conditions. Using the Take-Off phase allows making conclusions with conservatism: if the part can sustain Take-Off conditions, it can sustain the other phases as well.
In conclusion, the FEM simulation file is first selected by choosing a flight mission with an EGT temperature close the one used during the test, and then by selecting the Take-Off simulation.
Then, the maximum stress and temperature present around the defect can be retrieved.
Step 2: Test/Flight cycles equivalence
The objective here is to transform the tests cycles characteristics into usable data. To compare the fatigue life reached during the test to the theoretical one, obtained through simulations with flight mission cycles, same type of fatigue processing must be used. Test cycles are composed of phases different than the real flight mission ones.
Hypothesis:
x Low Cycle Fatigue (LCF): the equivalence in terms of LCF is done by analyzing the number of Take-Off increments in the test cycle and in the reference flight mission cycle. Then, by dividing the number of TO-increments in the test cycle by the number of TO-increments in the flight cycle, one can obtain a number of equivalent test cycles, which can then be used with material Wöhler curves. This hypothesis is very conservative since we consider that the part has only been submitted to fatigue damaging during these Take-Off increments, and not during the other phases.
Figure 47 Comparison between a test cycle and a flight cycle
48
x Creep: the equivalence in terms of creep is done by analyzing the cumulated Take-Off time. The temperature being the highest during Take-Off (around 800-1100°C), it is during this phase that the creep phenomenon is at its maximum. However, this hypothesis is also approximate, since creep also occurs during the other phases which still have consequent temperatures (around 600-700°C).
At the end, this provides for the part an equivalent number of flight cycles performed, for LCF and creep fatigue.
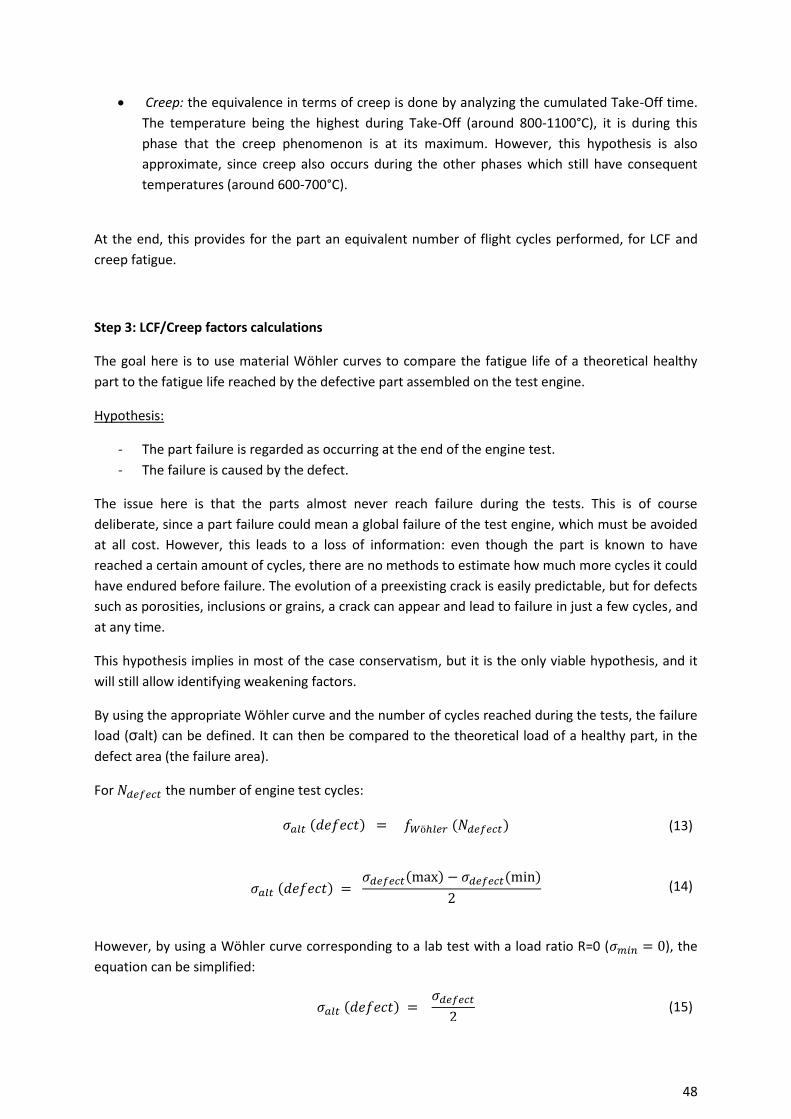
Step 3: LCF/Creep factors calculations
The goal here is to use material Wöhler curves to compare the fatigue life of a theoretical healthy part to the fatigue life reached by the defective part assembled on the test engine.
Hypothesis:
- The part failure is regarded as occurring at the end of the engine test. - The failure is caused by the defect.
The issue here is that the parts almost never reach failure during the tests. This is of course deliberate, since a part failure could mean a global failure of the test engine, which must be avoided at all cost. However, this leads to a loss of information: even though the part is known to have reached a certain amount of cycles, there are no methods to estimate how much more cycles it could have endured before failure. The evolution of a preexisting crack is easily predictable, but for defects such as porosities, inclusions or grains, a crack can appear and lead to failure in just a few cycles, and at any time.
This hypothesis implies in most of the case conservatism, but it is the only viable hypothesis, and it will still allow identifying weakening factors.
By using the appropriate Wöhler curve and the number of cycles reached during the tests, the failure load (σalt) can be defined. It can then be compared to the theoretical load of a healthy part, in the defect area (the failure area).
For the number of engine test cycles:
(13)
(14)
However, by using a Wöhler curve corresponding to a lab test with a load ratio R=0 ( ), the equation can be simplified:
(15)

49
The weakening factor generated by the defect is considered caused by a stress concentration factor. This means that the link between the defective load and the load of a healthy part can be represented by the following equation:
(16)
In conclusion the weakening factor can be obtained, for an R=0 Wöhler curve, by:
(17)
(For creep curves, the testing process is not cycled, thus the “2” in the previous formula used for is not needed)
For the example presented in Figure 48 ( ), this would give:
(18)
(19)
Cycles Figure 48 Wöhler curve – retrieval of the defect stress thanks to the number of cycles

50
The conclusion would then be that the mechanical impact of this type of defect is equivalent to an overload of 3,33 times the normal stress levels.
By applying the factor, simulations can then be conducted to establish if the part can still meet the technical specifications.
Step 4: Results application
The purpose of this part is to propose a solution for using the results found in the previous step on different cases. It would be a waste of time to conduct the same tests and analysis for every engine, every part and each material. With one set of results, a global conclusion on the defect behavior should be obtained.
The first idea was to work by comparing static criticalities:
(20)
This criticality ratio allows comparing {stress, temperature} couples by transforming them into different critical levels: a weak stress level but with a high temperature can be as damaging as a high stress level with low temperature.
The objective was then to assign to the weakening factors defined in the previous step a criticality ratio, and state that these factors would be valid for every area of the part that had an equal or lower critical level.
(21)
However, this lead to complex mappings of criticality levels, and there was no real demonstration on how criticality ratios behaved when changing materials.
The material expertise department, when establishing a weakening factor through a lab test campaign, directly concludes that the factor is valid for every material and every {stress, temperature} couples.
This conclusion can first be accepted if one considers that the weaknesses generated by a defect are purely due to geometrical discontinuities. This means that for a specific defect’s geometry, different loading levels will lead to the same stress concentration factor, hence to the same weakening factor. Therefore, for a same material, the weakening factor is the same whichever criticality ratio.
Secondly, to prove that the different materials have the same general behavior, the response to a specific {stress, temperature} couple should be similar.
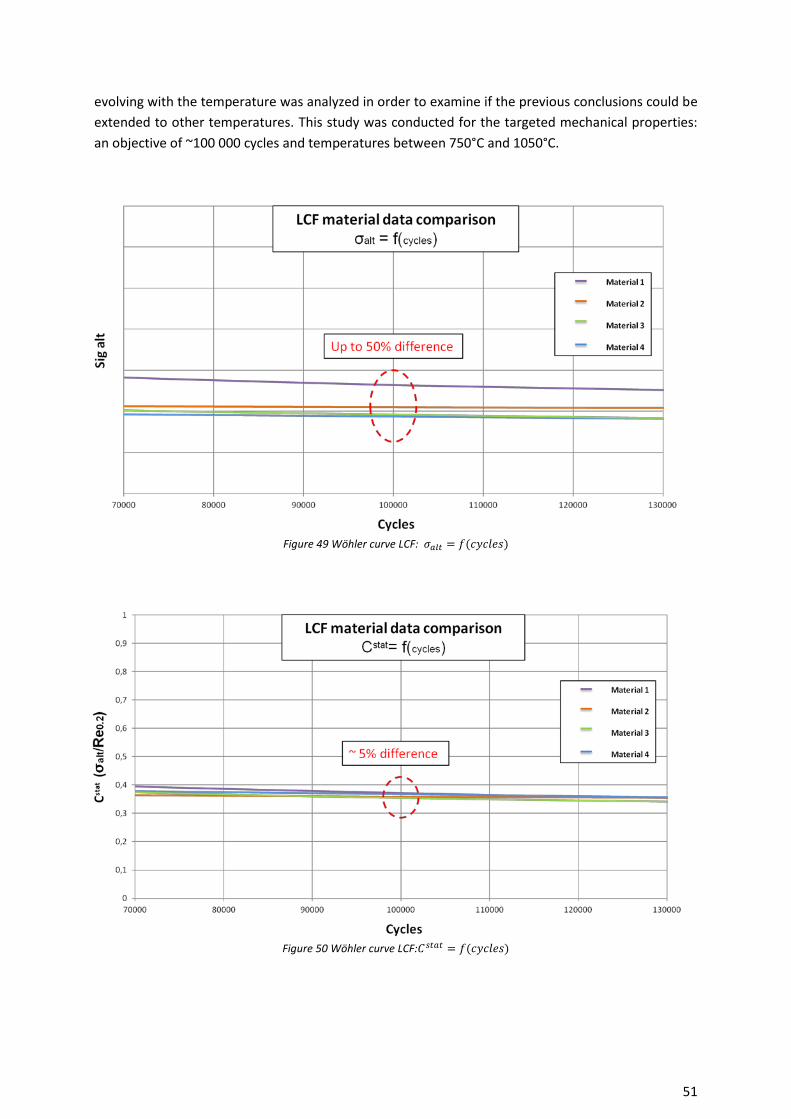
In order to do so, 4 of the most used materials were compared. First, and for a selected temperature, the LCF material curves were divided by the material’s yield criterion, linking the number of cycles to failure not to a load, but to a criticality ratio. Then, the data describing how the failure load is
51
Figure 50 Wöhler curve LCF:
evolving with the temperature was analyzed in order to examine if the previous conclusions could be extended to other temperatures. This study was conducted for the targeted mechanical properties: an objective of ~100 000 cycles and temperatures between 750°C and 1050°C.
Figure 49 Wöhler curve LCF:

52
The Figure 50 shows that on a criticality point of view, the different materials have a very similar behavior (especially between 80 000 cycles and 120 000 cycles, which is the targeted life span of the parts). And then, the Figure 51 demonstrates that this behavior resemblance is valid for a wide range of temperatures.
Conclusion: the weakening factors obtained through this methodology could be valid for every material. Moreover, the LCF weakening factor is also valid for the HCF fatigue calculations (same theoretical Wöhler curves).
Notes: here are some consequences of the methodology
- In order to obtain advantageous results, the part must have seen a consequent number of cycles (important total functioning time)
- For defects with the same {stress, temperature} couple, the ones with the weakest material (lowest LCF fatigue tolerance) will provide the most advantageous results.
- Reciprocally, for a batch of identical parts, the defects in the most critical areas will provide most advantageous results.
Finally, for this methodology to be optimal and provide more beneficial results, the defects must be fully characterized (full tomography and FPI) before assembling the parts, and followed up closely during the tests. Moreover, for a rigorous conclusion on the defects evolution, the parts should be cut and analyzed in-depth at the end of the test, to clearly establish the evolution of the part and the damaging of the material surrounding the defect.
Figure 51 Failure load versus temperature curves for 4 nickel based alloys (material points and trend curves)

53
3.2.3 Case study: ASTM4 shrinkage
The methodology has been applied on a real case of ASTM4 porosity. This helped precise the methodology steps, and provided proof-of-concept results.
For confidentiality reasons, the following numerical values will be modified.
Defect characterization The case study has been chosen from the CFM56 engine feedback. It was selected for 3 reasons:
- It concerns a batch of 13 parts, giving weight to the results. - It concerns defects with the highest cumulated functioning time. - The defects are localized in an area with relatively high stress and temperature
levels.
The defect is an ASTM4-sized shrinkage, spread over an area of 5mm x 20mm. It is localized on the upper part of the airfoil (85-100%), on the concave side (area 2), and closer to the leading edge. The material is equiaxed (IN100). The part has been submitted to 4 different types of cycles, for a total cumulated time of 2100h. (see Figure 52)
Figure 52 Report and mapping of the ASTM4 porosity defect
54
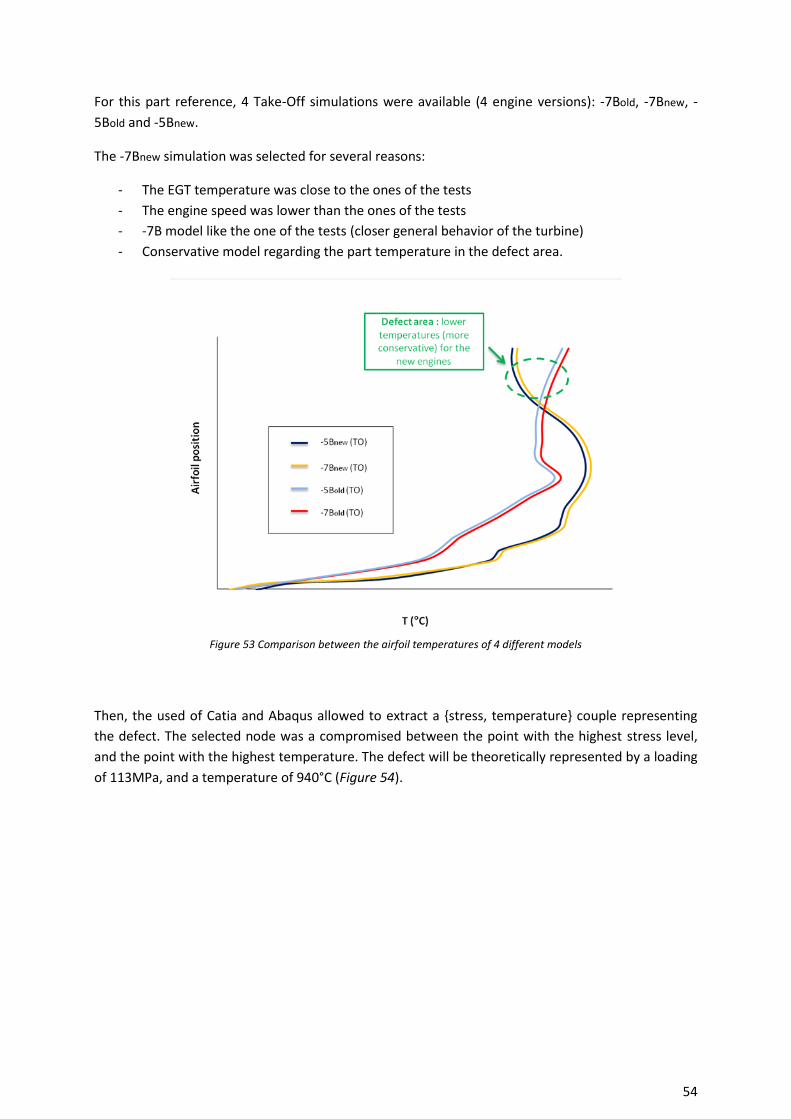
For this part reference, 4 Take-Off simulations were available (4 engine versions): -7Bold, -7Bnew, -5Bold and -5Bnew.
The -7Bnew simulation was selected for several reasons:
- The EGT temperature was close to the ones of the tests - The engine speed was lower than the ones of the tests - -7B model like the one of the tests (closer general behavior of the turbine) - Conservative model regarding the part temperature in the defect area.
Then, the used of Catia and Abaqus allowed to extract a {stress, temperature} couple representing the defect. The selected node was a compromised between the point with the highest stress level, and the point with the highest temperature. The defect will be theoretically represented by a loading of 113MPa, and a temperature of 940°C (Figure 54).
Figure 53 Comparison between the airfoil temperatures of 4 different models

55
Cycles equivalence The parts have been submitted to 4 types of cycles: A, B, C and D.
The A and B cycles are endurance cycles, and their graph was available. However, the information collected on the cycles C and D was not valuable enough for the study. Therefore, only the A and B cycles will be considered (conservative hypothesis).
Figure 54 3D Post-treatment analysis, stress and temperature levels recovery
Figure 55 Characteristic graphs of cycles A and B

56
The parts have executed 2500 cycles A and 15000 cycles B. With this information, it is now possible to calculate the equivalent number of LCF cycles (knowing that the flight mission has 2 TO-increments), and the total cumulated Take-Off time for the creep:
(22)
(23)
LCF/Creep factors calculation By using the previous data and the material Wöhler curves for LCF and creep, the following results were obtained:
(24)
(25)
Hence, and if the weakening factors are assimilated to a Kt:
(26)
(27)
Cycles
Wöhler curve
Figure 56 Wöhler curve LCF: retrieval of

57
One the first hand, the obtained results were not as advantageous as hoped: the defective parts with the most potential (1994-2002 CFM56 feedback) did not lead to a significant improvement of the porosities behavior characterization.
However, on the other hand, it was a proof of concept that relevant data, on how a foundry defect impacts the mechanical properties, could be retrieved from the engine feedbacks. Since 2013, the weakening factors are provided by the Material department. In comparison, the factors found with this case study are almost the same for the creep, and 12% lower for the LCF.
In conclusion, even though the results are not as beneficial as hoped, the concept of using engine feedbacks to gain knowledge on foundry defects’ behaviors is promising. Moreover, studies are
presently conducted in the department in order to more accurately understand the difference in mechanical damaging between a test cycle and a flight mission.
3.3 Defect acceptability conditions
Characterizing the mechanical impact of foundry defects was only the first step. Indeed, in order to extend the technical specifications to reduce the scrapping rates, one must prove that even with the weakening factor induced by the defect, the part can still meet the mechanical requirements.
Mechanical calculations are conducted when dealing with concessions. However, the calculations are established for a specific case: a precise defect in a precise location. Here, in order to be able to extend technical specifications, the ability of a part to sustain its defect must be proved for every scenario possible. The mechanical demonstrations must embrace every shape, origin, location, proximity to other abnormalities, etc …
During this period of the Master Thesis, the Material department was in the process of validating upgraded weakening factors (more data had been collected in the past years, leading to less dispersion of the results and hence less conservatism). This was of great interest since with these new factors, there were chances that the acceptable size of some defects could be increased in the technical specifications.
Following on from the previous part, the case of porosity will be treated here.
58
3.3.1 Mechanical criteria First, static mechanical criteria need to be verified. These are the main requirements needed, for concessions, to accept a defective part. There are 4 of them, a preliminary criterion, and then one for LCF, HCF and creep:
x Preliminary criterion: First, this prevents the apparition of plasticity. And besides, if this criterion is not respected, the other ones won’t be either, avoiding unnecessary calculations.
x LCF: is the targeted (and minimum) LCF life span used when developing the part. If the part cannot reach this limit, it will not be able to achieve the wanted number of flights.
x HCF:
The dynamical admissible stresses must be higher than , which is the minimum dyn. adm. stress set when developing the part.
x Creep:
A part, working in a specific temperature, must be able to resist a defined time, , before failure. This limit is set when developing the part, and is link to in-flight conditions.
For the other criteria, the Master Thesis work on this part is still ongoing. Researches and validation processes are conducted to establish the needed requirements to extend technical specifications.
Here are for instance some of the points studied:
x Pre-stress effect on the shroud: in real-life conditions, a pre-stress (torsion) is applied on the blades before assembling. This aspect has been modeled in FEM simulations, but leads to very high stress concentrations. The idea was to evaluate if the pre-stress simulation was required or relevant, and if the stress concentrations were due to the mesh itself.
x Proximity of other abnormalities: the fact that 2 different defects (a porosity and an inclusion for instance) could be close to each other have to be considered. This is presently accepted thanks to material feedback of the parts over the years, and by restricting the number of defects in each specific area.
x Impact of porosities on vibration modes: it is normally considered that a porosity does not dynamically impact the part (no changes in the modes frequencies). The idea was here to propose an approach to try and prove it through negligible mass variation:
(28)

59
With and the acceptable frequency and mass variations, and K the rigidity of the part (could be assimilated to the Young Modulus). When defining a porosity, 2 characteristics are of importance: the size (ASTM3, ASTM4…)
which represents how spread is the defect on the X-ray picture, and the porosity ratio, which represent how porous it is. For each size of porosity there is a range of porosity ratios. The idea was to select the upper part of this range for each porosity size (the maximum porosity ratio observed) and establish which portion of the part’s volume
should be affected by the defect to lead to a mass reduction of . For a porosity ratio , and an acceptable mass variation :
(29)
(30)
(31)
Example: for a porosity ratio of 10% and an acceptable mass variation of 5%, this would give:
(32)
This means that in order for this porosity to have an effect on the modes’ frequencies, it
would have to be present in 50% of the part’s volume.
3.3.2 Calculation methodology and case study The objective here was to establish if the mechanical criteria were still acceptable in some areas of turbine parts, even after applying a weakening factor due to a porosity.
The study was conducted on the turbine low pressure blades 1 to 6, and for different sizes of porosities. When the mechanical criteria were met for a defect size and a part area, the next size was tested, and so on.
In order to gain flexibility when analyzing the results, the blades were divided in several areas, which were then treated individually: shroud, leading edge, trailing edge, airfoil (concave and convex surfaces), airfoil/root fillet radius and airfoil/shroud fillet radius. Due to limitations of the FEM simulation (boundary conditions), the root was not treated.

60
Calculation methodology and hypotheses When conducting the calculations, material data were used. To keep a safety margin and stay conservative, only the minimum curves were used. Minimum curves are obtained by applying a certain amount of time the standard deviation to the average curve (obtained with the material lab tests results).
Then, the material curves are only available for specific temperatures and loading ranges. In order to extrapolate and interpolate the data, some hypotheses were made:
x Extrapolation at a given temperature: linear logarithmic extrapolation (see Figure 57) x Interpolation between 2 temperatures (LS = Life Span):
(33)
Extrapolation if the temperature is below the minimum temperature available for these material data:
(34)
(35)
This last equation is to be used carefully, since the extrapolation method will provide skewed results if the temperature is way below the ones with available data.
Cycles
Conservative extrapolation Conservative extrapolation Material data utilization
extrapolation
extrapolation
Experimental data
Figure 57 Wöhler curve extrapolation method (at a given temperature)
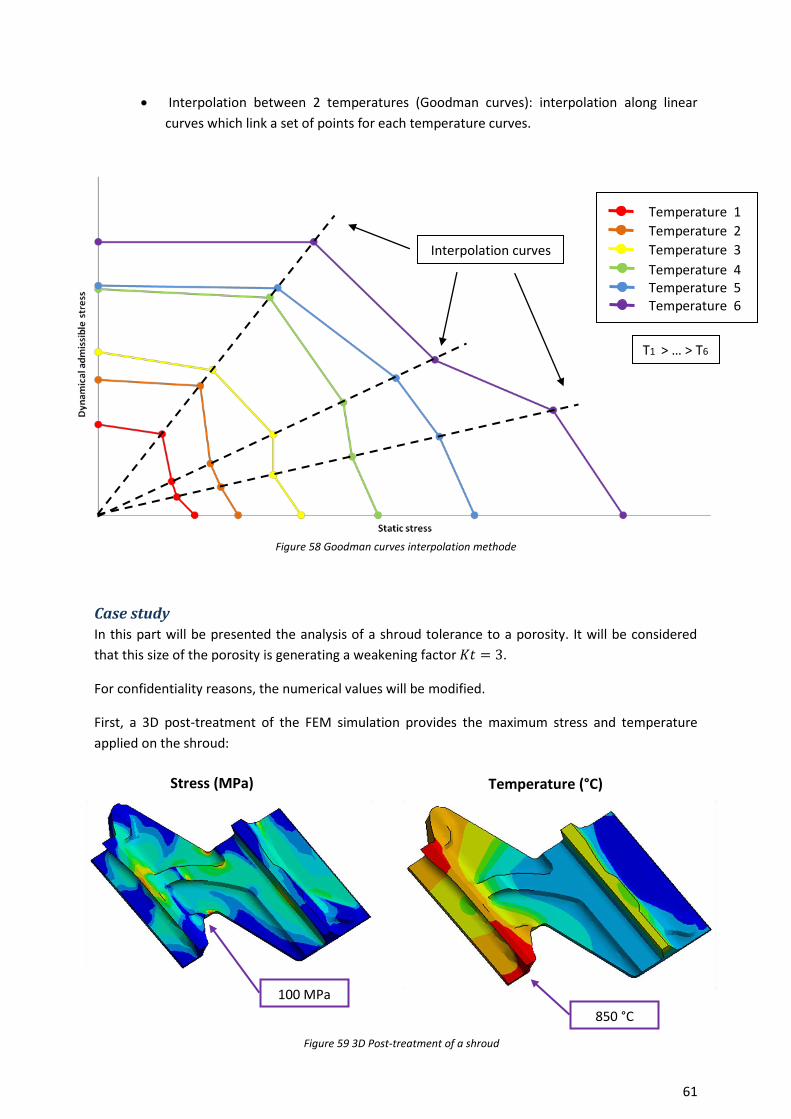
61
x Interpolation between 2 temperatures (Goodman curves): interpolation along linear curves which link a set of points for each temperature curves.
Case study In this part will be presented the analysis of a shroud tolerance to a porosity. It will be considered that this size of the porosity is generating a weakening factor .
For confidentiality reasons, the numerical values will be modified.
First, a 3D post-treatment of the FEM simulation provides the maximum stress and temperature applied on the shroud:
Temperature (°C) Stress (MPa)
100 MPa 850 °C
Figure 59 3D Post-treatment of a shroud
T1 > … > T6
Temperature 1 Temperature 2 Temperature 3 Temperature 4 Temperature 5 Temperature 6
Interpolation curves
Figure 58 Goodman curves interpolation methode

62
Taking the maximum stress and the maximum temperature is conservative, but allows covering the whole area with the results. The impact of the defect can then be quantified through the weakening factor:
(36)
(37)
Which is then compared to the curve to verify the preliminary criterion.
Here, the overstress generated by the defect does not exceed, for 850°C, 80% of the elastic limit: the first criterion is respected.
Temperature (°C)
Re0.2 (MPa)
Yield Criterion curve
80% curve
margin
Figure 60 Re0.2 versus temperature curve: preliminary criterion
Cycles
Temperature 1 Temperature 2 Temperature 3
T1 < 850°C < T2 < T3
Figure 61 Wöhler curve: LCF criterion
Interpolated curve
margin

63
The Figure 61 demonstrates that the defective part meets the technical specifications regarding the low cycle fatigue life: the number of cycles reached is greater than .
The same type of study has shown that the creep criterion is also respected: the number of hours reached before creep failure is greater than .
Finally, the HCF criterion had to be verified. After Goodman curve interpolation, it was proven that
(obtained for a static stress ) was greater than . (see Figure 62)
In conclusion, the shroud could meet the mechanical requirements even with a porosity defect inducing a weakening factor . As explained before, this result could be used for concessions, but it is still too early to conclude on a general case.
3.3.3 VBA program The calculations conducted for the case study have been executed a consequent number of time (for several parts, several areas and several defect size). In order to optimize the process, a VBA program prototype was developed to automatically solve the equations and plot the curves, after choosing a material, a stress and temperature load and weakening factors.
It was also possible to access the weakening factors provided by the Material department, by selecting a defect type (porosity, inclusion and recrystallized grain), a size and a mechanical criterion (LCF/HCF or creep).
margin
Interpolated curve Temperature 1 Temperature 2
T1 < 850°C < T2
Figure 62 Goodman curve: HCF criterion

64
Chapter 4: Technological test
The task was to suggest a compromise between the existing testing systems (see Figure 63):
- Engine tests: the parts are submitted to very similar stress levels, deformations and temperatures to flight conditions. However, such tests are very expensive, very long and cannot be leaded until failure of the parts.
- Sample testing: the samples cut out from parts are submitted to mechanical testing. It allows characterizing the material behavior, but testing conditions are poorly representative of in-use conditions. Moreover, samples are most of the time not taken from the blade region of the part (too thin and too much curvature).
The general idea was to investigate whether it was possible or not, by choosing a type of test, a part and testing conditions, to create a feasible assembly which would provided realistic results compared to in-flight conditions. With such a test, it would be possible to describe more precisely the impact of a casting defect on the part’s fatigue life: compared to sample testing, this would allow testing a complete part, with more sophisticated loading levels, but would still permit to work until failure, unlike engine tests.
A part of the Master Thesis work was dedicated to this project, the objective being to propose a proof of concept on a particular case.
The logical reasoning was as follow:
- Identify a target engine: Parts from several engines are easily accessible. However, the biggest potential of cost reduction lies with the LEAP and its rising production. For this reason efforts were focused on this engine.
In-use representativity
Cost
Sample testing
Engine test
Technological test
Figure 63 Technological test interest: a compromise between engine and sample testing

65
- Identify a part:
For geometrical reasons mainly, low pressure blades seemed to be the most adapted parts. Due to their shroud and root geometry, it seemed more probable to find a way to embed them at both sides and to apply a mechanical load. Furthermore, it is almost impossible to machine out samples in such thin and curved parts: a technological test on such parts could therefore provide beneficial insights on the airfoil behavior regarding casting defects.
- Identify an area in the part:
The root and the shroud being embed within the assembly, it is uneasy to extract usable data. It is also possible to extract samples in the angel wings, reducing the interest of a technological test for these areas. For these reasons, only the airfoil was studied.
- Identify a test and its assembly: The testing machine constraints impose to do simple tests among traction, twisting, bending or a simple combination of these tests.
Thus, the proof of concept was conducted on the first low pressure blade of the LEAP engine. The first low pressure blade being the most critical one, it was chosen since its results could then be extended to the other (less critical) blades.
Focus was then spent on testing simulations, the objective being to answer the following questions:
How could a complex stress field be represented by a simple test assembly, and allow to measure the impact of casting defects?
How could a part with complex geometry be integrated in a test assembly?
Turbine blades
Easy to embed, sample extraction almost
impossible in the airfoil
Too big to be placed in a testing oven, loss of representativity if
separation of the blades
No gain in comparison to the classical approach of
sample extraction
Seal segments Turbine vanes
Figure 64 Part comparison for a technological test

66
Work hypotheses For feasibility reasons, the complexity of the test needed to be limited. For this purpose, simplification hypothesis were made:
Temperature:
- The temperature field is constant during the whole test. - The temperature field is uniform. - Values are taken from the Take-Off phase.
These hypotheses do not represent in-flight conditions. However, by setting a constant and uniform temperature calculated from the Take-Off phase, this would allow representing at least the most critical state of the engine. A temperature gradient and a cooling system could have been added to the assembly, but for high temperature (~1000°C) and the type of oven available, it would have been unwieldy and caused a loss of results precision and reliability.
Mechanical load:
- Only simple tests as traction, twisting and bending can be implemented. - Only positive stress ratios are examined: no compression. - Values are estimated from the Take-Off phase.
The main issue regarding the stress field is the incapability to reproduce during the test the pressure applied by the gas on the part’s surfaces. In real flight conditions, 2 loading systems are present: a
positive stress filed due to the centrifugal force, and a compression field due to the gas.
In-use stress field analysis First was analyzed the in-use stress field and the influence of the different loadings: the centrifugal force and the aerodynamic forces. The high stresses areas highlighted by the simulations are different when we isolate one or another load, but the orders of magnitude are the same. One load cannot be neglected compared to another: it is only the combination of the centrifugal force and the aerodynamic forces that can lead to the in-use stress field. A suitable example is the leading edge: the stress levels are high in the middle of the leading edge, but more present in the lower-part for aerodynamic forces, and the upper-part for centrifugal force.
Stress field with aerodynamic forces only
Airfoil stress field during Take-Off
Stress field with centrifugal force only
Figure 65 Stress field analysis of the blade airfoil during Take-Off (concave side)
LE TE
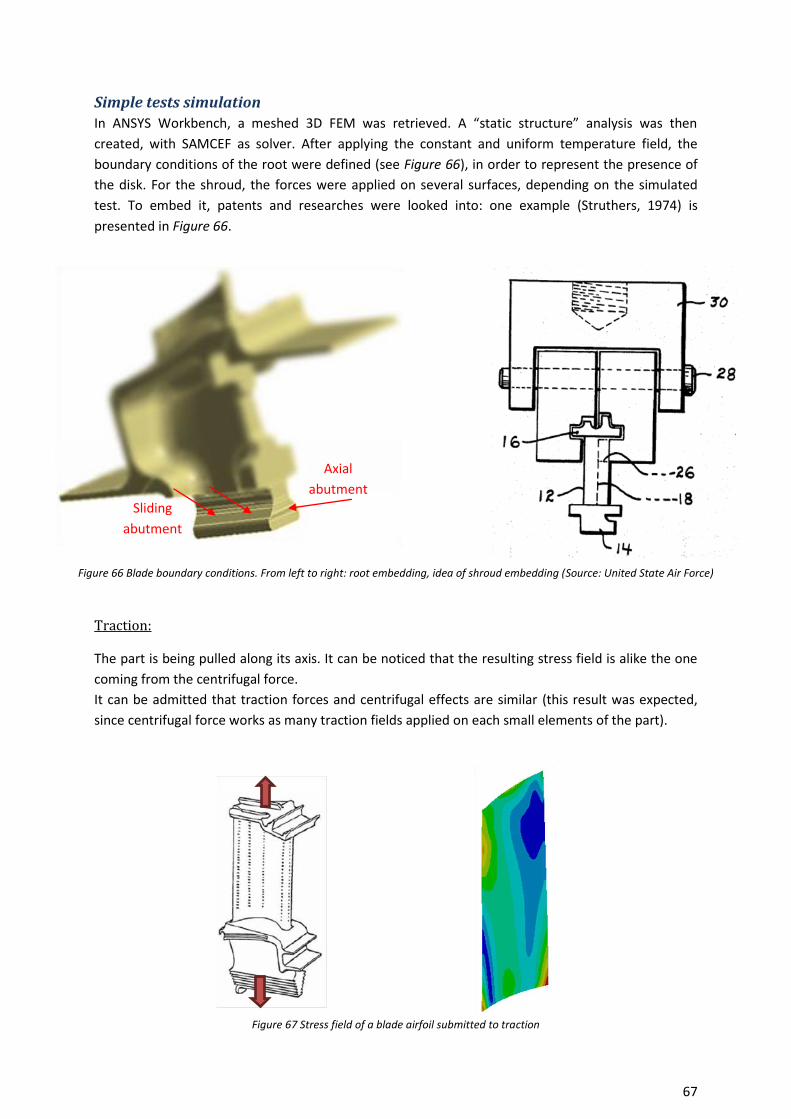
67
Simple tests simulation In ANSYS Workbench, a meshed 3D FEM was retrieved. A “static structure” analysis was then
created, with SAMCEF as solver. After applying the constant and uniform temperature field, the boundary conditions of the root were defined (see Figure 66), in order to represent the presence of the disk. For the shroud, the forces were applied on several surfaces, depending on the simulated test. To embed it, patents and researches were looked into: one example (Struthers, 1974) is presented in Figure 66.
Traction:
The part is being pulled along its axis. It can be noticed that the resulting stress field is alike the one coming from the centrifugal force. It can be admitted that traction forces and centrifugal effects are similar (this result was expected, since centrifugal force works as many traction fields applied on each small elements of the part).
Figure 67 Stress field of a blade airfoil submitted to traction
Axial abutment
Sliding abutment
Figure 66 Blade boundary conditions. From left to right: root embedding, idea of shroud embedding (Source: United State Air Force)

68
Bending test:
The part is being bended with a simple span. The resulting stress field is close to the one coming from the aerodynamic forces. Fluid forces are mostly perpendicular to the blade axis. The similarity between the two stress fields is understandable.
Twisting test:
The part is being twisted along its axis. The resulting stress field is alike none of the previous stress field studied. Therefore, the interest for this test is minor compared to the previous ones.
Figure 68 Stress field of a blade airfoil submitted to flexion
Figure 69 Stress field of a blade airfoil submitted to twisting

69
According to these results, a combination of these tests was suggested to try reproducing the in-flight stress field. The best solution computed was compared to the take-off stress field: results are presented Figure 70. Even though the general behavior is present, the simulated stress field is still far from the in-flight conditions. It seems complicated to reproduce under simple conditions an in-use representative stress field. Nevertheless, such testing can be used to submit casting defects occurring in the blade to mechanical loading. The results of such technological tests cannot be transmitted to an in-flight fatigue life: if a casting defect lasts cycles of a technological test, we cannot conclude that this same defect would have last flight cycles. However, the results of technological tests with casting defects can be compared to technological tests on healthy parts, and enrich the knowledge of casting defect fatigue life harmfulness. This could also be a way to test until rupture parts that had been previously assembled on engine tests.
Due to timing constraints, a testing assembly could not be fully designed and machined, therefore no experimental results were obtained.
Airfoil stress field during Take-Off
Airfoil stress field on technological test
Figure 70 Comparison between the in-flight stress field and the technological test (combination of simple tests)
70
Chapter 5: Test campaigns
This section was conducted in collaboration with Sébastien BLAS, another Master Thesis trainee, and the Material department. Therefore, only the main features will be presented.
The objective was, through material test campaigns, to refine the knowledge on how casting defects behave under specific mechanical loadings. The precision and the reliability of the results are directly linked to the number of experimental points and their dispersion. Thus, conducting test campaigns allows increasing the amount of experimental data, giving more weight to the results.
The first step was to gather enough raw material (casting defects) for the test campaigns. Then, the tests themselves needed to be defined, and finally, solutions on how to adequately interpret the results were looked into.
5.1 Sample elaboration
5.1.1 Scrap overview The occurrence of defect is random, and therefore very difficult to reproduce. The most straightforward way to gather a batch of samples is to collect scrap parts containing out of standard defects, within the production. For proximity reasons, it was only possible to examine the internal production of the Gennevilliers plant.
Unfortunately, only the defects located in massive regions of the part are exploitable: for testing constraints, the samples need to have certain dimensions. Thus, many scrap parts were unusable due to the location of the defect. Most of the selected parts were low pressure vanes, seal segment, and casting gates (channels or runners that connect the different parts and devices of the casting system). Due to their complex geometry and slimness, blades are unfortunately most of the time useless: it is not worthwhile to extract a sample.
In the first few months, it was managed to collect a few batch of defects located in massive regions of scrap parts:
- Inclusions in seal segments in AM1 - Inclusions in seal segments in MAR-M 509 - Microshrinkages in low pressure vanes in René125 - Microshrinkages in casting gates in IN718 - Recrystallized grains on traction samples

71
5.1.2 Sample extraction One of the main constraints when extracting a defect is the minimum size of the sample that needs to be machined out of the part. Besides, in order to obtain reliable results during the tests, the defect must as much as possible be centered in the sample, increasing the complexity of the task.
For these reasons, the positioning of the sample in the defective part must be optimized, which implies obtaining a very precise characterization of the defect (location, geometry, size, depth …). To
attain this precision, quality control reports (FPI, X-Ray) were looked into. However, many of the selected defective parts had to be put through non-destructive controls again (tomography and FPI).
With the information gathered, samples could then be machined out from the parts. Figure 71 presents an example of sample positioning after tomography analysis of the defect:
As we can see in Figure 71, the defect is not always fully present in the sample. In order to verify the results of the machining and define the defect as it is in the sample, tomography and FPI were once again conducted (see Figure 72).
Figure 71 Tomographic views of microshrinkages in a low pressure vane platform and the sample cutting are
Top view Lateral view
Figure 72 Tomography view of an inclusion in a sample

72
5.2 Testing campaigns
5.2.1 3 points bending test Apart from the recrystallized grains and their traction samples, the other campaigns were conducted with a 3 points bending test. This type of test had already been used for casting defects, and provided satisfying results.
One of the main advantages of bending tests is the small and easy shape of the samples that can be used. However, a drawback of such a test is the relatively low force applied on samples. The minimum applicable force is limited by the testing machine: the force amplitude has to be within the resolution of the sensors.
The following analytical formula gives the relation between force and surface stress in a 3-point bending test:
(38)
With the sample width, its depth and the length between supports.
The width is fixed by the assembly (10mm for the existing assembly), and the length and force are limited by the machine and the furnace. Therefore, the main option to apply relatively low stresses is to increase the depth, unfortunately the available depth is limited by the original part thickness that is often not greater than a few millimeters.
To allow greater leeway, a new assembly with a 20mm-width was developed. It was first designed in CATIA V5, and then the functional dimensioning was established for machining. The technical drawing of the assembly is presented in annex (Figure 79), and Figure 73 pictures the assembly in its context.
Bending sample
Figure 73 3 points bending assembly

73
Another drawback of 3-point bending tests is the non-uniformity of the stress levels. The stress gradient is constant in depth direction but non-null in length direction. FEM simulation shows the stress field ().
These gradients imply a thorough analysis of the results, the location of the defects in the sample being of primary importance.
5.2.2 Results At this point of the Master Thesis, only a few samples had been tested: no final conclusions regarding the impact of casting defects could be elaborated.
Failure surface analyses were however conducted on the first samples (healthy ones and a few with defects).
For instance, Figure 75 and Figure 76 show the crack initiation distribution on healthy bending samples.
Figure 74 Stress field σ_xx of a 3-point bending test
Figure 75 Failure surface of a bending sample
Tensile face Initiation site
Figure 76 Main crack initiation site of a bending sample

74
Figure 77 and Figure 78 present the failure surface analysis of an AM1 traction sample, tested during the recrystallized grain campaign:
While waiting for the results, several leads, on how to interpret the results, were looked into and compared with the first experimental results.
Total failure area
Crack propagation area
Initiating defect
Figure 78 Failure surface - Zoom on the crack initiation site revealing the crack propagation area and the total failure area
Figure 77 Photo of a traction sample failure surface
75
Conclusion
Tolerancing the casting defects more accurately is in the heart of today’s production issues. Due to
very high unit-costs of the turbine parts, lowering the scrap rates is of primary interest. In order to be
able to rethink the tolerances regarding the acceptable sizes of the defects, data has to be retrieved
on how casting defects evolve under damaging loadings, and how they affect the thermo-mechanical
properties of the parts.
A first lever is the use of the test engine feedbacks. Defective parts have been assembled on real
engines and submitted to damaging test cycles. The recovery and the analysis of the test data could
bring great insights on how casting defects behave under thermo-mechanical conditions close to the
in-flight ones.
However, after assessing the feedbacks data, it appeared that the conclusions were not as
straightforward as hoped. First, there was no mean to directly establish whether a defect has an
impact on the fatigue life or the creep tolerance of a part. An intermediary step, to evaluate the
defects behavior through weakening factors, had to be conducted. Then, in order to truly make use
of the test engines, some studies should be conducted prior to the tests to more precisely
characterize the defects, and follow their evolution more precisely through post-test expertise.
Another way to improve the understanding of casting defects is through mechanical testing
campaigns. By conducting lab experiments on defective samples, the amount of data available
increases and therefore leads to a refining of the weakening ratios provided by the Material
Department. However, this is long-term improvements, due to the time-constraints of testing
campaigns.
Even though it is still too early to rigorously use the feedbacks on test engines and test campaigns to
rapidly optimize casting defects tolerances, it is still very useful to treat concessions or help design
other test engines. Moreover, the concept of technological tests could help fill the gaps, and provide
even more information on the casting defects.
These studies allowed understanding the challenges and the cost-reduction paths at stake. New ideas
and concepts were discovered, opening exciting opportunities for the future.

76
Figures
Figure 1 Overview of SAFRAN Group sites .............................................................................................. 9 Figure 2 SAFRAN Group turnover distribution ........................................................................................ 9 Figure 3 SAFRAN remarkable figures ..................................................................................................... 10 Figure 4 SAFRAN Group civil engines .................................................................................................... 11 Figure 5 SAFRAN Group military engines .............................................................................................. 12 Figure 6 SAFRAN Group space engines ................................................................................................. 12 Figure 7 Aerial view of Gennevilliers plant ............................................................................................ 13 Figure 8 Turbojet scheme ...................................................................................................................... 14 Figure 9 High Bypass ratio engine ......................................................................................................... 15 Figure 10 Chemical composition of a typical nickel based super-alloy: IN718 (M. Zielinska, 2011) ..... 15 Figure 11 Typical 0.2% elastic limit versus temperature curve for a nickel based alloy ....................... 16 Figure 12 Nickel based alloy microstructure after heat treatments .................................................... 17 Figure 13 Blade cooling techniques ....................................................................................................... 17 Figure 14 Different scales of matter. From left to right: macroscopic scale or grain scale, dendrite scale, γ/γ’ phases scale, atomic scale. ................................................................................................... 18 Figure 15 One dendrite ......................................................................................................................... 18 Figure 16 Different metallurgical structures. From left to right: equiaxed, directionally solidified, single crystal. ......................................................................................................................................... 19 Figure 17 Creep loading on 3 different structures. From left to right: equiaxed structure showing failure at grain boundary, directionally solidified structure and single crystal having a better resistance to creep. ............................................................................................................................... 19 Figure 18 Schematic illustration of the lost wax process (Source: courtesy of steel founders Society of America) ................................................................................................................................................ 20 Figure 19 Grains formation ................................................................................................................... 21 Figure 20 Inclusion at the surface of a blade root................................................................................. 22 Figure 21 Shrinkage formation principle ............................................................................................... 22 Figure 22 Dendritic growth resulting in microshrinkage ....................................................................... 23 Figure 23 Example of microshrinkage ................................................................................................... 23 Figure 24 Example of a 3mm surface crack ........................................................................................... 23 Figure 25 Penetrant inspection technique ............................................................................................ 25 Figure 26 Turbine blade main parts ...................................................................................................... 26 Figure 27 Road map ............................................................................................................................... 28 Figure 28 Distribution of 3 types of defects .......................................................................................... 30 Figure 29 Extract of some production statistics .................................................................................... 31 Figure 30 Extract of some grain statistics .............................................................................................. 31 Figure 31 Casting defects ranking for the study .................................................................................... 32 Figure 32 Data retrieval protocol .......................................................................................................... 33 Figure 33 Defect type distribution of 2 test engines ............................................................................. 33 Figure 34 Defect type distribution for the studied test engines (among certification and endurance tests) ...................................................................................................................................................... 34 Figure 35 Departments interaction process .......................................................................................... 35

77
Figure 36 Stress concentration scheme ................................................................................................ 37 Figure 37 A circular hole in a plate under traction ................................................................................ 38 Figure 38 Analytical stress field around the hole .......................................................................... 39 Figure 39 Elliptical notch ....................................................................................................................... 39 Figure 40 FEM simulation for a cylindrical defect near the surface of a bending test ......................... 40 Figure 41 Wöhler curve of a healthy part (solid line) and defectuous part (dotted line) ..................... 41 Figure 42 Paris curve ............................................................................................................................. 42 Figure 43 Kitagawa diagram .................................................................................................................. 43 Figure 44 Example of shrinkages and methods applied ........................................................................ 43 Figure 45 Example of a post-engine test report of a porosity (on the left), and a mapping of inclusions (on the right) ......................................................................................................................................... 45 Figure 46 Characteristic graph of a test engine cycle............................................................................ 46 Figure 47 Comparison between a test cycle and a flight cycle ............................................................. 47 Figure 48 Wöhler curve – retrieval of the defect stress thanks to the number of cycles ................................................................................................................................................ 49 Figure 49 Wöhler curve LCF: .................................................................................. 51 Figure 50 Wöhler curve LCF: .................................................................................. 51 Figure 51 Failure load versus temperature curves for 4 nickel based alloys (material points and trend curves) ................................................................................................................................................... 52 Figure 52 Report and mapping of the ASTM4 porosity defect ............................................................. 53 Figure 53 Comparison between the airfoil temperatures of 4 different models ................................. 54 Figure 54 3D Post-treatment analysis, stress and temperature levels recovery .................................. 55 Figure 55 Characteristic graphs of cycles A and B ................................................................................. 55 Figure 56 Wöhler curve LCF: retrieval of ...................................................................................... 56 Figure 57 Wöhler curve extrapolation method (at a given temperature) ............................................ 60 Figure 58 Goodman curves interpolation methode .............................................................................. 61 Figure 59 3D Post-treatment of a shroud ............................................................................................. 61 Figure 60 Re0.2 versus temperature curve: preliminary criterion ........................................................ 62 Figure 61 Wöhler curve: LCF criterion ................................................................................................... 62 Figure 62 Goodman curve: HCF criterion .............................................................................................. 63 Figure 63 Technological test interest: a compromise between engine and sample testing ................. 64 Figure 64 Part comparison for a technological test .............................................................................. 65 Figure 65 Stress field analysis of the blade airfoil during Take-Off (concave side) ............................... 66 Figure 66 Blade boundary conditions. From left to right: root embedding, idea of shroud embedding (Source: United State Air Force) ............................................................................................................ 67 Figure 67 Stress field of a blade airfoil submitted to traction ............................................................... 67 Figure 68 Stress field of a blade airfoil submitted to flexion ................................................................ 68 Figure 69 Stress field of a blade airfoil submitted to twisting .............................................................. 68 Figure 70 Comparison between the in-flight stress field and the technological test (combination of simple tests) .......................................................................................................................................... 69 Figure 71 Tomographic views of microshrinkages in a low pressure vane platform and the sample cutting are ............................................................................................................................................. 71 Figure 72 Tomography view of an inclusion in a sample ...................................................................... 71 Figure 73 3 points bending assembly .................................................................................................... 72 Figure 74 Stress field σ_xx of a 3-point bending test ............................................................................ 73

78
Figure 75 Failure surface of a bending sample ...................................................................................... 73 Figure 76 Main crack initiation site of a bending sample ..................................................................... 73 Figure 77 Photo of a traction sample failure surface ............................................................................ 74 Figure 78 Failure surface - Zoom on the crack initiation site revealing the crack propagation area and the total failure area .............................................................................................................................. 74 Figure 79 Technical drawing - 3 points bending assembly .................................................................... 81
References
Avalle M. [et al.] Casting defects and fatigue strength of a die cast aluminium alloy: a comparison between standard specimens and production components [Article] // International Journal of Fatigue. - 2002. - 1-9 : Vol. 24.
Bickard A. Endommagement, sous sollicitations thermiques et mécaniques, d'une protection d'aluminiure de nickel et d'une barrière thermique, déposés sur un superalliage monocristal [Book]. - Paris : ENSMP CDM, 1998. - Vol. 1 : p. 443.
Bowmer T. Method and Apparatus for Cooling a Member such, for example, as a Turbine Blade of a Gas Turbine Engine. [Patent] : 861632. - GB, 1961.
Caron P. Superalliages pour aubes monocristallines : historique du développement et propriétés // Séminaire "Superalliages mono et polycristallins pour applications aéronautiques". - Evry : Centre des Matériaux ENSMP, December 2004.
Chevenard P. and Couveinhes P. Annales des Mines. - Paris : [s.n.], 1960.
Collini L. [et al.] Influence of casting defects on fatigue crack initiation and fatigue limit of ductile cast iron [Article] // Procedia. Engng.. - 2011. - 2898–2903 : Vol. 10.
Davidson J.H. [et al.] Alliage monocristallin à matrice base de nickel. [Patent] : 2557598. - FR, 1985.
De-Feng M. [et al.] Crack initiation and propagation of cast A356 aluminium alloy under multi-axial cyclic loadings [Article] // International Journal of Fatigue. - 2008. - 1843–1850 : Vol. 30.
Doriath J. C. Fonderie de précision à modèle perdu [Article] // Techniques de l'ingenieur. - 2007. - M3580 : Vol. 1.
Eylon D. and Strope B. Fatigue crack initiation in Ti-6wt% Al-4wt% V castings [Article] // Journal of Material Science. - 1979. - 345–353 : Vol. 14.
Filippini M. [et al.] Defect tolerance of gamma titanium aluminide alloy. [Article] // Procedia. Engng.. - 2001. - 3677–3682 : Vol. 10.

79
François D., Pineau, A., and Zaoui, A. Comportement mécanique des matériaux. [Book]. - (1993). - Vols. Volume 2 : viscoplasticité, endommagement, rupture. Hermès..
González R. [et al.] Fatigue of an aluminium cast alloy used in the manufacture of automotive engine blocks. [Article] // International Journal of Fatigue. - 2013. - 118–126 : Vol. 56.
Jinkeun O., Nack J.K. and Lee S. High-cycle fatigue properties of investment cast Ti-6Al-4V alloy welds [Article] // Journal of Material Science. - 2001. - 2183–2187 : Vol. 20.
Kitagawa H. Takahashi S. Applicability of fracture mechanics to very small cracks in the early stage. [Article] // International Conference on Mechanical Behaviour of Materials. - 1976. - 627–631.
Koutiri I. [et al.] High cycle fatigue damage mechanisms in cast aluminium subject to complex loads [Article] // International Journal of Fatigue. - 2013. - 44-57 : Vol. 47.
Kunz L. [et al.] Casting defects and high temperature fatigue life of IN 713LC superalloy [Article] // The superalloys, fundamentals and applications. - Cambridge : Cambridge University Press, 2006. - 33-120, 121-216.
Léopold G. [et al.] Influence of artificial and casting defects on fatigue strength of moulded components in Ti-6Al-4V alloy [Article] // Fatigue & Fracture of Engineering Materials & Structures. - 2015. - 1026-1041 : Vol. 38.
M. Zielinska J. Sieniawski, M. Yavorska, M. Motyka Influence of chemical composition of nickel based superalloy on the formation of aluminide coating [Article] // Archives of metallurgy and materials. - 2011. - 1 : Vol. 56.
Mua P. [et al.] Influence of casting defects on the fatigue behavior of cast aluminum AS7G06-T6 [Article] // International Journal of Fatigue. - 2014. - 97-109 : Vol. 63.
Mughrabi H. Microstructural aspects of high temperature deformation of monocrystalline nickel base superalloys: some open problems [Article] // Materials Science and Technology. - 2009. - 191-204 : Vol. 25.
Murakami Y. Effects of small defects and nonmetallic inclusions on the fatigue strength of metals. [Article] // JSME international journal. Ser. 1, Solid mechanics, strength of materials. - 1989. - 167-180 : Vol. 32.
Murakami Y. Endo T. Effects of small defects on fatigue strength of metals. [Article] // International Journal of Fatigue. - 1980. - 23-30 : Vol. 2.
Paris P. and Erdogan F. A critical analysis of crack propagation laws [Article] // Journal of Basic Engineering, Transactions of the American Society of Mechanical Engineers. - 1963. - 528-534.
Peterson R. E. Stress concentration factors [Book]. - New York : Wiley, 1974.
Roy M. J. Nadot Y., Nadot-Martin C., Bardinand P.-G., Maijer D. M. [Article] // International Journal of Fatigue.. - 2011. - 823-832 : Vol. 33.

80
Serrano-Munoz I. [et al.] Influence of surface and internal casting defects on the fatigue behaviour of A357-T6 cast aluminium alloy. [Article] // International Journal of Fatigue. - 2016. - 361-370 : Vol. 82.
Sims C. T. A history of superalloy metallurgy for superalloy metallurgists. [Article] // Superalloys 1984. - 1984. - 399-419.
Struthers John O. Fixture for tensile and stress rupture testing of turbine blades [Brevet]. - United State of America, Washington, D.C., 9 April 1974.
Zhang B. [et al.] Influence of recrystallization on high-temperature stress rupture property and fracture behavior of single crystal superalloy. [Article] // Materials Science and Engineering. - 2012. - 149-153 : Vol. 551.
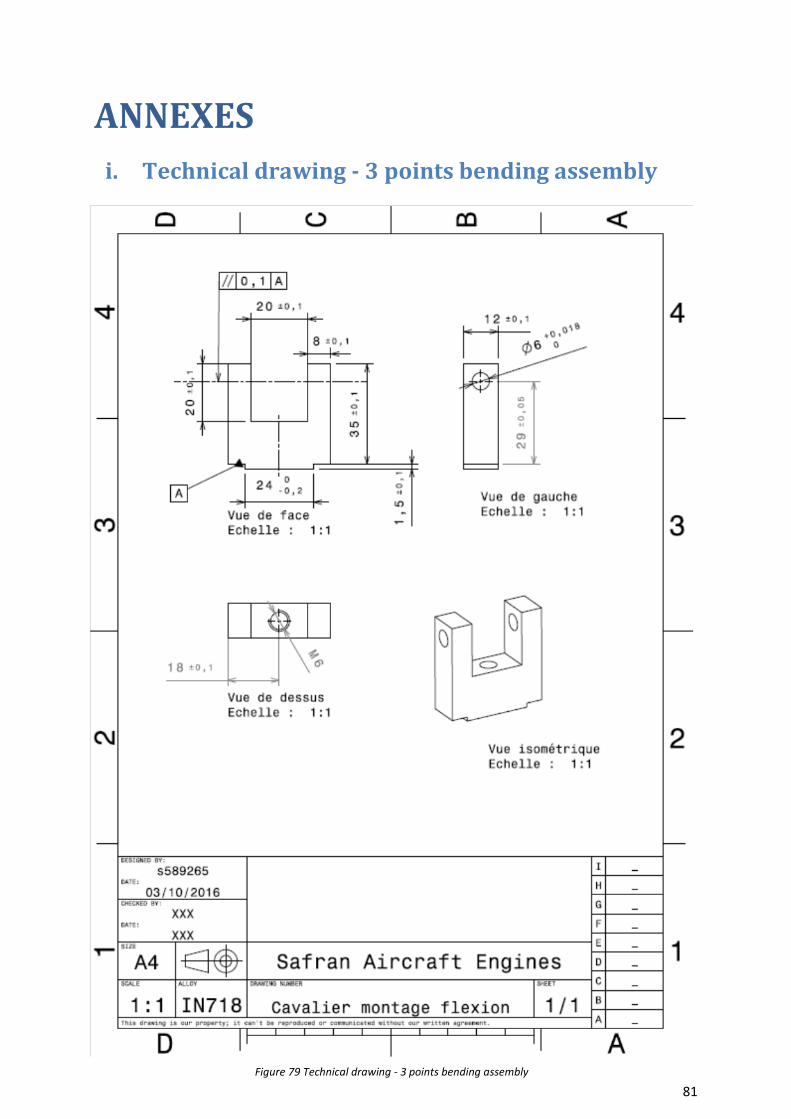
81
ANNEXES i. Technical drawing - 3 points bending assembly
Figure 79 Technical drawing - 3 points bending assembly

www.kth.se