Embed Size (px)
Citation preview

Castability Control in Metal Casting via Fluidity Measures: Application of Error
Analysis to Variations in Fluidity Testing
by
Brian Albert Dewhirst
A Dissertation
Submitted to the Faculty
of the
WORCESTER POLYTECHNIC INSTITUTE
in partial fulfillment of the requirements for the
Degree of Doctor of Philosophy
in
Materials Science and Engineering
December 2008
APPROVED by:
_______________________________
Diran Apelian, Howmet Professor of Mechanical Engineering, Advisor
_______________________________
Richard D. Sisson, Jr., George F. Fuller Professor, Materials Science and
Engineering Program Head

ii
ABSTRACT
Tautologically, castability is a critical requirement in any casting process. The two
most important factors impacting castability are the susceptibility of a metal to
hot tearing and the degree of casting fluidity a material possesses. This work
concerns itself with fluidity of molten metal. Since experimental investigations
into casting fluidity began, researchers have sought to maximize fluidity through
superheat, mold temperature, alloy chemistry, melt cleanliness, and mold design.
Researchers who have examined the published results in the field have remarked
on the difficulty of making quantitative comparisons and drawing conclusions
from the data. Ragone developed a horizontal vacuum fluidity apparatus and an
analytical expression for fluid length to help resolve these issues. This was
expanded on by Flemings et al. Still, the comparison of results is complicated by
experimental uncertainties and a plurality of experimental procedures. This work
seeks to resolve these issues through an analysis of experimental uncertainties
present in existing fluidity tests and the development of an improved test and
procedure which is very precise, accurate, and reliable. Certain existing tests and
software packages have been shown to be unsuitable for quantitative fluidity
measurement. Expressions for experimental uncertainty in fluidity testing have
been derived. The capability to predict variations in fluidity as a function of alloy
chemistry and other variables whose range of values are intrinsic to the
economics of the process will help to more accurately determine the superheat
needed for successful castings and will in turn lead to a decrease in scrap rates.
This will enable metal casters to more reliably cast thin sections, and to reduce
cycle time or scrap rate to achieve productivity goals. Superheat was shown to
remain the dominant factor in fluidity, but the test allowed investigation of alloy
modifications within an alloy specification in this alloy system. Factors known to
have negative effects on structural properties were found often to have neutral
or positive impacts on fluidity. A deep understanding of variations in fluidity
measurements is the next necessary step in a century-long quest to understand
how best to make metal castings through the use of fluidity experiments.

iii
ACKNOWLEDGEMENTS
First, I would like to thank the ACRC Consortium members who‘ve helped to fund
this work, especially the ACRC focus group and its co-chairs Ray Donahue and
John Jorstad, for their support and guidance which help to insure that academic
work retains its intended relevance to industry. Prof. Apelian, my advisor, has
likewise been a constant source of guidance and inspiration, as have the other
members of my committee, Prof. Sisson, Prof. Makhlouf, Prof. Liang, and Dr.
Major. I also would like to thank the support staff at WPI, who‘ve been a great
help to me. In particular, our department secretary Rita Shilansky, and Maureen
Plunkett, Carol Garofoli, and the rest of the MPI Staff have helped me throughout
my time at WPI and MPI. The Gordon Library staff and HAAS Center machine
shop staff have also contributed greatly to the quality of this work as well. Profs.
Furlong, Gennert, Iannacchione, Ludwig, Petruccelli, and Dr. Shu have all been
generous with their time in providing advice and assistance within their
respective fields. Deepika Gaddam and Matt Proske and Dr. Kim and Ken
Siersma were of great help with MAGMA and CAPCAST respectively. My
officemates, Shimin Li and Kimon Symeonidis, have always been there to discuss
my work and to offer assistance, and I wish them and the rest of the many
graduate students I‘ve interacted with the best of luck in their future endeavors.
Finally, I would like to thank my parents for their love and guidance throughout
my life and Carolyn Lachance, my wife, for her love, support, and
encouragement.
“IF WE LONG FOR OUR PLANET TO BE IMPORTANT, THERE IS SOMETHING WE CAN DO
ABOUT IT. WE MAKE OUR WORLD SIGNIFICANT BY THE COURAGE OF OUR QUESTIONS
AND BY THE DEPTH OF OUR ANSWERS.”
COSMOS 1980 CARL SAGAN

TABLE OF CONTENTS
1.0 Introduction 4
2.0 Literature Review 7
2.1 History of Fluidity Tests 7
2.1.1 Rheological Definition of Fluidity 8
2.1.2 Metal Casting Definition of Fluidity 8
2.2 Methods of Analysis 9
2.2.1 Linear Mold Casting 10
2.2.1.1 Sand Spiral 10
2.2.1.2 Horizontal Suction 11
2.2.1.3 Vertical Suction 13
2.2.1.4 Permanent Mold Tests 13
2.2.1.5 Die Casting Meander Dies 14
2.2.2 Fins, Plates and Blades 15
2.2.3 Other Tests 15
2.2.4 Modeling and Pure Theory 16
2.3 Existing Body of Knowledge 17
2.3.1 Theory of Casting Length 17
2.3.2 The Impact of Alloy Composition on Solidification 20
Mechanisms
2.3.3 Superheat Effects 21
2.3.4 Mold Surface Treatment 22
2.4 Theory of Error Analysis 22
2.4.1 Gage Repeatability and Reliability and 23
Measurement Systems Variability
2.4.2 Formal Statistical Analysis of Variations 24
2.5 Commercial Importance of Fluidity 25
2.6 Area for Original Work 26
2.7 Importance of this Work 27
2
3.0 Methodology 29
3.1 Uncertainty Calculations 33
3.2 Development of Experimental Apparatus 33
3.2.1 Preliminary Analyses 34
3.2.2 Development of an Improved Apparatus 38
3.3 Measurement Systems Variability (MSV) 42
3.4 Further Refinements and the Demonstration of Linear Superheat 44
3.4.1 Confirmation of Improvements by Baseline Comparison 45
3.5 Application of Apparatus to Variables of Interest 45
3.5.1 Si Level Adjustment 46
3.5.2 Fe and Mn Addition 47
3.5.3 Pure Aluminum Testing 47
3.5.4 Grain Refinement 48
3.5.5 Eutectic Modification (Sr) 48
3.5.6 Artificial Introduction of Oxides 48
3.5.7 Degassing 49
3.6 Predictive Modeling 50
4.0 Results & Discussion 52
4.1 Uncertainty Calculations 52
4.1.1 Error in Metal-Mold Interface Dominated Case 53
4.1.2 Error in Mold Resistance Dominated Case 54
4.2 Development of Experimental Apparatus 55
4.2.1 Preliminary Analyses 56
4.3 Measurement Systems Variability (MSV) 57
4.4 Further Refinements and the Demonstration of Linear Superheat 63
4.4.1 Confirmation of Improvements by Baseline Comparison 66
4.5 Application of Apparatus to Variables of Interest 68
4.5.1 Si Level Adjustment 68
4.5.2 Fe and Mn Addition 72
4.5.3 Pure Aluminum Testing 73
3
4.5.4 Grain Refinement 74
4.5.5 Eutectic Modification (Sr) 75
4.5.6 Artificial Introduction of Oxides 76
4.5.7 Degassing 78
4.6 Predictive Modeling 78
5.0 Conclusions 82
5.1 Recommendations for future work 84
6.0 References 85
Appendices 91
Appendix A: Fluidity Testing Data 92
Appendix B: Consortium Survey and Results 109
Appendix C: Castability Measures for Diecasting Alloys: Fluidity, Hot Tearing,
and Die Soldering 113
Appendix D: Flemings‘ Equation Derivations 127
Appendix E: Pumping Calculations 131
Appendix F: Calibration Nomogram 135
Appendix G: Microstructure Schematic 138
Appendix H: Phase 1 Procedures 140
Appendix I: Phase 2 Procedure 146
Appendix J: Phase 3 Procedure 150

4
1 INTRODUCTION:
At the surface, the question ―what is fluidity‖ to a metallurgist is a relatively
simple question. Having said that, the necessary caveat ‗to a metallurgist‘ has
already revealed one problem. Physicists define fluidity to be the inverse of
viscosity. Metallurgists, on the other hand, refer to the ability of a molten metal
to flow and fill a channel or cavity as fluidity. This is most often measured by the
length metal can flow through a given mold before freezing. A definition of
casting fluidity is presented below, but the ‗why‘ of fluidity is as important as the
‗what.‘
The answer to the question ‗why is fluidity important‘ is highly dependent on who
is asking. There are at least three:
To a foundry worker, the answer is ―because it is useful.‖ Fluidity refers to
an important property of cast alloys. The more fluid an alloy is, the more
easily it should be able to fill a given cavity. As the response of fluidity
with increasing superheat is known to be linear, fluidity directly relates to
the amount of superheat needed to fill a given cavity.
Theorists express interest in the impacts and causes of changes in fluidity,
principally as it relates to the study of solidification and interdendritic
metal flow. However, variations in precision and accuracy of fluidity
measurements make correlating data between experimenters problematic.
The majority of fluidity investigations in the last 25 years have focused on
maximizing fluidity with respect to precise alloy chemistry. The influence
of minor alloy additions is often slight when compared with that of
superheat, head pressure, or melt cleanliness.
A third answer, one which might satisfy an ambitious experimentalist, is
that there are believed to be significant problems with the repeatability
and precision of fluidity measurements. Surmounting these challenges so
that more accurate and repeatable measurements of fluidity can be
5
conducted would be an important contribution in the area of
experimentation, and given the interest in fluidity from both theorists and
industrialists, these accomplishments would receive praise beyond the
scope of just the experimentalist community.
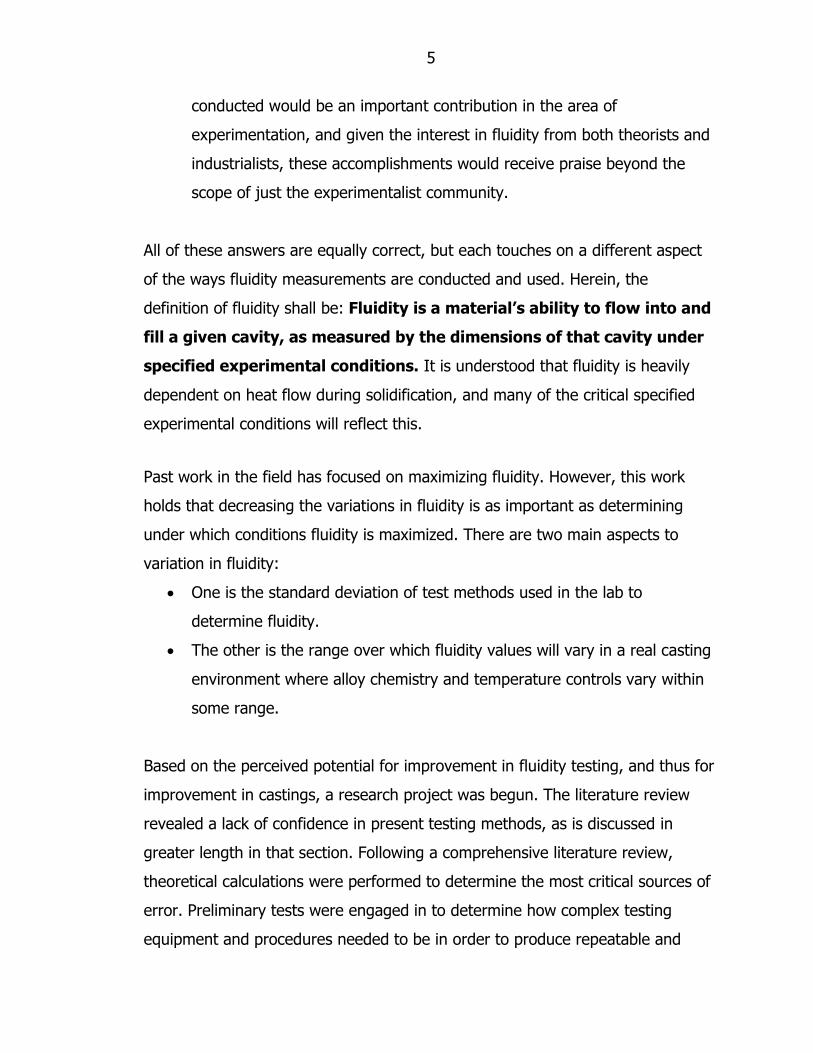
All of these answers are equally correct, but each touches on a different aspect
of the ways fluidity measurements are conducted and used. Herein, the
definition of fluidity shall be: Fluidity is a material’s ability to flow into and
fill a given cavity, as measured by the dimensions of that cavity under
specified experimental conditions. It is understood that fluidity is heavily
dependent on heat flow during solidification, and many of the critical specified
experimental conditions will reflect this.
Past work in the field has focused on maximizing fluidity. However, this work
holds that decreasing the variations in fluidity is as important as determining
under which conditions fluidity is maximized. There are two main aspects to
variation in fluidity:
One is the standard deviation of test methods used in the lab to
determine fluidity.
The other is the range over which fluidity values will vary in a real casting
environment where alloy chemistry and temperature controls vary within
some range.
Based on the perceived potential for improvement in fluidity testing, and thus for
improvement in castings, a research project was begun. The literature review
revealed a lack of confidence in present testing methods, as is discussed in
greater length in that section. Following a comprehensive literature review,
theoretical calculations were performed to determine the most critical sources of
error. Preliminary tests were engaged in to determine how complex testing
equipment and procedures needed to be in order to produce repeatable and

6
reliable results and statistical tools were used to evaluate repeatability. These
results, along with the results of an informal industrial survey, helped to further
define the problem. An existing testing apparatus was located and refurbished,
and a new procedure was generated for it. Successive testing with well-
understood phenomena, such as superheat, as well as other questions of interest
allowed for further refinement of the apparatus and procedure. Attempts to
model the rapid filling of thin sections during these sorts of tests have revealed
that present commercial casting modeling software is no substitute for lab
foundry testing. These successive steps are detailed in the rest of this
dissertation.
The experimental techniques described here are most appropriate for cases
where cooling is dominated by heat transfer during rapid solidification, as
opposed to cases where solidification is slower and dominated by the mold heat
conductivity. A dissertation on an improved mold-dominated sand spiral test has
recently been completed by a colleague [1], while theoretical calculations for
both cases are presented in this work.
The likely benefits of this work are threefold: A robust and reliable testing
apparatus and methodology will allow for comparisons between groups working
in different parts of the world, confidence in fluidity testing will improve, and
metal casters will be able to use the derived theoretical error equations and
testing methodologies to more closely fine-tune their processes to optimize scrap
rates, superheat, and alloy chemistry. More consistent fluidity should lead to
more consistent castings.

7
2 LITERATURE REVIEW:
2.1) History of Fluidity Tests
Since the earliest spiral castings of aluminum by Saito and Hayaschi in 1919 [2],
simple one-dimensional castings of metals have been conducted to determine
how well a given metal can fill a cavity. Their innovation was an improvement on
earlier techniques where metal was poured in a straight line, but where the
grade and temperature might not be equal—sand spirals insured uniform
levelness and temperature. Refinements on this technique by Ragone et al. in
1956 [2, 3], along with analytical solutions for pure metals, were a great leap
forward in the understanding of fluid length. Ragone‘s technique, employing
borosilicate glass tubes to directly observe metal velocity, and vacuum to draw
the melt into a horizontal channel, reduced experimental error as compared with
spiral castings. The work was expanded by M.C. Flemings et al. [4-7] to include
multi-phase alloy systems. Key to this development were micrographic
investigations that led to conclusions regarding the solidification mechanisms at
work. In brief, the flow of mostly-pure alloys stops by the growth of columnar
grains near the entrance of the mold, while flow in multi-component systems is
brought to a halt by nucleation of grains, often equiaxed dendrites, which halt
flow near the tip after nucleating earlier in the casting and coarsening as they
flow, to the point of flow stoppage once a critical fraction solid is reached.
With this work as a foundation, investigations into the impact of foundry
variables such as mold coatings, alloying additions, head pressure, and especially
superheat have been investigated and correlated with mechanisms. Specific
investigations are often alloy or metal/mold/coating specific in scope, but subtle
influences of minor variations in alloy purity can be detected with careful
application of fluidity testing. Some metal systems present special challenges.
Magnesium, for example, must be tested in vacuum or under a protective cover
8
gas. Variants on the existing testing devices have been devised which take these
requirements into account [8-13].
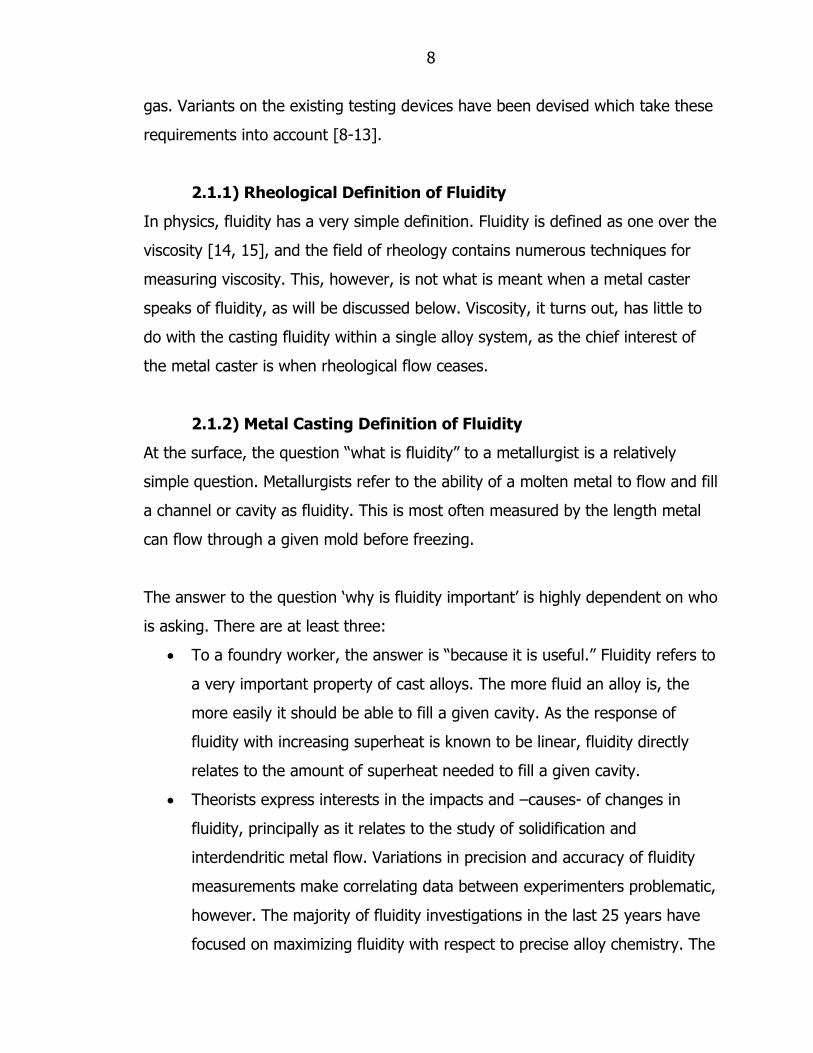
2.1.1) Rheological Definition of Fluidity
In physics, fluidity has a very simple definition. Fluidity is defined as one over the
viscosity [14, 15], and the field of rheology contains numerous techniques for
measuring viscosity. This, however, is not what is meant when a metal caster
speaks of fluidity, as will be discussed below. Viscosity, it turns out, has little to
do with the casting fluidity within a single alloy system, as the chief interest of
the metal caster is when rheological flow ceases.
2.1.2) Metal Casting Definition of Fluidity
At the surface, the question ―what is fluidity‖ to a metallurgist is a relatively
simple question. Metallurgists refer to the ability of a molten metal to flow and fill
a channel or cavity as fluidity. This is most often measured by the length metal
can flow through a given mold before freezing.
The answer to the question ‗why is fluidity important‘ is highly dependent on who
is asking. There are at least three:
To a foundry worker, the answer is ―because it is useful.‖ Fluidity refers to
a very important property of cast alloys. The more fluid an alloy is, the
more easily it should be able to fill a given cavity. As the response of
fluidity with increasing superheat is known to be linear, fluidity directly
relates to the amount of superheat needed to fill a given cavity.
Theorists express interests in the impacts and –causes- of changes in
fluidity, principally as it relates to the study of solidification and
interdendritic metal flow. Variations in precision and accuracy of fluidity
measurements make correlating data between experimenters problematic,
however. The majority of fluidity investigations in the last 25 years have
focused on maximizing fluidity with respect to precise alloy chemistry. The
9
influence of minor alloy additions, however, is often slight when compared
with that of superheat, head pressure, or (in some alloy systems) melt
cleanliness.
A third answer, one which might satisfy an ambitious experimentalist, is
that there are believed to be significant problems with the repeatability
and precision of fluidity measurements. Surmounting these challenges so
that more accurate and repeatable measurements of fluidity can be
conducted would be an important contribution in the area of
experimentation, and given the interest in fluidity by both theorists and
industrialists, these accomplishments would receive praise beyond the
scope of just the experimentalist community.
All answers are equally correct, but each touches on a different aspect of the
ways fluidity measurements are conducted and used. Herein, the definition of
fluidity shall be: Fluidity is a material’s ability to flow into and fill a given
cavity, as measured by the dimensions of that cavity under specified
experimental conditions. It should be noted that one of the most critical of
those experimental conditions is heat flow during solidification.
2.2) Methods of Analysis
Most experimentation on fluidity is conducted in one of three ways. Metal is
poured into a spiral mold or otherwise cast into a cavity or cavities having long
thin sections, extracted from a heated crucible by vacuum, or extruded from a
die casting machine into a tortuous die. In each case, it is the length which is
reported and specific parameters (superheat, mold material, mold coating, mold
temperature, other experimental conditions) must be precisely determined and
controlled for equivalent results. Even within one experiment (for example, two
experimenters at different labs working with the same alloy and following what
they believe to be the same procedure) results vary widely although qualitative
trends are comparable. In all three cases, microstructural examination of the
10
cross section, especially near the end of the casting, is used to examine how
solidification mechanisms ‗choked off‘ the flow. Often, in alloy development work
for example, it is unclear which fluidity test should be performed. Experimenters
frequently report the results of both a sand spiral and a Ragone-style vacuum
suction apparatus or fin casting [13, 16-19], and since this covers a wide range
of solidification conditions it is a good general procedure for an alloy intended for
a variety of solidification conditions. An alloy which is only expected to be cast in
die castings should be tested in a die casting fluidity die or Ragone glass tube
test, and an alloy intended only for sand casting ought to be tested in a sand
spiral test. Even so, there are many, many ways to conduct a particular test.
Indicating that it was ―a sand spiral‖ or ―Ragone-type test‖ is not sufficiently
precise.
2.2.1) Linear Mold Casting
The vast majority of fluidity tests involve a controlled flow of metal of known
composition and superheat into a channel of known temperature and constant
and known dimensions. Subsequent to solidification, the length of the resulting
sample is measured and reported as the fluidity of the metal in question [5, 16].
2.2.1.1) Sand Spiral
Spiral testing employs a simple concept to fluidity testing, but when all of the
details required for precise and repeatable experimentation are considered, the
final product is a great deal more complex. Liquid metal whose fluidity is to be
determined is poured into a cylinder which terminates in a long thin cavity. The
walls of this cavity might be sand or coated metal, heated or unheated, but the
idea is that the fluidity is equal to the length of the final casting which is
produced. The mold is coiled into a spiral so that the experimental setup does
not take up an excessively large amount of space[5, 16]. An advantage of this
process is that through selection of the mold material, the test is correlated with
the specific casting procedure of interest, eg. sand casting for a sand spiral.

11
Compared to its predecessor, a long linear sand mold along a foundry floor, the
spiral also takes up less room, is more likely to be level over its entire length,
and is more uniform in temperature.
Predating Ragone and Flemings et al.‘s [2-7] clarification of the solidification
mechanisms through the use of clear tubes and vacuum suction, early work was
performed by Kondic in 1950 [20], with sand spirals and mixed results. Other
experimenters [21, 22] refer to the theoretical work of Flemings et al. [4], but
conduct sand spiral tests rather than the vacuum tests on which Flemings‘ work
was based. Although Ragone did not make use of sand spirals in his research, his
work with vacuum suction was in part an attempt to overcome certain
experimental difficulties in working with sand spirals [2, 3]. Flemings and
Campbell both present diagrams of sand spirals in their discussions of fluidity [5,
16].
A common variation on the single sand spiral is the dual-spiral test [23],
although some experimenters have encountered problems with ensuring equal
pressure head, mold temperature, etc. to both spirals [24]. Although not spiral in
geometry, the serpentine test is similar to the spiral test in most critical respects
[25].
Much of Di Sabatino‘s work was done with refining sand spiral fluidity testing [1,
24, 26-28]. Di Sabatino compares sand spiral results to those of a commercial
thin strip (N-Tec) mold [27], and finds that they have qualitatively similar
results. Her work built on previous work by Dahle et al. [29].
2.2.1.2) Horizontal Suction
In the vacuum crucible method, metal is brought to a desired temperature in a
crucible. Melt is then extracted by a vacuum pump through a glass tube, and the
final length of the metal is reported as the fluidity. In the traditional Ragone

12
setup [2-7], some portion of the melt was drawn against gravity due to a curve
in the tube. Ragone‘s initial procedure involved using a wax plug to seal the tip
of his vacuum-filled tube, but subsequent experimenters modified the procedure
not to use this feature. Ragone also made use of a high-speed camera to
monitor the metal filling the tube, and he observed that the melt velocity was
nearly constant until the very end (when flow stops). Subsequent experimenters
did not make use of a camera, but it was an important procedural detail of the
initial work by Ragone, and one of the reasons his glass tubes were an
improvement on existing procedures. Ragone worked with pure metals, but later
experimenters in the same laboratory worked with alloys, and met with
unexpected difficulties [6]. It was discovered that commercial levels of alloy
additions change the solidification mechanism such that flow stops at the tip,
rather than the entrance neck. Horizontal fluidity testers were used in the
investigation of the solidification mechanisms and microstructures [5]. The final
‗crossing of t‘s and dotting of i's‘ of this theory was Flemings‘ British Foundryman
paper [4].
A diagram of Ragone‘s horizontal vacuum setup can be found in both
Flemings[5] and Campbell [16]. Researchers in fluidity who never use Ragone‘s
setup still sometimes provide diagrams of it to accompany discussions of fluidity
equations [29].
Figure 2.2.1.2.A Schematically depicting sand spiral and horizontal vacuum
testing. [5]

13
2.2.1.3) Vertical Suction
Comparable experimental procedures to Ragone‘s exist which draw the metal
vertically. These tests often cite the Ragone procedure without explicitly noting
the difference in their experimental construction, so that in an experiment with
no diagram, it is often unclear whether a vertical or horizontal vacuum suction
test was performed [10], [30]. According to White [15], velocity will be constant
in both vertical and horizontal suction tests until the forces of gravity and
pressure begin to equalize. Given the freezing lengths of fluidity tests, this point
is not reached during testing.
Vertical suction tests have been performed using different tube materials and
different bore sizes, which confirm the theoretical predictions of Flemings et al.
discussed in Section 2.3.1 with respect to heat transfer coefficient and mold
dimensions [31], [32].
Similar vertical tests in borosilicate glass have been performed with liquid metal
and SSM metal poured into a vertical tube with a funnel and without vacuum
[33], [34].
2.2.1.4) Permanent Mold Tests
Heated permanent molds with confined geometries, such as cast iron molds in a
spiral shape, are also used for fluidity testing. Heating the mold slows the cooling
rate and insures uniform temperature. In many respects these are similar to
sand molds, but the different materials allow for somewhat different geometries,
such as the N-Tec mold.
The N-Tec mold is a variation on the idea of a permanent mold spiral test.
Instead of pouring into a spiral of fixed cross section, metal feeds into five
‗fingers‘ of varied cross section. The fluidity reported from this experiment is the

14
sum of the lengths in the five fingers. This procedure conflates the cavity
parameters with the fluidity of the metal. If the goal of the experiment was only
to investigate the impact of cavity thickness on a given melt, this might be valid,
but the N-Tec mold is intended to be a general test for fluidity measurements
[27, 35, 36].
Researchers investigating the impact of grain refiners and oxide inclusions in Al-
Cu alloys made use of a permanent mold setup with integrated removable
stopper and thermocouple. It seems from their diagrams that there will be
thermal variations between the central and edge fingers [37, 38]. Such design
complications appear to be common in permanent mold fluidity designs.
Permanent mold metal finger tests can easily be modified for magnesium testing,
because steel is a preferred mold material for magnesium casting. One example
incorporated eight radial spokes from a central filling well, as well as appropriate
protective cover gas equipment [8]. Other groups present similar solutions to the
same problem [13].
A discussion of the repeatability of the N-Tec mold is included in Section 4.3.
2.2.1.5) Die Casting Meander Dies
Fluidity measurement in die casting is generally conducted by injecting metal into
a tortuous cavity in a standard die casting machine, and the length of the final
casting is the measure of fluidity. Although results may vary widely between this
procedure and the permanent mold and vertical vacuum techniques discussed
above, it is similar in many ways. Procedural differences in surface coating, mold
temperature, cavity diameter, etc. have a profound impact on the resulting fluid
length [17].

15
An important paper in die casting fluidity indicated that, unlike in permanent
mold, sand castings etc., solidification range is unimportant for die casting fluid
length [39]. The most immediate consequence of this work is that laboratory
tests of the type discussed in the rest of this thesis do not apply in the high
pressure, short time environment of a die casting machine. An exception would
be when Ragone-type testers are used to evaluate pure metal which is to be
diecast in a fluidity-critical die [40, 41].
2.2.2) Fins, Plates and Blades
Fluidity tests in two and three dimensional molds, principally in casting fins,
plates, and blades have also been conducted. Kondic [42] encouraged such work
for educational purposes in metal casting education. These tests have also been
used with other alloy systems. Wrought alloy manufacturers, such as those
working with Al-Zn-Mg-Cu alloys, and aerospace turbine blade manufacturers
developing investment nickel superalloy fins have also employed these
techniques [43, 44]. Magnesium work toward high-temperature resistant Mg
alloys which also must be fluid must take into account the reactability of the
material in the mold design, further outlining the similarity between this
technique and the linear casting techniques, as both must be adapted in similar
ways [45]. In work on the impact of oxides on three dimensional thin walled
castings, Campbell evaluated the fluidity of plates and boxes [46].
2.2.3) Other Tests
Some fluidity research involves novel approaches which are not easily covered by
this analysis. This observation is not to impugn the methods of these authors,
but merely to note that their work does not neatly fit into one of the categories
already discussed. Often, it seems that these tests are not measuring the same
things as the above tests, and are instead a form of rheometry. Other tests are
modifications of existing test methods for unusual alloy circumstances [9].

16
Exotic tests include forcing semisolid metal through a packed bed of beads [47],
novel simultaneous measurements of viscosity, density, and surface tension [48],
use of thin section fluidity tests to measure defects in zinc with a mind towards
controlling die soldering [41], and assessment of melt cleanliness via a porous
filter [49]. In addition to a standard sand spiral test, Ware investigated casting
elbows, cylindrical castings, Tatur molds, etc. [50]. Frequently, these papers are
investigating rheological fluidity rather than casting fluidity [14].
2.2.4) Modeling and Pure Theory
Though finite element modeling is a recent development, treatments of the
fluidity of metals on the basis of theory are quite old. Some have attempted to
make predictions of fluidity purely on the basis of thermodynamic phase diagram
analysis [51]. Similarly, Chikov discusses the impact on fluidity of adding any
arbitrary transition metal to aluminum [52]. Work in this vein date back to 1936,
where Portevin discussed ternary alloy casting theory and gave some sand spiral
examples [53].
While not the focus of this thesis, since there is activity in this area to model
fluidity tests as a test of the casting/ solidification software programs, it bears
mention [54]. Work in this area began quite early in finite element modeling,
though early codes were of necessity much simpler as a consequence of limited
computer resources [55]. Simulation of sand spirals is one example [56]. Often,
this work is more concerned with the modeling and pure math involved than with
the physical system being represented [57]. Recently, efforts have been made to
improve the modeling capability of thin sections, which would seem to relate
closely to fluidity testing, as this is another technique used to evaluate casting of
thin sections [58].

17
2.3) Existing Body of Knowledge
Fluidity has seen great advances since Ragone‘s 1956 doctoral thesis, thanks in
large part to his work in developing the vacuum testing apparatus, which
Flemings et al. built upon [2-7]. Key points are discussed below.
2.3.1) Theory of Casting Length
Over a period of 8 years, Flemings and collaborators produced the fluidity
equations and outlined the solidification mechanisms which are at work in linear
castings during standard fluidity tests, for pure alloys as well as commercially
pure and commercially alloyed compositions. The most common reference source
for these is Flemings‘ Solidification Processing, which references the other
research papers [2-7].
The fluidity equation from Flemings [5] for metal with some superheat T and a
mold which conducts heat rapidly is:
)(**2
)'*)(**(
om
s
TTh
TcHvapL
eqn. 1
Ragone demonstrated that the influence of viscosity or a change in viscosity on
casting fluidity is minimal, and while the equations he presented did include a
viscosity term, subsequent formulations correctly dropped it as insignificant as
compared with other sources of experimental error [2].
Flemings, Niyama, and Taylor [6] presented a more complex formulation:
)2
1(*)(**
)*)(**(
r
f
TThS
TcHkvALf eqn. 2a
where vk
Xh
'
***
eqn. 2b
where,
Lf Final length, fluidity
18
a channel radius
A mold surface area (proportional to roughness)
S circumference of mold channel
X choking range
c specific heat of metal
(T-Tr) liquid metal temperature minus room temperature
T the time average melt temp in the fluidity test, approximately equal to
)'(2
1TTm
To room temperature
h heat transfer coefficient at mold-metal interface
Tm metal melting temperature
T superheat
k thermal conductivity of mold material
density of metal
v velocity of metal flow
Hf Heat of fusion of metal
T‘ temperature of superheated metal entering flow channel
critical solid concentration required to stop flow in ‗mushy‘ alloys
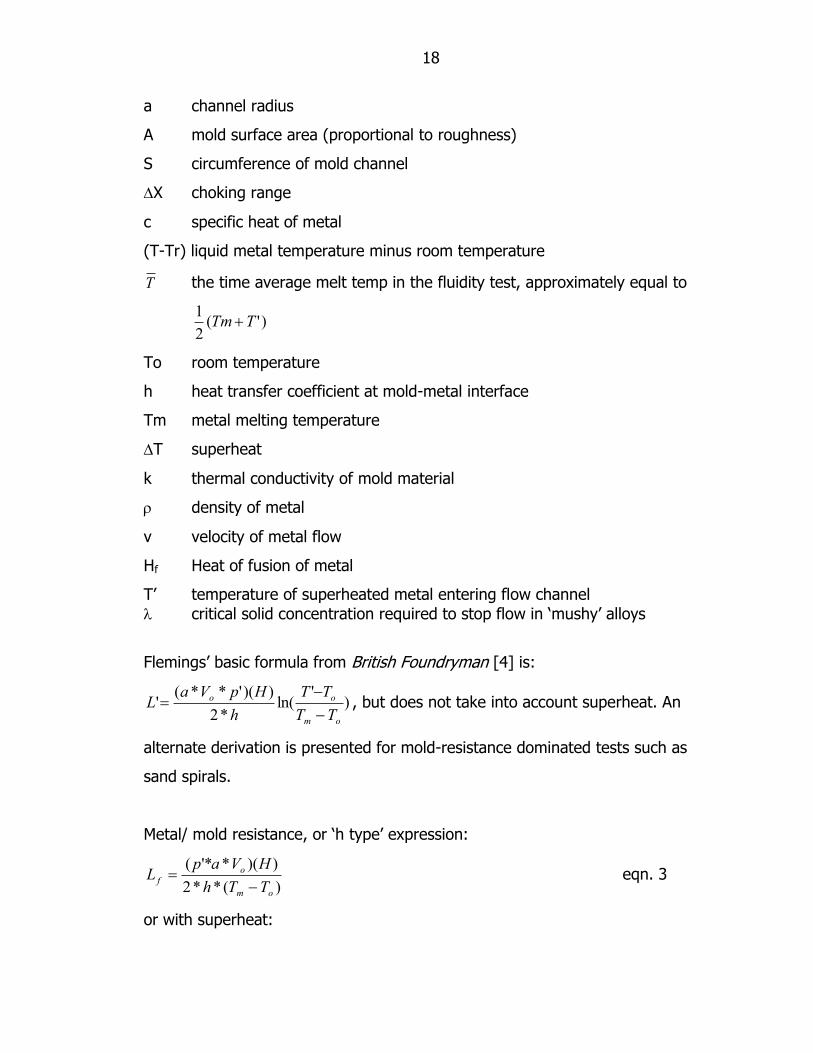
Flemings‘ basic formula from British Foundryman [4] is:
)'
ln(*2
))('**('
om
oo
TT
TT
h
HpVaL
, but does not take into account superheat. An
alternate derivation is presented for mold-resistance dominated tests such as
sand spirals.
Metal/ mold resistance, or ‗h type‘ expression:
)(**2
))(*'*(
om
of
TTh
HVapL
eqn. 3
or with superheat:
19
)(**2
)'*)(*'*(
o
of
TTh
TcHVapL
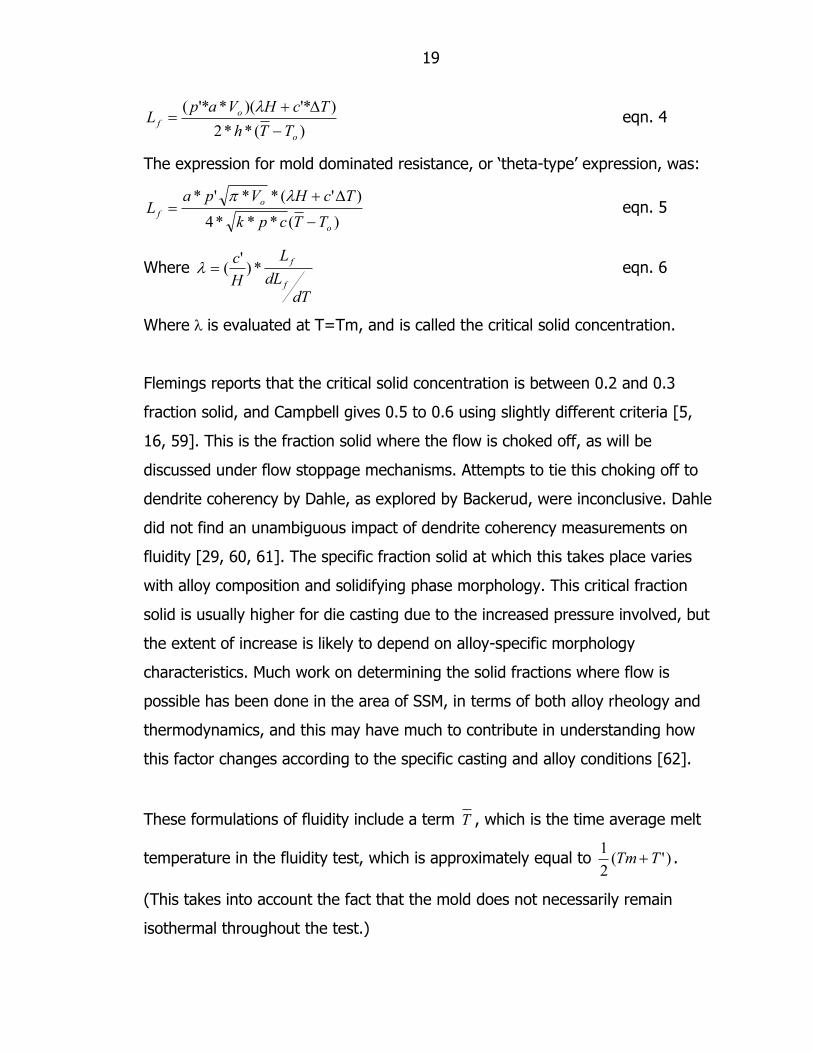
eqn. 4
The expression for mold dominated resistance, or ‗theta-type‘ expression, was:
)(***4
)'(**'*
o
o
fTTcpk
TcHVpaL
eqn. 5
Where
dT
dL
L
H
c
f
f*)
'( eqn. 6
Where is evaluated at T=Tm, and is called the critical solid concentration.
Flemings reports that the critical solid concentration is between 0.2 and 0.3
fraction solid, and Campbell gives 0.5 to 0.6 using slightly different criteria [5,
16, 59]. This is the fraction solid where the flow is choked off, as will be
discussed under flow stoppage mechanisms. Attempts to tie this choking off to
dendrite coherency by Dahle, as explored by Backerud, were inconclusive. Dahle
did not find an unambiguous impact of dendrite coherency measurements on
fluidity [29, 60, 61]. The specific fraction solid at which this takes place varies
with alloy composition and solidifying phase morphology. This critical fraction
solid is usually higher for die casting due to the increased pressure involved, but
the extent of increase is likely to depend on alloy-specific morphology
characteristics. Much work on determining the solid fractions where flow is
possible has been done in the area of SSM, in terms of both alloy rheology and
thermodynamics, and this may have much to contribute in understanding how
this factor changes according to the specific casting and alloy conditions [62].
These formulations of fluidity include a term T , which is the time average melt
temperature in the fluidity test, which is approximately equal to )'(2
1TTm .
(This takes into account the fact that the mold does not necessarily remain
isothermal throughout the test.)

20
In Campbell‘s Casting [16], he gives the following equations for fluidity in mold
and metal-mold interface dominated cases.
Sand: mVkm
Lf** eqn. 7
Die: h
Vk
m
Lf '* eqn. 8
Where:
k = a constant
m= casting modulus (Volume/Area)
V= velocity
This is a simplified form of Flemings‘ formulations, which were discussed above.
Campbell cites the paper by Niesse, Flemings et al. [7]. He also discusses the
impact of surface tension in filling narrow channels, which can impact filling and
fluidity through narrow channels [16].
2.3.2) The Impact of Alloy Composition on Solidification
Mechanisms
Ragone‘s initial work was on pure metals, and he found that flow stops as a
result of the growth of columnar grains near the point where metal first flows
into the channel. Small alloy additions, as occur in commercially pure materials,
display the same behavior with a reduction in fluidity. Eutectic alloys also behave
in much the same manner. Commercial alloys containing more significant alloying
additions cease flowing not as a result of columnar grain formation, but from the
the nucleation of equiaxed primary grains at that same point near the beginning
of the channel which subsequently flow down to the tip. When the fraction solid
of these primary grains crosses some critical threshold, metal flow is blocked [2-
7].

21
Although increasing alloy additions typically reduce fluidity, there are some
important exceptions. Additions of silicon to aluminum increase the fluidity for
two reasons. First, the high heat of fusion of silicon prolongs metal flow. Second,
in the case of hypereutectic silicon, the morphology of primary silicon and
requisite undercooling result in prolonged metal flow [1, 17, 18, 24, 25, 30, 33,
35, 47, 56, 63-65].
Though a great deal of research has been done to determine the impact of minor
alloy additions, with some papers reporting minor increases of fluidity under one
set of conditions and other researchers reporting minor decreases in fluidity
under slightly different conditions, the aggregate impact of these small changes
in composition to overall fluidity is minor [1-7, 17, 18, 23, 27, 29, 35, 38, 43, 50,
52, 66-71]. As will be discussed in Section 2.3.3, superheat is a much more
powerful mechanism for increasing fluidity. Similarly to the addition of minor
alloying elements, high hydrogen levels increase porosity but have no great
influence on metal fluidity [26].
2.3.3) Superheat Effects
As can be seen in the equations developed by Flemings et al. (see also Section
2.3.1), and in the research which supports those equations, the response of
fluidity to superheat is linear [2-7]. Mold preheating has a similar effect, as can
be seen by examining the aforementioned equations, and as is shown
experimentally [12]. An apparent exception can be found in magnesium casting,
where increasing temperature also increases the rate of oxidation and so
contributes additional solid material which will choke flow. But before this occurs
a linear response is still seen. Similarly, high superheat temperatures in
aluminum metal matrix composites can also induce a reaction which rapidly
decreases fluidity [72].

22
2.3.4) Mold Surface Treatment
As can be seen in Section 2.3.1, the heat transfer coefficient has a strong
influence on the fluidity of cast metals. This is reflected in research which shows
that by changing mold materials, applying mold coatings, and otherwise
retarding heat flow one may increase fluidity [4, 21, 22, 73-86].
2.4) Theory of Error Analysis
As mentioned previously, while general trends exist, there is a great deal of
quantitative variation between even carefully conducted tests using the same
experimental method. When methodologies vary such as when results from
vacuum suction testing are compared with those from spiral testing, this high
degree of experimental uncertainty is exacerbated.
Much of what these tests measure is process dependent. The results of two
spiral tests, one with a boron nitride coated metal mold and another conducted
with green sand, will show quite different results depending on the interaction of
specific melts with the specific interface. Since wetability of the metal and mold
will vary as a function of alloy chemistry in these two cases, so too will the heat
transfer coefficients. (For an example of how heat transfer coefficients can vary
dramatically within a single experimental apparatus as a function of time, see
Farouk, Apelian, and Kim [76]). As is known from the derived results above (see
Section 2.3.1), this will have a profound impact on the flow length, but this
behavior cannot be generalized, especially if mold coating is not the parameter
under investigation. Heat flow considerations are seldom considered, since, while
there are direct measurements of temperature and length, there are typically no
measurements of the heat transfer coefficients of the molds in question.
Compounding these problems is the fact that, while experimental procedures and
setup are critically important to obtaining self-consistent results, to say nothing
of results reproducible by other researchers, there is not a standard for either

23
experimental design or procedure. There are, instead, a variety of commercial
setups, home-built setups, and a wide range of precision in specifications of
experimental procedures. While there are widely known and reliable sources for
other physical properties, such as tensile strength, there is no such universal
database of quantitative fluidity data. Based on an analysis of Flemings‘
equations, presented above in Section 2.3.1, two standard tests are called for.
One standard vacuum fluidity test and one standard sand spiral test. Work to
improve the sand spiral test has already been performed by Di Sabatino [1].
The consequence of this experimental uncertainty is a general lack of faith in
reports of fluidity measurements. Many researchers feel that fluidity is inherently
unreliable, and if the concept were not so useful it would likely have been
discarded long ago.
Fortunately, statistical tools exist to define how well fluidity is known and what
determines its variation.
2.4.1) Gage Repeatability and Reliability and Measurement
System Variability
The method to be used to establish reproducibility and reliability in the
experimental procedures discussed later in this thesis, measurement systems
variability (MSV), is widely used in industry [87]. MSV is very similar to gage
repeatability and reliability (GR&R), another industrial measurement standard,
but GR&R is only intended for nondestructive tests of nominally identical samples
[88-90]. GR&R could be used to measure the diameter of 10 coins to establish
the accuracy of a micrometer, for instance. MSV might be used to analyze bomb
calorimeters which incinerate small quantities of petroleum that are not
guaranteed to be of equal volume or volatility due to uncertainties in the
chemistry of the fuel and volume dispensed into the apparatus. Terms and
procedures in GR&R and MSV have been defined for ease of implementation by

24
technicians, rather than mathematical rigor, as can be seen by comparing the
definitions from GR&R and MSV with those in a standard statistics text [91-93].
Closer examination of the methodologies of MSV in concert with personal
communications with statisticians suggest that while GR&R has a firm theoretical
basis for the calculations and procedures it prescribes, MSV appears not to. It is
possible this foundation exists, but it was not presented along with the standard
text of procedures [94]. Still, examining the results of multiple people performing
the same test can provide a qualitative guide to the repeatability and accuracy of
a given test.
2.4.2 Formal Statistical Analysis of Variations
When a formula describes a phenomenon, it is possible to describe the variation
of that phenomenon in terms of the variations of its parameters, for example
with the equation below [95].
If: ))...()((
))...()((
wvu
zyxq eqn. 9a
then: 22222 )(...)(...)()()(w
dw
u
du
z
dz
y
dy
x
dx
q
dq eqn. 9b
For nq x
dxn
q
dq* eqn. 10
If: wvuzyxq ...... eqn. 11a
then: 222222 )...()()()...()()( dwdvdudzdydxdq eqn. 11b
where dq is the relative uncertainty (i.e. q_true = q +/- dq).
The above assumes that there are small, random errors, where dx is the error in
x, and so on for the other variables. Although this sort of analysis is common in
physics, no work of this kind has been done with fluidity. Section 4.1 applies
this to Flemings‘ equations, discussed above[4].

25
2.5) Commercial Importance of Fluidity
Numerous advisors to the metal casting industry have written about the
importance of process control in the foundry. Among the tests they advocate
performing are fluidity tests. Fluidity depends on metal which is free from oxides,
on having the proper superheat, and on being within an expected chemistry
range. Consequently, fluidity tests can help to establish the quality of metal
before parts are cast badly and must be scrapped [96-98].
Given the high part numbers involved in die casting, questions of repeatability
are especially important. Fluidity failure can result in increased scrap rates, and
the costs associated with scrap are known to be high in die casting [99, 100].
Thin sections are desirable for a variety of reasons, and can be achieved with
increased mean fluidity, but if that increase comes at the expense of increased
fluidity variation, this will have the undesirable effect of increasing scrap rates.
Often, the factors which can be adjusted to improve fluidity have other impacts
on the casting process, and so a careful tradeoff must be achieved to insure
there is enough fluidity, and a margin of safety, without causing deleterious side
effects. Greater fluidity is often achieved by increasing melt superheat, but as
will be discussed below, this has negative implications for die soldering. Mold
coatings can decrease the heat transfer coefficient, and thus increase fluidity,
but this may have a small negative impact on cycle time. While minor alloy
additions often have little impact on fluidity, the secondary alloy components
(specifically, their heat of fusion and morphology) do contribute to fluidity.
This work to improve the laboratory testing of vacuum fluidity measurements is
largely focused on improving the repeatability of measurements by controlling
the various experimental parameters. After a controlled volume of melt is
collected, a thermocouple is inserted into it. When the metal cools to a pre-set
temperature, it is elevated such that the end of a borosilicate tube is immersed
in the melt, and vacuum is applied. The measurement of that length is then

26
made before the borosilicate tube is removed from the experimental setup, as
the rapid fracturing of the glass and other factors otherwise make it difficult to
determine the ‗zero point.‘ Through repeated measurements under controlled
experimental conditions the reliability of the test was established.
A continuing trend in engineering, including metal casting, is the application of
modeling software to problems of interest. These codes, in the case of casting
intended to predict filling, hot spots, etc., are no more reliable than the data
upon which they are built. It is hoped that increased precision of fluidity testing
will have a positive impact on these modeling codes by allowing direct
comparison of simple geometries between simulation and the laboratory. Since
these codes do not include direct fluidity calculations, accurate experimental
tests of fluidity would seem to be a good independent check.
2.6) Area for Original Work
Much has already been accomplished in the theoretical understanding of fluidity,
but there are still fertile areas for research. All of the above cited fluidity research
has sought to maximize fluidity, but the standard deviation of fluidity is also of
importance. There are two aspects to the standard deviation of fluidity results:
that of the test methods used to determine fluidity, and that occurring in the
industrial casting processes due to variations in alloy chemistry, superheat, mold
coating, etc. In order to investigate and improve the laboratory standard
deviation, methodological improvements are required.
In reviewing the above literature, there was little indication that results were
necessarily comparable between different lab apparatuses, even if they were of
the same nominal type and dimensions. Results can certainly be normalized and
compared qualitatively, but there is great skepticism as to the quantitative nature
of the results. If someone were to establish a standard test, or procedure for
comparing the fidelity of differing tests, this would be of great value to the field.

27
Accompanying this dissertation is Appendix B: ACRC Fluidity Survey. This
survey only reflects practices within the consortium, but as these are leaders in
the field who have taken a progressive view as to the value of pre-competitive
research, trends within the consortium reflect the best of metal casting in
general. This study revealed how fluidity is actually used, and how often, in
industrial light metals casting. The following conclusions were drawn from the
survey:
The majority of consortium members use computer modeling software to
evaluate castability effects, including fluidity. (This software must be
based upon reliable fluidity tests, and does not provide an indication of
the uncertainty of its measurements.)
When fluidity testing is done directly, it is in the context of alloy or
process development.
Ambiguity exists as to what is and is not a ‗fluidity test.‘ Consequently, a
variety of methodologies are used and skepticism of the results of internal
and external tests is high. A standard testing apparatus/procedure would
presumably alleviate these concerns.
2.7) Importance of this work
In increasing order of impact, the expected deliverables of this research are:
Existing experimental methods that determine fluidity will be quantitatively
analyzed
An improved procedure for conducting and discussing fluidity
measurements will be implemented to further communications and
comparisons between different research groups
Validated formulas that highlight the most important factors which affect
variations in fluidity results will be produced
The factors affecting the variation of lab fluidity results also impact the
variation (standard deviation) of the fluidity of actual industrial castings.

28
Through the above, simple calculations will allow anticipation of variations
in foundry practice from a small number of lab tests.
Quantitative predictive ability of the impact of alloy chemistry on the variations in
fluidity in foundry casting (sand casting, permanent mold, etc.) will allow for
process parameter (alloy, superheat, mold composition and coating etc.)
selection not only to maximize fluid length but also to minimize variations in that
length in foundry practice. This, in turn will help to reduce scrap rate. More
consistent fluidity should lead to more consistent castings.

29
3 METHODOLOGY:
This section details the procedures and equipment used to collect data in this
dissertation. Results of these methods are discussed below, in Section 4,
Results and Discussion. Throughout this work appropriate spark testing was
done on coupons prepared according to standard procedures to insure that metal
chemistries were in line with expectations.
Work in this dissertation fell into four categories, but in each phase of work the
dependent variable was fluidity and its variation. (There were additional
dependent variables during MSV testing.)
Phase 1: Preliminary experiments (detailed in Sections 3.2-3.3).
Independent variables included:
o Superheat
o Tube diameter
o Depth of tube
o Crucible/mold temperature
o Testing method (permanent mold versus vertical vacuum)
o Operator variation
Phase 2: Confirmation of a reliable test (detailed in Sections 3.4-
3.4.1).
Independent variables included:
o Superheat
o Date of experiment
Phase 3: Demonstration on variables of interest (detailed in Sections
3.5.1-3.5.7.)
Independent variables included:
o Silicon content
o Iron and Manganese content
30
o Alloy system (binary hypereutectic Al/Si, pure Al, A356.2)
o Grain refinement
o Eutectic modification
o Oxide level
o Degassing level
Phase 4: Computer modeling
Independent variables included Phase 2 variables and, if the models
matched with experimental data, Phase 3 variables as well.
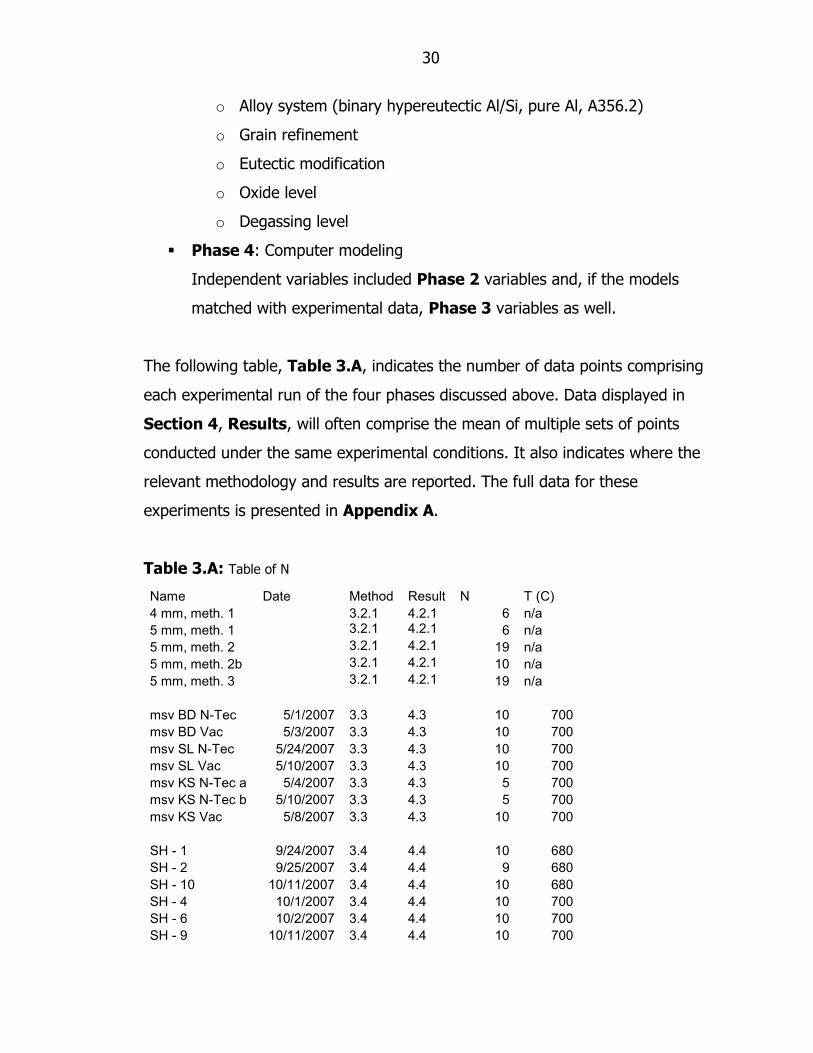
The following table, Table 3.A, indicates the number of data points comprising
each experimental run of the four phases discussed above. Data displayed in
Section 4, Results, will often comprise the mean of multiple sets of points
conducted under the same experimental conditions. It also indicates where the
relevant methodology and results are reported. The full data for these
experiments is presented in Appendix A.
Table 3.A: Table of N
Name Date Method Result N T (C)
4 mm, meth. 1 3.2.1 4.2.1 6 n/a
5 mm, meth. 1 3.2.1 4.2.1 6 n/a
5 mm, meth. 2 3.2.1 4.2.1 19 n/a
5 mm, meth. 2b 3.2.1 4.2.1 10 n/a
5 mm, meth. 3 3.2.1 4.2.1 19 n/a
msv BD N-Tec 5/1/2007 3.3 4.3 10 700
msv BD Vac 5/3/2007 3.3 4.3 10 700
msv SL N-Tec 5/24/2007 3.3 4.3 10 700
msv SL Vac 5/10/2007 3.3 4.3 10 700
msv KS N-Tec a 5/4/2007 3.3 4.3 5 700
msv KS N-Tec b 5/10/2007 3.3 4.3 5 700
msv KS Vac 5/8/2007 3.3 4.3 10 700
SH - 1 9/24/2007 3.4 4.4 10 680
SH - 2 9/25/2007 3.4 4.4 9 680
SH - 10 10/11/2007 3.4 4.4 10 680
SH - 4 10/1/2007 3.4 4.4 10 700
SH - 6 10/2/2007 3.4 4.4 10 700
SH - 9 10/11/2007 3.4 4.4 10 700

31
SH - 3 9/27/2007 3.4 4.4 10 720
SH - 11 11/2/2007 3.4 4.4 10 720
SH - 5 10/1/2007 3.4 4.4 10 740
SH - 7 10/2/2007 3.4 4.4 10 740
SH - 8 10/2/2007 3.4 4.4 10 760
SH - 12 11/2/2007 3.4 4.4 10 760
no degas 1 1/24/2008 3.5.7 4.5.7 15 700
no degas 2 1/25/2008 3.5.7 4.5.7 10 700
no degas 3 1/28/2008 3.5.7 4.5.7 10 700
degas high a 1/22/2008 3.5.7 4.5.7 14 700
degas high b 1/22/2008 3.5.7 4.5.7 15 700
degas high c 1/24/2008 3.5.7 4.5.7 15 700
degas high d 1/24/2008 3.5.7 4.5.7 14 700
degas low a 1/25/2008 3.5.7 4.5.7 10 700
degas low b 1/25/2008 3.5.7 4.5.7 10 700
degas low c 1/28/2008 3.5.7 4.5.7 10 700
degas low d 1/28/2008 3.5.7 4.5.7 10 700
no gr 1 1/29/2008 3.5.4 4.5.4 10 700
gr lv 1 A 1/29/2008 3.5.4 4.5.4 10 700
gr lv 1 B 1/29/2008 3.5.4 4.5.4 10 700
gr lv 1 C 1/29/2008 3.5.4 4.5.4 10 700
gr lv 1 D 1/31/2008 3.5.4 4.5.4 10 700
gr lv 2 A 1/31/2008 3.5.4 4.5.4 10 700
gr lv 2 B 1/31/2008 3.5.4 4.5.4 10 700
gr lv 2 C 1/31/2008 3.5.4 4.5.4 10 700
gr lv 2 D 1/31/2008 3.5.4 4.5.4 10 700
gr lv 2 E 2/4/2008 3.5.4 4.5.4 10 700
gr lv 3 A 2/4/2008 3.5.4 4.5.4 10 700
gr lv 3 B 2/4/2008 3.5.4 4.5.4 10 700
gr lv 3 C 2/4/2008 3.5.4 4.5.4 10 700
gr lv 4 D 2/4/2008 3.5.4 4.5.4 10 700
A356.2 1 2/6/2008 3.5.1 4.5.1 10 700
A356.2 2 2/7/2008 3.5.1 4.5.1 10 700
A356.2 3 3/19/2008 3.5.1 4.5.1 10 700
A356.2 4 3/20/2008 3.5.1 4.5.1 10 700
A356.2 5 3/26/2008 3.5.1 4.5.1 10 700
Si ++ A 2/6/2008 3.5.1 4.5.1 10 700
Si ++ B 2/6/2008 3.5.1 4.5.1 10 700
Si ++ C 2/6/2008 3.5.1 4.5.1 10 700
Si + A 3/19/2008 3.5.1 4.5.1 10 700
Si + B 3/19/2008 3.5.1 4.5.1 10 700
Si + C 3/19/2008 3.5.1 4.5.1 10 700
Si - A 3/26/2008 3.5.1 4.5.1 10 700
Si - B 3/26/2008 3.5.1 4.5.1 10 700
Si - C 3/26/2008 3.5.1 4.5.1 10 700
Si -- A 2/7/2008 3.5.1 4.5.1 10 700
Si -- B 2/7/2008 3.5.1 4.5.1 10 700

32
Si -- C 2/7/2008 3.5.1 4.5.1 10 700
baseline 6/25/2008 3.5.1 4.5.1 15 700
Si addition A 6/25/2008 3.5.1 4.5.1 10 698.5
Si addition B 6/25/2008 3.5.1 4.5.1 10 698.5
Si 'reduction' A 6/25/2008 3.5.1 4.5.1 10 702.5
Si 'reduction' B 6/25/2008 3.5.1 4.5.1 10 702.5
very high Si A 6/18/2008 3.5.1 4.5.1 10 700
very high Si B 6/18/2008 3.5.1 4.5.1 10 700
very high Si C 6/18/2008 3.5.1 4.5.1 9 700
no Sr baseline 1 2/12/2008 3.5.5 4.5.5 10 700
no Sr baseline 2 6/11/2008 3.5.5 4.5.5 10 700
no Sr baseline 3 6/11/2008 3.5.5 4.5.5 10 700
Sr lv 1 A 2/12/2008 3.5.5 4.5.5 10 700
Sr lv 1 B 2/12/2008 3.5.5 4.5.5 10 700
Sr lv 1 C 2/12/2008 3.5.5 4.5.5 10 700
Sr lv 2 A 2/12/2008 3.5.5 4.5.5 10 700
Sr lv 2 B 2/12/2008 3.5.5 4.5.5 10 700
Sr lv 2 C 2/12/2008 3.5.5 4.5.5 10 700
Sr lv 3 A 6/11/2008 3.5.5 4.5.5 10 700
Sr lv 3 B 6/11/2008 3.5.5 4.5.5 10 700
Sr lv 3 C 6/11/2008 3.5.5 4.5.5 10 700
Fe/Mn A356.2 1 3/28/2008 3.5.2 4.5.2 10 700
Fe/Mn A356.2 2 4/4/2008 3.5.2 4.5.2 10 700
low Fe A 28-Mar 3.5.2 4.5.2 10 700
low Fe B 28-Mar 3.5.2 4.5.2 10 700
high Fe A 28-Mar 3.5.2 4.5.2 10 700
high Fe B 31-Mar 3.5.2 4.5.2 10 700
high Fe C 31-Mar 3.5.2 4.5.2 10 700
low Mn A 4/4/2008 3.5.2 4.5.2 13 700
low Mn B 4/4/2008 3.5.2 4.5.2 13 700
low Mn C 4/8/2008 3.5.2 4.5.2 10 700
high Mn A 4/8/2008 3.5.2 4.5.2 15 700
high Mn B 4/8/2008 3.5.2 4.5.2 15 700
high Fe+Mn A 4/1/2008 3.5.2 4.5.2 14 700
high Fe+Mn B 4/1/2008 3.5.2 4.5.2 13 700
oxide A356.2 1 4/11/2008 3.5.6 4.5.6 8 700
oxide lv 1 4/11/2008 3.5.6 4.5.6 10 700
oxide lv 2 A 4/11/2008 3.5.6 4.5.6 10 700
oxide lv 2 B 4/14/2008 3.5.6 4.5.6 10 700
oxide lv 2 C 4/14/2008 3.5.6 4.5.6 10 700
oxide lv 3 A 4/14/2008 3.5.6 4.5.6 10 700
oxide lv 3 B 4/14/2008 3.5.6 4.5.6 10 700
oxide lv 3 C 4/14/2008 3.5.6 4.5.6 10 700
borax A356.2 1 6/12/2008 3.5.6 4.5.6 10 700
borax A356.2 2 6/12/2008 3.5.6 4.5.6 10 700
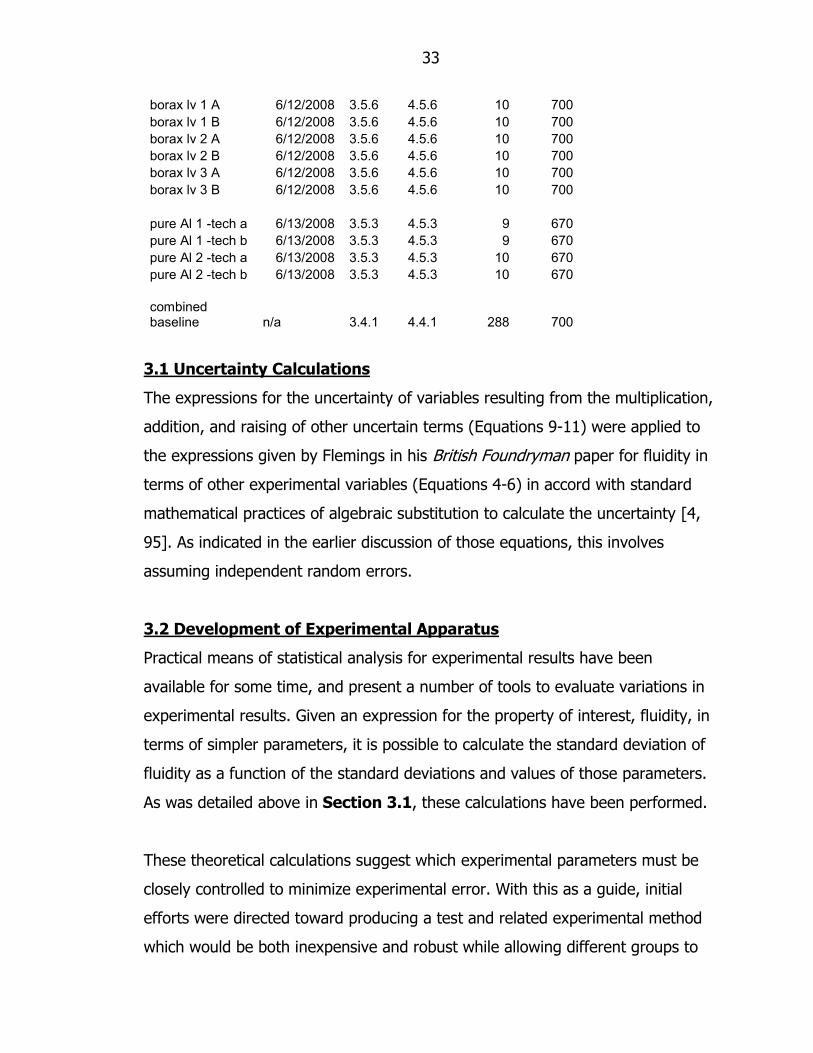
33
borax lv 1 A 6/12/2008 3.5.6 4.5.6 10 700
borax lv 1 B 6/12/2008 3.5.6 4.5.6 10 700
borax lv 2 A 6/12/2008 3.5.6 4.5.6 10 700
borax lv 2 B 6/12/2008 3.5.6 4.5.6 10 700
borax lv 3 A 6/12/2008 3.5.6 4.5.6 10 700
borax lv 3 B 6/12/2008 3.5.6 4.5.6 10 700
pure Al 1 -tech a 6/13/2008 3.5.3 4.5.3 9 670
pure Al 1 -tech b 6/13/2008 3.5.3 4.5.3 9 670
pure Al 2 -tech a 6/13/2008 3.5.3 4.5.3 10 670
pure Al 2 -tech b 6/13/2008 3.5.3 4.5.3 10 670
combined baseline n/a 3.4.1 4.4.1 288 700
3.1 Uncertainty Calculations
The expressions for the uncertainty of variables resulting from the multiplication,
addition, and raising of other uncertain terms (Equations 9-11) were applied to
the expressions given by Flemings in his British Foundryman paper for fluidity in
terms of other experimental variables (Equations 4-6) in accord with standard
mathematical practices of algebraic substitution to calculate the uncertainty [4,
95]. As indicated in the earlier discussion of those equations, this involves
assuming independent random errors.
3.2 Development of Experimental Apparatus
Practical means of statistical analysis for experimental results have been
available for some time, and present a number of tools to evaluate variations in
experimental results. Given an expression for the property of interest, fluidity, in
terms of simpler parameters, it is possible to calculate the standard deviation of
fluidity as a function of the standard deviations and values of those parameters.
As was detailed above in Section 3.1, these calculations have been performed.
These theoretical calculations suggest which experimental parameters must be
closely controlled to minimize experimental error. With this as a guide, initial
efforts were directed toward producing a test and related experimental method
which would be both inexpensive and robust while allowing different groups to

34
quantitatively compare results. In general, a process of successive incremental
improvements was employed.
Based on a review of the literature as well as personal correspondence, these
tests were vertical vacuum fluidity measurements. While the specific
experimental design was informed by these theoretical investigations into the
causes of experimental variation, it was assumed that the experimental setup
would resemble in many ways the vacuum suction tests of Ragone and Flemings.
A major reason that the vertical test is preferred over the horizontal test is that
the experimental setup is seen as being simpler to assemble, as the glass (or
metal) tubes do not need an ‗L‘ shaped bend.
As the experiments conducted have been a succession of refinements to discern
the optimal procedure, the procedure used has necessarily changed over time.
Consequently, those aspects of procedure which remained invariant during this
phase will be presented first, followed by the variable procedures presented in
chronological order.
3.2.1) Preliminary Analyses
All early tests were conducted with a half horsepower Alcatel 2008A vacuum
roughing pump, which was attached to a 18.9 L air compressor tank with NPT
fittings and rubber hosing as shown in Figures 3.2.1.A and B. Though the tank
was subsequently changed, this pump was used for all of the experimental work
detailed in this dissertation. Borosilicate tubes and a standard chemistry test tube
stand were used to perform vertical suction. After the valve had been opened,
the pressure gage read a vacuum of better than -27 mmHg. (Prior to opening,
the vacuum is greater than -28.5 mmHg.) K-type thermocouples and a handheld
reader were used in all cases for this phase of work. The crucibles were coated
with boron nitride and hold approximately 1.3 kg of A365 each.

35
Figure 3.2.1.A, B: Pressure testing setup, including air tank, ½ hp pump, gauge, valves.
Front (A) and Rear (B).
Figure 3.2.1.C, D: C) Lab stand, borosilicate tube, and crucible in upright position. D)
Close-up of borosilicate tube, stand, rubber tube, and rubber stopper in lower position.
Figure 3.2.1.E, F: E) Induction unit controls and F) induction unit
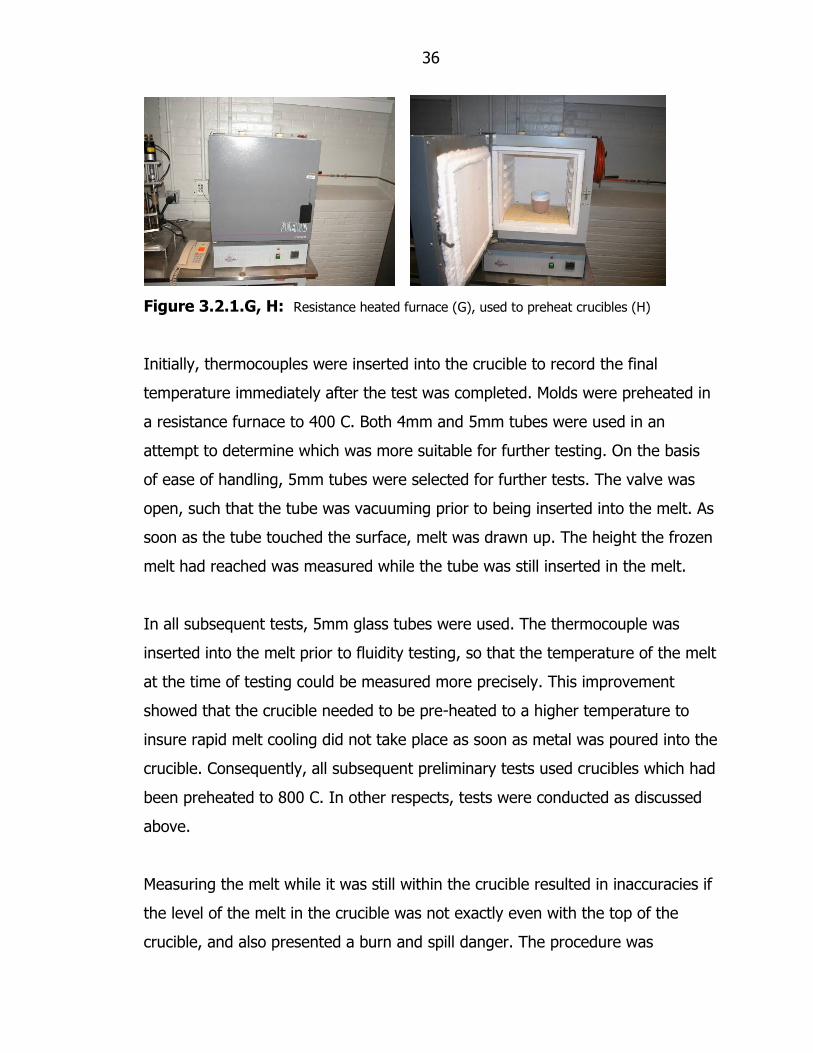
36
Figure 3.2.1.G, H: Resistance heated furnace (G), used to preheat crucibles (H)
Initially, thermocouples were inserted into the crucible to record the final
temperature immediately after the test was completed. Molds were preheated in
a resistance furnace to 400 C. Both 4mm and 5mm tubes were used in an
attempt to determine which was more suitable for further testing. On the basis
of ease of handling, 5mm tubes were selected for further tests. The valve was
open, such that the tube was vacuuming prior to being inserted into the melt. As
soon as the tube touched the surface, melt was drawn up. The height the frozen
melt had reached was measured while the tube was still inserted in the melt.
In all subsequent tests, 5mm glass tubes were used. The thermocouple was
inserted into the melt prior to fluidity testing, so that the temperature of the melt
at the time of testing could be measured more precisely. This improvement
showed that the crucible needed to be pre-heated to a higher temperature to
insure rapid melt cooling did not take place as soon as metal was poured into the
crucible. Consequently, all subsequent preliminary tests used crucibles which had
been preheated to 800 C. In other respects, tests were conducted as discussed
above.
Measuring the melt while it was still within the crucible resulted in inaccuracies if
the level of the melt in the crucible was not exactly even with the top of the
crucible, and also presented a burn and spill danger. The procedure was

37
modified to measure the tubes after they had been extracted from the melt. The
tradeoff was an additional glass hazard, as an extracted tube sheds its
borosilicate coating (especially when fluidity greater than 10 cm is reached).
The above tests, as previously mentioned, only involved lowering the tube until it
first made contact with the surface. This was done to insure that the depth the
tube was inserted into the melt was not a factor, but after one accidental
immersion led to a much greater fluidity than simple pressure differential as a
result of head pressure would suggest, subsequent tests were conducted. There
is clearly an effect, presumably due to increased oxide content, when suction is
at the surface. Metal dropping below the level of the tube, resulting in a
cessation of flow and the freezing of the metal, is another possible factor.
Finally, tests were conducted with the suction off. The tube was inserted to a
depth in the melt, then clamped off. (After removal from the melt, the depth the
tube was submerged was recorded as well.) The valve was then opened, and
vacuum sucked the melt up the tube.

38
3.2.2) Development of an Improved Apparatus
Fig. 3.2.2.A: Vertical vacuum apparatus in the lab foundry
Above, in Figure 3.2.2.A, the vertical vacuum setup is shown. When a sample
reaches a pre-set temperature, a pneumatic jack raises the crucible so that a
1016 mm long, 5 mm OD, 3.35 mm ID borosilicate tube is submerged into the
melt. This automatically triggers a valve which evacuates the tube and draws the
metal up the tube with a 95%+ vacuum. Measurements are conducted by the
operator immediately afterwards, before the tube is removed. This unit was
selected because it fulfilled the needs determined in earlier testing. Existing
Alcan equipment was refurbished, and a new testing procedure devised.
To reach the desired precision with the vacuum testing apparatus, several
possible improvements were considered.
39
One testing method considered was ultrasonic height measurement of the liquid
metal, but since the speed of sound is highly sensitive to air pressure (and
ultrasonic testing is not possible at all under high vacuum), this is not a feasible
technique.
Though laser range-finding seemed a promising upon initial consideration, both
of the major laser range-finding technologies are unsuitable[101]. The first
method of laser range-finding separates the emitter and receiver, and calculates
the distance based upon the angle. This presents a number of problems, the
most serious being that the narrow tubes being used for vacuum suction do not
present enough angular width for this technique. Other problems include
possible reflection off of the walls of the tube and, the rounded or irregular
shape of the flow front. The second technique also separates the emitter and
receiver, and is primarily used for surveying. This technique uses time-of-flight of
the beam, and is also unsuitable, since the architectural technique assumes the
emitter and receiver will be separated over distances much greater than a meter.
Even if a system could have been developed or adapted, a task more suitable for
the MPI Center for Imaging Studies (CIS), it would need to be robust enough for
frequent use in a foundry lab setting [101].
Mounting a digital camera such that it would photograph the melt on completion
of its flow and analyze the height with software was considered. There are
several professors in the Computer Science Department who work on computer
vision, including the department head. After speaking with Ph.D. Gennert [102],
it became clear there were a number of complications which had not been
considered. Such an arrangement would require a great deal of work to tune the
lighting to avoid false reflections, to ensure proper contrast, etc. It would be very
sensitive to the angle of its mounting, and the software would need time for
tuning as well. In computer vision, the camera is among the least important
parts of the system, and doing this properly is still an active area of research in

40
computer science. Again, since the intent at the ACRC is to be at the forefront of
light metals casting, rather than computer science, the work needed to make this
solution practical is enough to suggest other alternatives.
It turns out that there is a common instrument which does not suffer from these
problems of angular deflection, contrast in variable lighting conditions,
programming, etc. With additional care to specify the position of the observer,
the necessary measurements will be taken with the human eye and a fixed
measuring stick. With the chin placed on a specified spot (the corner of the cart-
top, sighting between the tip of the now-solid fluidity sample and a ruler), note
and record the height of the uppermost bit of metal drawn up the tube.
Measurements are now taken with the dominant eye. Sufficient measurements
have been taken (the height from chin to pupil) to allow another experimenter
either to place their pupil in exactly the same spot or to calculate an offset. This
offset problem should impact accuracy rather than precision, and so testing
against a known standard can also be helpful.
Additional procedural improvements have been made, such as filling the crucible
directly from the induction unit rather than with an intermediate ladle. (The
dimensions of that crucible are the same as specified in Section 3.2.1.)
In addition to procedural improvements, the experimental setup has also been
improved. A fill-line has been inscribed in the crucible three inches (7.62 cm) up
from its base, since attempting to fill it to the top led to problems with the exact
height of the meniscus, the displacement of metal by the tongs, which grip it by
the edge, and spilling. Other improvements include adding fire-resistant glass
cloth for fireproofing purposes, repainting and consolidating the experimental
setup, replacing defective switches, performing mechanical repairs, etc. The
consolidation of equipment has simplified the setup procedure considerably. This
new setup, and a new written procedure were tested in Section 3.3 below.

41
Figure 3.2.2.B: schematic of fluidity testing apparatus
The above schematic, Figure 3.2.2.B, depicts the fluidity testing apparatus
used in all later stages of research after the initial work described in Section
3.2.1. The various numbered components on the diagram are: 1) pneumatic
jack 2) switch which, when triggered by a L-shaped rod attached to the bottom
of platform, opens a valve evacuating the glass tube and drawing liquid metal up
the tube 3) steel platform covered by heat resistant tile which is raised and
lowered by the jack and which supports the plexiglass case 4) protective fiber
surrounding bottom of plexiglass case 5) crucible inscribed on the inside with a
fill-line 6) ruler affixed to the rear of the plexiglass box 7) thermocouple
connected by wire to temperature controller 8) temperature controller which
triggers pneumatic jack if the appropriate lever is in the ‗on‘ position and the
temperature of the melt as indicated by the thermocouple is below the set point

42
9) lever controlling jack, a pressure gage, and a fitting for the pressurized air
supply 10) lab ringstand which helps to maintain glass tube in vertical orientation
11) clamp holding rubber stopper connecting rubber tubing to pyrex tube 12)
connections between vacuum reservoir, vacuum pump, vacuum gage, and tube
terminating in rubber stopper and pyrex tube which is controlled by the switch
activated by the raising of the pneumatic jack 12b) vacuum gage 13) vacuum
pump 14) vacuum reservoir 15) switch for ac power supply to pump and
temperature controller, not shown 16) ac power line in 17) level wheels on which
cart is mounted.
3.3) Measurement Systems Variability (MSV)
Two sets of experimental apparatus and their respective procedures for use were
investigated to determine their reproducibility and reliability. As each device has
strengths and weaknesses outside of the scope of reliability and reproducibility,
this is not an attempt to show that one test is superior in all respects, but rather
whether they can and do produce trustworthy quantitative data when used
correctly according to a written procedure.
The method to be used to establish reproducibility and reliability, measurement
systems variability (MSV), is widely used in industry[87, 89, 90]. MSV is very
similar to gage repeatability and reliability (GR&R), another industrial
measurement standard, but GR&R is only intended for nondestructive tests of
nominally identical samples. GR&R could be used to measure the diameter of 10
coins to establish the accuracy of a micrometer, for instance. MSV might be used
to analyze bomb calorimeters which incinerate small quantities of petroleum that
are not guaranteed to be of equal volume or volatility due to uncertainties in the
chemistry of the fuel and volume dispensed into the apparatus.
The tests which were evaluated were the vertical vacuum testing unit and the N-
Tec test. In the vertical vacuum testing unit, a pneumatic jack raises a crucible of

43
melt up when a pre-set temperature is reached so that a vertical vacuum test
may be conducted with the attached vacuum equipment through a borosilicate
tube. Existing Alcan equipment has been refurbished, and a new procedure
written. The N-Tec test is a permanent mold test of fluidity has also had a
detailed procedure written for it. Five fingers of varied cross-sectional area but
equal length extend from a central well. The manufacturer sells the test for
qualitative measurement, but attempts at quantitative use are not unknown in
the literature [24]. Insofar as is possible, the same experimental conditions were
used for both tests.
One alloy composition, A356, was used for all experiments, and the other casting
parameters (superheat range, degassing, and grain refinement) were selected
and kept constant as well. Testing was done on 700 C metal, with no degassing
or grain refinement addition. Mold temperatures were kept constant for each
instrument, but varied based on the needs of the apparatus.
Each test has a separate procedure, which is presented at the end of this
section. Each test was repeated ten times by different experimenters. One of
these experimenters was already familiar with the pieces of equipment. All
experimenters were instructed to follow a written experimental procedure for the
piece of equipment. The experimenters were Brian Dewhirst, Shimin Li, and
Kimon Symeonidis. The assistance provided by the latter two is appreciated by
the former.
In the case of the vertical vacuum test, each of the 30 tests (10 tests each by
three people, divided into two blocks of five each) was a measured length. The
result of the N-Tec test was the sum of the lengths of the fingers. Volumetric
measures, which measure the total volume of metal in each of the fingers, weigh
thin fingers less heavily than thicker fingers, which was considered undesirable
for this test.
44
MSV analysis is algorithmic, and spreadsheet macros were written to perform the
relevant steps[87, 89, 90]. The result is four numbers: %EV (percent equipment
variation), %AV (percent appraiser variation), %PV (percent part variation), and
%MSV (percent measurement system variation), and standards exist to assist in
evaluating these results. These numbers are determined based upon a user-
specified TV (total variation), which was 100 mm for these experiments.
When %MSV is greater than 100%, the process is considered out of control, and
is best suited for qualitative work. A %MSV of 60 to 100% indicates that the
process can be used for quantitative work, but any changes which could be
made to reduce variability should be investigated. A %MSV less than 60%
indicates everything is functioning properly, and further improvement is generally
unwarranted.
The written procedures for this phase of work can be found in Appendix H.
3.4) Further Refinements and the Demonstration of Linear Superheat
Following the results of the MSV testing whose methodology was discussed
above and whose results are presented in Section 4.3 below, additional
modifications were made to improve the vertical vacuum procedure. Observation
of the execution of the procedures indicated there were significant problems in
measuring the tube length consistently. The borosilicate tubes used in these
experiments remain intact for only about 15 seconds after the melt has been
drawn up the tube. After this, they begin to violently eject glass flakes, and
frequently break off and fall back into the melt. Different experimenters
measured from different points, which explains why the standard deviations of
their results do not overlap.

45
This revised procedure is presented in Appendix I with modifications indicated
by boldface type. Boldface type is not used for simple
clarifications/simplifications. This procedure was used to collect the data
presented in Section 4.4, with multiple runs of A356 fluidity testing being
conducted for each temperature, and ten data points per run as indicated by
Table 3.A. This investigation of varied superheat was conducted because it was
known this alloy should respond in a linear fashion to superheat. A linear
response would indicate close agreement with theory, and thus further validate
this test apparatus and procedure. Tests were conducted at 680 C, 700 C, 720 C,
740 C, and 760 C with multiple runs for each condition.
3.4.1) Confirmation of Improvements by Baseline Comparison
After superheat testing demonstrated the test was reliable, work continued in
investigating variables of interest. During that testing, detailed below in Section
3.5, samples of unmodified A356.2 were tested at 700 C alongside the modified
materials in a series of experiments discussed below. This large baseline allows
for investigation of the repeatability and stability of this apparatus and these
related procedures (apart from the baseline points from the Section 3.5 work,
data from the 700 points of Section 3.4 was included).
These same data were used to generate a process control chart, which can be
found in Section 4.4.1.
3.5 Application of Apparatus to Variables of Interest
Subsequent to the work described above, additional modifications to the
procedure were made. These modifications are indicated by boldface type or
strikethroughs. Boldface type and strikethroughs are not used to indicate simple
clarifications/simplifications. This procedure, presented in Appendix J, was used
to collect the data presented in Section 4.5, with repeated trials as indicated by
Table 3.A. The following table summarizes the changes made between phase 1
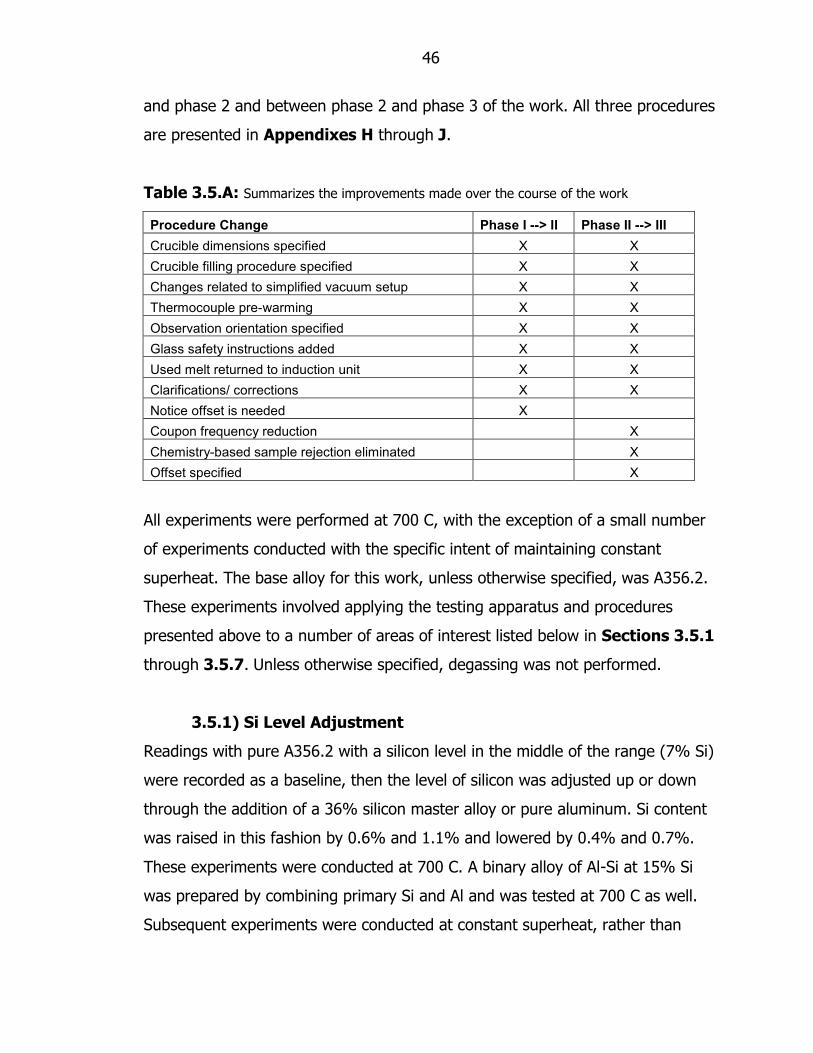
46
and phase 2 and between phase 2 and phase 3 of the work. All three procedures
are presented in Appendixes H through J.
Table 3.5.A: Summarizes the improvements made over the course of the work
Procedure Change Phase I --> II Phase II --> III
Crucible dimensions specified X X
Crucible filling procedure specified X X
Changes related to simplified vacuum setup X X
Thermocouple pre-warming X X
Observation orientation specified X X
Glass safety instructions added X X
Used melt returned to induction unit X X
Clarifications/ corrections X X
Notice offset is needed X
Coupon frequency reduction X
Chemistry-based sample rejection eliminated X
Offset specified X
All experiments were performed at 700 C, with the exception of a small number
of experiments conducted with the specific intent of maintaining constant
superheat. The base alloy for this work, unless otherwise specified, was A356.2.
These experiments involved applying the testing apparatus and procedures
presented above to a number of areas of interest listed below in Sections 3.5.1
through 3.5.7. Unless otherwise specified, degassing was not performed.
3.5.1) Si Level Adjustment
Readings with pure A356.2 with a silicon level in the middle of the range (7% Si)
were recorded as a baseline, then the level of silicon was adjusted up or down
through the addition of a 36% silicon master alloy or pure aluminum. Si content
was raised in this fashion by 0.6% and 1.1% and lowered by 0.4% and 0.7%.
These experiments were conducted at 700 C. A binary alloy of Al-Si at 15% Si
was prepared by combining primary Si and Al and was tested at 700 C as well.
Subsequent experiments were conducted at constant superheat, rather than

47
constant temperature, with a baseline A356.2 (7.0% Si) point at 700 C, a
reduced Si (6.5% Si) point at 698.5 C, and an increased Si (7.5% Si) point at
702.5 C. Investigations of alloy modifications over gross changes in chemistry
have been performed before, but this work explores the effect of fluidity within
the range of allowed chemistries of a commercial alloy.
3.5.2) Fe and Mn Addition
Readings with pure A356.2 with 0.08% Fe and 0.002% Mn were recorded as a
baseline, and then the levels of those constituents were modified through adding
master alloys. Iron content was increased to 0.2% (the specified limit), then later
increased to 1.0% (a level more typical of a secondary or die casting alloy).
Manganese is often added to control iron intermetallics in a 2:1 ratio of Fe:Mn,
so 0.5% Mn was added to the A356.2 with 1% Fe. Subsequently, 0.25% Mn was
added to fresh A356.2. A356 alloys may contain up to 0.2 Fe and 0.1 Mn, so
here again this work includes research into the effect of alloying elements within
the accepted range of a commercial alloy.
3.5.3) Pure Aluminum Testing
In addition to the experiments conducted with A356.2, and the binary
hypereutectic Al-Si alloy, tests were conducted with pure Al for the purposes of
comparison, as it is known that pure metals have very high fluidities. In addition
to the standard procedure indicated above, measurements were taken with the
eye parallel to the melt level. When the fluidity is very large the difference
between measurements taken with the head in a fixed location and the true
height become large. Measurements with the eye in a fixed position are still
more precise, even if they are less accurate. Due to the higher fluidity, testing
was conducted at 670 C.

48
3.5.4) Grain Refinement
Readings with pure A356.2 were recorded as a baseline. TiBor grain refiner sticks
(5 % Ti, 1% B) were added to the 25 lb of pure A356.2 to achieve three levels of
refinement in addition to the baseline. 27 grams TiBor was added to achieve the
recommended 10-20 ppm B, an additional 133 grams was added to reach 5-6
times that level, and a further addition of 140 grams was added to achieve 10-12
times the recommended commercial addition. Micrographs were taken to insure
refinement had taken place.
3.5.5) Eutectic Modification (Sr)
Readings with pure A356.2 were recorded as a baseline. Strontium master alloy
(90% Al, 10% Sr) was added to achieve three levels of modification in addition
to the baseline. The first two levels were prepared from the same initial 27 lb
melt of A356.2, while the final level was prepared from a 28 lb melt at a later
date. First, 37.5 grams of Sr master alloy were added to achieve a level greater
than 0.02% Sr. Subsequently, 32.5 additional grams were added to bring the
level above 0.04% Sr. Mercury Marine produces a series of die casting alloys
called Mercalloy which have Sr levels as high as 0.1% Sr, and so 150 grams were
added to a later melt of A356.2 to see how this larger addition impacts fluidity.
3.5.6) Artificial Introduction of Oxides
The impact of oxides and oxide films is much commented on in the aluminum
literature, and the deleterious effects on the fluidity of other aluminum alloys has
been established by other researchers. Here, the intent was to vary the oxide
level by introducing aluminum powder and borax to the melt. Oxides produced
on the surface of the melt were also stirred back in rather than skimmed off.
Since borax contains significant quantities of combined water which produce
oxides and significant quantities of solid ‗grit‘ are left behind, this may prove to
be a more potent artificial oxide source.

49
Readings with pure A356.2 were recorded as a baseline. Subsequent to baseline
testing of the 32 lb melt, 99% pure Al powder (ASP 17-23 microns) was added at
three levels (cumulative additions of 142 g, 402 g, and 498 g in aluminum foil.)
Adding this fine powder to the melt presented the melt with a great quantity of
additional surface area. In other testing, standard best practice with regards to
protecting castings from oxide related defects was followed. Oxides were
skimmed from the top, poring heights were minimized, etc. During this testing,
these practices were reversed. Oxides were not skimmed off, but were instead
deliberately stirred into the melt. Thus, the total quantity of oxides will not
directly correspond to the masses of Al powder added.
Testing was also conducted with borax (Na2B4O7•10H2O) addition. The
procedure, including steps to counteract best practice (stirring in oxides, etc),
was the same as was followed for the addition of powder, but rather than just
increasing the surface area available for oxidation the combined water in borax
reacts directly to form oxides and a sodium boron oxide is left behind in the melt
contributing to poor melt quality. Cumulative additions to the melt were 184 g,
336 g, and 501 g of borax in aluminum foil to a 28 lb melt.
3.5.7) Degassing
Readings with pure A356.2 were recorded as a baseline. Degassing was
performed using a rotary degasser with argon gas for 15 minutes and 35
minutes. Gas levels for un-degassed and heavily degassed metal were directly
measured with the Alscan setup. The indicated intermediate (15 min) level, 0.15
ml/cc, is based on past experience with the Alscan setup, A356, etc. Direct
measurements indicated that the high (35 min) degassing produced levels below
0.1 ml/cc of hydrogen and that the levels of hydrogen with no degassing were
over 0.3 ml/cc.
These measured levels of hydrogen are not precise, because both the Alscan

50
testing and degassing were performed at a lower temperature than testing, and
time passed while the metal was brought up to a suitable temperature for testing
allowing hydrogen to diffuse back into the melt. Naturally, time also passed
during testing, as it takes quite a while for the Alscan tester to reach equilibrium
and results are supposed to be the average of multiple measurements.
3.6) Predictive Modeling
Modeling is becoming an increasingly popular tool in the metals casting industry,
and while work in alloy and process involvement often involves explicit fluidity
testing, industry survey results presented in Appendix B suggest use of
computer models to determine fluidity is much more common in industry.
Unfortunately, current models do not provide an estimate of the uncertainty of
their calculations and they are constrained by the quality of their databases. If
modeling is sufficiently able to predict the results of fluidity tests, need for lab
tests will be obviated in many cases.
Three common molten metal modeling software packages were investigated for
this work:
Comsol, a finite element package used in many areas of the physical
sciences, especially for problems involving interactions between multiple
simultaneously modeled phenomena.
CAPCAST, by EKK inc., is a finite element software package, intended for
casting simulation, which is noted for its meshing tool.
MAGMA, by MAGMASOFT, is a finite difference software package, also
intended for casting simulation, which claims it can predict the properties
of castings through modeling.
First, each of these packages was evaluated with consultation with their
manufacturers to determine their suitability for modeling the apparatus discussed

51
in Section 3.2.2 Comsol's manufacturer indicated that it was not suitable for
this application. The manufacturers of the more casting-specific packages both
felt that their products were potentially suitable and provided assistance in
conducting the modeling.
Models were prepared based on descriptive details of the geometries and
materials involved, comparable to those found in Section 3, and were tested with
specified superheats. If the model results agreed with the experimental results
then a more comprehensive effort to evaluate the impact of various
modifications (Sections 3.5.1-3.5.7) would be conducted. Without a robust
baseline from valid superheat modeling to compare these modified models to,
however, it would not be possible to reliably evaluate the results.
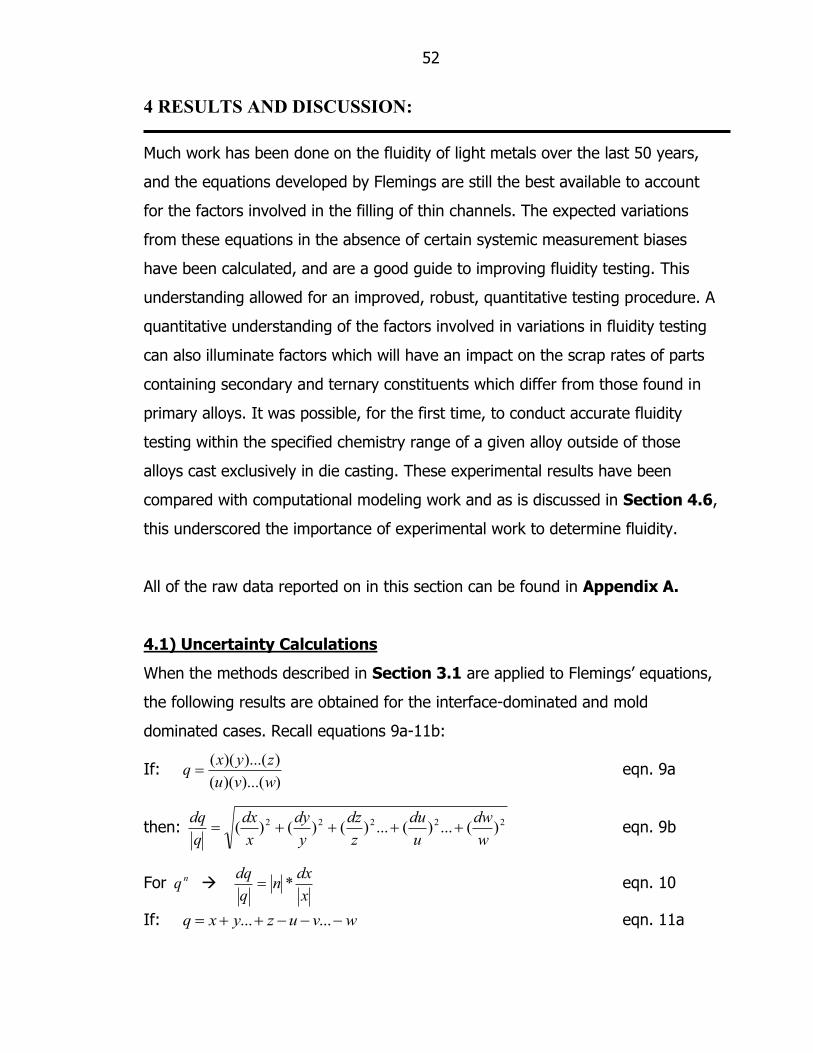
52
4 RESULTS AND DISCUSSION:
Much work has been done on the fluidity of light metals over the last 50 years,
and the equations developed by Flemings are still the best available to account
for the factors involved in the filling of thin channels. The expected variations
from these equations in the absence of certain systemic measurement biases
have been calculated, and are a good guide to improving fluidity testing. This
understanding allowed for an improved, robust, quantitative testing procedure. A
quantitative understanding of the factors involved in variations in fluidity testing
can also illuminate factors which will have an impact on the scrap rates of parts
containing secondary and ternary constituents which differ from those found in
primary alloys. It was possible, for the first time, to conduct accurate fluidity
testing within the specified chemistry range of a given alloy outside of those
alloys cast exclusively in die casting. These experimental results have been
compared with computational modeling work and as is discussed in Section 4.6,
this underscored the importance of experimental work to determine fluidity.
All of the raw data reported on in this section can be found in Appendix A.
4.1) Uncertainty Calculations
When the methods described in Section 3.1 are applied to Flemings‘ equations,
the following results are obtained for the interface-dominated and mold
dominated cases. Recall equations 9a-11b:
If: ))...()((
))...()((
wvu
zyxq eqn. 9a
then: 22222 )(...)(...)()()(w
dw
u
du
z
dz
y
dy
x
dx
q
dq eqn. 9b
For nq x
dxn
q
dq* eqn. 10
If: wvuzyxq ...... eqn. 11a

53
then: 222222 )...()()()...()()( dwdvdudzdydxdq eqn. 11b
where dq is the relative uncertainty (i.e. q_true = q +/- dq).
4.1.1) Error in Metal-Mold Interface Dominated Case
Recall equations 4 and 6:
)(**2
)'*)(*'*(
o
of
TTh
TcHVapL
eqn. 4
Where
dT
dL
L
H
c
f
f*)
'( eqn. 6
Define some useful terms: )'( TcHF and )( oTTE
bxF where Hx and Tcb '
22 )()(H
dHd
x
dx
22 )()(
H
dHdxdx
22 )()'
'(
T
Td
c
dc
b
db
22 )()
'
'(
T
Td
c
dcbdb
22 )()( dbdxdF
))()'
'(())()(( 222222
T
Td
c
dcb
H
dHdxdF
))()'
'(()'*())()(()*( 222222
T
Td
c
dcTc
H
dHdHdF
222222 )()()'
'()()()(
h
dh
Vo
dVod
a
da
E
DE
F
dF
L
dL
2222
2
22
)()()'
'()(
)(
))()((...
2
1
h
dh
Vo
dVod
a
da
TT
dTTd
L
dL
o
o
f
f
eqn. 12a
2
222222
)'**(
))()'
'(()'*())()(()*(
...TcH
T
Td
c
dcTc
H
dHdH
eqn. 12b
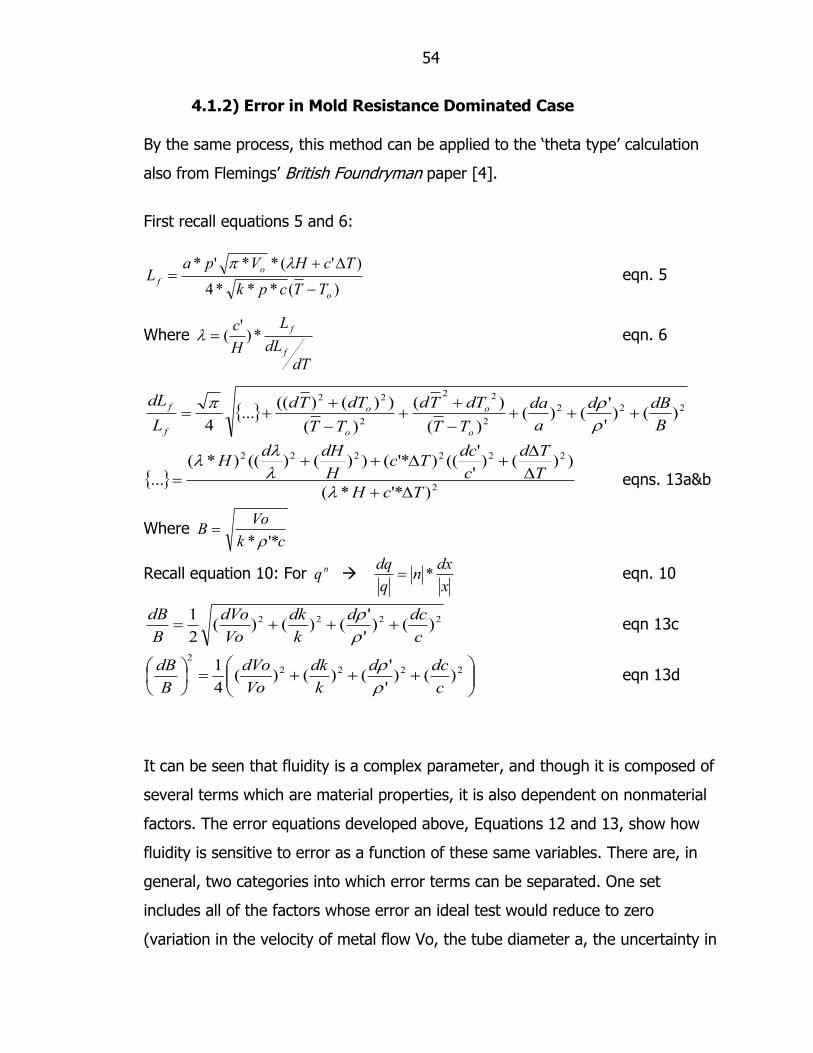
54
4.1.2) Error in Mold Resistance Dominated Case By the same process, this method can be applied to the ‗theta type‘ calculation
also from Flemings‘ British Foundryman paper [4].
First recall equations 5 and 6:
)(***4
)'(**'*
o
o
fTTcpk
TcHVpaL
eqn. 5
Where
dT
dL
L
H
c
f
f*)
'( eqn. 6
222
2
22
2
22
)()'
'()(
)(
)(
)(
))()((...
4 B
dBd
a
da
TT
dTTd
TT
dTTd
L
dL
o
o
o
o
f
f
2
222222
)'**(
))()'
'(()'*())()(()*(
...TcH
T
Td
c
dcTc
H
dHdH
eqns. 13a&b
Where ck
VoB
'**
Recall equation 10: For nq x
dxn
q
dq* eqn. 10
2222 )()'
'()()(
2
1
c
dcd
k
dk
Vo
dVo
B
dB
eqn 13c
2222
2
)()'
'()()(
4
1
c
dcd
k
dk
Vo
dVo
B
dB
eqn 13d
It can be seen that fluidity is a complex parameter, and though it is composed of
several terms which are material properties, it is also dependent on nonmaterial
factors. The error equations developed above, Equations 12 and 13, show how
fluidity is sensitive to error as a function of these same variables. There are, in
general, two categories into which error terms can be separated. One set
includes all of the factors whose error an ideal test would reduce to zero
(variation in the velocity of metal flow Vo, the tube diameter a, the uncertainty in

55
the measurements of the temperatures). The other includes all the intrinsic
factors, factors which may well vary in actual casting practice (variation in the
specific heat c, heat transfer coefficient h, mold thermal conductivity k, etc.)
Some variables can fall into both categories. When a variation in heat transfer
coefficient is due to a change in chemistry or local mold characteristic, this is of
interest, but if an experimental apparatus has a persistent air bubble which
would not be found in casting practice, it is desirable to eliminate the variation.
(Since the heat transfer coefficient between glass and molten metal is likely to be
quite different from that found in a die cavity, it is good that it is constant in this
test.)
Though the degree of uncertainty will vary between the lab test and the casting
facility, the same terms determine the uncertainty implicit in filling a thin section
in the foundry. Though heat transfer is, one hopes, well-controlled in the
laboratory setting, the presence or absence of an air gap between melt and mold
(or between melt and mold coating) can significantly affect the thermal
conductivity and heat transfer coefficient [76], and so lead to great variation in
the observed fluidity in the foundry setting. This variation can be estimated by
using the above equations.
4.2) Development of Experimental Apparatus
Though the general structure of the results section is patterned after the
methodology section, there are no data corresponding to Section 3.2 to
discuss.

56
4.2.1) Preliminary Analyses
fluidity
550
650
750
850
0 10 20 30 40
Length (cm)
Tem
p (
C)
4mm
"5mm"
"800C, surface"
submerged
vac after
Figure 4.2.1.A: Graph of fluidity versus temperature for vertically suctioned A356 under
varied experimental conditions, as detailed in Section 3.2.1.
The results of the five procedures above are presented in Figure 4.2.1.A. As
can be seen, the various refined procedures generated greater fluidity than the
procedures they replaced. Only the final procedure shows the expected linear
response between superheat and fluidity. Presumably, this was because of
confounding factors in the earlier test procedures (oxides, insufficient tube depth
to permit continued flow of metal, etc). It was found that the testing mechanism
and procedure were converging with the design decisions made for the
refurbished Alcan fluidity tester. Correcting problems with this apparatus and
procedure would bring it even closer to the Alcan setup. Future vacuum fluidity

57
testing was conducted with the Alcan apparatus. Based on these experiments, a
new procedure was written for the apparatus.
In addition to linearity, it is expected that accurate results will conform to the
relationship described by Flemings in Equation 4. At 750 C, the fluidity appears
to be 29 cm. The density, , of A356 is 2.6 g/cm^3. The inner diameter of the 5
mm OD tubes was 3.3 mm. for A356 is approximately 0.4. To, room
temperature, was approximately 20 C. Tbar is the average of the melting
temperature of A356 (615 C) and 750 C, or 682.5 C. T, the superheat, is 135
C. The specific heat, c, is 0.963 J/g*K, and the heat of fusion, H, is 389 J/g.
Based on these values, the ratio of our unknowns, velocity and the heat transfer
coefficient, is calculated to be 162 cm^3/J*s. A similar calculation performed on
the fluidity of 37 cm at 800 C yields 183 cm^3/J*s, a comparable result given
the sources of uncertainty which are still present. Though the exact values of
these parameters are unknown, solidification is observed to be rapid and is
known to be heavily influenced by the interface. With a heat transfer coefficient
of 0.17 J/cm^2, this suggests a velocity of 30 cm/s, a physically sensible result,
and sensible estimates of velocity produce similarly sensible estimates of heat
transfer coefficient. Though a number of inferences were made, it can be
concluded that Flemings' equation is valid; thus the fundamentals on which to
continue the work forward were verified.
4.3) Measurement Systems Variability (MSV)
The Design of Experiments for MSV was followed as presented above in Section
3.3. Results are presented in the standard format for MSV and GR&R. The three
experimenters are designated Operators 1, 2, and 3. Similarly, the samples are
numbered 1-5. MSV calculations make use of intermediate calculations of
averages (X) and ranges (R), as well as the range of the averages, and these
intermediate values are displayed. K1, K2, and K3 are statistical constants based
upon sample size, and the total number of tests, n, is 30. The most important

58
result of these calculations is %MSV, and the lower this value is, the better the
results a testing procedure/apparatus can provide.
The following table contains the MSV results and analysis of N-Tec testing. This
format is standard for GR&R/ MSV testing and follows the procedure, above, in
Section 3.3.

59
Table 4.3.A: N-Tec MSV Testing Results
Sample#1 Sample#2 Sample#3 Sample#4 Sample#5 -- --
1 (Oper. 1) 678.00 302.00 317.00 731.00 835.00
2 (Oper. 1) 607.00 566.00 360.00 800.00 375.00
3 (Oper. 2) 793.26 742.41 635.63 883.00 665.00
4 (Oper. 2) 300.02 750.04 931.00 675.00 500.00
5 (Oper. 3) 631.00 1071.00 784.00 954.00 906.00
6 (Oper. 3) 537.00 858.00 823.00 822.00 583.00
Oper. 1 Ave 642.50 434.00 338.50 765.50 605.00 X bar Oper. 1 557.10
Oper. 1 Range 71.00 264.00 43.00 69.00 460.00
R bar Oper. 1 181.40
Oper. 2 Ave 546.64 746.23 783.31 779.00 582.50 X bar Oper. 2 687.54
Oper. 2 Range 186.26 176.41 275.63 83.00 290.00
R bar Oper. 2 202.26
Oper. 3 Ave 584.00 964.50 803.50 888.00 744.50 X bar Oper. 3 796.90
Oper 3. Range 94.00 213.00 39.00 132.00 323.00
R bar Oper. 3 160.20
Sample Ave 591.05 714.91 641.77 810.83 644.00
-- Rp 219.79
R bar 181.29
X bar diff 239.80
MSV
EV 826.67 %EV 826.67 K1 4.56
AV 647.46 %AV 647.46 K2 2.70
PV 457.16 %PV 457.16 K3 2.08
TV 100.00 %MSV 1145.24 n 30.00
The following table contains the MSV results and analysis of vertical vacuum
testing. This format is standard for GR&R/ MSV testing and follows the
procedure, above, in Section 3.3.

60
Table 4.3.B: Vertical Vacuum MSV Testing Results
Sample#1 Sample#2 Sample#3 Sample#4 Sample#5 -- --
1 (Oper. 1) 255.00 248.00 273.00 289.00 270.00
2 (Oper. 1) 244.00 297.00 244.00 264.00 259.00
3 (Oper. 2) 314.96 317.50 317.50 317.50 322.60
4 (Oper. 2) 304.80 304.80 304.80 320.00 325.10
5 (Oper. 3) 237.00 210.00 236.00 237.00 236.00
6 (Oper. 3) 240.00 242.00 239.00 234.00 251.00
Oper. 1 Ave 249.50 272.50 258.50 276.50 264.50 X bar Oper. 1 264.30
Oper. 1 Range 11.00 49.00 29.00 25.00 11.00
R bar Oper. 1 25.00
Oper. 2 Ave 309.88 311.15 311.15 318.75 323.85 X bar Oper. 2 314.96
Oper. 2 Range 70.96 20.50 73.50 53.50 63.60
R bar Oper. 2 56.41
Oper. 3 Ave 238.50 226.00 237.50 235.50 243.50 X bar Oper. 3 236.20
Oper 3. Range 3.00 32.00 3.00 3.00 15.00
R bar Oper. 3 11.20
Sample Ave 265.96 269.88 269.05 276.92 277.28
-- Rp 11.32
R bar 30.87
X bar diff 78.76
MSV
EV 140.77 %EV 140.77 K1 4.56
AV 212.64 %AV 212.64 K2 2.70
PV 23.55 %PV 23.55 K3 2.08
TV 100.00 %MSV 256.10 n 30.00
In order to better compare and contrast the results of these two tables, Table
4.3.C below collects the results for side-by-side analysis.
Table 4.3.C: The key values for N-tec and Vertical Vacuum are presented together
Vertical Vacuum N-Tec
%EV 140 %EV 830
%AV 210 %AV 650
%PV 24 %PV 460
%MSV 260 %MSV 1100

61
From Table 4.3.C, the following can be noted:
While both tests have %MSV (percent measurement systems variation)
values which are much higher than the desired 100% or 60%, the vertical
vacuum test produced much more favorable overall results (240% versus
1100%).
%MSV results can be improved by further refining the procedure and
apparatus. N-Tec variations were high across the board, rather than in any
one area which might be targeted. In contrast, the part and equipment
variations for the vertical vacuum test were low, suggesting that the step
which needs improvement is the measurement of completed samples.
Experimental methodologies which either incorporate more data points or
allow for broader tolerances on total variation (such as applying a linear fit to
superheat values) would likely not help reduce %MSV to below 100%, the
threshold for quantitative work according to %MSV, without further
procedural improvements.
These results underscore the importance of investigating and improving the
testing methods for fluidity.
While both tests have %MSV (percent measurement systems variation) values
which are much higher than the desired 100% or 60%, the vertical vacuum test
produced much more favorable overall results. %MSV results can be improved by
further refining the procedure and apparatus. N-Tec variations were high across
the board, rather than in any one area which might be targeted. In contrast, the
part and equipment variations for the vertical vacuum test were low, suggesting
that the step which needs improvement is the measurement of completed
samples. Experimental methodologies which either incorporate more data points
or allow for broader tolerances on total variation (such as applying a linear fit to
superheat values) would likely help reduce %MSV to below 100%, the threshold
for quantitative work.

62
In these experiments (as mentioned above) there were variations across the
board for the N-Tec permanent mold. The manufacturers of this mold do not
claim it is suitable for quantitative testing. Though it might be possible to
incorporate it into a quantitative setup, in part through controlling melt velocity
and mold temperature more precisely, it is by far the less promising of the two
tests under consideration. Variations in mold temperature are clearly a factor in
the variation, as can be seen from examining Equations 12 and 13, presented
earlier. Many commercial and experimental molds have features in common with
the N-Tec mold which suggest they may not be suitable for robust and reliable
experimentation. These data confirm, in the case of these kinds of tests, the
common belief that fluidity testing is unreliable and difficult to compare between
labs. Manufacturers marketing fluidity tests would likely benefit from more robust
procedures and tighter temperature and temperature gradient controls in their
equipment.
As mentioned in Section 2.4.1, previous work on repeatability had made use of
the MSV testing methodology. Before conducting further MSV testing, resources
within WPI‘s mathematics department in the person of a professor of statistics,
Dr. Petruccelli [103], about aspects of the MSV methodology which were of
concern. Though he agreed that the GR&R testing on which the MSV
methodology is based is sound, he shared the misgivings expressed about how
part variation is calculated for tests involving the destruction of samples. The
nature of the material available on MSV makes it difficult to see the mathematical
arguments that went into its design, as the books and papers which were
available are not intended for mathematicians but rather for technicians, but it
may be there is a solid foundation for these methods. Since the underlying math
cannot be evaluated (as it is not included with the algorithmic procedure), more
traditional statistical methods were employed throughout the rest of the work
(standard deviation of the mean, etc.) Review of the data collected previously
using such methods confirms the conclusions reached: the vacuum methodology

63
is closer to the desired level of refinement, but still needs work to increase
precision and accuracy.
4.4) Further Refinements and the Demonstration of Linear Superheat
As indicated in Section 3.4, multiple tests were taken for a series of
temperatures to establish the precision of the improved apparatus and
procedure. Results of these improvements are presented in a series of graphs.
Figures 4.4.A-D are the results of these experiments. Each is followed by
relevant discussion. The 9 cm offset mentioned in the procedure has been
subtracted from this data.
Mean fluidity of A356
10.00
12.00
14.00
16.00
18.00
20.00
22.00
660 680 700 720 740 760 780
Temperature (C)
len
gth
(cm
)
Figure 4.4.A: The mean values of the runs are presented along with the
standard deviations of the means.
When the mean and the standard deviations of the mean are depicted, the
overall linear trend becomes clear. As expected, a linear trend with respect to
superheat is observed. The linear trend and small standard deviation of the
mean indicates that this is an accurate and repeatable apparatus and procedure.

64
This response to increased superheat is the principle way of increasing fluidity in
practice. Two points at 680 C have been omitted for reasons discussed below.
A356 at 680 C
8
12
16
0 1 2 3 4
experiment run
flu
idit
y (
cm
)
Figure 4.4.B: Data points, mean, and standard deviation of the three
experimental runs taken at 680 C
Data in Figure 4.4.B are presented in chronological order. Please note the
different scale from the previous figure. Between the second and third points a
switch was replaced due to its failure. It is believed it was operating
intermittently during the first two runs, resulting in variable suction. The smaller
range (thus, smaller standard deviation) of the third data point and its
agreement with the overall linear trend support the contention that it represents
the correct value. Regardless, the three ranges are still within three standard
deviations of each another.

65
Fluidity of A356 at 700 C
15
20
25
30
35
Experiment
Flu
idit
y (
cm
)
Figure 4.4.C: Comparison of means and standard deviations of old MSV (green
squares) and new (blue diamonds) fluidity values at 700 C.
As can be seen, the new data are much more consistent, and the standard
deviations do not account for the variation seen in the old MSV experiments, but
do a good job of accounting for the variation in current testing. Please note the
different scale from above, and recall that the MSV results were collected by
three separate experimenters in accordance with the MSV procedure. The
contention was that the main cause for this variation was the measuring
procedure, and it seems that affixing the position of the eye doing the measuring
has greatly improved the reproducibility of results. (Discussion following testing
revealed that experimenters were measuring the lengths in subtly different
ways—the most variant feature was the ‗metal line,‘ from which measurements
were supposed to be taken.)
Sufficient improvements to the testing apparatus and experimental procedure
were made to move on to the next phase, testing of fluidity and its variation
when alloy additions consistent with the differences between primary and
secondary alloys are considered.
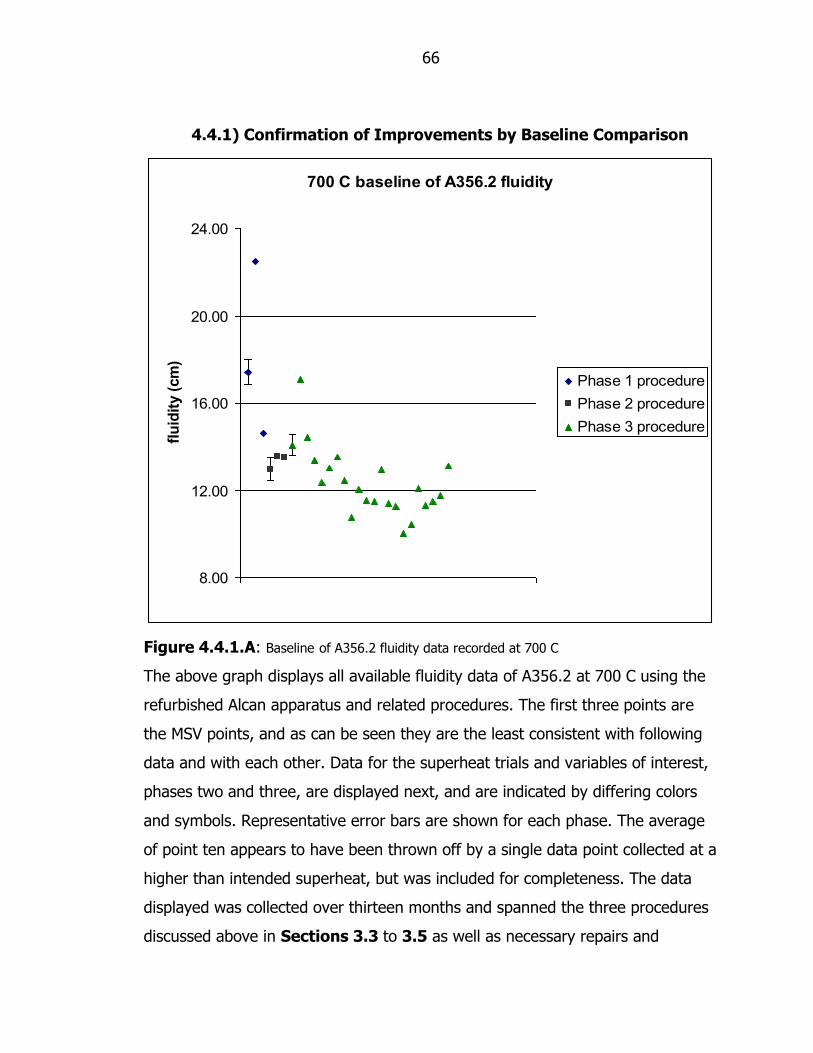
66
4.4.1) Confirmation of Improvements by Baseline Comparison
700 C baseline of A356.2 fluidity
8.00
12.00
16.00
20.00
24.00
0 40
flu
idit
y (
cm
)
Phase 1 procedure
Phase 2 procedure
Phase 3 procedure
Figure 4.4.1.A: Baseline of A356.2 fluidity data recorded at 700 C
The above graph displays all available fluidity data of A356.2 at 700 C using the
refurbished Alcan apparatus and related procedures. The first three points are
the MSV points, and as can be seen they are the least consistent with following
data and with each other. Data for the superheat trials and variables of interest,
phases two and three, are displayed next, and are indicated by differing colors
and symbols. Representative error bars are shown for each phase. The average
of point ten appears to have been thrown off by a single data point collected at a
higher than intended superheat, but was included for completeness. The data
displayed was collected over thirteen months and spanned the three procedures
discussed above in Sections 3.3 to 3.5 as well as necessary repairs and

67
adjustments to the apparatus and thermocouples and crucibles which were
successively repaired and replaced. The observed long term variation in the data
was compared to the barometric and relative humidity data from the Worcester
Airport at the time of testing, but no correlation was observed. It is possible that
the humidity and air pressure in the lab foundry vary with respect to different
factors as compared to that collected at the Worcester Airport. Such factors
include whether someone has performed a quenching experiment nearby, which
exhaust fans are running, whether the door is open, and may include other
factors. Given the variations in procedure, long length of time over which
experiments were run, mechanical and thermocouple failures, and other factors
this graph shows the present apparatus/procedure to be very reliable, but
underscores the need for taking baseline points at a known composition and
temperature for the highest accuracy. To confirm this represented a process
which was in control, a process control chart was generated, as shown below.
Control Chart
0
10
20
30
40
0 50 100 150 200 250 300
Data point number
Flu
idit
y (
cm
) UCL
LCL
X bar
Figure 4.4.1.B: Control Chart of A356.2 fluidity data recorded at 700 C for Phases 1 and 2

68
The above graph of the data, mean, upper and lower control limits shows that
the process is in a state of control, displaying common variation apart from one
point at 33.4 cm, which constitutes a special cause of error. In this case, the
special error was caused by opening the hydraulic valve before the thermocouple
reached either the melt temperature or the set temperature, resulting in
premature suction with a high superheat.
4.5) Application of Apparatus to Variables of Interest
As indicated in Section 3.5, multiple tests were taken for a series of
experimental conditions to establish the impact of those conditions on fluidity.
Results of these experiments are presented in a series of graphs. Figures
4.5.1.A-4.5.7.A are the results of these experiments. Each graph is followed by
relevant discussion. Unless otherwise indicated, all data was taken at 700 C.
4.5.1) Si Level Adjustment
Fluidity versus Si content at 700 C
10
12
14
16
6 6.5 7 7.5 8 8.5
Silicon content (%)
flu
idit
y (
cm
)
Figure 4.5.1.A: Impact of varied Si level on A356.2 fluidity at 700 C
The presence of additional silicon in commercial alloys, as opposed to pure and
commercially pure aluminum, is known to improve fluidity through increasing the

69
heat of fusion of the melt and through modifications of the morphology of the
solidifying melt. These tendencies, however, were studied on a much coarser
scale— investigations of binary Al-Si alloys over a relatively wide range of silicon
concentrations, or comparisons of different commercial alloys which again
involved relatively coarse changes in silicon concentration alloy to alloy. While it
is not the case that the rankings of the mean value of ten data points over five
varied compositions are always ordered from greatest to least silicon
concentration, it is the case that through successive experiments a trend can be
seen. Though difficult, changes due to Si content can be seen at this scale. The
large additions (6.3% Si and 8.1% Si) are slightly outside of the range of
acceptable chemistries for A356.2, while the smaller additions (6.4% Si and
7.6%Si) are right on the edge of those composition ranges. While it is difficult to
discern the difference between two silicon additions (7.6% Si and 8.1%Si), it is
very easy to distinguish between addition and removal (7.6% Si and 6.4% Si, for
instance), and possible to distinguish between the baseline average (7% Si) and
the smaller additions. The resolution at this number of experimental trials seems
to be +/- 0.5% Si. Again, the importance of this trial was not that Si improves
fluidity, but that the impacts of individual alloy constituents can be detected
within the range of an alloy specification for this kind of alloy.

70
Al-Si alloys at 700 C
8
12
16
20
24
28
6 8 10 12 14 16
percent Si
flu
idit
y (
cm
)
Figure 4.5.1.B: Comparison of hypereutectic binary Al-Si alloy at constant temperature to Si-
content modified A356.2
In Figure 4.5.1.B this linear trend is seen with respect to silicon content
continue as Si content increases. Hypereutectic silicon alloys are known to be
especially fluid up until 16 or 17% Si, though the specific maximum is dependent
on processing conditions and other aspects of the alloy such as copper and
phosphorous content. Note the larger scale in this figure as compared to
previous figures.

71
A356.2 with varied Si content at const. superheat
12
13
14
15
6.4 6.6 6.8 7 7.2 7.4 7.6
percent Si
flu
idit
y (
cm
)
Figure 4.5.1.C: Comparison of Al-Si alloys at constant superheat
In general, it is more appropriate to show fluidity data with constant superheat
as opposed to constant temperature, but data was recorded at constant
temperature for ease of comparison and to facilitate the baseline study discussed
in Section 4.4.1 above. This figure shows an even stronger linear correlation
between composition and fluidity, and the difference in fluidity at the extremes
of the allowed range of commercial alloy compositions is again apparent. Note
the smaller scale in this figure as compared to previous figures.

72
4.5.2) Fe and Mn Addition
Fe, Mn, and Fe+Mn addition at 700 C
8
10
12
14
base low Fe
(0.2%)
high Fe
(1%)
low Mn
(0.25%)
high Mn
(0.5%)
high Fe
(1%) high
Mn (0.5%)
additions
flu
idit
y (
cm
)
Figure 4.5.2.A: Impact of Fe and Mn addition on A356.2 fluidity at 700 C
Figure 4.5.2.A, above, investigates the impact of iron additions, manganese
additions, and iron combined with manganese along with a baseline. When a
small amount of iron is added to the melt, corresponding to the maximum
allowable iron content in A356 alloys, a small increase in fluidity is observed.
When higher iron levels are added, fluidity returns a point intermediate between
base and the low iron addition. Adding manganese to this high iron level in the
ratio of two parts iron to one part manganese used to arrest some of the
negative features associated with iron intermetallics does not greatly change the
fluidity observed as compared to the level reached through the addition of
significant quantities of iron alone. It should be noted that the larger iron
additions also include a larger quantity of pure aluminum, which dilutes the other
alloying constituents as discussed above in Figure 4.5.2.A, above, and this may
be mitigating the impact of additional added iron. As compared with the iron
additions, manganese does not have much of an impact, positive or negative, on
the fluidity of A356, either at the relatively low level corresponding to what is
permissible in the A356 specification, or at the higher level which might be more

73
typical of secondary alloys. The higher fluidity of combined iron and manganese
is most likely attributable to the iron content as opposed to the manganese
content. While there are negatives associated with excess manganese content,
such as sludge formation, they do not appear to be a threat to secondary alloy
fluidity. The higher iron and manganese levels investigated here suggest that the
higher fractions of these metals in secondary alloys do not have a marked
negative impact on fluidity, though other deleterious effects of these constituents
is well known, and other factors in secondary alloys may independently
negatively impact fluidity. It is also noteworthy that the effect of relatively small
iron additions can be detected.
4.5.3) Pure Aluminum
The fluidity of pure aluminum was measured at 670 C as discussed in the
Methodology section. Using the standard procedure, the fluidity was 51.2 +/-
0.5 cm, while measuring it directly with the eye approximately parallel to the
flow front a fluidity of 45.5+/- 0.4 cm was measured. As mentioned previously,
this discrepancy is due to the relatively large fluidity of pure aluminum. This
point is addressed in Section 5.1, Future Work. Pure aluminum demonstrates
very good fluidity, though this fluidity is known to be sensitive to very small
alloying additions.

74
4.5.4) Grain Refinement
TiBor additions into A356.2 at 700 C
9
11
13
15
0 50 100 150 200 250 300
grams TiBor added
flu
idit
y (
cm
)
Figure 4.5.4.A: Impact of TiBor grain refiner on fluidity of A356.2 at 700 C
The above data in Figure 4.5.4.A depict a single batch of metal to which
increasing levels of TiBor grain refiner has been added. The first data point is
unmodified A356.2 and all subsequent points (with a range of TiBor addition
between one and twelve times the recommended level of modification for
commercial castings) have equivalent fluidity. The second point is modified at the
commercial level. Fluidity remained constant when five to six times the
commercial level was added for the third point. After adding a total of ten to
twelve times the commercial modification level, no increase was observed. Past
research on the impact of TiBor addition has been mixed, but there is a general
consensus that the overall impact of grain modification is minor if present at all,
which is consistent with these results. This higher level of precision in testing
indicates TiBor addition is not a serious concern in this alloy at these
concentrations, which is favorable news for recycling and reuse of previously
refined materials.

75
4.5.5) Eutectic Modification (Sr)
Impact of Sr Addition on fluidity of 700 C A356.2
8
10
12
14
0.00% 0.04% 0.08% 0.12%
percent Sr added
flu
idit
y (
cm
)
base
low Sr
mid Sr
high Sr
Figure 4.5.5.A: Impact of strontium addition on fluidity of A356.2 at 700 C
The above graph, Figure 4.5.5.A, depicts three levels of strontium modification.
In comparing baseline A356.2 with very low strontium levels, commercial
modification, and twice the necessary strontium addition to achieve commercial
modification, a small dip in fluidity is observed at the level of commercial
modification but this dip disappears at higher levels of strontium. When much
higher levels of strontium are added, levels corresponding to those found in the
Mercalloy die casting alloys, a slight decrease in fluidity is again observed. This
decrease may be related to the change in surface tension brought about by the
change in viscosity, though these surface tension effects are small compared to
the impact of the vacuum on the metal. Strontium addition is known to
dramatically increase the viscosity of aluminum melts, as has been demonstrated
in the ACRC project on eutectic modification [104]. This increase in viscosity,
however, does not significantly impact casting fluidity. Strontium is also well
known for altering the morphology of the eutectic microstructure. Early fluidity
work, preceding Ragone‘s doctoral dissertation, continued to emphasize the role
viscosity played in casting fluidity, and some researchers still stress the supposed

76
impact of viscosity on fluidity [105]. Ragone showed in his dissertation that
fluidity did not play an important role in determining fluid length. The relative
unimportance of viscosity to casting fluidity is again underscored by these
results. This eutectic modification takes place too late in solidification to impact
the casting fluidity of this alloy.
4.5.6) Artificial Introduction of Oxides
Oxide additions at 700 C
8.00
10.00
12.00
14.00
0 142 401.8 497.6
grams Al powder added
flu
idit
y (
cm
)
Figure 4.5.6.A: Impact of 20 micron Al powder addition on A356.2 fluidity at 700 C
Given the volume of oxides added (half a kilogram into roughly 12 kilograms of
melt) and the known impact of diluting the silicon content of the melt, the
relatively constant response of A356.2 to oxide addition and deliberate melt
mishandling is surprising. In addition to the relatively slight decrease in the
mean, higher levels of aluminum powder addition were associated with a small
number of points with very low fluidity. Though this does not impact the mean to
a great extent, this variability would prove a hindrance to manufacturing
methodologies calling for very low scrap rates.

77
Increasing Borax Addition to 700 C A356.2
8
10
12
14
0 100 200 300 400 500 600
borax added (gm)
flu
idit
y (
cm
)
no addition
borax lv 1
borax lv 2
borax lv 3
Figure 4.5.6.B: impact of borax addition on the fluidity of 700 C A356.2
The above graph shows the more pronounced impact of very high additions of
borax and repeated melt mishandling on the fluidity of A356.2. Addition of
almost 200 g of borax had a barely noticeable negative impact on fluidity, but at
the higher levels of addition and after longer melt mishandling a decrease in
fluidity was observed. This decrease came from an increased number of low
fluidity tubes, rather than from a gradual lowering of the average. Even at the
highest level of borax addition, there were still some tubes whose fluidity was
comparable to that of the baseline. This increase in the spread of points led to
the increased standard deviation of the mean of the points visible at the higher
borax levels.

78
4.5.7) Degassing
Impact of degassing on 700 C A356.2
12
14
16
18
0 0.1 0.2 0.3 0.4
gas content (mL/cc)
flu
idit
y (
cm
)
Figure 4.5.7.A: Impact of degassing on fluidity of A356.2 at 700 C
The above graph, Figure 4.5.7.A, displays A356.2 metal at three different levels
of gas inclusion. The baseline, undegassed, point is leftmost in this figure. A
slight decrease in fluidity at the highest levels of degassing was observed, but
this decrease is within the variation of the baseline data. Previous work on the
effects of hydrogen levels on fluidity found no impact on fluidity within the limits
of experimental uncertainty, but that work was done with sand molds which have
slower solidification times and permit gas to escape through the porous sand.
This suggests that data collected elsewhere in this dissertation, which was
conducted without degassing, is applicable to degassed metal of like chemistry.
4.6) Predictive Modeling
Presented below are the results of modeling the refurbished apparatus discussed
previously in this dissertation.

79
Figure 4.6.A: Results of MAGMA modeling A356 at 680 C.
The above output from MAGMASOFT is the result of a model run on A356 at 680
C. As compared to the experimental results for this temperature, this length is
too short. Also noteworthy is that MAGMA assumes metal will flow at higher
fraction solids than are suggested by the literature. From this we can conclude
that MAGMA is unsuitable for the modeling of fluidity under these heat transfer
dominated conditions.

80
Figure 4.6.B: Results of CAPCAST modeling A356 at 700 C.
The above output from CAPCAST is the result of a model run on A356 at 700 C.
As compared to the experimental results for this temperature, the fluid length is
again underestimated. Also noteworthy is that a final fraction solid was input
manually based on knowledge from the literature. The necessity of manual input
undermines the tool's utility for prediction of fluidity in the absence of good data
on what fraction solid results in flow stoppage, and often the literature is unclear
as to when flow stoppage will occur under circumstances similar to fluidity
testing.
It would seem that both of the major casting modeling software packages do not
accurately predict flow stoppage in narrow channels where heat transfer is an
important factor. (Experiments showing agreement between modeling and lab
testing for gravity-filled sand spirals have been published by Di Sabatino [56].)
While these packages may be suitable for bulk filling, it seems further work is
needed in the area of filling thin sections.

81
Based on these data, it seems that fluidity testing remains vital. One of the
dangers of models such as these is that they yield plausible, colorful results, and
if there is no experiment to compare them to, users may be insufficiently
skeptical.
These software packages do not, at present, simultaneously model the solidifying
material on the micro and macro scales. Instead, rheological information for
material at various fraction solids is present in a database. Presumably, the
databases are assuming flow at higher fraction solids because of data conducted
under conditions more like those in a die casting. This database lookup method
does not account for the mechanisms known to take place during choking in
fluidity tests, where metal is nucleated near the inlet, flows, coarsens, and
eventually chokes off flow through agglomeration with other grains. Work is
underway by groups with access to powerful radiation sources to directly observe
nucleation and growth of metals, and it is possible that future models running on
faster computers incorporating additional kinds of heterogeneous multiphase
flow will be able to directly address this problem.
Data from these experiments, especially those detailed in Section 4.4 may
constitute sufficient information to assist the improvements of these databases
for A356 (when coupled with Flemings' equation 4), and if so, further fluidity
experiments with other alloys of interests may help to populate that database.
Such work would require close cooperation from the software publisher, as they
would be the ones most able to identify when and how such a database module
would be consulted. These data are certainly not suitable for replacing the
portions of code that handle bulk filling. In sum, from these analyses it can be
concluded that the three modeling softwares examined do not predict fluidity
with fidelity to experimental data. This further underscores the need for robust
experimental methods such as those developed here for fluidity testing.

82
5 CONCLUSIONS:
1. An improved testing apparatus and procedure capable of producing
precise, accurate, and consistent results has been developed and tested.
2. Certain existing tools to evaluate fluidity have been demonstrated to have
limitations, and an alternative method has been described in
detail. Through MSV testing, multi-fingered permanent mold tests
designed for qualitative testing have been shown to be unsuitable for
adaptation as robust quantitative tests, though their use in this capacity is
not unknown.
3. Work has been done demonstrating a capability of measuring fluidity
changes within an alloy‘s specified chemistry range as that chemistry is
changed, which has only previously been achieved in eutectic alloys.
4. The introduction of oxides has been shown to impact both the mean and
the range of fluidity, though A356 remained quite fluid at intermediate
levels of oxide addition.
5. Compounds more common in secondary alloys, iron and manganese, were
found not to negatively impact the fluidity of this alloy.
6. Degassing also had very little impact on fluidity.
7. Similarly, high levels of strontium and grain refiner addition had relatively
little impact on fluidity. his is particularly noteworthy, as strontium is
known to have a major influence on melt viscosity; thus fluidity is shown
to be relatively invariant to changes in melt viscosity.
8. As modeling improves, comparing simple models such as the filling of a
thin glass tube by vacuum and subsequent flow choking will remain a
valuable check to see if improvements have been made in determining the
conditions under which flow stops. These improvements are quite
important given the popularity of modeling techniques in industrial

83
practice. Consequently, recommendations are given in Section 4.6 for
how these research data might be incorporated into solidification models.
9. Superheat remains the dominant factor in fluidity.
10. Accurate analysis of necessary superheat temperatures will allow for a
reduction either of cycle time or scrap rate. This quantitative capability will
help to meet productivity goals.
11. Now that the variations are understood and equations are available to
estimate the fraction of samples which have a lower fluidity as compared
to the mean in terms of a series of measurable experimental parameters,
casters will have a greater degree of control over their products, especially
those possessing thin sections.
12. These improved testing procedures will allow for improved communication
between research groups and greater confidence in fluidity testing results.

84
5.1) Future Work
At present, the apparatus consists of a number of adjustable components
produced from a lab stand. The relative position of these components
should be fixed.
For reduced error at high fluidity, the ruler should be moved closer to the
crucible and glass tube. Direct measurement of angle followed by
conversion to height through an instrument similar to an astrolabe or
cross-staff would be an alternative improvement.
As computer vision research improves, it will likely become practical to
automate measuring fluid length with off-the-shelf equipment.
As mentioned above, continued comparison between casting fluidity and
modeling remains an important test of models.
Testing in this dissertation has largely been confined to A356.2 and
modifications of A356.2. Application of this apparatus to other alloys
would seem worthwhile.
Work remains to promote this as the standard test. Relevant publications
are planned.

85
6 REFERENCES:
1. Di Sabatino, M., Fluidity of Aluminum Foundry Alloys, in Materials Science
and Engineering. 2005, NTNU: Trondheim, Norway. p. 161.
2. Ragone, D.V., J. Adams, C. M., and H.F. Taylor, Some factors affecting
fluidity of metals. Transactions of the American Foundrymen's Society, 1956.
64: p. p640.
3. Ragone, D.V., J. Adams, C. M., and H.F. Taylor, A new method for
determining the effect of solidification range on fluidity. Transactions of the
American Foundrymen's Society, 1956. 64: p. 653-7.
4. Flemings, M.C., Fluidity of metals-- techniques for producing ultra-thin
section castings. British Foundryman, 1964. 57: p. 312.
5. Flemings, M.C., Solidification Processing. 1974, New York: McGraw-Hill.
6. Flemings, M.C., E. Niyama, and H.F. Taylor, Fluidity of Aluminum Alloys:
An experimental and quantitative evaluation. Transactions of the American
Foundrymen's Society, 1961. 69: p. 625-635.
7. Niesse, J.E., M.C. Flemings, and H.F. Taylor, Applications of Theory in
Understanding Fluidity of Metals. Transactions of the American
Foundrymen's Society, 1959. 67: p. 685.
8. Qudong, W., et al., Study on the fluidity of AZ91+xRE magnesium alloy.
Materials Science and Engineering, 1999. A271: p. 109-115.
9. Sin, S.L. and D. Dube, Influence of process parameters on fluidity of
investment-cast AZ91D magnesium alloy. Materials Science & Engineering A
(Structural Materials: Properties, Microstructure and Processing), 2004.
A386(1-2): p. 34-42.
10. Kim, J.-M., et al. Development of Mg-Al-Zn based diecasting alloys for
elevated temperature applications. 2005. Beijing, China: Trans Tech
Publications Ltd, Zurich-Ueticon, CH-8707, Switzerland.
11. Bottger, B., et al., Controlling Microstructure in Magnesium Alloys: A
Combined Thermodynamic, Experimental and Simulation Approach.
Advanced Engineering Materials, 2006. 8(4): p. 241-247.
12. Yim, C.D., et al., Effects of melt temperature and mold preheating temperature
on the fluidity of Ca containing AZ31 alloys. Journal of Material Science,
2006. 41: p. 2347-2350.
13. Lu, Y.Z., et al., Effects of silicon on microstructure, fluidity, mechanical
properties, and fracture behaviour of Mg-6Al alloy. Materials Science and
Technology, 2001. 17(2): p. 207-14.
14. Wein, O., Viscometric flow under apparent wall slip in parallel-plate geometry.
Journal of Non-Newtonian Fluid Mechanics, 2005. 126: p. 105-114.
15. White, F.M., Fluid Mechanics. 3rd. ed. 1994, New York: McGraw-Hill, Inc.
16. Campbell, J., Castings. 1993, Oxford ; Boston: Butterworth-Heinemann.
17. Kaufmann, H., W. Franger, and P.J. Uggowitzer, Influence of variation in
alloy composition on castability and process stability. Part 2: Semi-solid casting
processes. International Journal of Cast Metals Research, 2005. 18(5): p. 279-
285.

86
18. Kaufmann, H., W. Franger, and P.J. Uggowitzer, Influence of variation in
alloy composition on castability and process stability. Part 1: Gravity and
Pressure casting processes. International Journal of Cast Metals Research,
2005. 18(5): p. 273-278.
19. Unsworth, W. and J. King, NEW HIGH PERFORMANCE CASTING ALLOY
DEVELOPED. Metallurgia, 1986. 53(5): p. 199-200.
20. Kondic, V., Liquid Metal Properties- Effect on the casting fluidity of alloys.
Foundry Trade J, 1950. 88: p. 691.
21. Southin, R.T. IMPROVING FLUIDITY IN CAST METALS. 1982. Sydney,
Aust: Australas Inst of Met, Parkville, Aust.
22. Southin, R.T. and A. Romeyn. EFFECTS OF MOULD COATS ON
FLUIDITY. 1983. Coventry, Engl: Metals Soc (Book 273), London, Engl.
23. Dahle, A.K., et al., Effect of grain refinement on the fluidity of two commercial
Al-Si foundry alloys. Metallurgical and Materials Transactions A (Physical
Metallurgy and Materials Science), 1996. 27A(8): p. 2305-13.
24. Di Sabatino, M., et al., An improved method for fluidity measurement by
gravity casting of spirals in sand moulds. International Journal of Cast Metals
Research, 2005. 18: p. 59-62.
25. Kim, J.M. and C.R. Loper, Effect of Solidification Mechanism on Fluidity of
Al-Si Casting Alloys. Transactions of the American Foundrymen's Society,
1995(103): p. 521.
26. Di Sabatino, M. and L. Arnberg, Effect of grain refinement and dissolved
hydrogen on the fluidity of A356 alloy. International Journal of Cast Metals
Research, 2005. 18: p. 181-186.
27. Di Sabatino, M., et al., Fluidity evaluation methods for Al-Mg-Si alloys.
International Journal of Cast Metals Research, 2005.
28. Di Sabatino, M., et al. The influence of oxide inclusions on the fluidity of Al-
7wt.%Si alloy. in International Conference on Advances in Solidification
Processes. 2005. Stockholm, Sweden.
29. Dahle, A.K. and L. Arnberg, Effect of grain refinement on the fluidity of
aluminium alloys. Materials Science Forum, 1996. 217-222(pt 1): p. 259-264.
30. Nafisi, S., et al. Effects of different fraction solids on the fluidity of rheocast
356 Al-Si alloy. 2004. Charlotte, NC., United States: Minerals, Metals and
Materials Society, Warrendale, United States.
31. Niyama, E., et al., Some basic research for thin-wall casting technology.
Journal of Materials Processing Technology, 1997. 63(1-3): p. 779-783.
32. Pai, B.C. and H. Jones, EFFECT OF EXPERIMENTAL VARIABLES ON
CASTING FLUIDITY AND FLUID LIFE OF LIQUID TIN. Materials
Science and Technology, 1985. 1(5): p. 398-404.
33. McParkland, A.J., Fluidity and Macrosegregation in Al--Si Alloys
Solidification Processing, 1988: p. 323-326.
34. Pai, B.C. and H. Jones. Casting fluidity of partially solid Sn-Pb alloy slurries
made by stirring within the freezing range. in Solidification Technology in the
Foundry and Cast House, Proceedings of an International Conference. 1983.
Coventry, Engl.

87
35. Di Sabatino, M., et al. Influence of temperature and alloying elements on
fluidity of Al-Si alloys. in Shape casting. The John Campbell Symposium.
Proceedings of a Symposium Sponsored by the Aluminum Committee of the
Light Metals Division (LMD) and the Solidification Committee of the Materials
Processing and Manufacturing Division of TMS. Held at the 2005 TMS Annual
Meeting. 2005. San Francisco, CA, USA: Minerals, Metals & Materials Soc.
36. Metalhealth manual. 3.0 ed. june 2006: N-Tec Limited. 45.
37. Kwon, Y.D., K.H. Kim, and Z.-H. Lee. Casting properties of Al-4.8Cu-0.6Mn
alloy. 2001. New Orleans, LA: Minerals, Metals and Materials Society.
38. Kwon, Y.-D. and Z.-H. Lee, The effect of grain refining and oxide inclusion on
the fluidity of Al-4.5Cu-0.6Mn and A356 alloys. Materials Science and
Engineering A, 2003. 360(1-2): p. 372-376.
39. Han, Q. and H. Xu, Fluidity of alloys under high pressure die casting
conditions. Scripta Materialia, 2005. 53(1): p. 7-10.
40. Goodwin, F.E., et al. Progress in Development of Thin Section Zinc Die
Casting Technology. in 110th metalcasting congress: NADCA. 2006.
Columbus, Ohio: NADCA.
41. Rollez, D., M. Gilles, and N. Erhard, Ultra Thin Wall Zinc Die Castings. Die
Casting Engineer, 2003. 47(2): p. 32-35.
42. Kondic, V., Experimenting with the measurement of fluidity in the casting of
metals. Metals and Materials, 1972. 6(10): p. 440-1.
43. Kim, K.-T., et al. Effect of alloying elements on the strength and casting
characteristics of high strength Al-Zn-Mg-Cu alloys. 2005. Beijing, China:
Trans Tech Publications Ltd, Zurich-Ueticon, CH-8707, Switzerland.
44. Chandraseckariah, H.S. and S. Seshan, Effect of Foundry Variables on
Fluidity of Investment-Cast Nickel-Base Superalloys. Transactions of the
American Foundrymen's Society, 1995(102): p. 855.
45. Gokan, Y., et al. Development of heat resistant Mg-Zn-Al-Ca-RE diecasting
alloys. in Materials Science Forum. 2003. Osaka, Japan: Trans Tech
Publications Ltd.
46. Campbell, J., Thin wall castings. Materials Science and Technology, 1988.
4(3): p. 194-204.
47. Nicom, N. and H. Nomura, Molten metal flow through solid network in semi-
solid Al-Si alloy. Materials Transactions, 2005. 46(8): p. 1897-902.
48. Roach, S.J. and H. Henein, A new Method to Dynamically Measure the
Surface Tension, Viscosity, and Density of Melts. Metallurgical and Materials
Transactions B, 2005. 36B(October 2005): p. 667-676.
49. Liu, L. and F.H. Samuel, Assessment of melt cleanliness in A356.2 aluminium
casting alloy using the porous disc filtration apparatus technique. Part II:
Inclusion analysis. Journal of Materials Science, 1997. 32(22): p. 5927-44.
50. Ware, T.N., et al. Effect of Sr, Na, Ca and P on the castability of foundry alloy
A356.2. 2002. Columbus, OH, United States: ASM International.
51. Koursaris, A., RELATIONSHIPS BETWEEN PHASE DIAGRAM AND
CASTING CHARACTERISTICS. FWP Journal, 1985. 25(2): p. 29-32.

88
52. Chirkov, E.F., Y.M. Dolzhanski, and I.N. Fridlyander, Change of fluidity of
aluminum superalloy 1151 (Al-Cu-Mg) during its alloying by transition metals.
Materials Science Forum, 2000. 331-337(pt.1): p. 331-6.
53. Portevin, A. and P. Bastien, Castability of ternary alloys. Journal of the
Institute of Metals, 1936. 54(1): p. p 45-58.
54. Ravindran, K. and R.W. Lewis, Finite element modelling of solidification
effects in mould filling. Finite Elements in Analysis and Design, 1998. 31(2):
p. 99-116.
55. Bermudez, A. and J. Durany. MATHEMATICAL MODEL FOR THE
SOLIDIFICATION OF METAL CASTING IN A MOLD. 1983. Nantes, Fr:
North-Holland, Amsterdam, Neth.
56. Di Sabatino, M., L. Arnberg, and F. Bonollo, Simulation of fluidity in Al-Si
alloys. Metallurgical Science and Technology, 2005.
57. Heinrich, J.C. and D.R. Poirier, The effect of volume change during
directional solidification of binary alloys. Modelling Simul. Mater. Sci. Eng.,
2004. 12: p. 881-899.
58. Felicelli, S.D. and D.R. Poirier. Modeling of solidification and filling of thin-
section castings. in Proceedings of the ASME Summer Heat Transfer
Conference. 2005.
59. Flemings, M.C., Behavior of Metal Alloys in the Semisolid State. Metallurgical
Transactions A, 1991. 22A: p. 269-93.
60. Backerud, L., E. Krol, and J. Tamminen, Solidification Characteristics of
Aluminum Alloys Volume 1: Wrought Alloys. 1986.
61. Backerud, L., G. Chai, and J. Tamminen, Solidification Characteristics of
Aluminum Alloys-Volume 2: Foundry Alloys. 1986.
62. Apelian, D., et al., Science and Technology of Semi-Solid Metal Processing, ed.
deFigueredo. 2001, Rosemont, IL: North American Die Casting Association.
63. Kambel, S. and C. Ravindran, Primary Silicon Crystals and Flow Stoppage in
Hypereutectic Al-Si Alloys. AFS Transactions, 2006: p. 1-11.
64. Kim, M., J. Hwang, and H. Kwon, Effect of Squeeze Cast Process Parameters
on Fluidity of Al-Si Alloy. AFS Transactions, 2006.
65. Shankar, S., Y.W. Riddle, and M.M. Makhlouf, Eutectic Solidification of
Aluminum-Silicon Alloys. Metallurgical and Materials Transactions A, 2004.
35A.
66. Bonollo, F., et al. Evaluation of Fluidity in Aluminum Alloys. in Euromat
2001: 7th European conference on advanced materials and processes. 2001.
Rimini, Italy.
67. Couper, M.J., et al., The effect of Ti content on microstructure, castability and
properties of foundry alloy A356.2. JOM, 2004. 56(11): p. 288.
68. Sanchez, S., et al., Effect of Titanium and Strontium Addition on the Fluidity
of A319 and A356 Aluminum Alloys. Materials Science Forum, 2006.
509(March 2006): p. 159-164.
69. Spittle, J.A., Grain refinement in shape casting of aluminium alloys.
International Journal of Cast Metals Research, 2006. 19(4).
70. Young-Dong, K. and L. Zin-Hyoung, The effect of grain refining and oxide
inclusion on the fluidity of Al-4.5Cu-0.6Mn and A356 alloys. Materials Science

89
& Engineering A (Structural Materials: Properties, Microstructure and
Processing), 2003. A360(1-2): p. 372-6.
71. Donahue, R.J. and A. Kopper. High Ductility Die Casting With Very High
Strontium Additions. in Proceedings of the American Foundry Society
International Conference on High Integrity Light Metal Castings. 2005.
Indianapolis, IN.
72. Ravi, K.R., et al., Influence of Interrfacial Reaction on the Fluidity of A356 Al-
SiCp Composites-- A Theoretical Approach. Metallurgical and Materials
Transactions A, 2007. 38A(October 2007): p. 2531-2539.
73. Geiger, G.H. and F.R. Poirier, Transport Phenomina in Metallurgy. 1973,
Reading, MA: Addison-Wesley.
74. Branion, R.V., MOLD FLUXES FOR CONTINUOUS CASTING. Iron &
Steelmaker, 1986. 13(9): p. 41-50.
75. Dauby, P.H., W.H. Emling, and R. Sobolewski, LUBRICATION IN THE
MOLD: A MULTIPLE VARIABLE SYSTEM. Iron & Steelmaker, 1986. 13(2):
p. 28-36.
76. Farouk, B., D. Apelian, and Y.G. Kim, A Numerical and Experimental Study
of the Solidification Rate in a Twin-Belt Caster. Metallurgical Transactions B,
1992. 23B.
77. Griffiths, W.D. and D. Whitworth, The effect of die coating on fluidity in the
gravity die casting of aluminium. FTJ, 2006: p. 61-64.
78. Jensen, E.K., et al. HEAT TRANSFER MEASUREMENTS DURING DC
CASTING OF ALUMINIUM. PART II: RESULTS AND VERIFICATION
FOR EXTRUSION INGOTS. 1986. New Orleans, LA, USA: Metallurgical
Soc of AIME, Warrendale, PA, USA.
79. Luck, R., et al., The Determination of Accurate Heat Transfer Coefficient Data
for Permanent Mold Aluminum Alloy Casting -- The Results of an AFS
Research Project. AFS Transactions, 2006: p. 1-9.
80. Ramesh, A. and S.V. Sabasivam, Effect of Mould Materials on the Mould-
Metal Interfacial Thermal Resistance in Squeeze-Casting. AFS Transactions,
2006: p. 1-15.
81. Sabau, A.S. In-Situ Measurements of Heat Flux During Lubricant Spray
Application in Die Casting. in 110th metalcasting congress. 2006. Columbus,
Ohio: NADCA.
82. Sabau, A.S., Measurement of heat flux at the metal/mould interface during
casting solidification. International Journal of Cast Metals Research, 2006.
19(3): p. 188-194.
83. Venkatesan, A. and A. Rajadurai, Transient Interfacial Heat Transfer
Coefficient Equations for Casting Solidification in Permanent Mould. AFS
Transactions, 2006.
84. Greer, A.L., Liquid Metals Supercool order. nature materials, 2006. 5: p. 13-
14.
85. Oh, S.H., et al., Ordered Liquid Aluminum at the interface with Sapphire.
Science, 2005. 310: p. 661-663.
86. Showman, R.E., R.C. Aufderheide, and N.P. Yeomans, Using "Gate
Extensions" to Produce Thin-Wall Castings. AFS Transactions, 2006: p. 1-9.

90
87. Volkmar, A.P., Effectively Using Gage R&R and MEasurement Systems
Variability. Modern Casting, 1993: p. 30-33.
88. Petruccelli, J.D., B. Nandram, and M. Chen, Applied Statistics for Engineers
and Scientists. 1st. ed. 1999, Upper Saddle River, New Jersey: Prentice Hall.
944.
89. Measurement Systems Analysis. Third ed. March 2002: DaimlerChrysler
Corporation, Ford Motor Company, General Motors Corporation.
90. Parmenter, L.A., Development of a Statistically Optimized Test Method for the
Reduced Pressure Test, in Materials Science and Engineering. 1997, Worcester
Polytechnic Institute: Worcester.
91. Bevington, P.R. and D.K. Robinson, Data Reduction and Error Analysis for
the Physical Sciences. 2nd ed. 1992.
92. Box, G.E.P., W.G. Hunter, and J.S. Hunter, Statistics for Experimenters: An
introduction to Design, Data Analysis, and Model Building. 1978, New York:
John Wiley & Sons.
93. Phillies, G.D.J., Elementary Lectures in Statistical Mechanics. 2000, New
York: Springer.
94. Measurement Systems Analysis. Third ed. 2002: DaimlerChrysler
Corporation, Ford Motor Company, General Motors Corporation.
95. Taylor, J.R., An Introduction to Error Analysis Second Ed. ed. 1997,
Sausalito, CA: University Science Books.
96. Gwyn, M.A. and F. Schleg, DEVELOPING A CONCEPTUAL FRAMEWORK
FOR COST-EFFECTIVE CASTING DESIGN. Modern Casting, 1985. 75(9):
p. 31-35.
97. Jolly, M., Prof. John Campbell's Ten Rules for Making Reliable Castings.
JOM, 2005.
98. Neff, D.V., Evaluating molten metal cleanliness for producing high integrity
aluminum die castings. Die Casting Engineer, 2004. 48(5): p. 24-30.
99. Dewhirst, B., et al. Castability Measures for Diecasting Alloys: Fluidity, Hot
Tearing, and Die Soldering. in Proceedings of the 4th International High Tech
Die Casting Conference, HTDC. 2008. Brescia, Italy.
100. Dewhirst, B., et al., Castability Measures for Diecasting Alloys: Fluidity, Hot
Tearing, and Die Soldering. La Metallurgia Italiana, 2008.
101. Furlong, C., Ph.D. 2007.
102. Gennert, M.A. 2007.
103. Petruccelli, J.D. 2007.
104. Pan, Q.Y., et al., Optimization of 380 Alloy for Semi-Solid Processing. NADCA
Transactions, 2005.
105. Ravi, K.R., et al., Fluidity of aluminum alloys and composites: A review.
Journal of Alloys and Compounds, 2008. 456: p. 201-210.

91
APPENDICES:
Appendix A: Fluidity Testing Data
Appendix B: Consortium Survey and Results
Appendix C: Castability Measures for Diecasting Alloys: Fluidity, Hot Tearing,
and Die Soldering
Appendix D: Flemings‘ Equation Derivations
Appendix E: Pumping Calculations
Appendix F: Calibration Nomogram
Appendix G: Microstructure Schematic
Appendix H: Phase 1 Procedures
Appendix I: Phase 2 Procedure
Appendix J: Phase 3 Procedure

92
Appendix A
Fluidity Testing Data

93
The following are the data used to generate the presented charts in Section 4 Results and Discussion. fluidity_eval update.xls
temp (C.) length (cm) date
605 4.13 8/30/2006 * 'thermo after' method
677 6.19 9/7/2006 * 4 mm tube
615 4.4 9/7/2006 * 400 C mould
650 3.2 9/8/2006 * vac. first, surface slurp
616 4.8 9/8/2006
605 6 9/8/2006
707 5.1 8/28/2006 * 'thermo after' method
613 5.16 8/30/2006 * 5 mm tube
611 4.13 9/7/2006 * 400 C mould
606 9.21 9/7/2006 * vac first, surface slurp
611 6.7 9/8/2006
616 6.4 9/8/2006
633 6.83 12-Sep * all 5mm tube data
687 8.26 12-Sep * all with 'thermo in' method
746 7.94 12-Sep * 800 C
779 7.94 12-Sep * vac first, surface slurp
795 8.57 21-Sep
743 6.03 21-Sep
763.3 6.68 28-Sep
742.3 6.99 28-Sep
676.1 6.35 28-Sep
746.1 9.83 10/2/2006 * all 5mm tube data
741.6 7.62 10/2/2006 * all with 'thermo in' method
764.2 5.4 10/2/2006 * 800 C
785.9 8.89 10/2/2006 * vac first, surface slurp
642.6 6 10/5/2006
706.1 5.4 10/5/2006
717.5 5.72 10/5/2006
730.9 9.8 10/5/2006
714.5 11.7 10/5/2006
688.6 6.4 10/10/2006
680 4 10/12/2006 as above, tube extracted to measure
642 9 10/12/2006 as above, tube extracted to measure
649 11.8 10/12/2006 as above, tube extracted to measure
655 11.5 10/12/2006 as above, tube extracted to measure
654.4 9.5 10/12/2006 as above, tube extracted to measure
768 18 10/10/2006 * all 5mm tube data

94
775 16.7 10/10/2006 * all with 'thermo in' method
760.5 17 10/10/2006 * 800 C
792 14.5 10/10/2006 submerged tube during suck
699.2 12.4 10/10/2006
718.5 20.3 10/12/2006 as above, tube extrated to measure
Below
761.7 33 10/17/2006 * all 5mm tube data
759 32.7 3.5 10/17/2006 * all with 'thermo in' method
805.5 35 7 10/17/2006 * 800 C
775 32.5 4 10/17/2006 submerged tube first, then turned valve
710 24.5 4.5 10/17/2006 tube extrated to measure
760 25.7 7 10/17/2006
775 32.3 3.5 10/17/2006
775.1 32.7 4 10/17/2006
809.8 37.5 9 10/19/2006
775 33 8.5 10/19/2006
775 33.3 8 10/19/2006
750 29 40 10/19/2006
760 32.5 85 10/19/2006
790.7 32 70 10/24/2006
710 26 70 10/24/2006
739.8 26 7 10/24/2006
665 20.7 5.5 10/24/2006
775 35.5 7 10/24/2006
MSV data.xls
Dew Vac KS Vac SL Vac
Dew Ntec
KS Ntec SL Ntec
1 255 520.7 237 678 793.26 631
2 244 304.8 240 607 300.015 537
3 122 317.5 210 302 742.41 1071
4 297 304.8 242 566 750.04 858
5 273 317.5 236 317 635.625 784
6 244 304.8 239 360 931 823
7 289 317.5 237 731 883 954
8 264 320 234 800 675 822
9 134 322.6 236 835 665 906
10 259 325.1 251 375 500 583
11 330 sp
zero 248
one 270
n.b. all units mm
* Data for the bold numbers was replaced by the zero and one values in the following calculations
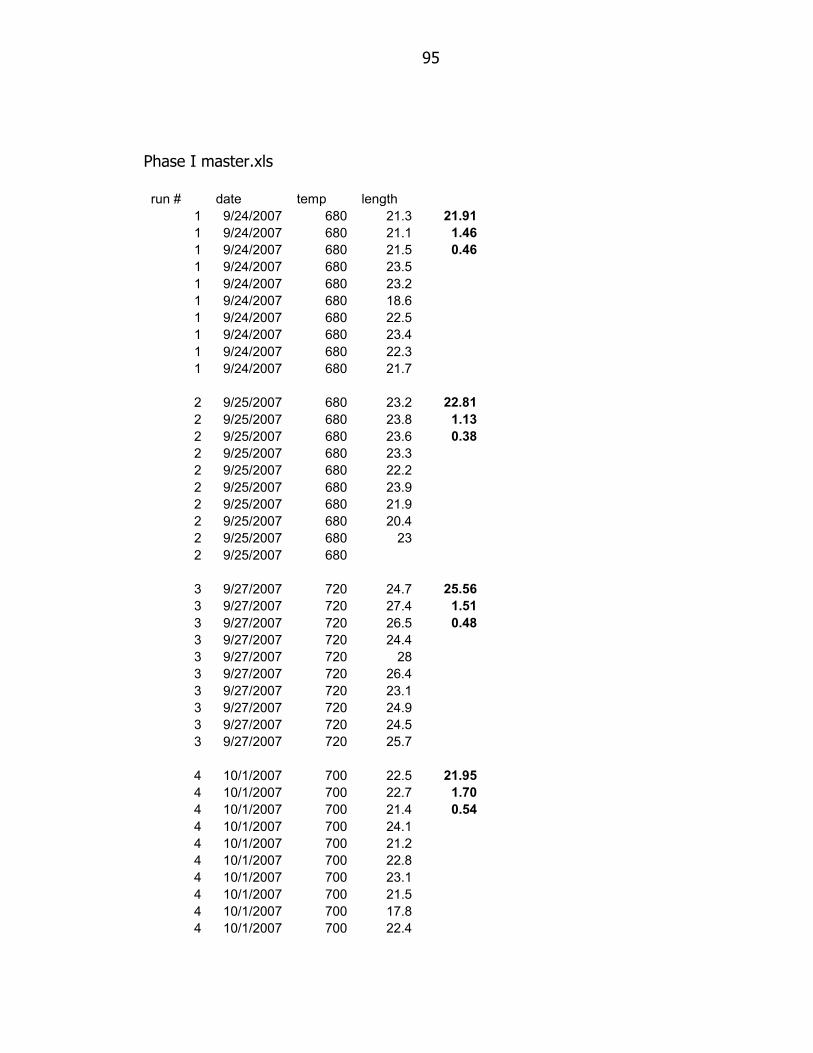
95
Phase I master.xls run # date temp length
1 9/24/2007 680 21.3 21.91
1 9/24/2007 680 21.1 1.46
1 9/24/2007 680 21.5 0.46
1 9/24/2007 680 23.5
1 9/24/2007 680 23.2
1 9/24/2007 680 18.6
1 9/24/2007 680 22.5
1 9/24/2007 680 23.4
1 9/24/2007 680 22.3
1 9/24/2007 680 21.7
2 9/25/2007 680 23.2 22.81
2 9/25/2007 680 23.8 1.13
2 9/25/2007 680 23.6 0.38
2 9/25/2007 680 23.3
2 9/25/2007 680 22.2
2 9/25/2007 680 23.9
2 9/25/2007 680 21.9
2 9/25/2007 680 20.4
2 9/25/2007 680 23
2 9/25/2007 680
3 9/27/2007 720 24.7 25.56
3 9/27/2007 720 27.4 1.51
3 9/27/2007 720 26.5 0.48
3 9/27/2007 720 24.4
3 9/27/2007 720 28
3 9/27/2007 720 26.4
3 9/27/2007 720 23.1
3 9/27/2007 720 24.9
3 9/27/2007 720 24.5
3 9/27/2007 720 25.7
4 10/1/2007 700 22.5 21.95
4 10/1/2007 700 22.7 1.70
4 10/1/2007 700 21.4 0.54
4 10/1/2007 700 24.1
4 10/1/2007 700 21.2
4 10/1/2007 700 22.8
4 10/1/2007 700 23.1
4 10/1/2007 700 21.5
4 10/1/2007 700 17.8
4 10/1/2007 700 22.4

96
5 10/1/2007 740 26.7 27.99
5 10/1/2007 740 29 1.04
5 10/1/2007 740 27.5 0.33
5 10/1/2007 740 28
5 10/1/2007 740 28.4
5 10/1/2007 740 28
5 10/1/2007 740 28.6
5 10/1/2007 740 27.2
5 10/1/2007 740 29.9
5 10/1/2007 740 26.6
6 10/2/2007 700 20 22.53
6 10/2/2007 700 21.6 1.08
6 10/2/2007 700 23.5 0.34
6 10/2/2007 700 22.2
6 10/2/2007 700 22.7
6 10/2/2007 700 22.9
6 10/2/2007 700 23.4
6 10/2/2007 700 23.5
6 10/2/2007 700 22.4
6 10/2/2007 700 23.1
7 10/2/2007 740 26.7 28.09
7 10/2/2007 740 27.5 1.03
7 10/2/2007 740 29 0.33
7 10/2/2007 740 28.3
7 10/2/2007 740 28
7 10/2/2007 740 26.7
7 10/2/2007 740 28.7
7 10/2/2007 740 29
7 10/2/2007 740 29.7
7 10/2/2007 740 27.3
8 10/2/2007 760 28.1 30.52
8 10/2/2007 760 27.7 1.53
8 10/2/2007 760 30.5 0.48
8 10/2/2007 760 31.4
8 10/2/2007 760 31.1
8 10/2/2007 760 31.7
8 10/2/2007 760 32.2
8 10/2/2007 760 31.8
8 10/2/2007 760 30.1
8 10/2/2007 760 30.6
9 10/11/2007 700 18.8 22.49
9 10/11/2007 700 24.5 1.86
9 10/11/2007 700 22.4 0.59
9 10/11/2007 700 23
9 10/11/2007 700 22.3
9 10/11/2007 700 23.8

97
9 10/11/2007 700 20.6
9 10/11/2007 700 21.2
9 10/11/2007 700 23.6
9 10/11/2007 700 24.7
10 10/11/2007 680 19.6 19.72
10 10/11/2007 680 20.3 0.75
10 10/11/2007 680 19.4 0.24
10 10/11/2007 680 20.2
10 10/11/2007 680 20.5
10 10/11/2007 680 18.6
10 10/11/2007 680 18.6
10 10/11/2007 680 20.8
10 10/11/2007 680 19.7
10 10/11/2007 680 19.5
11 11/2/2007 720 25.7 25.41
11 11/2/2007 720 24.55 0.67
11 11/2/2007 720 26.6 0.21
11 11/2/2007 720 25.8
11 11/2/2007 720 25.2
11 11/2/2007 720 24.7
11 11/2/2007 720 25.5
11 11/2/2007 720 25.9
11 11/2/2007 720 25.6
11 11/2/2007 720 24.5
12 11/2/2007 760 30.3 30.11
12 11/2/2007 760 30.1 0.92
12 11/2/2007 760 28.2 0.29
12 11/2/2007 760 29.3
12 11/2/2007 760 29.5
12 11/2/2007 760 30.7
12 11/2/2007 760 31.2
12 11/2/2007 760 30.7
12 11/2/2007 760 31.1
12 11/2/2007 760 30
Phase II master.xls (degassing) no degassing 1-25
no degas 1-24
no degas 1-28
degas high.a
degas high.b
degas high.c
22.8 22.6 22.9 21 27.3
23.2 23.3 22.4 20.4 24.6 24.3
26.1 22.3 23.7 20.1 23.4 21.5
24.2 24.1 23.8 20.6 26.2 23.6
33.4 22.8 22.7 23.5 24 23.7
25.5 22.7 23.3 22.3 26 22.3
23.7 21.3 24.7 22.4 23.6 23.2

98
24.8 22.2 23.7 21.4 24.2 22.9
27.4 24.3 24.6 22.9 23.7 23.5
26.6 23.7 23.1 22 25.9 22.5
26 24.9 22.5 24.5 23.6
21.3 25.4 22.8 23.5
23.6 24.1 21.6 23
23.4 24.8 22.1 23.8
23.8 25.7 23.9
26.09 23.10 23.46 22.52 23.95 23.51
2.89 1.04 0.79 1.59 1.61 1.27
0.91 0.27 0.25 0.42 0.42 0.33
17.09 14.10 14.46 13.52 14.95 14.51
degas high.d
degas low.a
degas low.b
degas low.c
degas low.d
24.2 24 25.5 26.1 23.6
23.7 24.5 24.5 22 27.6
27.2 22.6 23.7 25.5 23
26.6 23.7 24 24.3 19.4
25.4 22.6 25.9 21.9 24.2
25.3 26.1 23.4 26.4 25.1
26.5 22.5 23.2 26.7 25.1
25.7 24.5 24.4 21 24.3
25.3 24.3 25.9 23.2 25.6
25.7 24.3 25.6 24.6 23.7
26
25.6
26.6
24.5
25.59 23.91 24.61 24.17 24.16
0.98 1.12 1.04 2.05 2.11
0.26 0.35 0.33 0.65 0.67
16.59 14.91 15.61 15.17 15.16
(grain refinement) plain 1-29 1.a 1.b 1.c no xtra 1-31 1.d 1.e
21.4 21.2 23.3 20.6 20.5 24.6 20.9
23 23.3 21.9 21 22.1 22.1 22.8
22 22.6 20.8 22.8 19.6 25.4 21.4
21.7 23.4 23.4 22.3 20.6 23.5 23
22.6 22.8 22.5 20.3 22.9 24.3 21

99
22.7 23.7 21.6 22.4 22.3 24.5 21.5
22.4 22.4 22.4 22.6 21.6 23.4 21.7
23.4 21.7 23.5 23 21.6 22.3 23.8
23.6 23.1 22.1 22.7 21.7 22.9 22.5
21.3 23.3 22.8 23.4 20.5 22 21.7
22.41 22.75 22.43 22.11 21.34 23.50 22.03
0.80 0.80 0.86 1.08 1.01 1.18 0.95
0.25 0.25 0.27 0.34 0.32 0.37 0.30
13.41 13.75 13.43 13.11 12.34 14.50 13.03
22.41 22.16 22.36
0.253618 0.17 0.15
13.41 13.16 13.36
grams added
base 0 13.41 0.253618
1x 27.35 13.1575 0.16602
2x 150.03 13.364 0.150909
3x 284.45 13.0075 0.303048
1.f 1.g no xtra 2-04 1.h 1.i 1.j 1.k
22.1 21.3 21.3 23.6 21.6 22 24.3
21.7 23.4 20.7 21.3 23.7 21.8 21.2
22.3 21 20.8 21.8 22 23.1 22.4
23.2 20.8 22.7 20.4 22.7 22.6 20.7
22.6 22 22.4 23.7 22.8 21.9 21.2
22 22.3 21.3 21.4 21.6 20.6 22.6
22 23.1 23.6 21.9 22.5 22.2 12
21.3 22.1 22.1 23.3 22.6 20.5 23.7
23.4 22 23 21.9 20.4 23.2 22.6
21.7 22.3 22.4 23.4 22.4 23.5 23.2
22.23 22.03 22.03 22.27 22.23 22.14 21.39

100
0.67 0.84 0.97 1.15 0.89 1.02 3.49
0.21 0.26 0.31 0.36 0.28 0.32 1.10
13.23 13.03 13.03 13.27 13.23 13.14
22.01
0.30
13.01
(Si variations) 2/6/2008 base
2/7/08 base
3-19 base
3-20 base
3-26 base ++ Si.A ++ Si.B ++ Si.C
23.5 19.4 19.3 23.2 17.2 26.1 25.2 24.6
21.7 21.3 18.9 22.2 19.4 23.1 22.4 22.5
22.8 20.5 21.3 22.1 19.7 23.9 22.3 22.4
21.6 21.7 20.7 21.5 20.6 23.5 24 23.3
24.3 21.1 20.4 22.4 21.3 22.7 23.9 23.5
22.3 25.5 20.4 20.5 21.4 24.5 22.6 24.2
22.7 21.5 21 21.3 21.7 22.6 22.3 22.7
21.9 21.4 21.1 23.9 21.5 23.3 23.1 24.2
22.9 21.7 19.3 22 20.7 24 23.3 24.3
21.6 20.4 22.5 20.3 20.4 24.2 22.5 21

101
22.53 21.45 20.49 21.94 20.39 23.79 23.16 23.27
0.89 1.59 1.09 1.11 1.36 1.03 0.96 1.13
0.28 0.50 0.35 0.35 0.43 0.32 0.30 0.36
13.53 12.45 11.49 12.94 11.39 14.79 14.16 14.27
+ Si.D + Si.E + Si.F -- Si.A -- Si.B -- Si.C
21.3 22.4 22.3 22.7 20.3 24
21.6 20.5 22.2 19.7 18.2 20.9
21.3 22.3 23.1 20.1 19.5 20.3
22.6 21 22.3 21.2 19.5 21.3
20.5 21.4 21.5 20.9 20.4 20.2
22.3 23.2 21.3 20.8 20.7 17.8
21 21.5 21.6 19.3 20.9 19.7
21.7 20.6 19.3 20.2 19.6 19.3
22.4 23.1 24.5 20.5 20.5 22.7
21.5 21.4 20.9 19.9 19.7 20
21.62 21.74 21.90 20.53 19.93 20.62
0.66 0.97 1.37 0.96 0.80 1.75
0.21 0.31 0.43 0.30 0.25 0.55
12.62 12.74 12.90 11.53 10.93 11.62
- Si.E - Si.F - Si.G
19.9 20.8 20.7
20.4 20.1 22.9
19.8 19.9 19.5
22.1 20.7 20.4
20.4 19.8 19.6
15.9 20.7 18.7
20.8 21.6 20.8
19.3 19.1 20.3
18.4 19.8 20.7
20.3 20.1 20.5
19.73 20.26 20.41

102
1.65 0.70 1.10
0.52 0.22 0.35
10.73 11.26 11.41
6-18 very high si 6-18 very high si 6-18 very high si
700 C 700 C 730 C
34.2 36.7 37.3
27.8 36.8 26.2
36.3 36.4 42.8
39.7 36 40.8
36.2 34.6 42.8
39.9 32.3 37.4
36.6 33.5 38.7
36.6 33.3 40.7
35.5 33.6 42.5
35.7 34.8
35.85 34.80 38.80
3.34 1.61 5.20
1.06 0.51 1.73
26.85 25.80 29.80
(Constant superheat) 6-25 baseline +Si one +Si two -Si one - Si two
23.3 21.4 25.7 21.7 20.1
23.7 22.7 21.6 17.5 20.9
22.1 20.2 23.1 22.1 22
22 22.8 23.8 20.6 21.7
20.7 22.6 22.6 20.5 24.6
20.8 23.3 27.7 20.8 21.7
23.3 24.3 23 21.4 21.3
22 24.2 21.5 21.6 21.3
21.5 20.3 22.5 22.2 21.7
22 22.7 21.4 21 23.6
21.2
22.7
22.3
22.5
22
22.14 22.45 23.29 20.94 21.89
0.88 1.42 2.01 1.35 1.30
0.23 0.45 0.64 0.43 0.41
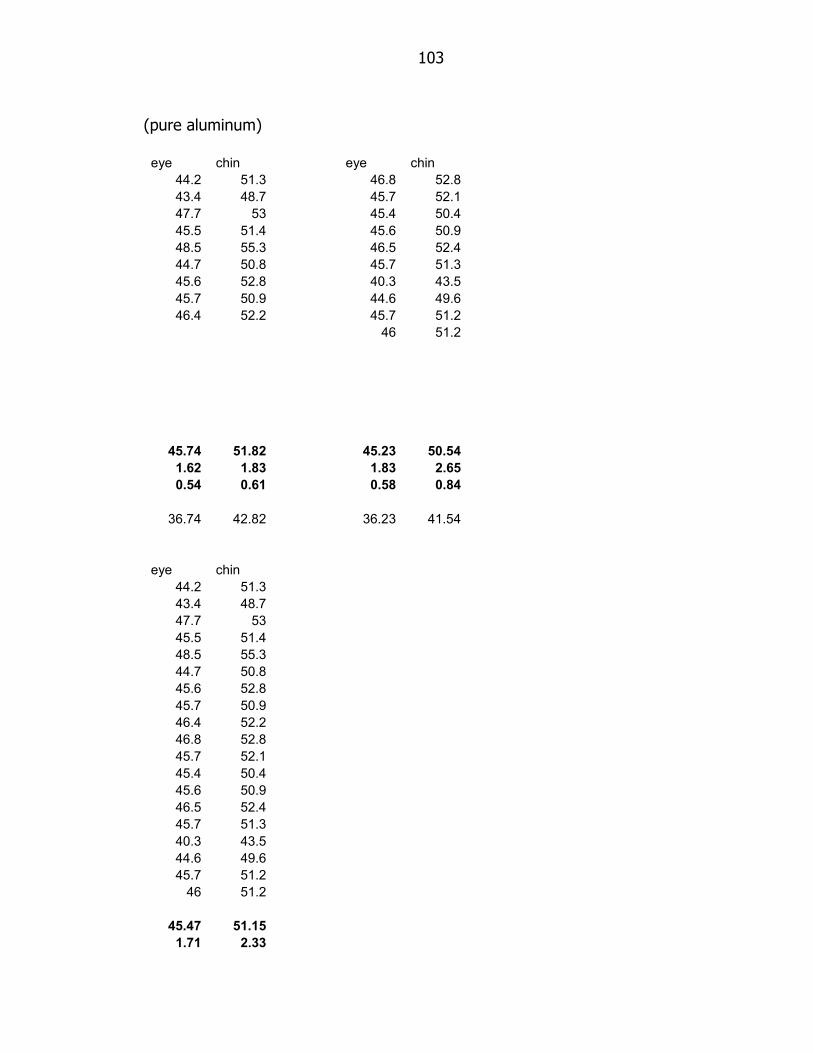
103
(pure aluminum) eye chin eye chin
44.2 51.3 46.8 52.8
43.4 48.7 45.7 52.1
47.7 53 45.4 50.4
45.5 51.4 45.6 50.9
48.5 55.3 46.5 52.4
44.7 50.8 45.7 51.3
45.6 52.8 40.3 43.5
45.7 50.9 44.6 49.6
46.4 52.2 45.7 51.2
46 51.2
45.74 51.82 45.23 50.54
1.62 1.83 1.83 2.65
0.54 0.61 0.58 0.84
36.74 42.82 36.23 41.54
eye chin
44.2 51.3
43.4 48.7
47.7 53
45.5 51.4
48.5 55.3
44.7 50.8
45.6 52.8
45.7 50.9
46.4 52.2
46.8 52.8
45.7 52.1
45.4 50.4
45.6 50.9
46.5 52.4
45.7 51.3
40.3 43.5
44.6 49.6
45.7 51.2
46 51.2
45.47 51.15
1.71 2.33

104
0.39 0.53
36.47 42.15
(Strontium addition)
2-11 base
2-11base b
2-12 base str.1a str.1b str.1c str.2.a
20 18.5 17 19 19.8 20.5 19.5
20.1 23.2 21.3 19.7 19.7 18.5 19.7
20.5 21.1 21.5 19.7 19.6 19.6 20.4
18.2 22.3 22.9 17.7 21.3 20.2 18.5
19.7 20.6 20.1 19.9 21.2 20.9 22
18.5 20.4 20.7 19.4 19.7 18.7 21.9
20.7 19.4 23.4 20.4 19.4 17.8 20.4
19.4 20.1 19.9 15.4 17.9 19.9 20.3
19.6 22.7 16.4 18.6 20 20.4 21.6
20.8 21.8 22.1 19.5 23.5 20.7 20.6
19.75 21.01 20.53 18.93 20.21 19.72 20.49
0.87 1.50 2.31 1.45 1.49 1.05 1.11
0.28 0.47 0.73 0.46 0.47 0.33 0.35
10.75 12.01 11.53 9.93 11.21 10.72 11.49
str.2b str.2c
21.6 19.4
21.1 20.6
21.2 19.8
20.7 20.4
22.6 20.5
20.8 20.3
20.3 20.6
19.5 21.7
20 21.1
21.4 20.7

105
20.92 20.51
0.88 0.63
0.28 0.20
11.92 11.51
6/11 base 6/11 b base
high Sr.1 high Sr.2 high Sr.3
16.8 21.3 22.2 19.3 23.7
21.9 21.3 21.8 19.5 19
22.7 22.2 19.4 19.4 18.7
21.3 19.8 19.8 19.6 18.8
21.6 19.8 20.1 19.8 19.2
20.9 19.6 18.9 20.7 19.3
20.6 18.7 19.2 19.7 20.2
22 21.4 18.6 20 19.5
20.7 18.7 19 19.8 19.4
22.4 20.2 19.4 18.7 19
21.09 20.30 19.84 19.65 19.68
1.66 1.20 1.22 0.51 1.47
0.53 0.38 0.39 0.16 0.47
12.09 11.30 10.84 10.65 10.68
20.70 19.72
0.33 0.20
11.70 10.72
(Fe & Mn) 3-28 base
4-4 base
low Fe.A
low Fe.B
high Fe.A
high Fe.B
high Fe.C
19.7 18.8 22.7 18.7 23.4 22 18.7
19.5 20 22.8 20.4 19.3 19.4 19.5
20.6 19.1 20 23.7 21.5 15 20
19.7 19.7 21.6 21.3 22.7 20.3 20.8
19 19.4 21.2 22 21.2 20 20.7
21.8 18.3 21.5 23.1 21.5 20.3 21
20.6 18.7 19.8 20.4 18.5 19.5 20.5
19.4 19.5 21 20.5 19.2 20.2 20.6
20.2 17.2 20.1 20.7 17.5 20.5 21.1

106
22.1 19.3 20.4 20.7 18.8 20.1 17.7
20.26 19.00 21.11 21.15 20.36 19.73 20.06
1.03 0.81 1.07 1.45 1.96 1.81 1.11
0.33 0.26 0.34 0.46 0.62 0.57 0.35
11.26 10.00 12.11 12.15 11.36 10.73 11.06
low Mn.A
low Mn.B low Mn.C
high Mn.A
high Mn.B
high Fe+Mn.A
high Fe+Mn.B
18.9 18 16.3 18.9 16.5 20 20.9
17 18.7 21.6 16.2 16.5 20.4 19.8
18.3 19.3 18.4 17.7 19.1 20.5 22.6
19.5 20 19 19.5 18.8 21.5 18.9
19.6 19.3 21.4 19.4 19.5 21 21.7
19.4 18.9 15.9 19.4 18.6 18.6 20.6
18.3 18.8 20.3 18.3 19.9 21.9 21.1
16.4 18.5 22.8 17.9 19.6 21.3 19.6
20.1 20.3 19 20.2 19.3 21.8 20.7
20 20.5 19 19.5 20.5 19.4 18.4
19.9 21.1 19.4 19.4 21.5 21.5
18.7 19.4 19.6 19.8 21.4 20.5
19.8 20.4 20.3 21 21.2 21.2
19.3 20.7 21.6
20.1 20.1
18.92 19.48 19.37 19.05 19.29 20.86 20.58
1.16 0.92 2.22 1.10 1.31 0.97 1.16
0.32 0.25 0.70 0.28 0.34 0.26 0.32
9.92 10.48 10.37 10.05 10.29 11.86 11.58
(oxides) 4/11 base
oxide lv 1.A
oxide lv 2.a
oxide lv 2.B
oxide lv 2.C
oxide lv 3.A
18.1 20.2 20.4 15.8 19.8 18.2
18.7 19.7 19.4 15 20.4 18.5
20.8 18 20.3 20 18.6 19.7
16.4 19 19.1 14.5 20.2 18.7
19.6 20.3 19.7 19.8 19.7 19.8
20.1 19.7 19.4 20.1 17.2 20
20.7 21.3 20.8 20.5 18.3 19.6
21.1 19.5 20.4 20.5 20.4 19.2
21.4 19.3 20 16.5 19.3

107
20.8 20.7 18.7 20.1 20
19.44 19.99 19.95 18.49 19.12 19.30
1.61 1.05 0.63 2.41 1.40 0.64
0.57 0.33 0.20 0.76 0.44 0.20
10.44 10.99 -9.00 10.95 9.49 10.12 -9.00 10.30
oxide lv 3.B
oxide lv 3.C
19.4 20.1
18.5 20.5
18.9 20.5
20.2 21.6
20.5 19.3
19.5 24
19.6 20.6
17.1 18.4
19 18.8
19.3 18.4
19.20 20.22
0.94 1.70
0.30 0.54
10.20 11.22
6/12 base
borax lv 1.a borax lv 1.b
borax lv 2.a
borax lv 2.b
20.7 22.1 20.6 20.3 20.8 21.7
20.8 21.4 19.5 21 18.7 19.9
20.6 18.5 21.1 20.7 20.2 17.4
20.4 19.8 20.4 21.3 21.1 12.9
21.5 21.5 20.7 20.5 19.7 19.6
20.2 20.3 19.6 20.2 21 19.4
19.7 20.7 21.2 18.3 20.3 19.5
20 22.7 20.8 21.1 19.7 17.8
21.3 19.4 17.6 20.1 21 20
19.7 21 20.5 21.2 21.5 20.5

108
20.49 20.74 20.20 20.47 20.40 18.87
0.62 1.28 1.07 0.88 0.85 2.43
0.19 0.40 0.34 0.28 0.27 0.77
11.49 11.74 11.20 11.47 11.40 9.87
20.62 20.34 19.64
0.22 0.22 0.43
11.62 11.34 10.64
borax lv 3.a
borax lv 3.b
18.3 19.4
20.7 17.6
14 21.4
12 22.4
15.7 19.6
11 20.2
19.4 15.4
20.9 15.9
19.3 19.4
18.5 20.8
16.98 19.21
3.58 2.28
1.13 0.72
7.98 10.21
18.10
0.70
9.10

109
Appendix B
Consortium Survey and Results

110
SURVEY RESULTS – FOR ACRC CONSORTIUM MEMBER’S USE
ONLY
One of the chief advantages of the ACRC casting consortium is its
ability to retain applicability to industry through close communication
with our consortium members. In that vein, a survey was prepared to
assist with the project titled: Characterization of Alloy Castability -
Fluidity.
We appreciate your taking the time to answer our questionnaire with
regards to the use of fluidity testing at your workplace. As promised,
these are the results of the anonymous survey.
Over half of the ACRC members replied, which when one considers that not all
member companies are alloy producers or foundries was a very good response.
Q1: Do you do fluidity testing at your company?
One in three of those who responded to the survey report that they do some
kind of fluidity testing at their company, at an attached research unit, or have
such work done at an external lab. Subsequent replies suggest that not all
respondents think about fluidity testing the same way.
Q2: If yes on #1, what sort of testing do you do?
Q3: If yes on #1, how frequently is fluidity testing done?
Sand spiral testing appears to be the most common diagnostic technique in use,
with just under half of those who conduct fluidity testing using sand spirals.
Horizontal vacuum testing and step molds are also used.

111
Responses to the third question indicate that fluidity testing is most often
performed in response to a specific problem, during alloy or process
development.
One respondent pointed out that Prefil by ABB Bomen is in use at their foundry
twice per shift per line. Rather than indicating this is a rare practice, it instead
reflects the perception of what is and is not a test of fluidity.
One respondent indicated there was monthly fluidity testing, although the
technique in place was unclear from their other responses. As this was the least
frequent printed option, this may indicate intermittent use for process/alloy
development as discussed above.
Q4: If you do not do any fluidity testing, are there other tests you carry
out to characterize the melt’s ability to fill a given cavity? Please
explain whether these are experimental or computational (simulation)
tests.
Of those who provided more detailed replies, many made use of fill analysis
software. Half indicated they used Magma, while others failed to indicate which
program they used or indicated Procast. Interestingly, some of those who
indicated they conducted fluidity testing indicated they used these tools as well.
One group indicated this was the only form of fluidity testing they performed.
Obviously, there is some ambiguity where fluidity begins and ‗castability‘ testing/
analysis/ modeling end.
One group indicated they made use of differential scanning calorimetry to
determine the solidification range of their alloy.

112
One group indicated they did not conduct fluidity testing as they had never had problems. Others indicated they did not do such testing because they worked with known alloys or customer specified compositions. Presumably, this indicates agreement with those who view fluidity as a diagnostic tool for alloy/process development as opposed to a regular test to insure process stability.

113
Appendix C
Castability Measures for Diecasting Alloys: Fluidity, Hot Tearing, and Die Soldering

114
CASTABILITY MEASURES FOR DIECASTING ALLOYS: FLUIDITY, HOT TEARING, AND DIE SOLDERING
B. Dewhirst, S. Li, P. Hogan, D. Apelian
Metal Processing Institute WPI, 100 Institute Road
Worcester, MA 01609 USA
ABSTRACT Tautologically, castability is a critical requirement in any casting process. Traditionally, castability in sand and permanent mold applications is thought to depend heavily on fluidity and hot tearing. Given capital investments in dies, die soldering is a critical parameter to consider for diecasting. We discuss quantitative and robust methods to insure repeatable metal casting for diecasting applications by investigating these three areas. Weight reduction initiatives call for progressively thinner sections, which in turn are dependent on reliable fluidity. Quantitative investigation of hot tearing is revealing how stress develops and yields as alloys solidify, and this has implications on part distortion even when pressure-casting methodologies preclude hot tearing failures. Understanding the underlying mechanism of die soldering presents opportunities to develop methods to avoid costly downtime and extend die life. Through an understanding of castability parameters, greater control over the diecasting process can be achieved. Keywords: Castability, Die Soldering, Fluidity, Hot Tearing, Part Distortion, Residual Stress INTRODUCTION Over the years, castability has been addressed through various angles and perspectives. However no matter what has been accomplished, it is fair to state that at the present there is not a single method that the community can point to as a means of defining an alloy‘s castability in terms of measurable quantitative parameters. It is critical that means for controlling the casting process be developed. Without robust measures, one will not be able to control the casting process. It is the latter that is the motivating force behind this project. Hopefully, the investigative techniques being developed in this research will become

115
standardized so that an accepted lexicon and methodology is practiced throughout the casting community. This paper will focus on three parallel lines of research with applicability to light metals diecasting: Fluidity, Hot tearing (as it relates to stresses developing within solidifying metals as a function of chemistry and microstructure), and die soldering. Each of these three areas of research has the potential to positively benefit the HPDC industry, either directly or as an accompanying benefit to research conducted for other purposes. Vacuum fluidity testing allows for the evaluation of various alloys and process modifications in a laboratory setting under rapid solidification conditions, but suffers from a poor reputation and, as a consequence, has principally been used for qualitative experimentation. Hot tearing, a consequence of stresses developing during feeding until the casting tears itself apart, is not found in alloys used in HPDC, but the investigative techniques being applied to understand hot tearing are providing a window into how these stresses develop. Die soldering is important because, in improperly designed castings, soldering can be a significant problem that can severely inhibit productivity. FLUIDITY Fluidity is a material‘s ability to flow into and fill a given cavity, as measured by the dimensions of that cavity under specified experimental conditions, and fluidity is heavily dependent on heat flow during solidification. Investigations into the impact of foundry variables such as mold coatings, alloying additions, head pressure, and especially superheat have been investigated and correlated with mechanisms. For sand and permanent mold castings, it is abundantly clear that increasing solidification range results in decreasing fluidity (all other factors being equal). Specific investigations are often alloy or metal/mold/coating specific in scope, but very subtle influences of minor variations in alloy purity can be detected. There is some question as to whether these trends transfer over to die casting, and that question will be the focus of our discussion. Thanks in large part to the work of Ragone in developing his vacuum testing apparatus,
which Flemings et al. built upon, fluidity has seen great advances since Ragone’s 1956
doctoral thesis [1-6]. Over a period of 8 years, Flemings and collaborators produced the
fluidity equations and solidification mechanisms which are at work in linear castings
during standard fluidity tests.
Ragone demonstrated that the influence of viscosity or a change in viscosity on (casting)
fluidity was minimal, and while the equations he presented did include a viscosity term,

116
subsequent formulations correctly dropped it as insignificant as compared with other
sources of experimental error [1].
The fluidity equation from Flemings [3], for metal with some superheat T and a mold
which conducts heat rapidly is given below as Equations 1 and 2.
)(**2
)'*)(*'*(
o
of
TTh
TcHVapL
(1)
dT
dL
L
H
c
f
f*)
'( evaluated at Tm (2)
Where:
Lf final length, fluidity
a channel radius
k critical solid concentration
c’ specific heat of liquid metal
To ambient environmental temperature (room temperature)
T superheat
' density of metal
Vo velocity of metal flow
H heat of fusion of metal
h heat transfer coefficient at mold-metal interface
T the time average melt temp in the fluidity test
Tm metal melting temperature
T’ temperature of superheated metal entering flow channel
critical solid concentration required to stop flow in ‘mushy’ alloys
Flemings reports that the critical solid concentration is between 0.2 and 0.3 fraction solid,
and Campbell gives 0.5-0.6 using slightly different criteria [4,7,8]. This is the fraction
solid where, as will be discussed under flow stoppage mechanisms, the flow is choked
off. Attempts to tie this choking off to dendrite coherency by Dahle, as explored by
Backerud, were inconclusive. He did not find an unambiguous impact of dendrite
coherency measurements on fluidity [9-11]. The specific fraction solid at which this takes
place varies with alloy composition and solidifying phase morphology. This critical
fraction solid is likely to be higher for die casting due to the increased pressure involved,
but the extent of increase is likely to depend on alloy-specific morphology characteristics.
Much work on the relevant solid fractions where flow is possible has been carried out in
the area of SSM, both in terms of alloy rheology and thermodynamics, and this may have
much to contribute in understanding how this factor changes according to the specific
casting and alloy conditions [12].
Past work in the field has focused on maximizing fluidity, however we believe that decreasing the variations in fluidity is as important as determining under

117
which conditions fluidity is maximized. There are two main aspects to variation in fluidity:
One is the standard deviation of test methods used in the lab to determine fluidity.
The other is the range over which fluidity values will vary in a real casting environment where alloy chemistry, temperature controls, etc. vary within some range.
Given the high part numbers involved in die casting, questions of repeatability are especially important. Thin sections are desirable for a variety of reasons, and can be achieved with increased mean fluidity, but if that increase is coming at the expense of increased fluidity variation, this will have the undesirable effect of increasing scrap rates. Often, the factors which can be adjusted to improve fluidity have other impacts on the casting process, and so a careful tradeoff must be achieved between insuring there is enough fluidity (and a margin of safety) without causing deleterious side-effects. Greater fluidity is often achieved by increasing melt superheat, but as will be discussed below, this has negative implications for die soldering. Mold coatings can decrease the heat transfer coefficient, and thus increase fluidity, but this may have a small negative impact on cycle time. While minor alloy additions often have little impact on fluidity, the secondary alloy components (specifically, their heat of fusion and morphology) do contribute to fluidity. Our work to improve the laboratory testing of vacuum fluidity measurements is largely focused on improving the repeatability of measurements by controlling the various experimental parameters. After a controlled volume of melt is collected, a thermocouple is inserted into it. When the metal cools to a pre-set temperature, it is elevated such that the end of a borosilicate tube is immersed in the melt, and vacuum is applied. The measurement of that length is then made before the pyrex tube is removed from the experimental setup, as the rapid fracturing of the glass and other factors otherwise make it difficult to determine the ‗zero point.‘ Through repeated measurements under controlled experimental conditions we are establishing the reliability of the test. A continuing trend in all of engineering, including metal casting, is the application of modeling software to problems of interest. These codes, in the case of casting intended to predict filling, hot spots, etc. are no more reliable than the data upon which they are built. It is hoped that increased precision of fluidity testing will have a positive impact on these modeling codes by allowing direct comparison of simple geometries in both simulation and the laboratory. Since these codes do not include direct fluidity calculations, accurate experimental tests of fluidity would seem to be a good independent check.

118
HOT TEARING AND INTERNAL STRAIN Though hot tearing is a casting phenomenon that occurs in sand castings and processes where the solidification rate is slower than in die-castings, the mechanism of stress distribution during solidification is appropriate for discussion in high integrity castings. This is more so than ever now that we can measure and quantify stresses during solidification. Material behavior during solidification is what matters. Campbell [7] defines a hot tear as a uniaxial tensile failure, which results in cracks on the surface or inside the casting. Alloys having a wide freezing range have a higher tendency to hot tear. Variables that influence hot tearing include alloy composition and processing variables [13,14]. Hot tearing susceptibility of alloys is greatly influenced by solidification behavior of molten metal in the mushy zone. Solidification can be divided into four stages [15]: (i) Mass feeding where the liquid and solid are free to move; (ii) Interdendrtic feeding when the dendrites begin to contact each other, and a coherent solid network; (iii) Interdendritic separation. With increasing fraction solid, the liquid network becomes fragmented. If liquid feeding is not adequate, a cavity may form. As thermal contraction occurs, strains are developed and if the strain imposed on the network is greater than a critical value, a hot tear will form and propagate. Lastly, in stage (iv), Interdendritic bridging or solid feeding occurs. Simply stated, hot tearing occurs if the solidification shrinkage and thermal deformation of the solid cannot be compensated by liquid flow. Measuring the development of strains and the evolution of hot tearing during solidification is not trivial. The Metal Processing Institute is a member of the Light Metals Alliance, and we have teamed up with our alliance partner CANMET to address hot tearing in aluminum alloys. The constrained bar mold used in this study was developed at CANMET Materials Technology Laboratory (MTL) and designed to measure load and temperature during solidification. Figure 1 shows one of the mold plates and testing setup. The mold is made of cast iron and coated with insulating mold wash. The test piece has two arms. One test arm (12.5mm) is constrained at one end with heavy section (22.5mm) to keep the bar from contraction, so the tension will be developed and hence cracking could be induced during solidification. The other arm is for load and temperature measurement with one end connected to a load cell. This opened end of the mold is closed with a graphite cylinder block which can move freely in horizontal direction. The block is connected to the solidifying material on inner side with a screw and on external side with a load cell. Two K-type thermocouples are used for the temperature measurement. One is positioned at the riser end and the other at the end of the bar as shown in Figure 1. After pouring the melt into

119
the mold, the temperature and load were recorded with a computer data acquisition system.
Figure 1: Cast Iron Mold designed to detect the onset of the hot tearing
Commercial cast alloy 713 and 518 were evaluated; the former is known to be sensitive to hot tearing, and the latter has good resistance to hot tearing. The pouring temperature was set at 60˚C above the melting point of the alloy during this effort. The mold temperature was maintained around 200˚C.
Figures 2 and 3 show the measured temperatures and load recorded during casting as a function of time for alloy 713 and 518 respectively. The load represents the tension force developed in the casting during solidification. The cooling curve T1 was recorded with thermocouple tip positioned at the riser end and T2 with thermocouple tip at the end of the bar as shown in Figure 1. A rapid rise in temperature (both curves) was observed immediately after pouring and the temperature started falling shortly. It‘s noticed that negative loads (compressive forces) were developed shortly after pouring for the tests, probably due to the pressure head of the melt [16]. When the rod begins to solidify but cannot contract freely, the tension force increases. Figure 2(b) and 3(b) are derivatives of load vs. time curve to determine onset of hot tearing. An obvious change in the rate suggests that cracking might occur there.
Thermocouple 1
Load Cell
Screw Graphite Block
Thermocouple 2 21

120
Figure 2: (a) Temperature-load-time curves of alloy 713; (b) Derivative of Load vs. time curve.
From Figure 2b, load began developing at proximately 9 seconds and the solidification temperature was around 617˚C (Figure 2a), then increased rapidly. It is shown that the rate changed abruptly to zero at 16.5 seconds, suggesting a severe tear occurred there. Hot tearing occurred at around 530˚C, corresponding to 94% solid, according to Pandat Scheil solidification calculation. The technique developed to measure hot tearing tendency is a valuable tool to differentiate between alloys and to use it to optimize alloys for high integrity castings.
Load T1
T2
(a)
(b)
Crack at 530˚C

121
Figure 3: (a) Temperature-load-time curves of alloy 518;
(b) Derivative of Load vs. time curve.
Figure 3: shows the temperature-load-time curves of alloy 518. The load started to develop at 10 seconds, and then increased smoothly with time. No abrupt change of rate was observed, suggesting no crack would occur during solidification. The difference between the load curves of alloy 713 and 518 reveals different hot tearing susceptibility between the two alloys.
DIE SOLDERING Die soldering occurs when the cast aluminum alloy comes into contact with die steel. Due to the natural affinity of iron and aluminum, a reaction occurs at the surface which results in the formation of intermetallic phases. Over a series of shots, a significant amount of aluminum becomes stuck to these phases at the die surface, and the resulting cast part can begin to miss critical tolerances or to lose integrity. At this point, the die must be shut down and cleaned, which is an
(b)
(a)

122
expensive process when it occurs too frequently. It is estimated that 1 to 1.5% of variable overhead is directly attributed to die soldering in casting plants. With such a large economic effect on the casting process, it is clear why die soldering needs to be controlled. There are several ways in which this can be achieved. These can be broken down into three groups, which will be discussed further below: melt chemistry, process conditions and the die surface condition. The chemical composition of an alloy can have a dramatic effect on soldering behavior. The importance of alloy chemistry was shown at WPI‘s Metals Processing Institute by Sumanth Shankar [17]. In his experiments, he dipped H13 steel pins in 380 alloy and rotated them to simulate the drag force experienced at the surface of the die during injection of the metal. After dipping, the thickness of the intermetallic layers that had formed on each sample was analyzed as a measure of soldering tendency. His results showed that small additions of Sr and Ti (0.004% and 0.125%, respectively) had a much greater effect on soldering tendency than the time of dipping (30 to 75 seconds) or the temperature of the melt (1150 to1250F). To further expand on this discovery, Shankar performed another set of experiments to test the effects of a much wider range of alloying elements. The main effects are shown in Figure .
Figure 4: Main effects plot of the effect various alloying elements on die
soldering. Iron, Manganese and Titanium show strong positive effects on
reducing soldering, while Nickel promotes soldering [17].
Not surprisingly, iron had the greatest effect of any alloying element in the study on reducing die soldering. Iron has long been added to die casting alloys in order to reduce the die soldering tendency of alloys. It is well known that alloys with

123
insufficient iron content (<0.8-0.9%) will solder readily to the die under the right conditions. A look at the phase diagram in Figure shows that the solubility of iron in aluminum with 10% silicon at typical casting temperatures is quite low, around 2-3%. At temperatures where the melt is likely to be in contact with the die, this solubility drops even lower. Therefore, even at low concentrations the presence of iron in the melt reduces the chemical potential gradient of iron from the steel to the melt significantly and slows the reactions that occur at the surface.
T[C]
w% (FE)
500
520
540
560
580
600
620
640
660
680
700
0 1 2 3 4 5
w%(FE)
T[C]
Al, 10% Si
LIQUID
LIQUID+FCC_A1
0 1 2 3 4 5500
520
540
560
580
600
620
640
660
680
700
Figure 5: Phase diagram of Aluminum-10% Silicon and low solubility of Fe .
Of the other alloying elements, strontium also has the potential to help control die soldering, in addition to its common use as a eutectic modifier. In industrial trials a small strontium addition was shown to reduce die soldering by more than 20%. The effect is not apparent in the main effects plot above because both of the levels selected were at or above the critical concentration. The mechanism behind this reduction has to do with the effect strontium has on the viscosity and surface tension of the alloy. As Figure shows, the addition of strontium changes the apparent viscosity and subsequently the surface energy of the alloy. This causes a reduction in the ability of the alloy to wet the die surface and reduces the contact area and the reaction between the two.

124
Figure 6: Change in viscosity of an Al-Si alloy with the addition of 230ppm Sr [18].
High temperatures and high melt velocity are process conditions which lead to soldering. Of the two, high temperature is the most important to avoid in order to prevent soldering. This can most effectively be done through careful design of the die. By configuring the part and optimizing the design of the die cooling system, the potential for soldering can be greatly reduced. It is very important to consider this during the design phase of a die because once a die is manufactured it is very difficult to reduce any hot spots. Other potential solutions include using additional spray in the high solder areas to reduce temperature or the use of inserts with high conduction coefficients Impingement velocity is important to control as well. The die surface should be coated with lubricants and is likely oxidized from prior treatment. A high impingement velocity can wash these protective coatings off of the die surface, exposing the die steel to the aluminum alloy and begin erosion of the die surface. Both of these effects will promote the beginning of die soldering. SSM processing can help to reduce both the temperature and velocities apparent in the casting system, and should help reduce die soldering [12]. Die coatings can be useful as a diffusion barrier between the steel in the die and the aluminum in the cast alloy. An effective coating must be able to withstand the harsh conditions at the surface of the die, however. Coatings which are sometimes used include CrN+W, CrN, (TiAl)N and CrC [19]. Additionally, surface treatments such as nitriding and nitro-carburizing can help to strengthen the surface and prevent erosion, which accelerates the soldering process by roughening the surface and creating local temperature excursions at the peaks of the die surface which solder very quickly.

125
Accurate modeling of the casting process during the design phase is very important to an effective control against die soldering. All of the previously mentioned controls require additional cost during the design and manufacturing of the die, and it must be understood how badly soldering will affect the process before the costs of any of those controls can be justified. CONCLUSIONS Though these three alloy characteristics seem tangentially related, they are factors that influence castability. In order to control these castability indices, it is necessary to develop experimental methods until robust quantitative analysis is possible. Once quantitative data can be extracted, the improvement in our understanding will occur. In the case of die soldering, multiple possible avenues to reduce the problem have been identified. Even when the initial intention was to resolve problems occurring in sand and permanent mold castings, such as hot tearing, the information gleaned about how stresses develop in liquid metal has wider applicability. Though die casting usually assures good fluidity through the use of pressure, if fluidity (and the factors which influence its variation) are well understood, it is possible to operate within tighter processing windows. REFERENCES 1) D.V. RAGONE, C.M. ADAMS, H.F. TAYLOR, AFS Trans. 64, (1956), p.640. 2) D.V. RAGONE, C.M. ADAMS, H.F. TAYLOR, AFS Trans. 64, (1956), p.653. 3) M.C. FLEMINGS, Brit. Foundryman 57, (1964), p.312. 4) M.C. FLEMINGS, Solidification Processing. McGraw-Hill, New York (1974). 5) M.C. FLEMINGS, E. NIYAMA, H.F. TAYLOR, AFS Trans. 69, (1961), p.625. 6) J.E. NIESSE, M.C. FLEMINGS, H.F. TAYLOR, AFS Trans. 67, (1959), p.685. 7) J. CAMPBELL, Castings. Butterworth-Heinemann, Oxford (1993). 8) A.K. DAHLE, L. ARNBERG, Materials Science Forum, 217-222, (1996), p.259. 9) A.K. DAHLE, L. ARNBERG, Materials Science Forum, 217-222, (1996), p.269. 10) L. BACKENRUD, E. KROL, J. TAMMINEM, Solidification Characteristics of Aluminum Alloys Volume 1: Wrought Alloys. (1986). 11) L. BACKENRUD, G. CHAI, J. TAMMINEN, Solidification Characteristics of Aluminum Alloys Volume 2: Foundry Alloys. (1986). 12) Science and Technology of Semi-Solid Metal Processing. North American Die Casting Association, (2001). 13) G.K. SIGWORTH, AFS Trans. 104, (1996), p.1053.
14) A.S. METZ, M.C. FLEMINGS, AFS Trans. 78, p.453.
15) D.G. ESKIN, K.L. SUYITNO, Progress in Materials Science, 49, (2004).
16) G. CAO, S. KOU, Met. Trans. A. 37A, (2006), p.3647.

126
17) S. SHANKAR, A Study of the Interface Reaction Mechanism Between Molten
Aluminum and Ferrous Die Materials, Ph.D. Worcester Polytechnic Institute,
(2000).
18) S. SHANKAR, M.M. MAKHLOUF, Internal ACRC Report, May 2005.
19) J. Wallace, A Guide to Correcting Soldering. North Ameican Die Casting Association, (2006).

127
Appendix D
Flemings’ Equation Derivations

128
The following derivation is based on that found in Flemings‘ Solidification
Processing, who in turn informs us that it is based on Ragone, Adams, and
Taylor‘s 1956 AFS Trans. article (dealing with spiral casting). He also makes
reference to two more detailed papers (Niesse, Flemings, and Taylor; 1959 AFS
Trans. and Fleming; 1964, Brit. Foundryman).
Assumptions: Neglect Friction. Neglect Acceleration (v= constant).
Initially, assume no superheat. Assume interface (heat transfer) controlled
solidification. (h<< ks/S and h^2<< km pm cm/t)
This means that Eqn. 1-19 applies (Fleming pg 13)
tf = [(ps * H) / (h*( Tm - To ))] * (V/A)
Flemings now assumes there is no ―separation of flow stream.‖
We further know that for a thin tube of circular cross section, (V/A) = a/2
This gives us Eqn. 7-7 (Flemings 220)
tf = [(ps * H* a) / (2* h*( Tm - To ))]
We‘ve assumed no acceleration, i.e., that velocity is constant. This is equivalent
to assuming no/constant head, as head pressure would introduce an
acceleration. If velocity is constant, it is equal to the distance covered divided by
the time it covers that distance.
v=x/t… or v= Lf / tf
(where Lf is the final length… i.e., the fluidity.)

129
We are assuming that the casting will reach its final length when the entry area
has completely solidified. After the derivation, cases where this may not hold are
discussed.
Substituting, we get Eqn. 7-8 (Flemings 220)
Lf = [(ps * H* a* v) / (2* h*( Tm - To ))]
Now, if we did have some superheat (T), we can account for it by including it
with the latent heat of fusion term as we have done in Flemings for previous
interface (h) controlled problems. In doing so, we‘re assuming that ps ~ pl
This gives Eqn 7-9 (Flemings 220)
Lf = (ps * a* v)*(H + c’ * T) / (2* h*( Tm - To ))
Flemings draws a number of conclusions from this equation
there is a linear impact of superheat
Fluidity is sensitive to channel size
Fluidity is sensitive to the heat transfer coefficient
Fluidity depends on velocity in such a fashion that it should be
proportionate to the square root of pressure. (His explanation is ―because
v= sqrt (2*g*h)‖ which doesn‘t seem like it would hold for a more
general case, but is fine when the pressure is due to a physical column of
molten metal as with the spiral test. The two cases should be equivalent.)
He goes on to state that this equation doesn‘t consider two situations:
Surface tension/ surface films
Back pressure due to mold outgassing

130
He adds, surface tension matters most in thin sections, where the diameter is
less than 1/10 (presumably he means 0.1‖)

131
Appendix E
Pumping Calculations

132
From White‘s Fluid Mechanics: Glass tubing is considered ―smooth‖ in terms of pipe roughness (drawn tubing is also very nearly ‗smooth‘ (epsilon = 0.0015 mm)) Equations are given for pipe flow in this same section
f
d
f dRe
51.2
7.3log*0.2
1
or
11.1
7.3Re
9.6log*8.1
1 d
f d
LVoLVo ***Re
Where: p- density Vo- velocity L- ―characteristic length‖ v- kinematic viscosity Estimation of the height a liquid of theta= 90 can be drawn up by a vacuum. P1 to 1atm (101,325 Pa) P2 to 0 atm (0 Pa, obviously this is an approximation) Mu=rho* v… = (900 kg/m3)*(0.0002 m2/s)= 0.18 (Kg/(m*s)) Z2= deltaZ- Z1 = Delta Z (if Z1 =0) HGL1= Z1 + P1/ (p*g) = 0+ 101,325/ (900*9.8) HGL2=Z2 + 0/p*g = Z2 As long as HGL1 > HGL2, flow is up Z2 <= 101,325/ (900*9.8) =11.49 m (Height of a column of this oil with the above properties we can draw up. Calculation will differ for Aluminum, or any other fluid with different density etc.) But is velocity constant over much of this length? We can use a Moody chart to get the Re for a smooth-walled (glass, drawn metal) tube. Epsilon/d= 0/d consult bottom of chart

133
Re= (as stated above)
LVo *Re
Assuming laminar flow:
L
hdgQ
f
**128
**** 4
(in m^3/s … volume per unit time) eqn 6.47 (White pg
311)
2*R
QV
= average velocity (m/s)
Full pipes are assumed, so Q is a constant, so (as long as the pipe isn‘t taller than the above calculation allows) Q=constant-> velocity is constant (by conservation of mass and incompressibility of our fluid).
This result holds (or should hold) for both vertical vacuumed and un-vacuumed tubes, assuming fully developed flow.
Estimate of needed pump size for given tube diameter:
1st order estimate potential energy change (will depend on tube diameter) (Pg 646 of White includes a discussion of pump theory.) A positive displacement pump (delta P versus Q is nearly constant) m*g*z= potential energy change (delta U) (p*v)*g*z= delta U
(p*(*r^2)z)g*z= delta U
p**r^2*z^2*g= delta U
z max can be found from earlier (preferably in terms of p, g, etc)
gg
atm
g
Pz
325,1011max
gg
rU
2
2 101325max
grU
22 101325
max
Pi ~3, density of aluminum~ 3; g~10

134
Umax ~ r^2 (1E9) (joules) If r=1 cm Umax ~= 100,000 (joules) ~=130 hp This is, of course, an approximate solution. Pump efficiency is not taken into account. As the tube diameter is decreased, the power requirements drop off sharply. For a 0.25 cm radius tube: Umax ~= 6,300 joules ~= 8 hp (Remember as well that the vacuum assembly includes a reservoir which has been pumped down to vacuum. While it only has a ½ hp pump, it can displace more aluminum in the short term as a result.)

135
Appendix F
Calibration Nomogram

136

137
The above nomogram allows the user to calculate the true height of a sample by
drawing a straight line between points corresponding to the observed height and
the height of the pupil of the operator‘s eye in centimeters. A different geometric
setup will require a different chart. The above chart solves the following
equation:
ht= ho + ((L-l)(x+X-ho)/L)
where:
ht= true height
ho= observed height
L= distance from ruler to parallel point under operator‘s eye = 52.9 cm
l= distance from sample base to parallel point under operator‘s eye = 35.3 cm
x= height from line drawn between operator‘s pupils to parallel line drawn under
chin when chin is resting on a level surface (12 cm for primary operator)
X= height from base of ruler to operator‘s chin = 16.8 cm
The above equation simplifies to:
ht = (2/3)ho+(1/3)x+5.6 (all in cm).

138
Appendix G
Microstructure Schematic

139
The following schematic displays 200x microstructures prepared from a tube
whose overall length was 22 cm before subtracting the baseline. Flemings
reports in his 1963 British Foundryman paper that the microstructure should be
fine at the tip and large at the base if the choking mechanism of the sample is
consistent with his proposed mechanism. The following schematic shows that
relationship from a representative sample from this work. The four micrographs
are approximately 0.3 cm, 5.5 cm, 10.5, and 21.5 cm away from the tip. Samples
were prepared from lengthwise cross-sections.

140
Appendix H
Phase 1 Procedures

141
N-Tec procedure: 1. Coat all metal tools (other than N-Tec mold or coupon mold) with
hardcoat boron nitride and allow 24 hours for drying (grey) 2. Coat all ceramic surfaces with Lubricoat (white or blue) and allow 24
hours to dry 3. Ensure mold thermocouple is working 4. Clean N-Tec mold with a brush or vacuum 5. Preheat N-Tec mold by setting the Backplate to 320 C
a. 304-264 C is an acceptable range for the mold temp, but as it cools during operation one ought to start higher (294 C) in anticipation of it getting lower (274 C) during operation.
6. There is an insulating cover to place on the fluidity mold as it heats up. It should be placed on top of the mold during mold heating. It must be removed before testing.
7. Remove one of the coupon molds from the shelf. 8. Use induction heating procedure, attached, to melt the metal 9. Obtain 35 lb ingot of the metal to be tested (in this case, A356)
a. no degassing (for this experiment) b. no grain refiner added (for this experiment)
10. Use the large ladle with the rounded bottom 11. Insert a sand pouring sleeve (without a filter at the bottom) into the
measuring ring a. Attach the carrying handle and block without crushing the filter, as
shown. b. Using the carrying handle, place the filling cone as shown, so that it
is suspended at a constant depth from the bottom of the mold. Sampling procedure:
12. Note initial mold temperature 13. Preheat the ladle (Note: With care, testing can be conducted with the
induction unit running continuously) 14. Skim oxide from top of melt with the back of the skimmer 15. Fill the ladle
a. Insofar as possible, the ladle should be full (to insure equal head pressure between tests)
16. Insert a (coated) large thermocouple into the filled ladle to determine when the superheat of the melt has decreased to the desired temperature for testing (in this case, T= 700. C)
a. Rest it on a refractory brick while waiting 17. Remove the thermocouple and pour in one smooth motion into the N-Tec
mold while being careful to not spill or splash the top of the mold or the table beneath

142
18. Do not overfill the sand spout 19. Pour coupon into coupon mold as soon after pouring the fluidity sample as
practical. a. After initial solidification, open the coupon mold on at least one
side. If one waits until it cools, this is nearly impossible to open. 20. Carefully remove the support for the sand pouring cups and place it to
one side. 21. Note the final mold temperature after pouring cupon and record the mold
temp range 22. Allow five minutes time for solidification to complete 23. Remove the sample for measurement, and label according to labeling
procedure 24. Carefully brush or blow out the mold before returning the top on, bearing
in mind temperature safety. 25. Repeat above procedure until desired number of fluidity samples have
been obtained. Labeling Procedure: Fluidity samples and chemistry coupons must be given matching labels which identify the tester and the sample number. For example, one would write ―BD 1‖ on both the fluidity sample and the top rim of the coupon. (Were one running many tests, one might write ―BD 1-1‖ to indicate it is the first sample in the first group.) Measurement Procedure:
26. Coupon evaluation procedure: a. Refer to Spectro procedure, attached b. If the composition of the coupon is outside of that of A356
aluminum, that fluidity test is to be rejected and repeated. 27. Record the length of each finger from the engraved line on the bottom to
the tip, from thickest to thinnest, with the ruler (which is graded in millimeters).
28. The value to be evaluated shall be the arithmetic sum of these lengths

143
Vertical Vacuum Procedure:
Prep procedure:
1. Coat all metal tools (except coupon mold) with hardcoat boron nitride and allow 24 hours for drying (grey)
2. Coat all ceramic surfaces with Lubricoat (white or blue) and allow 24 hours to dry
3. Thermocouple preparation 4. Remove one of the coupon molds from the shelf. 5. Crucible must be of the same size throughout experimentation, and
whenever possible the same crucible should be used throughout. 6. Use induction heating procedure, attached 7. Obtain 35 lb ingot of the metal to be tested (in this case, A356)
a. no degassing (for this experiment) b. no grain refiner added (for this experiment)
8. Attach the compressed air hose (keeping it clear of where it might be exposed to liquid metal) at the fitting.
9. Turn on the flow of air by opening the valve at the wall 10. Plug in extension (keeping it clear of molten metal) 11. Plug in vacuum pump 12. Make sure valve between pump and tank is closed, and that vacuum is
developing according to gage 13. Unplug vacuum pump 14. Test pneumatic jack by turning the valve to the ‗up‘ position and setting
the melt timer to a low temperature (the stage should rise) 15. Set the pneumatic valve to the ‗down‘ position so that the stage lowers
once again, and then set the melt timer to the desired testing temperature (700 C)
16. Attach the (101.6 cm ( 40‖) long, 0.5 cm diameter) Pyrex (borosilicate) glass tube to rubber stopper so that bottom is flush with indicator, as shown. Transfer the glass tube inside the Lexan protective case while keeping the end of the tube at this height (by keeping the rubber stopper at the same height, and cross-checking with the indicator)
c. Bottom of glass tube should be 15.24 cm (6‖) from bottom of lowered platform
17. Attach black hose to end of stopper
Sampling procedure:
18. (Note: With care, testing can be conducted with the induction unit running continuously)

144
19. Plug vacuum pump in. Vacuum pump should not be left on for extended periods between tests.
20. Check to make sure melt timer is on 21. Open the black valve so the end of the glass tube is under vacuum 22. Skim oxide from top of melt with the back of the skimmer 23. Grip the sampling crucible with tongs, and lower it into the melt until full
(but not so full that it will spill on transport or when the pneumatic jack rises)
24. Transfer ladle to inside of plexiglass cabinet 25. Insert a (coated) large size thermocouple into the crucible to determine
when the superheat of the melt has decreased to the desired temperature for testing
a. Watch the melt timer to see when the thermocouple has risen to a temperature above the setpoint (700 C). Pneumatics must not be turned on before this occurs
26. Turn handle to put pneumatics into ‗up‘ position (after thermocouple is in hot melt and melt timer is properly set) so that jack will raise melt into vacuumed tube when it reaches desired temperature
27. Once the desired temperature is reached, the jack will automatically raise the melt and a sample will be taken
28. After sampling has occurred, close black handle and 29. Lower pneumatic jack by moving pneumatic lever to ‗down‘ position 30. Remove thermocouple from melt 31. Pour coupon into coupon mold as soon as possible after preparing to take
the fluidity sample a. After initial solidification, open the coupon mold on at least one
side. If one waits until it cools, this is nearly impossible. 32. Allow time for glass to finish fragmenting
a. Alternately, measure the sample before fragmenting begins and transfer sample to the galvanized steel can. (Measurement is discussed below.)
33. Remove sample for measurement. (Measurement discussed below) 34. It is preferable to remove metal from crucible while still molten or semi-
solid. Some flash can be removed after solidification, but it is hard to empty the whole block out.
35. If the sample‘s fluid length is less than 50-60% of the mean, or if the jack triggered immediately after the pneumatic valve was thrown (and the temperature gage indicates it was either below 700 degrees at this time, or the thermocouple was still heating up and the temp is too high) disregard the result and repeat.
Repeat above procedure until desired number of fluidity samples have been obtained.

145
Labeling Procedure: Chemistry coupons must be given matching labels with the post-vacuum samples which identify the tester and the sample number. For example, one would write ―BD 1‖ on both the fluidity sample (by way of a small piece of tape) and the top rim of the coupon. (Were one running many tests, one might write ―BD 1-1‖ to indicate it is the first sample in the first group.) Measurement Procedure:
36. Coupon evaluation procedure: a. Refer to Spectro procedure, attached b. If the composition of the coupon is outside of that of A356
aluminum, that fluidity test is to be rejected and repeated. Record the length of each the sample from the ‗water line,‘ with the metal ruler (which is graded in millimeters).

146
Appendix I
Phase 2 Procedure

147
Prep procedure:
1. Coat all metal tools (except coupon mold) with hardcoat boron nitride and allow 24 hours for drying (grey)
2. Coat all ceramic surfaces with Lubricoat (white or blue) and allow 24 hours to dry
3. Thermocouple prep 4. Remove one of the coupon molds from the shelf. 5. Crucible must be of the same size throughout experimentation, and
whenever possible the same crucible should be used throughout. It
should be inscribed at a depth of 3 inches (7.62 cm), measured
from the inside, and must be visible during filling. 6. Use the ACRC induction heating procedure 7. Obtain 35 lb ingot of the metal to be tested (in this case, A356)
d. No degassing (unless otherwise specified) e. No grain refiner added (unless otherwise specified)
8. Attach the compressed air hose (keeping it clear of where it might be exposed to liquid metal) at the fitting.
9. Turn on the flow of air by opening the valve at the wall 10. Plug in extension (keeping it clear of molten metal) 11. Test pneumatic jack, vacuum pump, and melt timer 12. Attach the (101.6 cm ( 40‖) long, 0.5 cm diameter) Pyrex (borosilicate)
glass tube to rubber stopper so that bottom is flush with indicator, as shown. Transfer the glass tube inside the Lexan protective case while keeping the end of the tube at this height (by keeping the rubber stopper at the same height, and cross-checking with the indicator)
a. Bottom of glass tube should be 15.24 cm (6‖) from bottom of lowered platform
Sampling procedure:
13. (Note: With care, testing can be conducted with the induction unit running continuously)
14. Switch vacuum pump on. Vacuum pump should not be left on for extended periods between tests.
15. Check to make sure melt timer is on and set to the specified temperature
16. Skim oxide from top of melt with the back of the skimmer 17. Grip the sampling crucible with tongs, and lower it into the melt until it
reaches the fill line. 18. Transfer crucible to inside of the plexiglass cabinet 19. Insert a (coated) large size thermocouple into the crucible to determine
when the superheat of the melt has decreased to the desired temperature for testing

148
a. Watch the melt timer to see when the thermocouple has risen to a temperature above the set point. Pneumatics must not be turned on before this occurs.
b. It may be necessary to pre-warm the thermocouple and mold at the beginning of testing. If it does not reach the target temperature, return the melt to the induction unit and try again.
20. Turn handle to put pneumatics into ‗up‘ position (after thermocouple is in hot melt and melt timer is properly set) so that jack will raise melt into vacuumed tube when it reaches desired temperature
a. See 27 21. Once the desired temperature is reached, the jack will automatically raise
the melt and a sample will be taken 22. Lower pneumatic jack by moving pneumatic lever to ‗down‘ position 23. With one’s chin flat on the corner of the fluidity cart where
indicated and with one’s head upright, measure the height of the sample against the meter stick affixed to the plexiglass with only the right eye.
24. Remove thermocouple from melt 25. Remove the tube and place it into the metal waste bin before it
begins to fragment. a. Alternately, allow time for glass to finish fragmenting and
do not return the glass-rich metal back into the induction unit subsequently
26. Pour the metal from the crucible back into the induction unit. 27. Pour a coupon into coupon mold as soon as possible after preparing to
take the fluidity sample a. After initial solidification, open the coupon mold on at least one
side. If one waits until it cools, this is nearly impossible. b. Often, it is possible to prepare a coupon between turning
the pneumatic valve to the ‘up’ position and the collection of a sample
28. If the sample‘s fluid length is less than 50-60% of the mean, or if the jack triggered immediately after the pneumatic valve was thrown (and the temperature gage indicates it was either below 700 degrees at this time, or the thermocouple was still heating up and the temp is too high) disregard the result and repeat.
Repeat above procedure until desired number of fluidity samples have been obtained. Labeling Procedure:

149
Chemistry coupons must be given matching labels with the post-vacuum samples which identify the tester and the sample number. Measurement Procedure:
29. Coupon evaluation procedure: c. Refer to Spectro procedure d. If the composition of the coupon is outside of that of A356
aluminum, that fluidity test is to be rejected and repeated.
For exact fluidity measurements, it is necessary to subtract the height of the inscribed line and melt stand from the final result, as the meter stick is affixed level with the melt lift stage. Calibration for a user’s line of sight is also required. (See Appendix F for a related nomogram.)

150
Appendix J
Phase 3 Procedure

151
Prep procedure:
1. Coat all metal tools (except coupon mold) with hardcoat boron nitride and allow 24 hours for drying (grey)
2. Coat all ceramic surfaces with Lubricoat (white or blue) and allow 24 hours to dry
3. Thermocouple prep 4. Remove one of the coupon molds from the shelf. 5. Crucible must be of the same size throughout experimentation, and
whenever possible the same crucible should be used throughout. It should be inscribed at a depth of 3 inches (7.62 cm), measured from the outside, and must be visible during filling.
6. Use the ACRC induction heating procedure 7. Obtain 35 lb ingot of the metal to be tested (in this case, A356.2)
a. No degassing (unless otherwise specified) b. No grain refiner added (unless otherwise specified)
8. Attach the compressed air hose (keeping it clear of where it might be exposed to liquid metal) at the fitting.
9. Turn on the flow of air by opening the valve at the wall 10. Plug in extension (keeping it clear of molten metal) 11. Test pneumatic jack, vacuum pump, and melt timer 12. Attach the (101.6 cm (40‖) long, 0.5 cm outer diameter) Pyrex
(borosilicate) glass tube to rubber stopper so that bottom is flush with indicator. Transfer the glass tube inside the Lexan protective case while keeping the end of the tube at this height (by keeping the rubber stopper at the same height, and cross-checking with the indicator)
a. Bottom of glass tube should be 15.24 cm (6‖) from bottom of lowered platform
Sampling procedure:
13. (Note: With care, testing can be conducted with the induction unit running continuously)
14. Switch vacuum pump on. Vacuum pump should not be left on for extended periods between tests.
15. Check to make sure melt timer is on and set to the specified temperature 16. Skim oxide from top of melt with the back of the skimmer 17. Grip the sampling crucible with tongs, and lower it into the melt until it
reaches the fill line. 18. Transfer crucible to inside of the plexiglass cabinet

152
19. Insert a (coated) large size thermocouple into the crucible to determine when the superheat of the melt has decreased to the desired temperature for testing
a. Watch the melt timer to see when the thermocouple has risen to a temperature above the set point. Pneumatics must not be turned on before this occurs.
b. It may be necessary to pre-warm the thermocouple and mold at the beginning of testing. If it does not reach the target temperature, return the melt to the induction unit and try again.
20. Turn handle to put pneumatics into ‗up‘ position (after thermocouple is in hot melt and melt timer is properly set) so that jack will raise melt into vacuumed tube when it reaches desired temperature
a. See 28 21. Once the desired temperature is reached, the jack will automatically raise
the melt and a sample will be taken 22. Lower pneumatic jack by moving pneumatic lever to ‗down‘ position 23. With one‘s chin flat on the corner of the fluidity cart where indicated and
with one‘s head upright, measure the height of the sample against the meter stick affixed to the plexiglass with only the right eye.
24. Remove thermocouple from melt 25. Remove the tube and place it into the metal waste bin before it begins to
fragment. a. Alternately, allow time for glass to finish fragmenting and do not
return the glass-rich metal back into the induction unit subsequently
26. Pour the metal from the crucible back into the induction unit. 27. Prior to the first test, following the last test, and following any
introduction of agents to modify alloy chemistry, conduct a coupon test as follows: Pour a coupon into coupon mold as soon as possible after preparing to take the fluidity sample
a. After initial solidification, open the coupon mold on at least one side. If one waits until it cools, this is nearly impossible.
b. Often, it is possible to prepare a coupon between turning the pneumatic valve to the ‗up‘ position and the collection of a sample
28. If the sample‘s fluid length is less than 50-60% of the mean, or if the jack triggered immediately after the pneumatic valve was thrown (and the temperature gage indicates it was either below 700 degrees at this time, or the thermocouple was still heating up and the temp is too high) disregard the result and repeat.
Repeat above procedure until desired number of fluidity samples have been obtained.
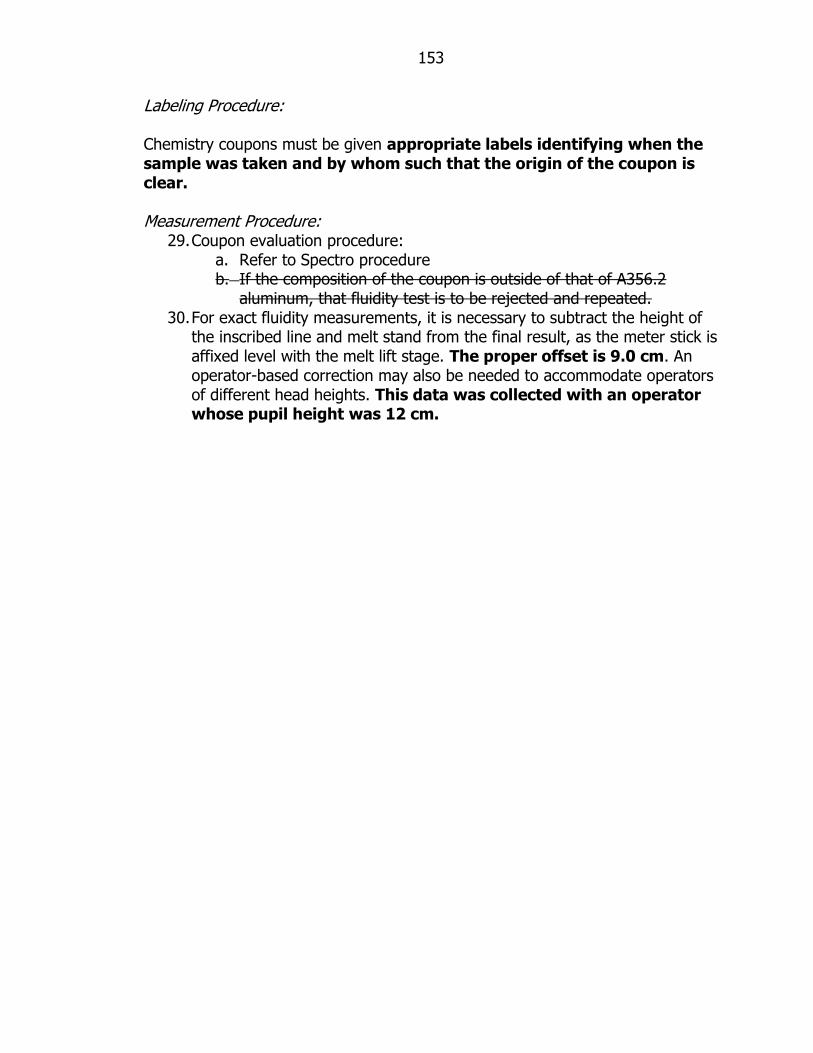
153
Labeling Procedure: Chemistry coupons must be given appropriate labels identifying when the sample was taken and by whom such that the origin of the coupon is clear. Measurement Procedure:
29. Coupon evaluation procedure: a. Refer to Spectro procedure b. If the composition of the coupon is outside of that of A356.2
aluminum, that fluidity test is to be rejected and repeated. 30. For exact fluidity measurements, it is necessary to subtract the height of
the inscribed line and melt stand from the final result, as the meter stick is affixed level with the melt lift stage. The proper offset is 9.0 cm. An operator-based correction may also be needed to accommodate operators of different head heights. This data was collected with an operator whose pupil height was 12 cm.