Embed Size (px)
Citation preview
1
CAST Worldwide Application Software Quality Study – 2010Summary of Key Findings
2
OverviewThis is the first in an annual series of reports highlighting trends in the structural qual-ity of business applications regarding char-acteristics such as robustness, performance, security, and changeability.
The purpose of these CAST reports is to provide an objective, empirical foundation for discussing structural software quality in both the public and the private sector. In this document we summarize some of the key findings extracted from the full report and will answer the following questions.
1. How much of an application’s cost of ownership is caused by structural flaws hidden in its code?
2. Which technology and industry sege-ment score high on application security?
3. Which technology scores lowest on struc-tural problems that could degrade perfor-mance?
4. Which industry segment has applications that are the most difficult to enhance and maintain, and does outsourcing affect these results?
5. Does size affect the quality of an applica-tion?
6. What are the some of the most frequent violations of good architectural and cod-ing practice?
CAST Worldwide Application Software Quality Study — 2010Summary of Key Findings
Structural quality characteristics are critical because they are difficult to detect through standard testing, yet they are the most fre-quent causes of operational problems such as outages, performance degradation, breaches by unauthorized users, or data corruption. The full version of the report provides a deeper analysis of the structural quality characteristics and their trends across indus-try segments and technologies. In addition, the full version also presents the most fre-quent violations of good architectural and coding practice in each technology domain.
The Data SampleThe data in this report, collected over a pe-riod of 3 years, are drawn from 288 applica-tions, representing 108 M lines of code (3.4 M Backfired Function Points), submitted by 75 organizations for static analysis of their structural quality characteristics. The results of these analyses are captured in Appmarq, a structural quality benchmarking repository maintained by CAST. These 75 organiza-tions represent 8 industry segments: energy, finance, insurance, IT consulting, technolo-gy, telecommunications, manufacturing, and government. The organizations are located primarily in North America, Europe, and In-dia. The applications range from 10,000 to 5 million lines of code, with 26% containing less than 50,000 lines of code and 32% fall-ing between 50,000 and 150,000 thousand lines of code. Although these results may not characterize the entire global population of IT business applications, they do emerge from the largest sample of applications ever to be statically analyzed and measured against a full spectrum of structural quality characteristics across different technologies. Consequently, these results present a starting
108 million lines of code
288 custom applications
75 organiza-tions
3 years of data collec-tion
Structural Quality - refers to the non-functional, internal properties of an application, that is, the enginee-ring soundness of an application’s architecture and coding rather than to the correctness with which the application implements functional requirements.
3
point for benchmarking the structural qual-ity of IT business applications.
This summary will concentrate on four struc-tural quality characteristics--robustness, per-formance, security, and changeability. These quality characteristics are computed by ana-lyzing the source code to detect violations of good coding and architectural practice. Scores for each of the structural quality char-acteristics are aggregated from the compo-nent to the application level and computed on a scale of 1.0 (high risk) to 4.0 (low risk), using an algorithm that weights the severity of each violation and its relevance to each individual quality characteristic.
Finding 1—Over $1M of Techni-cal Debt in Average ApplicationSince Technical Debt is a relatively new concept, there is little data on the Technical
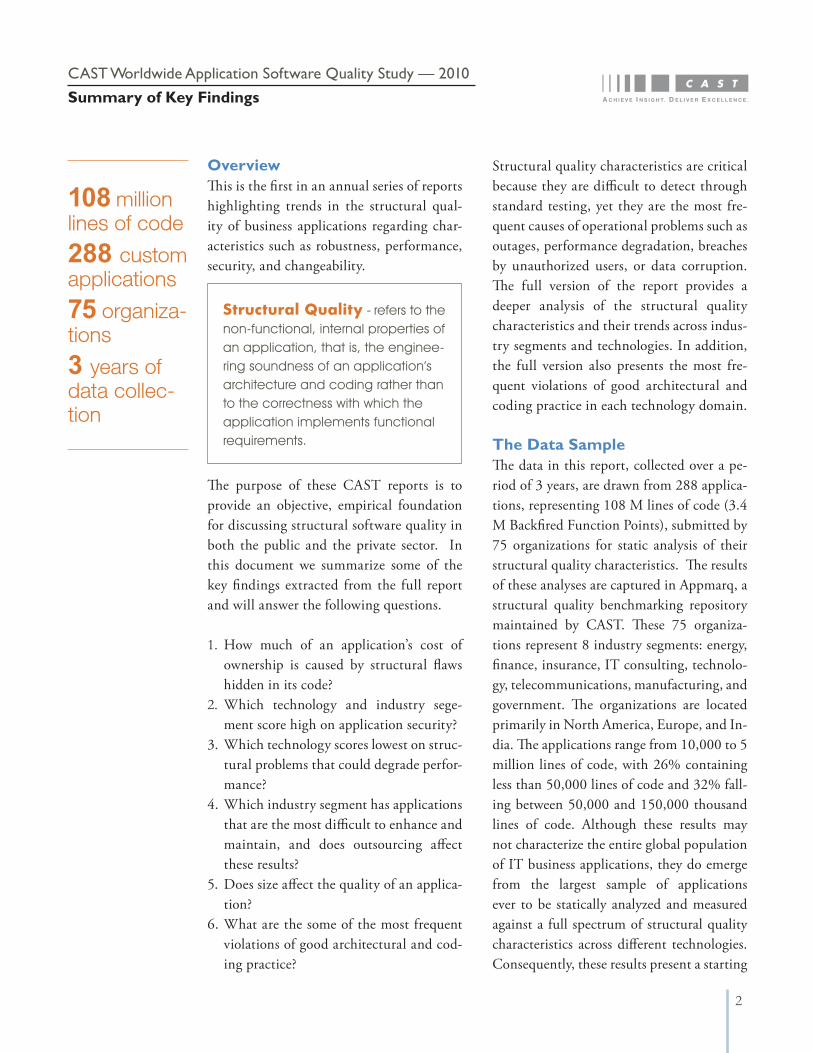
Figure 1. Technical Debt by Technology
Total cost of ownership estimates for projects need to add in $2.8 of technical debt per line of code
Technical Debt - cost of the effort required to fix problems that remain in the code when an application is released to operation. Like financial debt, Technical Debt incurs interest in the form of the extra effort it takes to maintain and enhance an appli-cation due to the structural quality flaws left in the code.
CAST Worldwide Application Software Quality Study — 2010Summary of Key Findings
Debt of a typical application. CAST’s Ap-pmarq benchmarking database provided a unique opportunity to calculate an estimate of Technical Debt based on the number of structural quality flaws at the source code
level. These data provide an objective, em-pirical frame of reference for the developer community. They also provide a platform for characterizing the management tradeoffs between expending resources on correcting
Technology
Tech
nica
l Deb
t ($/
KLO
C)
Oracle 4GLCOBOL .NET Java EE C/C++0
$5,000
$10,000
$15,000
Max
Min
Median25th Percentile
75th Percentile
4
How We Calculate Technical Debt
1. The density of coding violations per thousand lines of
code (KLOC) is derived from the source code analysis
using the CAST Application Intelligence Platform. The
coding violations highlight issues around Security, Perfor-
mance, Robustness and Changeability of the code.
2. Coding violations are categorized into low, medium
and high severity violations. In developing the estimate
of Technical Debt, it is assumed that only 50% of high
severity problems, 25% of moderate severity problems,
and 10% of low severity problems would ultimately be
corrected in the normal course of operating the ap-
plication.
3. A conservative assumption is made that each problem
would take only 1 hour to fix at a burdened cost of $75
per hour. Industry data suggest these numbers could
be higher, especially when the fix is applied during
operation.
4. Technical Debt = (10% of Low Severity Violations + 25%
of Medium Severity Violations + 50% of High Severity
Violations)*No. of Hours to Fix*Cost/Hr.
show that C/C++ applications tend to have a wider distribution of Technical Debt re-sults than applications built in other tech-nologies, although a larger sample of C/C++ applications is needed to characterize this distribution reliably. Looking at the trend in Technical Debt across different technolo-gies, it appears that the higher the level of abstraction in the technology, the lower the Technical Debt. Thus, the higher the level of abstraction, the fewer chances for devel-oper to make mistakes because the platform/framework takes care of more low-level tasks.
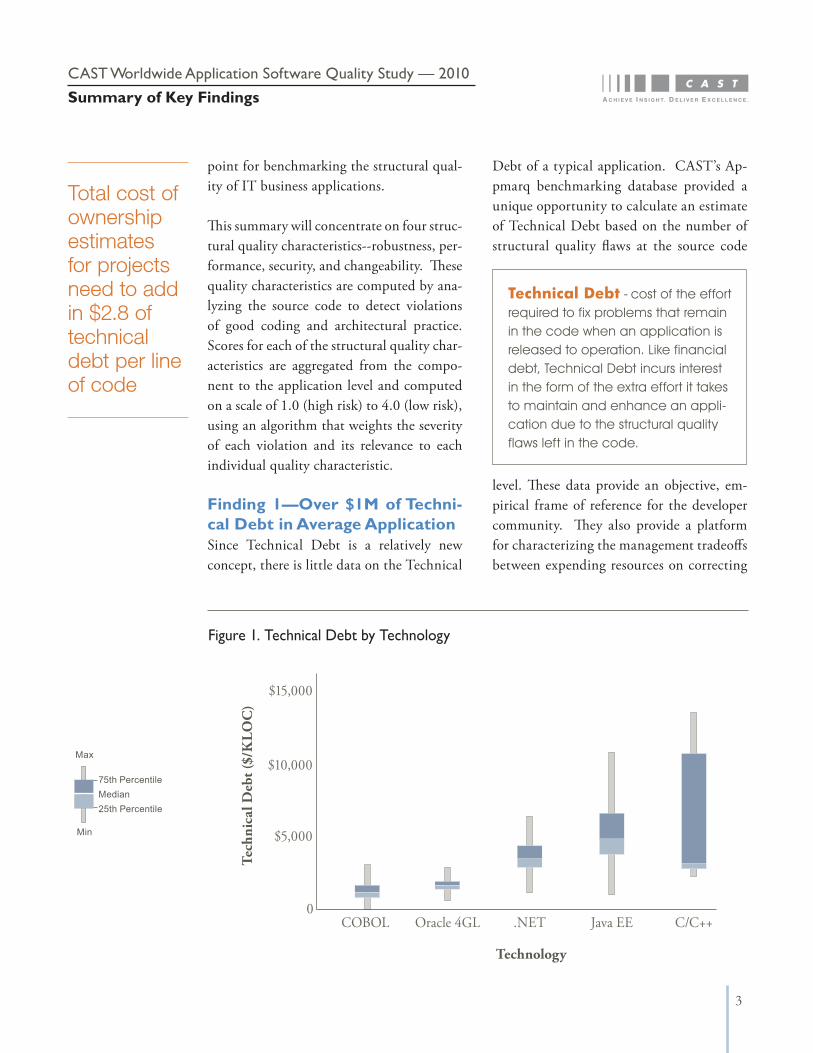
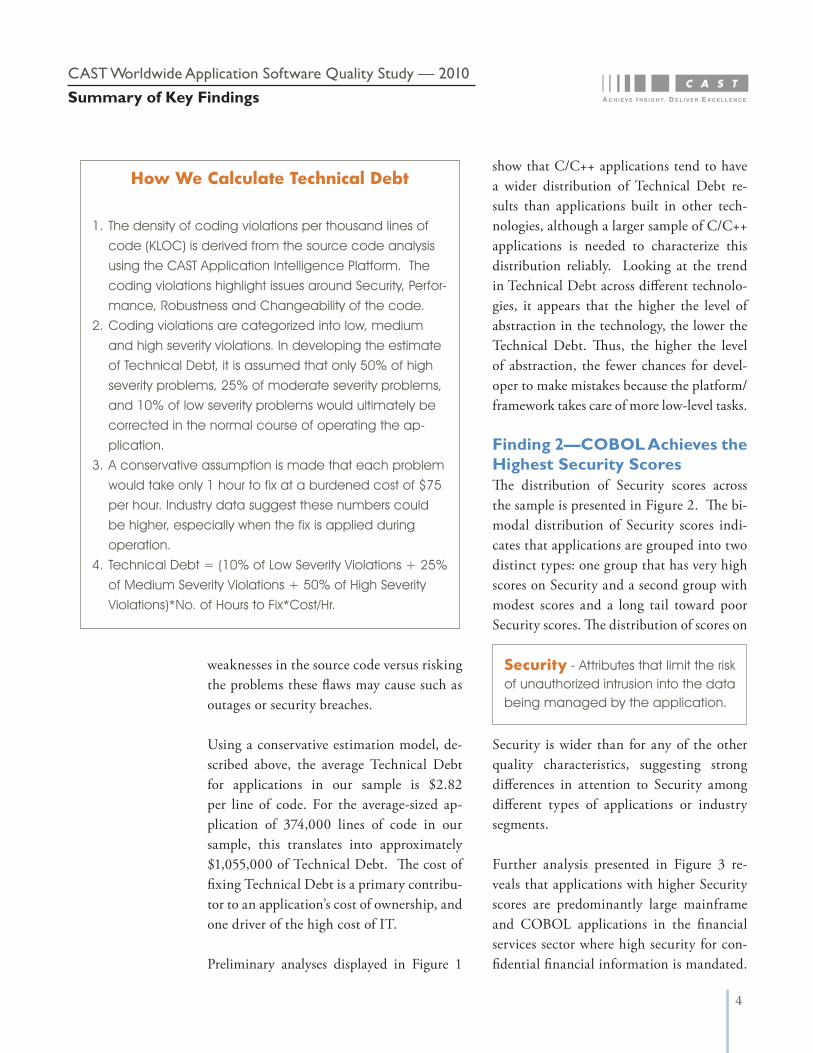
Finding 2—COBOL Achieves the Highest Security ScoresThe distribution of Security scores across the sample is presented in Figure 2. The bi-modal distribution of Security scores indi-cates that applications are grouped into two distinct types: one group that has very high scores on Security and a second group with modest scores and a long tail toward poor Security scores. The distribution of scores on
Security is wider than for any of the other quality characteristics, suggesting strong differences in attention to Security among different types of applications or industry segments.
Further analysis presented in Figure 3 re-veals that applications with higher Security scores are predominantly large mainframe and COBOL applications in the financial services sector where high security for con-fidential financial information is mandated.
weaknesses in the source code versus risking the problems these flaws may cause such as outages or security breaches.
Using a conservative estimation model, de-scribed above, the average Technical Debt for applications in our sample is $2.82 per line of code. For the average-sized ap-plication of 374,000 lines of code in our sample, this translates into approximately $1,055,000 of Technical Debt. The cost of fixing Technical Debt is a primary contribu-tor to an application’s cost of ownership, and one driver of the high cost of IT.
Preliminary analyses displayed in Figure 1
Security - Attributes that limit the risk of unauthorized intrusion into the data being managed by the application.
CAST Worldwide Application Software Quality Study — 2010Summary of Key Findings
5
Figure 2. Distribution of Security Scores
Mainframe-based applications are also less exposed to the security challenges posed to Web-facing applications. Nevertheless, the
lower Security scores for other types of ap-plications is surprising. In particular, .NET applications received some of the lowest Se-
Figure 3. Security Scores by Technology
Techhnology
1
4
3.5
3
2.5
2
1.5
Secu
rity
Sco
re
.NET C/C++ COBOL Java EE Oracle 4GLHigh Risk
Low Risk
0
60
50
40
30
20
10
Security Score
Freq
uenc
y
1.0 2.51.5 3.0 3.5 4.02.0High Risk Low Risk
CAST Worldwide Application Software Quality Study — 2010Summary of Key Findings
COBOL ap-plications in Financial Services score the highest in terms of Se-curity
Max
Min
Median25th Percentile
75th Percentile
6
curity scores. These data suggest that the IT community’s attention to security may be primarily driven by compliance regulations within industry segments.
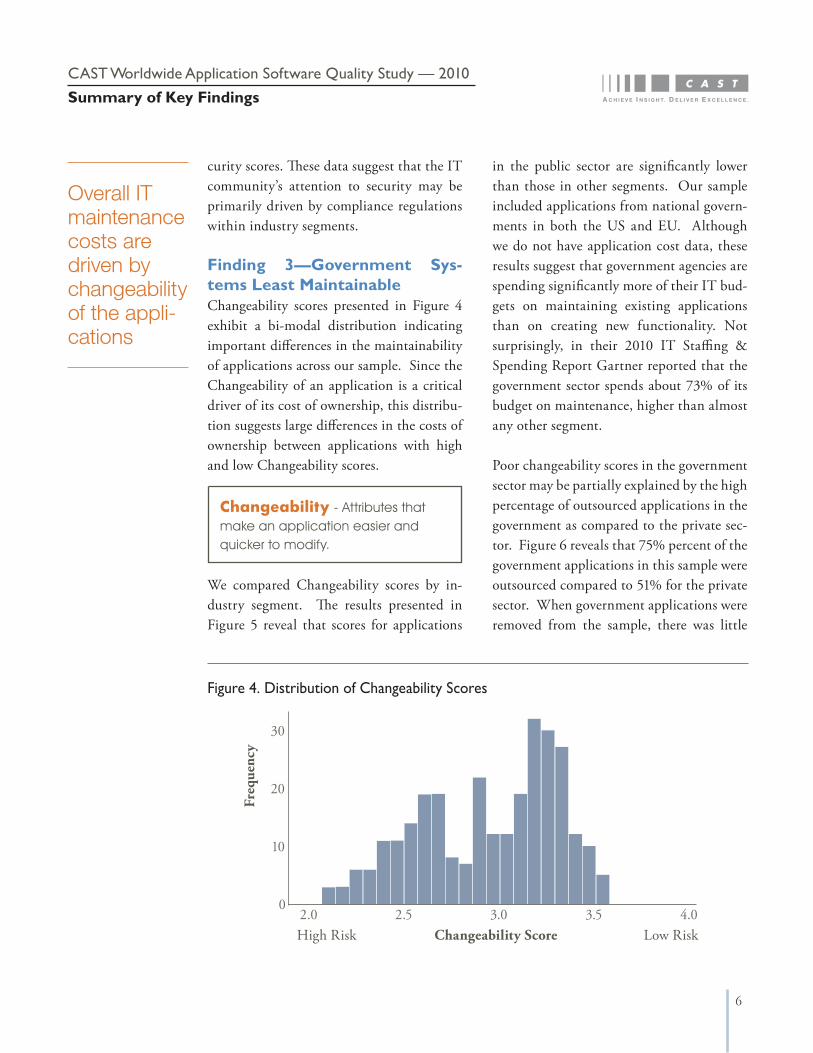
Finding 3—Government Sys-tems Least MaintainableChangeability scores presented in Figure 4 exhibit a bi-modal distribution indicating important differences in the maintainability of applications across our sample. Since the Changeability of an application is a critical driver of its cost of ownership, this distribu-tion suggests large differences in the costs of ownership between applications with high and low Changeability scores.
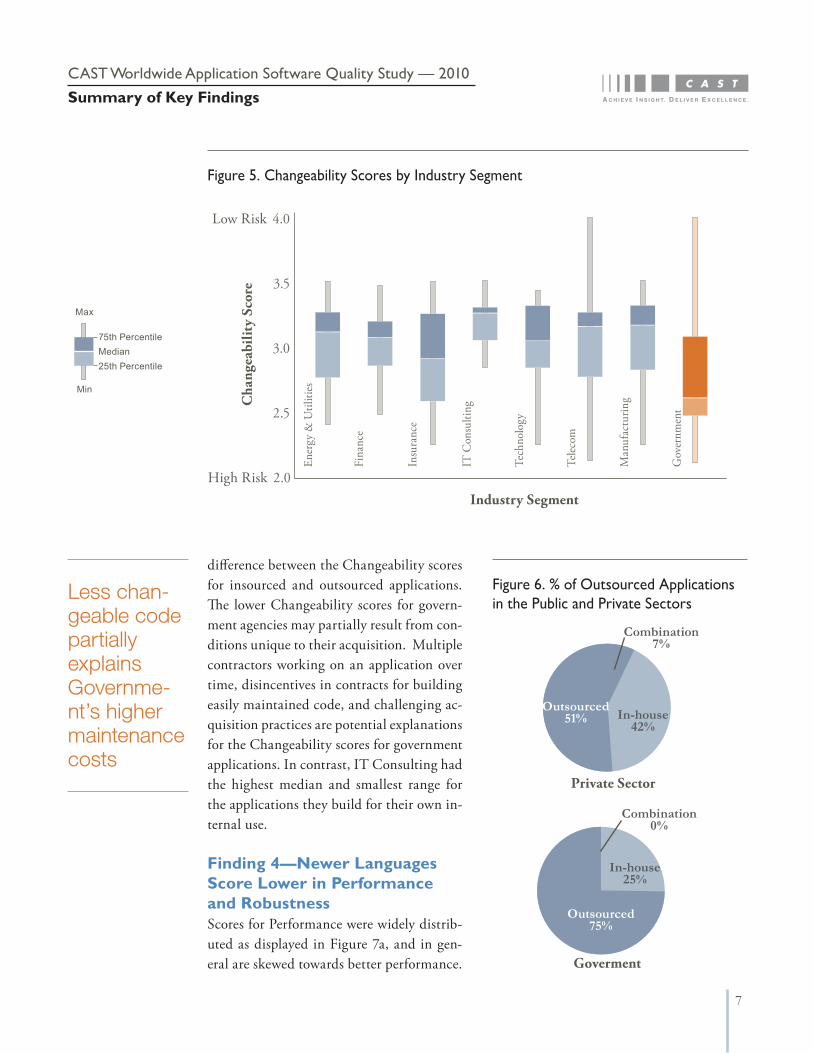
We compared Changeability scores by in-dustry segment. The results presented in Figure 5 reveal that scores for applications
Changeability - Attributes that make an application easier and quicker to modify.
Figure 4. Distribution of Changeability Scores
Changeability Score
0
30
20
10
2.0 2.5 3.0 3.5 4.0
Freq
uenc
y
High Risk Low Risk
CAST Worldwide Application Software Quality Study — 2010Summary of Key Findings
in the public sector are significantly lower than those in other segments. Our sample included applications from national govern-ments in both the US and EU. Although we do not have application cost data, these results suggest that government agencies are spending significantly more of their IT bud-gets on maintaining existing applications than on creating new functionality. Not surprisingly, in their 2010 IT Staffing & Spending Report Gartner reported that the government sector spends about 73% of its budget on maintenance, higher than almost any other segment.
Poor changeability scores in the government sector may be partially explained by the high percentage of outsourced applications in the government as compared to the private sec-tor. Figure 6 reveals that 75% percent of the government applications in this sample were outsourced compared to 51% for the private sector. When government applications were removed from the sample, there was little
Overall IT maintenance costs are driven by changeability of the appli-cations
7
Figure 5. Changeability Scores by Industry Segment
Industry Segment
Cha
ngea
bilit
y Sc
ore
Ener
gy &
Util
ities
Fina
nce
Insu
ranc
e
IT C
onsu
lting
Tech
nolo
gy
Telec
om
Man
ufac
turin
g
Gov
ernm
ent
2.0
4.0
3.5
3.0
2.5
High Risk
Low Risk
Figure 6. % of Outsourced Applications in the Public and Private Sectors
Combination 0%
Goverment
Outsourced 75%
In-house 25%
Combination 7%
Private Sector
Outsourced 51% In-house
42%
difference between the Changeability scores for insourced and outsourced applications. The lower Changeability scores for govern-ment agencies may partially result from con-ditions unique to their acquisition. Multiple contractors working on an application over time, disincentives in contracts for building easily maintained code, and challenging ac-quisition practices are potential explanations for the Changeability scores for government applications. In contrast, IT Consulting had the highest median and smallest range for the applications they build for their own in-ternal use.
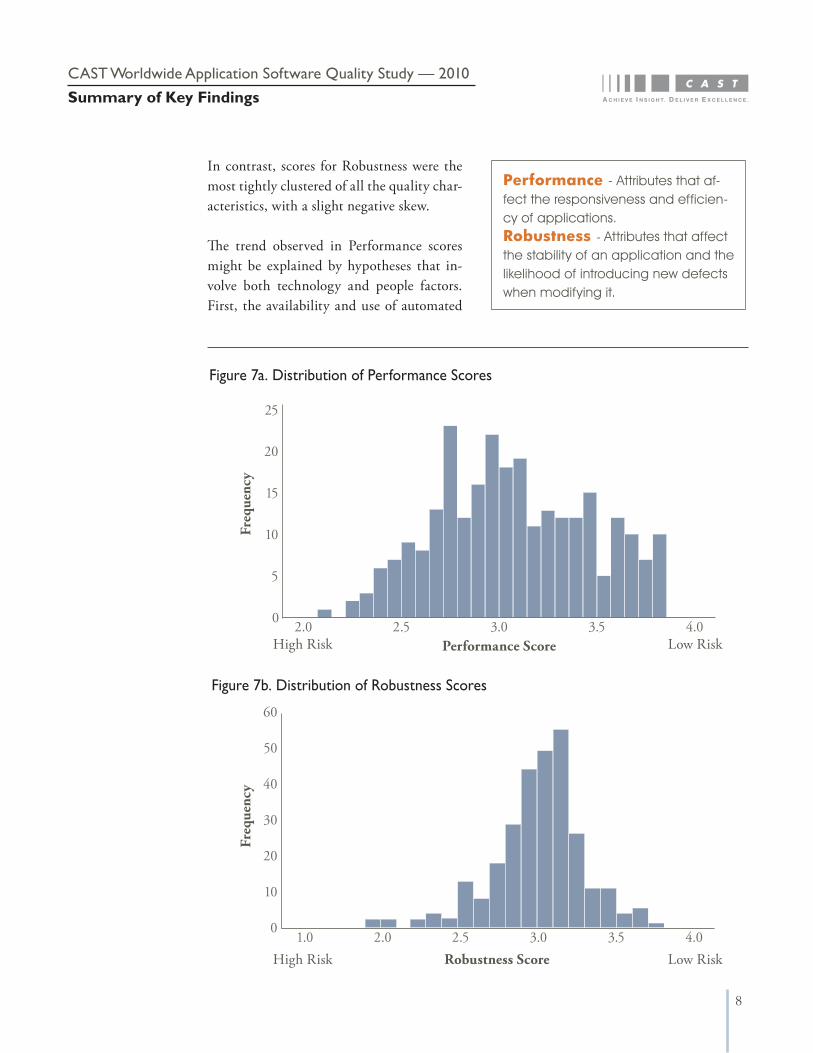
Finding 4—Newer Languages Score Lower in Performance and Robustness Scores for Performance were widely distrib-uted as displayed in Figure 7a, and in gen-eral are skewed towards better performance.
CAST Worldwide Application Software Quality Study — 2010Summary of Key Findings
Max
Min
Median25th Percentile
75th Percentile
Less chan-geable code partially explains Governme-nt’s higher maintenance costs
8
In contrast, scores for Robustness were the most tightly clustered of all the quality char-acteristics, with a slight negative skew.
The trend observed in Performance scores might be explained by hypotheses that in-volve both technology and people factors. First, the availability and use of automated
Performance - Attributes that af-fect the responsiveness and efficien-cy of applications. Robustness - Attributes that affect the stability of an application and the likelihood of introducing new defects when modifying it.
CAST Worldwide Application Software Quality Study — 2010Summary of Key Findings
Figure 7a. Distribution of Performance Scores
Freq
uenc
y
Figure 7b. Distribution of Robustness Scores
0
25
20
15
10
2.0 2.5 3.0 3.5 4.0
5
Performance Score
Freq
uenc
y
High Risk Low Risk
0
60
50
40
30
1.0 2.52.0 3.0 3.5 4.0
10
20
Robustness ScoreHigh Risk Low Risk
9
performance testing solutions has made performance problems easier to detect and address during development. Most modern testing platforms have embedded modules to test the performance of applications. Al-though they do not check the performance issues at the code level, they do highlight
bottlenecks and attune developers to critical performance problems that could slow down an application or cause it to crash. Organiza-tions using these tools would be expected to post high Performance scores. Second, per-formance is one of the most visceral quality characteristics, especially to end users whose
CAST Worldwide Application Software Quality Study — 2010Summary of Key Findings
Figure 8a. Performance Scores by Technology
Figure 8b. Robustness Scores by Technology
Technology
C/C++.NET COBOL Java EE Oracle 4GL
4.0
Perf
orm
ance
Sco
re
2.0
3.5
3.0
2.5
High Risk
Low Risk
Technology
C/C++.NET COBOL Java EE Oracle 4GL
Rob
ustn
ess S
core
2.0
4.0
3.5
3.0
2.5
High Risk
Low Risk
Max
Min
Median25th Percentile
75th Percentile
10
productivity it impacts. It is not uncommon for end-users to complain vociferously to the development team about slow performance, prioritizing the remediation of performance problems over other quality problems such as poor maintainability.
Further analysis of these data presented in Figure 8a reveals that Java EE applications were found to have significantly lower Per-formance scores than other languages. .NET applications displayed the same trend, but not as strongly as Java EE. However, modu-larity might partially explain the lower Per-formance scores in .NET and Java EE, as discussed in Finding 4, since poor design or excessive modularity can adversely impact on the performance of applications.
Finding 5—Modularity Minimiz-es the Effect of Size on QualityAppmarq data contradict the conventional
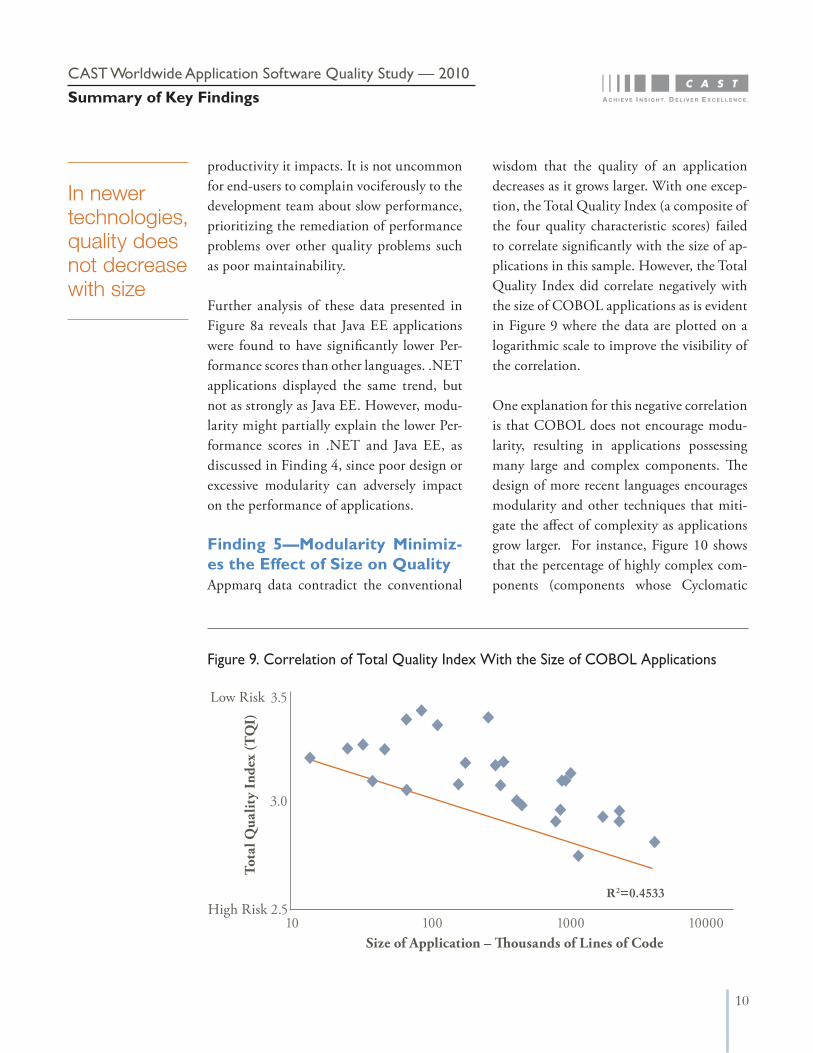
wisdom that the quality of an application decreases as it grows larger. With one excep-tion, the Total Quality Index (a composite of the four quality characteristic scores) failed to correlate significantly with the size of ap-plications in this sample. However, the Total Quality Index did correlate negatively with the size of COBOL applications as is evident in Figure 9 where the data are plotted on a logarithmic scale to improve the visibility of the correlation.
One explanation for this negative correlation is that COBOL does not encourage modu-larity, resulting in applications possessing many large and complex components. The design of more recent languages encourages modularity and other techniques that miti-gate the affect of complexity as applications grow larger. For instance, Figure 10 shows that the percentage of highly complex com-ponents (components whose Cyclomatic
CAST Worldwide Application Software Quality Study — 2010Summary of Key Findings
Figure 9. Correlation of Total Quality Index With the Size of COBOL Applications
R2=0.4533
Size of Application – Thousands of Lines of Code
2.510 100 1000 10000
3.5
3.0
Tota
l Qua
lity
Inde
x (T
QI)
High Risk
Low Risk
In newer technologies, quality does not decrease with size

11
Complexity is 30 or greater) in COBOL applications is much higher than in other languages, while for the newer Object Ori-ented Technologies like Java EE and .NET this percentage is lower, consistent with the objectives of object-oriented design. Modu-larity can also explain the poor Performance scores in .NET and Java EE, as discussed in Finding 4, since high levels of modularity can adversely impact the performance of ap-plications.
Finding 6—The GOTO Is Eter-nal (and other top violations)! The following two findings highlight com-mon mistakes being made by developers. The full version of the report provides lists of the top violations by technology domain.
GOTO Considered Eternal: It has been more than 40 years since the eminent computer scientist, Prof. Edsger Dijkstra, assailed the GOTO statement as a construct that made programs needlessly complex and defect-prone. Dijkstra’s letter to the editor of the
Communications of the ACM in 1968 ti-tled ‘GOTO Considered Harmful’ is often regarded as the beginning of the structured programming movement, a collection of practices now taught in every introductory programming course.
Although most modern programming lan-guages have eliminated the GOTO state-ment, older languages such as COBOL still allow them. It is then shocking to observe that there were 334,249 GOTO statements detected in the 33.4 million lines of code contained in the 30 COBOL applications analyzed in this study -- roughly 1 GOTO statement in every 100 lines of code! Even after years of maintenance and refactor-ing, these damaging constructs still infest COBOL applications, suggesting that, like cockroaches, GOTOs are eternal.
Hidden Complexity: A common violation oc-curring frequently across most technolgies is high fan-out of connections to other compo-nents in the application. This violation oc-
CAST Worldwide Application Software Quality Study — 2010Summary of Key Findings
Figure 10. Percent of Components That are Highly Complex in Applications
Max
Min
Median25th Percentile
75th Percentile
Technology
% o
f Hig
h C
ompl
ex O
bjec
ts
C/C++.NET COBOL Java EE Oracle 4GL0
100
80
60
40
20
12
curred frequently in Java, .NET, COBOL, ABAP, and C/C++. The application-level complexity associated with high fan-out components dramatically increases the time required to make changes or enhancements to the application. The more complex the connections between components, the lon-ger it takes to design, implement, and test a change, thus driving up the cost of owner-ship and increasing the time needed to de-liver functionality to the business.
Observations such as these indicate that best design and coding practices are often slow to be adopted. In some cases organizations do not want to reduce the complexity of code that appears to be running correctly, even if cost of ownership and time to deliver en-hancements could be reduced by refactoring the code. These observations may also iden-tify the need for continued developer train-ing in best design and coding practices.
Summary of Key FindingsResults reported in the previous sections re-vealed the following trends in the structural quality of business applications:
1. COBOL programs achieve the highest scores for security.
2. Newer technology platforms like Java EE and .NET showed poor Performance scores, relative to Mainframe or 3GL technologies.
3. Public Sector applications showed signifi-
cantly lower Changeability scores, consistent with reports of higher main-tenance spend in the public sector com-pared to the private sector.
4. The conventional wisdom that the quality of an application decreases as its size in-creases is not true so long as the applica-tion is properly modularized. Modularity helps reduce the complexity introduced by growing size of applications.
5. The average business application, about 374K lines of code, has over $1 Million in Technical Debt.
6. Even 40 years after the eminent com-puter scientist Edsger Dijkstra assailed the GOTO statement as a construct that made programs needlessly complex and defect-prone, there is, on average, 1 GOTO statement in every 100 lines of COBOL code! Coding best practices are slow to be adopted.
The observations from these data suggest that development organizations are focused most heavily on performance and security in certain critical applications. Less atten-tion appears to be focused on removing the maintainability problems that increase the cost of ownership and reduce responsive-ness to business needs. These results suggest that IT executives are still mostly in reaction mode to immediate business demands rather than being proactive in addressing the long-term causes of IT costs.
CAST Worldwide Application Software Quality Study — 2010Summary of Key Findings
IT executives are yet una-ble to master the tradeoff between im-mediate pain and long term cost
13
For more information, please visit research.castsoftware.com
CAST Research Labs
CAST Research Labs (CRL) was established to further the empirical study of custom software
implementation in business technology. Starting in 2007, CRL has been collecting metrics and
structural characteristics from custom applications deployed by large, IT-intensive enterprises
across North America, Europe and India. This unique dataset, currently standing at approxi-
mately 500 applications, forms a basis to analyze actual software implementation in industry.
CRL focuses on the scientific analysis of large software applications to discover insights that
can improve their structural quality. CRL provides practical advice and annual benchmarks
to the global application development community, as well as interacting with the academic
community and contributing to the scientific literature.
As a baseline, each year CRL will be publishing a detailed report of software trends found
in the industry repository. The executive summary of the report can be downloaded free of
charge by clicking on the link below. The full report can be purchased by contacting the CAST
Information Center at +1 (877) 852 2278.
AuthorsJay Sappidi, Technical Director, CAST Research LabsDr. Bill Curtis, CAST Chief Scientist and Senior Vice President, CAST Research LabsDr. Jitendra Subramanyam, Director of Productivity Research, CAST Research Labs


![Cybersecurity: balancing risks and controls for ÕfYf[]hjg ...docs.media.bitpipe.com/io_10x/io_102267/item_465972/Cyber_securi… · UK law in 2018. Richard Brown, Partner in EY’s](https://img.pdfslide.us/doc/110x75/5ecfca52bf7e33536e631ed2/cybersecurity-balancing-risks-and-controls-for-fyfhjg-docsmedia-uk-law.jpg)