Embed Size (px)
Citation preview
Cass Freight Index® Report
January 2019
JANUARY 2019
Cass Freight Index® Report
www.cassinfo.com | © 2019 Cass Information Systems 2 To receive this report on a monthly basis, sign up
Economic Outlook from Freight’s Perspective
Financial Markets Rebound, Transportation Economy Strong Against Tough
Comparisons
January
2019
Year-over-year
change
2 year stacked
change
Month-to-month
change
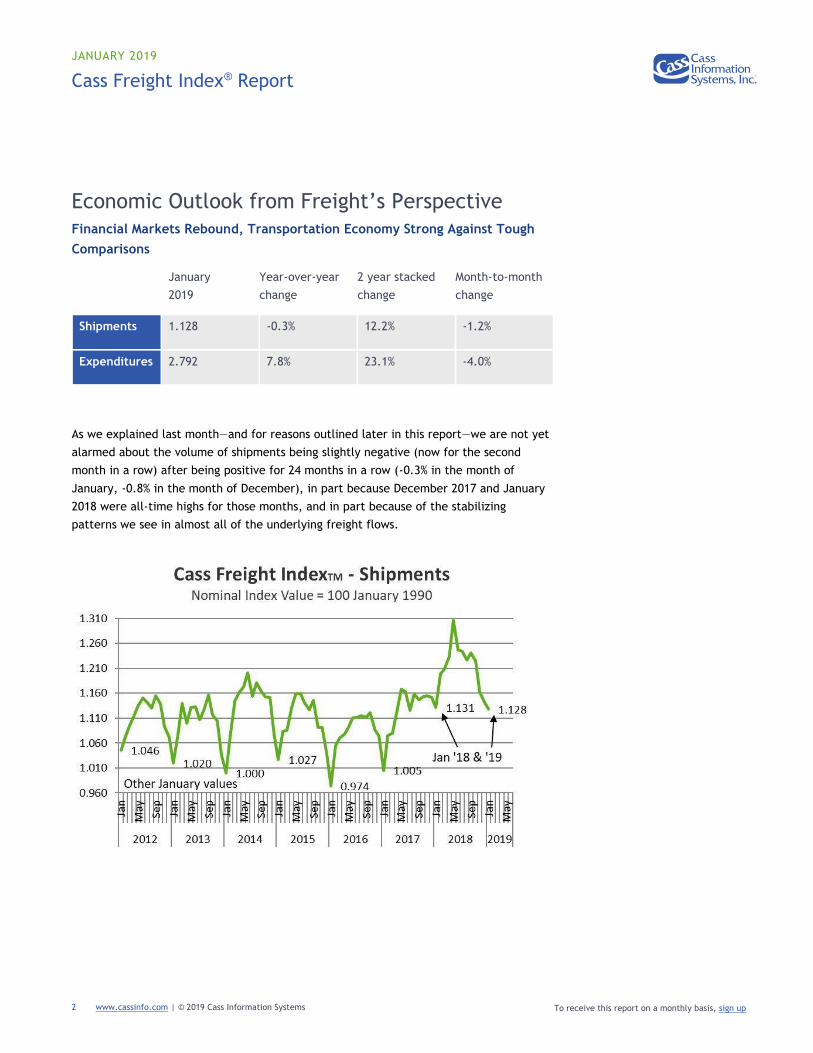
Shipments 1.128 -0.3% 12.2% -1.2%
Expenditures 2.792 7.8% 23.1% -4.0%
As we explained last month—and for reasons outlined later in this report—we are not yet
alarmed about the volume of shipments being slightly negative (now for the second
month in a row) after being positive for 24 months in a row (-0.3% in the month of
January, -0.8% in the month of December), in part because December 2017 and January
2018 were all-time highs for those months, and in part because of the stabilizing
patterns we see in almost all of the underlying freight flows.
JANUARY 2019
Cass Freight Index® Report
www.cassinfo.com | © 2019 Cass Information Systems 3 To receive this report on a monthly basis, sign up
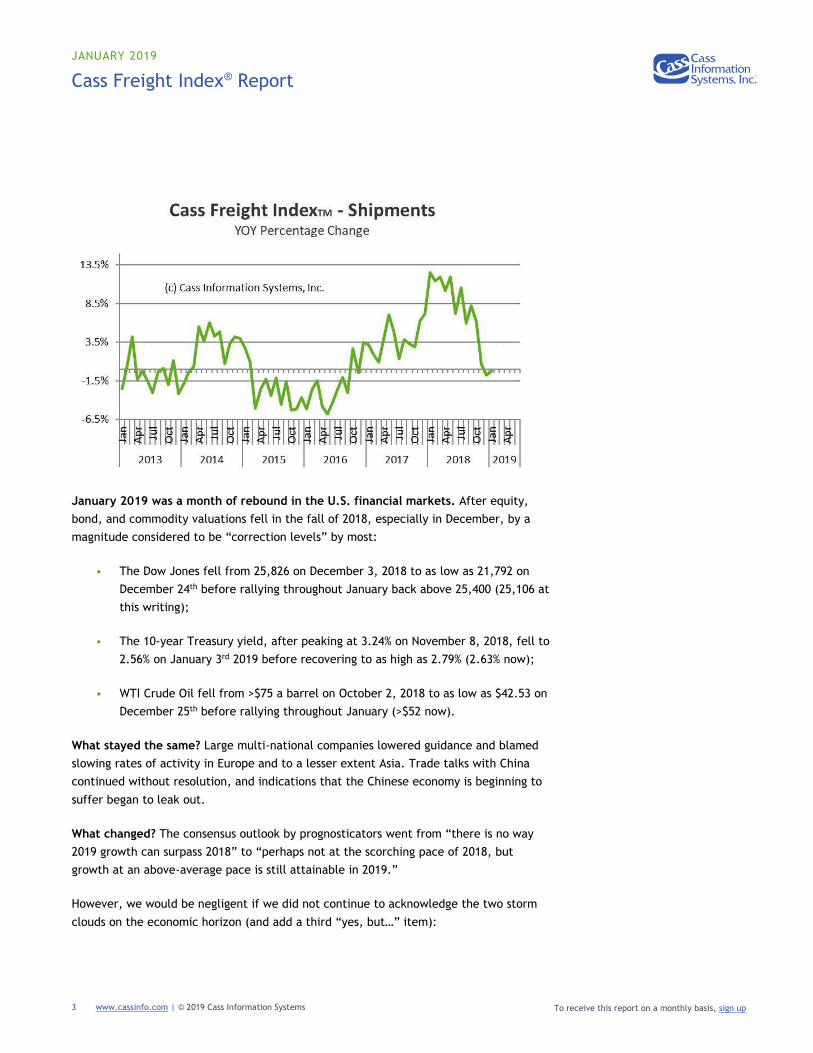
January 2019 was a month of rebound in the U.S. financial markets. After equity,
bond, and commodity valuations fell in the fall of 2018, especially in December, by a
magnitude considered to be “correction levels” by most:
• The Dow Jones fell from 25,826 on December 3, 2018 to as low as 21,792 on
December 24th before rallying throughout January back above 25,400 (25,106 at
this writing);
• The 10-year Treasury yield, after peaking at 3.24% on November 8, 2018, fell to
2.56% on January 3rd 2019 before recovering to as high as 2.79% (2.63% now);
• WTI Crude Oil fell from >$75 a barrel on October 2, 2018 to as low as $42.53 on
December 25th before rallying throughout January (>$52 now).
What stayed the same? Large multi-national companies lowered guidance and blamed
slowing rates of activity in Europe and to a lesser extent Asia. Trade talks with China
continued without resolution, and indications that the Chinese economy is beginning to
suffer began to leak out.
What changed? The consensus outlook by prognosticators went from “there is no way
2019 growth can surpass 2018” to “perhaps not at the scorching pace of 2018, but
growth at an above-average pace is still attainable in 2019.”
However, we would be negligent if we did not continue to acknowledge the two storm
clouds on the economic horizon (and add a third “yes, but…” item):
JANUARY 2019
Cass Freight Index® Report
www.cassinfo.com | © 2019 Cass Information Systems 4 To receive this report on a monthly basis, sign up
1. The tariffs and threats of even higher tariffs with China, the world’s second
largest economy (even though the latest headlines and tweets suggest there
may be a resolution). Tariffs have throttled volumes in some areas of the U.S.
economy, most notably agriculture exports and other select raw materials.
2. The decline in WTI crude in December to as low as $42.50 a barrel. This did
not fall below the marginal cost of production for fracked crude in almost all
areas of the U.S., but it made it less profitable and significantly lowered the
incentive to drill ever more holes, effectively slowing the rate of growth in the
industrial economy. Crude’s recent rally (WTI above $52 as we write this) gives
us a momentary sigh of relief. Continued strength in the price of crude makes
us more confident in our positive outlook for the U.S. industrial economy and
less worried about global demand.
3. Yes, but… the Federal Government shutdown is over, but not after leaving its
mark. The Federal Government is more than 6.5% of the GDP. While not all
government spending and services were furloughed during the shutdown, we
estimate that it directly presents a 0.5 percentage point headwind to the Q1
2019 results. What is more difficult to predict is the amount, and rate at
which, the decline in output will be recouped before the end of the current
quarter or in the second quarter. At a minimum, we know that it effectively
delayed the reporting of the 4Q 2018 GDP by approximately 30 days (on
February 28th versus the originally scheduled January 30th). Longer term, we
expect little to no effect on the economy, but admit it may lower the reported
results of Q1 2019.
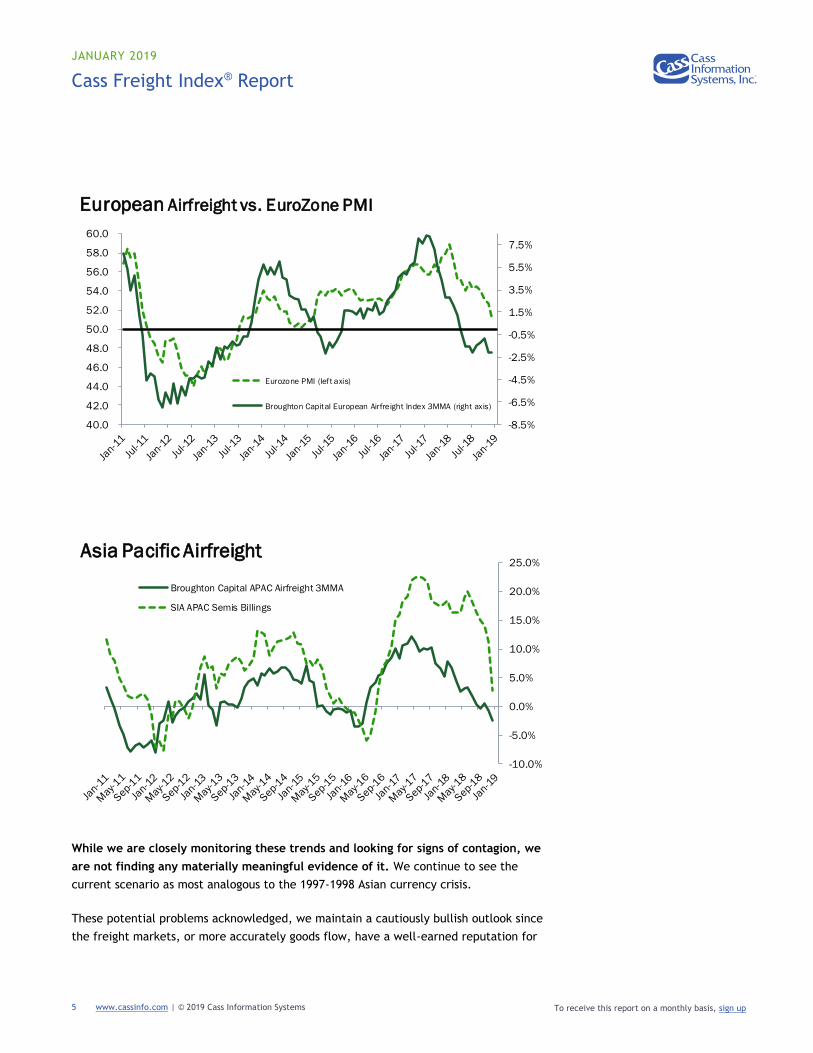
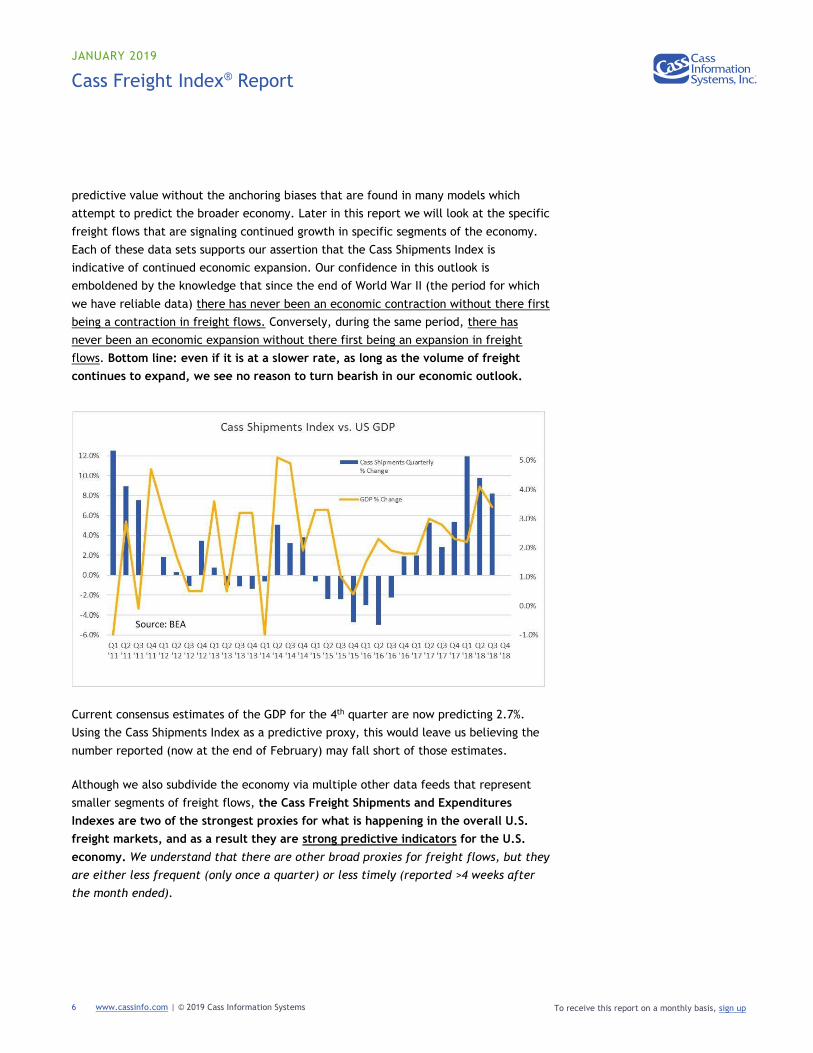
Recent airfreight volumes in both Europe and Asia suggest that those economies
have cooled. As we’ve outlined, trade tariffs that slow the rate of growth for our global
trading partners pose a real threat to the U.S. rate of economic growth.
JANUARY 2019
Cass Freight Index® Report
www.cassinfo.com | © 2019 Cass Information Systems 5 To receive this report on a monthly basis, sign up
While we are closely monitoring these trends and looking for signs of contagion, we
are not finding any materially meaningful evidence of it. We continue to see the
current scenario as most analogous to the 1997-1998 Asian currency crisis.
These potential problems acknowledged, we maintain a cautiously bullish outlook since
the freight markets, or more accurately goods flow, have a well-earned reputation for
-8.5%
-6.5%
-4.5%
-2.5%
-0.5%
1.5%
3.5%
5.5%
7.5%
40.0
42.0
44.0
46.0
48.0
50.0
52.0
54.0
56.0
58.0
60.0
Eurozone PMI (left axis)
Broughton Capital European Airfreight Index 3MMA (right axis)
European Airfreight vs. EuroZone PMI
-10.0%
-5.0%
0.0%
5.0%
10.0%
15.0%
20.0%
25.0%
Broughton Capital APAC Airfreight 3MMA
SIA APAC Semis Billings
Asia Pacific Airfreight
JANUARY 2019
Cass Freight Index® Report
www.cassinfo.com | © 2019 Cass Information Systems 6 To receive this report on a monthly basis, sign up
predictive value without the anchoring biases that are found in many models which
attempt to predict the broader economy. Later in this report we will look at the specific
freight flows that are signaling continued growth in specific segments of the economy.
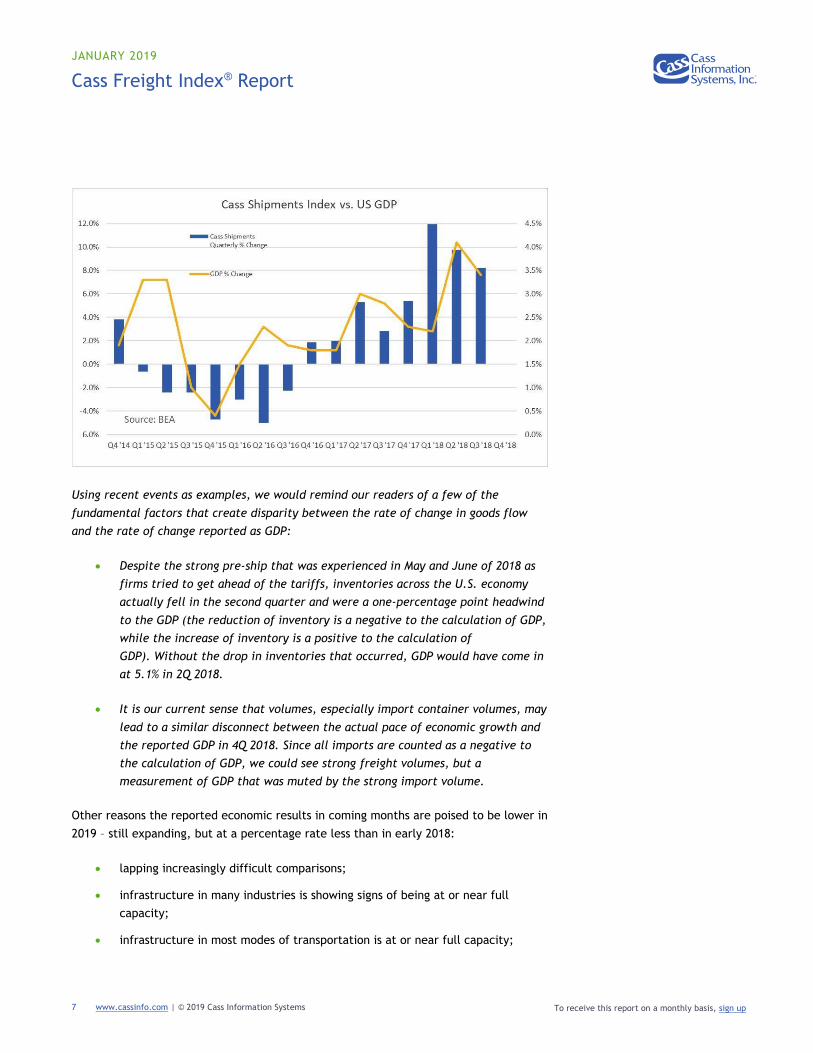
Each of these data sets supports our assertion that the Cass Shipments Index is
indicative of continued economic expansion. Our confidence in this outlook is
emboldened by the knowledge that since the end of World War II (the period for which
we have reliable data) there has never been an economic contraction without there first
being a contraction in freight flows. Conversely, during the same period, there has
never been an economic expansion without there first being an expansion in freight
flows. Bottom line: even if it is at a slower rate, as long as the volume of freight
continues to expand, we see no reason to turn bearish in our economic outlook.
Current consensus estimates of the GDP for the 4th quarter are now predicting 2.7%.
Using the Cass Shipments Index as a predictive proxy, this would leave us believing the
number reported (now at the end of February) may fall short of those estimates.
Although we also subdivide the economy via multiple other data feeds that represent
smaller segments of freight flows, the Cass Freight Shipments and Expenditures
Indexes are two of the strongest proxies for what is happening in the overall U.S.
freight markets, and as a result they are strong predictive indicators for the U.S.
economy. We understand that there are other broad proxies for freight flows, but they
are either less frequent (only once a quarter) or less timely (reported >4 weeks after
the month ended).
JANUARY 2019
Cass Freight Index® Report
www.cassinfo.com | © 2019 Cass Information Systems 7 To receive this report on a monthly basis, sign up
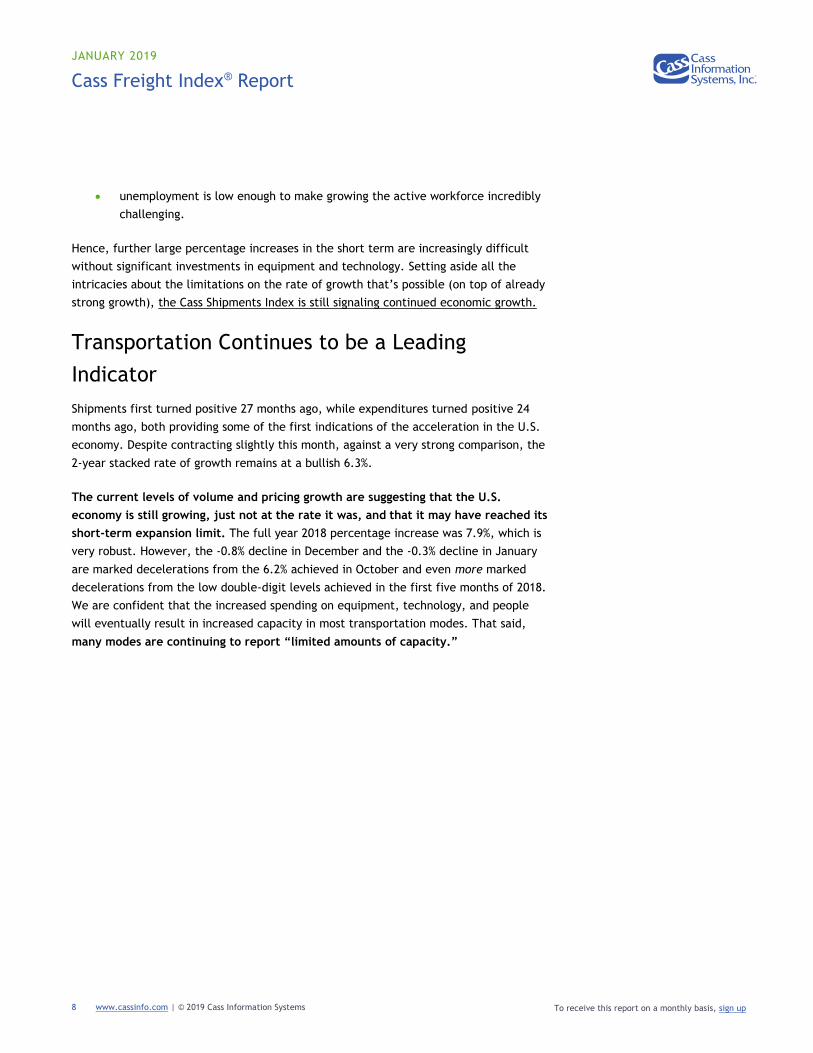
Using recent events as examples, we would remind our readers of a few of the
fundamental factors that create disparity between the rate of change in goods flow
and the rate of change reported as GDP:
• Despite the strong pre-ship that was experienced in May and June of 2018 as
firms tried to get ahead of the tariffs, inventories across the U.S. economy
actually fell in the second quarter and were a one-percentage point headwind
to the GDP (the reduction of inventory is a negative to the calculation of GDP,
while the increase of inventory is a positive to the calculation of
GDP). Without the drop in inventories that occurred, GDP would have come in
at 5.1% in 2Q 2018.
• It is our current sense that volumes, especially import container volumes, may
lead to a similar disconnect between the actual pace of economic growth and
the reported GDP in 4Q 2018. Since all imports are counted as a negative to
the calculation of GDP, we could see strong freight volumes, but a
measurement of GDP that was muted by the strong import volume.
Other reasons the reported economic results in coming months are poised to be lower in
2019 – still expanding, but at a percentage rate less than in early 2018:
• lapping increasingly difficult comparisons;
• infrastructure in many industries is showing signs of being at or near full
capacity;
• infrastructure in most modes of transportation is at or near full capacity;
JANUARY 2019
Cass Freight Index® Report
www.cassinfo.com | © 2019 Cass Information Systems 8 To receive this report on a monthly basis, sign up
• unemployment is low enough to make growing the active workforce incredibly
challenging.
Hence, further large percentage increases in the short term are increasingly difficult
without significant investments in equipment and technology. Setting aside all the
intricacies about the limitations on the rate of growth that’s possible (on top of already
strong growth), the Cass Shipments Index is still signaling continued economic growth.
Transportation Continues to be a Leading
Indicator
Shipments first turned positive 27 months ago, while expenditures turned positive 24
months ago, both providing some of the first indications of the acceleration in the U.S.
economy. Despite contracting slightly this month, against a very strong comparison, the
2-year stacked rate of growth remains at a bullish 6.3%.
The current levels of volume and pricing growth are suggesting that the U.S.
economy is still growing, just not at the rate it was, and that it may have reached its
short-term expansion limit. The full year 2018 percentage increase was 7.9%, which is
very robust. However, the -0.8% decline in December and the -0.3% decline in January
are marked decelerations from the 6.2% achieved in October and even more marked
decelerations from the low double-digit levels achieved in the first five months of 2018.
We are confident that the increased spending on equipment, technology, and people
will eventually result in increased capacity in most transportation modes. That said,
many modes are continuing to report “limited amounts of capacity.”
JANUARY 2019
Cass Freight Index® Report
www.cassinfo.com | © 2019 Cass Information Systems 9 To receive this report on a monthly basis, sign up
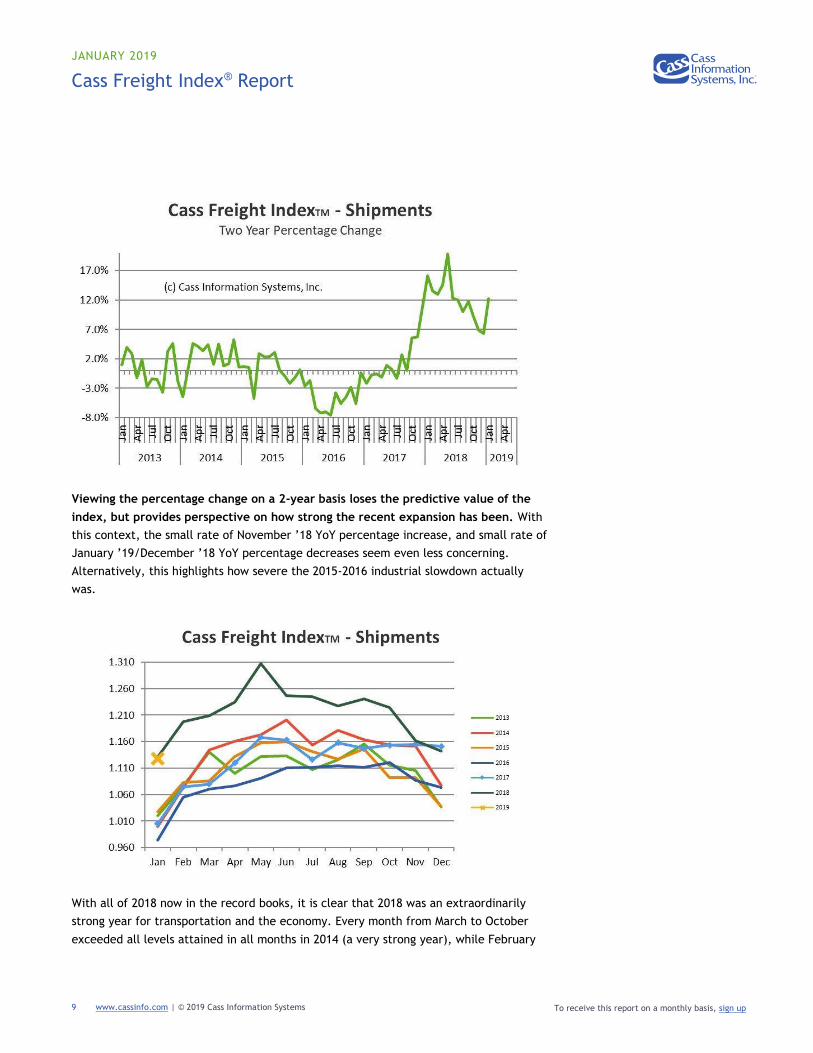
Viewing the percentage change on a 2-year basis loses the predictive value of the
index, but provides perspective on how strong the recent expansion has been. With
this context, the small rate of November ’18 YoY percentage increase, and small rate of
January ’19/December ’18 YoY percentage decreases seem even less concerning.
Alternatively, this highlights how severe the 2015-2016 industrial slowdown actually
was.
With all of 2018 now in the record books, it is clear that 2018 was an extraordinarily
strong year for transportation and the economy. Every month from March to October
exceeded all levels attained in all months in 2014 (a very strong year), while February
JANUARY 2019
Cass Freight Index® Report
www.cassinfo.com | © 2019 Cass Information Systems 10 To receive this report on a monthly basis, sign up
was roughly equal to the peak month in 2014 (June 2014 – 1.201 vs February 2018 –
1.198), which is extraordinary. A YoY stacked chart (see above) highlights the surge to
higher levels that began in November and December 2017.
Enough About Volume and Demand, What About
Pricing?
The Cass Expenditures Index is signaling continued overall pricing power for those in
the marketplace who move freight. Demand is exceeding capacity in most modes of
transportation by a material amount. In turn, pricing power has erupted in those modes
to levels that spark overall inflationary concerns in the broader economy. Even with the
recent decline in the price of oil, the strength in base rates being experienced in many
sectors remains strong.
With the Expenditures Index up 7.8% in January and the 2-year stacked increase of
23.1%, we understand the concerns about inflation, but are comforted by four factors:
1. Almost all modes of transportation are using the current environment of pricing
power to create capacity, which will first dampen and eventually kill pricing
power;
2. Spot pricing (not including fuel surcharge) in all three modes of truckload
freight (dry van, reefer, and flatbed) has already been falling for six months;
3. The cost of fuel (and resulting fuel surcharge) is included in the Expenditures
Index, and the cost of diesel was down 0.8% in January (suggesting lower fuel
surcharges in coming weeks);
4. Whether driven by capacity addition/creation or lower fuel surcharges (or a
combination of both - our best guess) the Expenditures Index is sequentially
declining: the January ’19 Index is already down 7.1% from its peak in
September ’18.
As we explained in previous months, we do not fear long-term inflationary pressure as
technology provides multiple ways to ever increase asset utilization and price discovery
in all parts of the economy, but especially in transportation. In fact, we are continuing
to see more evidence that ELDs (Electronic Logging Devices), which initially hurt the
capacity/utilization of truckers (especially small truckers), are becoming an ever-
smaller impediment to capacity utilization and in some cases actually improving
utilization to levels above those achieved before ELD adoption. Many of the truckers
who were the most adversely effected are now getting most, if not all, of the original
loss in utilization back. This is especially true in the dry van and reefer (temperature
JANUARY 2019
Cass Freight Index® Report
www.cassinfo.com | © 2019 Cass Information Systems 11 To receive this report on a monthly basis, sign up
control) marketplaces of trucking. Even the flatbed segment of trucking, which initially
faced the greatest challenges with productivity after the adoption of ELDs, is learning to
adapt.
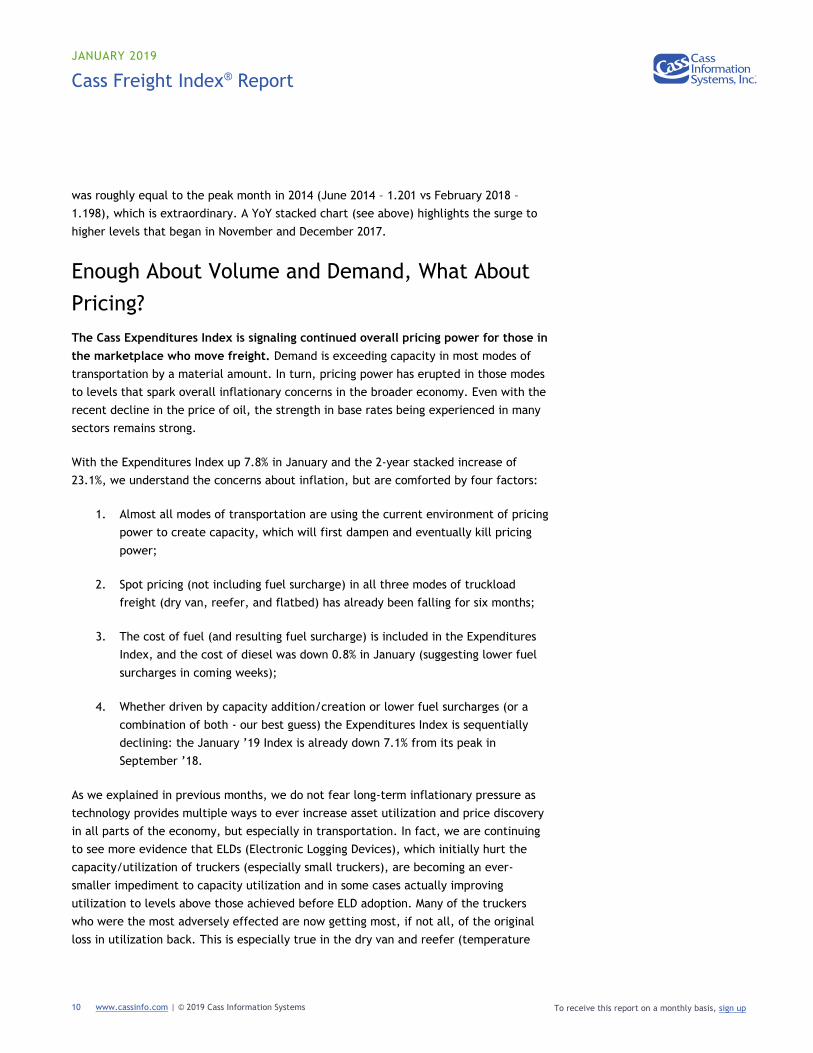
With all the recent strength in demand, it follows that the Cass Freight Expenditures
Index also posted strong percentage increases throughout 2017 that continued
throughout 2018 and into 2019. As we commented on the Shipments Index, we have to
go back to the easy comparisons of 2009-2010 to find such large percentage increases.
The current comparison is anything but easy. We have commented repeatedly that this
was indicative of an economy that is continuing to expand. The January 7.8% increase
signals that capacity is still tight, demand is strong, and shippers are willing to pay up
for services to get goods picked up and delivered in modes throughout the
transportation industry.
JANUARY 2019
Cass Freight Index® Report
www.cassinfo.com | © 2019 Cass Information Systems 12 To receive this report on a monthly basis, sign up
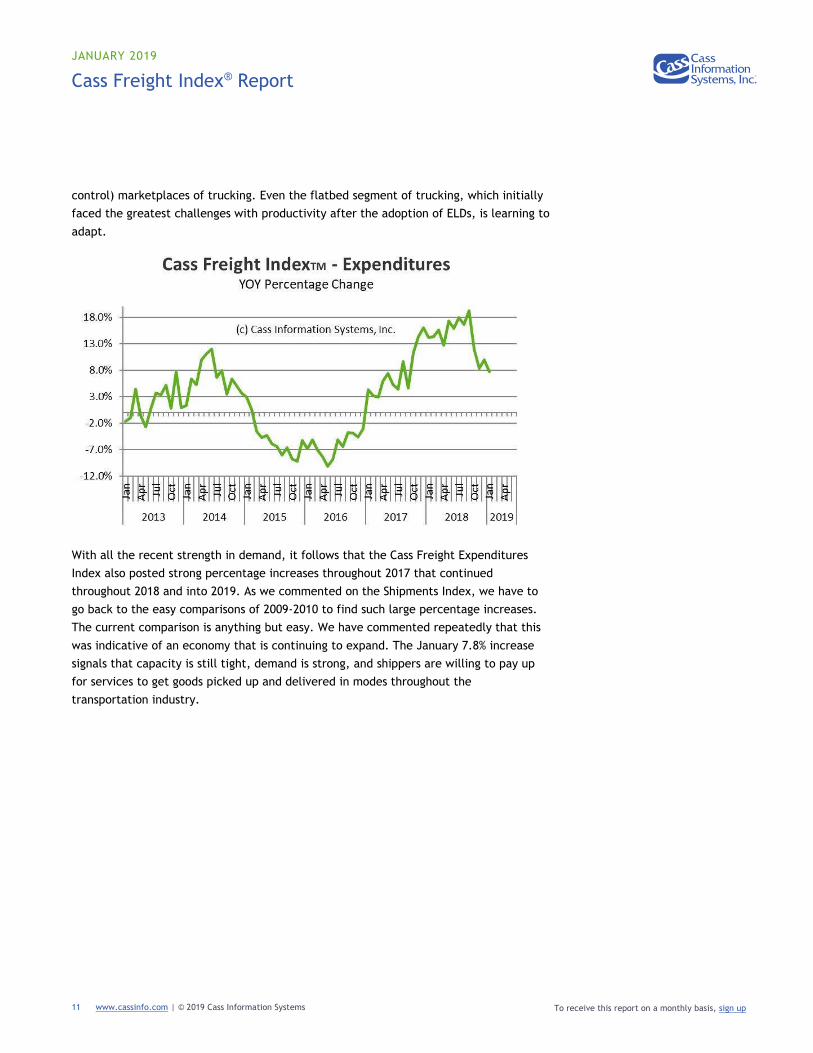
While January’s 7.8% percentage increase is less than December’s 10.0%, and
dramatically less than September’s 19.3%, it is in part because January’s increase was
on top of a 14.2% increase in 2018, while October’s increase was on top of a 11.2%
increase in 2017, and the September 2017 increase was on top of an increase of only
4.6%. Viewed another way that provides more perspective, the 2-year stacked increase
(2018 vs. 2016) in Expenditures was 24.8% in September, 24.6% in October, 23.9% in
November, 27.7% in December, and 23.1% in January.
JANUARY 2019
Cass Freight Index® Report
www.cassinfo.com | © 2019 Cass Information Systems 13 To receive this report on a monthly basis, sign up
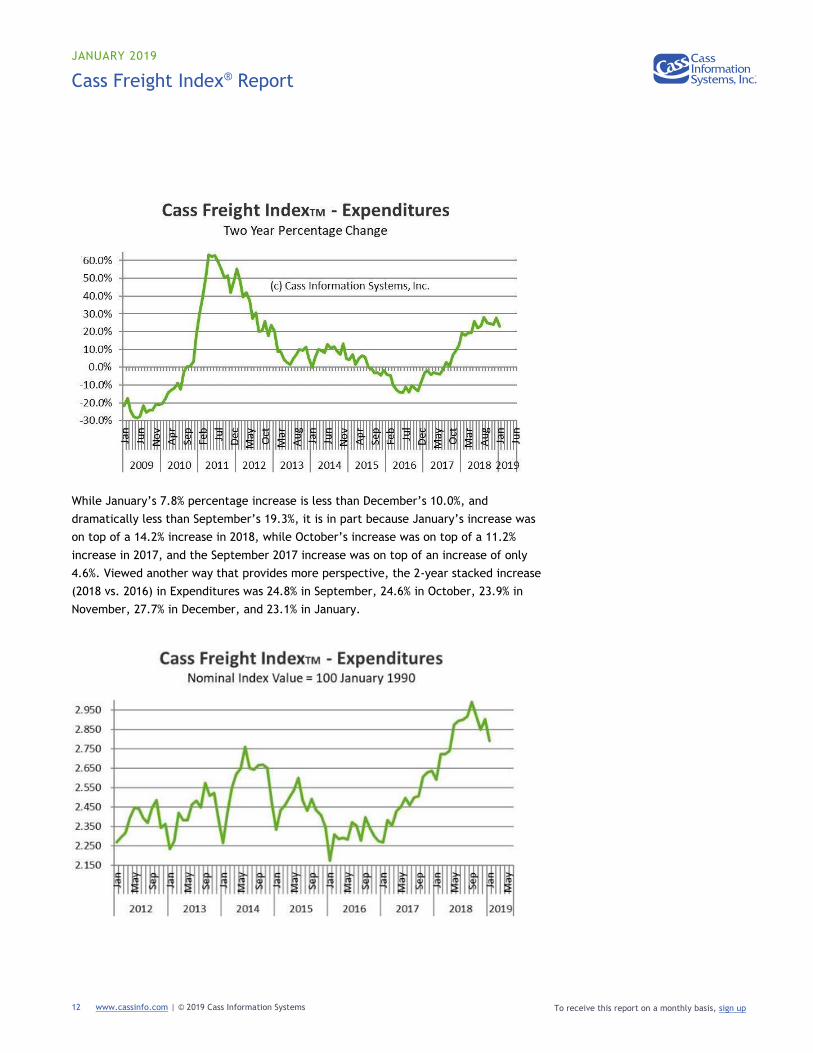
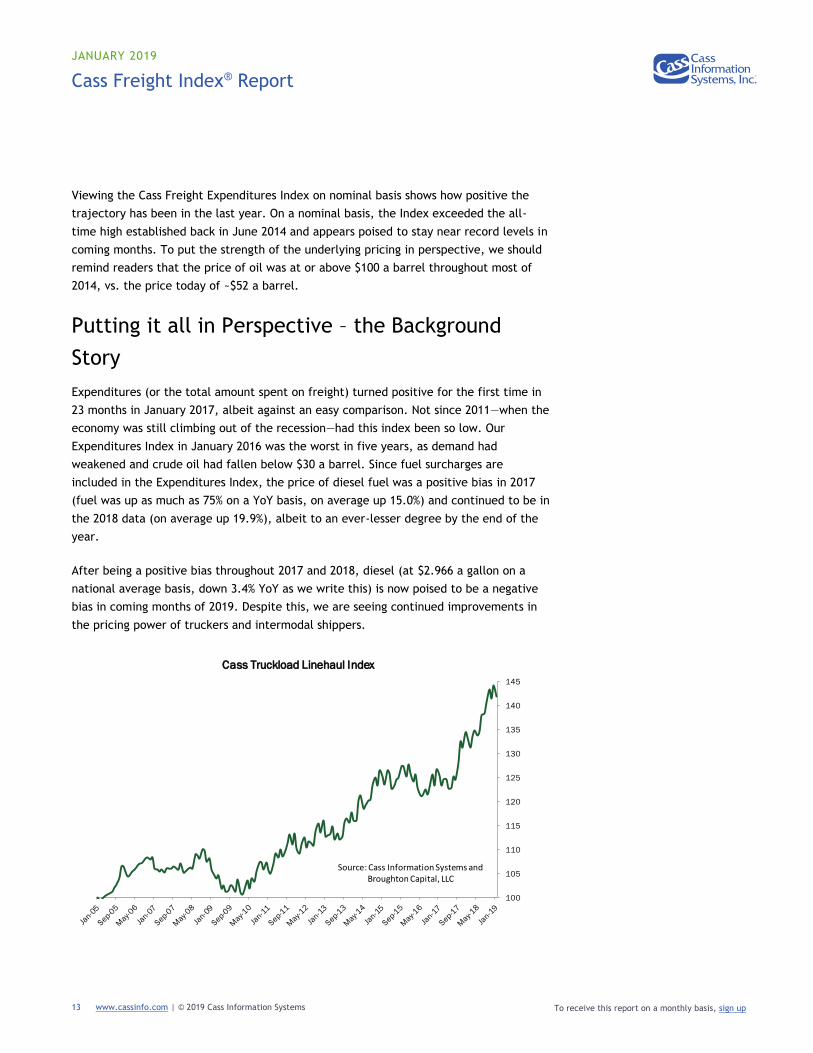
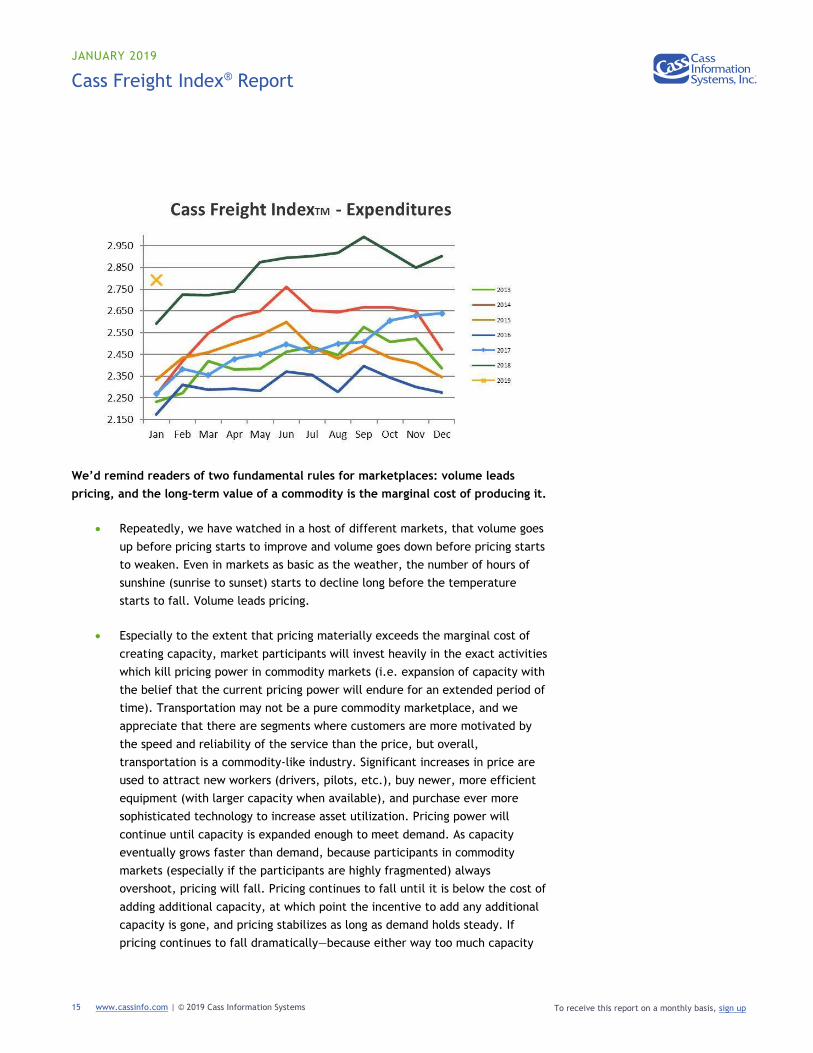
Viewing the Cass Freight Expenditures Index on nominal basis shows how positive the
trajectory has been in the last year. On a nominal basis, the Index exceeded the all-
time high established back in June 2014 and appears poised to stay near record levels in
coming months. To put the strength of the underlying pricing in perspective, we should
remind readers that the price of oil was at or above $100 a barrel throughout most of
2014, vs. the price today of ~$52 a barrel.
Putting it all in Perspective – the Background
Story
Expenditures (or the total amount spent on freight) turned positive for the first time in
23 months in January 2017, albeit against an easy comparison. Not since 2011—when the
economy was still climbing out of the recession—had this index been so low. Our
Expenditures Index in January 2016 was the worst in five years, as demand had
weakened and crude oil had fallen below $30 a barrel. Since fuel surcharges are
included in the Expenditures Index, the price of diesel fuel was a positive bias in 2017
(fuel was up as much as 75% on a YoY basis, on average up 15.0%) and continued to be in
the 2018 data (on average up 19.9%), albeit to an ever-lesser degree by the end of the
year.
After being a positive bias throughout 2017 and 2018, diesel (at $2.966 a gallon on a
national average basis, down 3.4% YoY as we write this) is now poised to be a negative
bias in coming months of 2019. Despite this, we are seeing continued improvements in
the pricing power of truckers and intermodal shippers.
100
105
110
115
120
125
130
135
140
145
Cass Truckload Linehaul Index
Source: Cass Information Systems and Broughton Capital, LLC
JANUARY 2019
Cass Freight Index® Report
www.cassinfo.com | © 2019 Cass Information Systems 14 To receive this report on a monthly basis, sign up
As an example, the proprietary Cass Truckload Linehaul Index (which measures linehaul
rates and does not include fuel) rose 6.5% on a YoY basis in the month of January to
142.0 (falling just shy of the all-time record high, set in December 2018 at 144.2).
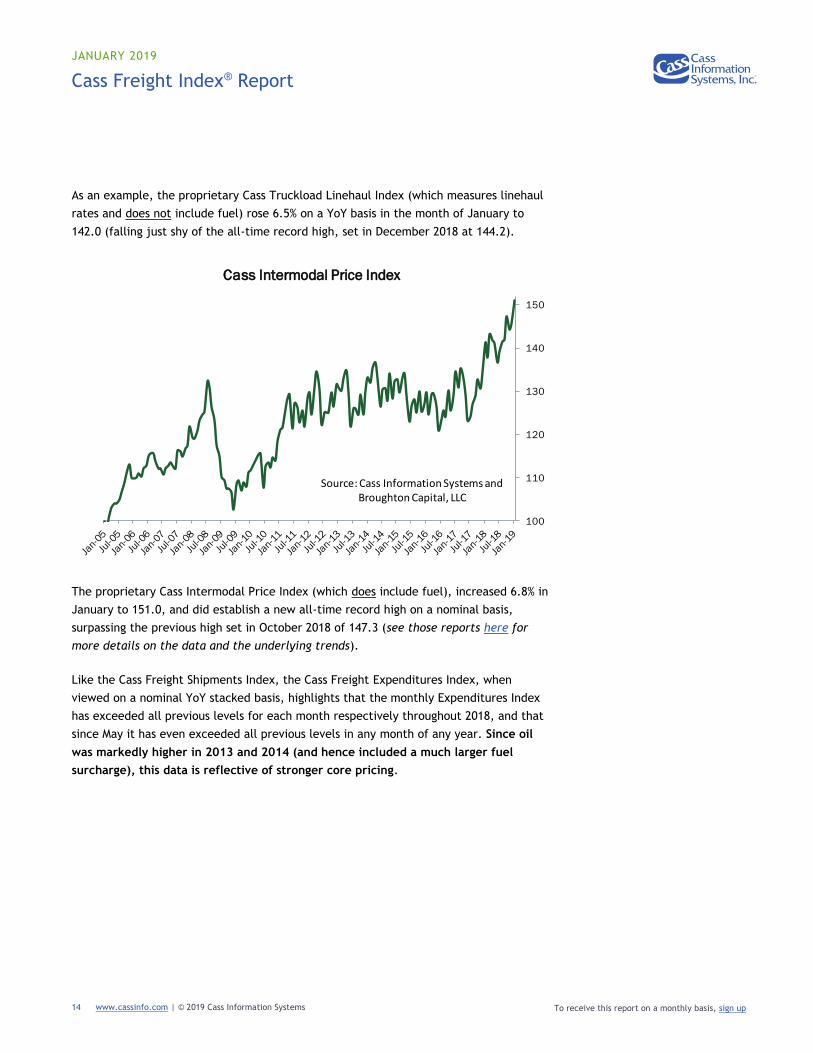
The proprietary Cass Intermodal Price Index (which does include fuel), increased 6.8% in
January to 151.0, and did establish a new all-time record high on a nominal basis,
surpassing the previous high set in October 2018 of 147.3 (see those reports here for
more details on the data and the underlying trends).
Like the Cass Freight Shipments Index, the Cass Freight Expenditures Index, when
viewed on a nominal YoY stacked basis, highlights that the monthly Expenditures Index
has exceeded all previous levels for each month respectively throughout 2018, and that
since May it has even exceeded all previous levels in any month of any year. Since oil
was markedly higher in 2013 and 2014 (and hence included a much larger fuel
surcharge), this data is reflective of stronger core pricing.
100
110
120
130
140
150
Cass Intermodal Price Index
Source: Cass Information Systems and Broughton Capital, LLC
JANUARY 2019
Cass Freight Index® Report
www.cassinfo.com | © 2019 Cass Information Systems 15 To receive this report on a monthly basis, sign up
We’d remind readers of two fundamental rules for marketplaces: volume leads
pricing, and the long-term value of a commodity is the marginal cost of producing it.
• Repeatedly, we have watched in a host of different markets, that volume goes
up before pricing starts to improve and volume goes down before pricing starts
to weaken. Even in markets as basic as the weather, the number of hours of
sunshine (sunrise to sunset) starts to decline long before the temperature
starts to fall. Volume leads pricing.
• Especially to the extent that pricing materially exceeds the marginal cost of
creating capacity, market participants will invest heavily in the exact activities
which kill pricing power in commodity markets (i.e. expansion of capacity with
the belief that the current pricing power will endure for an extended period of
time). Transportation may not be a pure commodity marketplace, and we
appreciate that there are segments where customers are more motivated by
the speed and reliability of the service than the price, but overall,
transportation is a commodity-like industry. Significant increases in price are
used to attract new workers (drivers, pilots, etc.), buy newer, more efficient
equipment (with larger capacity when available), and purchase ever more
sophisticated technology to increase asset utilization. Pricing power will
continue until capacity is expanded enough to meet demand. As capacity
eventually grows faster than demand, because participants in commodity
markets (especially if the participants are highly fragmented) always
overshoot, pricing will fall. Pricing continues to fall until it is below the cost of
adding additional capacity, at which point the incentive to add any additional
capacity is gone, and pricing stabilizes as long as demand holds steady. If
pricing continues to fall dramatically—because either way too much capacity
JANUARY 2019
Cass Freight Index® Report
www.cassinfo.com | © 2019 Cass Information Systems 16 To receive this report on a monthly basis, sign up
was created or because demand has contracted—capacity will be destroyed or
at least idled until pricing stabilizes. This process may create significant
oscillations in pricing above and below the marginal cost of creating capacity in
the short-term, but those increases and decreases in pricing will be around the
marginal cost of production.
JANUARY 2019
Cass Freight Index® Report
www.cassinfo.com | © 2019 Cass Information Systems 17 To receive this report on a monthly basis, sign up
About the Cass Freight Index
The Cass Freight Index represents monthly levels of shipment activity, in terms of
volume of shipments and expenditures for freight shipments. Cass Information Systems
processes more than $25 billion in annual freight payables on behalf of its clients. The
Cass Freight Index is based upon the domestic freight shipments of hundreds of Cass
clients representing a broad spectrum of industries. The index uses January 1990 as its
base month.
Visit http://www.cassinfo.com/frtindex.html or call 314-506-5500 to get detailed
information about the Cass Freight Index, including historical data.
About the Author: Donald Broughton Founder and Managing Partner of Broughton Capital, a deep data driven quantimental
economic and equity research firm.
Prior to starting Broughton Capital, Mr. Broughton spent nine years as the Chief Market
Strategist and Senior Transportation Analyst for Avondale Partners. Before that, Mr.
Broughton spent over twelve years at A.G. Edwards. At A.G. Edwards, in addition to
being the Senior Transportation Analyst, he was the Group Leader of the Industrial
Analysts and served on the firm’s Investment Strategy Committee. Prior to going to Wall
Street, Mr. Broughton spent eight years in various distribution and operations
management roles in the beverage industry, including serving as the Corporate Manager
of Distribution for Dr. Pepper/Seven-Up companies and Chief Operating Officer for
Bevmark Concepts.
Many in the transportation industry know him for his quarterly tracking of trucking
bankruptcies. He is also known for his development of a ‘Value to Density Spectrum’
study of the tangible goods flow and its economic ramifications.
Broughton’s equity research has earned acclaim and is regularly quoted by The Wall
Street Journal, Bloomberg, Fortune, Forbes, and numerous other national media
outlets. He is a frequent guest on CNBC, Nightly Business Report, CNN, Fox, NPR and
other broadcast media.
His stock-picking performance has been repeatedly recognized by The Wall Street
Journal, which has ranked him in its “Best on the Street” survey for his picks in both the
cargo and railroad industry groups. Forbes has highlighted his performance in its “When
Picky Analysts Pick” series. He has been ranked by Zacks Investment Research and
Starmine as a 5-Star Analyst (their highest ranking) based on the historical performance
of his recommendations.
JANUARY 2019
Cass Freight Index® Report
www.cassinfo.com | © 2019 Cass Information Systems 18 To receive this report on a monthly basis, sign up
Beginning in mid-2006, Broughton published reports warning of an impending economic
slowdown and by early 2007 published reports explaining why a recession was coming. In
early 2009, as the world became convinced that the ‘sky was falling’ he upgraded large
cap industrials and names such as FedEx and Union Pacific. More recently, in July of
2010 and again in September 2011 his “Blue Car Report” explained why fears of a
double dip were severely overblown and outlined why the market would have significant
rallies by the end of those years. He believes that the current market is struggling to
digest the end of the industrial-led recovery and the beginning of the consumer-led
recovery in this cycle. But fear not, the consumer both in the U.S. and globally is about
to be better than expected.
Other indexes published by Cass and Donald Broughton:
Cass Truckload Linehaul Index® – measures fluctuations in U.S. truckload linehaul rates
Cass Intermodal Price Index® – measures fluctuations in U.S. domestic intermodal costs
Visit http://bit.ly/s9iniq to view or subscribe.

JANUARY 2019
Cass Freight Index® Report
www.cassinfo.com | © 2019 Cass Information Systems 19 To receive this report on a monthly basis, sign up
The material contained herein is intended as general industry commentary. The Cass
Freight Index and other content (“Index”) is based upon information that we consider
reliable, but Cass does not guarantee the accuracy, timeliness, reliability, continued
availability or completeness of any information or underlying assumptions, and Cass
shall have no liability for any errors, omissions or interruptions. Any data on past
performance contained in the index is no guarantee as to future performance. The
Index is not intended to predict actual results, and no assurances are given with respect
thereto. Cass makes no warranty, express or implied. Opinions expressed herein as to
the Index are those of Donald Broughton and may differ from those of Cass Information
Systems Inc. All opinions and estimates are given as of the date hereof and are subject
to change.
© 2019 Cass Information Systems, Inc.


![INDEX [manuals.lddb.com]manuals.lddb.com/LD_Players/PRB_Belt_XRef-extract.pdf · INDEX Section 1 pgs. 2-104 Audio/Cass. Recorders Section 2 105-111 Camcorders Section 3 112-118 Car](https://img.pdfslide.us/doc/110x75/601fa16edf949d24b328261b/index-index-section-1-pgs-2-104-audiocass-recorders-section-2-105-111-camcorders.jpg)