Embed Size (px)
Citation preview

1
Cass-Clay Creamery: A New Direction for an Old Brand
Gregory McKee and Michael Boland
Greg McKee is assistant professor of agricultural economics and director of the Quentin Burdick Center at North Dakota State University. Michael Boland is professor of agricultural economics and associate director of the Arthur Capper Cooperative Center at Kansas State University
Acknowledgements
The authors gratefully acknowledge the assistance of the following in helping to prepare this
manuscript: Keith Pagel, J.W. Schroeder, Alan Qual, Gary Hoffman, John Ringsrud, Mark Furth,
and Sheryl Meshke. This study was funded in part by proceeds from an endowment to the
Quentin Burdick Center for Cooperatives and the Arthur Capper Cooperative Center.

2
Cass-Clay Creamery: A New Direction for an Old Brand
North Dakota (ND) was not known for being especially warm in December and 2006 was no
different than any other December. Keith Pagel, general manager of Cass-Clay Creamery (Cass-
Clay) was preparing for a board meeting. For several years, the board had been discussing the
future of Cass-Clay. In recent years, it had developed a successful regional brand by co-branding
its products with upper Midwest professional and collegiate sports teams. The brand marketing
efforts had been successful but it had not enabled the cooperative to offset long-term industry
trends with regard to a declining number of dairy cows and members, excess capacity in the
upper Midwest dairy industry which meant price competition for the declining milk supplies, and
increased costs due to energy and transportation. The reality is that Cass-Clay was not generating
enough income to enable the board to shorten its equity management program and enable it to
use its assets efficiently. The cooperative had net income losses in 2004, 2005, and 2006.
During this time period, the board and Keith had considered different options including
generating more income off of its value-added brand marketing, reducing its assets base as a
means of reducing costs, finding another partner who would provide equity by buying into the
cooperative, or considering a unification (e.g., merger) with another dairy cooperative. The first
option of generating additional income had worked but Keith and his management team had
negotiated as best as possible and believed that they were getting the best possible price in the
market. The second option of asset reduction had already been tried and the remaining assets
were valuable due to the integrative nature of their business. The third option was not feasible
because an outside investor was not likely to emerge because of Cass-Clay’s financial position

3
and because the board was not willing to relinquish governance rights in the cooperative. Thus,
Keith had been seeking other opportunities with various other dairy cooperatives. One such
partner, Associated Milk Producers, Inc., had emerged and Keith was prepared to discuss the
proposal with the board tonight. Regardless of what it decided to do, Cass-Clay’s future was
going to take a new direction.
Background on Cass Clay Creamery
Cass-Clay Creamery (Cass-Clay) is a dairy cooperative which both bottles milk and process it
into other dairy products. Established in 1934, it originally marketed milk produced by member
dairy farms in the Cass County, North Dakota (ND) and Clay County, Minnesota (MN) area.
These adjacent counties lie along the middle of the eastern border of North Dakota and western
border of Minnesota, respectively, separated by the Red River. Today, Cass-Clay markets milk
from members in North and South Dakota, Montana, and Minnesota. In recent years, its revenues
have been at or above $100 million.
Cass-Clay processes milk into a broad line of products. Fluid milk products include
traditional skim, 1%, 2%, and whole milk products and chocolate milk. Other dairy products
include cottage cheese, chip dips, Romano and Parmesan cheeses, ice cream, yogurt, butter, and
sour cream. All of its operations occur at facilities in North Dakota, Minnesota, and South
Dakota, with its headquarters at the Fargo, ND facility. Given the location of these facilities and
associated transportation costs, Cass-Clay has traditionally marketed its products to consumers in
North Dakota and western Minnesota.
Keith Pagel has been general manager of Cass-Clay since 2000. During his tenure, he and
his management team have developed strategies to generate economic benefits for the
cooperative’s membership. These efforts have been made with a goal to maintain strong ties to

4
its membership and to grow in economic size over time. Keith works with a board of directors.
The board is comprised of dairy farmers operating in North and South Dakota, Minnesota, and
Montana. This nine-member board makes general business policy decisions and represents all
members (who are the patrons, members, and owners of Cass-Clay ) investors in making
decisions about investment policies for new equipment, milk purchasing incentives, and quantity
and timing of giving financial benefits to the general membership.
Due to changes in North Dakota and Minnesota’s dairy industry during Keith’s tenure,
the number of members in the cooperative has declined from a high of approximately 1,300
members to only 137 today. This had reduced the number of producers available to provide
equity into the cooperative.
Industrial Structure of Milk Supply and Processing
The primary challenge Cass-Clay faces is to acquire equity capital for purposes of making
updates to its aging equipment, most of which were purchased for its facility constructed in
1957. Cooperatives such as Cass-Clay pass earnings on to the users based on level of use, and
therefore cannot attract equity from a wide group of investors as in other types of firms.
Cooperatives usually obtain equity capital from members using three strategies. These include
direct investment, retained earnings, and retained portions of sales volume-known as equity
retains. The amount of funds from these strategies depends on the number of members in the
cooperative.
Decline in Size of Dairy Industry in North Dakota and Minnesota
The number of members in the cooperative has been affected by forces controlling milk supply
and demand. First, the numbers of dairy farms and dairy cows have persistently declined in Cass-

5
Clay’s trade area. Some members have moved their operations to other states. Others have
switched from dairy production to more lucrative grain-only or grain and beef farming. Still
others have quit farming entirely.
In North Dakota, for example, the number of dairy cows declined from 375,000 head in
1950 to 32,000 head in 2006 (U.S. Department of Agriculture 2008). Total statewide milk
production during the same period declined from 1,699 million pounds to 470 million pounds
(U.S. Department of Agriculture 2008). The number of dairy farms declined from 2,839 in 1987
to less than 200 in 200. In Cass County, the number of dairy farms declined from 21 in 1987 to 5
in 2002, with 900 total head in 1987 reduced to 59 in 2002 (U.S. Department of Agriculture
1992, 2002). Similar trends exist in Minnesota, Montana, and South Dakota.
The declining numbers of dairy cows and farms have increased the geographic spread of
members in Cass-Clay’s trade area. This increasing spread has affected Cass-Clay’s freight costs
and reduced the pool of profits from which it could acquire retained earnings. The cooperative
acquires approximately 70% of the milk used from only 12 farms. These farms are as far away as
eastern Montana, over 350 miles from Fargo; Mandan, about 200 miles west of Fargo; and
locations in western Minnesota. The long distances, coupled with increasing fuel costs,
contribute to high freight costs. In an effort to attract large, distant members, the board had
maintained a policy of charging all members the same rate for freight costs, but recently started
charging freight rates in proportion to distance travelled.
The Upper Midwest has had little success at encouraging new producers to enter the dairy
industry because of other career opportunities, low profitability, lifestyles, and similar issues.
Dairy industry leaders, such as Gary Hoffman of the North Dakota Dairy Coalition, make
specific efforts to grow the industry in Cass-Clay’s trade area. Although a handful of new dairies
will be started in North Dakota this year, these efforts are hampered by lifestyle preferences of

6
the next generation of farmers. Many prefer lifestyles which permit vacations and time for
pursuits other than farming. The trends in cow numbers and producers appears to be irreversible.
Consolidation of Dairy Processing Industry in North Dakota and Minnesota
These trends have contributed to the consolidation and shrinking of the dairy processing industry
in the upper Midwest (Minnesota, Montana, North Dakota, and South Dakota. As the number of
dairy farms and total number of dairy cows in the state declined, the need for processors
decreased. For example, in 1977, 17 plants manufactured dairy products in North Dakota and 72
in Minnesota (U.S. Department of Commerce-, 1980). By 2002, only five remained in North
Dakota, and 44 in Minnesota. In 1977, there were ten facilities bottling milk in North Dakota and
seven facilities processing butter. Today, two bottling facilities remain, with one owned by Cass-
Clay and the other owned by Dean’s Foods. One butter producing facility remains, owned and
operated by the Pride Dairy Cooperative in Bottineau. Only one cheese plant and one dry milk
plant remain in the state. Cass-Clay had adjusted to these changes by purchasing the assets of
other cooperatives or private companies in an effort to increase membership and enlarge the
geographic market Cass-Clay served. This occurred in the 1970s and 1980s by purchasing
companies in cities throughout the state such as Grand Forks, Jamestown, Minot, Mandan,
Medina, Rugby, and Valley City, as well as purchases in South Dakota and Minnesota. These
had the effect of increasing the number of members and expanding the territory Cass-Clay could
market its products.
Competitors of Cass-Clay
The cooperative supplies milk products in competition with several processed dairy product
producers (Table 1). These include other cooperatives and investor-owned firms. Major

7
companies in the North Dakota and Minnesota geographical market include Bongard’s
Creameries, First District Association, Swiss Valley Farms, Foremost Farms, Kemps, Land
O’Lakes, Dairy Farmers of America, Associated Milk Producers, and Hastings Creamery.
Bongards Creameries (Bongards MN) operates a plant in Bongards and owns a plant in Perham.
The cooperative manufactures various dairy products and has 421 patrons with another 2,000
retired equity holders. In 2007, the cooperative wrote down the value of its equity by almost 66
percent to account for almost $20 million in losses that had accrued since 1998 but had not been
passed through to the members.
First District Association (Litchfield MN) operates a plant in Litchfield. The cooperative
has 803 patrons and ten member creameries (700 patrons in these creameries) in west central and
northeastern Minnesota, northeastern Iowa, and western Wisconsin. The cooperative operates
with no long-term debt. The name came from the fact that it was the first district in the
Minnesota Cooperative Creameries Association which began marketing the sweet cream butter
under the name “Land O' Lakes.” It later began marketing under its own brand name of
“Fieldgate.”
Swiss Valley Farms (Davenport IA) operates plants in southeastern Minnesota,
northeastern Iowa, northern Illinois, and southwestern Wisconsin. It has 867 patrons and
produces a broad line of differentiated dairy products under its own retail label, Swiss Family
Farms, as well as private label and ingredient markets.
Associated Milk Producers Inc. or AMPI (New Ulm MN) has 3,400 patrons in Iowa,
Minnesota, Missouri, Montana, Nebraska, North Dakota, South Dakota and Wisconsin. It
produces a broad line of dairy products for the private label market. Foremost Farms USA
(Baraboo WI) has 3,697 patrons in Illinois, Indiana, Iowa, Michigan, Minnesota, Ohio and
Wisconsin. Its retail brands include Golden Guernsey Dairy®, Morning Glory™ and Grip It, Sip

8
It.™ brands. Kemps LLC (Chelsea MA) is owned by HP Hood LLC. It has fluid milk processing
plants in Rochester, Minneapolis, and Duluth (MN), Rapid City (SD) and Cedarburg (WI). Its
brands include Kemps, Hood, Hagan, Green’s and Arrowhead. Hastings Cooperative Creamery
(Hastings, MN) had 128 members.
These cooperatives can be described as regional, with almost of the membership and
business activity concentrated in a particular area, such as the Midwestern United States. Two
other cooperatives, Land O'Lakes, Inc. and Dairy Farmers of America, Inc., are national in
scope. Land O'Lakes, Inc. (Arden Hills MN) is a diversified cooperative with 4,610 dairy
producers. Its dairy products are sold under the Land O’Lakes label and much of its milk
collection and processing operations are conducted through long-term supply agreements with
different companies. Dairy Farmers of America, Inc. or DFA (Kansas City MO) has over 11,306
dairy producers, supplying almost a third of the domestic US fluid milk market. It owns the
Borden and Golden retail brands.
Changes in Demand: Industrialization and Population
The cooperative is also faced with changes in demand for dairy products in the area. The single
largest source of change in demand for dairy products is the changing nature of the way these
products flow from farms to consumers. Traditionally, retailers have purchased dairy products
from regional producers. Increasingly, vertical relationships between dairy product producers,
such as Cass-Clay and its members, and retailers, such as grocery outlets and institutional food
outlets, govern the flow of these products. In order to improve the coordination and flow of these
products among participants, dairy product retailers are increasingly forming relationships with a
single producer. Dairy cooperatives are responding to this by forming marketing relationships
with larger companies. For example, in 2002 Land O’Lakes Inc. and Dean Foods Company

9
(Dean’s) formed an alliance to allow the members of Land O’Lakes to market their milk
throughout Dean’s nationwide system of retail customers.
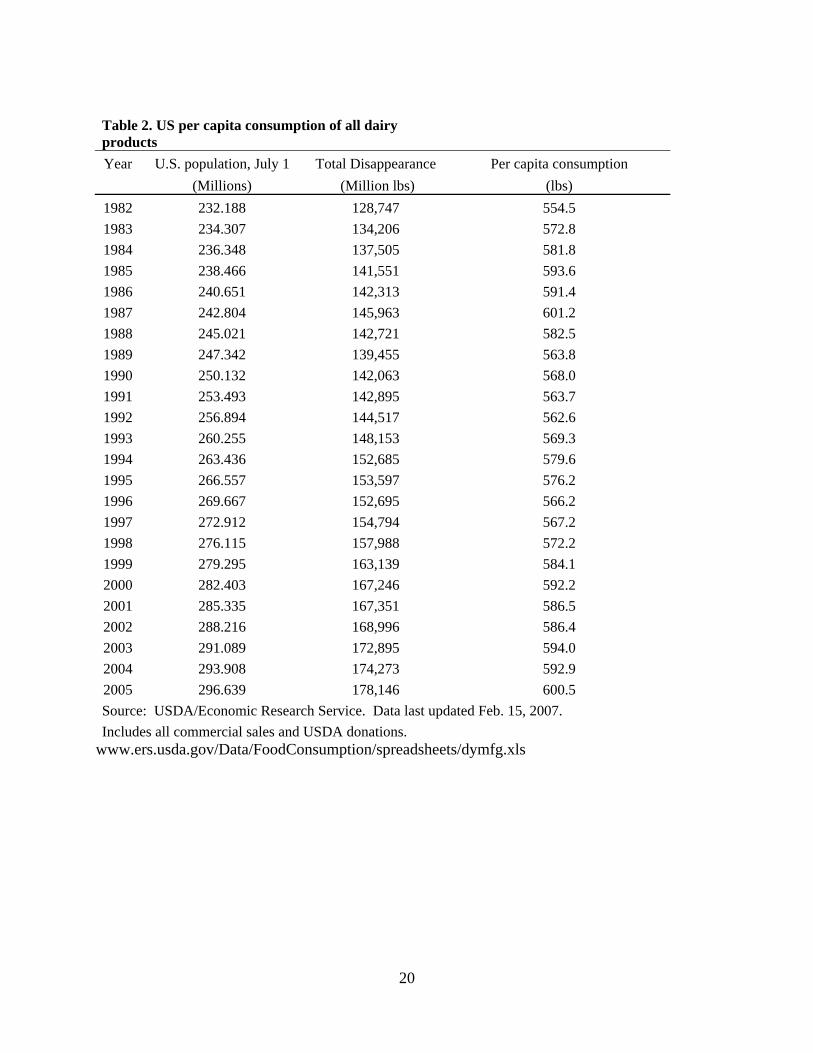
Another source of increased demand is population. Although per capita milk product
disappearance in the US has remained steady since 1982 (Table 2), the combination of steady
population levels in North Dakota and population growth in Minnesota, has increased the total
demand for all dairy products in the North Dakota and Minnesota region.
Capital Improvements
Cass-Clay has responded to these changes in demand by investing millions in capital updates in
its facilities. Updates to its Fargo facility include a new freeze tunnel, which freeze ice cream
more rapidly and preserves freshness better than older technology; high speed bottling lines and
material handling equipment; and enlarging the cooler to three times its original size. At its
Mandan, ND facility updates include a cooler and loading dock for speedier delivery truck
loading. New boilers have been installed in its Hoven, S.D. cheese processing facility. These
investments totaled more than $5 million between 2002 and 2004. These improvements are
coupled with commitments from the board of directors to encourage facility update expenditures
of about $1 million annually (Thompson 2004). These improvements and policies together are
intended to expand Cass-Clay’s volume of production and efficiency of distribution.
Branding
Production Costs, Milk Prices and Government Policy
Cass-Clay contributes to the welfare of its member farmers by providing a guaranteed market for
their output. Declines in real raw milk prices and increasing dairy input costs have also
contributed to the cooperative’s difficulties in obtaining equity from the cooperative’s members.

10
For example, the relatively small dairy farm size forces North Dakota and Minnesota members to
have relatively high milk production costs, which many dairy farms in other parts of the nation
reduce through consolidation (McDonald et al. 2007). A nationwide study of costs and returns in
2005 indicated that a typical farm receives $17.03 in gross production value per hundredweight
of milk, but receives net returns of -$1.43 after total production costs and allocated overhead are
considered. Losses are not uniform across herd size, however. Farms with fewer than 50 head,
for example, received net returns of -12.22 in 2005 per hundredweight of milk (Table 3).
Milk prices are affected by government policy. Congress has passed legislation
establishing federal milk marketing orders. These regulations are intended to promote the orderly
marketing of milk in sufficient quantity to meet consumer demand at reasonable prices.
According to Miller and Blayney (2006), more than 80% of all milk is marketed under these and
other regulated pricing systems. In 2006 and 2007, prices for milk received by farmers was
relatively low (Table 4) having declined steadily since 1997 from $13.34 to $9.71 per
hundredweight for milk types.
Marketing orders have recently had the effect of increasing the supply of milk available
in North Dakota and further depressing its price. Companies and cooperatives operating in North
Dakota and Minnesota which have chosen to participate in the policies declared in Federal Milk
Marketing Order #30 have found they have been harmed by some of it policies. The Order
permits handlers of “distant” milk to pick and choose when to participate in the marketing pool
created by the Order, thus drawing revenue funds from the marketing area. Sue Beitlich,
president of the Wisconsin Farmers Union, indicated that “over twenty counties in Idaho
delivered milk into the Upper Midwest Milk Marketing Order in December of 2003, with one
particular county in that state ranking number one overall in delivery into the order. More than
180 producers from Idaho delivered more than 260 million pounds of producer milk,

11
representing 12% of the Order’s market during the same period,” reducing the payments made to
dairy producers in the North Dakota, Minnesota, and Wisconsin area (Beitlich, 2004).
Cooperatives and Branding
In order to increase margins from dairy product sales, Cass-Clay began an intensive brand
marketing program. Public efforts began in earnest in 1996, with the release of its current
“sunburst” design logo. Since that time, the logo has been used on many of its products and on
its publicly-visible equipment. In total, 35% of the annual product volume produced by Cass-
Clay is packaged in a branded container. By 2004, Cass-Clay spent about $1 million annually in
its advertising (Thompson, 2004). This was expensive to maintain and with declining
profitability and increased competition, it was doubtful whether Cass-Clay could continue such
expenditures in the future. The fact that Cass-Clay chose to brand several of its products is
interesting because of its cooperative business status. Both Beverland (2007) and Hardesty
(2005) noted that because of the traditional cooperative principles of user-benefits, user-
financing, and user-control, few cooperatives have nationally prominent brand names. For
agricultural cooperatives, the user-benefit principle tends to contribute to seasonal product
availability and inability to provide long-term returns to members who invest in brand building.
The user-financing principle contributes to a cooperative’s comparative limited access to capital
to invest in branding. The user-control principle may lead to a homogenous board of directors
with no brand building experience.
Having a cooperative develop its own brand can benefit consumers, however. Haller
(1992) found that cooperatives which branded their own cottage cheese tended to price lower
than competing brands, had higher sales volume than other brands in which their products were
sold, and were more aggressive in merchandising than brands than all other types of businesses

12
except in-store brands. Hence, branding may allow cooperatives to increase sales by increasing
the distribution of their products within current markets.
Success with the Cass-Clay Brand
Cass-Clay has been able to use its branding strategy to broaden its geographic product
distribution. Cass-Clay brand products have obtained shelf space in stores where they hadn’t sold
previously, such as in SuperValu stores operating under the Cub brand in the Twin Cities market.
The brand has also gained significant recognition through its relationship with the
Minnesota Vikings football team, which began in 2003. Cass-Clay worked with Gameday Sports
Company to align its brand with the Minneapolis football franchise. Now several Cass-Clay
products feature the official team logo, including ice cream flavors like Touchdown Toffee and
Victory Vanilla, chocolate milk, and French onion snack dip. The relationship has also enabled
Cass-Clay to develop business relationships with clients.
Cass-Clay has formed relationships to promote its brand through other sports teams and
venues. In 2005, Cass-Clay began selling products at the Xcel Energy Center, home of the
Minnesota Wild. Other relationships exist with North Dakota State University and the University
of North Dakota, featuring these schools in connection with ice cream flavors Bison Crunch and
Championship Sioux, respectively. Alumni support exists for relationships with schools in
western North Dakota and Minnesota.
Cass-Clay also enhanced its brand identity by offering products differentiated by
packaging innovations. The company developed an exclusive 97 ounce container for chocolate
milk, a unique volume among the typical selections of products. Other products have received
containers which are more lively and colorful than previous designs. Cass-Clay also followed
changes in ice cream packaging by promoting its line of “scrounds,” ice cream containers with
rounded edges, making it easier for removal of all contents. Together all of these efforts

13
contributed to a well-respected brand by consumers in all geographic markets Cass-Clay
participates in.
The Decision Faced by the Board
Despite these successful brand marketing efforts, Cass-Clay was still a regional dairy
cooperative with a niche. However, this niche was due to contracts with these sports teams which
were renegotiable in the future. Other competitors were keen to have access to similar branding
efforts and it was conceivable that Cass-Clay could lose these contracts in the future to a larger
dairy company.
Keith had studied other dairy competitors in the Upper Midwest in order to find possible
candidates for a unification. The board desired firms that had a similar organizational culture and
would preserve Cass-Clay’s brand marketing efforts. In addition, the board wanted to ensure that
its members had representation on the board of directors. Finally, the board was sensitive to the
fact that its profitability had declined in recent years but it still wanted to preserve the equity of
its past members who had helped provide equity in the past.
One company, Associated Milk Producers Inc. attracted Keith’s attention. AMPI, based
in New Ulm, Minnesota, is a dairy cooperative which is owned by dairy farmers in Iowa,
Minnesota, Nebraska, South Dakota and Wisconsin. While it competed with Cass-Clay, AMPI
did not have members in Cass-Clay’s trade territory. At the end of 2006, AMPI had
approximately 3,400 members and processed 5.1 billion pounds of member milk. By contrast,
Cass-Clay had 172 member farms and processed 0.3 billion pounds of member milk (Jackson
2007). Sales of AMPI are now approximately $1 billion annually, making it one of the ten largest
milk processing cooperatives in the country. AMPI markets a full line of dairy products and
ingredients for the retail, food service and food ingredient sectors, including cheese, butter,

14
instant milk, shelf-stable cheese and pudding, and other items. In addition to commercial and
institutional sales, it also retails some of its products under numerous private labels.
As a cooperative, AMPI shares Cass-Clay’s member-focused philosophy. As a result,
Keith believed that if Cass-Clay’s assets were sold to AMPI, AMPI would likely continue to
operate existing facilities and to guarantee a market for milk produced by member dairies. Keith
feared that acquisitions by other companies would lead to a splintering of the parts of the
company into joint ventures with other firms. Such a division would tend to be confusing to the
membership and remove any sense of member business control.
AMPI liked the idea of acquiring Cass-Clay for purposes of diversification. AMPI
primarily produces cheddar cheese and other products for private labels. Cass-Clay, in contrast,
bottled fluid milk and produced several other branded dairy products. AMPI viewed the
acquisition of Cass-Clay as an opportunity to expand its product line and expand its retail
presence by using an already-developed and well-recognized name. Since significant expenses
are required to develop a brand, AMPI intended to take advantage of the already-existing value
of the Cass-Clay brand.
AMPI’s board of directors was prepared to acquire Cass-Clay (with a proposed date of May 1,
2007) and establish it as its Fargo division. The equity of Cass-Clay would be exchanged with
AMPI, net of passed losses from previous years which had not yet been allocated to Cass-Clay’s
members’ equity. The acquisition would fold Cass-Clay’s equity management program into
AMPI’s program. The net result was that it would reduce the revolving period from 19 to 12
years because AMPI was on a 12 year revolving fund compared to Cass-Clay’s 19 year
revolving fund. Another benefit that the board liked was that AMPI would make lump sum
equity payments over five years to any retired producer over the age of 65.

15
The acquisition also generated economies of scale. Production costs declined for Cass-
Clay, by almost one-third in some cases, relative to costs prior to the acquisition. Lower costs
would result in increased Profitability and have more income available to revolve equity and
invest in new assets.
The acquisition created other financial benefits. The acquisition generated economies of
scope, making available new and increased levels of professional resources, such as technical
and financial expertise, which members of Cass-Clay did not previously have access to. The
acquisition also enabled members to take advantage of selling whey, a byproduct of milk
processing into dairy products. Sales into this market added to the revenues of Cass-Clay
members as dry whey sells for approximately $0.44 per pound.
AMPI was prepared to create two temporary seats on its twenty-four member board of
directors in order to accommodate two members of Cass-Clay. After two years AMPI’s board
will return to its original size and reallocate its seats based on the number of members within
each of its divisions. Thus, membership would have representation in Cass-Clay’s trade territory.
Summary
There were many benefits to the proposed acquisition by AMPI. Keith had developed a list of
issues to discuss with the board. These were
1. AMPI desired to maintain the Cass-Clay brand. However, now the brand might include milk from all AMPI members including those outside the new Fargo division.
2. Cass-Clay had a long-established corporate giving program in their member communities. However, this would now be part of AMPI’s corporate giving program. It was likely that there would be changes in philosophy.
3. In order to best optimize the entire system of AMPI, the AMPI board of directors might decide to introduce changes in transportation allowances and pricing that might be advantageous and disadvantageous to producers in the new Fargo division.

16
4. The new 24 member board of directors for AMPI would include as many as two directors from its Fargo division. This was understandable since Cass-Clay was much smaller than AMPI.
5. Cass-Clay’s success in recent years was due to its relationships and contracts with local sports teams, larger warehouses, and wholesale groups. This required marketing expenditures. However, Cass-Clay was losing money despite such branding. AMPI might decide to reduce such expenditures to increase profitability.
All of these issues were important to Cass-Clay’s directors and the members it represented
who provided the equity capital and patronized and used the cooperative to market its milk,
It was important that the effect of these changes on Cass-Clay’s membership be analyzed
because cooperative directors represented the members.

17
References Beitlich, S. 2004. “Statement of Sue Beitlich, President Wisconsin Farmers Union” Presented to
the USDA Federal Milk Marketing Order Public Hearing, August 16, 2004.
Beverland, M. 2007. “Can cooperatives brand? Exploring the interplay between cooperative
structure and sustained brand marketing success.” Food Policy 32:480-495.
Haller, L. 1992. “Branded product marketing strategies in the cottage cheese market: cooperative
versus proprietary firms.” Food Marketing Policy Center Research Report No. 16.
Hardesty, S. 2005. “Cooperatives as marketers of branded products” Journal of Food
Distribution Research 36(1):237-242.
Hoards Dairyman. Top 50 Dairy Processors in 2007. Hoards Dairyman, Fort Atkinson, WI,
October 2007.
Jackson, S. 2007. “Total pounds up, farms down among top 50 co-ops.” Hoard’s Dairyman,
October 10, 2007.
MacDonald, J., E. O’Donoghue, W. McBride, R. Nehring, C. Sandretto, and R. Mosheim. 2007.
“Profits, costs, and the changing structure of dairy farming” September 2007
http://www.ers.usda.gov/publications/err47/
Miller, J., D. Blayney. “Dairy backgrounder” July 2006.
http://www.ers.usda.gov/Publications/LDP/2006/07Jul/LDPM14501/
U. S. States Department of Commerce, Bureau of Census. “1977 Census of Manufactures: North
Dakota.”
U. S. Department of Commerce, Bureau of Census. “1977 Census of Manufactures: Minnesota.”
U. S. Department of Agriculture, National Agriculture Statistics Service. Quick Facts.
http://www.nass.usda.gov/QuickStats/Create_Federal_Indv.jsp. Accessed February, 2008.

18
U. S. Department of Agriculture, National Agriculture Statistics Service. Agricultural Census.
1997, 2002.

19
Table 1. Name and size of dairy product producers selling in Cass-Clay’s trade area, 2007
Rank Name and Headquarter Location Pounds of Milk
(billions)
Number of
producers
1 Dairy Farmers of America, Kansas City MO 37.599 11,306
3 Land O’Lakes Inc., St. Paul MN 12.260 3,178
7 Associated Milk Producers Inc., New Ulm MN 5.100 3,400
8 Foremost Farms USA, Baraboo WI 4.859 3,697
16 Swiss Valley Farms Co., Davenport IA 1.402 867
20 First District Association, Litchfield MN 1.246 803
28 Bongards Creameries, Bongards MN 0.807 421
40 Cass-Clay Creamery Inc., Fargo ND 0.352 388
45 Sunrise Ag Cooperative, Buckman MN 0.196 169
50 Hastings Cooperative Creamery Association, Hastings MN 0.198 128
Source: Hoard’s Dairyman, October 17, 2007
20
Table 2. US per capita consumption of all dairy products Year U.S. population, July 1 Total Disappearance Per capita consumption (Millions) (Million lbs) (lbs) 1982 232.188 128,747 554.5 1983 234.307 134,206 572.8 1984 236.348 137,505 581.8 1985 238.466 141,551 593.6 1986 240.651 142,313 591.4 1987 242.804 145,963 601.2 1988 245.021 142,721 582.5 1989 247.342 139,455 563.8 1990 250.132 142,063 568.0 1991 253.493 142,895 563.7 1992 256.894 144,517 562.6 1993 260.255 148,153 569.3 1994 263.436 152,685 579.6 1995 266.557 153,597 576.2 1996 269.667 152,695 566.2 1997 272.912 154,794 567.2 1998 276.115 157,988 572.2 1999 279.295 163,139 584.1 2000 282.403 167,246 592.2 2001 285.335 167,351 586.5 2002 288.216 168,996 586.4 2003 291.089 172,895 594.0 2004 293.908 174,273 592.9 2005 296.639 178,146 600.5 Source: USDA/Economic Research Service. Data last updated Feb. 15, 2007. Includes all commercial sales and USDA donations.
www.ers.usda.gov/Data/FoodConsumption/spreadsheets/dymfg.xls

21
Table 3 Dairy costs of production, by herd size, 2005
Enterprise size (number of milk cows) <50 50-99 100-199 200-499 500-999 >999 Mean herd size 35 69 133 295 666 2,083 Output per cow (lbs) 15,055 17,149 18,228 19,487 20,719 20,195
Dollars per hundredweight Total operating costs 12.30 12.94 11.51 11.31 11.07 9.74
Purchased feed 3.60 3.75 4.12 5.00 5.64 5.99Homegrown feed 5.02 5.07 4.06 3.01 2.58 1.47Grazed feed 0.41 0.15 0.11 0.10 0.02 0.01
Allocated overhead 17.79 12.56 9.31 6.61 5.00 3.85Hired labor 0.50 0.80 1.34 1.84 1.80 1.61Unpaid labor 10.60 6.10 6.13 1.34 0.54 0.17Capital recovery 5.26 4.56 3.89 2.55 2.03 1.66
Total costs 30.09 25.50 20.82 17.92 16.07 13.59Gross value of production 17.87 17.56 17.20 17.25 16.56 16.54Net returns -12.22 -7.94 -3.62 -0.67 0.49 2.95
Source: McDonald et al., 2007

22
Table 4. Prices received by farmers, all milk
Year 1st
Quarter 2nd Quarter 3rd
Quarter 4th
Quarter Annual Deflator Real Price
Dollars per hundredweight1997 13.50 12.70 12.63 14.53 13.34 100.0 13.34 1998 14.70 13.83 15.53 17.93 15.50 106.1 14.61 1999 15.93 12.80 14.83 13.83 14.35 109.7 13.08 2000 11.87 12.07 12.63 12.67 12.31 109.3 11.26 2001 13.33 15.43 16.60 14.50 14.97 114.1 13.12 2002 13.10 12.03 11.33 11.97 12.11 109.9 11.02 2003 11.37 11.00 13.30 14.40 12.52 117.5 10.65 2004 14.07 18.53 15.50 16.07 16.04 124.4 12.90 2005 15.67 14.83 14.97 15.10 15.14 127.0 11.92 2006 13.53 12.00 12.23 13.87 12.91 125.5 10.28 2007 13.95 13.10 13.35 14.05 13.61 140.1 9.71
Deflated to 1997 dollars http://future.aae.wisc.edu/data/monthly_values/by_area/316?area=US&tab=prices&grid=true http://usda.mannlib.cornell.edu/MannUsda/viewDocumentInfo.do?documentID=1207