Embed Size (px)
Citation preview
Casio FX-9750GIIGuide for Introductory Statistics
Includes step-by-step instructions,practice exercises, and links to video
tutorials. Covers all calculator featuresneeded for AP® Statistics Exam
Instructions excerpted fromAdvanced High School Statistics,
available for FREE at openintro.org/ahss
Author of instructions
David DiezOpenIntro, Inc.
Guide aggregated by
Leah DorazioSan Francisco University High School
August 19, 2016

Copyright © 2016 OpenIntro, Inc.Updated: August 19, 2016.
This guide is available under a Creative Commons license. Visit openintro.org for a freePDF, to download the source files, or for more information about the license.
AP® is a trademark registered and owned by the College Board, which was not involved in the production of,
and does not endorse, this product.
2
Contents
Summarizing data 4Entering data . . . . . . . . . . . . . . . . . . . . . . . . . . . . . . . . . . . . . . 4Calculating summary statistics and drawing a box plot . . . . . . . . . . . . . . . 4Practice exercises . . . . . . . . . . . . . . . . . . . . . . . . . . . . . . . . . . . . 5
Probability 6Computing the binomial coefficient . . . . . . . . . . . . . . . . . . . . . . . . . . 6Binomial calculations . . . . . . . . . . . . . . . . . . . . . . . . . . . . . . . . . . 6Practice exercises . . . . . . . . . . . . . . . . . . . . . . . . . . . . . . . . . . . . 7
Distribution of random variables 8Finding area under the normal curve . . . . . . . . . . . . . . . . . . . . . . . . . 8Find a Z-score that corresponds to a percentile . . . . . . . . . . . . . . . . . . . 8Practice exercises . . . . . . . . . . . . . . . . . . . . . . . . . . . . . . . . . . . . 9
Inference for categorical data 101-proportion z-interval and z-test . . . . . . . . . . . . . . . . . . . . . . . . . . . 10Practice exercises . . . . . . . . . . . . . . . . . . . . . . . . . . . . . . . . . . . . 112-proportion z-interval and z-test . . . . . . . . . . . . . . . . . . . . . . . . . . . 12Practice exercises . . . . . . . . . . . . . . . . . . . . . . . . . . . . . . . . . . . . 13Finding area unders the Chi-square curve . . . . . . . . . . . . . . . . . . . . . . 14Chi-square goodness of fit test . . . . . . . . . . . . . . . . . . . . . . . . . . . . 14Chi-square test for two-way tables . . . . . . . . . . . . . . . . . . . . . . . . . . 15Practice exercises . . . . . . . . . . . . . . . . . . . . . . . . . . . . . . . . . . . . 16
Inference for numerical data 171-sample t-test and t-interval . . . . . . . . . . . . . . . . . . . . . . . . . . . . . 17Practice exercises . . . . . . . . . . . . . . . . . . . . . . . . . . . . . . . . . . . . 18Matched pairs t-test and t-interval . . . . . . . . . . . . . . . . . . . . . . . . . . 19Practice exercises . . . . . . . . . . . . . . . . . . . . . . . . . . . . . . . . . . . . 192-sample t-test and t-interval . . . . . . . . . . . . . . . . . . . . . . . . . . . . . 20Practice exercises . . . . . . . . . . . . . . . . . . . . . . . . . . . . . . . . . . . . 21
Introduction to linear regression 22Finding b0, b1, R2, and r for a linear model . . . . . . . . . . . . . . . . . . . . . 22Practice exercises . . . . . . . . . . . . . . . . . . . . . . . . . . . . . . . . . . . . 23Linear regression t-test . . . . . . . . . . . . . . . . . . . . . . . . . . . . . . . . . 23
3
Summarizing data
Entering data
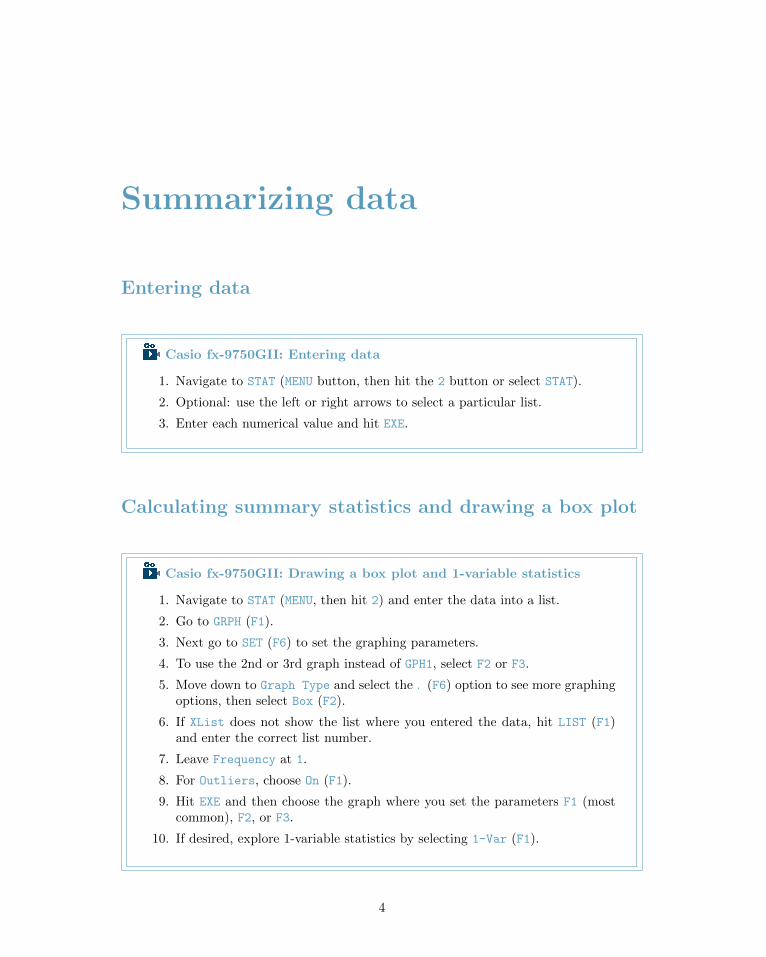
Casio fx-9750GII: Entering data
1. Navigate to STAT (MENU button, then hit the 2 button or select STAT).
2. Optional: use the left or right arrows to select a particular list.
3. Enter each numerical value and hit EXE.
Calculating summary statistics and drawing a box plot
Casio fx-9750GII: Drawing a box plot and 1-variable statistics
1. Navigate to STAT (MENU, then hit 2) and enter the data into a list.
2. Go to GRPH (F1).
3. Next go to SET (F6) to set the graphing parameters.
4. To use the 2nd or 3rd graph instead of GPH1, select F2 or F3.
5. Move down to Graph Type and select the . (F6) option to see more graphingoptions, then select Box (F2).
6. If XList does not show the list where you entered the data, hit LIST (F1)and enter the correct list number.
7. Leave Frequency at 1.
8. For Outliers, choose On (F1).
9. Hit EXE and then choose the graph where you set the parameters F1 (mostcommon), F2, or F3.
10. If desired, explore 1-variable statistics by selecting 1-Var (F1).
4
CONTENTS 5
Calculating the summary statistics will return the following information. It will benecessary to hit the down arrow to see all of the summary statistics.
x Mean minX MinimumΣx Sum of all the data values Q1 First quartileΣx2 Sum of all the squared data values Med Medianσx Population standard deviation maxX Maximumn Sample size or # of data points
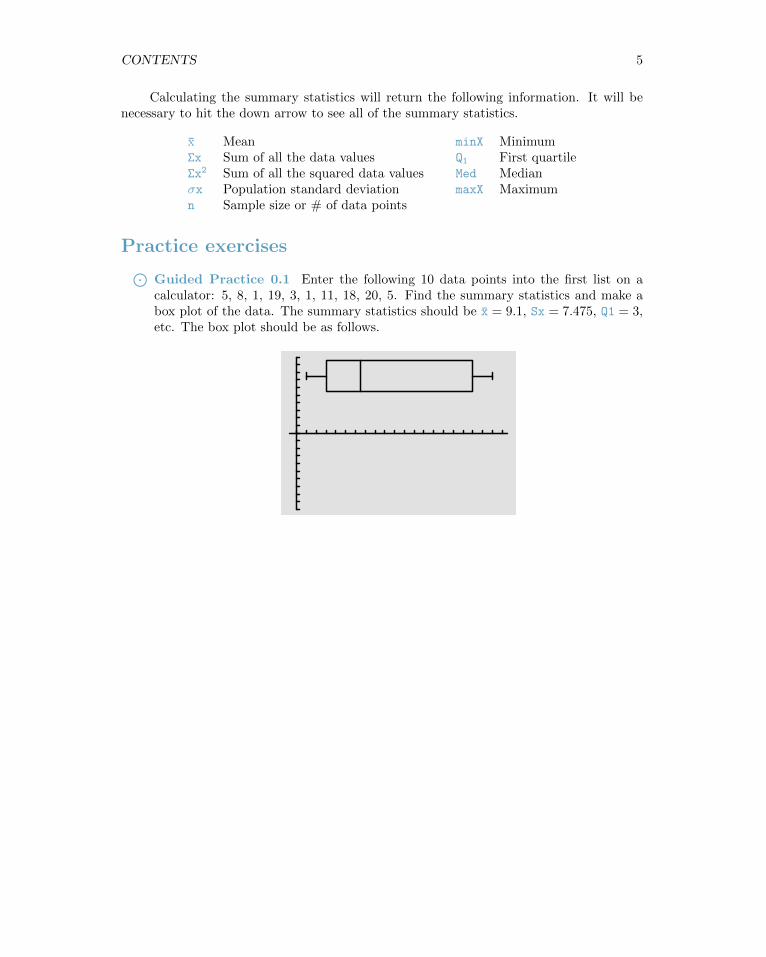
Practice exercises⊙Guided Practice 0.1 Enter the following 10 data points into the first list on acalculator: 5, 8, 1, 19, 3, 1, 11, 18, 20, 5. Find the summary statistics and make abox plot of the data. The summary statistics should be x = 9.1, Sx = 7.475, Q1 = 3,etc. The box plot should be as follows.

Probability
Computing the binomial coefficient
Casio fx-9750GII: Computing the binomial coefficient,(nk
)1. Navigate to the RUN-MAT section (hit MENU, then hit 1).
2. Enter a value for n.
3. Go to CATALOG (hit buttons SHIFT and then 7).
4. Type C (hit the ln button), then navigate down to the bolded C and hit EXE.
5. Enter the value of k. Example of what it should look like: 7C3.
6. Hit EXE.
Binomial calculations
Casio fx-9750GII: Binomial calculations
1. Navigate to STAT (MENU, then hit 2).
2. Select DIST (F5), and then BINM (F5).
3. Choose whether to calculate the binomial distribution for a specific numberof successes, P (X = k), or for a range P (X ≤ k) of values (0 successes,1 success, ..., k successes).
• For a specific number of successes, choose Bpd (F1).
• To consider the range 0, 1, ..., k successes, choose Bcd(F1).
4. If needed, set Data to Variable (Var option, which is F2).
5. Enter the value for x (k), Numtrial (n), and p (probability of a success).
6. Hit EXE.
6
CONTENTS 7
Practice exercises⊙Guided Practice 0.2 Find the number of ways of arranging 3 blue marbles and2 red marbles.1⊙Guided Practice 0.3 There are 13 marbles in a bag. 4 are blue and 9 are red.Randomly draw 5 marbles with replacement. Find the probability you get exactly 3blue marbles.2⊙Guided Practice 0.4 There are 13 marbles in a bag. 4 are blue and 9 are red.Randomly draw 5 marbles with replacement. Find the probability you get at most 3blue marbles (i.e. less than or equal to 3 blue marbles).3
1Use n = 5 and k = 3 to get 10.2Use n = 5, p = 4/13, and x (k) = 3 to get 0.1396.3Use n = 5, p = 4/13, and x = 3 to get 0.9662.
Distribution of randomvariables
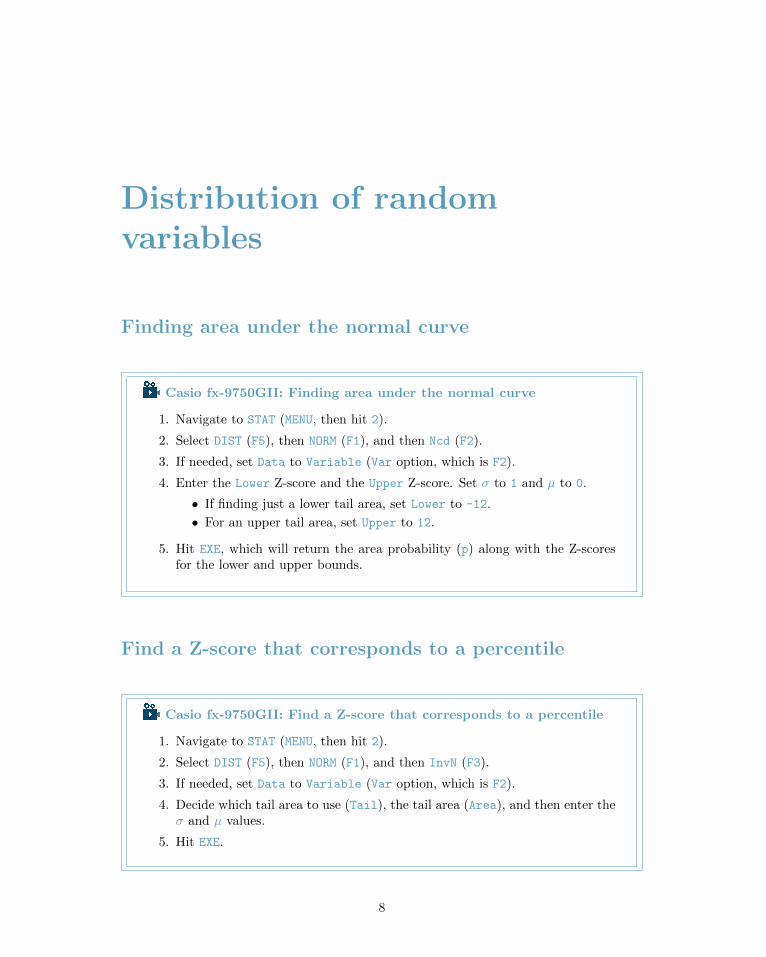
Finding area under the normal curve
Casio fx-9750GII: Finding area under the normal curve
1. Navigate to STAT (MENU, then hit 2).
2. Select DIST (F5), then NORM (F1), and then Ncd (F2).
3. If needed, set Data to Variable (Var option, which is F2).
4. Enter the Lower Z-score and the Upper Z-score. Set σ to 1 and µ to 0.
• If finding just a lower tail area, set Lower to -12.
• For an upper tail area, set Upper to 12.
5. Hit EXE, which will return the area probability (p) along with the Z-scoresfor the lower and upper bounds.
Find a Z-score that corresponds to a percentile
Casio fx-9750GII: Find a Z-score that corresponds to a percentile
1. Navigate to STAT (MENU, then hit 2).
2. Select DIST (F5), then NORM (F1), and then InvN (F3).
3. If needed, set Data to Variable (Var option, which is F2).
4. Decide which tail area to use (Tail), the tail area (Area), and then enter theσ and µ values.
5. Hit EXE.
8
CONTENTS 9
Practice exercises
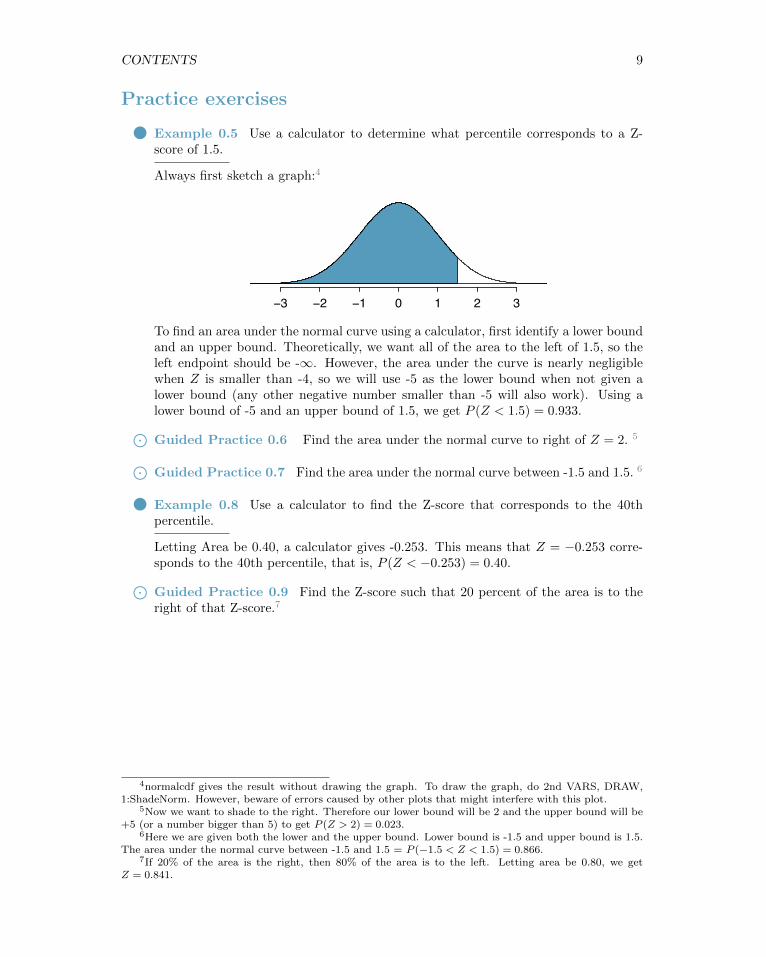
Example 0.5 Use a calculator to determine what percentile corresponds to a Z-score of 1.5.
Always first sketch a graph:4
−3 −2 −1 0 1 2 3
To find an area under the normal curve using a calculator, first identify a lower boundand an upper bound. Theoretically, we want all of the area to the left of 1.5, so theleft endpoint should be -∞. However, the area under the curve is nearly negligiblewhen Z is smaller than -4, so we will use -5 as the lower bound when not given alower bound (any other negative number smaller than -5 will also work). Using alower bound of -5 and an upper bound of 1.5, we get P (Z < 1.5) = 0.933.⊙Guided Practice 0.6 Find the area under the normal curve to right of Z = 2. 5
⊙Guided Practice 0.7 Find the area under the normal curve between -1.5 and 1.5. 6
Example 0.8 Use a calculator to find the Z-score that corresponds to the 40thpercentile.
Letting Area be 0.40, a calculator gives -0.253. This means that Z = −0.253 corre-sponds to the 40th percentile, that is, P (Z < −0.253) = 0.40.⊙Guided Practice 0.9 Find the Z-score such that 20 percent of the area is to theright of that Z-score.7
4normalcdf gives the result without drawing the graph. To draw the graph, do 2nd VARS, DRAW,1:ShadeNorm. However, beware of errors caused by other plots that might interfere with this plot.
5Now we want to shade to the right. Therefore our lower bound will be 2 and the upper bound will be+5 (or a number bigger than 5) to get P (Z > 2) = 0.023.
6Here we are given both the lower and the upper bound. Lower bound is -1.5 and upper bound is 1.5.The area under the normal curve between -1.5 and 1.5 = P (−1.5 < Z < 1.5) = 0.866.
7If 20% of the area is the right, then 80% of the area is to the left. Letting area be 0.80, we getZ = 0.841.
Inference for categorical data
1-proportion z-interval and z-test
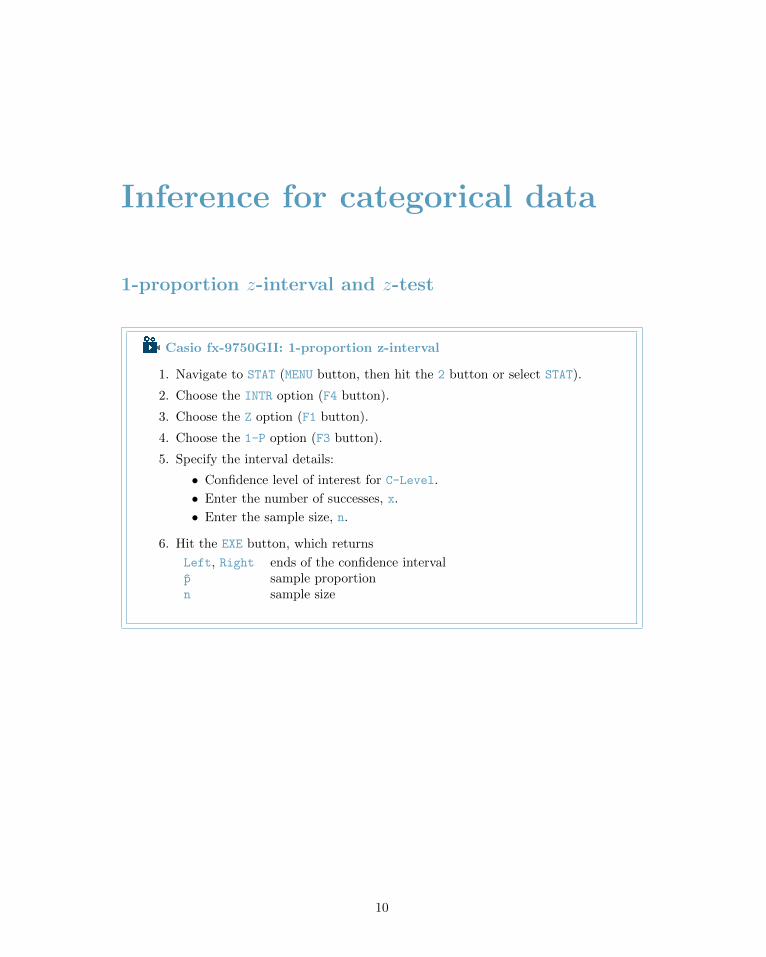
Casio fx-9750GII: 1-proportion z-interval
1. Navigate to STAT (MENU button, then hit the 2 button or select STAT).
2. Choose the INTR option (F4 button).
3. Choose the Z option (F1 button).
4. Choose the 1-P option (F3 button).
5. Specify the interval details:
• Confidence level of interest for C-Level.
• Enter the number of successes, x.
• Enter the sample size, n.
6. Hit the EXE button, which returns
Left, Right ends of the confidence intervalp sample proportionn sample size
10
CONTENTS 11
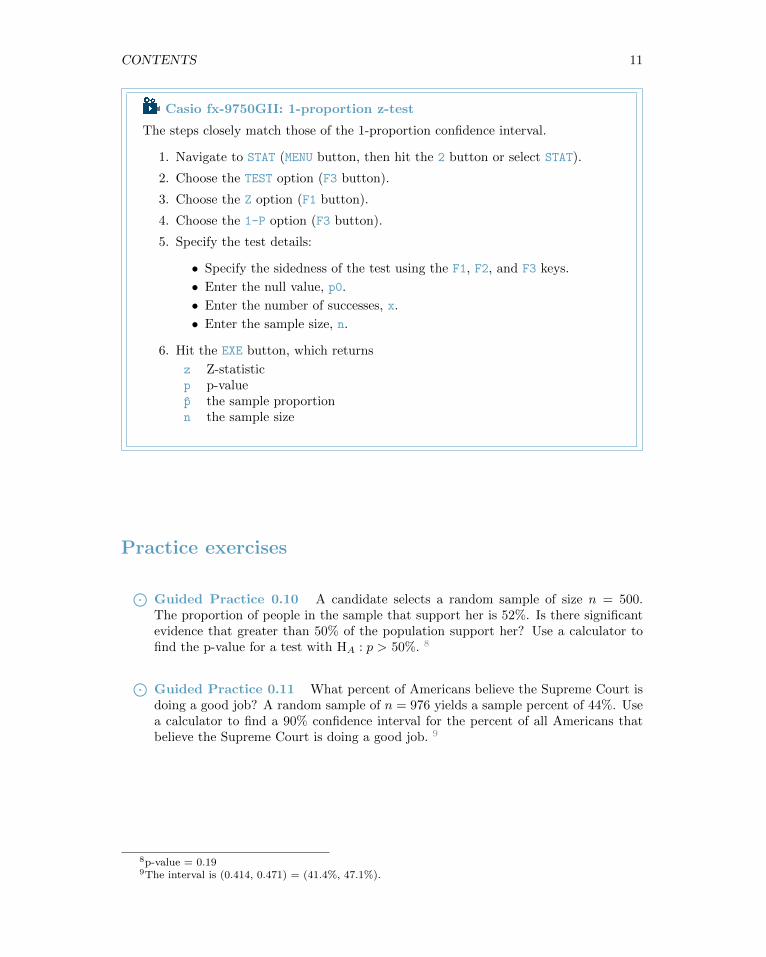
Casio fx-9750GII: 1-proportion z-test
The steps closely match those of the 1-proportion confidence interval.
1. Navigate to STAT (MENU button, then hit the 2 button or select STAT).
2. Choose the TEST option (F3 button).
3. Choose the Z option (F1 button).
4. Choose the 1-P option (F3 button).
5. Specify the test details:
• Specify the sidedness of the test using the F1, F2, and F3 keys.
• Enter the null value, p0.
• Enter the number of successes, x.
• Enter the sample size, n.
6. Hit the EXE button, which returns
z Z-statisticp p-valuep the sample proportionn the sample size
Practice exercises
⊙Guided Practice 0.10 A candidate selects a random sample of size n = 500.The proportion of people in the sample that support her is 52%. Is there significantevidence that greater than 50% of the population support her? Use a calculator tofind the p-value for a test with HA : p > 50%. 8
⊙Guided Practice 0.11 What percent of Americans believe the Supreme Court isdoing a good job? A random sample of n = 976 yields a sample percent of 44%. Usea calculator to find a 90% confidence interval for the percent of all Americans thatbelieve the Supreme Court is doing a good job. 9
8p-value = 0.199The interval is (0.414, 0.471) = (41.4%, 47.1%).
12 CONTENTS
2-proportion z-interval and z-test
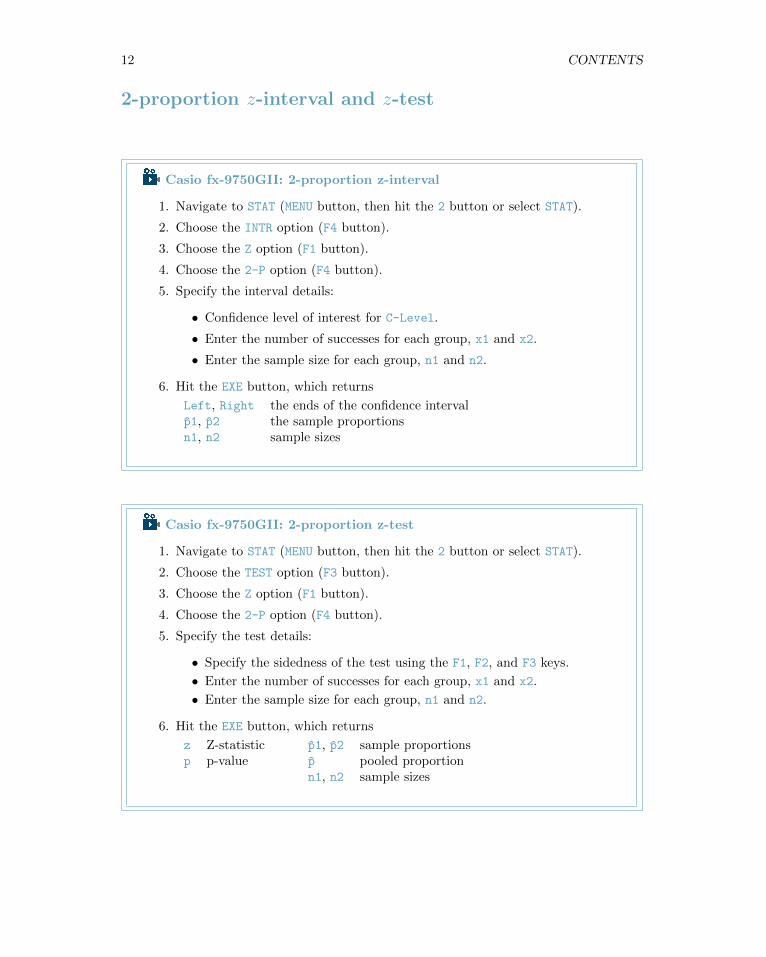
Casio fx-9750GII: 2-proportion z-interval
1. Navigate to STAT (MENU button, then hit the 2 button or select STAT).
2. Choose the INTR option (F4 button).
3. Choose the Z option (F1 button).
4. Choose the 2-P option (F4 button).
5. Specify the interval details:
• Confidence level of interest for C-Level.
• Enter the number of successes for each group, x1 and x2.
• Enter the sample size for each group, n1 and n2.
6. Hit the EXE button, which returns
Left, Right the ends of the confidence intervalp1, p2 the sample proportionsn1, n2 sample sizes
Casio fx-9750GII: 2-proportion z-test
1. Navigate to STAT (MENU button, then hit the 2 button or select STAT).
2. Choose the TEST option (F3 button).
3. Choose the Z option (F1 button).
4. Choose the 2-P option (F4 button).
5. Specify the test details:
• Specify the sidedness of the test using the F1, F2, and F3 keys.
• Enter the number of successes for each group, x1 and x2.
• Enter the sample size for each group, n1 and n2.
6. Hit the EXE button, which returns
z Z-statistic p1, p2 sample proportionsp p-value p pooled proportion
n1, n2 sample sizes
CONTENTS 13
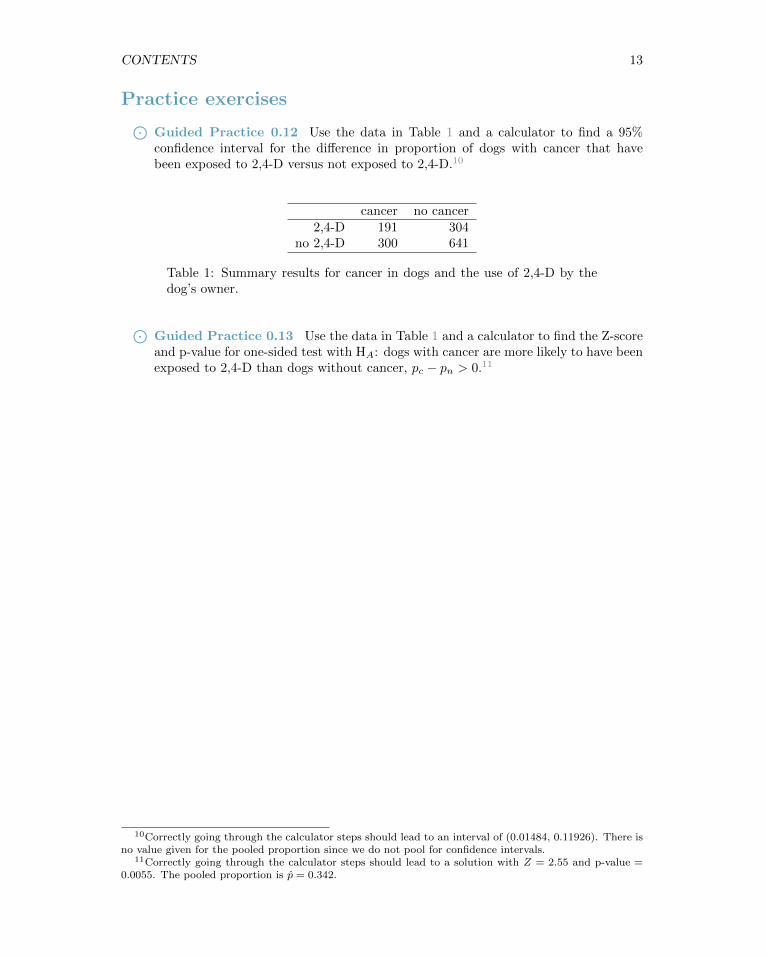
Practice exercises⊙Guided Practice 0.12 Use the data in Table 1 and a calculator to find a 95%confidence interval for the difference in proportion of dogs with cancer that havebeen exposed to 2,4-D versus not exposed to 2,4-D.10
cancer no cancer2,4-D 191 304
no 2,4-D 300 641
Table 1: Summary results for cancer in dogs and the use of 2,4-D by thedog’s owner.
⊙Guided Practice 0.13 Use the data in Table 1 and a calculator to find the Z-scoreand p-value for one-sided test with HA: dogs with cancer are more likely to have beenexposed to 2,4-D than dogs without cancer, pc − pn > 0.11
10Correctly going through the calculator steps should lead to an interval of (0.01484, 0.11926). There isno value given for the pooled proportion since we do not pool for confidence intervals.
11Correctly going through the calculator steps should lead to a solution with Z = 2.55 and p-value =0.0055. The pooled proportion is p = 0.342.
14 CONTENTS
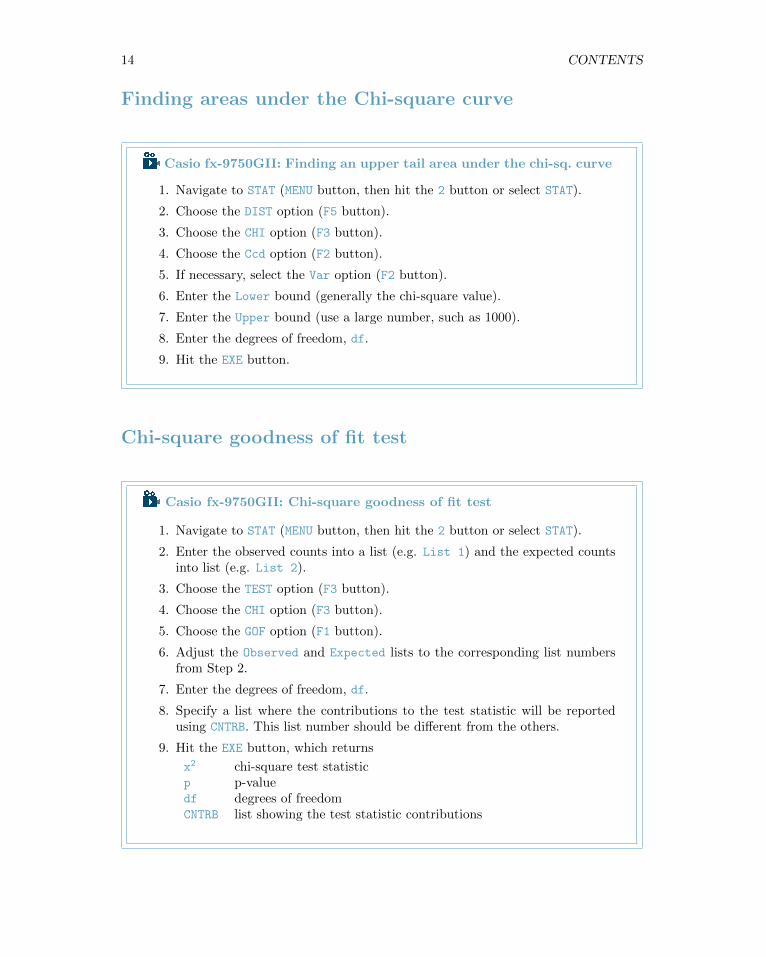
Finding areas under the Chi-square curve
Casio fx-9750GII: Finding an upper tail area under the chi-sq. curve
1. Navigate to STAT (MENU button, then hit the 2 button or select STAT).
2. Choose the DIST option (F5 button).
3. Choose the CHI option (F3 button).
4. Choose the Ccd option (F2 button).
5. If necessary, select the Var option (F2 button).
6. Enter the Lower bound (generally the chi-square value).
7. Enter the Upper bound (use a large number, such as 1000).
8. Enter the degrees of freedom, df.
9. Hit the EXE button.
Chi-square goodness of fit test
Casio fx-9750GII: Chi-square goodness of fit test
1. Navigate to STAT (MENU button, then hit the 2 button or select STAT).
2. Enter the observed counts into a list (e.g. List 1) and the expected countsinto list (e.g. List 2).
3. Choose the TEST option (F3 button).
4. Choose the CHI option (F3 button).
5. Choose the GOF option (F1 button).
6. Adjust the Observed and Expected lists to the corresponding list numbersfrom Step 2.
7. Enter the degrees of freedom, df.
8. Specify a list where the contributions to the test statistic will be reportedusing CNTRB. This list number should be different from the others.
9. Hit the EXE button, which returns
x2 chi-square test statisticp p-valuedf degrees of freedomCNTRB list showing the test statistic contributions
CONTENTS 15
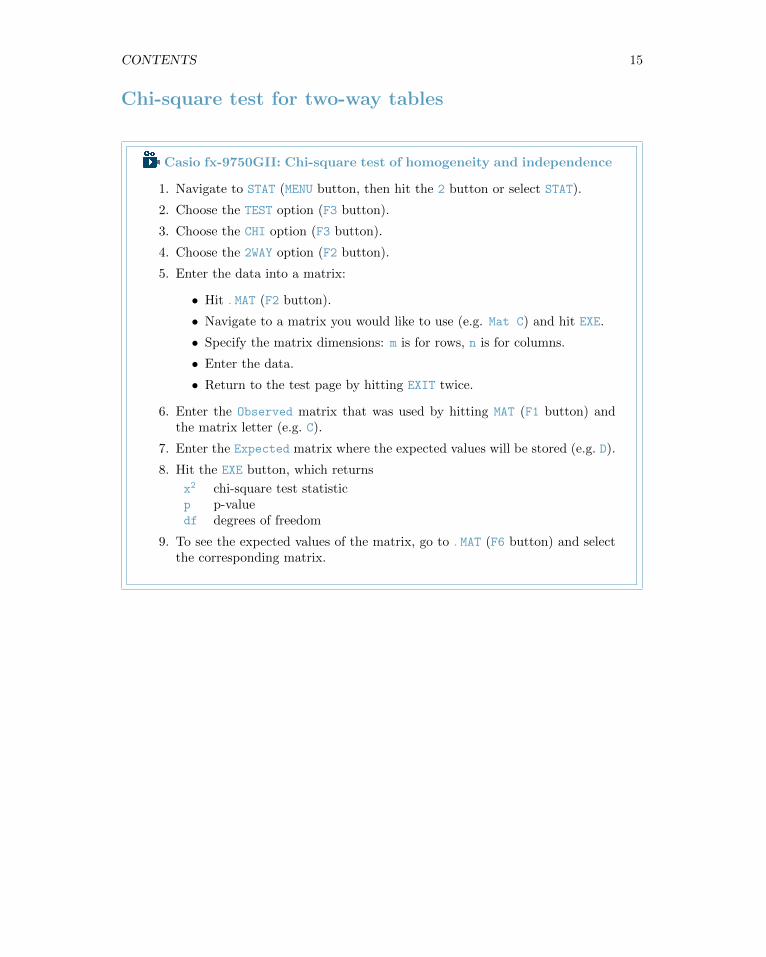
Chi-square test for two-way tables
Casio fx-9750GII: Chi-square test of homogeneity and independence
1. Navigate to STAT (MENU button, then hit the 2 button or select STAT).
2. Choose the TEST option (F3 button).
3. Choose the CHI option (F3 button).
4. Choose the 2WAY option (F2 button).
5. Enter the data into a matrix:
• Hit .MAT (F2 button).
• Navigate to a matrix you would like to use (e.g. Mat C) and hit EXE.
• Specify the matrix dimensions: m is for rows, n is for columns.
• Enter the data.
• Return to the test page by hitting EXIT twice.
6. Enter the Observed matrix that was used by hitting MAT (F1 button) andthe matrix letter (e.g. C).
7. Enter the Expected matrix where the expected values will be stored (e.g. D).
8. Hit the EXE button, which returns
x2 chi-square test statisticp p-valuedf degrees of freedom
9. To see the expected values of the matrix, go to .MAT (F6 button) and selectthe corresponding matrix.
16 CONTENTS
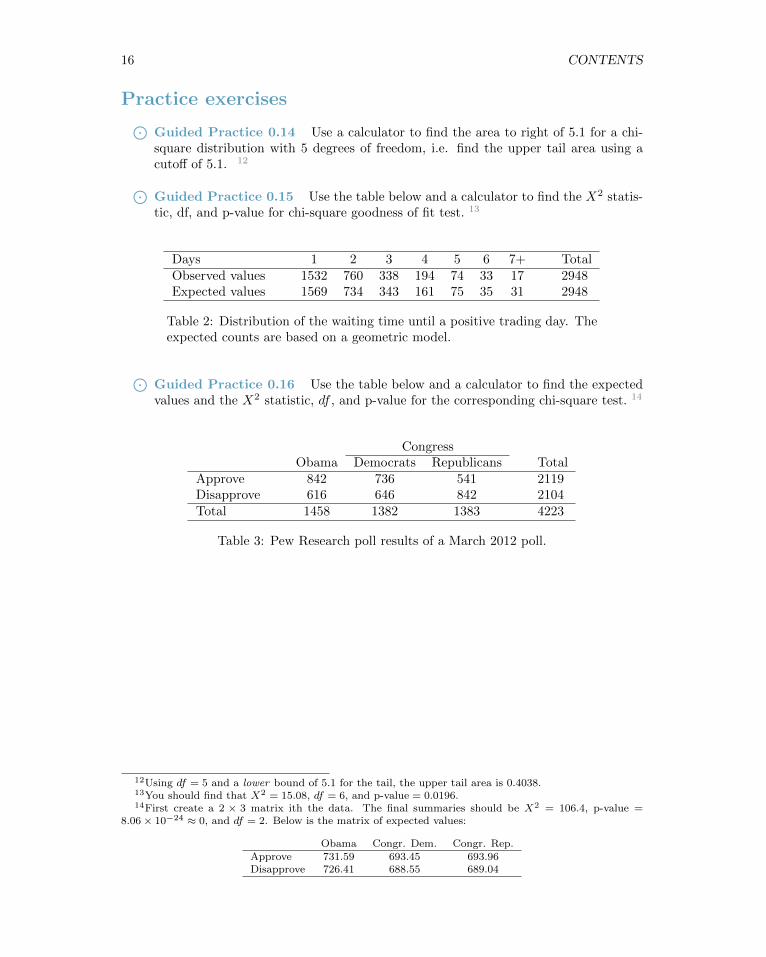
Practice exercises⊙Guided Practice 0.14 Use a calculator to find the area to right of 5.1 for a chi-square distribution with 5 degrees of freedom, i.e. find the upper tail area using acutoff of 5.1. 12
⊙Guided Practice 0.15 Use the table below and a calculator to find the X2 statis-tic, df, and p-value for chi-square goodness of fit test. 13
Days 1 2 3 4 5 6 7+ TotalObserved values 1532 760 338 194 74 33 17 2948Expected values 1569 734 343 161 75 35 31 2948
Table 2: Distribution of the waiting time until a positive trading day. Theexpected counts are based on a geometric model.
⊙Guided Practice 0.16 Use the table below and a calculator to find the expectedvalues and the X2 statistic, df , and p-value for the corresponding chi-square test. 14
CongressObama Democrats Republicans Total
Approve 842 736 541 2119Disapprove 616 646 842 2104Total 1458 1382 1383 4223
Table 3: Pew Research poll results of a March 2012 poll.
12Using df = 5 and a lower bound of 5.1 for the tail, the upper tail area is 0.4038.13You should find that X2 = 15.08, df = 6, and p-value = 0.0196.14First create a 2 × 3 matrix ith the data. The final summaries should be X2 = 106.4, p-value =
8.06× 10⁻²⁴ ≈ 0, and df = 2. Below is the matrix of expected values:
Obama Congr. Dem. Congr. Rep.Approve 731.59 693.45 693.96Disapprove 726.41 688.55 689.04

Inference for numerical data
1-sample t-test and t-interval
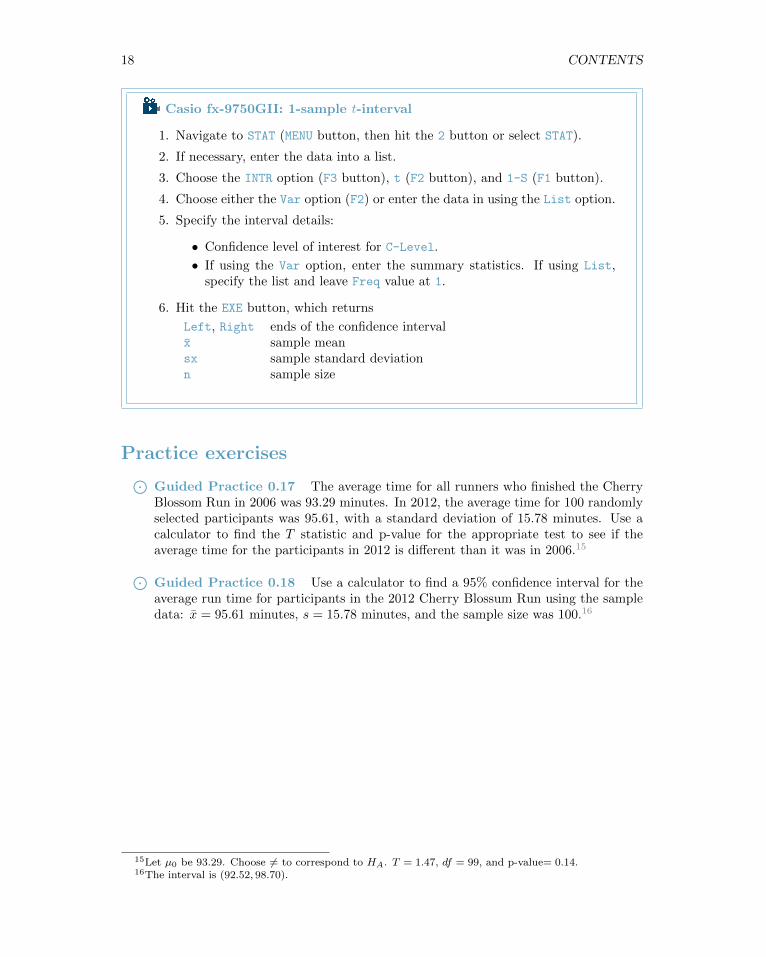
Casio fx-9750GII: 1-sample t-test
1. Navigate to STAT (MENU button, then hit the 2 button or select STAT).
2. If necessary, enter the data into a list.
3. Choose the TEST option (F3 button).
4. Choose the t option (F2 button).
5. Choose the 1-S option (F1 button).
6. Choose either the Var option (F2) or enter the data in using the List option.
7. Specify the test details:
• Specify the sidedness of the test using the F1, F2, and F3 keys.
• Enter the null value, µ0.
• If using the Var option, enter the summary statistics. If using List,specify the list and leave Freq values at 1.
8. Hit the EXE button, which returns
alternative hypothesis x sample meant T statistic sx sample standard deviationp p-value n sample size
17
18 CONTENTS
Casio fx-9750GII: 1-sample t-interval
1. Navigate to STAT (MENU button, then hit the 2 button or select STAT).
2. If necessary, enter the data into a list.
3. Choose the INTR option (F3 button), t (F2 button), and 1-S (F1 button).
4. Choose either the Var option (F2) or enter the data in using the List option.
5. Specify the interval details:
• Confidence level of interest for C-Level.
• If using the Var option, enter the summary statistics. If using List,specify the list and leave Freq value at 1.
6. Hit the EXE button, which returns
Left, Right ends of the confidence intervalx sample meansx sample standard deviationn sample size
Practice exercises⊙Guided Practice 0.17 The average time for all runners who finished the CherryBlossom Run in 2006 was 93.29 minutes. In 2012, the average time for 100 randomlyselected participants was 95.61, with a standard deviation of 15.78 minutes. Use acalculator to find the T statistic and p-value for the appropriate test to see if theaverage time for the participants in 2012 is different than it was in 2006.15⊙Guided Practice 0.18 Use a calculator to find a 95% confidence interval for theaverage run time for participants in the 2012 Cherry Blossum Run using the sampledata: x = 95.61 minutes, s = 15.78 minutes, and the sample size was 100.16
15Let µ0 be 93.29. Choose 6= to correspond to HA. T = 1.47, df = 99, and p-value= 0.14.16The interval is (92.52, 98.70).
CONTENTS 19
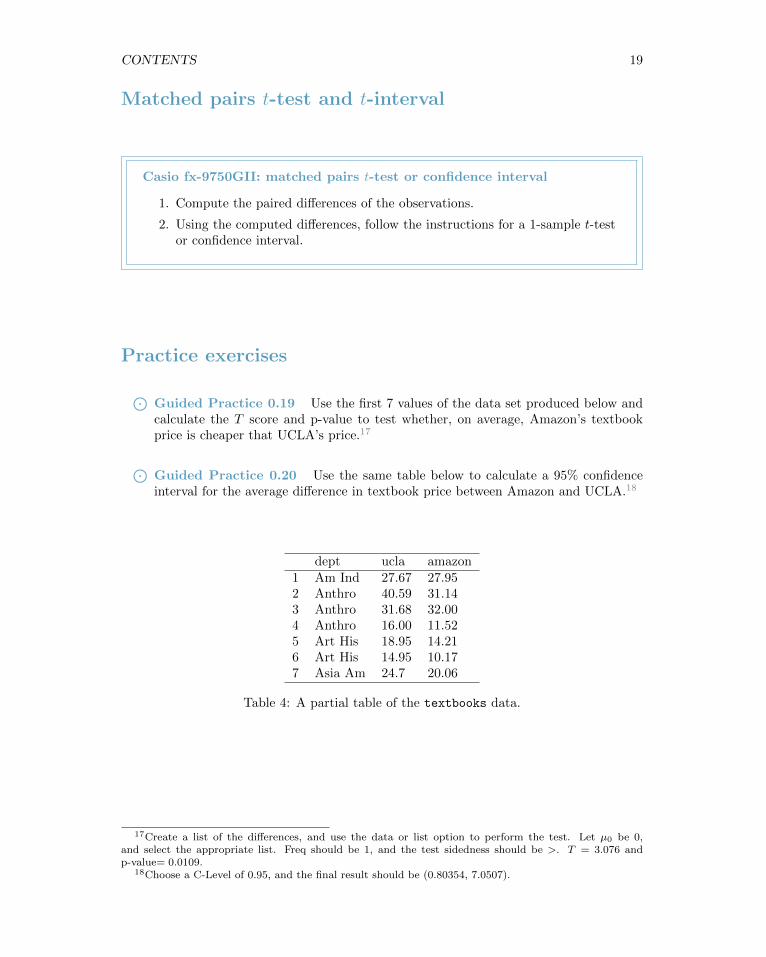
Matched pairs t-test and t-interval
Casio fx-9750GII: matched pairs t-test or confidence interval
1. Compute the paired differences of the observations.
2. Using the computed differences, follow the instructions for a 1-sample t-testor confidence interval.
Practice exercises
⊙Guided Practice 0.19 Use the first 7 values of the data set produced below andcalculate the T score and p-value to test whether, on average, Amazon’s textbookprice is cheaper that UCLA’s price.17
⊙Guided Practice 0.20 Use the same table below to calculate a 95% confidenceinterval for the average difference in textbook price between Amazon and UCLA.18
dept ucla amazon1 Am Ind 27.67 27.952 Anthro 40.59 31.143 Anthro 31.68 32.004 Anthro 16.00 11.525 Art His 18.95 14.216 Art His 14.95 10.177 Asia Am 24.7 20.06
Table 4: A partial table of the textbooks data.
17Create a list of the differences, and use the data or list option to perform the test. Let µ0 be 0,and select the appropriate list. Freq should be 1, and the test sidedness should be >. T = 3.076 andp-value= 0.0109.
18Choose a C-Level of 0.95, and the final result should be (0.80354, 7.0507).
20 CONTENTS
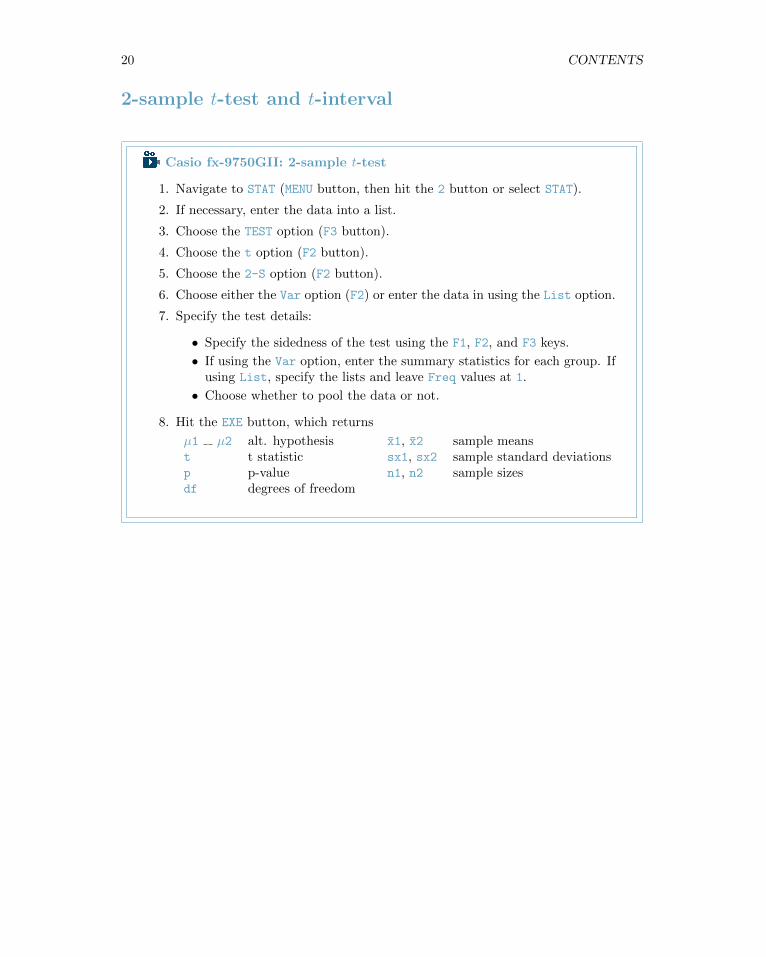
2-sample t-test and t-interval
Casio fx-9750GII: 2-sample t-test
1. Navigate to STAT (MENU button, then hit the 2 button or select STAT).
2. If necessary, enter the data into a list.
3. Choose the TEST option (F3 button).
4. Choose the t option (F2 button).
5. Choose the 2-S option (F2 button).
6. Choose either the Var option (F2) or enter the data in using the List option.
7. Specify the test details:
• Specify the sidedness of the test using the F1, F2, and F3 keys.
• If using the Var option, enter the summary statistics for each group. Ifusing List, specify the lists and leave Freq values at 1.
• Choose whether to pool the data or not.
8. Hit the EXE button, which returns
µ1 µ2 alt. hypothesis x1, x2 sample meanst t statistic sx1, sx2 sample standard deviationsp p-value n1, n2 sample sizesdf degrees of freedom
CONTENTS 21
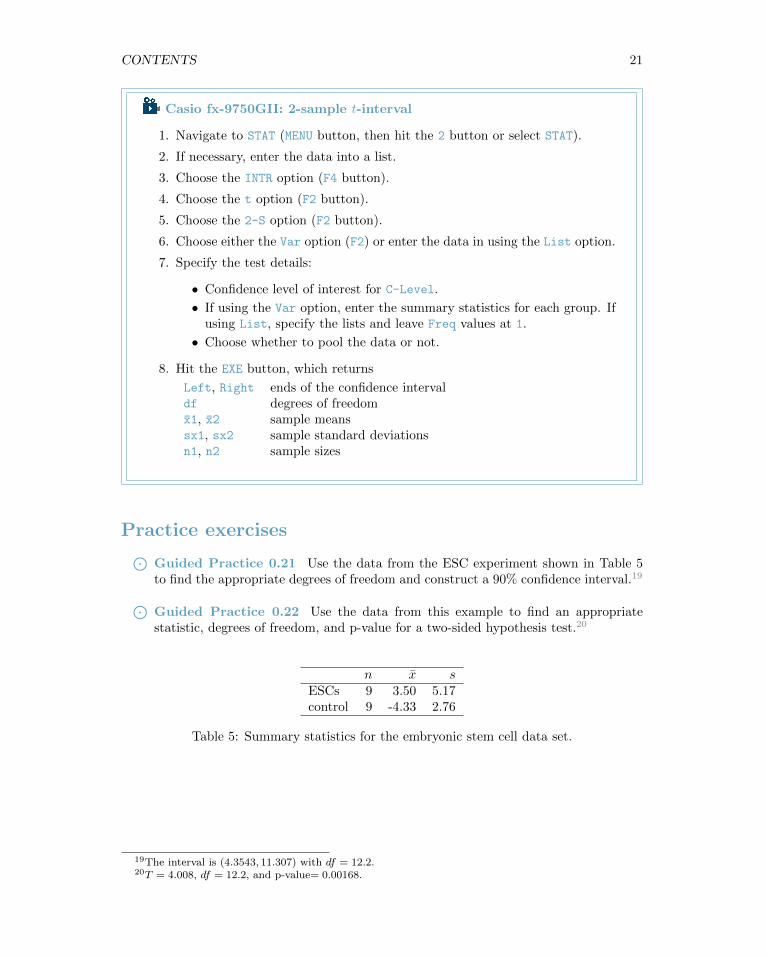
Casio fx-9750GII: 2-sample t-interval
1. Navigate to STAT (MENU button, then hit the 2 button or select STAT).
2. If necessary, enter the data into a list.
3. Choose the INTR option (F4 button).
4. Choose the t option (F2 button).
5. Choose the 2-S option (F2 button).
6. Choose either the Var option (F2) or enter the data in using the List option.
7. Specify the test details:
• Confidence level of interest for C-Level.
• If using the Var option, enter the summary statistics for each group. Ifusing List, specify the lists and leave Freq values at 1.
• Choose whether to pool the data or not.
8. Hit the EXE button, which returns
Left, Right ends of the confidence intervaldf degrees of freedomx1, x2 sample meanssx1, sx2 sample standard deviationsn1, n2 sample sizes
Practice exercises⊙Guided Practice 0.21 Use the data from the ESC experiment shown in Table 5to find the appropriate degrees of freedom and construct a 90% confidence interval.19⊙Guided Practice 0.22 Use the data from this example to find an appropriatestatistic, degrees of freedom, and p-value for a two-sided hypothesis test.20
n x sESCs 9 3.50 5.17control 9 -4.33 2.76
Table 5: Summary statistics for the embryonic stem cell data set.
19The interval is (4.3543, 11.307) with df = 12.2.20T = 4.008, df = 12.2, and p-value= 0.00168.
Introduction to linearregression
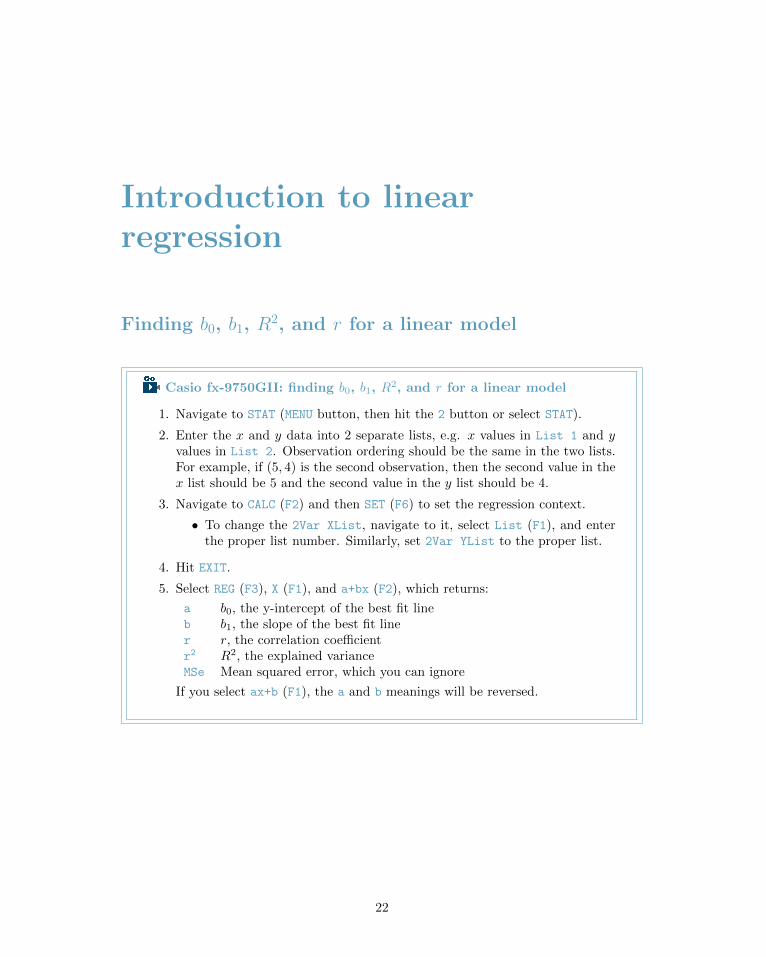
Finding b0, b1, R2, and r for a linear model
Casio fx-9750GII: finding b0, b1, R2, and r for a linear model
1. Navigate to STAT (MENU button, then hit the 2 button or select STAT).
2. Enter the x and y data into 2 separate lists, e.g. x values in List 1 and yvalues in List 2. Observation ordering should be the same in the two lists.For example, if (5, 4) is the second observation, then the second value in thex list should be 5 and the second value in the y list should be 4.
3. Navigate to CALC (F2) and then SET (F6) to set the regression context.
• To change the 2Var XList, navigate to it, select List (F1), and enterthe proper list number. Similarly, set 2Var YList to the proper list.
4. Hit EXIT.
5. Select REG (F3), X (F1), and a+bx (F2), which returns:
a b0, the y-intercept of the best fit lineb b1, the slope of the best fit liner r, the correlation coefficientr2 R2, the explained varianceMSe Mean squared error, which you can ignore
If you select ax+b (F1), the a and b meanings will be reversed.
22
CONTENTS 23
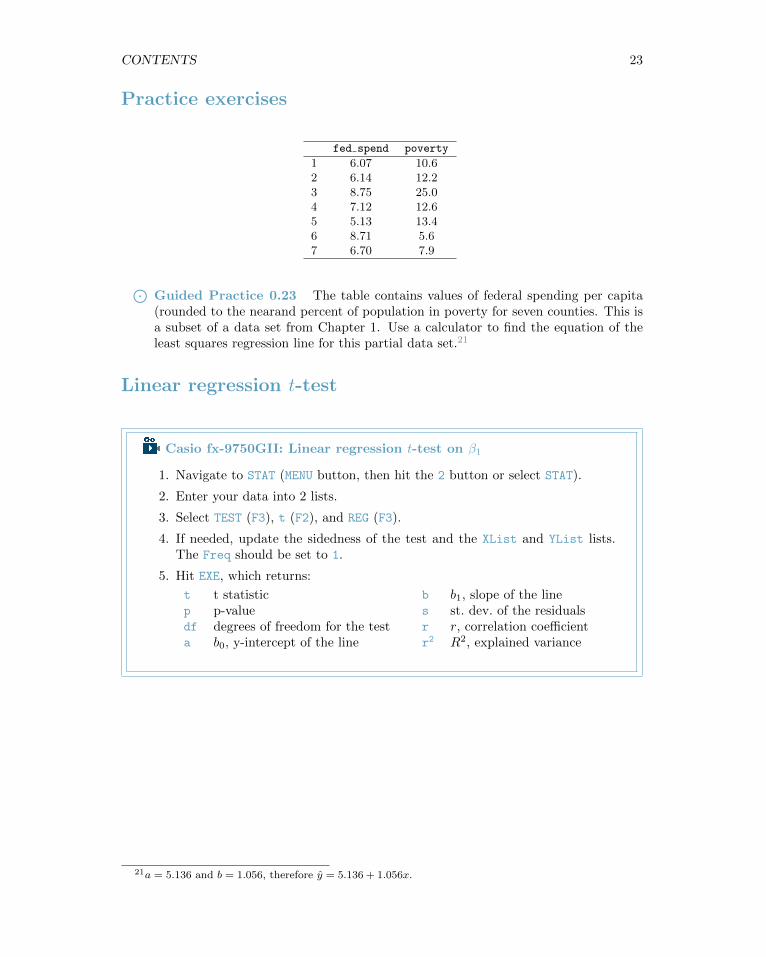
Practice exercises
fed spend poverty
1 6.07 10.62 6.14 12.23 8.75 25.04 7.12 12.65 5.13 13.46 8.71 5.67 6.70 7.9
⊙Guided Practice 0.23 The table contains values of federal spending per capita(rounded to the nearand percent of population in poverty for seven counties. This isa subset of a data set from Chapter 1. Use a calculator to find the equation of theleast squares regression line for this partial data set.21
Linear regression t-test
Casio fx-9750GII: Linear regression t-test on β1
1. Navigate to STAT (MENU button, then hit the 2 button or select STAT).
2. Enter your data into 2 lists.
3. Select TEST (F3), t (F2), and REG (F3).
4. If needed, update the sidedness of the test and the XList and YList lists.The Freq should be set to 1.
5. Hit EXE, which returns:
t t statistic b b1, slope of the linep p-value s st. dev. of the residualsdf degrees of freedom for the test r r, correlation coefficienta b0, y-intercept of the line r2 R2, explained variance
21a = 5.136 and b = 1.056, therefore y = 5.136 + 1.056x.