Embed Size (px)
Citation preview

C A S H E W Shigh l igh ts o f the cashew indus t r y
presented by Red River Foods, Inc.
JUNE 2011


Red River Foods, Inc. June 2011 1
Peru
Brazil
SenegalGuinea-BissauIvory CoastGhanaBeninNigeriaMaliTogoGuineaBurkina FasoGambia
ThailandMalaysiaCambodia
Indonesia
0° 0°EQUATOR
PhilippinesVietnamIndia
Sri LankaKenya
Tanzania
Mozambique
Madagascar
major cashew kernel trade
from India & Vietnam
To Europe
To Middle East
To Europe
from India
to India & Vietnam
major raw cashew trade
A WORLD VIEW The cashew is native to northeastern Brazil. In the mid-to-late 1500s, Portuguese traders and explorers introduced the cashew tree
to India and to the east coast of Africa in an area that is now Mozambique. In Africa, the tree was spread along the east coast (today,
Kenya and Tanzania) and was later introduced to the continent’s west coast, where it presently grows from Senegal to Nigeria. Portuguese
and Spanish traders also introduced the cashew tree to Southeast Asia. The cashew tree now grows in tropical climates of about thirty
countries across the globe within a band approximately 25-30 degrees north and south latitude of the equator. India is the largest
single producer of cashew nuts while West Africa--principally Ivory Coast, Benin, and Guinea-Bissau—is the largest regional producer.
Vietnam, Brazil, and East Africa are the other major sources of production. Indonesia has become a major producer and exporter in
Southeast Asia.
The world map below identifi es countries with estimated annual raw cashew production of one or more million kgs in 2011. Countries
which are identifi ed in bold are major producers and are the most important exporters of either raw cashews and/or processed cashew
kernels. The cashew kernel trade and the raw cashew trade are highlighted, showing the major kernel export destinations from India,
Vietnam, and Brazil and the sources of Indian and Vietnamese raw cashew imports.
The fi nal product: Roasted/Salted Cashew Nuts

2 Highlights of the cashew industry
INDUSTRY PERSPECTIVEThe international cashew market never suffers from a lack of uncertainty. The last eighteen months witnessed a “tightening” of the market
in all its many aspects, from supply to pricing, from collection to procurement to fi nancing to processing to shipping to inspection…
throughout the chain, from tree to table. Not to mention weather-related effects on crops worldwide. As we publish this brochure, the
industry is dealing with:
• Expanding quality and food safety requirements
• Tightening supplies as Indian domestic consumption rises and 2010-2011 crops from all major origins are below expectations
• Rising demand in China, adding further pressure on world supplies
• Halts and delays in major West African raw shipments to India and Vietnam because of civil war in the Ivory Coast
• The need for--but uncertainty about--the reliability of West African production and shipments because of sporadic
civil unrest
• Defaults and delays in shipments from India and Vietnam
• Record high prices
In 2010 Middle Eastern markets (including Turkey) remained strong with Indian exports to the region down only slightly to 24.9 million
kgs from 27.6 million kgs in 2009. In the meantime, Vietnamese exports to the region rose from 6.8 to 8.1 million kgs and Brazilian
shipments to the Middle East, though relatively minor, increased from 1.9 to 2.2 million kgs. The Vietnamese cross-border trade with
China grew by one-third between 2009 and 2010, from 32 to 42 million kgs. U.S. demand remained strong with imports increasing
from 117 to 119 million kgs. European Union imports from the three major origins were down less than one million kgs: 71.9 million
kgs in 2009 vs. 71.2 million kgs in 2010.
Thus, even without weather-related crop diffi culties, world demand remains strong and generally exceeds supply. Importantly, at any
given time demand is likely to exceed the availability of raw cashews and kernels, which could mean periodic defi cits and high prices
for particular grades.
Vacuum Sealed Bags
Red River Foods, Inc. June 2011 3
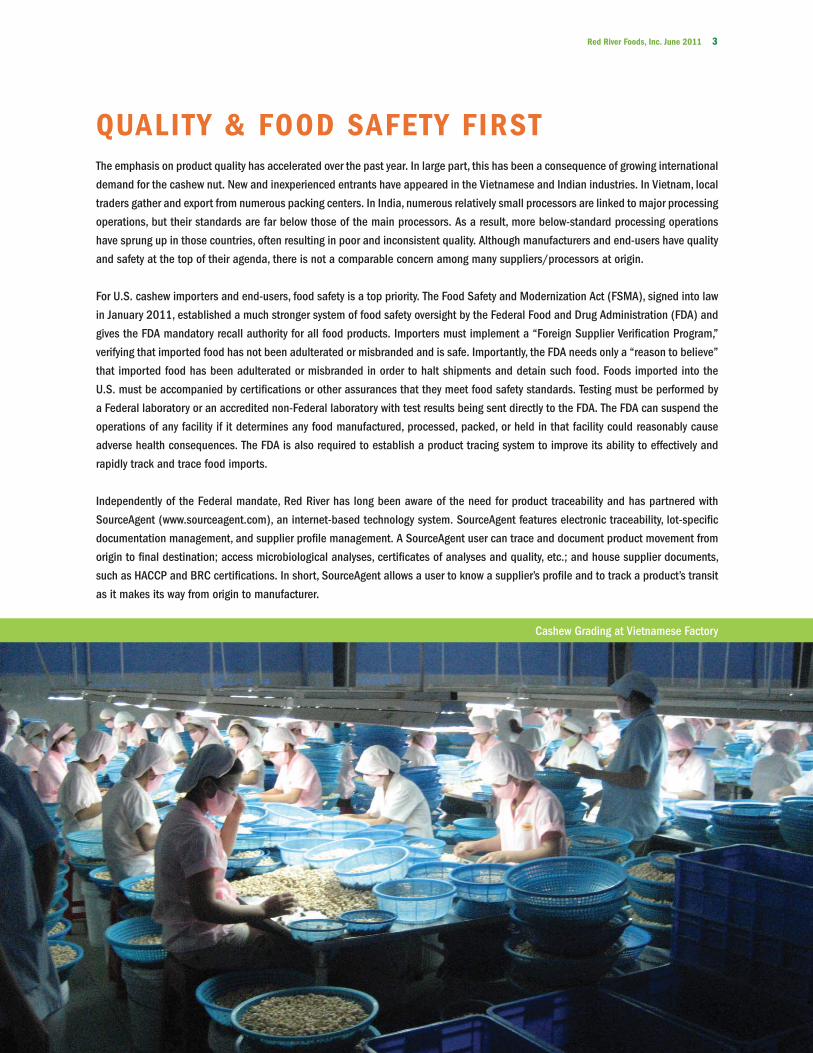
QUALITY & FOOD SAFETY FIRSTThe emphasis on product quality has accelerated over the past year. In large part, this has been a consequence of growing international
demand for the cashew nut. New and inexperienced entrants have appeared in the Vietnamese and Indian industries. In Vietnam, local
traders gather and export from numerous packing centers. In India, numerous relatively small processors are linked to major processing
operations, but their standards are far below those of the main processors. As a result, more below-standard processing operations
have sprung up in those countries, often resulting in poor and inconsistent quality. Although manufacturers and end-users have quality
and safety at the top of their agenda, there is not a comparable concern among many suppliers/processors at origin.
For U.S. cashew importers and end-users, food safety is a top priority. The Food Safety and Modernization Act (FSMA), signed into law
in January 2011, established a much stronger system of food safety oversight by the Federal Food and Drug Administration (FDA) and
gives the FDA mandatory recall authority for all food products. Importers must implement a “Foreign Supplier Verifi cation Program,”
verifying that imported food has not been adulterated or misbranded and is safe. Importantly, the FDA needs only a “reason to believe”
that imported food has been adulterated or misbranded in order to halt shipments and detain such food. Foods imported into the
U.S. must be accompanied by certifi cations or other assurances that they meet food safety standards. Testing must be performed by
a Federal laboratory or an accredited non-Federal laboratory with test results being sent directly to the FDA. The FDA can suspend the
operations of any facility if it determines any food manufactured, processed, packed, or held in that facility could reasonably cause
adverse health consequences. The FDA is also required to establish a product tracing system to improve its ability to effectively and
rapidly track and trace food imports.
Independently of the Federal mandate, Red River has long been aware of the need for product traceability and has partnered with
SourceAgent (www.sourceagent.com), an internet-based technology system. SourceAgent features electronic traceability, lot-specifi c
documentation management, and supplier profi le management. A SourceAgent user can trace and document product movement from
origin to fi nal destination; access microbiological analyses, certifi cates of analyses and quality, etc.; and house supplier documents,
such as HACCP and BRC certifi cations. In short, SourceAgent allows a user to know a supplier’s profi le and to track a product’s transit
as it makes its way from origin to manufacturer.
Cashew Grading at Vietnamese Factory

4 Highlights of the cashew industry
The world cashew trade is balanced on the annual cashew production cycle. Short or poor crops anywhere or abnormal weather conditions distort the trade pattern, consequently affecting prices. Vietnam produces the year’s fi rst crop, and shortly thereafter India’s crop comes in. At approximately the same time, West African crops are being harvested. Harvest of the Brazilian and East African crops begins in August/September, tying the trade over until the new crops of Vietnam, India, and West Africa are harvested early the following year.
Disruptions in the international market are not uncommon, but the 2010-2011 seasons put unusual pressures on the trade. The 2011 Brazilian crop of approximately 155 million kgs was only half the normal production of 300 million kgs, sharply reducing the amount available for orders from November through February. Wet weather in both India and Vietnam in early 2011 delayed early harvesting and interfered with drying of the raw seed.
Rising Indian domestic consumption has drawn down the amount of kernels available to the trade as Indian export tonnage declines, and Indian exports were down for the third consecutive year in 2010. With only limited processing capabilities, West Africa exports its raw seed to India and Vietnam. Civil disorder in the Ivory Coast early in 2011 introduced much uncertainty into availability of West African raw seed. Because of the resulting delay in shipments, the lack of storage space in the Ivory Coast raised questions about maintenance of seed quality. In turn, this contributed to Vietnamese and Indian suppliers holding out for higher prices. Thus, any one major disruption in the production cycle has multiple effects on the marketing of kernels.
Maturing Cashews
THE PRODUCTION CYCLE
JA
N FE
B
MAR
APR
MAY
JUN
JULA
UG
S E P
O C T
NO
V
DEC
Brazil
East Africa
India
Vietnam/W. Africa
FLOWERING
FLOWERING
FLOW
ERIN
GFL
OWER
ING
HARVESTING
HARV
ESTIN
G
HARV
ESTI
NG
HARVESTINGHARVESTING
HARVESTINGHARVESTING

Red River Foods, Inc. June 2011 5
HARVESTING SEASONSHarvesting seasons are generally similar in the producing countries, depending on their location relative to the equator. Countries
north of the equator, including India, Vietnam, and producers in West Africa, harvest from early in the calendar year to approximately
mid-year. Countries south of the equator, including Brazil and producers in East Africa, harvest from September or October to early in
the following calendar year.
Cashew Seed Drying in Vietnam
end of season
beginning of season Jan Feb Mar Apr May Jun Jul Aug Sep Oct Nov Dec
India
Vietnam
Benin
Guinea-Bissau
Ivory Coast
Nigeria
Togo
Brazil
Mozambique
Tanzania
Kenya
Mali
Ghana
Burkina Faso
Senegal
Gambia
Indonesia
Raw Seed Imports in Million Kgs
2006
572200
2007
599220
2008
649250
2009
728300
2010
644404
IndiaVietnam
THE PRODUCTION CYCLE CONTINUED

6 Highlights of the cashew industry
R A W P R O D U C T I O N T R E N D SThe edible cashew kernel is encased within a kidney-shaped seed or pod at the bottom of a cashew “apple” (The “apple” is actually a stem.) Cashews are not harvested in the conventional sense. Once the cashew apple falls to the ground, the cashew seed is removed from the apple. Cashew seeds are gathered and taken to various collection points. From there they are delivered to a processing facility. After drying, the cashew kernel is separated from the seed either mechanically or by hand. Where mechanical separation takes place, primarily in Brazil, there is a higher percentage of broken grades.
Cashew production is extremely diffi cult to estimate, and production estimates have to be offered with caveats. Crop size estimates for any one producing country can vary signifi cantly because of the inherent diffi culties in accounting for output. Crops are harvested from trees growing in their natural habitat, as there are few plantations in most countries. Cross-border activity, particularly in West Africa, inhibit accurate accounting. Further, there is little processing in West African countries, hence there are few sources from which reasonable estimates can be ventured. Cashew seeds are not weighed during any of the collecting, buying, or transfer stages. After being gathered and brought to a series of collection points, the cashews are delivered to processors. The crop size is frequently estimated after the raw cashews have been processed and some indication of average kernel weight has been ascertained. Thus, raw cashew estimates are extrapolations from processing outcomes and the “best guesses” of those active in the industry. Production estimates would be more accurately defi ned as collection estimates.
0
500
1,000
1,500
2,000
2,500
3,000
1990 1995 2000 2005 2010 2007 2008 2009 2010 2011P
Mil
lio
n K
gs
Year
Asia East Africa West Africa Cent/So Amer
source: Red River, Industry, FAO
Estimated World Raw Cashew Production by Major Region
Cashew Apples
Red River Foods, Inc. June 2011 7
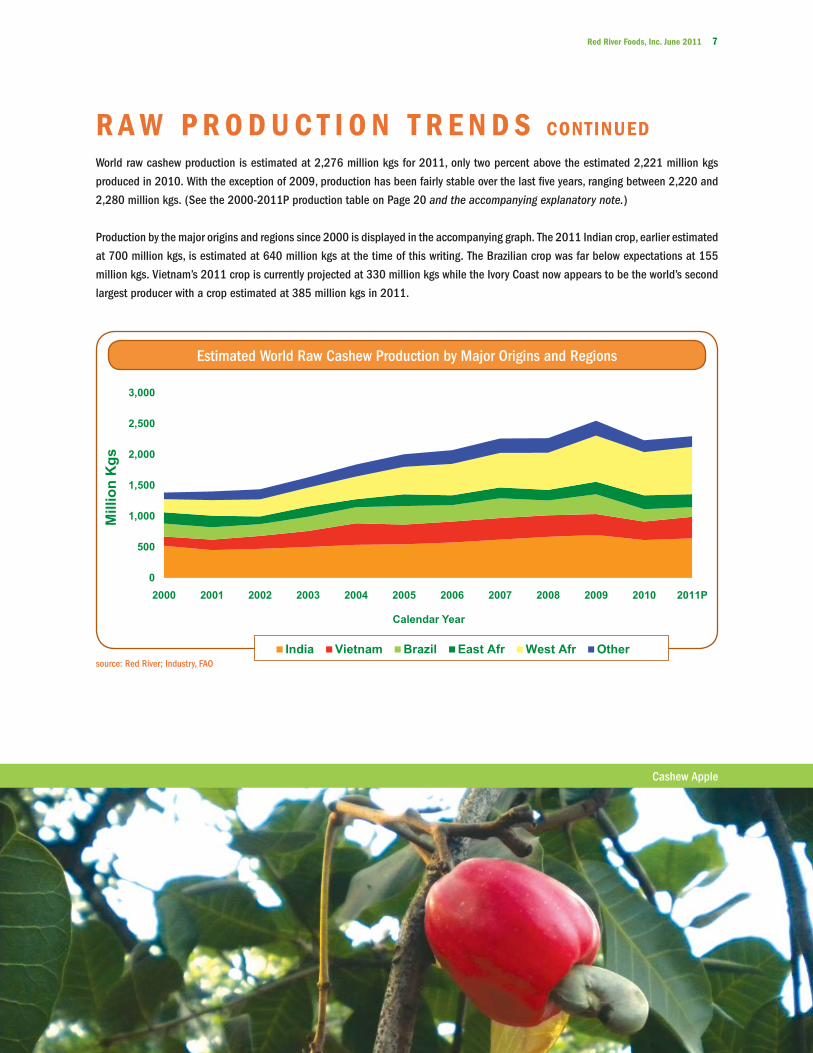
Estimated World Raw Cashew Production by Major Origins and Regions
0
500
1,000
1,500
2,000
2,500
3,000
2000 2001 2002 2003 2004 2005 2006 2007 2008 2009 2010 2011P
Millio
n K
gs
Calendar Year
source: Red River; Industry, FAOIndia Vietnam Brazil East Afr West Afr Other
World raw cashew production is estimated at 2,276 million kgs for 2011, only two percent above the estimated 2,221 million kgs
produced in 2010. With the exception of 2009, production has been fairly stable over the last fi ve years, ranging between 2,220 and
2,280 million kgs. (See the 2000-2011P production table on Page 20 and the accompanying explanatory note.)
Production by the major origins and regions since 2000 is displayed in the accompanying graph. The 2011 Indian crop, earlier estimated
at 700 million kgs, is estimated at 640 million kgs at the time of this writing. The Brazilian crop was far below expectations at 155
million kgs. Vietnam’s 2011 crop is currently projected at 330 million kgs while the Ivory Coast now appears to be the world’s second
largest producer with a crop estimated at 385 million kgs in 2011.
R A W P R O D U C T I O N T R E N D S CONTINUED
Cashew Apple

8 Highlights of the cashew industry
Generally, cashew kernel yields range from about 20 to 24
percent. Thus, one metric ton of raw cashews can yield between
200 and 240 kgs of edible kernel wholes and pieces after
processing, depending on country of origin. A crop that yields 1
million kgs of cashew kernels, for example, might be estimated
to have been 4.2 to 5.0 million kgs of raw production.
The adjacent table displays the estimated average amounts (in
kgs) of exportable grade kernels produced per metric ton from
the three major exporting countries. These percentages may vary
from year to year and even during the same season because
of weather conditions, the quality of the seed, the time of the
season when the crop is being processed, and the capabilities
of the processor.
In India, for example, each metric ton of raw cashew seed
produced and processed in that country yields, on average, about
230 kgs (23 percent) of exportable grade kernels. Thus, if the
Indian 2011 crop was 640,000 metric tons of raw cashew nuts
and we applied the percentage yield for the country as a whole,
the approximate outturn would have been about 147 million kgs
of exportable grade wholes and pieces.
The accompanying graph displays the
estimated percentage of whole and broken
grades produced by the three major
producers/exporters. (These percentages
result after peeling losses and rejects are
discounted.) The high percentage of broken
grades in Brazil is the result of mechanical
processing. Most processing in India and
Vietnam is labor intensive, done by hand.
Estimated Percentage of Whole and Broken Gradesproduced by major processors/exporters
per metric ton of export kernels
80%
53%
75%
20%
47%
25%
Vietnam
Brazil
India
Whole Brokensource: Industry
EXPORTABLE GRADES
Senegal
Nigeria, Kenya
Mozambique
Guinea Bissau, Togo
Processing Country Country of Origin kgs
India (Kerala State) 250
India (Country) 230
India Indonesia 240
240
230
230
220
200
Brazil Brazil 210
Vietnam Vietnam 230
Ivory Coast, Benin
Estimated Amount of Export-Quality Kernelsproduced by major processors/exporters
per metric ton of raw cashew nuts
source: Industry

Red River Foods, Inc. June 2011 9
U.S. IMPORTS FOR CONSUMPTIONCashews constitute the single largest segment of the
U.S. shelled tree nut import market. Between 2006
and 2010, two thirds of all U.S. imports were cashews.
(The accompanying pie chart does not include tree nuts
imported in-shell, primarily pecans and brazil nuts).
Cashew imports increased in 2010 to 119 million kgs
from 117 in 2009. For the fi rst four months of 2011,
cashew imports were 34.6 million kgs vs. 32.2 million
kgs during the same period in 2010. If the pace of
imports during 2011 mirrors that of 2010, total imports
for the year could be about 128 million kgs. As of April
2011, imports from Vietnam were on a pace to exceed
70 million kgs, much higher than the 2010 high of 58
million kgs and would represent well over 50 percent of
all U.S. cashew imports.
The accompanying graph clearly displays the trend of U.S. imports since 1990. Imports from Brazil have remained relatively steady
compared to the shifts in import totals from India and Vietnam. Imports from Vietnam have been increasing annually since 2006, but
U.S. imports from India have fallen annually since a peak of 58 million kgs in 2004. In 2009 and 2010, U.S. imports of Indian cashews
were only 30.6 million kgs, a drop of over 27 million kgs over a fi ve year period.
U.S. Cashew Imports for Consumptionfrom India, Vietnam, and Brazil
0
20
40
60
80
100
120
140
1990 1991 1992 1993 1994 1995 1996 1997 1998 1999 2000 2001 2002 2003 2004 2005 2006 2007 2008 2009 2010
Millio
n K
gs
Calendar Year
India Vietnam Brazil Other
U.S. Tree Nut Imports 2010shelled weight in million kgs
Filberts3.3 Brazils
10.9
Macs 7.2
Chesnuts 4.9
Pine Nuts1.2
Pecans29.1
Other6.0
Cashews119.1
Filberts3.3 Brazils
10.9
Macs
Ch
Pi
Pecan29.1
Other6.0
Cashews119.1
source: U.S. Department of Agriculture181.7 Million Kgs
source: U.S. Department of Agriculture

10 Highlights of the cashew industry
The graph below depicts annual import volumes from each of the three major origins and the average annual CIF values of those
imports. Average CIF values from all three origins have been on an upward trend since 2003, with import values of Indian cashews
higher than those of both Brazil and Vietnam.
U.S. IMPORTS CONTINUED
$0.00
$1.00
$2.00
$3.00
$4.00
$5.00
$6.00
$7.00
0
10
20
30
40
50
60
70
1990 1991 1992 1993 1994 1995 1996 1997 1998 1999 2000 2001 2002 2003 2004 2005 2006 2007 2008 2009 2010
Avg
CIF
Va
l P
er
Kg
Millio
n K
gs
Calendar Year
India Vietnam Brazil India Vietnam Brazil
U.S. Cashew Imports for Consumptionfrom India, Vietnam, and Brazil
Over the past year, the monthly average CIF values of total imports rose from $5.39 per kg in April 2010 to a record high in April 2011
of $8.03 per kg, an increase of $2.64 per kg. During this period, the monthly average CIF values of imports from Brazil and India
reached highs of $8.39 and $8.14, respectively, in March 2011. The monthly average CIF values of imports from Vietnam peaked at
$7.95 per kg in April 2011.
Source: U.S. Department of Agriculture
$5.39 $5.55 $5.69 $5.84 $6.02 $6.23 $6.06$6.67 $6.88
$7.39$7.76 $7.83 $8.03
$0.00
$1.00
$2.00
$3.00
$4.00
$5.00
$6.00
$7.00
$8.00
$9.00
Apr 10 May 10 Jun 10 Jul 10 Aug 10 Sep 10 Oct 10 Nov 10 Dec 10 Jan 11 Feb 11 Mar 11 Apr 11
Do
lla
rs P
er
Kg
Month & Year
U.S. Cashew Imports Monthly Average CIF Import Values
Source: U.S. Department of Agriculture
Red River Foods, Inc. June 2011 11
U.S. IMPORTS CONTINUED
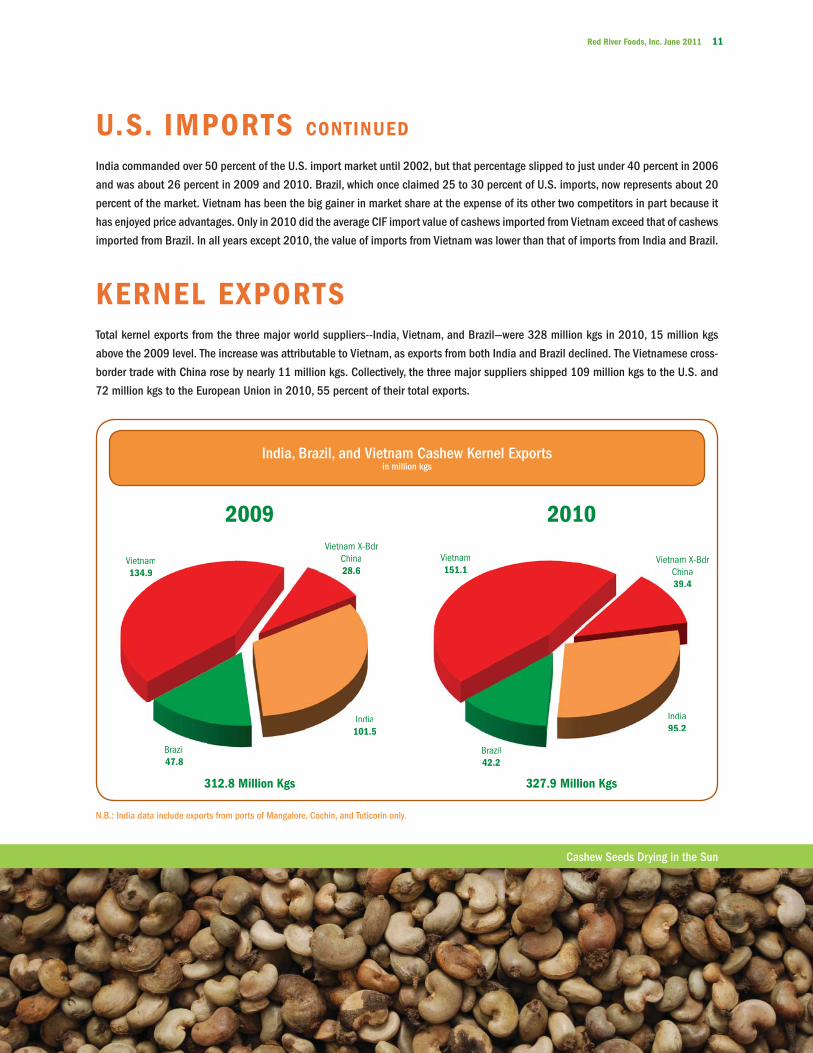
KERNEL EXPORTSTotal kernel exports from the three major world suppliers--India, Vietnam, and Brazil—were 328 million kgs in 2010, 15 million kgs
above the 2009 level. The increase was attributable to Vietnam, as exports from both India and Brazil declined. The Vietnamese cross-
border trade with China rose by nearly 11 million kgs. Collectively, the three major suppliers shipped 109 million kgs to the U.S. and
72 million kgs to the European Union in 2010, 55 percent of their total exports.
India commanded over 50 percent of the U.S. import market until 2002, but that percentage slipped to just under 40 percent in 2006
and was about 26 percent in 2009 and 2010. Brazil, which once claimed 25 to 30 percent of U.S. imports, now represents about 20
percent of the market. Vietnam has been the big gainer in market share at the expense of its other two competitors in part because it
has enjoyed price advantages. Only in 2010 did the average CIF import value of cashews imported from Vietnam exceed that of cashews
imported from Brazil. In all years except 2010, the value of imports from Vietnam was lower than that of imports from India and Brazil.
India, Brazil, and Vietnam Cashew Kernel Exports in million kgs
Vietnam134.9
Vietnam151.1
Vietnam X-BdrChina28.6
Vietnam X-BdrChina39.4
India101.5
India95.2
Brazil47.8
Brazil42.2
Vietnam134.9
China28.6
India101.5
Brazil
Vietnam151.1
Vietnam X-BdrChina39.4
India95.2
Brazil
N.B.: India data include exports from ports of Mangalore, Cochin, and Tuticorin only.
2009
312.8 Million Kgs
2010
327.9 Million Kgs
Cashew Seeds Drying in the Sun
12 Highlights of the cashew industry
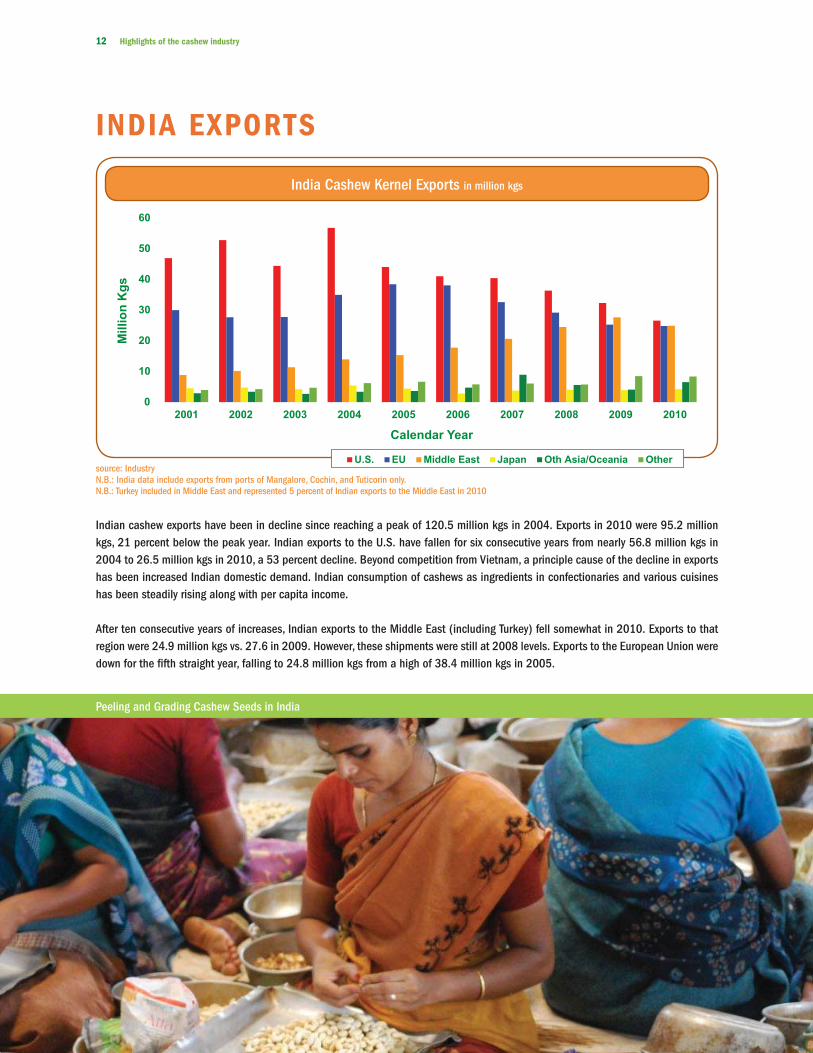
Indian cashew exports have been in decline since reaching a peak of 120.5 million kgs in 2004. Exports in 2010 were 95.2 million kgs, 21 percent below the peak year. Indian exports to the U.S. have fallen for six consecutive years from nearly 56.8 million kgs in 2004 to 26.5 million kgs in 2010, a 53 percent decline. Beyond competition from Vietnam, a principle cause of the decline in exports has been increased Indian domestic demand. Indian consumption of cashews as ingredients in confectionaries and various cuisines has been steadily rising along with per capita income.
After ten consecutive years of increases, Indian exports to the Middle East (including Turkey) fell somewhat in 2010. Exports to that region were 24.9 million kgs vs. 27.6 in 2009. However, these shipments were still at 2008 levels. Exports to the European Union were down for the fi fth straight year, falling to 24.8 million kgs from a high of 38.4 million kgs in 2005.
India Cashew Kernel Exports in million kgs
0
10
20
30
40
50
60
2001 2002 2003 2004 2005 2006 2007 2008 2009 2010
Mil
lio
n K
gs
Calendar Year
U.S. EU Middle East Japan Oth Asia/Oceania Othersource: IndustryN.B.: India data include exports from ports of Mangalore, Cochin, and Tuticorin only.N.B.: Turkey included in Middle East and represented 5 percent of Indian exports to the Middle East in 2010
INDIA EXPORTS
Peeling and Grading Cashew Seeds in India

Red River Foods, Inc. June 2011 13
BRAZIL EXPORTS Brazilian exports fell to 42 million kgs in 2010 from nearly 48 million kgs in 2009. Sharply reduced exports to the U.S. accounted
for nearly all the decline. Exports to the U.S. fell over 20 percent from 30.5 to 24 million kgs. Since 2000 the U.S. share of Brazilian
exports has been falling: in 2000, 78 percent of Brazilian shipments were destined for the U.S.; in 2010 the U.S. accounted for 57
percent of Brazil’s cashew exports. The one other major destination for Brazilian cashews is the European Union; exports to the EU were
essentially stable in 2009-2010, 8.8 v. 8.5 million kgs. Over the same 2000-2010 period, exports to the EU have risen from about 10
percent of Brazil’s total shipments to about 20 percent. This increase is partially the result of the expansion of the European Union;
ten countries joined the EU in 2004 and two additional countries joined in 2007.
Brazil Cashew Kernel Exports in million kgs
0
5
10
15
20
25
30
35
40
2001 2002 2003 2004 2005 2006 2007 2008 2009 2010
Millio
n K
gs
Calendar Year
USA Canada EU 15/25 Othersource: Industry
Cashew Seeds at Brazilian Factory

14 Highlights of the cashew industry
VIETNAM EXPORTSVietnam’s share of the international market continues to grow, particularly its share of U.S. imports. Total Vietnamese exports,
including the China cross-border trade, rose 27 million kgs between 2009 and 2010, from 163.5 to 190.5 million kgs. The China
cross-border trade jumped 38 percent from 28.6 to 39.4 million kgs. While exports to the European Union (EU) were the same at
37.9 million kgs in 2009 and 2010, exports to the U.S. rose from 50 to 58 million kgs. With the exception of the EU, Vietnamese
exports rose across the board, including shipments into the former USSR and the Middle East (including Turkey).
In 2010, wholes constituted 73 percent of cashew exports while pieces, butts, and splits accounted for 26 percent (excluding the China
cross-border trade.) At nearly 67 million kgs, exports of W320s represented 44 percent of total Vietnamese shipments while exports
of W240s totaled nearly 29 million kgs or 19 percent.
Vietnam’s Cashew Exports by region/country
source: Industry
USA50.3
USA58
Fmr USSR5.7
Fmr USSR6.9
EU37.9
EU37.9
Other6.7 Other
7.6
China31.7
China42
Oceania13.7
Oceania14.7
Other Asia10.7
Other Asia15.3
Mid East6.8
Mid East8.1
2009
163.5 Million Kgs
2010
190.5 Million Kgs
Harvested Cashew Apples Baskets of Raw Seed

Red River Foods, Inc. June 2011 15
The African cashew industr y
could represent the single biggest
opportunity for the international
cashew market over the next two
decades. With growing domestic
consumption in Asia (particularly in
India and China), the industry will
need increased supplies, and Africa
represents the greatest potential
for additional cashew product.
However, the African industry will
need long-term investment and
development: a complete value-
added infrastructure from growing
and harvesting to processing and
marketing.
The lack of processing capacity is the single biggest obstacle to industry growth in Africa. Of the approximately 700 million kgs produced
in West Africa annually, only about ten percent is processed in that region. For the approximately 200 million kgs produced in East Africa,
processing capacity is variously estimated at 35 to 50 million kgs. Nearly all African production is processed in India and Vietnam.
0
100
200
300
400
500
600
700
800
900
1,000
2000 2001 2002 2003 2004 2005 2006 2007 2008 2009 2010P
Estimated African Cashew Production in million kgs
West Africa East Africasource: Industry / African Cashew Alliance
AFRICA
Africa

16 Highlights of the cashew industry
AFRICA CONTINUED
AFRICAN CASHEW
PRODUCERSWestBenin
Burkina FasoGhanaGuinea
Guinea-BissauIvory Coast
MaliNigeriaSenegal
The GambiaTogo
EastKenya
MadagascarMozambique
Tanzania
Numerous parties are working to improve various segments of the African industry. The focal point for individual companies; non-profits; and various government agencies, including the U.S. Peace Corps, is often the African Cashew Alliance (ACA). The Alliance, headquartered in Accra, Ghana, was organized in 2005 and became operational one year later. The purpose of the Alliance is to invigorate and promote the African cashew industry, with a particular focus on expanding the processing sector and improving quality. In 2009 the Alliance helped steer a $25 million grant from the Gates Foundation to Benin, Burkina Faso, Ivory Coast, Ghana, and Mozambique for development of their respective industries. Later that year the ACA received a grant from USAID/West Africa to assist cashew entrepreneurs in the region obtain access to fi nancing. In December 2010, USAID West Africa, the ACA and the Economic Community of West African States (ECOWAS) Bank of Investment and Development signed a Memorandum of Understanding to open access to long-term fi nancing to processors.
Production in West Africa is diffi cult to estimate, but it is clear there has been a marked increase in that region’s output. Production there has grown by over 200 percent since 2001. The Ivory Coast is the leading producer by far, with estimated 2011 production at 385 million kgs. Guinea-Bissau is the next largest producer at about 130 million kgs. Production in East Africa is about 200 million kgs, principally in Mozambique and Tanzania.
Estimated African Cashew Production in million kgs
source: African Cashew Alliance, Industry
Ivory CoastGuinea-Bissau
MozambiqueTanzania
NigeriaBenin
SenegalGhanaKenyaOther
Total
290.0100.0
92.674.480.037.517.512.5
5.026.0
735.5
320.0100.0
99.164.281.045.020.012.5
5.027.5
774.3
350.0136.0
96.095.0
100.0100.0
20.012.5
8.533.5
951.5
335.0150.0112.0
97.070.070.035.012.011.033.5
925.0
385.0130.0100.0100.0
85.090.035.012.0
8.033.5
978.5
2007 2008 2009 2010 2011P
African Sunset

Red River Foods, Inc. June 2011 17
PRICES The vertical bar graph below clearly depicts the volatility of the cashew market over the last fi ve years. After shifting upward in 2004 and 2005, average FOB export prices fell back in 2006 as supplies increased. However, prices began to increase again in mid-2007 as Vietnamese and Indian shippers delayed and then defaulted on their contracts. By year’s end, the average FOB export price had risen to nearly $5.70 per kg. Prices continued to increase in 2008 and surged to $7.40 per kg at mid-year. The causes were numerous: a short crop in Brazil; new and inexperienced processors in Vietnam; and Vietnamese/Indian defaults, demands for renegotiated contracts, and shipping delays. However, monthly average prices did fall back to just under $5.00 per kg by the fi nal months of the year. Prices began another upward swing in mid-2009 and by December averaged $6.35 per kg. Prices continued their upward trend in 2010, reaching new levels. By December, the average monthly price was slightly above $8.00 per kg. Prices continued to accelerate during the fi rst quarter of 2011 and reached a record high in March, exceeding $8.50 per kg. An expected decline in prices in April failed to materialize as raw seed shipments were delayed from the Ivory Coast because of civil strife. Extended rainy weather caused uncertainties about the availability and quality of Indian and Vietnamese crops. Adding to the price pressure was the extremely short Brazilian crop.
$8.53$8.50
$8.02$8.07$8.00
$7.50$7.41
$7.00
$6.50
$6.35$6.11
$6.00
$5.62 $5.67$5.82$5.51
$5.50
$5.00
$4.78$4.63
$4.92$4.54$4.50
$4.32$4.67$4.25
$4.43$4.30
$4.19 $4.25$4.00
$3.86
$3.73$3.50 $3.66Janto Mar
2000 2001 2002 2003 2004 2005 2006 2007 2008 2009 2010 2011
Estimated Avg Annual FOB Price Ranges—Cashews W320s in USD/kg
source: Industry

18 Highlights of the cashew industry
The accompanying graph depicts the average quarterly price movement of W320 cashews since 1998. The price spike in 1999 was caused
by crop shortfalls and processors contracting in advance for more product than they were able to deliver. Many processors defaulted on
their commitments, leaving importers with an eleventh hour need to fulfi ll their own obligations. The result was extremely strong demand
which led to intense upward pressure on prices. The price plunge in 2000 refl ected higher worldwide supplies. The estimated average
quarterly prices fell to about $4.40 per kg by 2001, and remained at historic lows, between $3.75 and $4.20 per kg, through 2003. Thus,
the market was relatively stable for these three years.
Cashew prices began increasing in early 2004 in part because of the collective efforts of Indian packers to seek higher prices. The Indian
example was followed by Vietnamese packers. The price increase was also a refl ection of the higher prices being paid for all nut products.
By the end of 2004 and early 2005 the estimated average quarterly price was $5.30 per kg. Prices began to decline in late 2005 and
from then until mid-2007 the estimated monthly price ranged from about $4.30 to $4.60 per kg. This relatively low price in the fi rst two
quarters of 2007 was attributed in part to the sale of large quantities of India’s 2006 crop to make way for the even bigger 2007 crop of
620 million kgs.
Prices rose sharply beginning in mid-2007, reached a quarterly high of more than $6.90 per kg in the second quarter of 2008, matching
the 1999 price peak, and then began to abate. The price surge originated with Vietnamese shippers. Faced with higher than expected raw
cashew prices, some delayed and then defaulted on shipments, forcing buyers to bid up prices. By the last quarter of 2008, the quarterly
average had declined to just above $5.00 per kg. Since then, quarterly average prices have been accelerating, exceeding $6.00 per kg in
the last quarter of 2009, and surging to $7.60 per kg during the last quarter of 2010 and $8.30 per kg in the fi rst quarter of 2011. The
causes of the unprecedented increases are many: shortfalls in both the Vietnamese and Brazilian crops, rising Indian domestic consumption,
higher African raw seed prices, and continued strong world demand. These pressures have been compounded by Vietnamese and Indian
suppliers holding out for higher prices.
PRICES CONTINUED
$0.00
$1.00
$2.00
$3.00
$4.00
$5.00
$6.00
$7.00
$8.00
$9.00
1 2 3 4 1 2 3 4 1 2 3 4 1 2 3 4 1 2 3 4 1 2 3 4 1 2 3 4 1 2 3 4 1 2 3 4 1 2 3 4 1 2 3 4 1 2 3 4 1 2 3 4 1
98 99 00 01 02 03 04 05 06 07 08 09 10 11
Est A
vg F
OB E
xp P
rice
/ Kg
Year / Quarter
w320s—Quarterly Estimated Average Prices FOB Origin in USD/kg
source: Industry

Red River Foods, Inc. June 2011 19
CA
SH
EW I
ND
US
TRY
TIM
ELIN
E
Vie
tnam
ese, In
dia
n
prices b
egin
prices r
ise s
harp
ly;
Ivory
Coast
becom
es 2
nd
larg
est cashew
pro
ducer
only
by In
dia
Avg F
OB
export
prices d
eclin
e
dra
matic
ally
fro
m p
eak
1999 le
vels
Annual i
ncre
ases o
f cashew
import
s in
to the U
.S.
export
prices r
ecord
ed
2000
2002
cashew
pro
ducer
,
to in
cre
ase s
harp
ly
India
raw
cashew
Ivory
Coast
civ
il w
arf
are
India
export
s d
eclin
e
Manu, buyers
incre
ase e
mphasis
on q
ualit
y
Sharp
FO
B
FO
B e
xport
prices
reach
new
record
levels
pro
ble
ms e
merg
e
385 m
n k
gs
Incre
ases F
ed'l
overs
ight of
food im
port
s
2011
U.S
.
Food S
afe
ty
& M
od'z
'n A
ct
fm C
am
bodia
for
second la
rgest
cro
p r
educed
2010
rebound
FO
B p
rices
Bra
zil
by h
eat; e
st
low
ere
d to 3
00
auth
orizes
health
benefit
cla
ims f
or
2004
2003
cashew
pro
d
pro
cessin
g
est at 35 m
n k
gs
Vie
tnam
leases
6,0
00 h
ecta
res
to h
elp
develo
p
cro
p, export
s
countr
ies to in
cre
ase
pro
cessin
g, add p
roduct valu
edro
p s
harp
ly
Mozam
biq
ue
pro
cessin
g b
egin
s
fall
as m
kt
slo
w V
iet
$146 m
to A
frPeak
export
in 2
006 a
nd f
irst half 2
007
Cash A
lliance
gra
nts
$25 m
n
Vie
tnam
ese,
India
n d
efa
ults
and s
hip
pin
g
dela
ys
year
for
Bra
zil
Alliance
Vie
tnam
cro
pV
ietn
am
export
s a
t
record
levels
by y
ear
end
export
price
incre
ases; at
Majo
r qualit
y
2009; rise, fa
ll,
fluctu
ate
early
form
ed u
nder
Vie
tnam
ese r
aw
cashew
import
s in
cre
ase d
ram
atic
ally
;
dow
n 3
5%
;
2007
191 m
n k
gs
2005
US
AID
sponsors
hip
record
level:
labor
issues
2006
pro
ductio
n
record
level
Vie
tnam
ese
2009
fm 4
00 m
n k
gs
Afr
ican C
ashew
Alliance b
egin
s
industr
y
Bra
zil
Afr
ican
Cashew
belo
w s
tandard
import
s r
ise f
m 7
0 m
n k
gs in
2005 to 4
04 m
n k
gs in
2010
U.S
. FD
A
Vie
tnam
export
s a
t new
kern
el i
mport
s b
egin
Avg F
OB
export
export
Avg F
OB
incre
asin
g
Gate
s F
dn
peak
Jun 0
8
sto
cks
in In
dia
,
Avg F
OB
export
prices d
eclin
eV
ietn
am
U.S
. im
port
s:
mid
-2005; re
main
rela
tively
fla
t
Vie
tnam
becom
es
pro
cessin
g;
surp
assed o
nly
by
Peak
export
India
His
torically
low
avg F
OB
origin
price in
cre
ases
to r
ebound
Vie
tnam
becom
es
2nd la
rgest ke
rnel
export
er,
surp
assed
in V
ietn
am
Early 2
007
2008
export
s to U
.S.
org
aniz
ing c
ashew
inte
rests
in
2001
cert
ain
nuts
record
export
s
131 m
illio
n k
gs
year
for
India
:
122 m
n k
gs
export
prices
Avg F
OB
Vie
t re
covers
;
ship
pers
defa
ult,
dela
y; cause s
harp
Peak
year
for
155 m
n k
gs
Obje
ctiv
e is
to e
sta
blis
h c
ashew
ente
rprises s
o lo
cal p
opula
tions m
ay r
ealiz
e f
inancia
l benefits
fro
m a
ddin
g v
alu
e to the c
ashew
rath
er
than s
imply
export
ing the r
aw
mate
rial.
estim
ate
d a
t
Mozam
biq
ue
US
AID
gra
nts
to a
id in
d a
ccess
to f
inancin
g
Various e
ffort
s b
y in
tern
atio
nal g
overn
ment org
aniz
atio
ns a
nd N
GO
s to in
stit
ute
cashew
supply
chain
org
aniz
atio
n a
nd c
ashew
pro
cessin
g in
Afr
ican p
roducers
.
20-2
5 m
n k
gs
Afr
cashew
short
at
Rain
y w
eath
er
thre
ate
ns s
ize,
qualit
y o
f In
dia
n,
Vie
tnam
ese
U.S
. im
port
s f
luctu
ate
: declin
e 1
3%
in 2
005, flat in
2006 a
t 114 m
kgs, rise to 1
25
mn k
gs in
2007, fa
ll to
115 m
kgs in
2008, in
cre
ase to 1
17 in
2009 a
nd 1
19 in
2010; could
exceed 1
25 m
n k
gs in
2011
uncert
ain
ties
lead to s
urp
lus
pro
cessin
g c
ap
India
raw
import
s in
cre
ase f
m 3
94 m
n k
gs in
2002 to r
ecord
728 m
n k
gs in
2009; at 644 m
n k
gs in
2010
cro
ps
Bra
zilian
cro
p e
xtr
em
ely
thre
ate
ns, dela
ys
cro
p e
xport
s;
leads to h
igh
raw
seed p
rices
and le
vel
Mozam
biq
ue

20 Highlights of the cashew industry
PRODUCTION ESTIMATES in mill ion kgsR
eg
ion
/
Co
un
try
2000
2001
2002
2003
2004
2005
2006
2007
2008
2009
2010
2011P
C
am
bo
dia
10
.02
0.0
25
.03
0.0
35
.04
0.0
45
.05
0.0
50
.05
0.0
60
.06
0.0
In
dia
52
0.0
45
0.0
47
0.0
50
0.0
53
5.0
54
4.0
57
3.0
62
0.0
66
5.0
69
5.0
61
3.0
64
0.0
In
do
ne
sia
69
.99
1.6
11
0.2
10
6.9
13
1.0
13
5.1
14
9.2
15
4.8
15
7.4
15
8.0
10
0.0
80
.0
P
hilip
pin
es
10
.11
0.0
10
.01
0.1
10
.01
0.0
10
.01
0.3
10
.31
0.3
10
.01
0.0
S
ri L
an
ka
4.7
6.2
6.4
6.5
6.5
6.2
6.0
6.0
6.0
6.0
6.0
6.0
T
ha
ila
nd
4.8
4.7
4.7
4.7
4.6
4.7
4.7
4.7
5.0
5.0
5.0
5.0
V
ietn
am
15
0.0
17
0.0
21
0.0
26
0.0
35
0.0
32
0.0
34
0.0
35
0.0
34
9.0
34
0.0
29
0.0
33
0.0
O
the
r1
.01
.01
.10
.91
.11
.01
.01
.01
.15
.05
.05
.0
Su
b-T
ota
l, A
sia
770.5
753.5
837.4
919.1
1,073.2
1,061.0
1,128.9
1,196.8
1,243.8
1,269.3
1,089.0
1,136.0
Afr
ica
We
st
As
ia
B
en
in3
0.0
35
.04
3.1
40
.04
3.0
43
.03
7.5
37
.64
5.0
10
0.0
70
.09
0.0
G
ha
na
5.5
5.0
5.2
5.2
10
.01
0.0
10
.01
2.5
12
.51
2.5
12
.01
2.0
G
uin
ea
-Bis
sa
u7
2.7
70
.07
0.0
75
.09
2.0
10
0.8
10
0.0
10
0.0
10
0.0
13
6.0
15
0.0
13
0.0
Ivo
ry C
oa
st
60
.01
00
.01
04
.81
20
.01
50
.02
00
.02
50
.02
90
.03
20
.03
50
.03
35
.03
85
.0
N
ige
ria
30
.03
0.0
40
.05
0.0
50
.06
0.0
75
.08
0.0
81
.01
00
.07
0.0
85
.0
S
en
eg
al
6.8
3.2
4.0
6.0
8.5
12
.01
5.0
17
.52
0.0
20
.03
5.0
35
.0
O
the
r8
.18
.79
.21
1.5
14
.01
9.5
21
.82
1.9
23
.52
9.5
28
.02
9.5
Su
b-T
ota
l, A
fr W
213.1
251.9
276.3
307.7
367.5
445.3
509.3
559.5
602.0
748.0
700.0
766.5
Afr
ica
Ea
st
K
en
ya
5.1
10
.14
.15
.25
.25
.21
.05
.05
.08
.51
1.0
8.0
M
ad
ag
as
ca
r4
.04
.04
.04
.04
.04
.04
.04
.04
.04
.04
.04
.0
M
oza
mb
iqu
e5
2.6
52
.15
0.2
63
.84
2.3
10
4.4
62
.87
4.4
64
.29
5.0
112
.01
00
.0
T
an
za
nia
12
1.2
12
2.3
67
.49
2.2
78
.67
7.4
92
.69
2.6
99
.19
6.0
98
.01
00
.0
Su
b-T
ota
l, A
fr E
182.9
188.5
125.7
165.2
130.1
191.0
160.4
176.0
172.3
203.5
225.0
212.0
La
tin
Am
eri
ca
B
razil
21
0.0
20
0.0
19
0.0
23
0.0
26
0.0
30
0.0
26
5.0
32
0.0
24
0.0
32
0.0
20
0.0
15
5.0
P
eru
2.7
2.5
2.1
2.2
2.4
2.2
2.2
2.3
2.3
2.3
2.3
2.3
O
the
r4
.24
.24
.64
.54
.34
.24
.34
.44
.54
.64
.64
.6
Su
b-T
ota
l, L
at
Am
216.9
206.7
196.7
236.7
266.7
306.4
271.5
326.7
246.8
326.9
206.9
161.9
Wo
rld
To
tal
1,383.4
1,400.6
1,436.1
1,628.7
1,837.5
2,003.7
2,070.1
2,259.0
2,264.9
2,547.7
2,220.9
2,276.4
N.B.
: Pr
oduc
tion
estim
ates
for a
ny o
ne c
ount
ry c
an a
nd o
ften
do v
ary
grea
tly.
Thus
, man
y es
timat
es h
ere
are
deriv
ed b
y ex
trapo
latio
n, in
terp
olat
ion,
and
“be
st g
uess
es,”
while
oth
er e
stim
ates
der
ived
from
kno
wn a
nd
relia
ble
sour
ces
are
reas
onab
ly a
ccur
ate.
Unt
il th
ere
is a
will
ingn
ess
on th
e pa
rt o
f res
pons
ible
indu
stry
and
gov
ernm
ent p
artie
s at
orig
in to
ven
ture
thei
r bes
t est
imat
es, t
he in
dust
ry w
ill b
e ha
mpe
red
in a
sses
sing
av
aila
ble
supp
lies.
Red River Foods is pleased to provide information about the world cashew trade. Preparing this brief report has been a challenging, but
we think important, step in trying to develop a more complete picture of the cashew industry. The information and data herein represent
estimates from a variety of sources as well as our own estimates. We wish to extend our grateful appreciation to the many individuals who
helped make this brochure possible by contributing to our research. The company makes no warranty about the accuracy of these data and
assumes no duty to update any materials contained in this report. Within the industry it is generally accepted that production, export, and
other data can be understated, overestimated, or even unreported.
Red River wishes to emphasize that unforeseen events caused by political, legal, economic, or other circumstances, as well as weather
conditions, could affect current expectations for any one market or for the world situation generally. Readers should not unduly rely on any
estimates, forward-looking statements, or data cited herein to reach conclusions or make decisions about the various markets or market prices.
Red R ive r Foods , Inc .9020 Stony Po int Parkway
Sui te 380Richmond, V i rg in ia 23235
USA
te l— 804.320.1800 fax—804.320.1896 phipps j@redr i ve r foods .com

Red River Foods , Inc .9020 Stony Po int Parkway
Sui te 380Richmond, V i rg in ia 23235
USA
te l— 804.320.1800 fax—804.320.1896 email—[email protected]


![Chapter - I Introduction - Shodhgangashodhganga.inflibnet.ac.in/bitstream/10603/24891/6/06...1998 [38]. The cashew nut tree consists of the cashew nut fruit, the apple, leaf and bark](https://img.pdfslide.us/doc/110x75/5e83338a059b5b3a95726ed1/chapter-i-introduction-1998-38-the-cashew-nut-tree-consists-of-the-cashew.jpg)