Embed Size (px)
Citation preview
7/
Date: January 24, 2014 Date: March 8, 2018
, 2017
Cash Wheat Market Summary:
The USDA report took all the air out of the room today, although it was all about corn. The corn market will start to support wheat prices as well which just continues to beg the agreement in the cash markets, where can we sell our wheat at these levels. I/we talked about the balance sheets in yesterday’s report & nothing has changed today. Emily has done some good work on weather & what the forecasts could mean for the HRW crop going forward, but I/we contend we’re losing demand as fast as we are supply today. The bottom-line for this reports is, “without the cash carry the cash basis would collapse if it was based upon demand. USDA cut their exports 25 mbu today & we think they may need to cut another 25 mbu in the April report; don’t forget we normally carry 500 kmt +/- of old crop sales forward into new crop so when people talk about what is needed to meet USDA’s sales forecast, you best add an additional 500k to that number. US Wheat Associates & others are very concerned about the possible impact on US grain shipments to Asia since the USA has pulled out of the TPP agreement. They are suggesting sales of wheat to Japan could be cut 50% (2.0 mmt) under the TPP 11 rules. Although this could happen & Japan could buy more from Canada, then Canada will have less to sell to someone else & the US will fill that gap. It will result in shuffling the deck chairs around on the ship, Canada sells more to Japan but they have less for LAM or another buyer. Today, freight & logistics are driving the cash basis & given USDA’s forecast for corn exports rail freight traded $500/car premium to tariff for May/June/July shipment. This will also support the delivered basis & adds the cash carry. HRW cash markets feel weaker today in the export & domestic market, but it isn’t on cheaper offers but rather lack bids or no one seeing reason to push their bids since they don’t see the business. The best buyers of HRW are shippers buying back their sales & turning the wheat in other directions &/or just willing to store it given the smaller the crop. SRW cash market has a weaker tone as well, due to lack of engagement from buyers. The mills are acting like they don’t need to buy wheat after seeing good movement the past 2+ weeks, while the export market is all about barge freight & logistics. The shippers are focused on loading corn & soybeans, not wheat, making it difficult for exporters to meet their commitments. The domestic spring wheat market saw a few cars offered today & the only train of 12.8% protein was pulled when they got a low bid, but the higher protein cars traded up 5-15 ct/bu. The PNW is just dead after Guatemala purchased yesterday, there is nothing behind them until next week when Japan & Taiwan both tender.
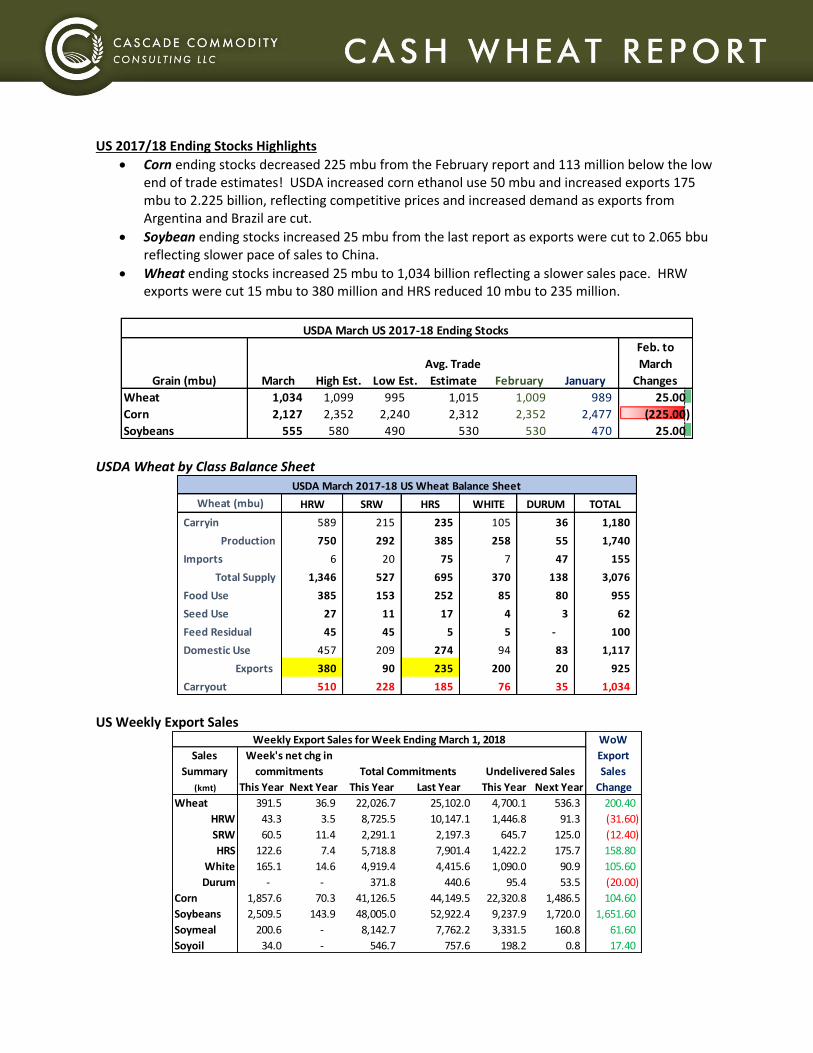
US 2017/18 Ending Stocks Highlights
Corn ending stocks decreased 225 mbu from the February report and 113 million below the low end of trade estimates! USDA increased corn ethanol use 50 mbu and increased exports 175 mbu to 2.225 billion, reflecting competitive prices and increased demand as exports from Argentina and Brazil are cut.
Soybean ending stocks increased 25 mbu from the last report as exports were cut to 2.065 bbu reflecting slower pace of sales to China.
Wheat ending stocks increased 25 mbu to 1,034 billion reflecting a slower sales pace. HRW exports were cut 15 mbu to 380 million and HRS reduced 10 mbu to 235 million.
USDA Wheat by Class Balance Sheet
US Weekly Export Sales
Grain (mbu) March High Est. Low Est.
Avg. Trade
Estimate February January
Feb. to
March
Changes
Wheat 1,034 1,099 995 1,015 1,009 989 25.00
Corn 2,127 2,352 2,240 2,312 2,352 2,477 (225.00)
Soybeans 555 580 490 530 530 470 25.00
USDA March US 2017-18 Ending Stocks
Wheat (mbu) HRW SRW HRS WHITE DURUM TOTAL
Carryin 589 215 235 105 36 1,180
Production 750 292 385 258 55 1,740
Imports 6 20 75 7 47 155
Total Supply 1,346 527 695 370 138 3,076
Food Use 385 153 252 85 80 955
Seed Use 27 11 17 4 3 62
Feed Residual 45 45 5 5 - 100
Domestic Use 457 209 274 94 83 1,117
Exports 380 90 235 200 20 925
Carryout 510 228 185 76 35 1,034
USDA March 2017-18 US Wheat Balance Sheet
Sales
Summary
(kmt) This Year Next Year This Year Last Year This Year Next Year Change
Wheat 391.5 36.9 22,026.7 25,102.0 4,700.1 536.3 200.40
HRW 43.3 3.5 8,725.5 10,147.1 1,446.8 91.3 (31.60)
SRW 60.5 11.4 2,291.1 2,197.3 645.7 125.0 (12.40)
HRS 122.6 7.4 5,718.8 7,901.4 1,422.2 175.7 158.80
White 165.1 14.6 4,919.4 4,415.6 1,090.0 90.9 105.60
Durum - - 371.8 440.6 95.4 53.5 (20.00)
Corn 1,857.6 70.3 41,126.5 44,149.5 22,320.8 1,486.5 104.60
Soybeans 2,509.5 143.9 48,005.0 52,922.4 9,237.9 1,720.0 1,651.60
Soymeal 200.6 - 8,142.7 7,762.2 3,331.5 160.8 61.60
Soyoil 34.0 - 546.7 757.6 198.2 0.8 17.40
WoW
Export
Sales
Week's net chg in
commitments Total Commitments Undelivered Sales
Weekly Export Sales for Week Ending March 1, 2018
This E-mail (including attachments) is covered by the Electronic Communications Privacy Act, 18 U.S.C. §§2510-2521, is confidential. If you are not the intended recipient, you are
hereby notified that any retention, dissemination, distribution, or copying of this communication is strictly prohibited. Please reply to the sender that you have received the message in
error, and then delete it. This data and these comments are provided for information purposes only and are not intended to be used for specific trading strategies. Although all
information is believed to be reliable, we cannot guarantee its accuracy or completeness. Commodity trading involves risks, and you should ful ly understand those risks before trading.
USDA reported wheat sales of 391,500 metric tons for delivery in marketing year 2017/2018 were up 200.4 kmt from the previous week and up 28% from the prior 4-week average. Increases were for unknown destinations (113,500 MT), South Korea (71,500 MT, including 65,000 MT switched from SRW unknown destinations), Japan (66,100 MT), the Philippines (52,000 MT), and Colombia (34,400 MT, switched from HRW unknown destinations and decreases of 19,000 MT). Reductions were reported for Mexico (10,200 MT), Canada (1,400 MT), and Nicaragua (1,200 MT). For 2018/2019, net sales of 36,900 MT were primarily reported for Mexico (30,500 MT).
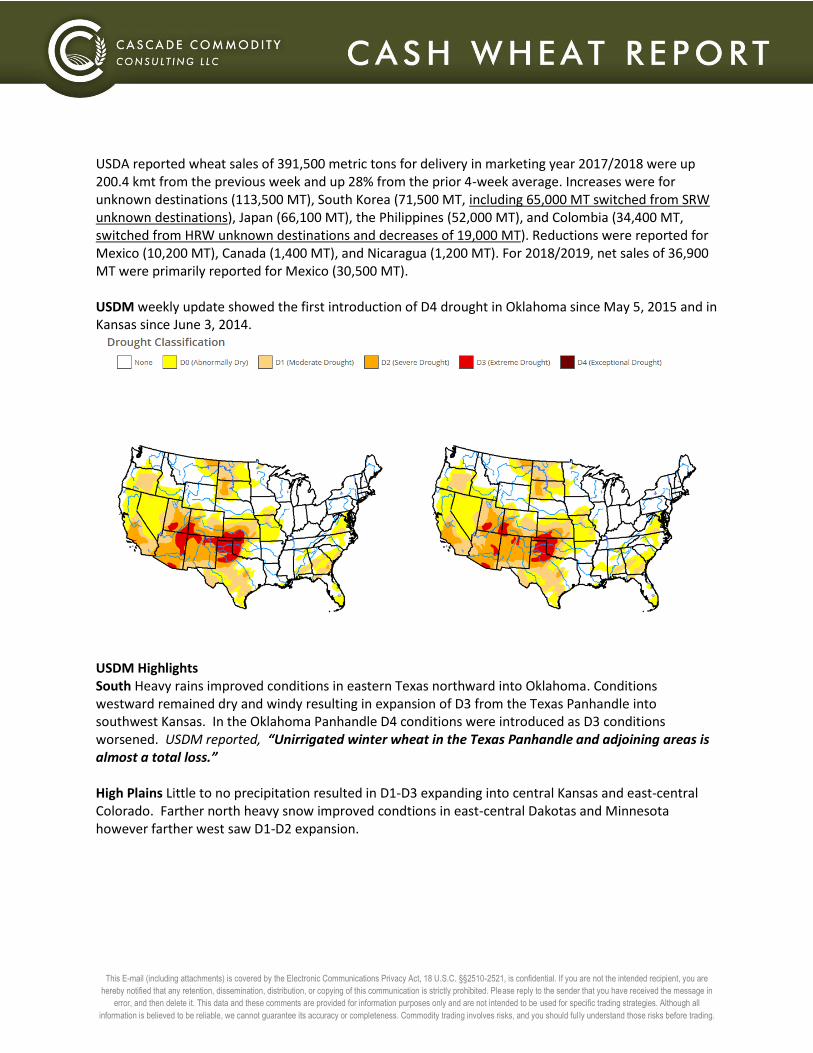
USDM weekly update showed the first introduction of D4 drought in Oklahoma since May 5, 2015 and in Kansas since June 3, 2014.
USDM Highlights South Heavy rains improved conditions in eastern Texas northward into Oklahoma. Conditions westward remained dry and windy resulting in expansion of D3 from the Texas Panhandle into southwest Kansas. In the Oklahoma Panhandle D4 conditions were introduced as D3 conditions worsened. USDM reported, “Unirrigated winter wheat in the Texas Panhandle and adjoining areas is almost a total loss.” High Plains Little to no precipitation resulted in D1-D3 expanding into central Kansas and east-central Colorado. Farther north heavy snow improved condtions in east-central Dakotas and Minnesota however farther west saw D1-D2 expansion.
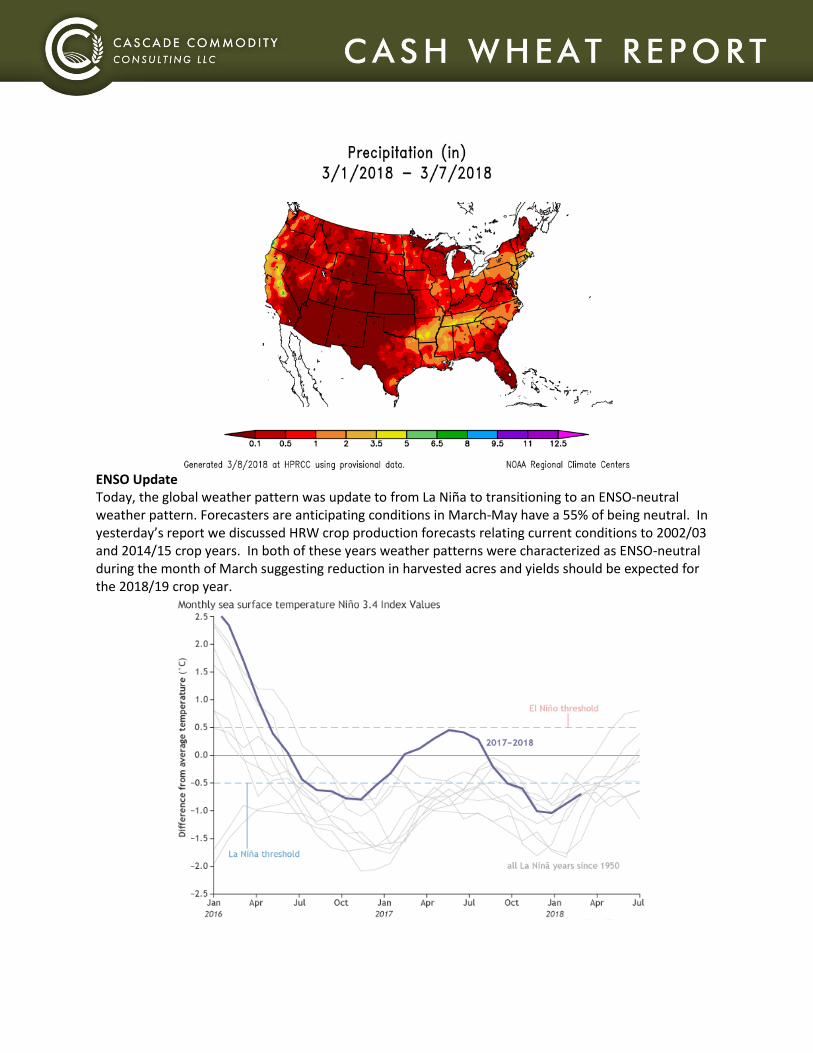
ENSO Update Today, the global weather pattern was update to from La Niña to transitioning to an ENSO-neutral weather pattern. Forecasters are anticipating conditions in March-May have a 55% of being neutral. In yesterday’s report we discussed HRW crop production forecasts relating current conditions to 2002/03 and 2014/15 crop years. In both of these years weather patterns were characterized as ENSO-neutral during the month of March suggesting reduction in harvested acres and yields should be expected for the 2018/19 crop year.
This E-mail (including attachments) is covered by the Electronic Communications Privacy Act, 18 U.S.C. §§2510-2521, is confidential. If you are not the intended recipient, you are
hereby notified that any retention, dissemination, distribution, or copying of this communication is strictly prohibited. Please reply to the sender that you have received the message in
error, and then delete it. This data and these comments are provided for information purposes only and are not intended to be used for specific trading strategies. Although all
information is believed to be reliable, we cannot guarantee its accuracy or completeness. Commodity trading involves risks, and you should ful ly understand those risks before trading.
Hard Red Winter
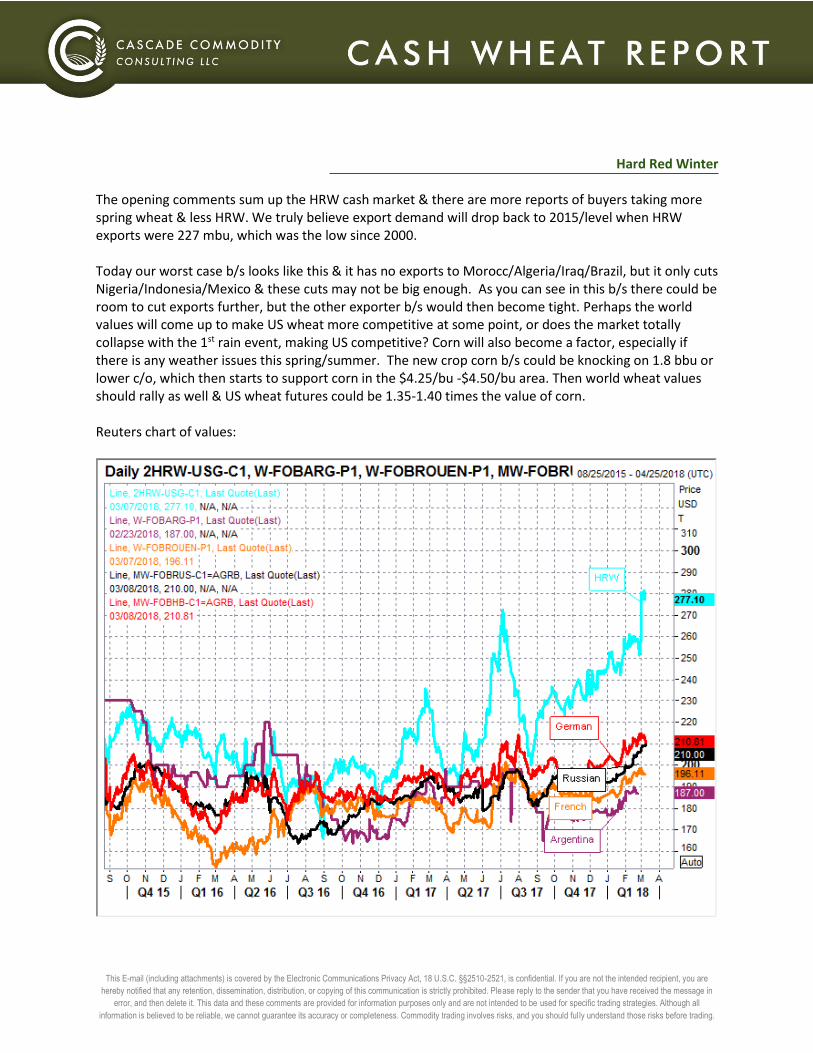
The opening comments sum up the HRW cash market & there are more reports of buyers taking more spring wheat & less HRW. We truly believe export demand will drop back to 2015/level when HRW exports were 227 mbu, which was the low since 2000. Today our worst case b/s looks like this & it has no exports to Morocc/Algeria/Iraq/Brazil, but it only cuts Nigeria/Indonesia/Mexico & these cuts may not be big enough. As you can see in this b/s there could be room to cut exports further, but the other exporter b/s would then become tight. Perhaps the world values will come up to make US wheat more competitive at some point, or does the market totally collapse with the 1st rain event, making US competitive? Corn will also become a factor, especially if there is any weather issues this spring/summer. The new crop corn b/s could be knocking on 1.8 bbu or lower c/o, which then starts to support corn in the $4.25/bu -$4.50/bu area. Then world wheat values should rally as well & US wheat futures could be 1.35-1.40 times the value of corn. Reuters chart of values:
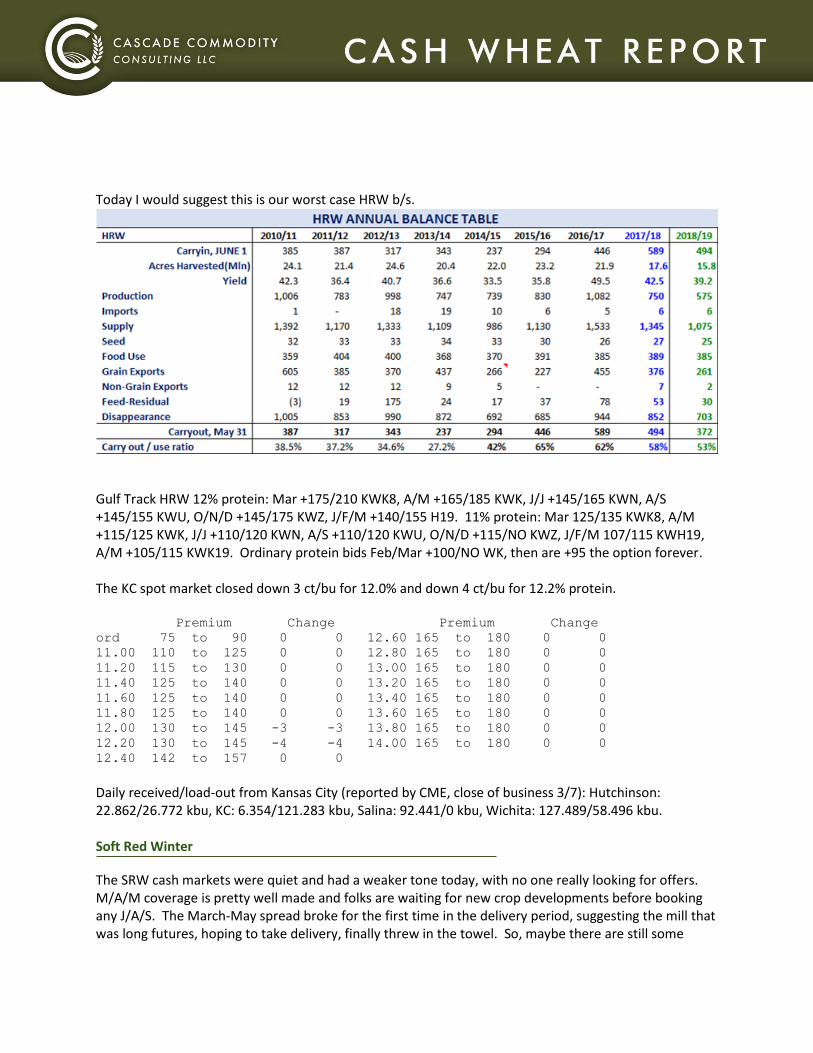
Today I would suggest this is our worst case HRW b/s.
Gulf Track HRW 12% protein: Mar +175/210 KWK8, A/M +165/185 KWK, J/J +145/165 KWN, A/S +145/155 KWU, O/N/D +145/175 KWZ, J/F/M +140/155 H19. 11% protein: Mar 125/135 KWK8, A/M +115/125 KWK, J/J +110/120 KWN, A/S +110/120 KWU, O/N/D +115/NO KWZ, J/F/M 107/115 KWH19, A/M +105/115 KWK19. Ordinary protein bids Feb/Mar +100/NO WK, then are +95 the option forever. The KC spot market closed down 3 ct/bu for 12.0% and down 4 ct/bu for 12.2% protein. Premium Change Premium Change
ord 75 to 90 0 0 12.60 165 to 180 0 0
11.00 110 to 125 0 0 12.80 165 to 180 0 0
11.20 115 to 130 0 0 13.00 165 to 180 0 0
11.40 125 to 140 0 0 13.20 165 to 180 0 0
11.60 125 to 140 0 0 13.40 165 to 180 0 0
11.80 125 to 140 0 0 13.60 165 to 180 0 0
12.00 130 to 145 -3 -3 13.80 165 to 180 0 0
12.20 130 to 145 -4 -4 14.00 165 to 180 0 0
12.40 142 to 157 0 0
Daily received/load-out from Kansas City (reported by CME, close of business 3/7): Hutchinson: 22.862/26.772 kbu, KC: 6.354/121.283 kbu, Salina: 92.441/0 kbu, Wichita: 127.489/58.496 kbu. Soft Red Winter
The SRW cash markets were quiet and had a weaker tone today, with no one really looking for offers. M/A/M coverage is pretty well made and folks are waiting for new crop developments before booking any J/A/S. The March-May spread broke for the first time in the delivery period, suggesting the mill that was long futures, hoping to take delivery, finally threw in the towel. So, maybe there are still some
This E-mail (including attachments) is covered by the Electronic Communications Privacy Act, 18 U.S.C. §§2510-2521, is confidential. If you are not the intended recipient, you are
hereby notified that any retention, dissemination, distribution, or copying of this communication is strictly prohibited. Please reply to the sender that you have received the message in
error, and then delete it. This data and these comments are provided for information purposes only and are not intended to be used for specific trading strategies. Although all
information is believed to be reliable, we cannot guarantee its accuracy or completeness. Commodity trading involves risks, and you should ful ly understand those risks before trading.
Apr/May sales to be made ;-) River logistics are still poor and their affects are being felt at the Gulf. The CIF market saw offers of +68 WK for Apr/May and +52 WN for Jun/Jul. FOB SRW offers are indicated at around +80 WN for Jun/Jul, +70-75 WU for Aug/Sep, and +90 WZ for O/N/D. Export capacity is nearly booked through May. This week’s export sales report showed 71.5 kmt of SRW sold & shipped to South Korea, switched from unknown, which we reported on Monday was seen in weekly inspections. CIF barge bid/offer: FH Mar +65/NO WK, Mar +60/NO WK, Apr/May +58/68 WK, J/J +44/52 WN, A/S +40/NO WU, O/N/D +50/NO WZ, J/F/M +50/NO WH9. Elevator/Mill Bids: NW Ohio mills: Mar +15 WK, Apr/May +10 WK, Jul/Aug +0 WN; Chicago warehouse: Mar -10 WK, New Crop -20 WN; Toledo elevator: Mar -8 WK, Apr/May -5/+0 WK, Jul/Aug -5 WN; Eastern Indiana mill: Mar +15 WK, New Crop +20 WN, Aug/Sep +15/20 WU. Daily received/load-outs from Chicago (reported by CME, close of business 3/7): Chicago: 1.645/0 kbu, MS River: 18.565/13.921 kbu, NW Ohio: 12.145/20.284 kbu, OH River: 79.921/61.733 kbu, St. Louis: 43.294/0 kbu, Toledo: 6.53/38.966 kbu.
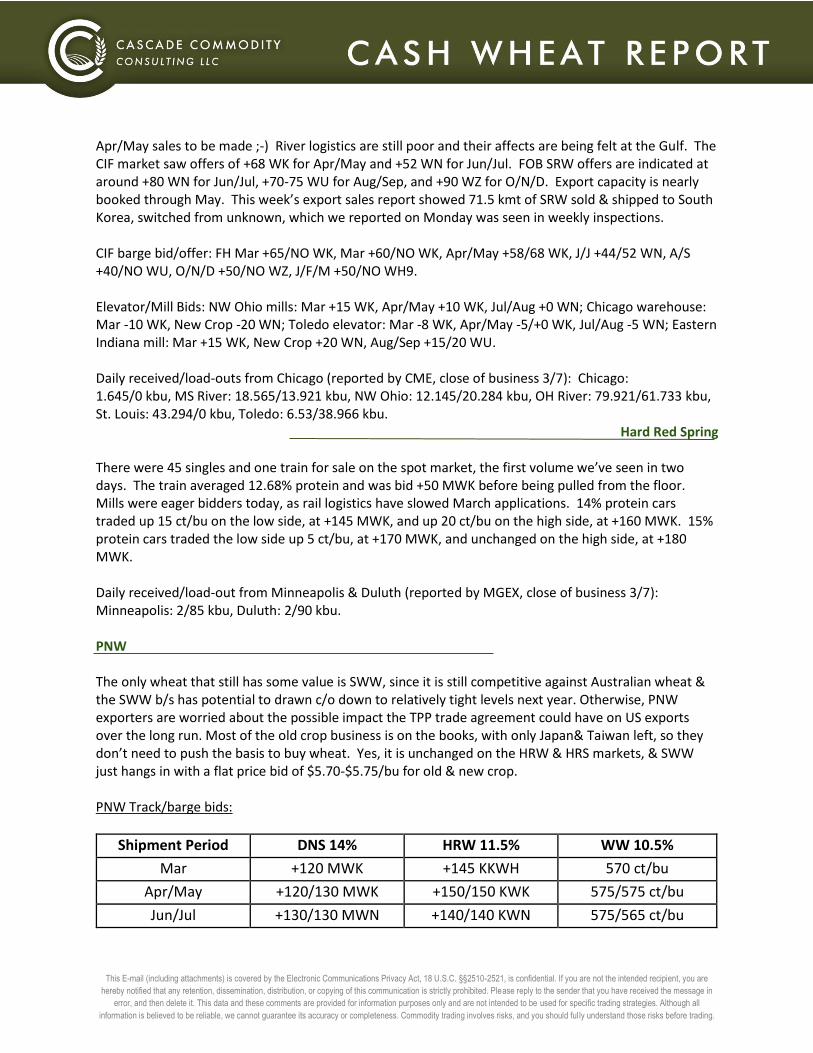
Hard Red Spring There were 45 singles and one train for sale on the spot market, the first volume we’ve seen in two days. The train averaged 12.68% protein and was bid +50 MWK before being pulled from the floor. Mills were eager bidders today, as rail logistics have slowed March applications. 14% protein cars traded up 15 ct/bu on the low side, at +145 MWK, and up 20 ct/bu on the high side, at +160 MWK. 15% protein cars traded the low side up 5 ct/bu, at +170 MWK, and unchanged on the high side, at +180 MWK. Daily received/load-out from Minneapolis & Duluth (reported by MGEX, close of business 3/7): Minneapolis: 2/85 kbu, Duluth: 2/90 kbu. PNW The only wheat that still has some value is SWW, since it is still competitive against Australian wheat & the SWW b/s has potential to drawn c/o down to relatively tight levels next year. Otherwise, PNW exporters are worried about the possible impact the TPP trade agreement could have on US exports over the long run. Most of the old crop business is on the books, with only Japan& Taiwan left, so they don’t need to push the basis to buy wheat. Yes, it is unchanged on the HRW & HRS markets, & SWW just hangs in with a flat price bid of $5.70-$5.75/bu for old & new crop. PNW Track/barge bids:
Shipment Period DNS 14% HRW 11.5% WW 10.5%
Mar +120 MWK +145 KKWH 570 ct/bu
Apr/May +120/130 MWK +150/150 KWK 575/575 ct/bu
Jun/Jul +130/130 MWN +140/140 KWN 575/565 ct/bu
World Wheat News
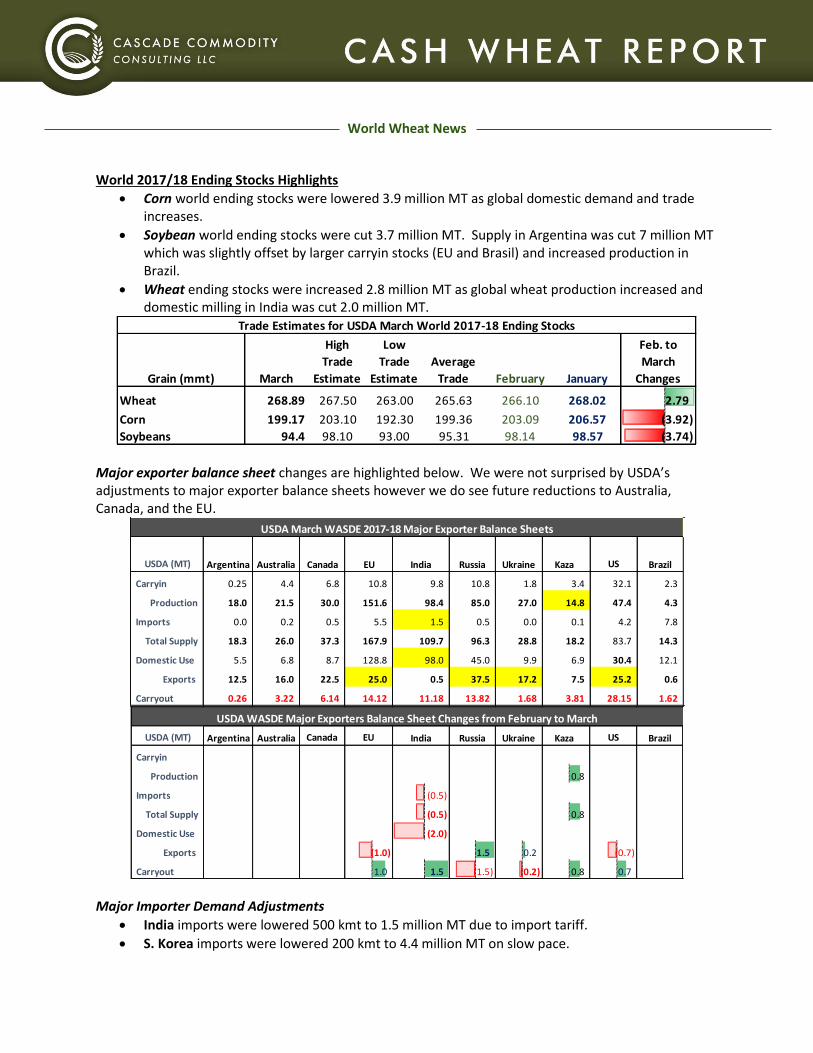
World 2017/18 Ending Stocks Highlights
Corn world ending stocks were lowered 3.9 million MT as global domestic demand and trade increases.
Soybean world ending stocks were cut 3.7 million MT. Supply in Argentina was cut 7 million MT which was slightly offset by larger carryin stocks (EU and Brasil) and increased production in Brazil.
Wheat ending stocks were increased 2.8 million MT as global wheat production increased and domestic milling in India was cut 2.0 million MT.
Major exporter balance sheet changes are highlighted below. We were not surprised by USDA’s adjustments to major exporter balance sheets however we do see future reductions to Australia, Canada, and the EU.
Major Importer Demand Adjustments
India imports were lowered 500 kmt to 1.5 million MT due to import tariff.
S. Korea imports were lowered 200 kmt to 4.4 million MT on slow pace.
Grain (mmt) March
High
Trade
Estimate
Low
Trade
Estimate
Average
Trade February January
Feb. to
March
Changes
Wheat 268.89 267.50 263.00 265.63 266.10 268.02 2.79
Corn 199.17 203.10 192.30 199.36 203.09 206.57 (3.92)
Soybeans 94.4 98.10 93.00 95.31 98.14 98.57 (3.74)
Trade Estimates for USDA March World 2017-18 Ending Stocks
USDA (MT) Argentina Australia Canada EU India Russia Ukraine Kaza US Brazil
Carryin 0.25 4.4 6.8 10.8 9.8 10.8 1.8 3.4 32.1 2.3
Production 18.0 21.5 30.0 151.6 98.4 85.0 27.0 14.8 47.4 4.3
Imports 0.0 0.2 0.5 5.5 1.5 0.5 0.0 0.1 4.2 7.8
Total Supply 18.3 26.0 37.3 167.9 109.7 96.3 28.8 18.2 83.7 14.3
Domestic Use 5.5 6.8 8.7 128.8 98.0 45.0 9.9 6.9 30.4 12.1
Exports 12.5 16.0 22.5 25.0 0.5 37.5 17.2 7.5 25.2 0.6
Carryout 0.26 3.22 6.14 14.12 11.18 13.82 1.68 3.81 28.15 1.62
USDA March WASDE 2017-18 Major Exporter Balance Sheets
USDA (MT) Argentina Australia Canada EU India Russia Ukraine Kaza US Brazil
Carryin
Production 0.8
Imports (0.5)
Total Supply (0.5) 0.8
Domestic Use (2.0)
Exports (1.0) 1.5 0.2 (0.7)
Carryout 1.0 1.5 (1.5) (0.2) 0.8 0.7
USDA WASDE Major Exporters Balance Sheet Changes from February to March
This E-mail (including attachments) is covered by the Electronic Communications Privacy Act, 18 U.S.C. §§2510-2521, is confidential. If you are not the intended recipient, you are
hereby notified that any retention, dissemination, distribution, or copying of this communication is strictly prohibited. Please reply to the sender that you have received the message in
error, and then delete it. This data and these comments are provided for information purposes only and are not intended to be used for specific trading strategies. Although all
information is believed to be reliable, we cannot guarantee its accuracy or completeness. Commodity trading involves risks, and you should ful ly understand those risks before trading.
Bangladesh imports were increased 200 kmt to 6.4 million MT.
Kenya imports increased 300 kmt on higher pace/consumption.
Turkey imports increased 1.0 million MT to 5.5 million MT on increased pace. Iraq wheat flour imports from Turkey July-January have increased 25% YoY (total flour imports up 28%) clearing 150-200 kmt per month (+50-100 kmt more than a year ago). This is indicating Iraq wheat flour imports could increase 400-600 kmt year-on-year to 2.0 million MT.
Vietnam imports increased 200 kmt to 4.2 million MT on higher pace. World Wheat FOB Comparisons:
South America
Origin Month Quality Bid/Offer ($USD/MT)
Argentine Upriver March 11.0% pro Seller $198
Argentine Upriver March/April 11.5% pro Seller $203/205
$1 USD= AR $20.33 Pesos $1 USD= R $3.26 Reales
Canada #2 CWRS fob Vancouver quotes May/Jun/Jul over the respective: 12.5% protein +50/45/50, 13.0% protein +75/65/70, 13.5% protein +110/100/105, and around a +15 cent premium for 13.8% protein. Australia Australian values were unchanged & have not been following CME futures for sometime now, making Australian wheat more competitive against Black Sea & US markets.
Origin Russian German Baltic Argentina HRW HRW HRW French UK SRW
Protein (dmb) 12.50% 12.50% 12.50% 11.50% 12.50% 11.00% 10.20% 11.00% 11.00% 10.20%
Protein (12% mb) 11.00% 11.00% 11.00% 10.12% 11.00% 9.68% 9.00% 9.68% 9.68% 9.00%
Apr $208 $210 $209 $205 $247 $242 - $205 $217 -
May $209 $213 $211 - $247 $242 $240 $206 $218 $217
Jun $200 $217 $215 - $250 $246 $244 $208 $220 $217
Jul $201 $219 $218 - $250 $246 $244 $209 $222 $217
World Wheat FOB Comparisons
Origin APW AH2 ASW HRW PNW HRW PNW SWW NS NS CWRS CWRS
Protein (dmb) 11.80% 12.90% 10.10% 12.00% 13.10% 12.00% 15.30% 15.90% 15.50% 15.90%
Protein (local) 10.50% 11.50% 9.00% 10.50% 11.50% 10.50% 13.50% 14.00% 13.50% 13.80%
Apr $246 $261 $236 $244 $258 $219 $277 $285 - -
May $246 $261 $236 $244 $258 $219 $277 $285 $270 $275
Jun $247 $262 $237 $244 $259 $219 $280 $288 $269 $275
Jul $247 $262 $237 $244 $259 $217 $280 $288 $271 $277
World Wheat FOB Comparisons

Indicative offers for APW are around $240-242/mt for May/Jun FOB WA, with around a $10/mt discount for ASW from WA, and around a $15/mt premium for AH2. Australian wheat export data for the month of January was released today showing 1.17 million MT shipped. Australia has exported 4.0 million MT October-January down 2.2 million MT below last year’s volume.
Black Sea & Europe The Matif closed up 0.50€ at 164.50€ for the May contract. FOB quotes Apr/May/Jun for Russian 12.5% pro: $208/209/210/mt (11.5% pro $6/mt discount), French 11.5% pro: $208/208/209/mt, German 12.5% pro: $213/216/218/mt, Baltic 12.5% pro: $211/$213/$215/mt, Ukraine 11.5% pro: $202/203/204/mt. CME Black Sea wheat traded 600 contracts today = 30 kmt at values $203-$204/mt while the cash market saw offers higher today at $210 vs bid $208/mt. New crop Baltic 12.5% protein wheat offered option to +2 Euro/mt over Sep. & German 12.5% new crop offered +3Euro / mt over Sep. Pending Tenders March 13: Ethiopia tenders for 400 kmt of milling wheat for shipment April/May. March 13: Taiwan US wheat 90+ kmt April/May shipment March 13: Japan expected to tender April/May shipment
This E-mail (including attachments) is covered by the Electronic Communications Privacy Act, 18 U.S.C. §§2510-2521, is confidential. If you are not the intended recipient, you are
hereby notified that any retention, dissemination, distribution, or copying of this communication is strictly prohibited. Please reply to the sender that you have received the message in
error, and then delete it. This data and these comments are provided for information purposes only and are not intended to be used for specific trading strategies. Although all
information is believed to be reliable, we cannot guarantee its accuracy or completeness. Commodity trading involves risks, and you should ful ly understand those risks before trading.
Futures Comments
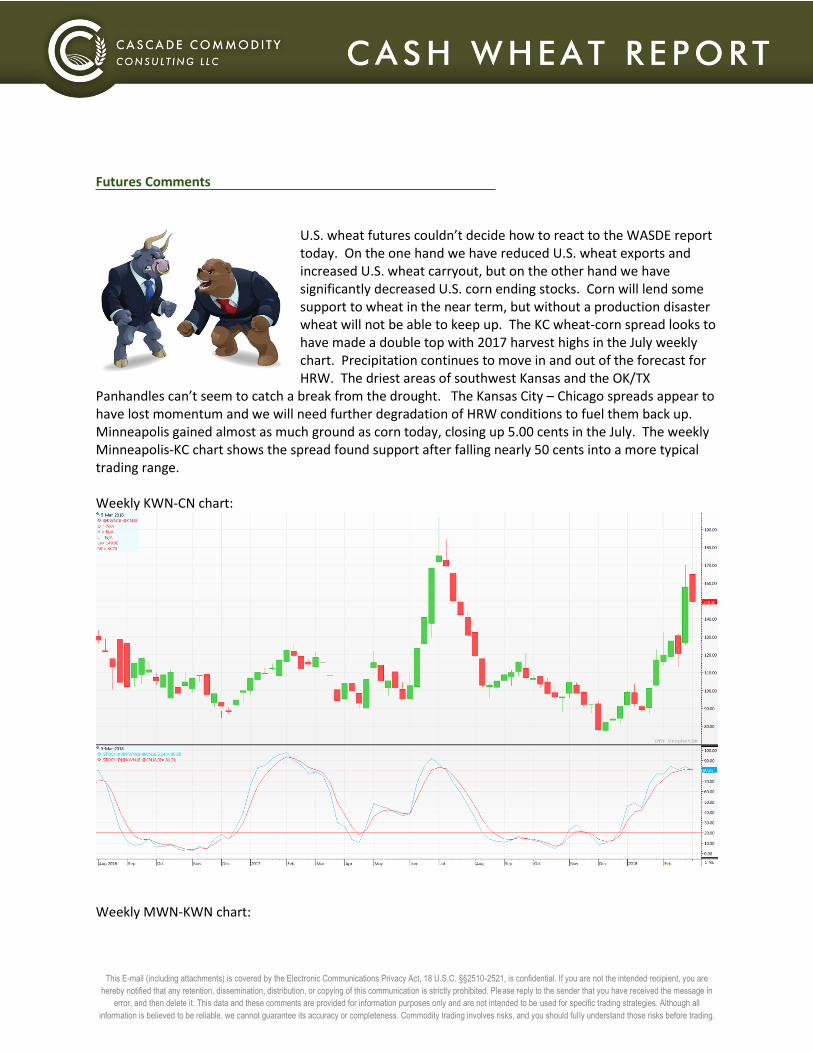
U.S. wheat futures couldn’t decide how to react to the WASDE report today. On the one hand we have reduced U.S. wheat exports and increased U.S. wheat carryout, but on the other hand we have significantly decreased U.S. corn ending stocks. Corn will lend some support to wheat in the near term, but without a production disaster wheat will not be able to keep up. The KC wheat-corn spread looks to have made a double top with 2017 harvest highs in the July weekly chart. Precipitation continues to move in and out of the forecast for HRW. The driest areas of southwest Kansas and the OK/TX
Panhandles can’t seem to catch a break from the drought. The Kansas City – Chicago spreads appear to have lost momentum and we will need further degradation of HRW conditions to fuel them back up. Minneapolis gained almost as much ground as corn today, closing up 5.00 cents in the July. The weekly Minneapolis-KC chart shows the spread found support after falling nearly 50 cents into a more typical trading range. Weekly KWN-CN chart:
Weekly MWN-KWN chart:
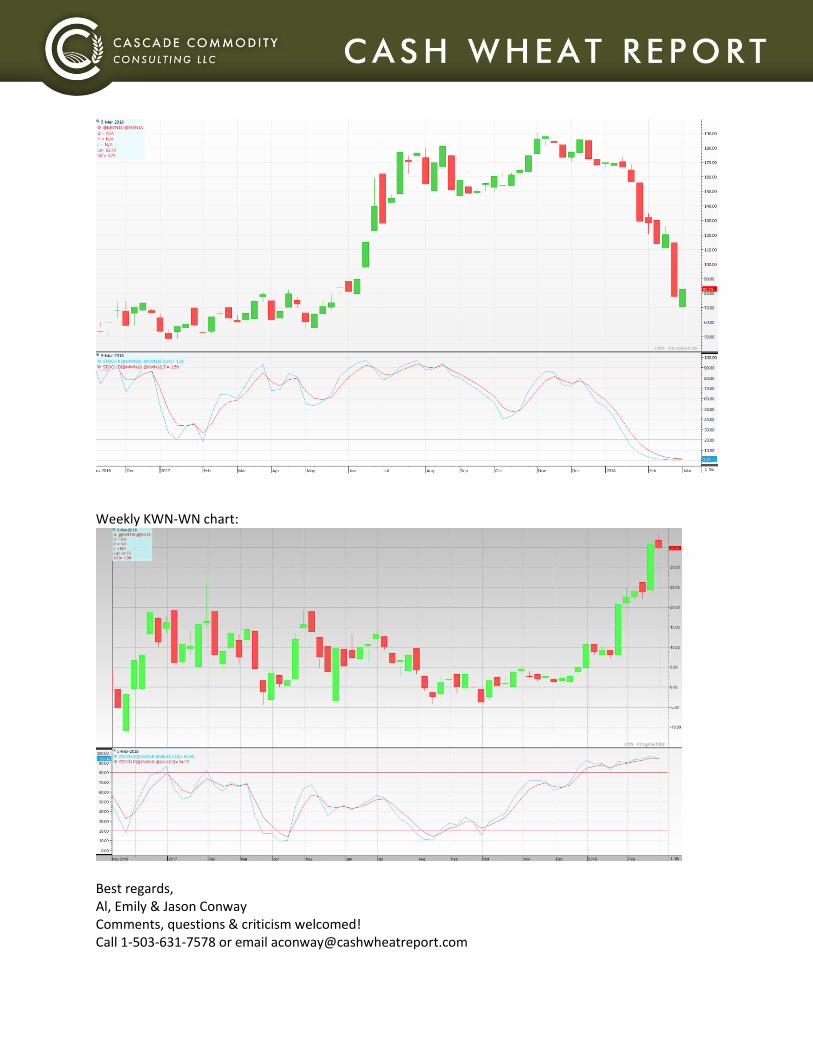
Weekly KWN-WN chart:
Best regards, Al, Emily & Jason Conway Comments, questions & criticism welcomed! Call 1-503-631-7578 or email [email protected]