Embed Size (px)
Citation preview
Cash vs. Electronic Payments in Small RetailingEstimating the Global Size
© 2016 International Bank for Reconstruction and Development / The World Bank
1818 H Street NW, Washington DC 20433
Telephone: 202-473-1000; Internet: www.worldbank.org
This work is a product of the staff of The World Bank with external contributions. The findings, interpretations, and conclusions expressed in this work do not necessarily reflect the views of The World Bank, its Board of Executive Directors, or the governments they represent. The World Bank does not guarantee the accuracy of the data included in this work. The boundaries, colors, denominations, and other information shown on any map in this work do not imply any judgment on the part of The World Bank concerning the legal status of any territory or the endorsement or acceptance of such boundaries.
Rights and Permissions
The material in this work is subject to copyright. Because the World Bank encourages dissemination of its knowledge, this work may be reproduced, in whole or in part, for noncommercial purposes as long as full attribution to this work is given.
All queries on rights and licenses should be addressed to the Office of the Publisher, The World Bank, 1818 H Street NW, Washington, DC 20433, USA; fax: 202-522-2625; e-mail: [email protected].
Photo Credit: Shutterstock
1.
Acknowledgements
i
Acknowledgements III
Acronyms And Abbreviations V
Executive Summary VII
1. Introduction 1
2. Methodology 5
2.1. Scope 5
2.2. Estimation 8
3. Country Research 9
4. Global Size Of Digital Vs. Cash Transactions By MSMRs 15
4.1. Person-To-Business Payments For MSMRs 15
4.2. Business-To-Business Payments From MSMRs To Suppliers 17
4.3. Business-To-Person Payments by MSMRs: Payments Of Salaries 18
Annexes 21
A1. Glossary 22
A2. Euromonitor Passport Databases 24
A3. List Of Economies 25
A4. Methodology – Detailed Descriptions 26
A5. Discussion Guides And Questionnaires 34
A6. Country-Level Findings 39
References 93
Endnotes 95

1.
Acknowledgements
iiiAcknowledgements
This report is a product of a collaborative effort across the World Bank Group’s Finance & Markets Global Practice (WBG) and the World Economic Forum (Forum) Financial Services Industry Team, specifically with the Promoting Global Financial Inclusion Initiative.
The collaboration was led by Ghada Teima (Program Manager and Lead Financial Sector Specialist, WBG) working with a core team – Nina Bilandzic (Financial Sector Specialist, WBG), Oya Pinar Ardic Alper (Financial Sector Specialist, WBG), Nicole Meyers (Project Manager, Forum, and Financial Inclusion Fellow, McKinsey & Company). Tony Lythgoe (Practice Manager, WBG), Douglas Pearce (Practice Manager, WBG), Massimo Cirasino (Adviser, WBG), Matthew Gamser (CEO, SME Finance Forum, IFC), and Peer Stein (Adviser, IFC) provided overall guidance to the team. Ivan Mortimer-Schutts (Senior Operations Officer, WBG), Harish Natarajan (Lead Financial Sector Specialist, WBG), Thomas Lammer (Senior Financial Sector Specialist, WBG) and Lois Quinn (Senior Payment Systems Specialist, WBG) provided technical guidance. The team is
thankful for the multi-phase collaboration with the World Economic Forum on this topic and for the contribution from Michael Koenitzer (formerly Forum), Annelyse Freyman (formerly Forum) and Lisa Donegan (formerly Forum) at the project design stages. Euromonitor International provided analytical support for the study. Aichin Jones (Graphic Designer, WBG) designed the report.
The team is grateful to the peer reviewers of this report for their valuable input and guidance chaired by Samuel Maimbo (Practice Manager, WBG), including – Matthew Gamser (CEO, SME Finance Forum, IFC), Harish Natarajan (Lead Financial Sector Specialist, WBG), Ivan Mortimer-Schutts (Senior Operations Officer, WBG), Thomas Lammer (Senior Financial Sector Specialist, WBG), and Chris Dooley (Project Lead, Promoting Financial Inclusion Initiative, Forum).
This report would not be possible without the generous support of the Netherlands’ Ministry of Foreign Affairs and the Bill and Melinda Gates Foundation provided through WBG’s Financial Inclusion Support Framework (FISF) program as well as the support of the SME Finance Forum.

1.
Acknowledgements
vAcronyms and Abbreviations
ACH Automated Clearing House
ATM Automatic teller machine
B2B Business-to-business
B2P Business-to-person
B2C Business-to-consumer
C2B Consumer-to-business
IFC International Financial Corporation
MSME Micro, small and medium enterprises
MSMR Micro, small and medium retailers
SME Small and medium enterprises
P2B Person-to-business
POS Point of sale
USD United States Dollars
WB World Bank
WBG World Bank Group
Forum World Economic Forum

1.
Acknowledgements
viiExecutive Summary
In 2014, the World Bank Group (WBG) and the World Economic Forum (Forum) agreed to promote a shared vision of financial inclusion. This study is a part of that collaborative effort to foster knowledge to grow responsible financial inclusion through usage by merchants of electronic payments (often nowadays referred to as digital payments), in particular by small retailers, with a specific focus of the retailers’ role in person-to-business (P2B), business-to-business (B2B) and business-to-person (B2P) payments: payments for retail sales, supplier payments, and wage payments.
For this purpose, concurrent with the underlying study, the WBG and the Forum conducted a stocktaking analysis of innovative cases of electronic payment adoption and usage by small merchants (World Bank Group and World Economic Forum, 2016). This study is a companion piece to that, and aims to identify the value of the digital gap—the value of cash transactions that could be migrated to electronic payments—in retail payments globally with a focus on formal micro, small and medium retailers (MSMRs), and in doing so, inform the analysis and recommendations of the stocktaking study.
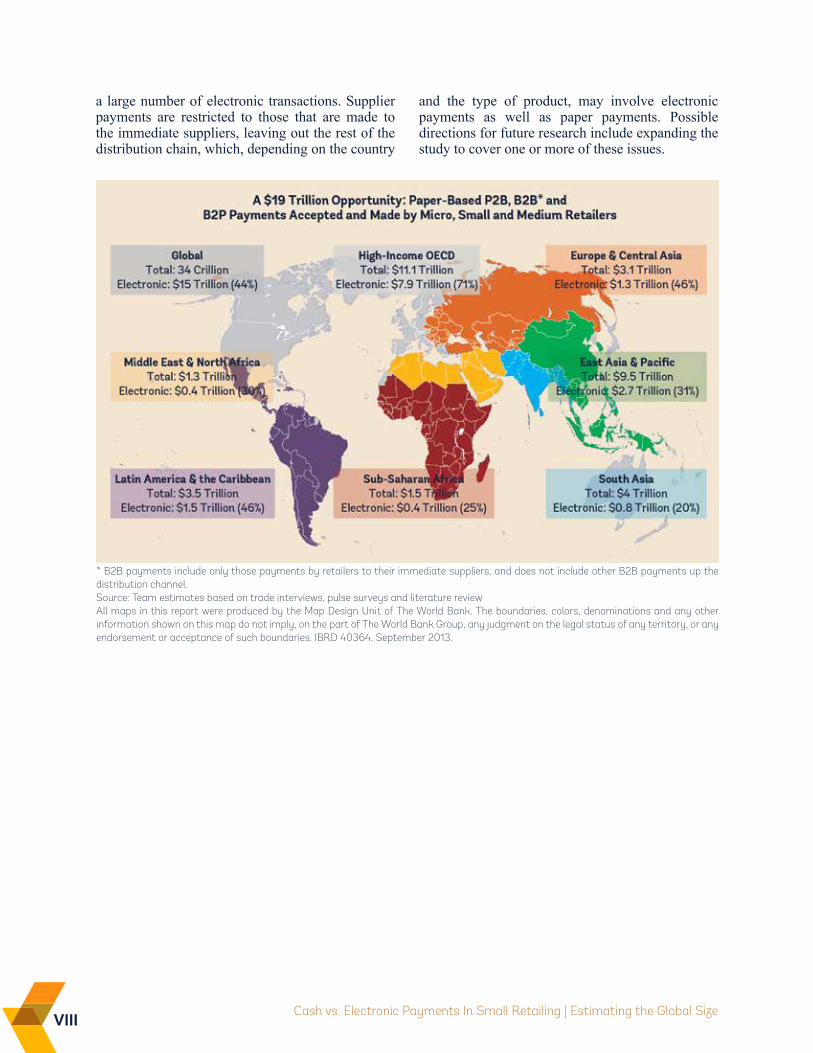
The findings of this study indicate that MSMRs make and accept payments estimated at USD 34 trillion in an annual basis in the form of supplier payments, wages and salaries, and receipts from consumers, USD 15 trillion of which are estimated to be done electronically and the rest, USD 19 trillion, is in paper form (cash and checks). Electronic payments,
as opposed to cash, are more commonly accepted and used by non-grocery retailers, and by retailers larger in size.
At the same time, there is a large variance across countries in terms of the use and acceptance of electronic payments by MSMRs. In developed and upper-middle income countries, almost all the salaries are paid electronically by medium retailers, and the majority are paid electronically by small and medium retailers. However, MSMRs in lower-middle income and low income countries use mainly cash for the same purpose. The majority of the P2B and B2B payments, both in terms of value and volume, are electronic in the more developed economies.
Data availability has been a big challenge in identifying the global size of cash and electronic payments in retail. To fill the gap, this study undertook primary research in seven economies, and simulations were run to estimate the global size. This paper is a reference paper that discusses the scope and the methodology of this exercise, and presents the findings. As data availability has been a challenge, the scope of this research was defined to ensure reliability of the estimates at the global level. For example, informal sector was left out as it is a vast exercise by itself to estimate the payment flows in the informal retail sector, with the acknowledgement that a large number of cash transactions are done in the informal sector. Also, the scope is restricted to micro, small, and medium retailers, leaving out large retailers. This excludes
viii Cash vs. Electronic Payments In Small Retailing | Estimating the Global Size
a large number of electronic transactions. Supplier payments are restricted to those that are made to the immediate suppliers, leaving out the rest of the distribution chain, which, depending on the country
and the type of product, may involve electronic payments as well as paper payments. Possible directions for future research include expanding the study to cover one or more of these issues.
* B2B payments include only those payments by retailers to their immediate suppliers, and does not include other B2B payments up the distribution channel. Source: Team estimates based on trade interviews, pulse surveys and literature reviewAll maps in this report were produced by the Map Design Unit of The World Bank. The boundaries, colors, denominations and any other information shown on this map do not imply, on the part of The World Bank Group, any judgment on the legal status of any territory, or any endorsement or acceptance of such boundaries. IBRD 40364, September 2013.
1.
Acknowledgements
1
The importance of financial inclusion for development has been recognized in the international development community and by most policy makers in developing economies. According to the Global Findex database, an estimated 2 billion adults globally do not have access to a transaction account with an authorized and/or regulated service provider and that can be used to send and receive payments or to store some value. Yet, research shows that poor people have active financial lives and need a range of financial services to take advantage of economic opportunities and manage and mitigate risks. Similarly, while small and medium enterprises (SMEs) generate the most new jobs, employ the largest number of people in aggregate, and hence are important for job creation and economic growth, 200 million enterprises in developing economies are constrained in terms of financing.
Recognizing the transformational potential of universal financial inclusion for economic development, the World Bank Group (WBG) President put forward an ambitious goal of universal financial access. Universal Financial Access by 2020 vision is to ensure that everyone has access to a transaction or deposit account -- whether accessed through a bank account, payment card, mobile wallet, or other financial instrument. This will provide a strong foundation to achieve the broader future goal of universal financial inclusion, in addition to being instrumental in achieving the WBG’s twin goals of
eradicating extreme poverty by 2030, and increasing the share of income held by the bottom 40%.
While there are many ingredients to achieving universal financial access, the potential impact of extending digital financial services through a more widespread acceptance at small retailers is substantial. Traditional retailers in developing economies, the majority of which are micro, small, and medium enterprises (MSMEs), most often do not use electronic payments and are excluded from the formal financial sector. They can help expand the use of electronic payments by consumers. It is through the regularity and the frequency of purchases from everyday retailers that retail payment solutions become valuable to consumers and generate an anchor for them within the formal financial sector.
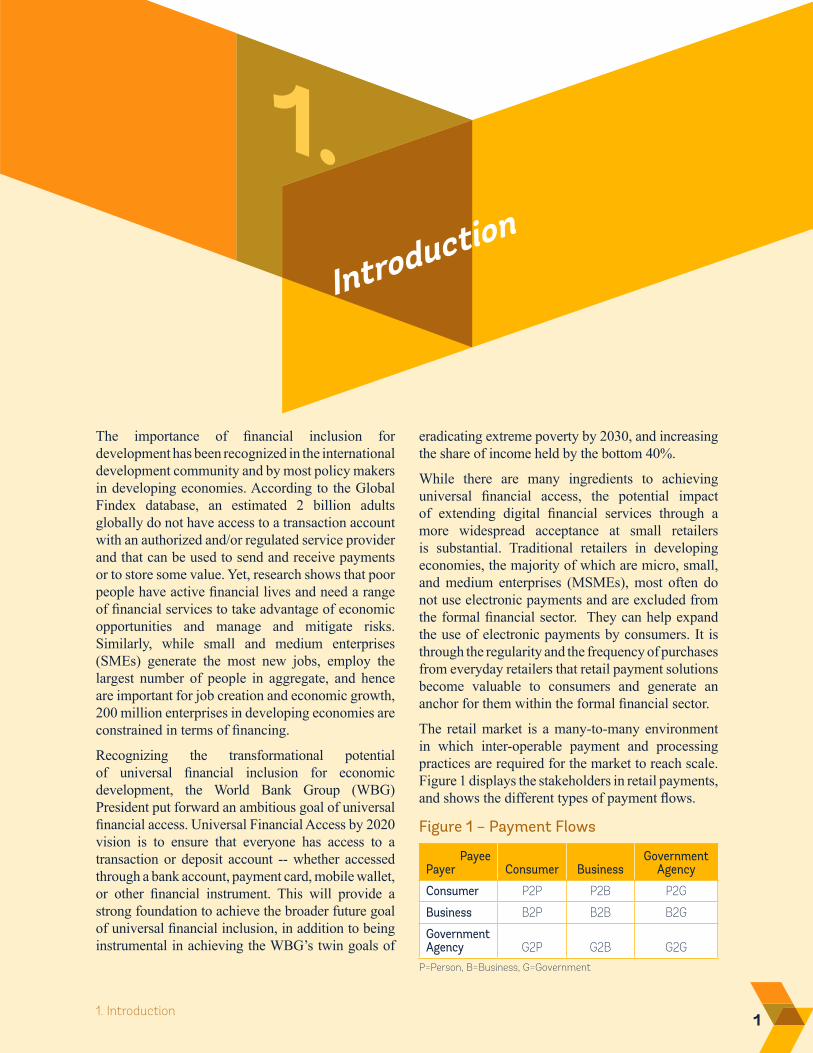
The retail market is a many-to-many environment in which inter-operable payment and processing practices are required for the market to reach scale. Figure 1 displays the stakeholders in retail payments, and shows the different types of payment flows.
1. Introduction
Figure 1 – Payment Flows
P=Person, B=Business, G=Government
PayeePayer Consumer Business
Government Agency
Consumer P2P P2B P2G
Business B2P B2B B2G
Government Agency G2P G2B G2G
2 Cash vs. Electronic Payments In Small Retailing | Estimating the Global Size
Small retailers have a potentially key role in adoption and eventual widespread use of digital payment instruments. The benefits of transforming small retailers into non-cash transaction partners include:
• Boosting the value of non-cash payments to a broader consumer market (P2B payments).
• Using the information on timely supplier payments in credit decisioning (B2B payments).
• Expansion of transaction account ownership (B2P payments).
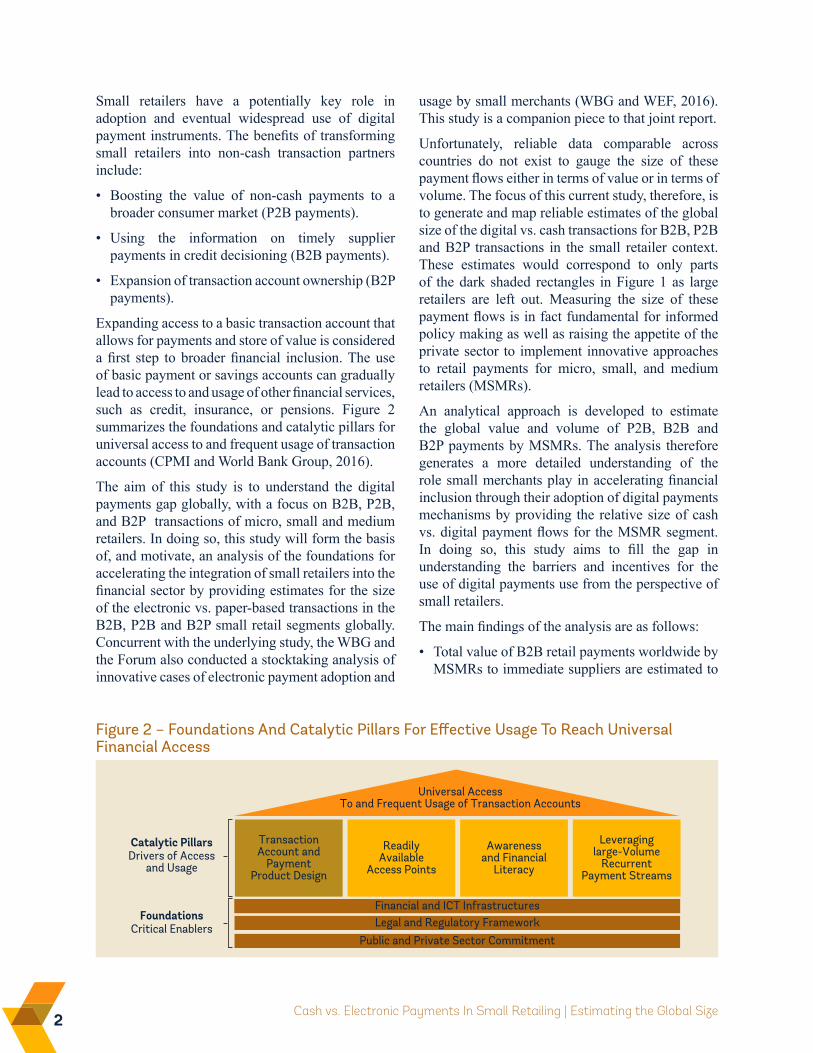
Expanding access to a basic transaction account that allows for payments and store of value is considered a first step to broader financial inclusion. The use of basic payment or savings accounts can gradually lead to access to and usage of other financial services, such as credit, insurance, or pensions. Figure 2 summarizes the foundations and catalytic pillars for universal access to and frequent usage of transaction accounts (CPMI and World Bank Group, 2016).
The aim of this study is to understand the digital payments gap globally, with a focus on B2B, P2B, and B2P transactions of micro, small and medium retailers. In doing so, this study will form the basis of, and motivate, an analysis of the foundations for accelerating the integration of small retailers into the financial sector by providing estimates for the size of the electronic vs. paper-based transactions in the B2B, P2B and B2P small retail segments globally. Concurrent with the underlying study, the WBG and the Forum also conducted a stocktaking analysis of innovative cases of electronic payment adoption and
usage by small merchants (WBG and WEF, 2016). This study is a companion piece to that joint report.
Unfortunately, reliable data comparable across countries do not exist to gauge the size of these payment flows either in terms of value or in terms of volume. The focus of this current study, therefore, is to generate and map reliable estimates of the global size of the digital vs. cash transactions for B2B, P2B and B2P transactions in the small retailer context. These estimates would correspond to only parts of the dark shaded rectangles in Figure 1 as large retailers are left out. Measuring the size of these payment flows is in fact fundamental for informed policy making as well as raising the appetite of the private sector to implement innovative approaches to retail payments for micro, small, and medium retailers (MSMRs).
An analytical approach is developed to estimate the global value and volume of P2B, B2B and B2P payments by MSMRs. The analysis therefore generates a more detailed understanding of the role small merchants play in accelerating financial inclusion through their adoption of digital payments mechanisms by providing the relative size of cash vs. digital payment flows for the MSMR segment. In doing so, this study aims to fill the gap in understanding the barriers and incentives for the use of digital payments use from the perspective of small retailers.
The main findings of the analysis are as follows:
• Total value of B2B retail payments worldwide by MSMRs to immediate suppliers are estimated to
Figure 2 – Foundations And Catalytic Pillars For Effective Usage To Reach Universal Financial Access
Public and Private Sector CommitmentLegal and Regulatory FrameworkFinancial and ICT Infrastructures
Universal AccessTo and Frequent Usage of Transaction Accounts
TransactionAccount and
PaymentProduct Design
Awarenessand Financial
Literacy
Leveraginglarge-Volume
RecurrentPayment Streams
ReadilyAvailable
Access Points
Critical EnablersFoundations
Drivers of Accessand Usage
Catalytic Pillars
31. Introduction
be $13.3 trillion, 53% of which (approximately $7 trillion) are made electronically, and the remaining $6.3 trillion is in cash and checks.
• Total value of B2P retail payments worldwide by MSMRs are estimated to be $2 trillion, 50% of which are made electronically.
• These imply a market size of $34 trillion globally for payments by small retailers, $15 trillion of which are made electronically, and $19 trillion made in cash and checks.
• Electronic payments are more widely used by non-grocery retailers compared to grocery retailers, regardless of whether it is B2B, P2B or B2P transactions.
Developing and accelerating acceptance of electronic payments by small merchants is essential to expand financial access. A basic transaction account that enables payments and store of value is considered an entry point to the formal financial system and can act as a gateway for individuals to adopt other
relevant financial services they need to smooth their consumption and manage income shocks. However, it is not sufficient to just equip individuals with basic transaction accounts. The use case becomes more and more effective as individuals gradually move to a cashless economy where electronic payments are widely accepted for regular and frequent purchases.
The rest of this report is organized as follows. Section 2 provides an overview of the methodology. Findings of the analysis are presented in sections 3 and 4, on country research and global research, respectively. The report also has six annexes: a glossary of terms is provided in Annex 1. Annex 2 includes information on the proprietary databases by Euromonitor International used in this study. The list of economies used in estimating the global size is in Annex 3. Annex 4 provides technical details on the methodology. Discussion guides and questionnaires on which the primary research is based are provided in Annex 5. Annex 6 includes detailed country-level results.

52. Methodology
2.1 SCOPE
FORMAL MiCRO, SMALL, AND MEDiUM RETAiLERS
The scope of this research is restricted to B2B, P2B and B2P transactions of formal (i.e. officially registered as a business) micro, small and medium retailers (MSMRs), which are defined as those up to 100 employees. Both grocery (modern and traditional) and non-grocery retailers are included. Modern grocery retailing includes hypermarkets, supermarkets, discounters, forecourt retailers, and convenience stores. Traditional grocery retailing includes independent small grocers, food/drink/tobacco specialists and other grocery retailers. Annex 1 has the Glossary with definitions of different types of retailers.
While very relevant for including individuals who are outside the regulated financial system, the informal retail sector is excluded because it is challenging to come up with a measure of the informal retail sector within a country as well as a measure that is comparable across countries. At the same time, it is difficult to define the extent of the informal sector even within a country.
P2B PAYMENTS, B2P PAYMENTS, AND B2B PAYMENTS TO iMMEDiATE SUPPLiERS
P2B payments in this study include all payment transactions made by consumers/persons to MSMRs in return for products or services. B2P payment flows, on the other hand, are payments by MSMRs to persons, which are wages and additional benefits.
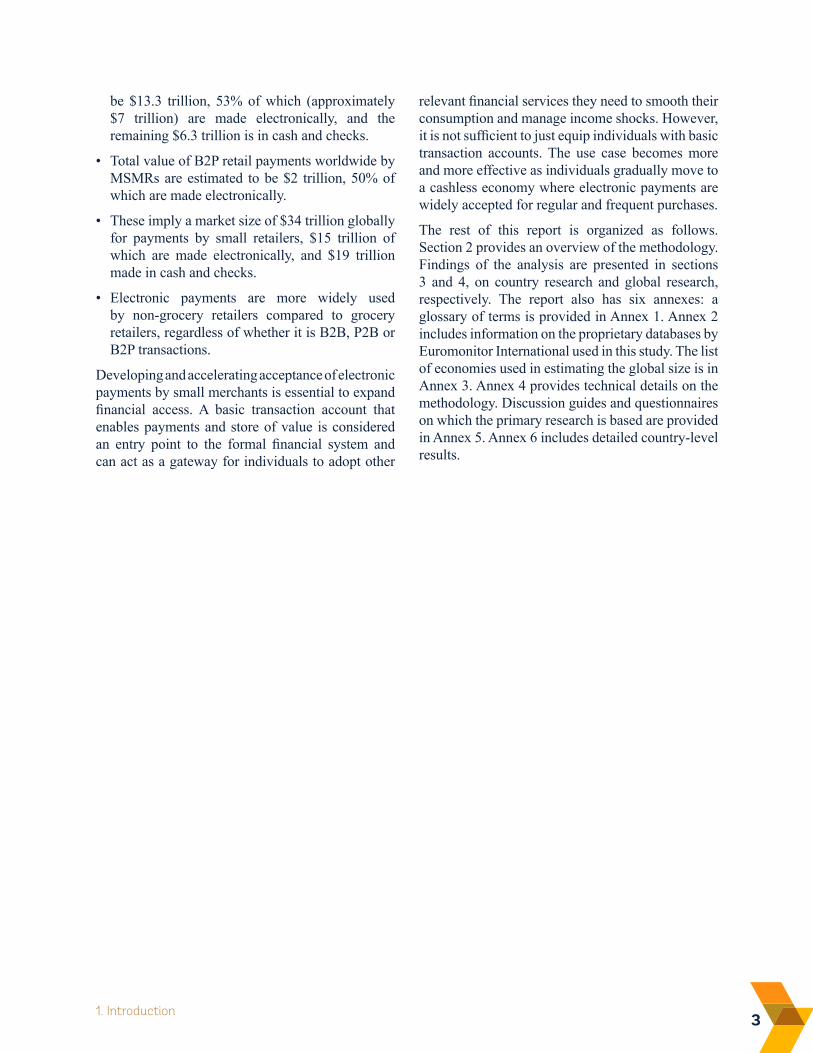
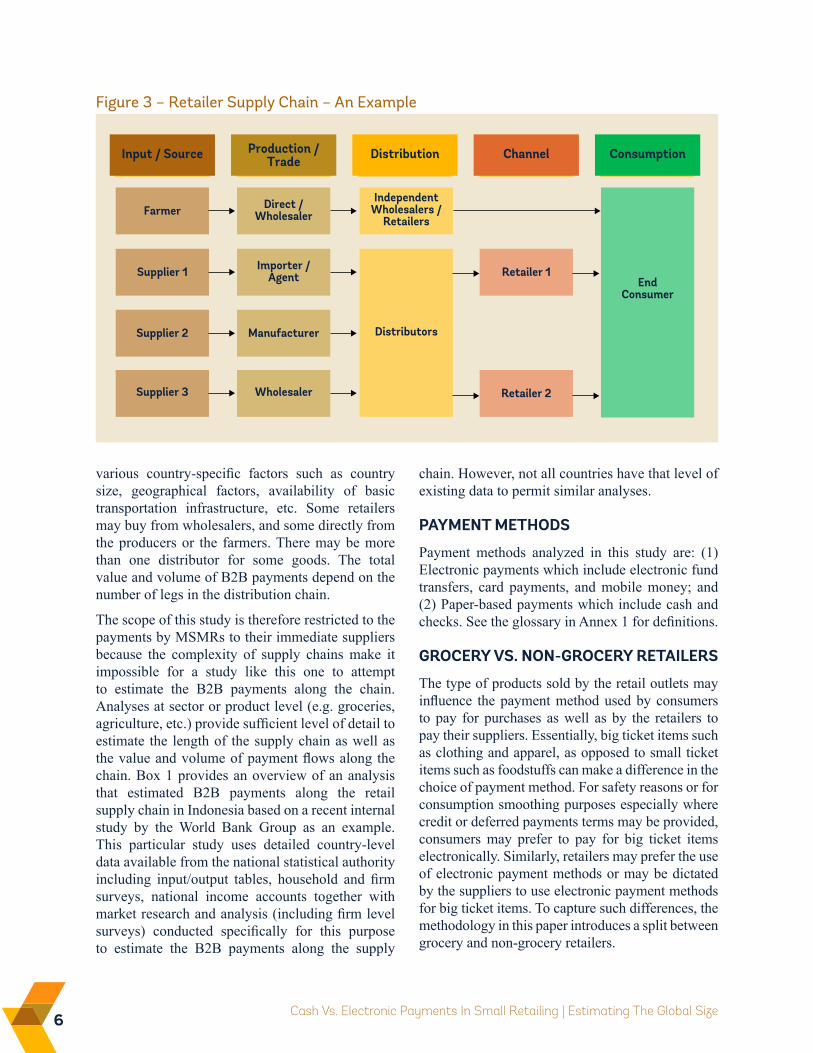
The study measures B2B payments as those by MSMRs to immediate suppliers, i.e. the first leg in the supply chain. The full extent of B2B payments, however, is much larger and depends on the length of the supply/distribution chain, including all payment flows through the chain in either direction. Figure 3 plots an example of a supply chain where the product is distributed along the various layers of the chain by various agents, e.g. distributors, wholesalers, etc. from the actual producer to the retailer. However, not all retailer supply chains are the same.
The complexity and differences in measuring supply chain length depend on the type of the product, the degree of integration of the supply chain itself and the degree of concentration and fragmentation of the retailer markets/suppliers, in addition to
6 Cash Vs. Electronic Payments In Small Retailing | Estimating The Global Size
various country-specific factors such as country size, geographical factors, availability of basic transportation infrastructure, etc. Some retailers may buy from wholesalers, and some directly from the producers or the farmers. There may be more than one distributor for some goods. The total value and volume of B2B payments depend on the number of legs in the distribution chain.
The scope of this study is therefore restricted to the payments by MSMRs to their immediate suppliers because the complexity of supply chains make it impossible for a study like this one to attempt to estimate the B2B payments along the chain. Analyses at sector or product level (e.g. groceries, agriculture, etc.) provide sufficient level of detail to estimate the length of the supply chain as well as the value and volume of payment flows along the chain. Box 1 provides an overview of an analysis that estimated B2B payments along the retail supply chain in Indonesia based on a recent internal study by the World Bank Group as an example. This particular study uses detailed country-level data available from the national statistical authority including input/output tables, household and firm surveys, national income accounts together with market research and analysis (including firm level surveys) conducted specifically for this purpose to estimate the B2B payments along the supply
chain. However, not all countries have that level of existing data to permit similar analyses.
PAYMENT METHODS
Payment methods analyzed in this study are: (1) Electronic payments which include electronic fund transfers, card payments, and mobile money; and (2) Paper-based payments which include cash and checks. See the glossary in Annex 1 for definitions.
GROCERY vS. NON-GROCERY RETAiLERS
The type of products sold by the retail outlets may influence the payment method used by consumers to pay for purchases as well as by the retailers to pay their suppliers. Essentially, big ticket items such as clothing and apparel, as opposed to small ticket items such as foodstuffs can make a difference in the choice of payment method. For safety reasons or for consumption smoothing purposes especially where credit or deferred payments terms may be provided, consumers may prefer to pay for big ticket items electronically. Similarly, retailers may prefer the use of electronic payment methods or may be dictated by the suppliers to use electronic payment methods for big ticket items. To capture such differences, the methodology in this paper introduces a split between grocery and non-grocery retailers.
Figure 3 – Retailer Supply Chain – An Example
Input / Source
Farmer
Supplier 1
Supplier 2
Supplier 3
Production /Trade
Direct /Wholesaler
Importer /Agent
Manufacturer
Wholesaler
Distribution
IndependentWholesalers /
Retailers
Distributors
Channel
Retailer 1
Retailer 2
Consumption
EndConsumer
72. Methodology
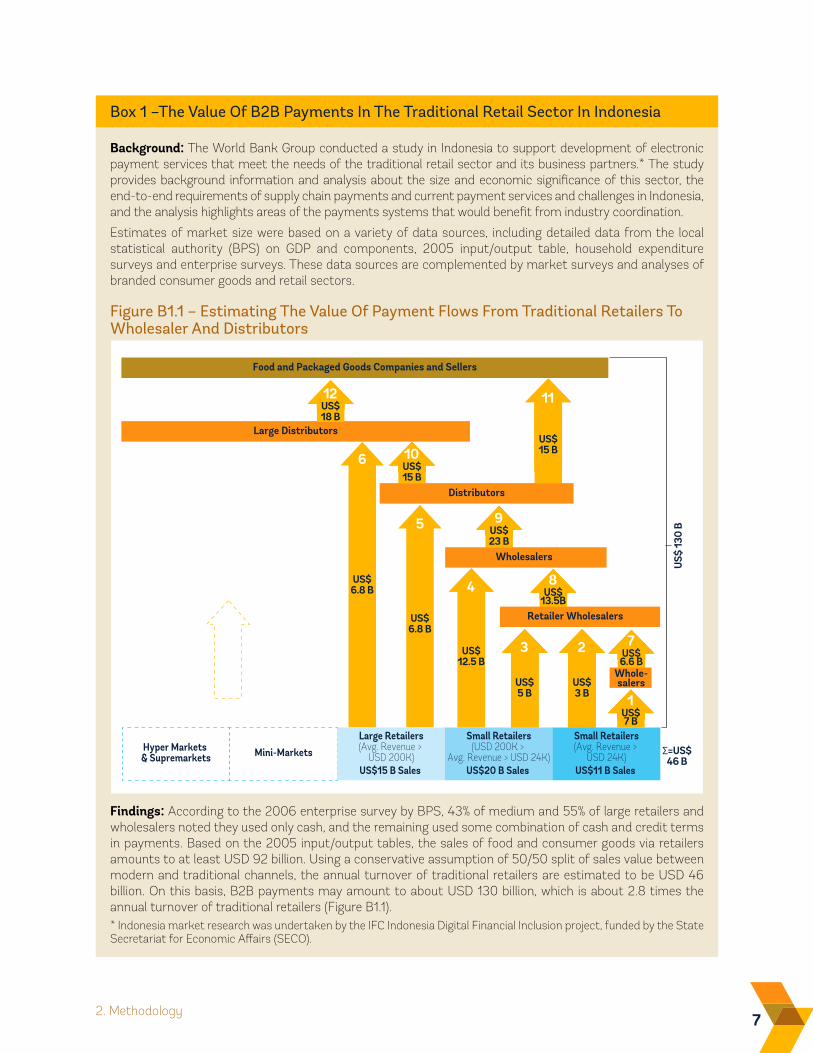
Background: The World Bank Group conducted a study in Indonesia to support development of electronic payment services that meet the needs of the traditional retail sector and its business partners.* The study provides background information and analysis about the size and economic significance of this sector, the end-to-end requirements of supply chain payments and current payment services and challenges in Indonesia, and the analysis highlights areas of the payments systems that would benefit from industry coordination.
Estimates of market size were based on a variety of data sources, including detailed data from the local statistical authority (BPS) on GDP and components, 2005 input/output table, household expenditure surveys and enterprise surveys. These data sources are complemented by market surveys and analyses of branded consumer goods and retail sectors.
Figure B1.1 – Estimating The Value Of Payment Flows From Traditional Retailers To Wholesaler And Distributors
Findings: According to the 2006 enterprise survey by BPS, 43% of medium and 55% of large retailers and wholesalers noted they used only cash, and the remaining used some combination of cash and credit terms in payments. Based on the 2005 input/output tables, the sales of food and consumer goods via retailers amounts to at least USD 92 billion. Using a conservative assumption of 50/50 split of sales value between modern and traditional channels, the annual turnover of traditional retailers are estimated to be USD 46 billion. On this basis, B2B payments may amount to about USD 130 billion, which is about 2.8 times the annual turnover of traditional retailers (Figure B1.1).* Indonesia market research was undertaken by the IFC Indonesia Digital Financial Inclusion project, funded by the State Secretariat for Economic Affairs (SECO).
Box 1 –The Value Of B2B Payments In The Traditional Retail Sector In Indonesia
6
US$6.8 B
Food and Packaged Goods Companies and Sellers
Large Distributors
US$6.8 B
US$6.8 B
US$12.5 B
5
4
US$6.8 BUS$6.8 BUS$6.8 BUS$
7 B
1
US$6.8 BUS$6.8 BUS$6.8 BUS$6.6 B
7US$6.8 BUS$6.8 BUS$6.8 B
US$3 B
2US$6.8 BUS$6.8 BUS$6.8 B
US$5 B
3
Mini-MarketsLarge Retailers(Avg. Revenue >
USD 200K)US$15 B Sales
Small Retailers(USD 200K >
Avg. Revenue > USD 24K)US$20 B Sales
Small Retailers(Avg. Revenue >
USD 24K)US$11 B Sales
Hyper Markets & Supremarkets
US$6.8 BUS$6.8 BUS$6.8 BUS$23 B
9
Wholesalers
US$6.8 BUS$6.8 BUS$6.8 BUS$15 B
10
US$6.8 BUS$6.8 BUS$6.8 B
US$15 B
11US$6.8 BUS$6.8 BUS$6.8 BUS$18 B
12
Whole-salers
US$6.8 BUS$6.8 BUS$6.8 BUS$13.5B
8
Retailer Wholesalers
Distributors
US$
130
B
Σ=US$46 B
8 Cash vs. Electronic Payments In Small Retailing | Estimating the Global Size
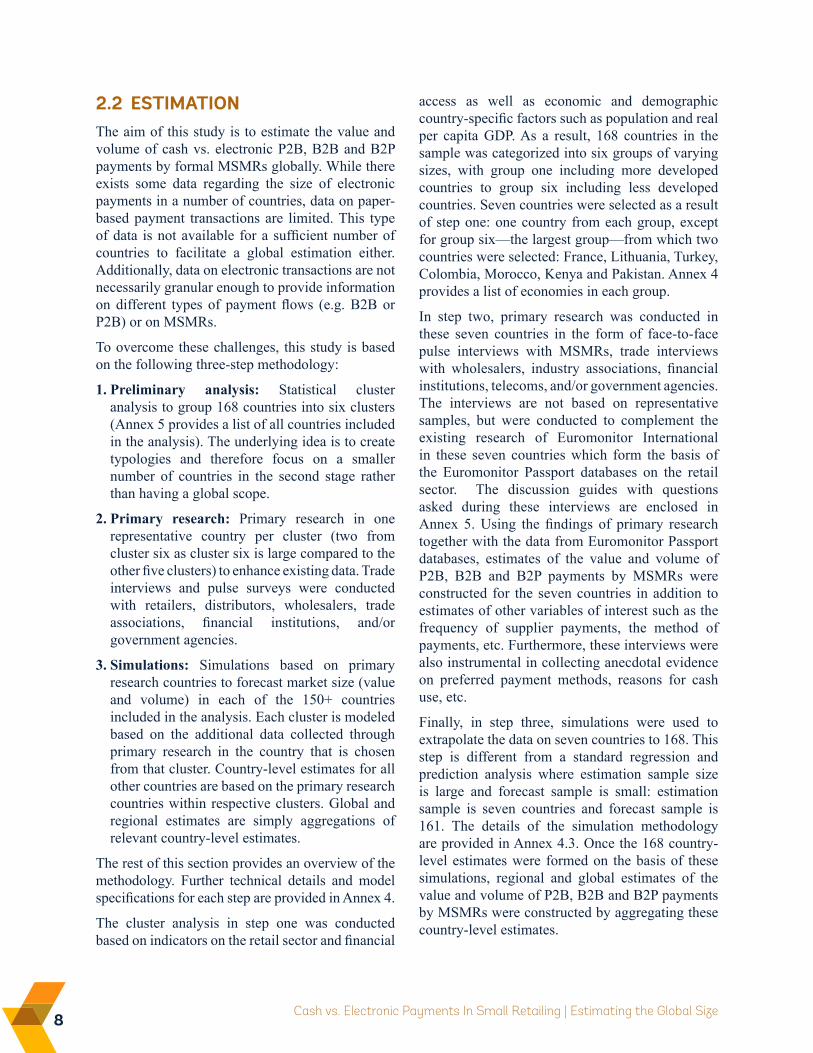
2.2 ESTiMATiONThe aim of this study is to estimate the value and volume of cash vs. electronic P2B, B2B and B2P payments by formal MSMRs globally. While there exists some data regarding the size of electronic payments in a number of countries, data on paper-based payment transactions are limited. This type of data is not available for a sufficient number of countries to facilitate a global estimation either. Additionally, data on electronic transactions are not necessarily granular enough to provide information on different types of payment flows (e.g. B2B or P2B) or on MSMRs.
To overcome these challenges, this study is based on the following three-step methodology:
1. Preliminary analysis: Statistical cluster analysis to group 168 countries into six clusters (Annex 5 provides a list of all countries included in the analysis). The underlying idea is to create typologies and therefore focus on a smaller number of countries in the second stage rather than having a global scope.
2. Primary research: Primary research in one representative country per cluster (two from cluster six as cluster six is large compared to the other five clusters) to enhance existing data. Trade interviews and pulse surveys were conducted with retailers, distributors, wholesalers, trade associations, financial institutions, and/or government agencies.
3. Simulations: Simulations based on primary research countries to forecast market size (value and volume) in each of the 150+ countries included in the analysis. Each cluster is modeled based on the additional data collected through primary research in the country that is chosen from that cluster. Country-level estimates for all other countries are based on the primary research countries within respective clusters. Global and regional estimates are simply aggregations of relevant country-level estimates.
The rest of this section provides an overview of the methodology. Further technical details and model specifications for each step are provided in Annex 4.
The cluster analysis in step one was conducted based on indicators on the retail sector and financial
access as well as economic and demographic country-specific factors such as population and real per capita GDP. As a result, 168 countries in the sample was categorized into six groups of varying sizes, with group one including more developed countries to group six including less developed countries. Seven countries were selected as a result of step one: one country from each group, except for group six—the largest group—from which two countries were selected: France, Lithuania, Turkey, Colombia, Morocco, Kenya and Pakistan. Annex 4 provides a list of economies in each group.
In step two, primary research was conducted in these seven countries in the form of face-to-face pulse interviews with MSMRs, trade interviews with wholesalers, industry associations, financial institutions, telecoms, and/or government agencies. The interviews are not based on representative samples, but were conducted to complement the existing research of Euromonitor International in these seven countries which form the basis of the Euromonitor Passport databases on the retail sector. The discussion guides with questions asked during these interviews are enclosed in Annex 5. Using the findings of primary research together with the data from Euromonitor Passport databases, estimates of the value and volume of P2B, B2B and B2P payments by MSMRs were constructed for the seven countries in addition to estimates of other variables of interest such as the frequency of supplier payments, the method of payments, etc. Furthermore, these interviews were also instrumental in collecting anecdotal evidence on preferred payment methods, reasons for cash use, etc.
Finally, in step three, simulations were used to extrapolate the data on seven countries to 168. This step is different from a standard regression and prediction analysis where estimation sample size is large and forecast sample is small: estimation sample is seven countries and forecast sample is 161. The details of the simulation methodology are provided in Annex 4.3. Once the 168 country-level estimates were formed on the basis of these simulations, regional and global estimates of the value and volume of P2B, B2B and B2P payments by MSMRs were constructed by aggregating these country-level estimates.
93. Country Research
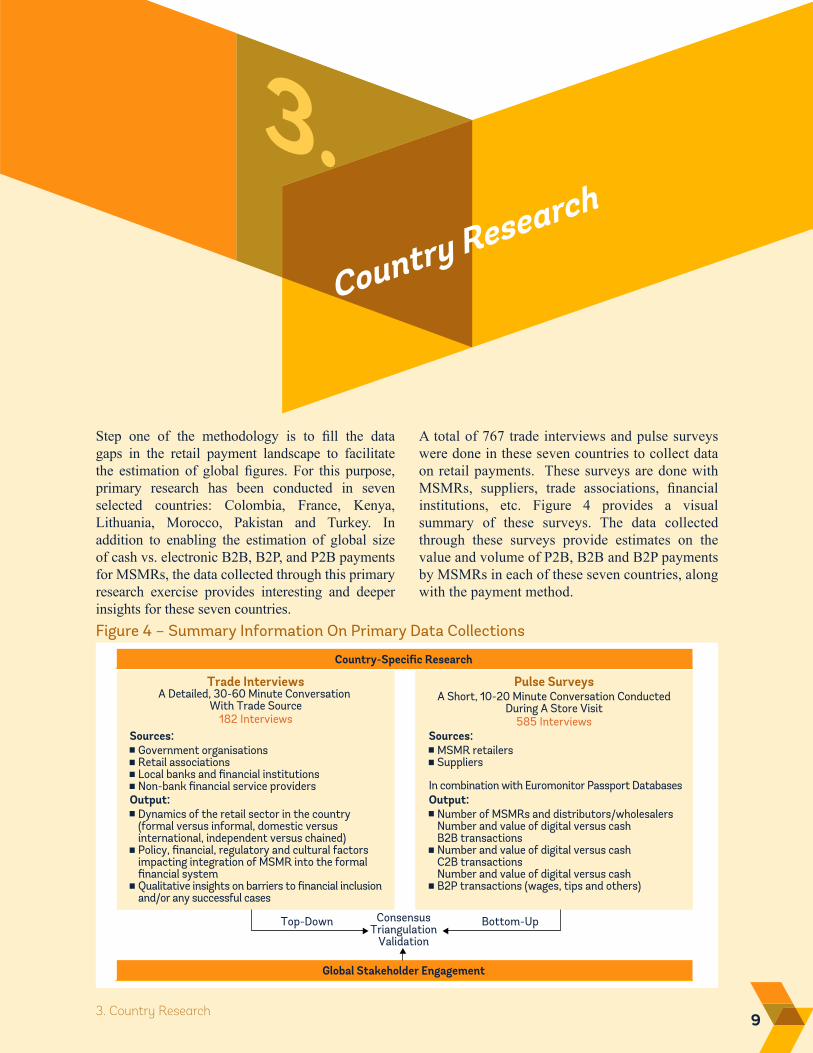
Figure 4 – Summary Information On Primary Data Collections
Country-Specific Research
Pulse SurveysA Short, 10-20 Minute Conversation Conducted
During A Store Visit585 Interviews
Global Stakeholder Engagement
Trade InterviewsA Detailed, 30-60 Minute Conversation
With Trade Source182 Interviews
Bottom-UpTop-Down
Global Stakeholder Engagement
ConsensusTriangulation
Validation
Number of MSMRs and distributors/wholesalersNumber and value of digital versus cash B2B transactionsNumber and value of digital versus cash C2B transactionsNumber and value of digital versus cash B2P transactions (wages, tips and others)
�
�
�
Output:
MSMR retailersSuppliers�
�
Sources:
Dynamics of the retail sector in the country (formal versus informal, domestic versus international, independent versus chained)Policy, financial, regulatory and cultural factors impacting integration of MSMR into the formal financial systemQualitative insights on barriers to financial inclusion and/or any successful cases
�
�
�
Output:
Government organisationsRetail associationsLocal banks and financial institutionsNon-bank financial service providers
�
�
�
�
Sources:
In combination with Euromonitor Passport Databases
Step one of the methodology is to fill the data gaps in the retail payment landscape to facilitate the estimation of global figures. For this purpose, primary research has been conducted in seven selected countries: Colombia, France, Kenya, Lithuania, Morocco, Pakistan and Turkey. In addition to enabling the estimation of global size of cash vs. electronic B2B, B2P, and P2B payments for MSMRs, the data collected through this primary research exercise provides interesting and deeper insights for these seven countries.
A total of 767 trade interviews and pulse surveys were done in these seven countries to collect data on retail payments. These surveys are done with MSMRs, suppliers, trade associations, financial institutions, etc. Figure 4 provides a visual summary of these surveys. The data collected through these surveys provide estimates on the value and volume of P2B, B2B and B2P payments by MSMRs in each of these seven countries, along with the payment method.
10 Cash Vs. Electronic Payments In Small Retailing | Estimating The Global Size
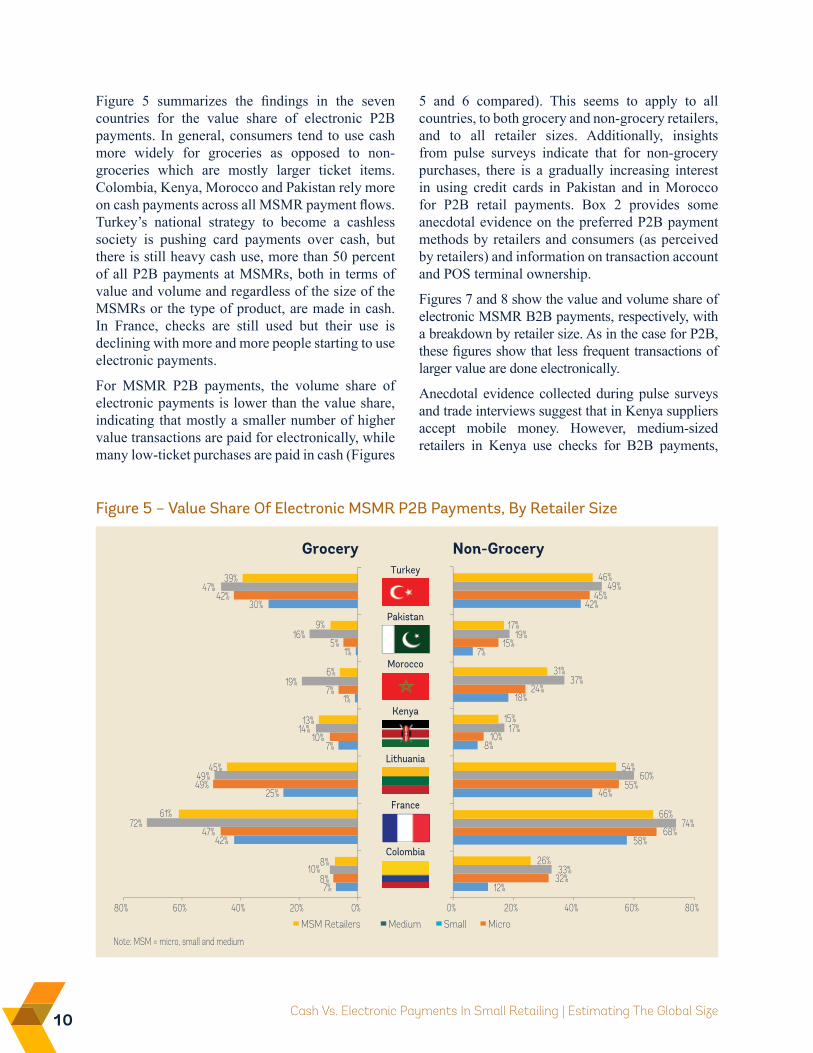
Figure 5 summarizes the findings in the seven countries for the value share of electronic P2B payments. In general, consumers tend to use cash more widely for groceries as opposed to non-groceries which are mostly larger ticket items. Colombia, Kenya, Morocco and Pakistan rely more on cash payments across all MSMR payment flows. Turkey’s national strategy to become a cashless society is pushing card payments over cash, but there is still heavy cash use, more than 50 percent of all P2B payments at MSMRs, both in terms of value and volume and regardless of the size of the MSMRs or the type of product, are made in cash. In France, checks are still used but their use is declining with more and more people starting to use electronic payments.
For MSMR P2B payments, the volume share of electronic payments is lower than the value share, indicating that mostly a smaller number of higher value transactions are paid for electronically, while many low-ticket purchases are paid in cash (Figures
Figure 5 – Value Share Of Electronic MSMR P2B Payments, By Retailer Size
7%
42%
25%
7%
1%
1%
30%
8%
47%
49%
10%
7%
5%
42%
10%
72%
49%
14%
19%
16%
47%
8%
61%
45%
13%
6%
9%
39%
0%20%40%60%80%
12%
58%
46%
8%
18%
7%
42%
32%
68%
55%
10%
24%
15%
45%
33%
74%
60%
17%
37%
19%
49%
26%
66%
54%
15%
31%
17%
46%
0% 20% 40% 60% 80%
Grocery Non-Grocery
MSM Retailers Medium Small Micro
Turkey
Pakistan
Morocco
Lithuania
Kenya
Colombia
France
Note: MSM = micro, small and medium
5 and 6 compared). This seems to apply to all countries, to both grocery and non-grocery retailers, and to all retailer sizes. Additionally, insights from pulse surveys indicate that for non-grocery purchases, there is a gradually increasing interest in using credit cards in Pakistan and in Morocco for P2B retail payments. Box 2 provides some anecdotal evidence on the preferred P2B payment methods by retailers and consumers (as perceived by retailers) and information on transaction account and POS terminal ownership.
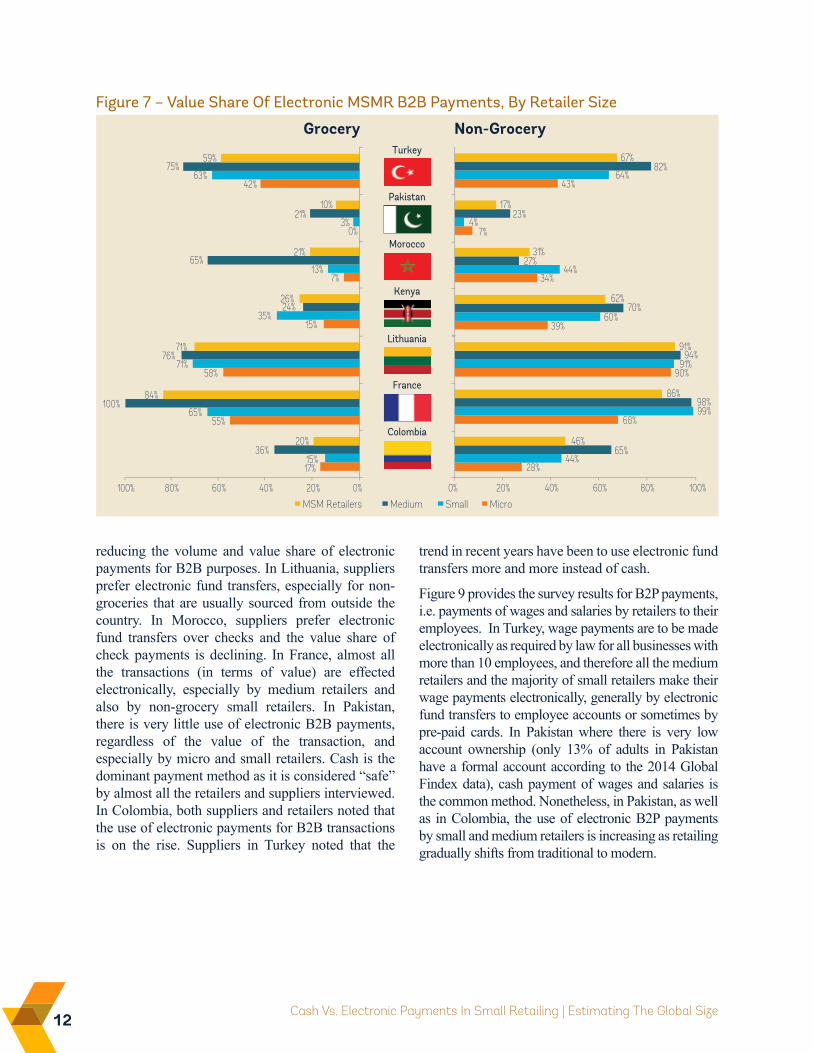
Figures 7 and 8 show the value and volume share of electronic MSMR B2B payments, respectively, with a breakdown by retailer size. As in the case for P2B, these figures show that less frequent transactions of larger value are done electronically.
Anecdotal evidence collected during pulse surveys and trade interviews suggest that in Kenya suppliers accept mobile money. However, medium-sized retailers in Kenya use checks for B2B payments,
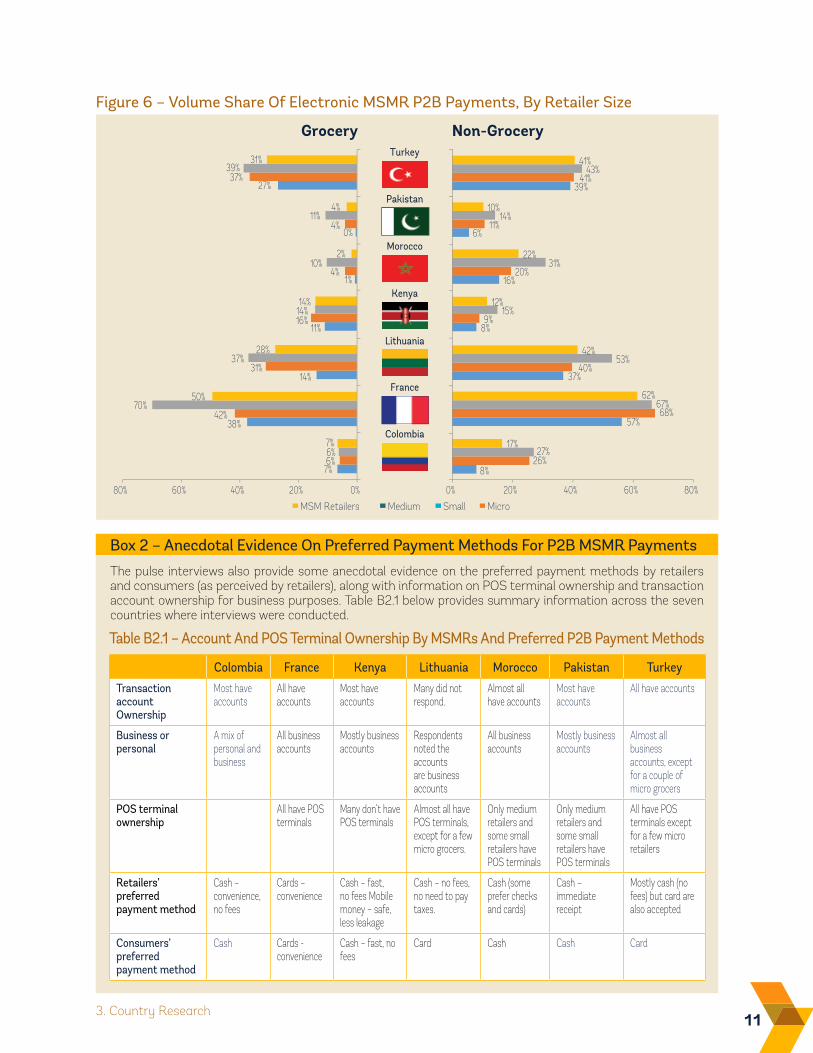
113. Country Research
Figure 6 – Volume Share Of Electronic MSMR P2B Payments, By Retailer Size
7%
38%
14%
11%
1%
0%
27%
6%
42%
31%
16%
4%
4%
37%
6%
70%
37%
14%
10%
11%
39%
7%
50%
28%
14%
2%
4%
31%
68%
8%
57%
37%
8%
16%
6%
39%
26%
40%
9%
20%
11%
41%
27%
67%
53%
15%
31%
14%
43%
17%
62%
42%
12%
22%
10%
41%
0%20%40%60%80% 0% 20% 40% 60% 80%
Grocery Non-Grocery
MSM Retailers Medium Small Micro
Turkey
Pakistan
Morocco
Lithuania
Kenya
Colombia
France
The pulse interviews also provide some anecdotal evidence on the preferred payment methods by retailers and consumers (as perceived by retailers), along with information on POS terminal ownership and transaction account ownership for business purposes. Table B2.1 below provides summary information across the seven countries where interviews were conducted.
Box 2 – Anecdotal Evidence On Preferred Payment Methods For P2B MSMR Payments
Table B2.1 – Account And POS Terminal Ownership By MSMRs And Preferred P2B Payment Methods
Colombia France Kenya Lithuania Morocco Pakistan Turkey
Transaction account Ownership
Most have accounts
All have accounts
Most have accounts
Many did not respond.
Almost all have accounts
Most have accounts
All have accounts
Business or personal
A mix of personal and business
All business accounts
Mostly business accounts
Respondents noted the accounts are business accounts
All business accounts
Mostly business accounts
Almost all business accounts, except for a couple of micro grocers
POS terminal ownership
All have POS terminals
Many don’t have POS terminals
Almost all have POS terminals, except for a few micro grocers.
Only medium retailers and some small retailers have POS terminals
Only medium retailers and some small retailers have POS terminals
All have POS terminals except for a few micro retailers
Retailers’ preferred payment method
Cash – convenience, no fees
Cards – convenience
Cash – fast, no fees Mobile money – safe, less leakage
Cash – no fees, no need to pay taxes.
Cash (some prefer checks and cards)
Cash – immediate receipt
Mostly cash (no fees) but card are also accepted
Consumers’ preferred payment method
Cash Cards - convenience
Cash – fast, no fees
Card Cash Cash Card
12 Cash Vs. Electronic Payments In Small Retailing | Estimating The Global Size
Figure 7 – Value Share Of Electronic MSMR B2B Payments, By Retailer Size
0%20%40%60%80%100% 0% 20% 40% 60% 100%80%
Grocery Non-Grocery
MSM Retailers Medium Small Micro
Turkey
Pakistan
Morocco
Lithuania
Kenya
Colombia
France
17%
55%
58%
15%
7%
0%
42%
15%
65%
71%
35%
13%
3%
63%
36%
100%
76%
24%
65%
21%
75%
20%
84%
71%
26%
21%
10%
59%
28%
68%
90%
39%
34%
7%
43%
44%
99%
91%
60%
44%
4%
64%
65%
98%
94%
70%
27%
23%
82%
46%
86%
91%
62%
31%
17%
67%
reducing the volume and value share of electronic payments for B2B purposes. In Lithuania, suppliers prefer electronic fund transfers, especially for non-groceries that are usually sourced from outside the country. In Morocco, suppliers prefer electronic fund transfers over checks and the value share of check payments is declining. In France, almost all the transactions (in terms of value) are effected electronically, especially by medium retailers and also by non-grocery small retailers. In Pakistan, there is very little use of electronic B2B payments, regardless of the value of the transaction, and especially by micro and small retailers. Cash is the dominant payment method as it is considered “safe” by almost all the retailers and suppliers interviewed. In Colombia, both suppliers and retailers noted that the use of electronic payments for B2B transactions is on the rise. Suppliers in Turkey noted that the
trend in recent years have been to use electronic fund transfers more and more instead of cash.
Figure 9 provides the survey results for B2P payments, i.e. payments of wages and salaries by retailers to their employees. In Turkey, wage payments are to be made electronically as required by law for all businesses with more than 10 employees, and therefore all the medium retailers and the majority of small retailers make their wage payments electronically, generally by electronic fund transfers to employee accounts or sometimes by pre-paid cards. In Pakistan where there is very low account ownership (only 13% of adults in Pakistan have a formal account according to the 2014 Global Findex data), cash payment of wages and salaries is the common method. Nonetheless, in Pakistan, as well as in Colombia, the use of electronic B2P payments by small and medium retailers is increasing as retailing gradually shifts from traditional to modern.
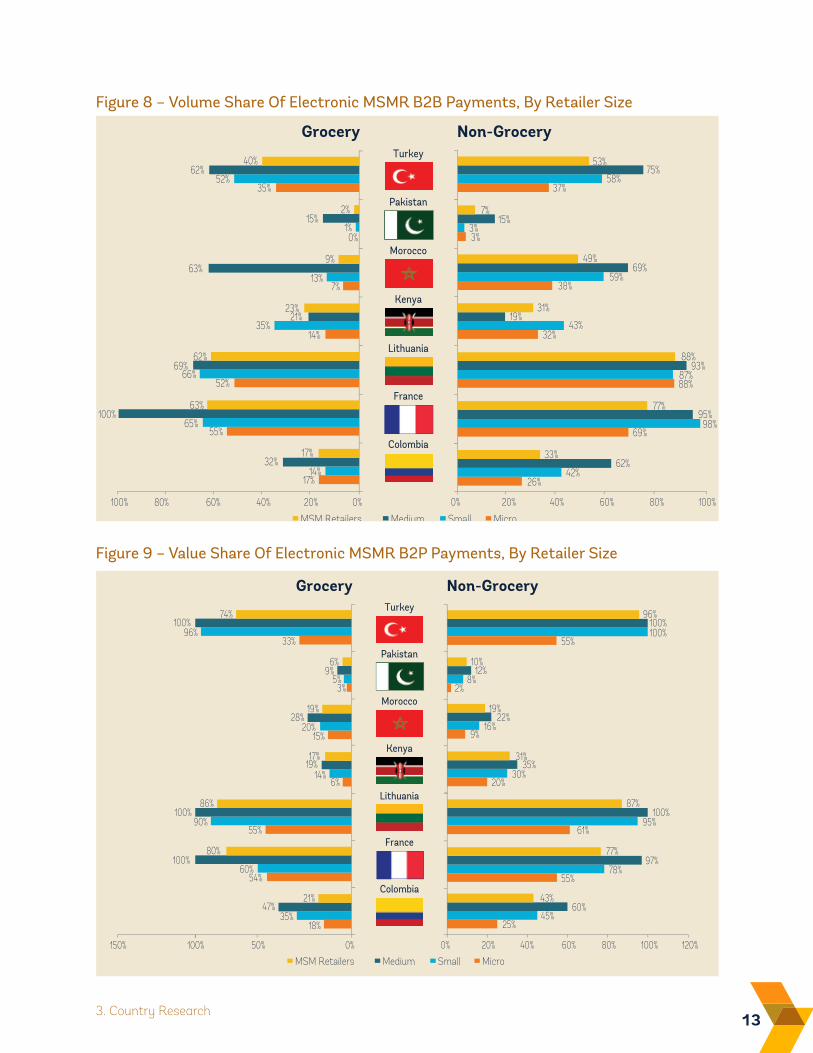
133. Country Research
Figure 9 – Value Share Of Electronic MSMR B2P Payments, By Retailer Size
Figure 8 – Volume Share Of Electronic MSMR B2B Payments, By Retailer Size
0%20%40%60%100% 0% 20% 40% 60% 100%80%
Grocery Non-Grocery
MSM Retailers Medium Small Micro
Turkey
Pakistan
Morocco
Lithuania
Kenya
Colombia
France
17%
55%
52%
14%
7%
0%
35%
14%
65%
66%
35%
13%
1%
52%
32%
100%
69%
21%
63%
15%
62%
17%
63%
62%
23%
9%
2%
40%
80%
26%
69%
88%
32%
38%
3%
37%
42%
98%
87%
43%
59%
3%
58%
62%
95%
93%
19%
69%
15%
75%
33%
77%
88%
31%
49%
7%
53%
0%50%100%150% 0% 20% 40% 80%60% 120%100%
Grocery Non-Grocery
MSM Retailers Medium Small Micro
Turkey
Pakistan
Morocco
Lithuania
Kenya
Colombia
France
25%
55%
61%
20%
9%
2%
55%
45%
78%
95%
30%
16%
8%
100%
60%
97%
100%
35%
22%
12%
100%
43%
77%
87%
31%
19%
10%
96%
18%
54%
55%
6%
15%
3%
33%
35%
60%
90%
14%
20%
5%
96%
47%
100%
100%
19%
28%
9%
100%
21%
80%
86%
17%
19%
6%
74%
14 Cash vs. Electronic Payments In Small Retailing | Estimating the Global Size
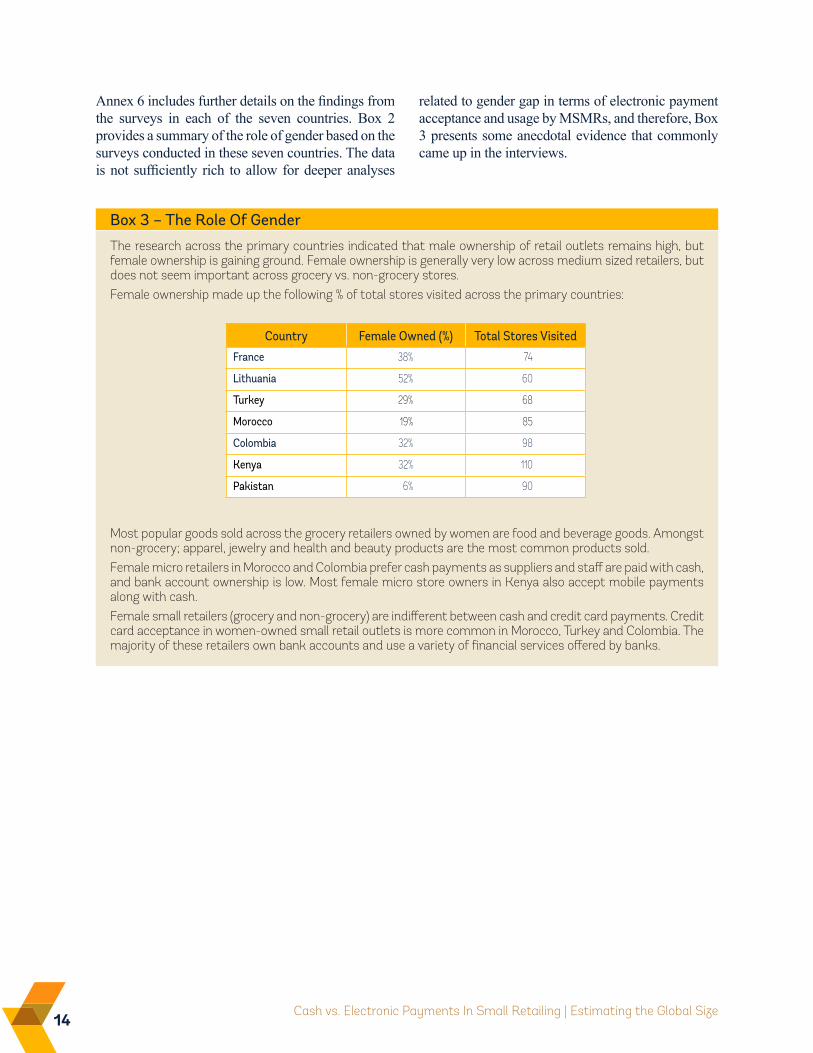
Annex 6 includes further details on the findings from the surveys in each of the seven countries. Box 2 provides a summary of the role of gender based on the surveys conducted in these seven countries. The data is not sufficiently rich to allow for deeper analyses
The research across the primary countries indicated that male ownership of retail outlets remains high, but female ownership is gaining ground. Female ownership is generally very low across medium sized retailers, but does not seem important across grocery vs. non-grocery stores. Female ownership made up the following % of total stores visited across the primary countries:
Most popular goods sold across the grocery retailers owned by women are food and beverage goods. Amongst non-grocery; apparel, jewelry and health and beauty products are the most common products sold. Female micro retailers in Morocco and Colombia prefer cash payments as suppliers and staff are paid with cash, and bank account ownership is low. Most female micro store owners in Kenya also accept mobile payments along with cash.Female small retailers (grocery and non-grocery) are indifferent between cash and credit card payments. Credit card acceptance in women-owned small retail outlets is more common in Morocco, Turkey and Colombia. The majority of these retailers own bank accounts and use a variety of financial services offered by banks.
Box 3 – The Role Of Gender
Country Female Owned (%) Total Stores Visited
France 38% 74
Lithuania 52% 60
Turkey 29% 68
Morocco 19% 85
Colombia 32% 98
Kenya 32% 110
Pakistan 6% 90
related to gender gap in terms of electronic payment acceptance and usage by MSMRs, and therefore, Box 3 presents some anecdotal evidence that commonly came up in the interviews.
154. Global Size of Digital vs Cash Transactions by MSMRs
This section provides an overview of the estimated share of electronic payments across different payment flow types for MSMRs. Global results are based on aggregations of country-level estimates, which are based on simulations using data from seven primary research countries: Colombia, France, Kenya, Lithuania, Morocco, Pakistan and Turkey.
4.1 PERSON-TO-BUSiNESS PAYMENTS FOR MSMRsAccording to the estimation results, developing regions exhibit a higher percentage of paper-based payment transactions (cash and checks) compared to developed markets. The trend is also more prominent with micro retailers where many self-employed firms or mom-and-pop stores tend to shy away from electronic transactions such as debit or credit cards due to extra costs including fees and service charges, lack of awareness, difficulty in accessing financial services and other challenges.
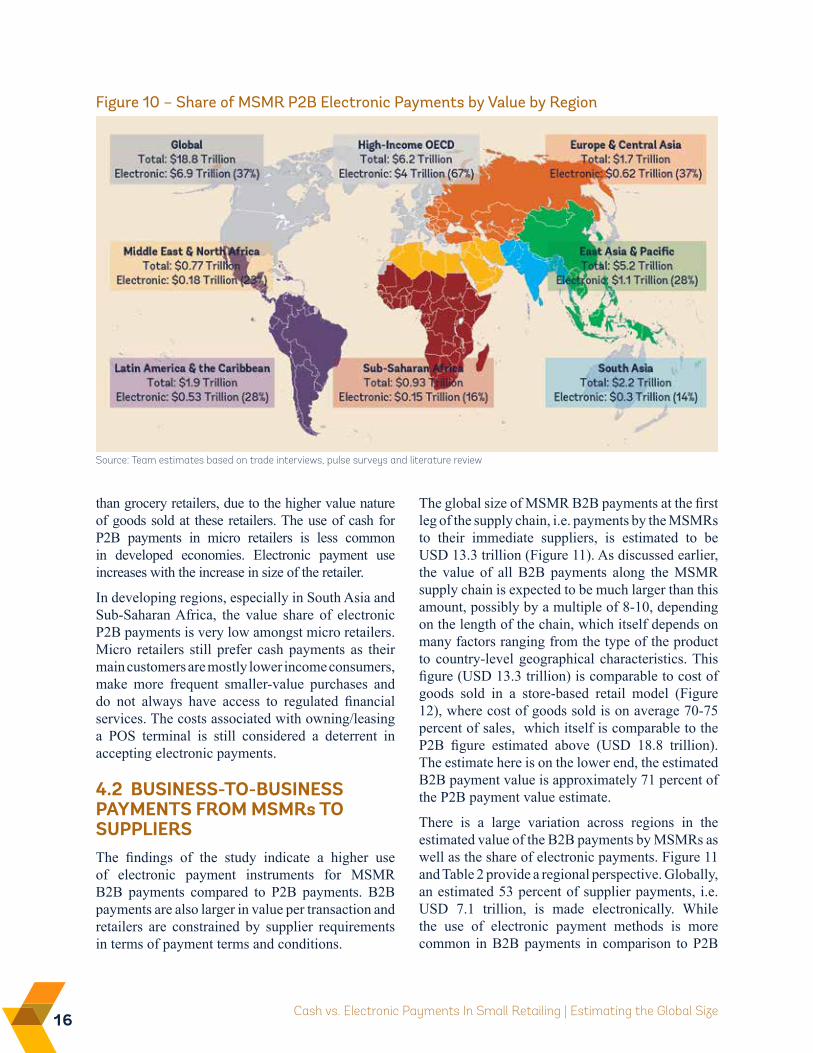
Figure 10 provides consolidated results globally and per region. The global value of MSMR P2B payments is estimated at USD 18.8 trillion. This figure is consistent with other similar studies. For example, the Economist Intelligence Unit (EIU) estimates the 2014 value of total retail sales at USD 17.5 trillion for 58 countries. A new report by Visa (2016) estimates that 43 percent of consumer payments globally are made in cash, which amount
to USD 21 trillion. According to eMarketer, global retail sales was an estimated USD 24 trillion in 2015. A recent report by Citigroup (2016) estimates the global consumer retail payments as USD 23 trillion as of 2014, and forecasts it to reach USD 32 trillion by 2020. And Deloitte (2015) estimates the retail sales of the largest 250 retailers in globally at USD 4.5 trillion.
The share of electronic payments in total MSMR P2B payment value varies largely across countries. While electronic payments are estimated to constitute 37 percent of MSMR P2B payments value globally, this share is as high as 64 percent in high-income OECD economies. Sub-Saharan African economies and South Asian economies have the lowest share by 16 percent and 14 percent, respectively.
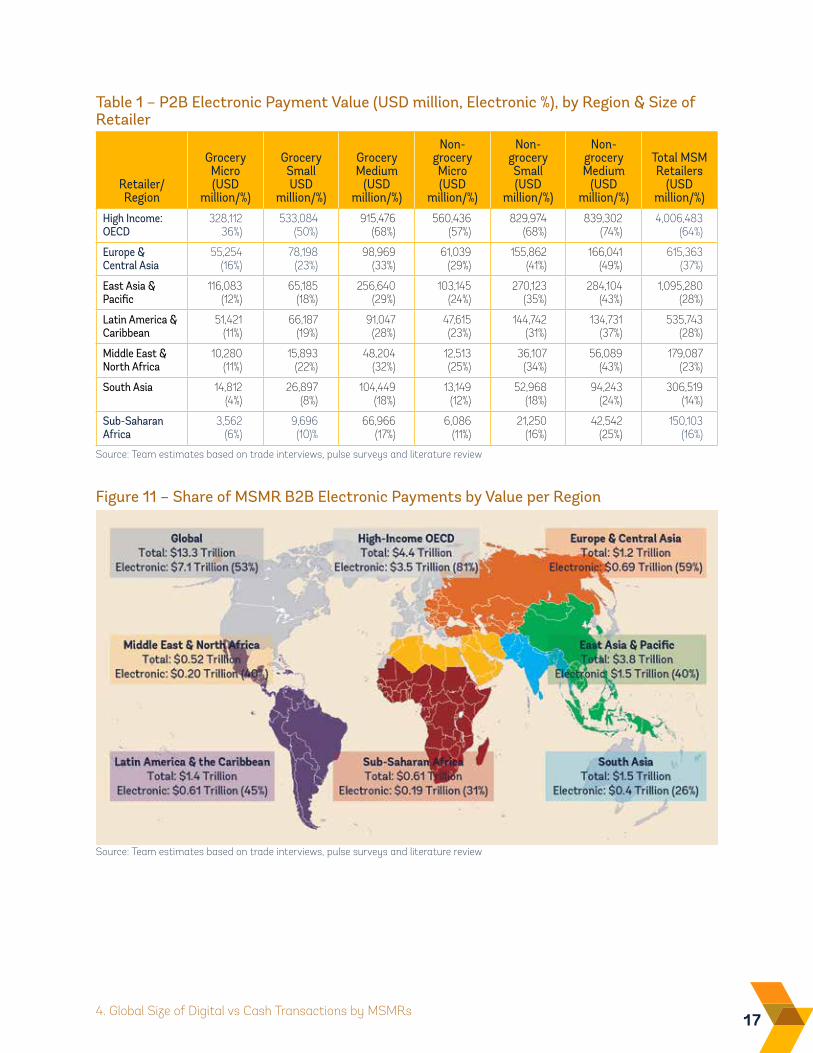
Table 1 shows the estimated electronic payment value and percentage of overall MSM retail value across the regions and retailer type for P2B payments.
The findings show, perhaps not surprisingly, that within each region it is more common to use electronic payments amongst small and medium retailers compared to micro retailers. Electronic payment use increases with the increase in size of the retailer. During the interviews, small and medium retailers cited convenience and safety as reasons for accepting electronic payments. There is a higher use of electronic payments amongst non-grocery retailers
16 Cash vs. Electronic Payments In Small Retailing | Estimating the Global Size
than grocery retailers, due to the higher value nature of goods sold at these retailers. The use of cash for P2B payments in micro retailers is less common in developed economies. Electronic payment use increases with the increase in size of the retailer.
In developing regions, especially in South Asia and Sub-Saharan Africa, the value share of electronic P2B payments is very low amongst micro retailers. Micro retailers still prefer cash payments as their main customers are mostly lower income consumers, make more frequent smaller-value purchases and do not always have access to regulated financial services. The costs associated with owning/leasing a POS terminal is still considered a deterrent in accepting electronic payments.
4.2 BUSiNESS-TO-BUSiNESS PAYMENTS FROM MSMRs TO SUPPLiERSThe findings of the study indicate a higher use of electronic payment instruments for MSMR B2B payments compared to P2B payments. B2B payments are also larger in value per transaction and retailers are constrained by supplier requirements in terms of payment terms and conditions.
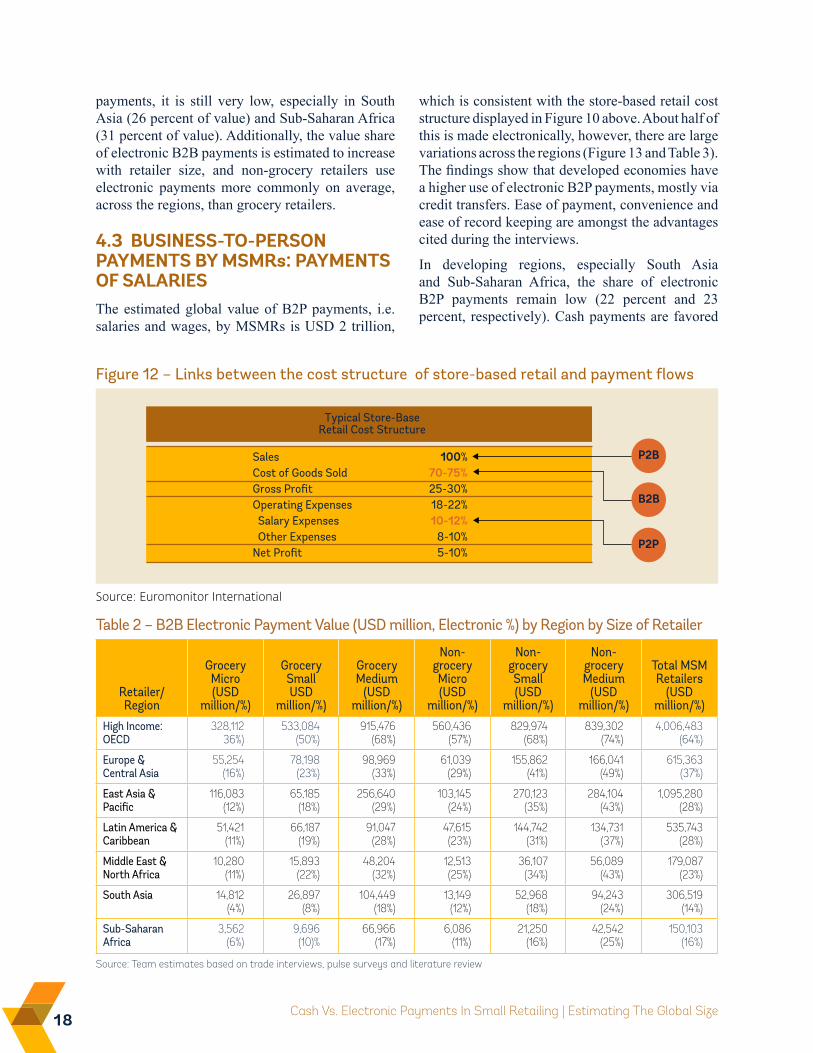
The global size of MSMR B2B payments at the first leg of the supply chain, i.e. payments by the MSMRs to their immediate suppliers, is estimated to be USD 13.3 trillion (Figure 11). As discussed earlier, the value of all B2B payments along the MSMR supply chain is expected to be much larger than this amount, possibly by a multiple of 8-10, depending on the length of the chain, which itself depends on many factors ranging from the type of the product to country-level geographical characteristics. This figure (USD 13.3 trillion) is comparable to cost of goods sold in a store-based retail model (Figure 12), where cost of goods sold is on average 70-75 percent of sales, which itself is comparable to the P2B figure estimated above (USD 18.8 trillion). The estimate here is on the lower end, the estimated B2B payment value is approximately 71 percent of the P2B payment value estimate.
There is a large variation across regions in the estimated value of the B2B payments by MSMRs as well as the share of electronic payments. Figure 11 and Table 2 provide a regional perspective. Globally, an estimated 53 percent of supplier payments, i.e. USD 7.1 trillion, is made electronically. While the use of electronic payment methods is more common in B2B payments in comparison to P2B
Figure 10 – Share of MSMR P2B Electronic Payments by Value by Region
Source: Team estimates based on trade interviews, pulse surveys and literature review
174. Global Size of Digital vs Cash Transactions by MSMRs
Table 1 – P2B Electronic Payment Value (USD million, Electronic %), by Region & Size of Retailer
P=Person, B=Business, G=Government
Retailer/Region
Grocery Micro (USD
million/%)
Grocery Small USD
million/%)
Grocery Medium
(USD million/%)
Non-grocery Micro (USD
million/%)
Non-grocery Small (USD
million/%)
Non-grocery Medium
(USD million/%)
Total MSM Retailers
(USD million/%)
High Income: OECD
328,112 36%)
533,084 (50%)
915,476 (68%)
560,436 (57%)
829,974 (68%)
839,302 (74%)
4,006,483 (64%)
Europe & Central Asia
55,254 (16%)
78,198 (23%)
98,969 (33%)
61,039 (29%)
155,862 (41%)
166,041 (49%)
615,363 (37%)
East Asia & Pacific
116,083 (12%)
65,185 (18%)
256,640 (29%)
103,145 (24%)
270,123 (35%)
284,104 (43%)
1,095,280 (28%)
Latin America & Caribbean
51,421 (11%)
66,187 (19%)
91,047 (28%)
47,615 (23%)
144,742 (31%)
134,731 (37%)
535,743 (28%)
Middle East & North Africa
10,280 (11%)
15,893 (22%)
48,204 (32%)
12,513 (25%)
36,107 (34%)
56,089 (43%)
179,087 (23%)
South Asia 14,812 (4%)
26,897 (8%)
104,449 (18%)
13,149 (12%)
52,968 (18%)
94,243 (24%)
306,519 (14%)
Sub-Saharan Africa
3,562 (6%)
9,696 (10)%
66,966 (17%)
6,086 (11%)
21,250 (16%)
42,542 (25%)
150,103 (16%)
Source: Team estimates based on trade interviews, pulse surveys and literature review
Figure 11 – Share of MSMR B2B Electronic Payments by Value per Region
Source: Team estimates based on trade interviews, pulse surveys and literature review
18 Cash Vs. Electronic Payments In Small Retailing | Estimating The Global Size
payments, it is still very low, especially in South Asia (26 percent of value) and Sub-Saharan Africa (31 percent of value). Additionally, the value share of electronic B2B payments is estimated to increase with retailer size, and non-grocery retailers use electronic payments more commonly on average, across the regions, than grocery retailers.
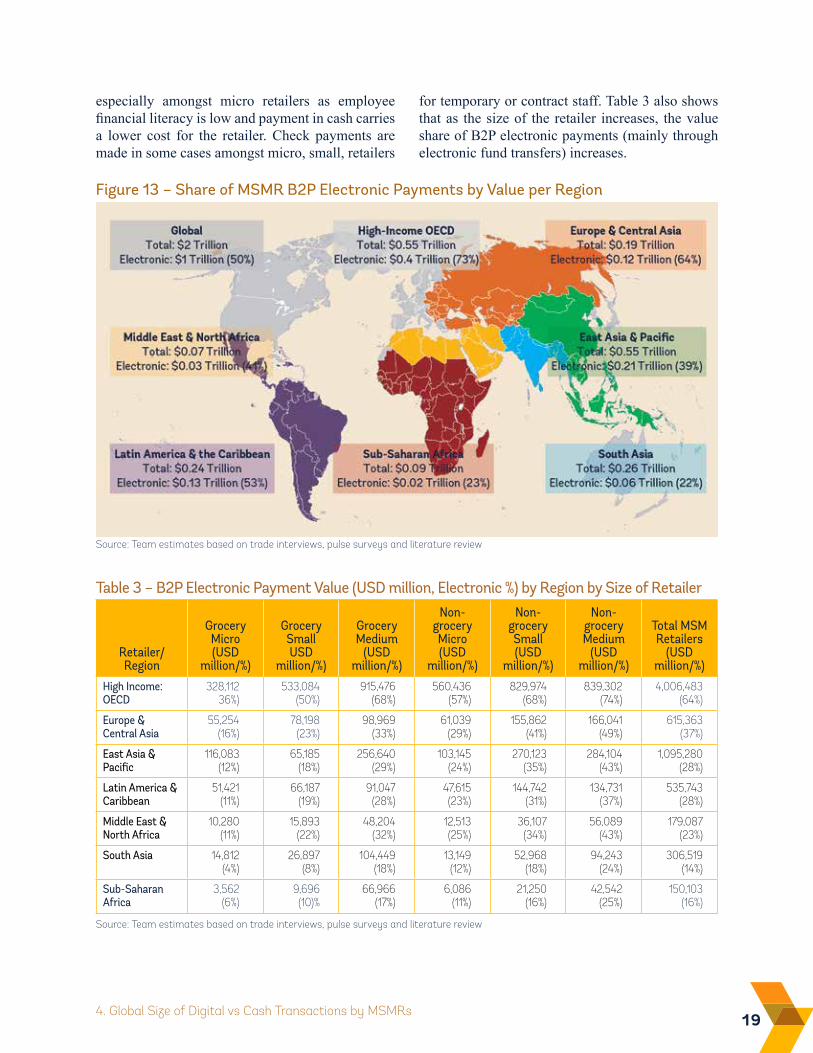
4.3 BUSiNESS-TO-PERSON PAYMENTS BY MSMRs: PAYMENTS OF SALARiESThe estimated global value of B2P payments, i.e. salaries and wages, by MSMRs is USD 2 trillion,
which is consistent with the store-based retail cost structure displayed in Figure 10 above. About half of this is made electronically, however, there are large variations across the regions (Figure 13 and Table 3). The findings show that developed economies have a higher use of electronic B2P payments, mostly via credit transfers. Ease of payment, convenience and ease of record keeping are amongst the advantages cited during the interviews.
In developing regions, especially South Asia and Sub-Saharan Africa, the share of electronic B2P payments remain low (22 percent and 23 percent, respectively). Cash payments are favored
Table 2 – B2B Electronic Payment Value (USD million, Electronic %) by Region by Size of Retailer
P=Person, B=Business, G=Government
Retailer/Region
Grocery Micro (USD
million/%)
Grocery Small USD
million/%)
Grocery Medium
(USD million/%)
Non-grocery Micro (USD
million/%)
Non-grocery Small (USD
million/%)
Non-grocery Medium
(USD million/%)
Total MSM Retailers
(USD million/%)
High Income: OECD
328,112 36%)
533,084 (50%)
915,476 (68%)
560,436 (57%)
829,974 (68%)
839,302 (74%)
4,006,483 (64%)
Europe & Central Asia
55,254 (16%)
78,198 (23%)
98,969 (33%)
61,039 (29%)
155,862 (41%)
166,041 (49%)
615,363 (37%)
East Asia & Pacific
116,083 (12%)
65,185 (18%)
256,640 (29%)
103,145 (24%)
270,123 (35%)
284,104 (43%)
1,095,280 (28%)
Latin America & Caribbean
51,421 (11%)
66,187 (19%)
91,047 (28%)
47,615 (23%)
144,742 (31%)
134,731 (37%)
535,743 (28%)
Middle East & North Africa
10,280 (11%)
15,893 (22%)
48,204 (32%)
12,513 (25%)
36,107 (34%)
56,089 (43%)
179,087 (23%)
South Asia 14,812 (4%)
26,897 (8%)
104,449 (18%)
13,149 (12%)
52,968 (18%)
94,243 (24%)
306,519 (14%)
Sub-Saharan Africa
3,562 (6%)
9,696 (10)%
66,966 (17%)
6,086 (11%)
21,250 (16%)
42,542 (25%)
150,103 (16%)
Source: Team estimates based on trade interviews, pulse surveys and literature review
Figure 12 – Links between the cost structure of store-based retail and payment flows
Source: Euromonitor International
SalesCost of Goods SoldGross ProfitOperating Expenses Salary Expenses Other ExpensesNet Profit
100%70-75%25-30%18-22%10-12%
8-10%5-10%
Typical Store-BaseRetail Cost Structure
B2B
P2P
P2B
194. Global Size of Digital vs Cash Transactions by MSMRs
especially amongst micro retailers as employee financial literacy is low and payment in cash carries a lower cost for the retailer. Check payments are made in some cases amongst micro, small, retailers
Table 3 – B2P Electronic Payment Value (USD million, Electronic %) by Region by Size of Retailer
Retailer/Region
Grocery Micro (USD
million/%)
Grocery Small USD
million/%)
Grocery Medium
(USD million/%)
Non-grocery Micro (USD
million/%)
Non-grocery Small (USD
million/%)
Non-grocery Medium
(USD million/%)
Total MSM Retailers
(USD million/%)
High Income: OECD
328,112 36%)
533,084 (50%)
915,476 (68%)
560,436 (57%)
829,974 (68%)
839,302 (74%)
4,006,483 (64%)
Europe & Central Asia
55,254 (16%)
78,198 (23%)
98,969 (33%)
61,039 (29%)
155,862 (41%)
166,041 (49%)
615,363 (37%)
East Asia & Pacific
116,083 (12%)
65,185 (18%)
256,640 (29%)
103,145 (24%)
270,123 (35%)
284,104 (43%)
1,095,280 (28%)
Latin America & Caribbean
51,421 (11%)
66,187 (19%)
91,047 (28%)
47,615 (23%)
144,742 (31%)
134,731 (37%)
535,743 (28%)
Middle East & North Africa
10,280 (11%)
15,893 (22%)
48,204 (32%)
12,513 (25%)
36,107 (34%)
56,089 (43%)
179,087 (23%)
South Asia 14,812 (4%)
26,897 (8%)
104,449 (18%)
13,149 (12%)
52,968 (18%)
94,243 (24%)
306,519 (14%)
Sub-Saharan Africa
3,562 (6%)
9,696 (10)%
66,966 (17%)
6,086 (11%)
21,250 (16%)
42,542 (25%)
150,103 (16%)
Source: Team estimates based on trade interviews, pulse surveys and literature review
Figure 13 – Share of MSMR B2P Electronic Payments by Value per Region
Source: Team estimates based on trade interviews, pulse surveys and literature review
for temporary or contract staff. Table 3 also shows that as the size of the retailer increases, the value share of B2P electronic payments (mainly through electronic fund transfers) increases.

21Annexes
Annexes
AnnexesA1. Glossary 22
A2. Euromonitor Passport Databases 24
A3. List of Economies Used in the Analyses 25
A4. Methodology – Detailed Descriptions 26
A4.1. Cluster Analysis: Details on Methodology 26
A4.2. Primary Research: Details on Methodology 28
A4.3. Modeling and Simulations: Details on Methodology 31
A5. Discussion Guides and Questionnaires 34
A5.1. Trade Interviews 34
A5.2. Pulse Interviews 35
A6. Country Research Findings 39
1. Colombia 39
2. France 47
3. Kenya 55
4. Lithuania 63
5. Morocco 70
6. Pakistan 78
7. Turkey 86
22 Cash vs. Electronic Payments In Small Retailing | Estimating the Global Size
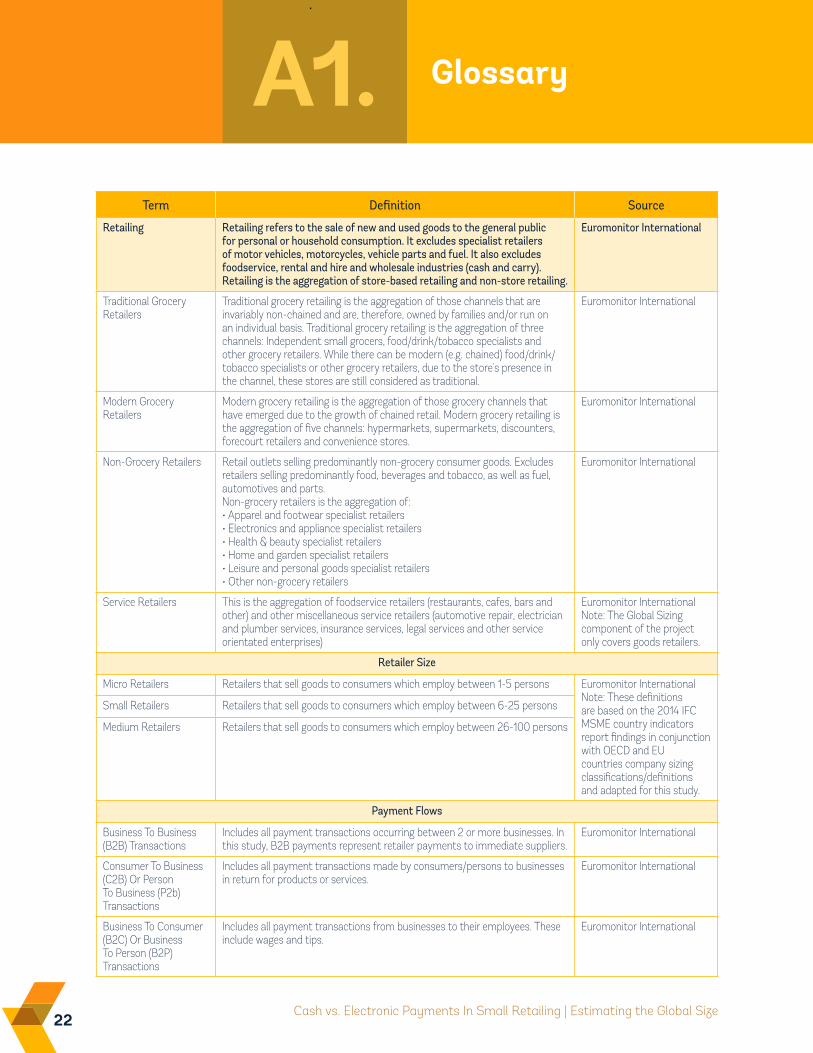
GlossaryA1.Term Definition Source
Retailing Retailing refers to the sale of new and used goods to the general public for personal or household consumption. It excludes specialist retailers of motor vehicles, motorcycles, vehicle parts and fuel. It also excludes foodservice, rental and hire and wholesale industries (cash and carry). Retailing is the aggregation of store-based retailing and non-store retailing.
Euromonitor International
Traditional Grocery Retailers
Traditional grocery retailing is the aggregation of those channels that are invariably non-chained and are, therefore, owned by families and/or run on an individual basis. Traditional grocery retailing is the aggregation of three channels: Independent small grocers, food/drink/tobacco specialists and other grocery retailers. While there can be modern (e.g. chained) food/drink/tobacco specialists or other grocery retailers, due to the store's presence in the channel, these stores are still considered as traditional.
Euromonitor International
Modern Grocery Retailers
Modern grocery retailing is the aggregation of those grocery channels that have emerged due to the growth of chained retail. Modern grocery retailing is the aggregation of five channels: hypermarkets, supermarkets, discounters, forecourt retailers and convenience stores.
Euromonitor International
Non-Grocery Retailers Retail outlets selling predominantly non-grocery consumer goods. Excludes retailers selling predominantly food, beverages and tobacco, as well as fuel, automotives and parts. Non-grocery retailers is the aggregation of: • Apparel and footwear specialist retailers• Electronics and appliance specialist retailers• Health & beauty specialist retailers• Home and garden specialist retailers• Leisure and personal goods specialist retailers• Other non-grocery retailers
Euromonitor International
Service Retailers This is the aggregation of foodservice retailers (restaurants, cafes, bars and other) and other miscellaneous service retailers (automotive repair, electrician and plumber services, insurance services, legal services and other service orientated enterprises)
Euromonitor InternationalNote: The Global Sizing component of the project only covers goods retailers.
Retailer Size
Micro Retailers Retailers that sell goods to consumers which employ between 1-5 persons Euromonitor InternationalNote: These definitions are based on the 2014 IFC MSME country indicators report findings in conjunction with OECD and EU countries company sizing classifications/definitions and adapted for this study.
Small Retailers Retailers that sell goods to consumers which employ between 6-25 persons
Medium Retailers Retailers that sell goods to consumers which employ between 26-100 persons
Payment Flows
Business To Business (B2B) Transactions
Includes all payment transactions occurring between 2 or more businesses. In this study, B2B payments represent retailer payments to immediate suppliers.
Euromonitor International
Consumer To Business (C2B) Or Person To Business (P2b) Transactions
Includes all payment transactions made by consumers/persons to businesses in return for products or services.
Euromonitor International
Business To Consumer (B2C) Or Business To Person (B2P) Transactions
Includes all payment transactions from businesses to their employees. These include wages and tips.
Euromonitor International
23Annexes: A1. Glossary 23
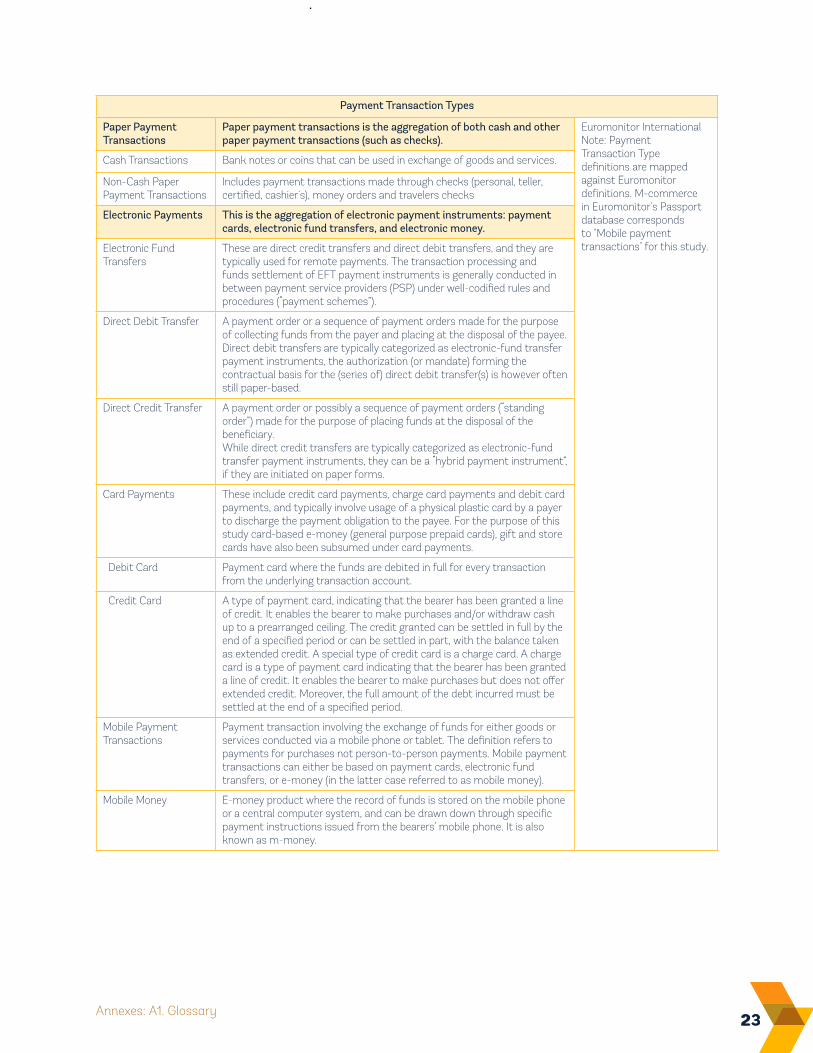
Payment Transaction Types
Paper Payment Transactions
Paper payment transactions is the aggregation of both cash and other paper payment transactions (such as checks).
Euromonitor InternationalNote: Payment Transaction Type definitions are mapped against Euromonitor definitions. M-commerce in Euromonitor's Passport database corresponds to "Mobile payment transactions" for this study.
Cash Transactions Bank notes or coins that can be used in exchange of goods and services.
Non-Cash Paper Payment Transactions
Includes payment transactions made through checks (personal, teller, certified, cashier's), money orders and travelers checks
Electronic Payments This is the aggregation of electronic payment instruments: payment cards, electronic fund transfers, and electronic money.
Electronic Fund Transfers
These are direct credit transfers and direct debit transfers, and they are typically used for remote payments. The transaction processing and funds settlement of EFT payment instruments is generally conducted in between payment service providers (PSP) under well-codified rules and procedures (“payment schemes”).
Direct Debit Transfer A payment order or a sequence of payment orders made for the purpose of collecting funds from the payer and placing at the disposal of the payee. Direct debit transfers are typically categorized as electronic-fund transfer payment instruments, the authorization (or mandate) forming the contractual basis for the (series of) direct debit transfer(s) is however often still paper-based.
Direct Credit Transfer A payment order or possibly a sequence of payment orders (“standing order”) made for the purpose of placing funds at the disposal of the beneficiary. While direct credit transfers are typically categorized as electronic-fund transfer payment instruments, they can be a “hybrid payment instrument”, if they are initiated on paper forms.
Card Payments These include credit card payments, charge card payments and debit card payments, and typically involve usage of a physical plastic card by a payer to discharge the payment obligation to the payee. For the purpose of this study card-based e-money (general purpose prepaid cards), gift and store cards have also been subsumed under card payments.
Debit Card Payment card where the funds are debited in full for every transaction from the underlying transaction account.
Credit Card A type of payment card, indicating that the bearer has been granted a line of credit. It enables the bearer to make purchases and/or withdraw cash up to a prearranged ceiling. The credit granted can be settled in full by the end of a specified period or can be settled in part, with the balance taken as extended credit. A special type of credit card is a charge card. A charge card is a type of payment card indicating that the bearer has been granted a line of credit. It enables the bearer to make purchases but does not offer extended credit. Moreover, the full amount of the debt incurred must be settled at the end of a specified period.
Mobile Payment Transactions
Payment transaction involving the exchange of funds for either goods or services conducted via a mobile phone or tablet. The definition refers to payments for purchases not person-to-person payments. Mobile payment transactions can either be based on payment cards, electronic fund transfers, or e-money (in the latter case referred to as mobile money).
Mobile Money E-money product where the record of funds is stored on the mobile phone or a central computer system, and can be drawn down through specific payment instructions issued from the bearers’ mobile phone. It is also known as m-money.
24 Cash vs. Electronic Payments In Small Retailing | Estimating the Global Size
Euromonitor Passport DatabasesA2.
The Passport database data on consumer finance, retail, industrials, and numerous other categories of packaged consumer goods is used in this research. Key Euromonitor databases used in this project include:
• Passport: Consumer Finance: Euromonitor’s Passport consumer finance database originates from annual on-the-ground research in 46 core markets. Indicators in this database include estimates of P2B retail transactions value made electronically and by paper.
• Passport: Retail: Euromonitor’s Passport retail database has data on 80 countries. Estimates for each country are updated annually, ensuring comparability across countries. Indicators in this database include total retail market size, total number of outlets, and market shares of the main players. Data are broken down into
grocery, non-grocery and over 18 subcategories of specialist retailers. This is further segmented into traditional and modern retailers for all 80 markets.
• Passport: Industrial: Euromonitor’s This database is built up using input/output tables for 18 core and secondary markets. Included in this database for each industry is a breakdown by number of firms in each employment category. The database also includes analysis of the buyers and suppliers for up to 177 industries including retail and wholesale providing a picture of the industry’s supply chain.
• Passport: Countries and Consumers: Euromonitor’s Countries and Consumer database includes secondary data taken from hundreds of sources globally. This data is standardized to allow comparisons to be made.
25Annexes: A3. List Of Economies Used In The Analyses
List Of Economies Used in The AnalysesA3.
Afghanistan Ecuador Lesotho RomaniaAlbania Egypt, arab Rep. Liberia Russian FederationAlgeria El Salvador Libya RwandaAngola Equatorial Guinea Liechtenstein Saudi ArabiaArgentina Eritrea Lithuania SenegalArmenia Estonia Luxembourg SerbiaAustralia Ethiopia Macedonia, FYR Sierra LeoneAustria Fiji Madagascar SingaporeAzerbaijan Finland Malawi Slovak RepublicBahamas, The France Malaysia SloveniaBahrain Gabon Mali SomaliaBangladesh Gambia, The Malta South AfricaBelarus Georgia Mauritania South KoreaBelgium Germany Mauritius South SudanBenin Ghana Mexico SpainBermuda Greece Moldova Sri LankaBhutan Guatemala Monaco SudanBolivia Guinea Mongolia SwazilandBosnia and Herzegovina Haiti Montenegro SwedenBotswana Honduras Morocco SwitzerlandBrazil Hong Kong SAR, China Mozambique Syrian Arab RepublicBrunei Hungary Myanmar Taiwan, ChinaBulgaria Iceland Namibia TajikistanBurkina Faso India Nepal TanzaniaBurundi Indonesia Netherlands ThailandCambodia Iran, Islamic Rep. New Zealand TogoCameroon Iraq Nicaragua Trinidad and TobagoCanada Ireland Niger TunisiaCentral African Republic Israel Nigeria TurkeyChad Italy North Korea TurkmenistanChile Jamaica Norway UgandaChina Japan Oman UkraineColombia Jordan Pakistan United Arab EmiratesCongo, Dem. Rep. Kazakhstan Panama United KingdomCongo, Rep. Kenya Paraguay United StatesCosta Rica Korea, Dem. People’s Rep. Peru UruguayCöte d'Ivoire Korea, Rep. Philippines UzbekistanCroatia Kosovo Poland Venezuela, RBCuba Kuwait Portugal VietnamCyprus Kyrgyzstan Puerto Rico Yemen, Rep.Czech Republic Lao, PDR Qatar ZambiaDenmark Latvia Reunion ZimbabweDominican Republic Lebanon
26 Cash vs. Electronic Payments In Small Retailing | Estimating the Global Size
Methodology – Detailed DescriptionsA4.
A4.1 CLUSTER ANALYSiS: DETAiLS ON METHODOLOGYThis annex summarizes how the cluster analysis was performed. The variables and the rationale for using them are described, as well as the clustering methodology and output is presented.
vARiABLES iNCLUDED iN THE CLUSTER ANALYSiS
Five variables are included in the analysis. The variables are selected to account for variation across countries in terms of the retail sector and financial inclusion. The definitions of these variables along with the sources are listed below.15
1. Retail sales per capita: (USD , nominal, converted using 2014 exchange rates, source: Euromonitor)
• Sales per capita of new and used goods to the general public for personal or household consumption.
• Excludes specialist retailers of motor vehicles, motorcycles, vehicle parts, fuel; and foodservice, rental and hire and wholesale industries (Cash and Carry). Sales value excluding or including VAT/Sales Tax.
• Retailing is the aggregation of store-based and non-store retailing. Retailing excludes the informal retail sector. Informal retailing is retail trade which is not declared to the tax authorities, and encompasses (a) sales generated by unregistered and unlicensed retailers, i.e. retailers operating illegally, and (b) any proportion of sales generated by a registered and licensed retailer which is not declared to the tax authorities. Unregistered and unlicensed retailers operate predominantly (although not exclusively) as street hawkers or operate open market stalls, as these channels are harder for the authorities to monitor than
permanent outlets. Activities in the “black market”, i.e. those refer to trade in illegal, counterfeit or stolen merchandise, are included within our definition of informal retailing. Activities in the “grey market”, i.e. those refer to trade in legal merchandise that is sold through unauthorized channels–for example cigarettes bought legally in another country, legally imported, but sold at lower prices than in authorized channels–will be included as informal retailing if no tax is paid on sale by the retailer. However if the retailer pays tax–for example on cigarettes bought legally in another country but sold at a lower price than standard–the sale is included within formal retailing.
• In relation to click and collect purchases (i.e. where purchases are made over the internet but picked up at store) where the sales data is attributed depends on where the payment is made: If payment is made in store, then the sale is included in store-based sales. If payment is made over the internet, then the sale is included in internet retailing.
• Retail sales per capita provides an indication of the income that the population spends on retail purchases.
2. Share of modern grocery retailers in grocery retailing: (%, based on local currency prices at current prices, source: Euromonitor)
• Modern grocery retailing is the aggregation of those grocery channels that have emerged alongside the growth of chained retail: Hypermarkets, Supermarkets, Discounters, Forecourt Retailers and Convenience Stores. While there can be traditional (i.e. non-chained) supermarkets or forecourt retailers, e.g., due to the store's presence in the channel, these stores are still considered as modern in Euromonitor Passport Databases.
27Annexes: A4. Methodology – Detailed Descriptions
• This variable provides an indication of the retail sector development of a country.
3. Urban population: (% of total population, source: UN)
• Urban population is defined as population of areas defined as urban in each country and reported to the UN. The infrastructure, types of houses and dwellings in agglomerations, density, landscapes, etc., are very different between the countries, and thus it is impossible to have a uniform definition. Urban population by city refers to population of “city proper”, or a "locality with legally fixed boundaries and an administratively recognized urban status that is usually characterized by some form of local government”.
• Higher urbanization, particularly in developing countries, is expected to facilitate ownership of a bank account and use of non-paper payments.
4. Share of paper payments in consumer payment transactions: (%, source: Euromonitor)
• Consumer payment transactions is the sum of card payment transactions, cash transactions, other paper payment transactions and electronic transactions (excluding commercial). Paper payment transactions contains both cash and other paper payment transactions such as checks (personal, teller, certified, cashier's), money orders and travelers’ checks. Electronic transactions include electronic fund transfers, and examples of electronic fund transfers include direct debit and direct credit transfers.
• Measures financial system development and consumer cultural preferences over paper vs. electronic payments
5. Adults with a formal account at a financial institution, poorest 40%: (%, source: World Bank Global Findex)
• Denotes the percentage of respondents in the bottom 40 percent of income earners, aged 15+, with an account (self or together
with someone else) at a bank, credit union, another financial institution (e.g., cooperative, microfinance institution), or the post office (if applicable) including respondents who reported having a debit card.
CLUSTER METHODOLOGY
K-Means Clustering:The objective of this method is to seek items in the same cluster that would be as similar as possible and different clusters would be as dissimilar as possible. This method aims to partition the countries into k clusters in which each observation belongs to the cluster with the nearest mean (i.e. cluster center or mean), serving as a prototype of the cluster. The methodology used employs an iterative algorithm to classify an observation into a cluster by minimizing the squared distance of each observation from the cluster centers.
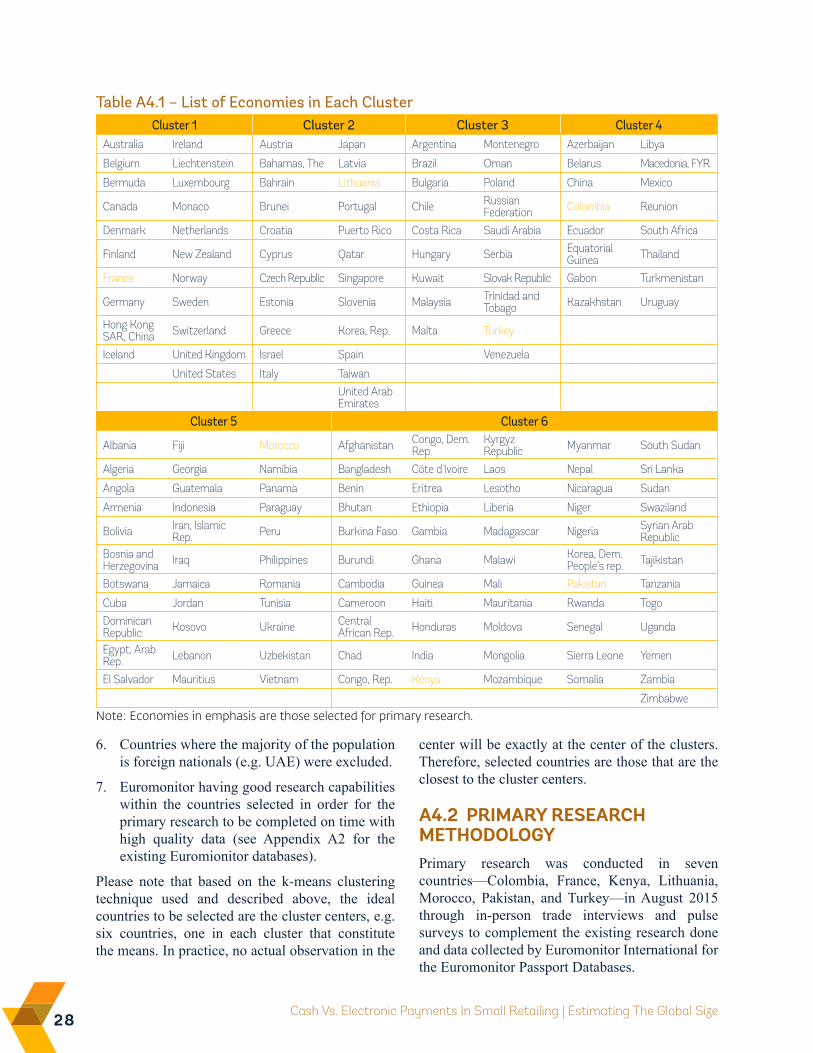
Using the variables above for 168 developed and developing economies, the countries are grouped into six clusters. Small island countries were not included in the analysis due to low spend and low population. Table A4.1 lists the countries in each cluster.
Country Selection:
The next step is to choose one country per cluster to conduct the primary research in. The selection criteria used for this purpose are:
1. Whether the country is researched across Euromonitor’s Retail and Consumer Finance Passport databases as opposed to modeled, i.e. forecasted. This ensures a solid starting point in terms of data availability.
2. Geographical location in order to have a representative selection across cluster groupings
3. Whether the country had good data availability across the variables to be used for the purposes of cluster analysis and also for the modeling stage to follow.
4. Potential for success in collecting data during primary research to be used during the modeling phase.
5. Countries too big in geographic size and overall population to complete the research in a timely manner within the project timeline are excluded (e.g. Brazil, China, India, Nigeria).
28 Cash Vs. Electronic Payments In Small Retailing | Estimating The Global Size
6. Countries where the majority of the population is foreign nationals (e.g. UAE) were excluded.
7. Euromonitor having good research capabilities within the countries selected in order for the primary research to be completed on time with high quality data (see Appendix A2 for the existing Euromionitor databases).
Please note that based on the k-means clustering technique used and described above, the ideal countries to be selected are the cluster centers, e.g. six countries, one in each cluster that constitute the means. In practice, no actual observation in the
center will be exactly at the center of the clusters. Therefore, selected countries are those that are the closest to the cluster centers.
A4.2 PRiMARY RESEARCH METHODOLOGYPrimary research was conducted in seven countries—Colombia, France, Kenya, Lithuania, Morocco, Pakistan, and Turkey—in August 2015 through in-person trade interviews and pulse surveys to complement the existing research done and data collected by Euromonitor International for the Euromonitor Passport Databases.
Cluster 1 Cluster 2 Cluster 3 Cluster 4Australia Ireland Austria Japan Argentina Montenegro Azerbaijan Libya
Belgium Liechtenstein Bahamas, The Latvia Brazil Oman Belarus Macedonia, FYR
Bermuda Luxembourg Bahrain Lithuania Bulgaria Poland China Mexico
Canada Monaco Brunei Portugal Chile Russian Federation Colombia Reunion
Denmark Netherlands Croatia Puerto Rico Costa Rica Saudi Arabia Ecuador South Africa
Finland New Zealand Cyprus Qatar Hungary Serbia Equatorial Guinea Thailand
France Norway Czech Republic Singapore Kuwait Slovak Republic Gabon Turkmenistan
Germany Sweden Estonia Slovenia Malaysia Trinidad and Tobago Kazakhstan Uruguay
Hong Kong SAR, China Switzerland Greece Korea, Rep. Malta Turkey
Iceland United Kingdom Israel Spain Venezuela
United States Italy Taiwan
United Arab Emirates
Cluster 5 Cluster 6
Albania Fiji Morocco Afghanistan Congo, Dem. Rep.
Kyrgyz Republic Myanmar South Sudan
Algeria Georgia Namibia Bangladesh Cöte d'Ivoire Laos Nepal Sri Lanka
Angola Guatemala Panama Benin Eritrea Lesotho Nicaragua Sudan
Armenia Indonesia Paraguay Bhutan Ethiopia Liberia Niger Swaziland
Bolivia Iran, Islamic Rep. Peru Burkina Faso Gambia Madagascar Nigeria Syrian Arab
RepublicBosnia and Herzegovina Iraq Philippines Burundi Ghana Malawi Korea, Dem.
People’s rep. Tajikistan
Botswana Jamaica Romania Cambodia Guinea Mali Pakistan Tanzania
Cuba Jordan Tunisia Cameroon Haiti Mauritania Rwanda Togo
Dominican Republic Kosovo Ukraine Central
African Rep. Honduras Moldova Senegal Uganda
Egypt, Arab Rep. Lebanon Uzbekistan Chad India Mongolia Sierra Leone Yemen
El Salvador Mauritius Vietnam Congo, Rep. Kenya Mozambique Somalia Zambia
ZimbabweNote: Economies in emphasis are those selected for primary research.
Table A4.1 – List of Economies in Each Cluster
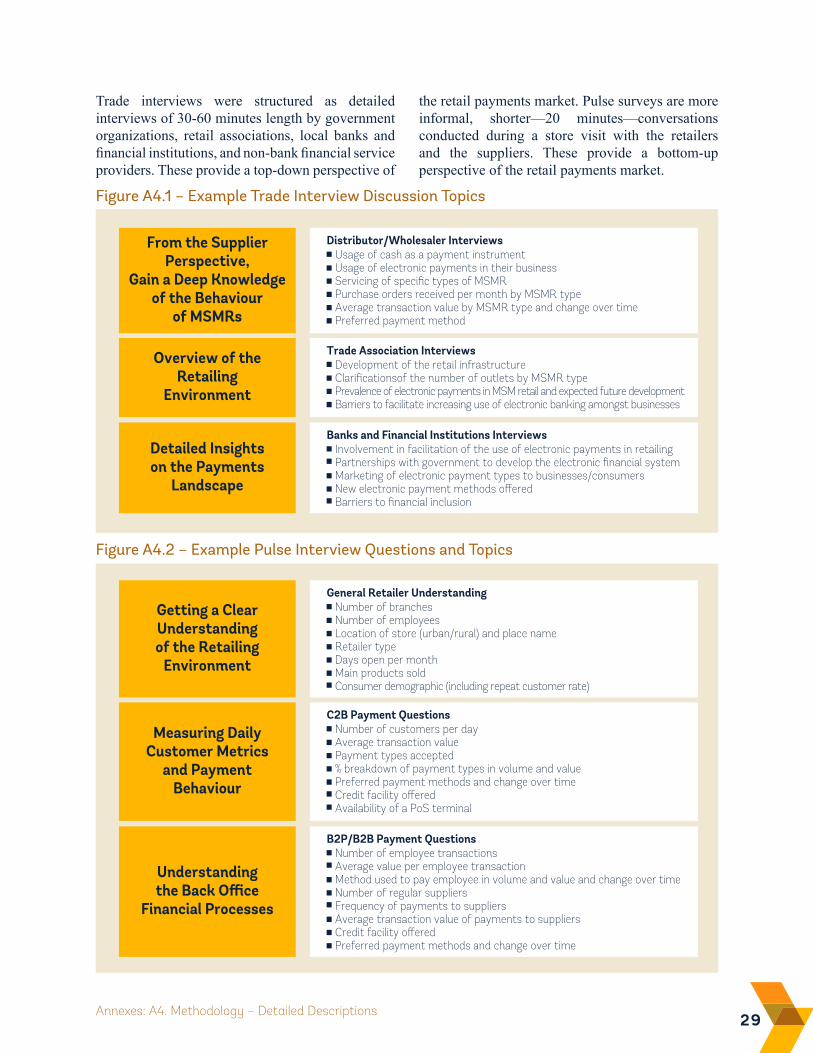
29Annexes: A4. Methodology – Detailed Descriptions
Trade interviews were structured as detailed interviews of 30-60 minutes length by government organizations, retail associations, local banks and financial institutions, and non-bank financial service providers. These provide a top-down perspective of
the retail payments market. Pulse surveys are more informal, shorter—20 minutes—conversations conducted during a store visit with the retailers and the suppliers. These provide a bottom-up perspective of the retail payments market.
Figure A4.1 – Example Trade Interview Discussion Topics
Usage of cash as a payment instrumentUsage of electronic payments in their businessServicing of specific types of MSMRPurchase orders received per month by MSMR type Average transaction value by MSMR type and change over timePreferred payment method
�
�
�
�
�
�
Distributor/Wholesaler InterviewsFrom the SupplierPerspective,
Gain a Deep Knowledgeof the Behaviour
of MSMRs
Development of the retail infrastructureClarificationsof the number of outlets by MSMR typePrevalence of electronic payments in MSM retail and expected future developmentBarriers to facilitate increasing use of electronic banking amongst businesses
�
�
�
�
Trade Association InterviewsOverview of theRetailing
Environment
Involvement in facilitation of the use of electronic payments in retailingPartnerships with government to develop the electronic financial systemMarketing of electronic payment types to businesses/consumersNew electronic payment methods offeredBarriers to financial inclusion�
�
�
�
�
Banks and Financial Institutions InterviewsDetailed Insightson the Payments
Landscape
Figure A4.2 – Example Pulse Interview Questions and Topics
Number of branchesNumber of employeesLocation of store (urban/rural) and place nameRetailer typeDays open per month Main products sold Consumer demographic (including repeat customer rate)
�
�
�
�
�
�
�
General Retailer UnderstandingGetting a ClearUnderstandingof the Retailing
Environment
Number of customers per dayAverage transaction valuePayment types accepted% breakdown of payment types in volume and valuePreferred payment methods and change over time Credit facility offeredAvailability of a PoS terminal
�
�
�
�
�
�
�
C2B Payment QuestionsMeasuring Daily
Customer Metricsand Payment
Behaviour
Number of employee transactionsAverage value per employee transactionMethod used to pay employee in volume and value and change over timeNumber of regular suppliersFrequency of payments to suppliersAverage transaction value of payments to suppliers Credit facility offeredPreferred payment methods and change over time
�
�
�
�
�
�
�
�
B2P/B2B Payment Questions
Understandingthe Back Office
Financial Processes
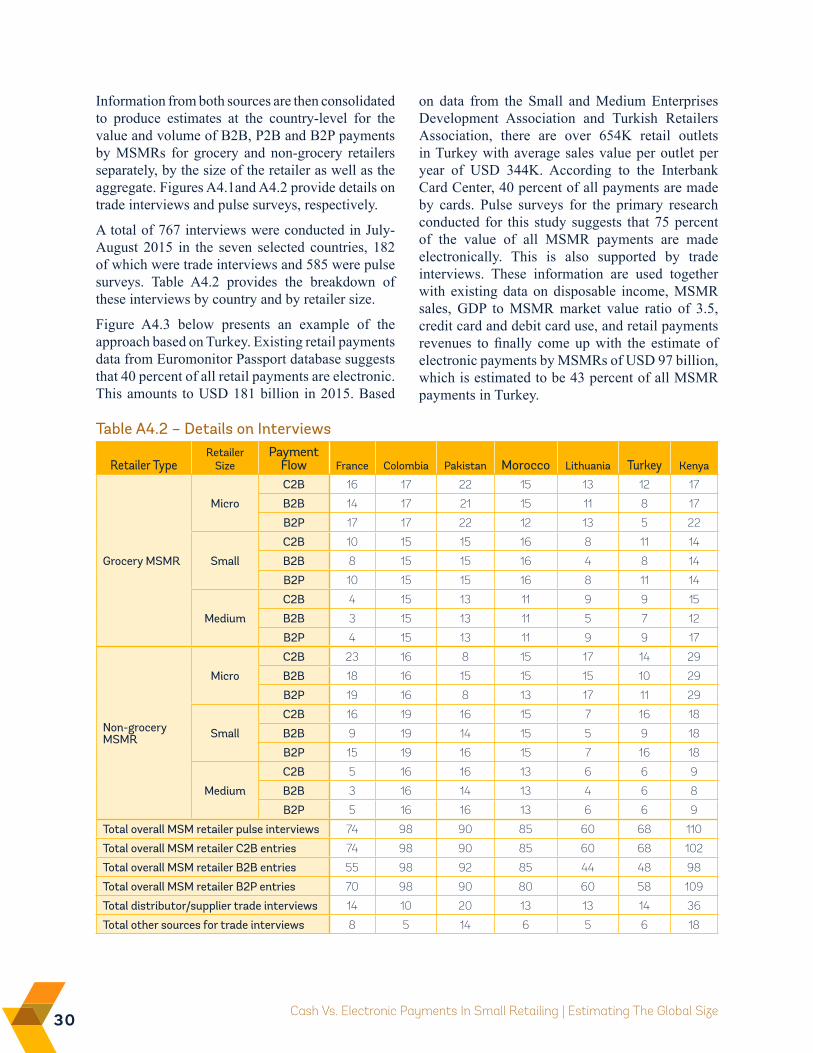
30 Cash Vs. Electronic Payments In Small Retailing | Estimating The Global Size
Information from both sources are then consolidated to produce estimates at the country-level for the value and volume of B2B, P2B and B2P payments by MSMRs for grocery and non-grocery retailers separately, by the size of the retailer as well as the aggregate. Figures A4.1and A4.2 provide details on trade interviews and pulse surveys, respectively.
A total of 767 interviews were conducted in July-August 2015 in the seven selected countries, 182 of which were trade interviews and 585 were pulse surveys. Table A4.2 provides the breakdown of these interviews by country and by retailer size.
Figure A4.3 below presents an example of the approach based on Turkey. Existing retail payments data from Euromonitor Passport database suggests that 40 percent of all retail payments are electronic. This amounts to USD 181 billion in 2015. Based
on data from the Small and Medium Enterprises Development Association and Turkish Retailers Association, there are over 654K retail outlets in Turkey with average sales value per outlet per year of USD 344K. According to the Interbank Card Center, 40 percent of all payments are made by cards. Pulse surveys for the primary research conducted for this study suggests that 75 percent of the value of all MSMR payments are made electronically. This is also supported by trade interviews. These information are used together with existing data on disposable income, MSMR sales, GDP to MSMR market value ratio of 3.5, credit card and debit card use, and retail payments revenues to finally come up with the estimate of electronic payments by MSMRs of USD 97 billion, which is estimated to be 43 percent of all MSMR payments in Turkey.
Retailer TypeRetailer
SizePayment
Flow France Colombia Pakistan Morocco Lithuania Turkey Kenya
Grocery MSMR
Micro
C2B 16 17 22 15 13 12 17
B2B 14 17 21 15 11 8 17
B2P 17 17 22 12 13 5 22
Small
C2B 10 15 15 16 8 11 14
B2B 8 15 15 16 4 8 14
B2P 10 15 15 16 8 11 14
Medium
C2B 4 15 13 11 9 9 15
B2B 3 15 13 11 5 7 12
B2P 4 15 13 11 9 9 17
Non-grocery MSMR
Micro
C2B 23 16 8 15 17 14 29
B2B 18 16 15 15 15 10 29
B2P 19 16 8 13 17 11 29
Small
C2B 16 19 16 15 7 16 18
B2B 9 19 14 15 5 9 18
B2P 15 19 16 15 7 16 18
Medium
C2B 5 16 16 13 6 6 9
B2B 3 16 14 13 4 6 8
B2P 5 16 16 13 6 6 9
Total overall MSM retailer pulse interviews 74 98 90 85 60 68 110
Total overall MSM retailer C2B entries 74 98 90 85 60 68 102
Total overall MSM retailer B2B entries 55 98 92 85 44 48 98
Total overall MSM retailer B2P entries 70 98 90 80 60 58 109
Total distributor/supplier trade interviews 14 10 20 13 13 14 36
Total other sources for trade interviews 8 5 14 6 5 6 18
Table A4.2 – Details on Interviews
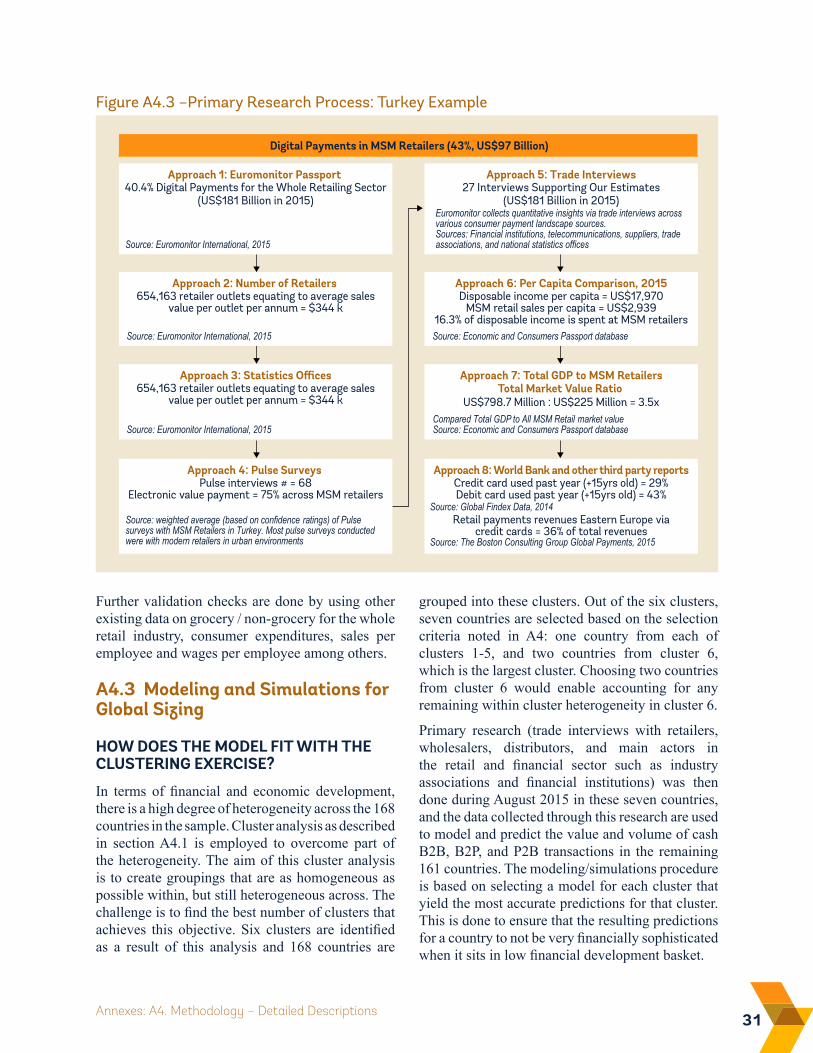
31Annexes: A4. Methodology – Detailed Descriptions
Further validation checks are done by using other existing data on grocery / non-grocery for the whole retail industry, consumer expenditures, sales per employee and wages per employee among others.
A4.3 Modeling and Simulations for Global Sizing
HOW DOES THE MODEL FiT WiTH THE CLUSTERiNG EXERCiSE?
In terms of financial and economic development, there is a high degree of heterogeneity across the 168 countries in the sample. Cluster analysis as described in section A4.1 is employed to overcome part of the heterogeneity. The aim of this cluster analysis is to create groupings that are as homogeneous as possible within, but still heterogeneous across. The challenge is to find the best number of clusters that achieves this objective. Six clusters are identified as a result of this analysis and 168 countries are
grouped into these clusters. Out of the six clusters, seven countries are selected based on the selection criteria noted in A4: one country from each of clusters 1-5, and two countries from cluster 6, which is the largest cluster. Choosing two countries from cluster 6 would enable accounting for any remaining within cluster heterogeneity in cluster 6.
Primary research (trade interviews with retailers, wholesalers, distributors, and main actors in the retail and financial sector such as industry associations and financial institutions) was then done during August 2015 in these seven countries, and the data collected through this research are used to model and predict the value and volume of cash B2B, B2P, and P2B transactions in the remaining 161 countries. The modeling/simulations procedure is based on selecting a model for each cluster that yield the most accurate predictions for that cluster. This is done to ensure that the resulting predictions for a country to not be very financially sophisticated when it sits in low financial development basket.
Figure A4.3 –Primary Research Process: Turkey Example
Approach 7: Total GDP to MSM RetailersTotal Market Value Ratio
US$798.7 Million : US$225 Million = 3.5xCompared Total GDP to All MSM Retail market valueSource: Economic and Consumers Passport database
Approach 3: Statistics Offices654,163 retailer outlets equating to average sales
value per outlet per annum = $344 k
Source: Euromonitor International, 2015
Global Stakeholder EngagementDigital Payments in MSM Retailers (43%, US$97 Billion)
Approach 5: Trade Interviews27 Interviews Supporting Our Estimates
(US$181 Billion in 2015)Euromonitor collects quantitative insights via trade interviews across various consumer payment landscape sources. Sources: Financial institutions, telecommunications, suppliers, trade associations, and national statistics offices
Approach 1: Euromonitor Passport 40.4% Digital Payments for the Whole Retailing Sector
(US$181 Billion in 2015)
Source: Euromonitor International, 2015
Approach 8: World Bank and other third party reports
Retail payments revenues Eastern Europe viacredit cards = 36% of total revenues
Source: Global Findex Data, 2014
Approach 4: Pulse Surveys Pulse interviews # = 68
Electronic value payment = 75% across MSM retailers
Source: weighted average (based on confidence ratings) of Pulse surveys with MSM Retailers in Turkey. Most pulse surveys conducted were with modern retailers in urban environments
Approach 6: Per Capita Comparison, 2015Disposable income per capita = US$17,970
MSM retail sales per capita = US$2,93916.3% of disposable income is spent at MSM retailersSource: Economic and Consumers Passport database
Approach 2: Number of Retailers 654,163 retailer outlets equating to average sales
value per outlet per annum = $344 k
Source: Euromonitor International, 2015
Source: The Boston Consulting Group Global Payments, 2015
Credit card used past year (+15yrs old) = 29%Debit card used past year (+15yrs old) = 43%
32 Cash vs. Electronic Payments In Small Retailing | Estimating the Global Size
DESCRiPTiON OF THE MODEL
Most classical statistical methods work well when applied to data sets which are characterised by a large number of observations. Since this research project aims to predict 161 data points using 7 observations for each variable of interest, enhanced regression analysis based methods are used. This annex explains the methodology for the prediction of a variable of interest. In this particular context we characterize a model by its outcome variable (y) and its predictive indicators (X’s), implying that a different combination of predictors makes up a different model:
yi=a0+a1X1i+a2 X2i+εi,
Suppose that in this context, yi denotes the number of medium grocery retailers of country i. X1i and X2i are two predictors such as disposable income, personal consumption expenditures, population density, etc. and εi is the error term. Generally, there might be a number of potential predictors (X), provided that the sample is big enough. In current settings, the sample size is seven, so only two predictors at a time are included and the three coefficients (a0, a1, a2) for each model are estimated. There are a total of 61 y variables to predict, and a total of 198 different predictors (X variables). Thus, the total number of different pairwise combinations of the predictors is quite large and estimation is very challenging.16 Table A4.3 below lists the variables to be predicted.
As a solution, all predictors are grouped into the following seven categories: education, financial, development, demographics, retail, business, and telecom. In the simulations, pairwise combinations made up of two variables from the same group are not used. That is, if the group is, say, ‘Financial’, two predictors from this group would not be used in combination in one model. This grouping and the resulting number of combinations makes the analysis more manageable and efficient as there is no need to estimate models using variables that contain very similar information.17
Once these models are estimated, the best fitting predictor pair needs to be selected. Unfortunately, any statistical testing, as well as tests of significance, in this modelling exercise would be flawed, since the parameter estimates suffer from omitted variable bias and the sample is small. Nevertheless,
all models are checked to see if the signs of the estimated coefficients make sense economically and statistically. For example, it is expected that the share of paper cash payments would go down as the annual disposable income per capita of country goes up. Therefore, if an estimated model predicted a converse relationship, that particular model will be excluded from the analysis.
As the objective of this step in the methodology is prediction, models need to be evaluated in terms of in-sample and out-of-sample predictive power. A common measure for in-sample prediction is the coefficient of determination, R2, however, as the sample size is small (seven observations), it is not appropriate to use this measure. Measuring out-of-sample fit—which is normally done my splitting the sample in half, using one half for estimation, predicting the values for the other half based on the estimates, and comparing predictions with actuals—would also be problematic, since it is not reasonable to split a sample as small as one with seven observations in half.
The solution, in this case, is to use a variant of jackknife (or leave-one-out cross validation) procedure, which drops one observation, re-estimates the model and checks the model fit for the observation left out of sample. This is repeated for each data point in the sample, i.e. a total of seven times, and the prediction errors are averages to get the (inverse) mean absolute percent error (MAPE) measure.18
To find the balance between in-sample fit and out-of-sample fit, top 30 best performing models based on R2 are used to predict an outcome variable. Then, these 30 models are evaluated for the out-of-sample fit using the jackknife variant described above to calculate the (inverse) MAPE of each of these 30 models. The predictions from these 30 models for one outcome variable are then averaged using inverse MAPE as the weights to construct the final prediction for that outcome variable, thereby relying on out-of-sample predictions of the best-fitting 30 models for each of the 61 variables to be predicted.19 This enables incorporating the effects of a larger number of factors in predicting an outcome variable, which would otherwise not be possible because of the small sample size. That is, only two predictors would have been used in each model otherwise, and the resulting prediction error would have been larger.
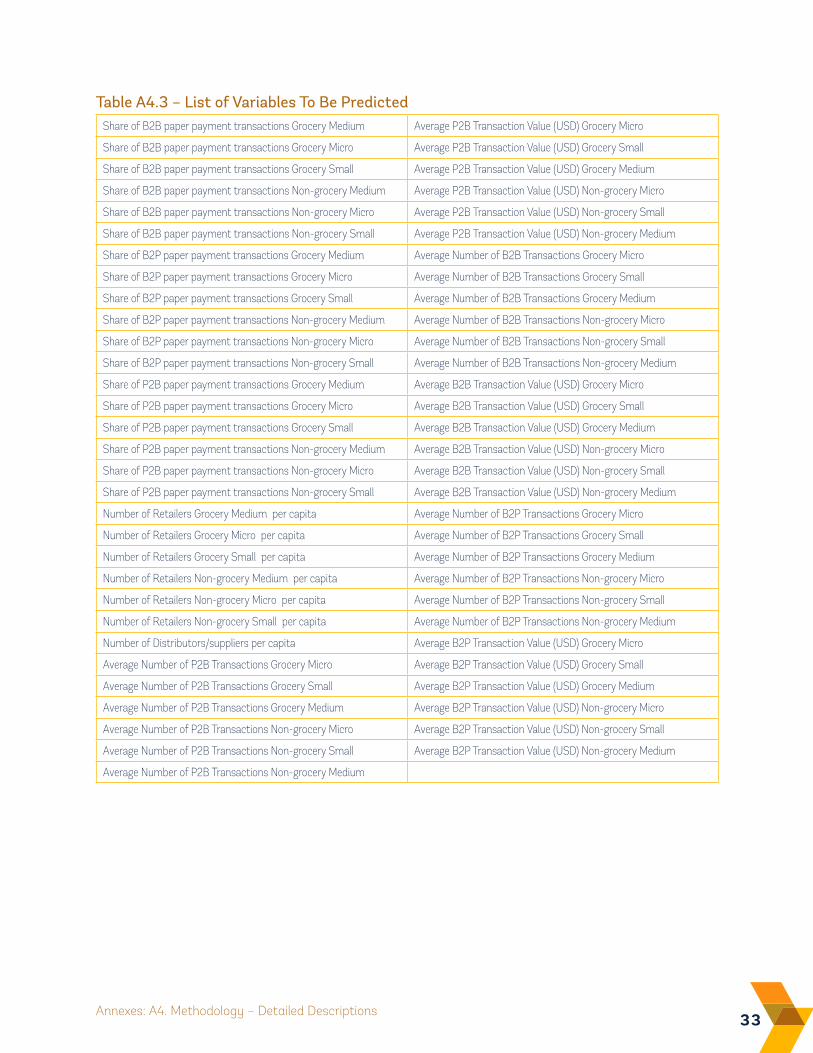
33Annexes: A4. Methodology – Detailed Descriptions
Table A4.3 – List of Variables To Be PredictedShare of B2B paper payment transactions Grocery Medium Average P2B Transaction Value (USD) Grocery Micro
Share of B2B paper payment transactions Grocery Micro Average P2B Transaction Value (USD) Grocery Small
Share of B2B paper payment transactions Grocery Small Average P2B Transaction Value (USD) Grocery Medium
Share of B2B paper payment transactions Non-grocery Medium Average P2B Transaction Value (USD) Non-grocery Micro
Share of B2B paper payment transactions Non-grocery Micro Average P2B Transaction Value (USD) Non-grocery Small
Share of B2B paper payment transactions Non-grocery Small Average P2B Transaction Value (USD) Non-grocery Medium
Share of B2P paper payment transactions Grocery Medium Average Number of B2B Transactions Grocery Micro
Share of B2P paper payment transactions Grocery Micro Average Number of B2B Transactions Grocery Small
Share of B2P paper payment transactions Grocery Small Average Number of B2B Transactions Grocery Medium
Share of B2P paper payment transactions Non-grocery Medium Average Number of B2B Transactions Non-grocery Micro
Share of B2P paper payment transactions Non-grocery Micro Average Number of B2B Transactions Non-grocery Small
Share of B2P paper payment transactions Non-grocery Small Average Number of B2B Transactions Non-grocery Medium
Share of P2B paper payment transactions Grocery Medium Average B2B Transaction Value (USD) Grocery Micro
Share of P2B paper payment transactions Grocery Micro Average B2B Transaction Value (USD) Grocery Small
Share of P2B paper payment transactions Grocery Small Average B2B Transaction Value (USD) Grocery Medium
Share of P2B paper payment transactions Non-grocery Medium Average B2B Transaction Value (USD) Non-grocery Micro
Share of P2B paper payment transactions Non-grocery Micro Average B2B Transaction Value (USD) Non-grocery Small
Share of P2B paper payment transactions Non-grocery Small Average B2B Transaction Value (USD) Non-grocery Medium
Number of Retailers Grocery Medium per capita Average Number of B2P Transactions Grocery Micro
Number of Retailers Grocery Micro per capita Average Number of B2P Transactions Grocery Small
Number of Retailers Grocery Small per capita Average Number of B2P Transactions Grocery Medium
Number of Retailers Non-grocery Medium per capita Average Number of B2P Transactions Non-grocery Micro
Number of Retailers Non-grocery Micro per capita Average Number of B2P Transactions Non-grocery Small
Number of Retailers Non-grocery Small per capita Average Number of B2P Transactions Non-grocery Medium
Number of Distributors/suppliers per capita Average B2P Transaction Value (USD) Grocery Micro
Average Number of P2B Transactions Grocery Micro Average B2P Transaction Value (USD) Grocery Small
Average Number of P2B Transactions Grocery Small Average B2P Transaction Value (USD) Grocery Medium
Average Number of P2B Transactions Grocery Medium Average B2P Transaction Value (USD) Non-grocery Micro
Average Number of P2B Transactions Non-grocery Micro Average B2P Transaction Value (USD) Non-grocery Small
Average Number of P2B Transactions Non-grocery Small Average B2P Transaction Value (USD) Non-grocery Medium
Average Number of P2B Transactions Non-grocery Medium
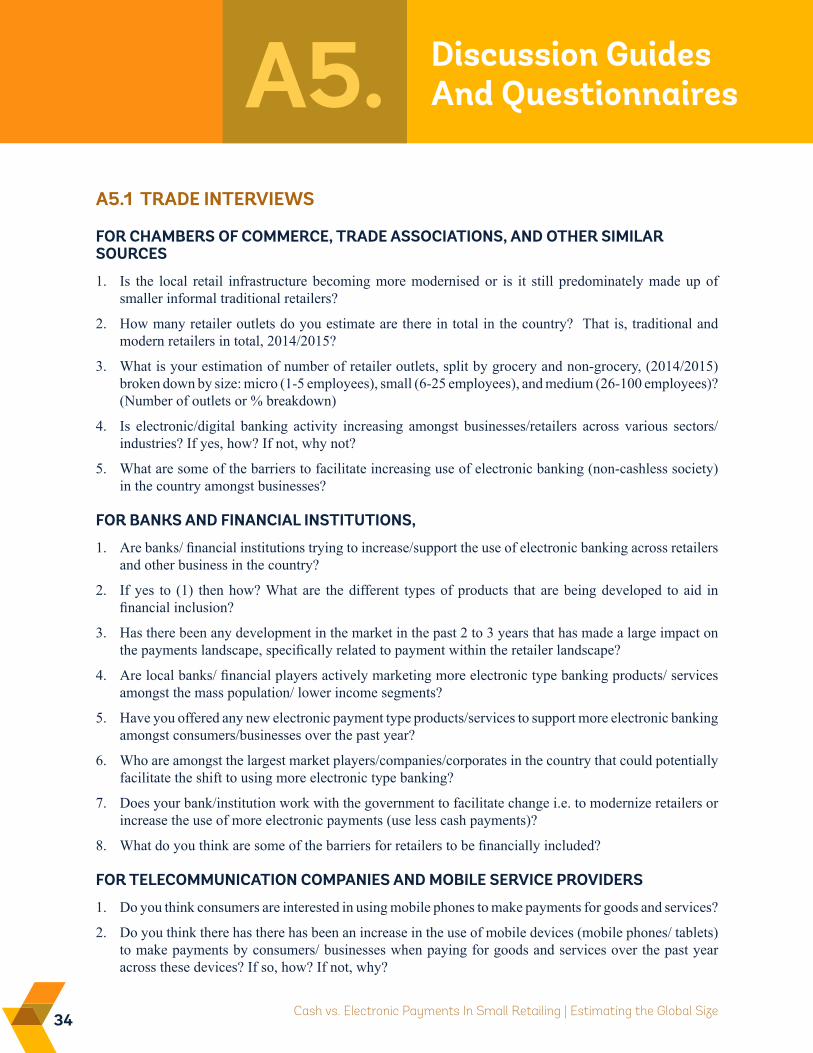
34 Cash vs. Electronic Payments In Small Retailing | Estimating the Global Size
Discussion Guides And Questionnaires A5.
A5.1 TRADE iNTERviEWS
FOR CHAMBERS OF COMMERCE, TRADE ASSOCiATiONS, AND OTHER SiMiLAR SOURCES
1. Is the local retail infrastructure becoming more modernised or is it still predominately made up of smaller informal traditional retailers?
2. How many retailer outlets do you estimate are there in total in the country? That is, traditional and modern retailers in total, 2014/2015?
3. What is your estimation of number of retailer outlets, split by grocery and non-grocery, (2014/2015) broken down by size: micro (1-5 employees), small (6-25 employees), and medium (26-100 employees)? (Number of outlets or % breakdown)
4. Is electronic/digital banking activity increasing amongst businesses/retailers across various sectors/industries? If yes, how? If not, why not?
5. What are some of the barriers to facilitate increasing use of electronic banking (non-cashless society) in the country amongst businesses?
FOR BANKS AND FiNANCiAL iNSTiTUTiONS,
1. Are banks/ financial institutions trying to increase/support the use of electronic banking across retailers and other business in the country?
2. If yes to (1) then how? What are the different types of products that are being developed to aid in financial inclusion?
3. Has there been any development in the market in the past 2 to 3 years that has made a large impact on the payments landscape, specifically related to payment within the retailer landscape?
4. Are local banks/ financial players actively marketing more electronic type banking products/ services amongst the mass population/ lower income segments?
5. Have you offered any new electronic payment type products/services to support more electronic banking amongst consumers/businesses over the past year?
6. Who are amongst the largest market players/companies/corporates in the country that could potentially facilitate the shift to using more electronic type banking?
7. Does your bank/institution work with the government to facilitate change i.e. to modernize retailers or increase the use of more electronic payments (use less cash payments)?
8. What do you think are some of the barriers for retailers to be financially included?
FOR TELECOMMUNiCATiON COMPANiES AND MOBiLE SERviCE PROviDERS
1. Do you think consumers are interested in using mobile phones to make payments for goods and services?
2. Do you think there has there has been an increase in the use of mobile devices (mobile phones/ tablets) to make payments by consumers/ businesses when paying for goods and services over the past year across these devices? If so, how? If not, why?
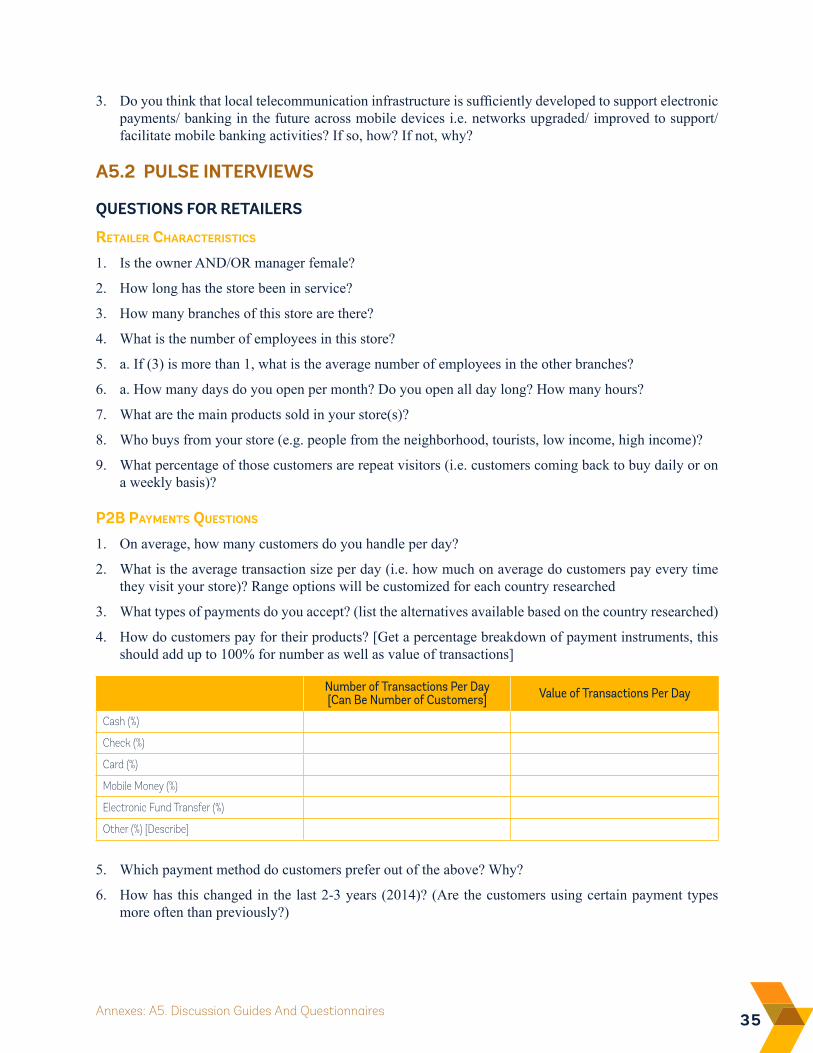
35Annexes: A5. Discussion Guides And Questionnaires
3. Do you think that local telecommunication infrastructure is sufficiently developed to support electronic payments/ banking in the future across mobile devices i.e. networks upgraded/ improved to support/ facilitate mobile banking activities? If so, how? If not, why?
A5.2 PULSE iNTERviEWS
QUESTiONS FOR RETAiLERS
retailer CharaCteristiCs
1. Is the owner AND/OR manager female?
2. How long has the store been in service?
3. How many branches of this store are there?
4. What is the number of employees in this store?
5. a. If (3) is more than 1, what is the average number of employees in the other branches?
6. a. How many days do you open per month? Do you open all day long? How many hours?
7. What are the main products sold in your store(s)?
8. Who buys from your store (e.g. people from the neighborhood, tourists, low income, high income)?
9. What percentage of those customers are repeat visitors (i.e. customers coming back to buy daily or on a weekly basis)?
P2B PayMents Questions
1. On average, how many customers do you handle per day?
2. What is the average transaction size per day (i.e. how much on average do customers pay every time they visit your store)? Range options will be customized for each country researched
3. What types of payments do you accept? (list the alternatives available based on the country researched)
4. How do customers pay for their products? [Get a percentage breakdown of payment instruments, this should add up to 100% for number as well as value of transactions]
5. Which payment method do customers prefer out of the above? Why?
6. How has this changed in the last 2-3 years (2014)? (Are the customers using certain payment types more often than previously?)
Number of Transactions Per Day [Can Be Number of Customers] Value of Transactions Per Day
Cash (%)
Check (%)
Card (%)
Mobile Money (%)
Electronic Fund Transfer (%)
Other (%) [Describe]
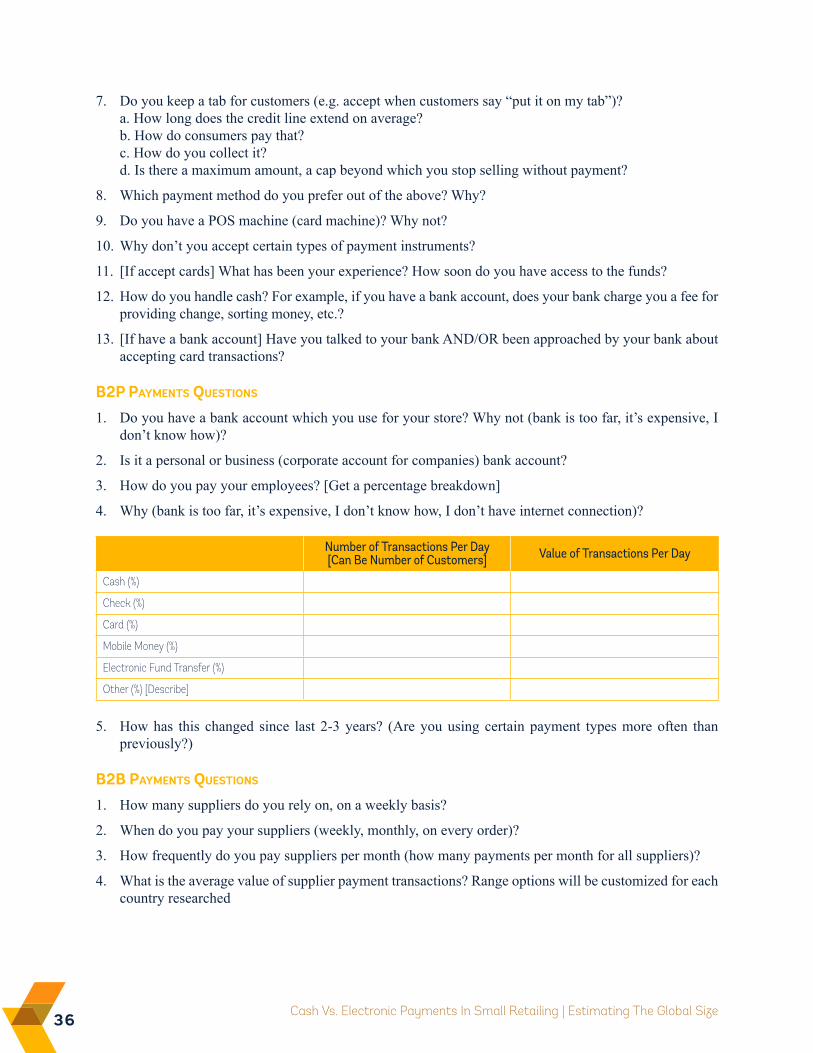
36 Cash Vs. Electronic Payments In Small Retailing | Estimating The Global Size
7. Do you keep a tab for customers (e.g. accept when customers say “put it on my tab”)? a. How long does the credit line extend on average? b. How do consumers pay that? c. How do you collect it? d. Is there a maximum amount, a cap beyond which you stop selling without payment?
8. Which payment method do you prefer out of the above? Why?
9. Do you have a POS machine (card machine)? Why not?
10. Why don’t you accept certain types of payment instruments?
11. [If accept cards] What has been your experience? How soon do you have access to the funds?
12. How do you handle cash? For example, if you have a bank account, does your bank charge you a fee for providing change, sorting money, etc.?
13. [If have a bank account] Have you talked to your bank AND/OR been approached by your bank about accepting card transactions?
B2P PayMents Questions
1. Do you have a bank account which you use for your store? Why not (bank is too far, it’s expensive, I don’t know how)?
2. Is it a personal or business (corporate account for companies) bank account?
3. How do you pay your employees? [Get a percentage breakdown]
4. Why (bank is too far, it’s expensive, I don’t know how, I don’t have internet connection)?
5. How has this changed since last 2-3 years? (Are you using certain payment types more often than previously?)
B2B PayMents Questions
1. How many suppliers do you rely on, on a weekly basis?
2. When do you pay your suppliers (weekly, monthly, on every order)?
3. How frequently do you pay suppliers per month (how many payments per month for all suppliers)?
4. What is the average value of supplier payment transactions? Range options will be customized for each country researched
Number of Transactions Per Day [Can Be Number of Customers] Value of Transactions Per Day
Cash (%)
Check (%)
Card (%)
Mobile Money (%)
Electronic Fund Transfer (%)
Other (%) [Describe]
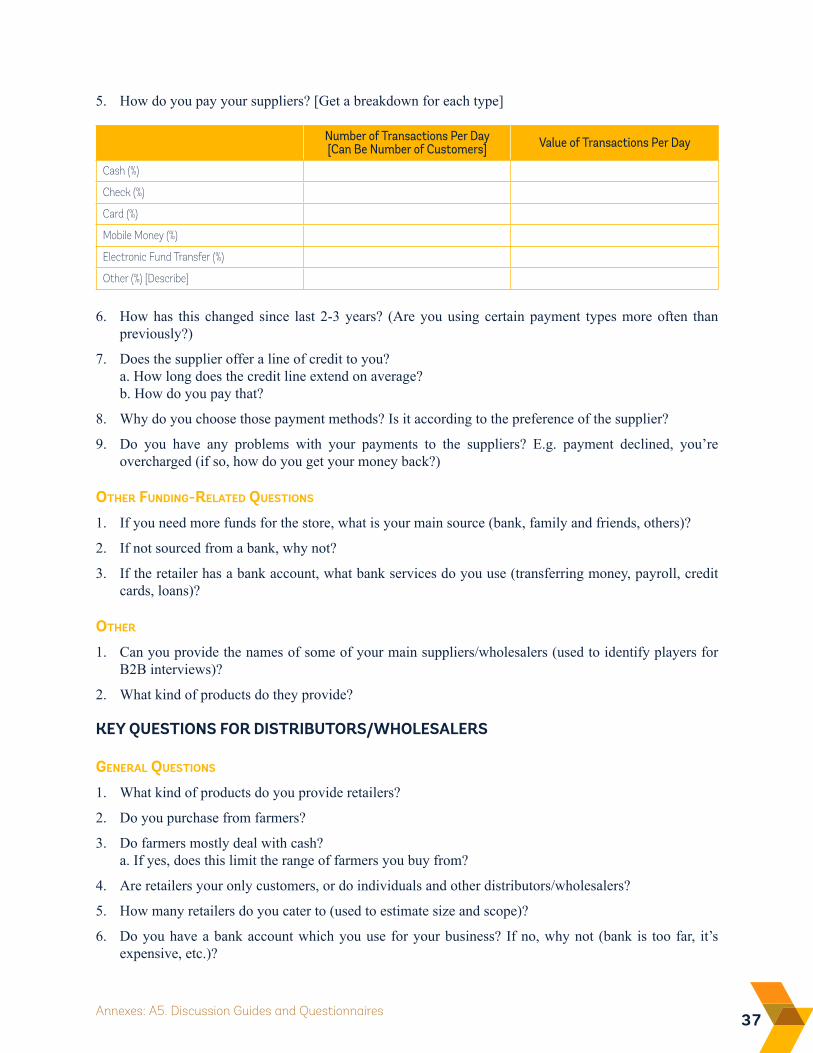
37Annexes: A5. Discussion Guides and Questionnaires
5. How do you pay your suppliers? [Get a breakdown for each type]
6. How has this changed since last 2-3 years? (Are you using certain payment types more often than previously?)
7. Does the supplier offer a line of credit to you? a. How long does the credit line extend on average? b. How do you pay that?
8. Why do you choose those payment methods? Is it according to the preference of the supplier?
9. Do you have any problems with your payments to the suppliers? E.g. payment declined, you’re overcharged (if so, how do you get your money back?)
other Funding-related Questions
1. If you need more funds for the store, what is your main source (bank, family and friends, others)?
2. If not sourced from a bank, why not?
3. If the retailer has a bank account, what bank services do you use (transferring money, payroll, credit cards, loans)?
other
1. Can you provide the names of some of your main suppliers/wholesalers (used to identify players for B2B interviews)?
2. What kind of products do they provide?
KEY QUESTiONS FOR DiSTRiBUTORS/WHOLESALERS
general Questions
1. What kind of products do you provide retailers?
2. Do you purchase from farmers?
3. Do farmers mostly deal with cash? a. If yes, does this limit the range of farmers you buy from?
4. Are retailers your only customers, or do individuals and other distributors/wholesalers?
5. How many retailers do you cater to (used to estimate size and scope)?
6. Do you have a bank account which you use for your business? If no, why not (bank is too far, it’s expensive, etc.)?
Number of Transactions Per Day [Can Be Number of Customers] Value of Transactions Per Day
Cash (%)
Check (%)
Card (%)
Mobile Money (%)
Electronic Fund Transfer (%)
Other (%) [Describe]
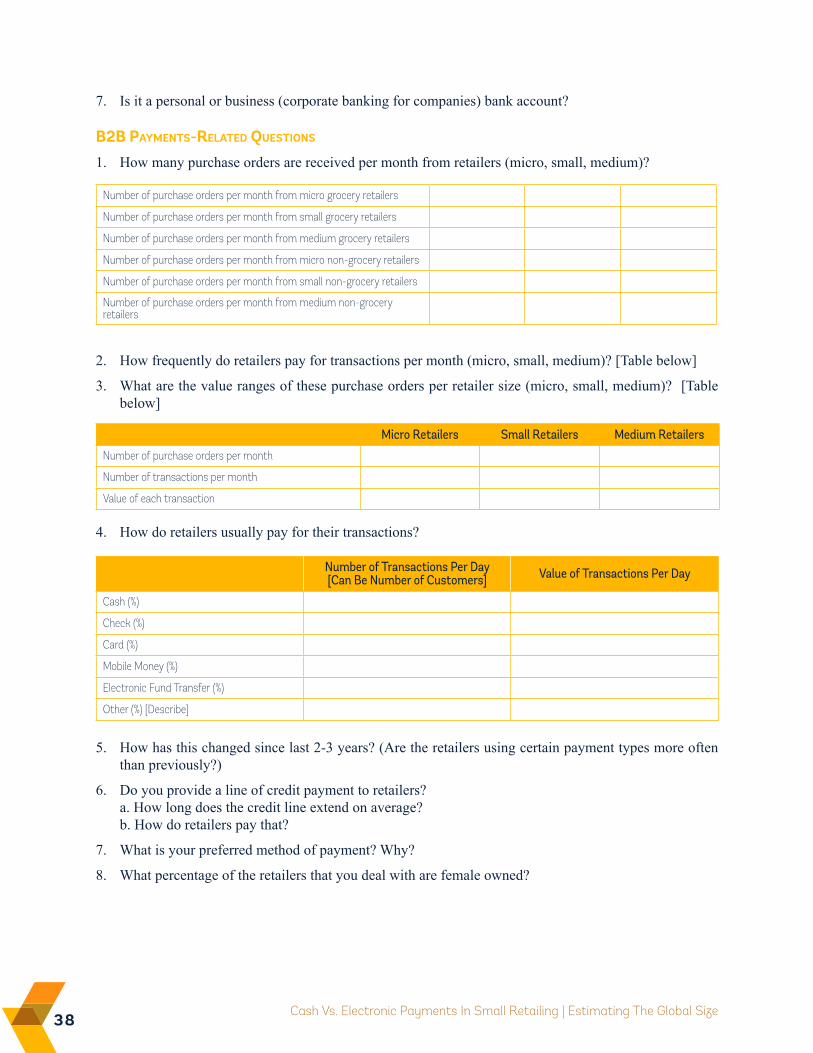
38 Cash Vs. Electronic Payments In Small Retailing | Estimating The Global Size
Micro Retailers Small Retailers Medium Retailers
Number of purchase orders per month
Number of transactions per month
Value of each transaction
7. Is it a personal or business (corporate banking for companies) bank account?
B2B PayMents-related Questions
1. How many purchase orders are received per month from retailers (micro, small, medium)?
2. How frequently do retailers pay for transactions per month (micro, small, medium)? [Table below]
3. What are the value ranges of these purchase orders per retailer size (micro, small, medium)? [Table below]
4. How do retailers usually pay for their transactions?
5. How has this changed since last 2-3 years? (Are the retailers using certain payment types more often than previously?)
6. Do you provide a line of credit payment to retailers? a. How long does the credit line extend on average? b. How do retailers pay that?
7. What is your preferred method of payment? Why?
8. What percentage of the retailers that you deal with are female owned?
Number of Transactions Per Day [Can Be Number of Customers] Value of Transactions Per Day
Cash (%)
Check (%)
Card (%)
Mobile Money (%)
Electronic Fund Transfer (%)
Other (%) [Describe]
Number of purchase orders per month from micro grocery retailers
Number of purchase orders per month from small grocery retailers
Number of purchase orders per month from medium grocery retailers
Number of purchase orders per month from micro non-grocery retailers
Number of purchase orders per month from small non-grocery retailers
Number of purchase orders per month from medium non-grocery retailers
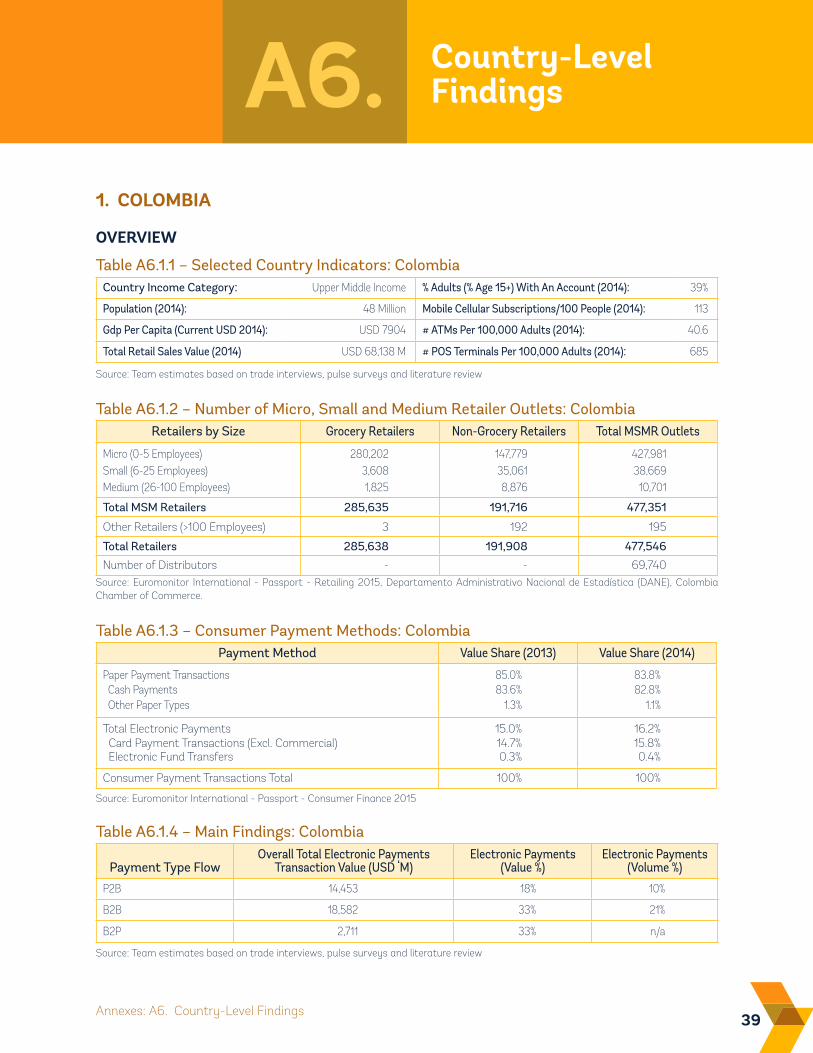
39Annexes: A6. Country-Level Findings
Country-Level FindingsA6.
Country Income Category: Upper Middle Income % Adults (% Age 15+) With An Account (2014): 39%
Population (2014): 48 Million Mobile Cellular Subscriptions/100 People (2014): 113
Gdp Per Capita (Current USD 2014): USD 7904 # ATMs Per 100,000 Adults (2014): 40.6
Total Retail Sales Value (2014) USD 68,138 M # POS Terminals Per 100,000 Adults (2014): 685
Table A6.1.1 – Selected Country Indicators: Colombia
Source: Team estimates based on trade interviews, pulse surveys and literature review
Retailers by Size Grocery Retailers Non-Grocery Retailers Total MSMR Outlets
Micro (0-5 Employees) 280,202 147,779 427,981Small (6-25 Employees) 3,608 35,061 38,669Medium (26-100 Employees) 1,825 8,876 10,701
Total MSM Retailers 285,635 191,716 477,351
Other Retailers (>100 Employees) 3 192 195
Total Retailers 285,638 191,908 477,546
Number of Distributors - - 69,740
Table A6.1.2 – Number of Micro, Small and Medium Retailer Outlets: Colombia
Source: Euromonitor International - Passport - Retailing 2015, Departamento Administrativo Nacional de Estadística (DANE), Colombia Chamber of Commerce.
Payment Method Value Share (2013) Value Share (2014)
Paper Payment Transactions 85.0% 83.8% Cash Payments 83.6% 82.8% Other Paper Types 1.3% 1.1%
Total Electronic Payments 15.0% 16.2% Card Payment Transactions (Excl. Commercial) 14.7% 15.8% Electronic Fund Transfers 0.3% 0.4%
Consumer Payment Transactions Total 100% 100%
Table A6.1.3 – Consumer Payment Methods: Colombia
Source: Euromonitor International - Passport - Consumer Finance 2015
Payment Type FlowOverall Total Electronic Payments
Transaction Value (USD ‘M)Electronic Payments
(Value %)Electronic Payments
(Volume %)
P2B 14,453 18% 10%
B2B 18,582 33% 21%
B2P 2,711 33% n/a
Table A6.1.4 – Main Findings: Colombia
Source: Team estimates based on trade interviews, pulse surveys and literature review
1. COLOMBiA
OvERviEW
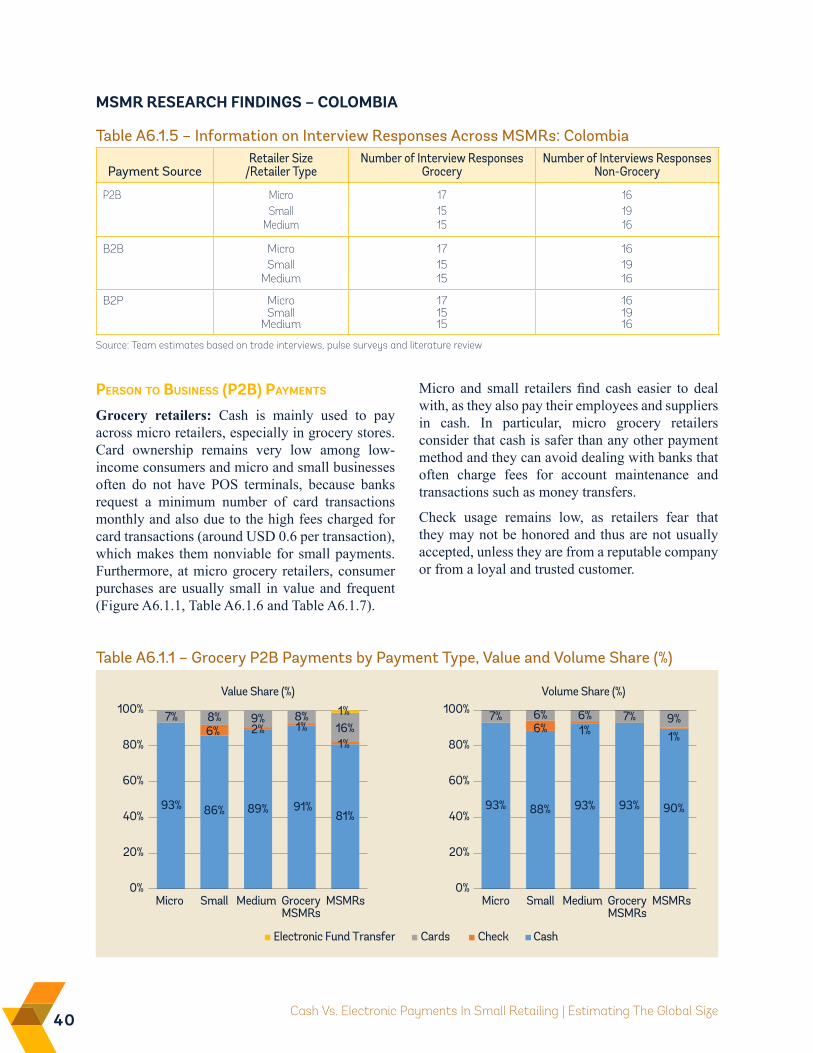
40 Cash Vs. Electronic Payments In Small Retailing | Estimating The Global Size
Payment SourceRetailer Size
/Retailer TypeNumber of Interview Responses
GroceryNumber of Interviews Responses
Non-Grocery
P2B Micro 17 16Small 15 19
Medium 15 16
B2B Micro 17 16Small 15 19
Medium 15 16
B2P Micro 17 16Small 15 19
Medium 15 16
Table A6.1.5 – Information on Interview Responses Across MSMRs: Colombia
Source: Team estimates based on trade interviews, pulse surveys and literature review
MSMR RESEARCH FiNDiNGS – COLOMBiA
Person to Business (P2B) PayMents
Grocery retailers: Cash is mainly used to pay across micro retailers, especially in grocery stores. Card ownership remains very low among low-income consumers and micro and small businesses often do not have POS terminals, because banks request a minimum number of card transactions monthly and also due to the high fees charged for card transactions (around USD 0.6 per transaction), which makes them nonviable for small payments. Furthermore, at micro grocery retailers, consumer purchases are usually small in value and frequent (Figure A6.1.1, Table A6.1.6 and Table A6.1.7).
Table A6.1.1 – Grocery P2B Payments by Payment Type, Value and Volume Share (%)
93% 86% 89% 91%81%
6% 2% 1%1%
7% 8% 9% 8%16%1%
0%
20%
40%
60%
80%
100%
Micro Small Medium GroceryMSMRs
MSMRsMicro Small Medium GroceryMSMRs
MSMRs
Value Share (%)
93% 88% 93% 93% 90%
6% 1% 1%
7% 6% 6% 7% 9%
0%
20%
40%
60%
80%
100%Volume Share (%)
Electronic Fund Transfer Cards Check Cash
Micro and small retailers find cash easier to deal with, as they also pay their employees and suppliers in cash. In particular, micro grocery retailers consider that cash is safer than any other payment method and they can avoid dealing with banks that often charge fees for account maintenance and transactions such as money transfers.
Check usage remains low, as retailers fear that they may not be honored and thus are not usually accepted, unless they are from a reputable company or from a loyal and trusted customer.
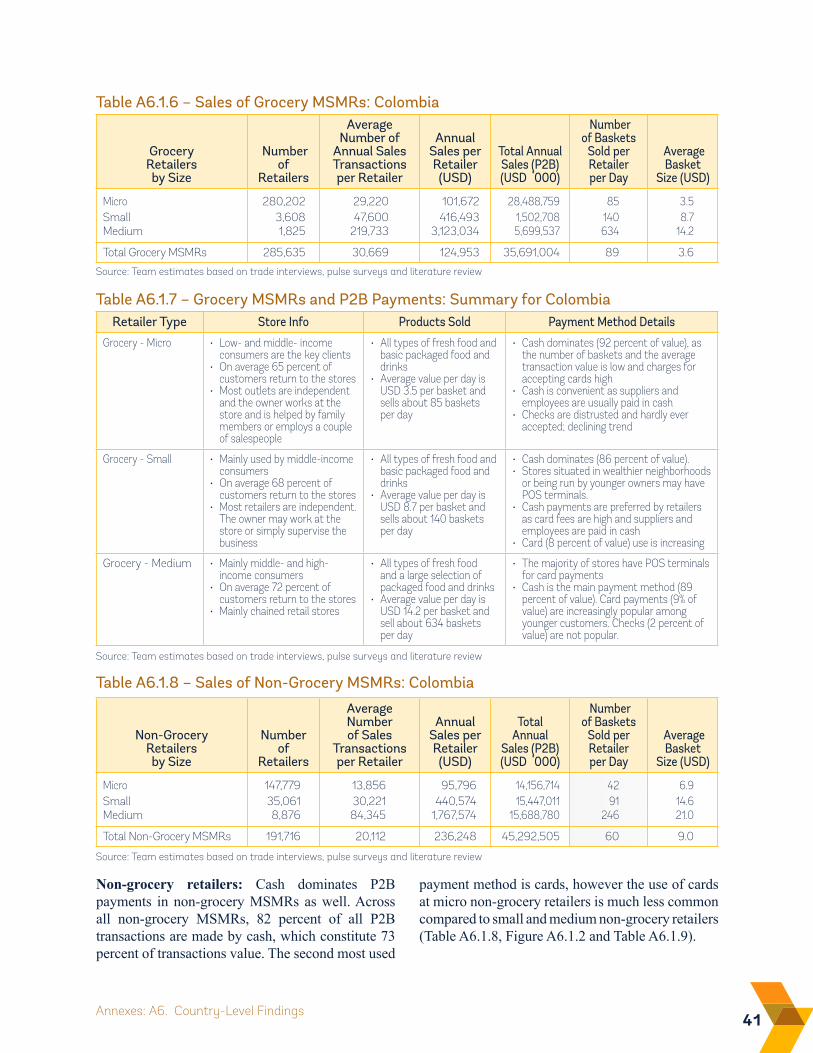
41Annexes: A6. Country-Level Findings
Table A6.1.6 – Sales of Grocery MSMRs: Colombia
Source: Team estimates based on trade interviews, pulse surveys and literature review
Retailer Type Store Info Products Sold Payment Method Details
Grocery - Micro • Low- and middle- income consumers are the key clients
• On average 65 percent of customers return to the stores
• Most outlets are independent and the owner works at the store and is helped by family members or employs a couple of salespeople
• All types of fresh food and basic packaged food and drinks
• Average value per day is USD 3.5 per basket and sells about 85 baskets per day
• Cash dominates (92 percent of value), as the number of baskets and the average transaction value is low and charges for accepting cards high
• Cash is convenient as suppliers and employees are usually paid in cash
• Checks are distrusted and hardly ever accepted; declining trend
Grocery - Small • Mainly used by middle-income consumers
• On average 68 percent of customers return to the stores
• Most retailers are independent. The owner may work at the store or simply supervise the business
• All types of fresh food and basic packaged food and drinks
• Average value per day is USD 8.7 per basket and sells about 140 baskets per day
• Cash dominates (86 percent of value).• Stores situated in wealthier neighborhoods
or being run by younger owners may have POS terminals.
• Cash payments are preferred by retailers as card fees are high and suppliers and employees are paid in cash
• Card (8 percent of value) use is increasing
Grocery - Medium • Mainly middle- and high-income consumers
• On average 72 percent of customers return to the stores
• Mainly chained retail stores
• All types of fresh food and a large selection of packaged food and drinks
• Average value per day is USD 14.2 per basket and sell about 634 baskets per day
• The majority of stores have POS terminals for card payments
• Cash is the main payment method (89 percent of value). Card payments (9% of value) are increasingly popular among younger customers. Checks (2 percent of value) are not popular.
Table A6.1.7 – Grocery MSMRs and P2B Payments: Summary for Colombia
Source: Team estimates based on trade interviews, pulse surveys and literature review
Non-Grocery Retailers by Size
Number of
Retailers
Average Number of Sales
Transactions per Retailer
Annual Sales per Retailer (USD)
Total Annual
Sales (P2B) (USD ‘000)
Number of Baskets
Sold per Retailer per Day
Average Basket
Size (USD)
Micro 147,779 13,856 95,796 14,156,714 42 6.9Small 35,061 30,221 440,574 15,447,011 91 14.6Medium 8,876 84,345 1,767,574 15,688,780 246 21.0
Total Non-Grocery MSMRs 191,716 20,112 236,248 45,292,505 60 9.0
Table A6.1.8 – Sales of Non-Grocery MSMRs: Colombia
Source: Team estimates based on trade interviews, pulse surveys and literature review
Non-grocery retailers: Cash dominates P2B payments in non-grocery MSMRs as well. Across all non-grocery MSMRs, 82 percent of all P2B transactions are made by cash, which constitute 73 percent of transactions value. The second most used
payment method is cards, however the use of cards at micro non-grocery retailers is much less common compared to small and medium non-grocery retailers (Table A6.1.8, Figure A6.1.2 and Table A6.1.9).
Grocery Retailers by Size
Number of
Retailers
Average Number of
Annual Sales Transactions per Retailer
Annual Sales per Retailer (USD)
Total Annual Sales (P2B) (USD ‘000)
Number of Baskets
Sold per Retailer per Day
Average Basket
Size (USD)
Micro 280,202 29,220 101,672 28,488,759 85 3.5Small 3,608 47,600 416,493 1,502,708 140 8.7Medium 1,825 219,733 3,123,034 5,699,537 634 14.2
Total Grocery MSMRs 285,635 30,669 124,953 35,691,004 89 3.6
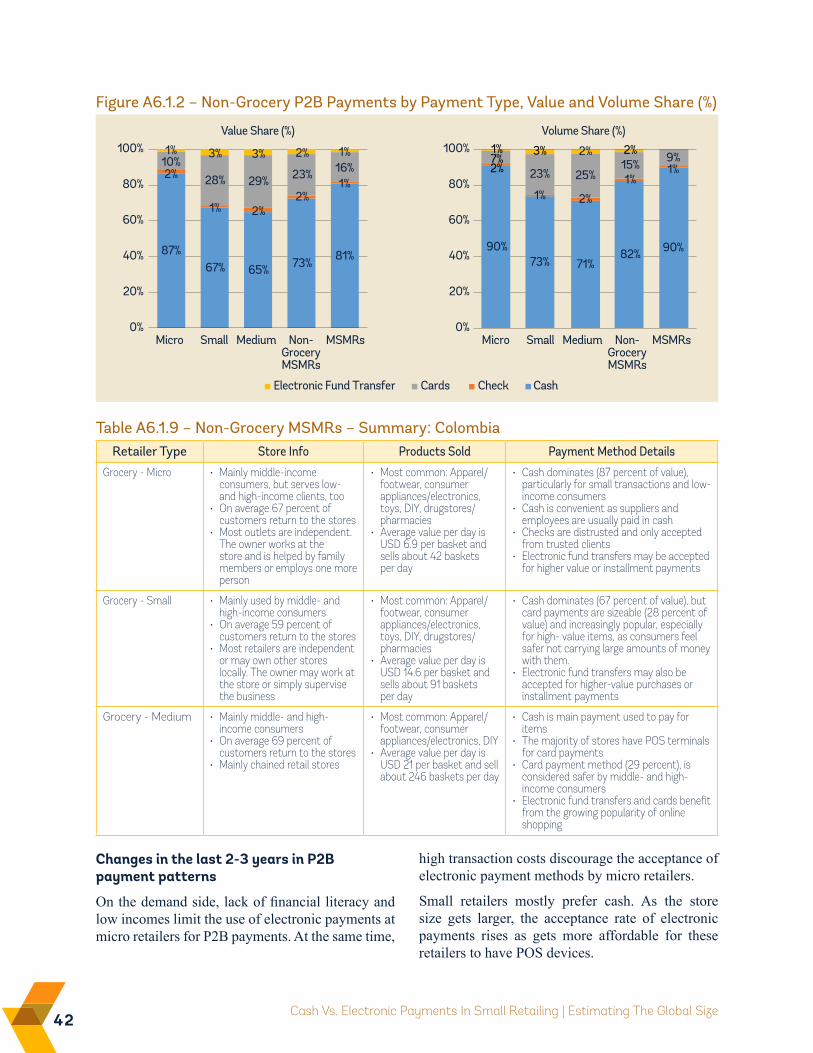
42 Cash Vs. Electronic Payments In Small Retailing | Estimating The Global Size
Figure A6.1.2 – Non-Grocery P2B Payments by Payment Type, Value and Volume Share (%)
0%
20%
40%
60%
80%
100%
Micro Small Medium Non-GroceryMSMRs
MSMRsMicro Small Medium Non-GroceryMSMRs
MSMRs
Value Share (%)
Electronic Fund Transfer Cards Check Cash
0%
20%
40%
60%
80%
100%Volume Share (%)
87%67% 65% 73% 81%
2%
1% 2%2%
1%
10%28% 29% 23% 16%
1% 3% 3% 2% 1%
90%73% 71%
82% 90%
2%
1% 2%
1%1%
7%23% 25%
15% 9%1% 3% 2% 2%
Retailer Type Store Info Products Sold Payment Method Details
Grocery - Micro • Mainly middle-income consumers, but serves low- and high-income clients, too
• On average 67 percent of customers return to the stores
• Most outlets are independent. The owner works at the store and is helped by family members or employs one more person
• Most common: Apparel/ footwear, consumer appliances/electronics, toys, DIY, drugstores/pharmacies
• Average value per day is USD 6.9 per basket and sells about 42 baskets per day
• Cash dominates (87 percent of value), particularly for small transactions and low-income consumers
• Cash is convenient as suppliers and employees are usually paid in cash
• Checks are distrusted and only accepted from trusted clients
• Electronic fund transfers may be accepted for higher value or installment payments
Grocery - Small • Mainly used by middle- and high-income consumers
• On average 59 percent of customers return to the stores
• Most retailers are independent or may own other stores locally. The owner may work at the store or simply supervise the business
• Most common: Apparel/ footwear, consumer appliances/electronics, toys, DIY, drugstores/pharmacies
• Average value per day is USD 14.6 per basket and sells about 91 baskets per day
• Cash dominates (67 percent of value), but card payments are sizeable (28 percent of value) and increasingly popular, especially for high- value items, as consumers feel safer not carrying large amounts of money with them.
• Electronic fund transfers may also be accepted for higher-value purchases or installment payments
Grocery - Medium • Mainly middle- and high-income consumers
• On average 69 percent of customers return to the stores
• Mainly chained retail stores
• Most common: Apparel/ footwear, consumer appliances/electronics, DIY
• Average value per day is USD 21 per basket and sell about 246 baskets per day
• Cash is main payment used to pay for items
• The majority of stores have POS terminals for card payments
• Card payment method (29 percent), is considered safer by middle- and high-income consumers
• Electronic fund transfers and cards benefit from the growing popularity of online shopping
Table A6.1.9 – Non-Grocery MSMRs – Summary: Colombia
Changes in the last 2-3 years in P2B payment patterns
On the demand side, lack of financial literacy and low incomes limit the use of electronic payments at micro retailers for P2B payments. At the same time,
high transaction costs discourage the acceptance of electronic payment methods by micro retailers.
Small retailers mostly prefer cash. As the store size gets larger, the acceptance rate of electronic payments rises as gets more affordable for these retailers to have POS devices.
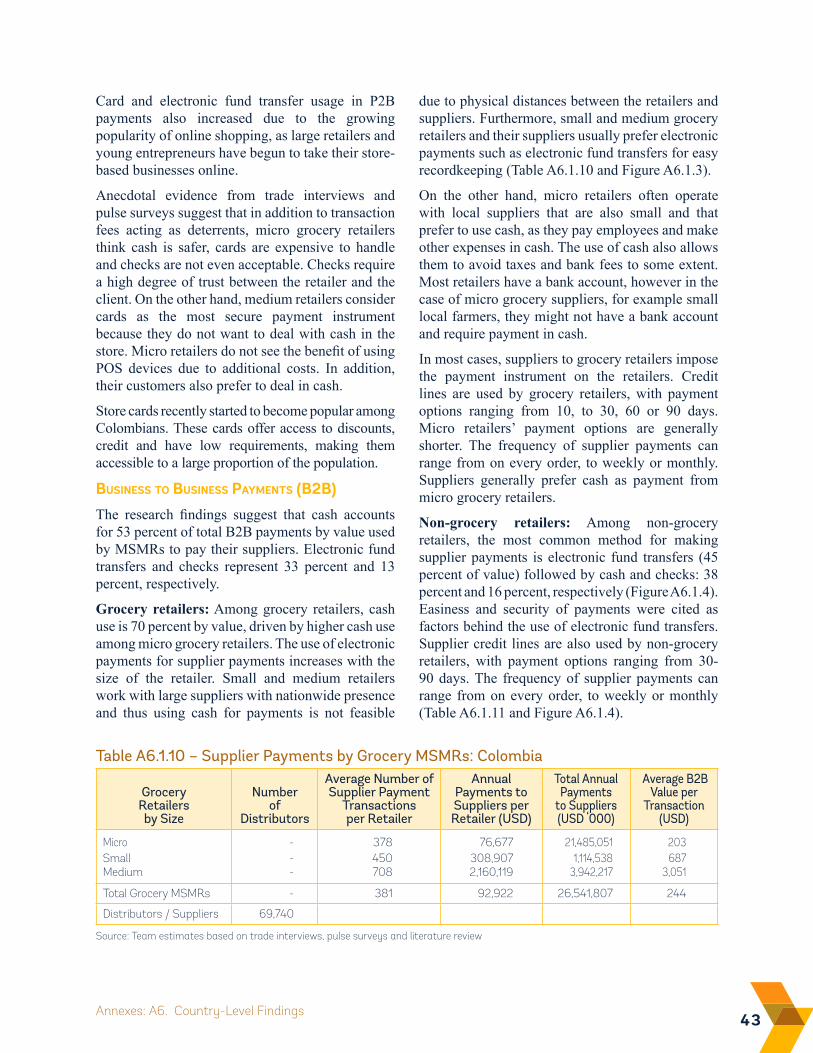
43Annexes: A6. Country-Level Findings
due to physical distances between the retailers and suppliers. Furthermore, small and medium grocery retailers and their suppliers usually prefer electronic payments such as electronic fund transfers for easy recordkeeping (Table A6.1.10 and Figure A6.1.3).
On the other hand, micro retailers often operate with local suppliers that are also small and that prefer to use cash, as they pay employees and make other expenses in cash. The use of cash also allows them to avoid taxes and bank fees to some extent. Most retailers have a bank account, however in the case of micro grocery suppliers, for example small local farmers, they might not have a bank account and require payment in cash.
In most cases, suppliers to grocery retailers impose the payment instrument on the retailers. Credit lines are used by grocery retailers, with payment options ranging from 10, to 30, 60 or 90 days. Micro retailers’ payment options are generally shorter. The frequency of supplier payments can range from on every order, to weekly or monthly. Suppliers generally prefer cash as payment from micro grocery retailers.
Non-grocery retailers: Among non-grocery retailers, the most common method for making supplier payments is electronic fund transfers (45 percent of value) followed by cash and checks: 38 percent and 16 percent, respectively (Figure A6.1.4). Easiness and security of payments were cited as factors behind the use of electronic fund transfers. Supplier credit lines are also used by non-grocery retailers, with payment options ranging from 30-90 days. The frequency of supplier payments can range from on every order, to weekly or monthly (Table A6.1.11 and Figure A6.1.4).
Grocery Retailers by Size
Number of
Distributors
Average Number of Supplier Payment
Transactions per Retailer
Annual Payments to Suppliers per Retailer (USD)
Total Annual Payments
to Suppliers (USD ‘000)
Average B2B Value per
Transaction (USD)
Micro - 378 76,677 21,485,051 203Small - 450 308,907 1,114,538 687Medium - 708 2,160,119 3,942,217 3,051
Total Grocery MSMRs - 381 92,922 26,541,807 244
Distributors / Suppliers 69,740
Table A6.1.10 – Supplier Payments by Grocery MSMRs: Colombia
Source: Team estimates based on trade interviews, pulse surveys and literature review
Card and electronic fund transfer usage in P2B payments also increased due to the growing popularity of online shopping, as large retailers and young entrepreneurs have begun to take their store-based businesses online.
Anecdotal evidence from trade interviews and pulse surveys suggest that in addition to transaction fees acting as deterrents, micro grocery retailers think cash is safer, cards are expensive to handle and checks are not even acceptable. Checks require a high degree of trust between the retailer and the client. On the other hand, medium retailers consider cards as the most secure payment instrument because they do not want to deal with cash in the store. Micro retailers do not see the benefit of using POS devices due to additional costs. In addition, their customers also prefer to deal in cash.
Store cards recently started to become popular among Colombians. These cards offer access to discounts, credit and have low requirements, making them accessible to a large proportion of the population.
Business to Business PayMents (B2B) The research findings suggest that cash accounts for 53 percent of total B2B payments by value used by MSMRs to pay their suppliers. Electronic fund transfers and checks represent 33 percent and 13 percent, respectively.
Grocery retailers: Among grocery retailers, cash use is 70 percent by value, driven by higher cash use among micro grocery retailers. The use of electronic payments for supplier payments increases with the size of the retailer. Small and medium retailers work with large suppliers with nationwide presence and thus using cash for payments is not feasible
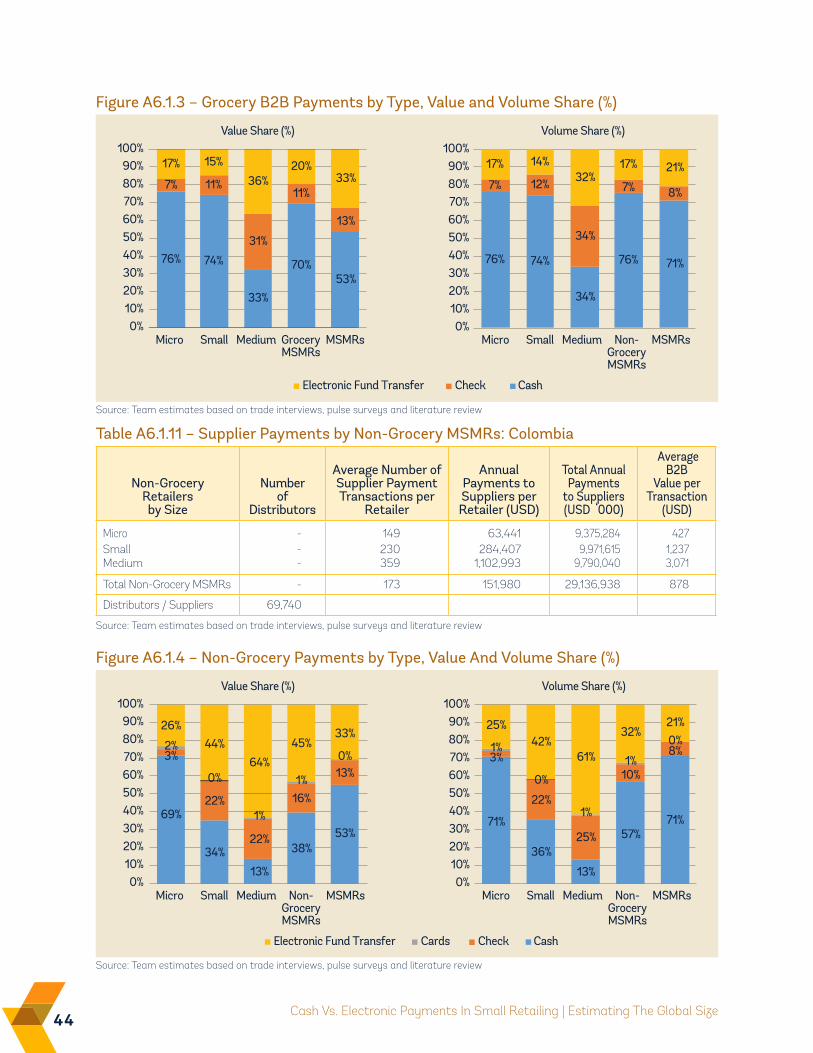
44 Cash Vs. Electronic Payments In Small Retailing | Estimating The Global Size
Figure A6.1.3 – Grocery B2B Payments by Type, Value and Volume Share (%)
100%
Micro Small Medium Non-GroceryMSMRs
MSMRsMicro Small Medium GroceryMSMRs
MSMRs
Value Share (%)
Electronic Fund Transfer Check Cash
Volume Share (%)
76% 74%
33%
70%53%
7% 11%
31%
11%
13%
17% 15%
36%20%
33%
0%10%20%30%40%50%60%70%80%90%
76% 74%
34%
76% 71%
7% 12%
34%
7% 8%
17% 14%32%
17% 21%
0%10%20%30%40%50%60%70%80%90%
100%
Source: Team estimates based on trade interviews, pulse surveys and literature review
Table A6.1.11 – Supplier Payments by Non-Grocery MSMRs: Colombia
Non-Grocery Retailers by Size
Number of
Distributors
Average Number of Supplier Payment Transactions per
Retailer
Annual Payments to Suppliers per Retailer (USD)
Total Annual Payments
to Suppliers (USD ‘000)
Average B2B
Value per Transaction
(USD)
Micro - 149 63,441 9,375,284 427Small - 230 284,407 9,971,615 1,237Medium - 359 1,102,993 9,790,040 3,071
Total Non-Grocery MSMRs - 173 151,980 29,136,938 878
Distributors / Suppliers 69,740
Source: Team estimates based on trade interviews, pulse surveys and literature review
Figure A6.1.4 – Non-Grocery Payments by Type, Value And Volume Share (%)
Electronic Fund Transfer Cards Check Cash
100%
Micro Small Medium Non-GroceryMSMRs
MSMRsMicro Small Medium Non-GroceryMSMRs
MSMRs
Value Share (%) Volume Share (%)
0%10%20%30%40%50%60%70%80%90%
0%10%20%30%40%50%60%70%80%90%
100%
69%
34%
13%
38%53%
3%
22%
22%
16%
13%
2%
1%
1%
0%
26%44%
64%
45%33%
71%
36%
13%
57%71%
3%
22%
25%
10%
8%1%
1%
1%
0%25%
42%61%
32%21%
0% 0%
Source: Team estimates based on trade interviews, pulse surveys and literature review
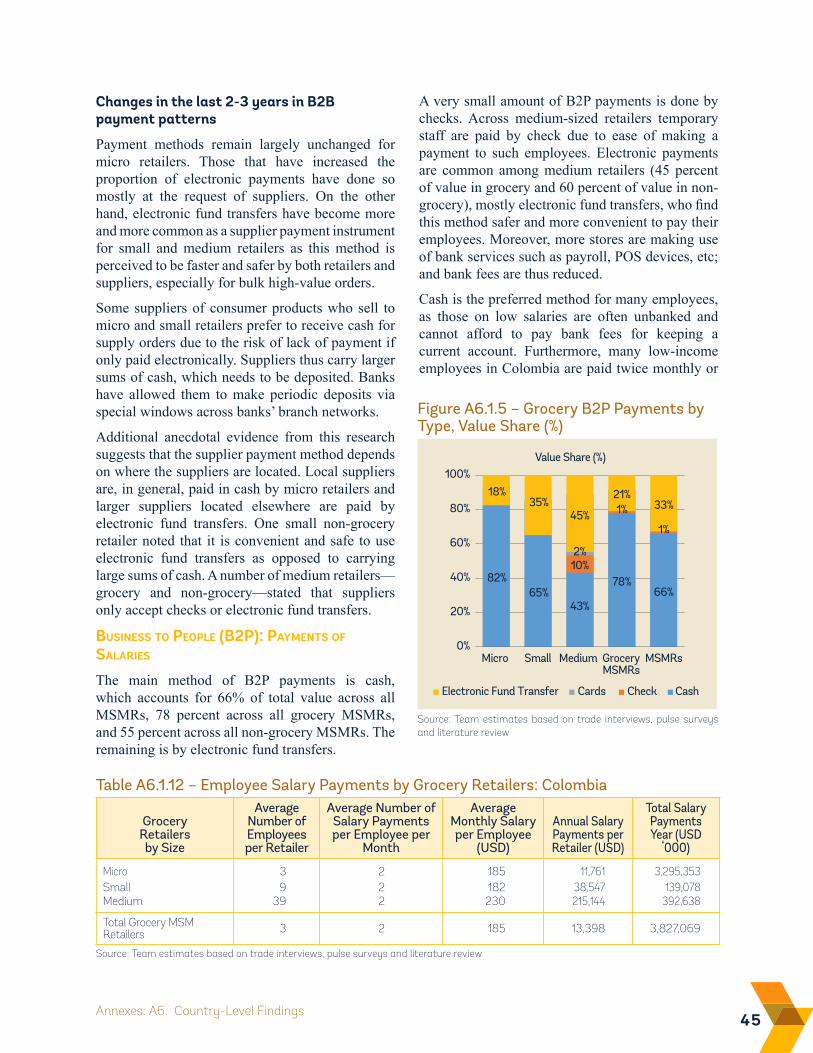
45Annexes: A6. Country-Level Findings
Changes in the last 2-3 years in B2B payment patterns
Payment methods remain largely unchanged for micro retailers. Those that have increased the proportion of electronic payments have done so mostly at the request of suppliers. On the other hand, electronic fund transfers have become more and more common as a supplier payment instrument for small and medium retailers as this method is perceived to be faster and safer by both retailers and suppliers, especially for bulk high-value orders.
Some suppliers of consumer products who sell to micro and small retailers prefer to receive cash for supply orders due to the risk of lack of payment if only paid electronically. Suppliers thus carry larger sums of cash, which needs to be deposited. Banks have allowed them to make periodic deposits via special windows across banks’ branch networks.
Additional anecdotal evidence from this research suggests that the supplier payment method depends on where the suppliers are located. Local suppliers are, in general, paid in cash by micro retailers and larger suppliers located elsewhere are paid by electronic fund transfers. One small non-grocery retailer noted that it is convenient and safe to use electronic fund transfers as opposed to carrying large sums of cash. A number of medium retailers—grocery and non-grocery—stated that suppliers only accept checks or electronic fund transfers.
Business to PeoPle (B2P): PayMents oF salaries
The main method of B2P payments is cash, which accounts for 66% of total value across all MSMRs, 78 percent across all grocery MSMRs, and 55 percent across all non-grocery MSMRs. The remaining is by electronic fund transfers.
A very small amount of B2P payments is done by checks. Across medium-sized retailers temporary staff are paid by check due to ease of making a payment to such employees. Electronic payments are common among medium retailers (45 percent of value in grocery and 60 percent of value in non-grocery), mostly electronic fund transfers, who find this method safer and more convenient to pay their employees. Moreover, more stores are making use of bank services such as payroll, POS devices, etc; and bank fees are thus reduced.
Cash is the preferred method for many employees, as those on low salaries are often unbanked and cannot afford to pay bank fees for keeping a current account. Furthermore, many low-income employees in Colombia are paid twice monthly or
Table A6.1.12 – Employee Salary Payments by Grocery Retailers: Colombia
Grocery Retailers by Size
Average Number of Employees per Retailer
Average Number of Salary Payments per Employee per
Month
Average Monthly Salary per Employee
(USD)
Annual Salary Payments per Retailer (USD)
Total Salary Payments Year (USD
‘000)
Micro 3 2 185 11,761 3,295,353Small 9 2 182 38,547 139,078Medium 39 2 230 215,144 392,638
Total Grocery MSM Retailers 3 2 185 13,398 3,827,069
Source: Team estimates based on trade interviews, pulse surveys and literature review
Figure A6.1.5 – Grocery B2P Payments by Type, Value Share (%)
0%
20%
40%
60%
80%
100%
Micro Small Medium GroceryMSMRs
MSMRs
Value Share (%)
Electronic Fund Transfer Cards Check Cash
82%65%
43%
78%66%
10%
1%
1%
2%
18%35%
45%
21%33%
Source: Team estimates based on trade interviews, pulse surveys and literature review
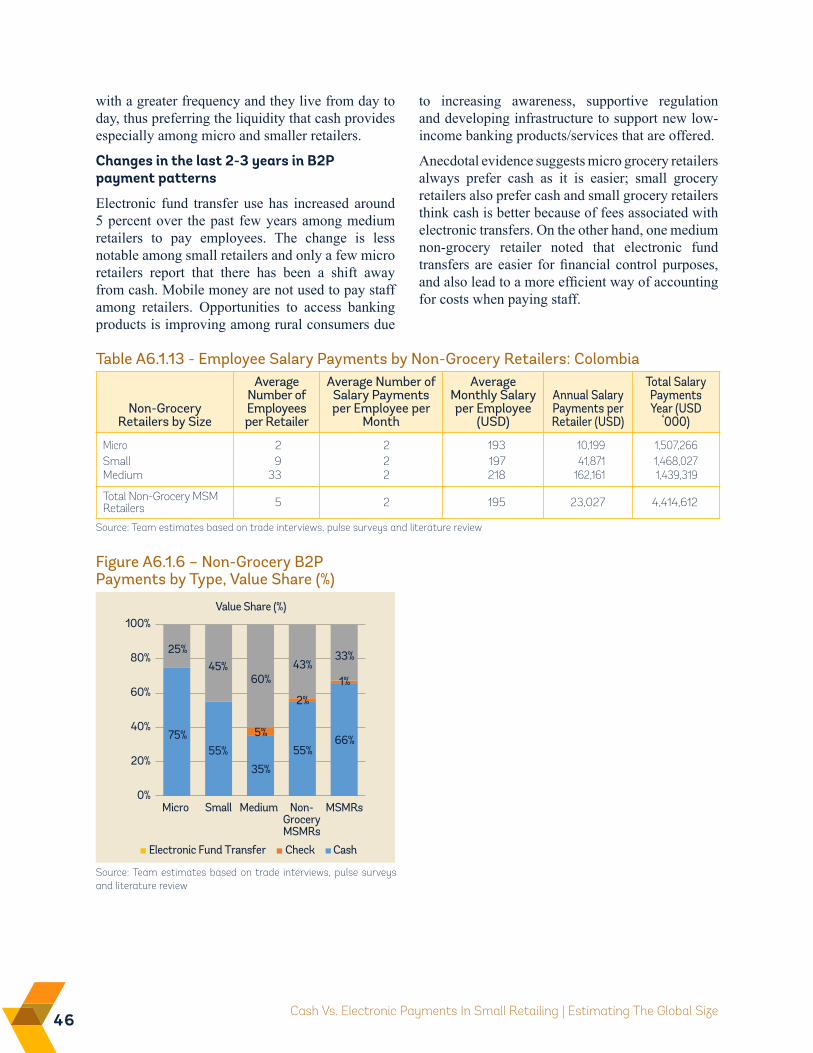
46 Cash Vs. Electronic Payments In Small Retailing | Estimating The Global Size
with a greater frequency and they live from day to day, thus preferring the liquidity that cash provides especially among micro and smaller retailers.
Changes in the last 2-3 years in B2P payment patterns
Electronic fund transfer use has increased around 5 percent over the past few years among medium retailers to pay employees. The change is less notable among small retailers and only a few micro retailers report that there has been a shift away from cash. Mobile money are not used to pay staff among retailers. Opportunities to access banking products is improving among rural consumers due
Table A6.1.13 - Employee Salary Payments by Non-Grocery Retailers: Colombia
Non-Grocery Retailers by Size
Average Number of Employees per Retailer
Average Number of Salary Payments per Employee per
Month
Average Monthly Salary per Employee
(USD)
Annual Salary Payments per Retailer (USD)
Total Salary Payments Year (USD
‘000)
Micro 2 2 193 10,199 1,507,266Small 9 2 197 41,871 1,468,027Medium 33 2 218 162,161 1,439,319
Total Non-Grocery MSM Retailers 5 2 195 23,027 4,414,612
Source: Team estimates based on trade interviews, pulse surveys and literature review
Figure A6.1.6 – Non-Grocery B2P Payments by Type, Value Share (%)
0%
20%
40%
60%
80%
100%
Micro Small Medium Non-GroceryMSMRs
MSMRs
Value Share (%)
Electronic Fund Transfer Check Cash
75%55%
35%
55%66%
5%
2%
1%
25%45%
60%43%
33%
Source: Team estimates based on trade interviews, pulse surveys and literature review
to increasing awareness, supportive regulation and developing infrastructure to support new low-income banking products/services that are offered.
Anecdotal evidence suggests micro grocery retailers always prefer cash as it is easier; small grocery retailers also prefer cash and small grocery retailers think cash is better because of fees associated with electronic transfers. On the other hand, one medium non-grocery retailer noted that electronic fund transfers are easier for financial control purposes, and also lead to a more efficient way of accounting for costs when paying staff.
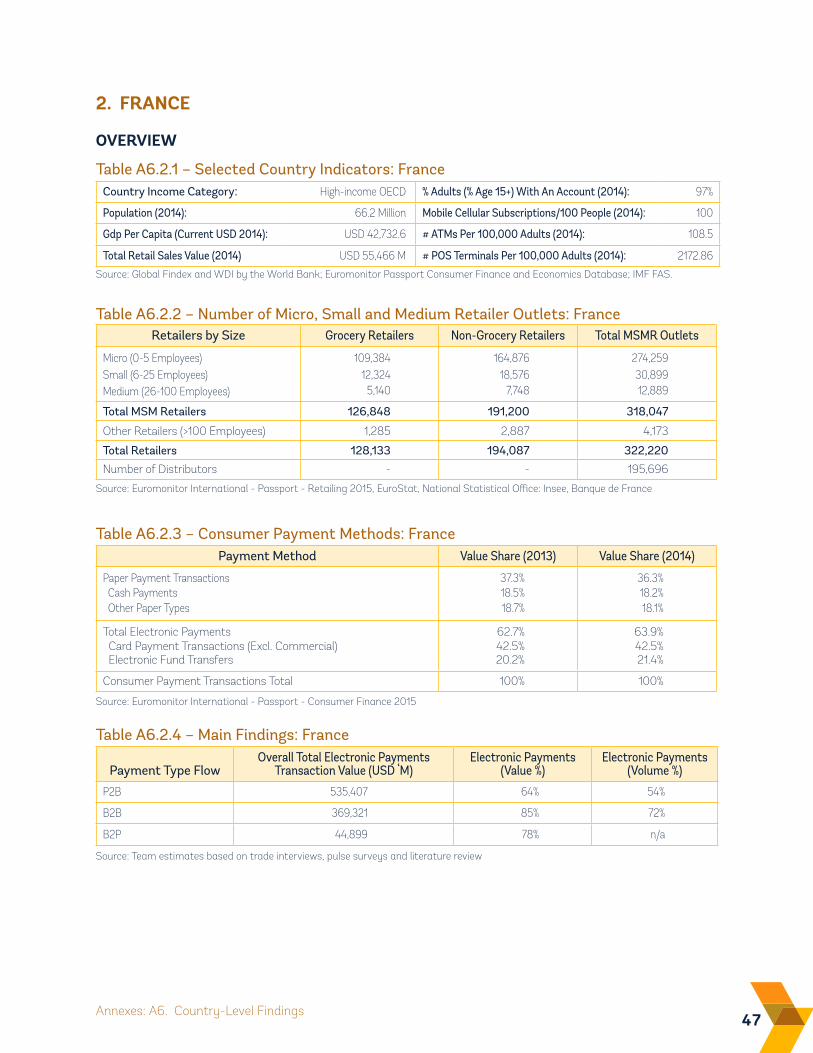
47Annexes: A6. Country-Level Findings
Table A6.2.2 – Number of Micro, Small and Medium Retailer Outlets: France
Source: Euromonitor International - Passport - Retailing 2015, EuroStat, National Statistical Office: Insee, Banque de France
Payment Method Value Share (2013) Value Share (2014)
Paper Payment Transactions 37.3% 36.3% Cash Payments 18.5% 18.2% Other Paper Types 18.7% 18.1%
Total Electronic Payments 62.7% 63.9% Card Payment Transactions (Excl. Commercial) 42.5% 42.5% Electronic Fund Transfers 20.2% 21.4%
Consumer Payment Transactions Total 100% 100%
Table A6.2.3 – Consumer Payment Methods: France
Source: Euromonitor International - Passport - Consumer Finance 2015
Payment Type FlowOverall Total Electronic Payments
Transaction Value (USD ‘M)Electronic Payments
(Value %)Electronic Payments
(Volume %)
P2B 535,407 64% 54%
B2B 369,321 85% 72%
B2P 44,899 78% n/a
Table A6.2.4 – Main Findings: France
Source: Team estimates based on trade interviews, pulse surveys and literature review
2. FRANCE
OvERviEW
Country Income Category: High-income OECD % Adults (% Age 15+) With An Account (2014): 97%
Population (2014): 66.2 Million Mobile Cellular Subscriptions/100 People (2014): 100
Gdp Per Capita (Current USD 2014): USD 42,732.6 # ATMs Per 100,000 Adults (2014): 108.5
Total Retail Sales Value (2014) USD 55,466 M # POS Terminals Per 100,000 Adults (2014): 2172.86
Table A6.2.1 – Selected Country Indicators: France
Source: Global Findex and WDI by the World Bank; Euromonitor Passport Consumer Finance and Economics Database; IMF FAS.
Retailers by Size Grocery Retailers Non-Grocery Retailers Total MSMR Outlets
Micro (0-5 Employees) 109,384 164,876 274,259Small (6-25 Employees) 12,324 18,576 30,899Medium (26-100 Employees) 5,140 7,748 12,889
Total MSM Retailers 126,848 191,200 318,047
Other Retailers (>100 Employees) 1,285 2,887 4,173
Total Retailers 128,133 194,087 322,220
Number of Distributors - - 195,696
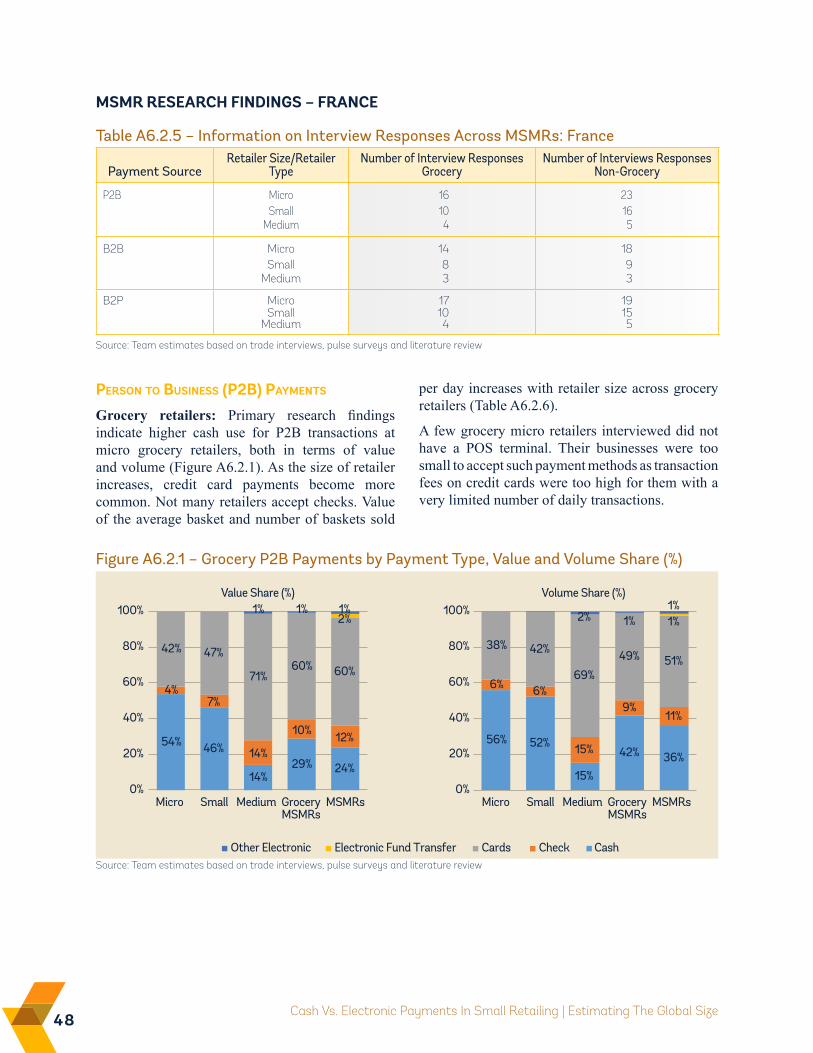
48 Cash Vs. Electronic Payments In Small Retailing | Estimating The Global Size
MSMR RESEARCH FiNDiNGS – FRANCE
Person to Business (P2B) PayMents
Grocery retailers: Primary research findings indicate higher cash use for P2B transactions at micro grocery retailers, both in terms of value and volume (Figure A6.2.1). As the size of retailer increases, credit card payments become more common. Not many retailers accept checks. Value of the average basket and number of baskets sold
Figure A6.2.1 – Grocery P2B Payments by Payment Type, Value and Volume Share (%)
0%
20%
40%
60%
80%
100%
Micro Small Medium GroceryMSMRs
MSMRsMicro Small Medium GroceryMSMRs
MSMRs
Value Share (%)
Other Electronic Electronic Fund Transfer Cards Check Cash
0%
20%
40%
60%
80%
100%Volume Share (%)
54% 46%
14%29% 24%
4%7%
14%
10% 12%
42% 47%
71%60% 60%
2%1% 1% 1%
56% 52%
15%
42% 36%
6% 6%
15%
9%11%
38% 42%
69%
49% 51%
1%2% 1% 1%
per day increases with retailer size across grocery retailers (Table A6.2.6).
A few grocery micro retailers interviewed did not have a POS terminal. Their businesses were too small to accept such payment methods as transaction fees on credit cards were too high for them with a very limited number of daily transactions.
Source: Team estimates based on trade interviews, pulse surveys and literature review
Payment SourceRetailer Size/Retailer
TypeNumber of Interview Responses
GroceryNumber of Interviews Responses
Non-Grocery
P2B Micro 16 23Small 10 16
Medium 4 5
B2B Micro 14 18Small 8 9
Medium 3 3
B2P Micro 17 19Small 10 15
Medium 4 5
Table A6.2.5 – Information on Interview Responses Across MSMRs: France
Source: Team estimates based on trade interviews, pulse surveys and literature review
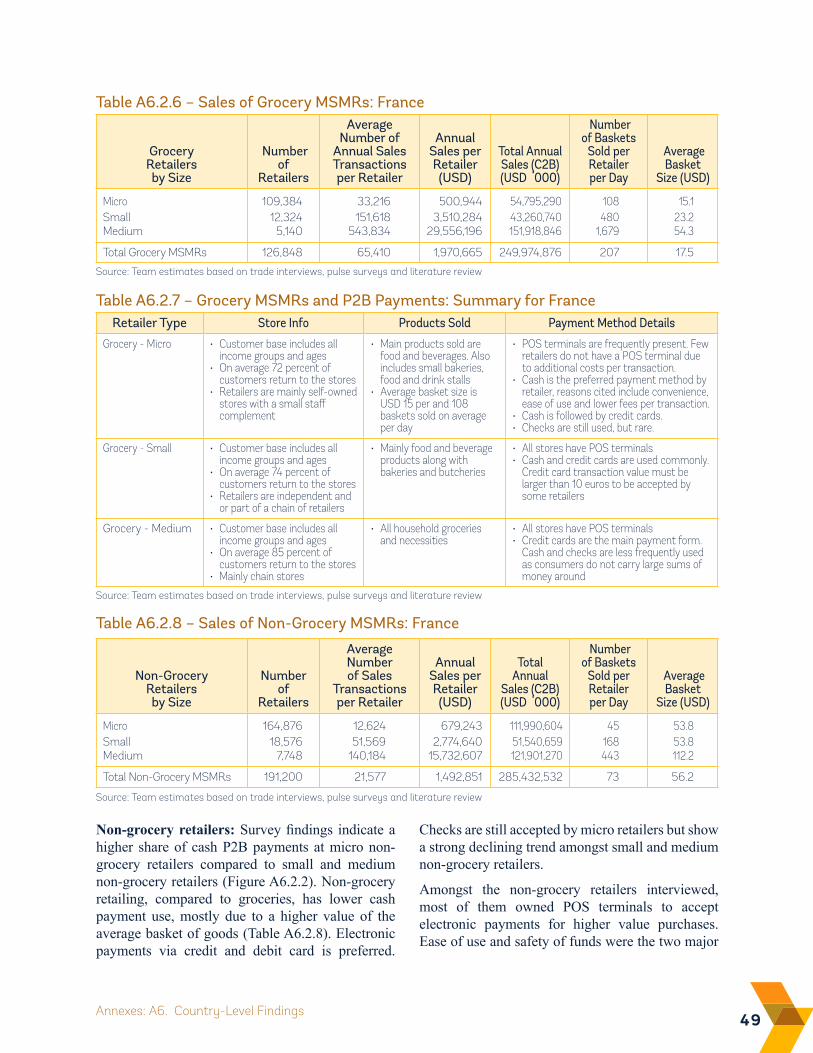
49Annexes: A6. Country-Level Findings
Table A6.2.6 – Sales of Grocery MSMRs: France
Source: Team estimates based on trade interviews, pulse surveys and literature review
Retailer Type Store Info Products Sold Payment Method Details
Grocery - Micro • Customer base includes all income groups and ages
• On average 72 percent of customers return to the stores
• Retailers are mainly self-owned stores with a small staff complement
• Main products sold are food and beverages. Also includes small bakeries, food and drink stalls
• Average basket size is USD 15 per and 108 baskets sold on average per day
• POS terminals are frequently present. Few retailers do not have a POS terminal due to additional costs per transaction.
• Cash is the preferred payment method by retailer, reasons cited include convenience, ease of use and lower fees per transaction.
• Cash is followed by credit cards.• Checks are still used, but rare.
Grocery - Small • Customer base includes all income groups and ages
• On average 74 percent of customers return to the stores
• Retailers are independent and or part of a chain of retailers
• Mainly food and beverage products along with bakeries and butcheries
• All stores have POS terminals• Cash and credit cards are used commonly.
Credit card transaction value must be larger than 10 euros to be accepted by some retailers
Grocery - Medium • Customer base includes all income groups and ages
• On average 85 percent of customers return to the stores
• Mainly chain stores
• All household groceries and necessities
• All stores have POS terminals• Credit cards are the main payment form.
Cash and checks are less frequently used as consumers do not carry large sums of money around
Table A6.2.7 – Grocery MSMRs and P2B Payments: Summary for France
Source: Team estimates based on trade interviews, pulse surveys and literature review
Non-Grocery Retailers by Size
Number of
Retailers
Average Number of Sales
Transactions per Retailer
Annual Sales per Retailer (USD)
Total Annual
Sales (C2B) (USD ‘000)
Number of Baskets
Sold per Retailer per Day
Average Basket
Size (USD)
Micro 164,876 12,624 679,243 111,990,604 45 53.8Small 18,576 51,569 2,774,640 51,540,659 168 53.8Medium 7,748 140,184 15,732,607 121,901,270 443 112.2
Total Non-Grocery MSMRs 191,200 21,577 1,492,851 285,432,532 73 56.2
Table A6.2.8 – Sales of Non-Grocery MSMRs: France
Source: Team estimates based on trade interviews, pulse surveys and literature review
Non-grocery retailers: Survey findings indicate a higher share of cash P2B payments at micro non-grocery retailers compared to small and medium non-grocery retailers (Figure A6.2.2). Non-grocery retailing, compared to groceries, has lower cash payment use, mostly due to a higher value of the average basket of goods (Table A6.2.8). Electronic payments via credit and debit card is preferred.
Checks are still accepted by micro retailers but show a strong declining trend amongst small and medium non-grocery retailers.
Amongst the non-grocery retailers interviewed, most of them owned POS terminals to accept electronic payments for higher value purchases. Ease of use and safety of funds were the two major
Grocery Retailers by Size
Number of
Retailers
Average Number of
Annual Sales Transactions per Retailer
Annual Sales per Retailer (USD)
Total Annual Sales (C2B) (USD ‘000)
Number of Baskets
Sold per Retailer per Day
Average Basket
Size (USD)
Micro 109,384 33,216 500,944 54,795,290 108 15.1Small 12,324 151,618 3,510,284 43,260,740 480 23.2Medium 5,140 543,834 29,556,196 151,918,846 1,679 54.3
Total Grocery MSMRs 126,848 65,410 1,970,665 249,974,876 207 17.5
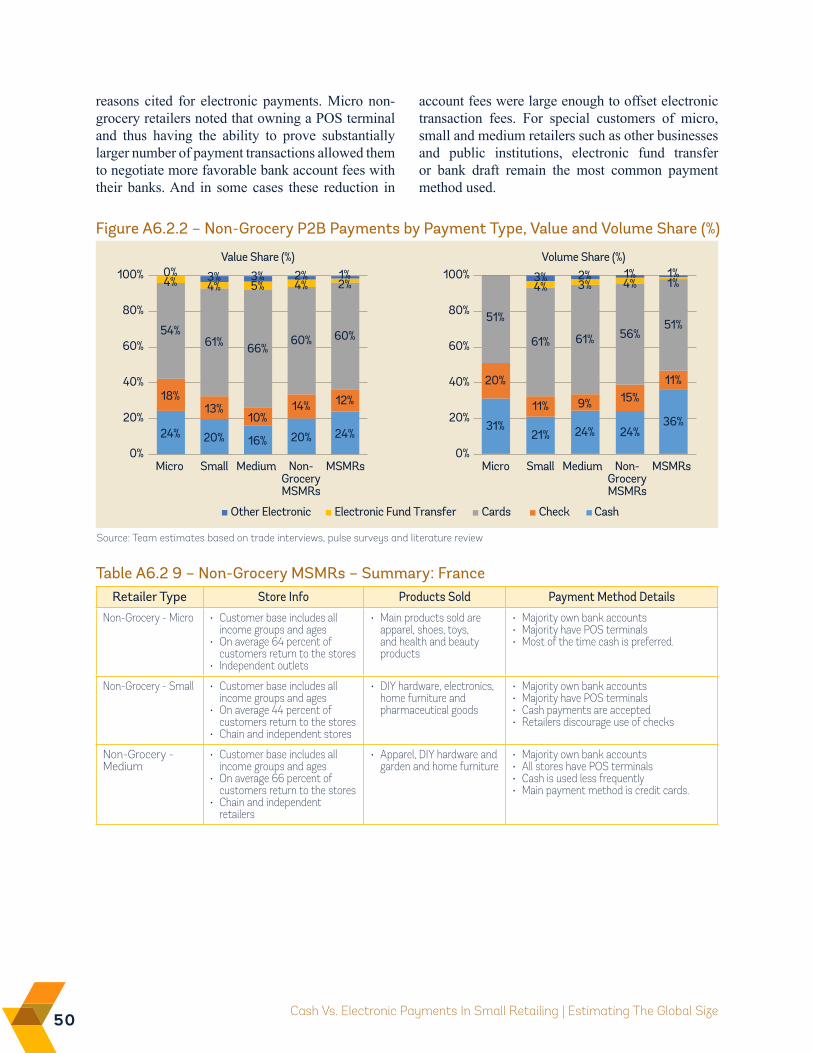
50 Cash Vs. Electronic Payments In Small Retailing | Estimating The Global Size
Figure A6.2.2 – Non-Grocery P2B Payments by Payment Type, Value and Volume Share (%)
0%
20%
40%
60%
80%
100%
Micro Small Medium Non-GroceryMSMRs
MSMRsMicro Small Medium Non-GroceryMSMRs
MSMRs
Value Share (%)
Other Electronic Electronic Fund Transfer Cards Check Cash
0%
20%
40%
60%
80%
100%Volume Share (%)
24% 20% 16% 20% 24%
18%13%
10%14% 12%
54%61% 66%
60% 60%
4% 4% 5% 4% 2%0% 3% 3% 2% 1%
31%21% 24% 24%
36%
20%
11% 9% 15%11%
51%
61% 61% 56%51%
4% 3% 4% 1%3% 2% 1% 1%
Retailer Type Store Info Products Sold Payment Method Details
Non-Grocery - Micro • Customer base includes all income groups and ages
• On average 64 percent of customers return to the stores
• Independent outlets
• Main products sold are apparel, shoes, toys, and health and beauty products
• Majority own bank accounts• Majority have POS terminals• Most of the time cash is preferred.
Non-Grocery - Small • Customer base includes all income groups and ages
• On average 44 percent of customers return to the stores
• Chain and independent stores
• DIY hardware, electronics, home furniture and pharmaceutical goods
• Majority own bank accounts• Majority have POS terminals• Cash payments are accepted• Retailers discourage use of checks
Non-Grocery - Medium
• Customer base includes all income groups and ages
• On average 66 percent of customers return to the stores
• Chain and independent retailers
• Apparel, DIY hardware and garden and home furniture
• Majority own bank accounts• All stores have POS terminals• Cash is used less frequently • Main payment method is credit cards.
Table A6.2 9 – Non-Grocery MSMRs – Summary: France
Source: Team estimates based on trade interviews, pulse surveys and literature review
reasons cited for electronic payments. Micro non-grocery retailers noted that owning a POS terminal and thus having the ability to prove substantially larger number of payment transactions allowed them to negotiate more favorable bank account fees with their banks. And in some cases these reduction in
account fees were large enough to offset electronic transaction fees. For special customers of micro, small and medium retailers such as other businesses and public institutions, electronic fund transfer or bank draft remain the most common payment method used.
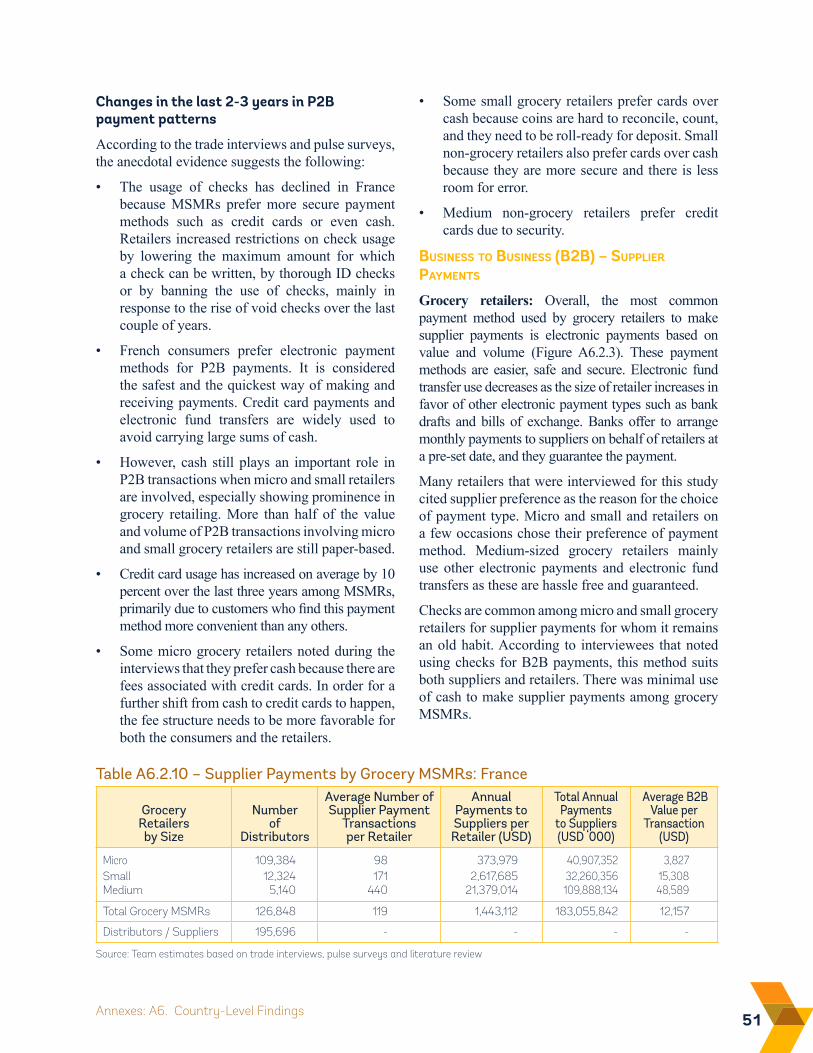
51Annexes: A6. Country-Level Findings
Grocery Retailers by Size
Number of
Distributors
Average Number of Supplier Payment
Transactions per Retailer
Annual Payments to Suppliers per Retailer (USD)
Total Annual Payments
to Suppliers (USD ‘000)
Average B2B Value per
Transaction (USD)
Micro 109,384 98 373,979 40,907,352 3,827Small 12,324 171 2,617,685 32,260,356 15,308Medium 5,140 440 21,379,014 109,888,134 48,589
Total Grocery MSMRs 126,848 119 1,443,112 183,055,842 12,157
Distributors / Suppliers 195,696 - - - -
Table A6.2.10 – Supplier Payments by Grocery MSMRs: France
Source: Team estimates based on trade interviews, pulse surveys and literature review
Changes in the last 2-3 years in P2B payment patterns
According to the trade interviews and pulse surveys, the anecdotal evidence suggests the following:
• The usage of checks has declined in France because MSMRs prefer more secure payment methods such as credit cards or even cash. Retailers increased restrictions on check usage by lowering the maximum amount for which a check can be written, by thorough ID checks or by banning the use of checks, mainly in response to the rise of void checks over the last couple of years.
• French consumers prefer electronic payment methods for P2B payments. It is considered the safest and the quickest way of making and receiving payments. Credit card payments and electronic fund transfers are widely used to avoid carrying large sums of cash.
• However, cash still plays an important role in P2B transactions when micro and small retailers are involved, especially showing prominence in grocery retailing. More than half of the value and volume of P2B transactions involving micro and small grocery retailers are still paper-based.
• Credit card usage has increased on average by 10 percent over the last three years among MSMRs, primarily due to customers who find this payment method more convenient than any others.
• Some micro grocery retailers noted during the interviews that they prefer cash because there are fees associated with credit cards. In order for a further shift from cash to credit cards to happen, the fee structure needs to be more favorable for both the consumers and the retailers.
• Some small grocery retailers prefer cards over cash because coins are hard to reconcile, count, and they need to be roll-ready for deposit. Small non-grocery retailers also prefer cards over cash because they are more secure and there is less room for error.
• Medium non-grocery retailers prefer credit cards due to security.
Business to Business (B2B) – suPPlier PayMents
Grocery retailers: Overall, the most common payment method used by grocery retailers to make supplier payments is electronic payments based on value and volume (Figure A6.2.3). These payment methods are easier, safe and secure. Electronic fund transfer use decreases as the size of retailer increases in favor of other electronic payment types such as bank drafts and bills of exchange. Banks offer to arrange monthly payments to suppliers on behalf of retailers at a pre-set date, and they guarantee the payment.
Many retailers that were interviewed for this study cited supplier preference as the reason for the choice of payment type. Micro and small and retailers on a few occasions chose their preference of payment method. Medium-sized grocery retailers mainly use other electronic payments and electronic fund transfers as these are hassle free and guaranteed.
Checks are common among micro and small grocery retailers for supplier payments for whom it remains an old habit. According to interviewees that noted using checks for B2B payments, this method suits both suppliers and retailers. There was minimal use of cash to make supplier payments among grocery MSMRs.
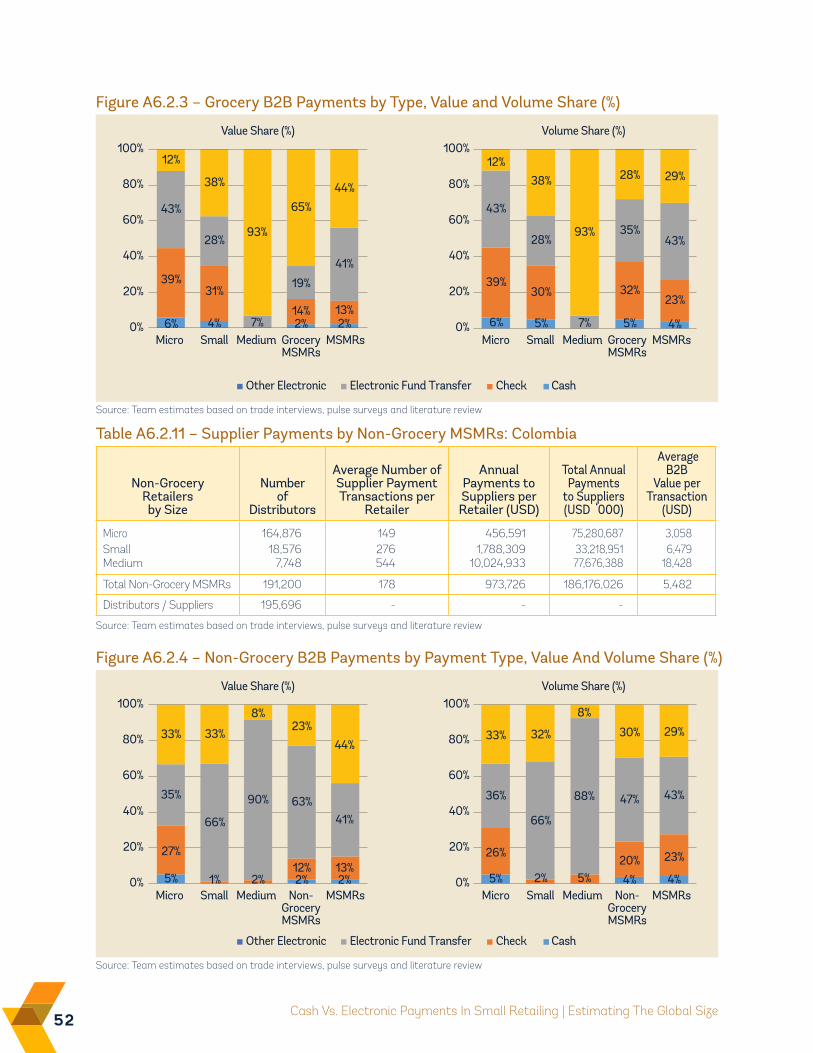
52 Cash Vs. Electronic Payments In Small Retailing | Estimating The Global Size
Figure A6.2.3 – Grocery B2B Payments by Type, Value and Volume Share (%)
0%
20%
40%
60%
80%
100%
Micro Small Medium GroceryMSMRs
MSMRsMicro Small Medium GroceryMSMRs
MSMRs
Value Share (%)
Other Electronic Electronic Fund Transfer Check Cash
0%
20%
40%
60%
80%
100%Volume Share (%)
6% 4% 2% 2%
39%31%
14% 13%
43%
28%
7%
19%
41%
12%
38%
93%
65%44%
6% 5% 5% 4%
39%30% 32%
23%
43%
28%
7%
35%43%
12%38%
93%
28% 29%
Source: Team estimates based on trade interviews, pulse surveys and literature review
Table A6.2.11 – Supplier Payments by Non-Grocery MSMRs: Colombia
Non-Grocery Retailers by Size
Number of
Distributors
Average Number of Supplier Payment Transactions per
Retailer
Annual Payments to Suppliers per Retailer (USD)
Total Annual Payments
to Suppliers (USD ‘000)
Average B2B
Value per Transaction
(USD)
Micro 164,876 149 456,591 75,280,687 3,058Small 18,576 276 1,788,309 33,218,951 6,479Medium 7,748 544 10,024,933 77,676,388 18,428
Total Non-Grocery MSMRs 191,200 178 973,726 186,176,026 5,482
Distributors / Suppliers 195,696 - - -
Source: Team estimates based on trade interviews, pulse surveys and literature review
Figure A6.2.4 – Non-Grocery B2B Payments by Payment Type, Value And Volume Share (%)
0%
20%
40%
60%
80%
100%
Micro Small Medium Non-GroceryMSMRs
MSMRsMicro Small Medium Non-GroceryMSMRs
MSMRs
Value Share (%)
Other Electronic Electronic Fund Transfer Check Cash
0%
20%
40%
60%
80%
100%Volume Share (%)
12%
5% 2% 2%
27%
1% 2%12% 13%
35%
66%
90% 63%41%
33% 33%
8%23%
44%
5% 4% 4%
26%
2% 5%20% 23%
36%
66%
88% 47% 43%
33% 32%
8%
30% 29%
Source: Team estimates based on trade interviews, pulse surveys and literature review
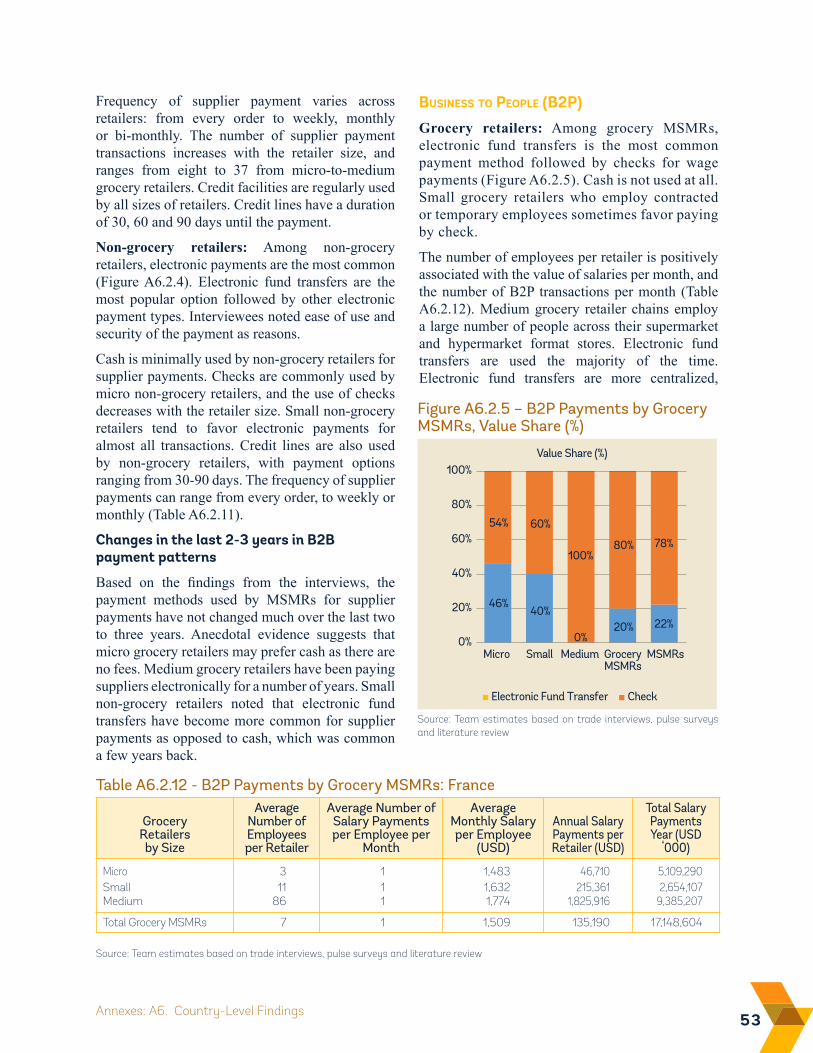
53Annexes: A6. Country-Level Findings
Table A6.2.12 - B2P Payments by Grocery MSMRs: France
Grocery Retailers by Size
Average Number of Employees per Retailer
Average Number of Salary Payments per Employee per
Month
Average Monthly Salary per Employee
(USD)
Annual Salary Payments per Retailer (USD)
Total Salary Payments Year (USD
‘000)
Micro 3 1 1,483 46,710 5,109,290Small 11 1 1,632 215,361 2,654,107Medium 86 1 1,774 1,825,916 9,385,207
Total Grocery MSMRs 7 1 1,509 135,190 17,148,604
Source: Team estimates based on trade interviews, pulse surveys and literature review
Figure A6.2.5 – B2P Payments by Grocery MSMRs, Value Share (%)
0%
20%
40%
60%
80%
100%
Micro Small Medium GroceryMSMRs
MSMRs
Value Share (%)
Electronic Fund Transfer Check
46%40%
0%20% 22%
54% 60%
100%80% 78%
Source: Team estimates based on trade interviews, pulse surveys and literature review
Frequency of supplier payment varies across retailers: from every order to weekly, monthly or bi-monthly. The number of supplier payment transactions increases with the retailer size, and ranges from eight to 37 from micro-to-medium grocery retailers. Credit facilities are regularly used by all sizes of retailers. Credit lines have a duration of 30, 60 and 90 days until the payment.
Non-grocery retailers: Among non-grocery retailers, electronic payments are the most common (Figure A6.2.4). Electronic fund transfers are the most popular option followed by other electronic payment types. Interviewees noted ease of use and security of the payment as reasons.
Cash is minimally used by non-grocery retailers for supplier payments. Checks are commonly used by micro non-grocery retailers, and the use of checks decreases with the retailer size. Small non-grocery retailers tend to favor electronic payments for almost all transactions. Credit lines are also used by non-grocery retailers, with payment options ranging from 30-90 days. The frequency of supplier payments can range from every order, to weekly or monthly (Table A6.2.11).
Changes in the last 2-3 years in B2B payment patterns
Based on the findings from the interviews, the payment methods used by MSMRs for supplier payments have not changed much over the last two to three years. Anecdotal evidence suggests that micro grocery retailers may prefer cash as there are no fees. Medium grocery retailers have been paying suppliers electronically for a number of years. Small non-grocery retailers noted that electronic fund transfers have become more common for supplier payments as opposed to cash, which was common a few years back.
Business to PeoPle (B2P)Grocery retailers: Among grocery MSMRs, electronic fund transfers is the most common payment method followed by checks for wage payments (Figure A6.2.5). Cash is not used at all. Small grocery retailers who employ contracted or temporary employees sometimes favor paying by check.
The number of employees per retailer is positively associated with the value of salaries per month, and the number of B2P transactions per month (Table A6.2.12). Medium grocery retailer chains employ a large number of people across their supermarket and hypermarket format stores. Electronic fund transfers are used the majority of the time. Electronic fund transfers are more centralized,
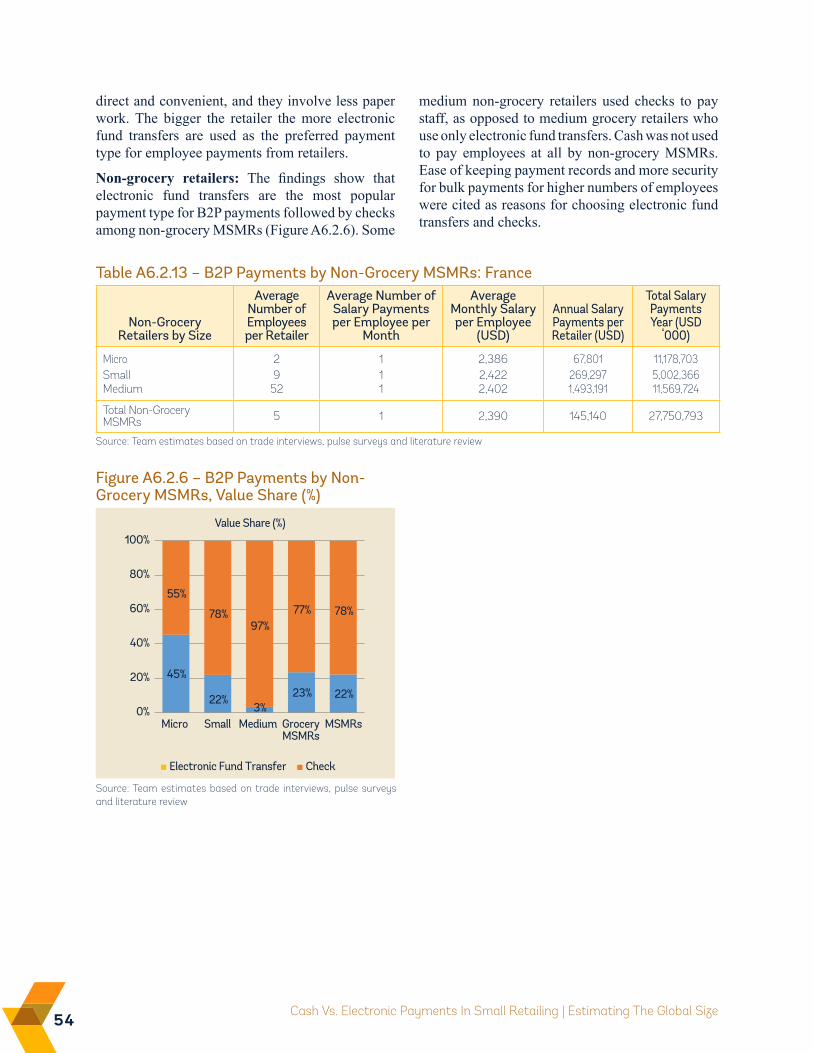
54 Cash Vs. Electronic Payments In Small Retailing | Estimating The Global Size
Table A6.2.13 – B2P Payments by Non-Grocery MSMRs: France
Non-Grocery Retailers by Size
Average Number of Employees per Retailer
Average Number of Salary Payments per Employee per
Month
Average Monthly Salary per Employee
(USD)
Annual Salary Payments per Retailer (USD)
Total Salary Payments Year (USD
‘000)
Micro 2 1 2,386 67,801 11,178,703Small 9 1 2,422 269,297 5,002,366Medium 52 1 2,402 1,493,191 11,569,724
Total Non-Grocery MSMRs 5 1 2,390 145,140 27,750,793
Source: Team estimates based on trade interviews, pulse surveys and literature review
Figure A6.2.6 – B2P Payments by Non-Grocery MSMRs, Value Share (%)
0%
20%
40%
60%
80%
100%
Micro Small Medium GroceryMSMRs
MSMRs
Value Share (%)
Electronic Fund Transfer Check
45%
22%3%
23% 22%
55%
78%97%
77% 78%
Source: Team estimates based on trade interviews, pulse surveys and literature review
direct and convenient, and they involve less paper work. The bigger the retailer the more electronic fund transfers are used as the preferred payment type for employee payments from retailers.
Non-grocery retailers: The findings show that electronic fund transfers are the most popular payment type for B2P payments followed by checks among non-grocery MSMRs (Figure A6.2.6). Some
medium non-grocery retailers used checks to pay staff, as opposed to medium grocery retailers who use only electronic fund transfers. Cash was not used to pay employees at all by non-grocery MSMRs. Ease of keeping payment records and more security for bulk payments for higher numbers of employees were cited as reasons for choosing electronic fund transfers and checks.
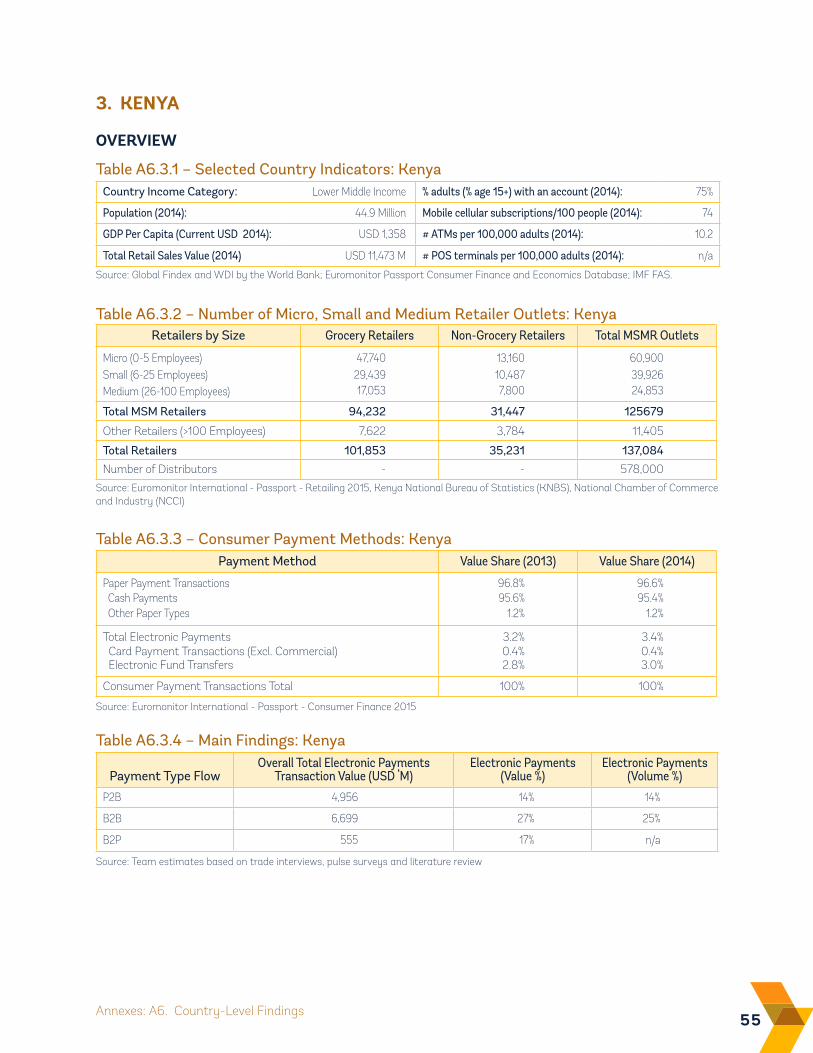
55Annexes: A6. Country-Level Findings
Table A6.3.2 – Number of Micro, Small and Medium Retailer Outlets: Kenya
Source: Euromonitor International - Passport - Retailing 2015, Kenya National Bureau of Statistics (KNBS), National Chamber of Commerce and Industry (NCCI)
Payment Method Value Share (2013) Value Share (2014)
Paper Payment Transactions 96.8% 96.6% Cash Payments 95.6% 95.4% Other Paper Types 1.2% 1.2%
Total Electronic Payments 3.2% 3.4% Card Payment Transactions (Excl. Commercial) 0.4% 0.4% Electronic Fund Transfers 2.8% 3.0%
Consumer Payment Transactions Total 100% 100%
Table A6.3.3 – Consumer Payment Methods: Kenya
Source: Euromonitor International - Passport - Consumer Finance 2015
Payment Type FlowOverall Total Electronic Payments
Transaction Value (USD ‘M)Electronic Payments
(Value %)Electronic Payments
(Volume %)
P2B 4,956 14% 14%
B2B 6,699 27% 25%
B2P 555 17% n/a
Table A6.3.4 – Main Findings: Kenya
Source: Team estimates based on trade interviews, pulse surveys and literature review
3. KENYA
OvERviEW
Country Income Category: Lower Middle Income % adults (% age 15+) with an account (2014): 75%
Population (2014): 44.9 Million Mobile cellular subscriptions/100 people (2014): 74
GDP Per Capita (Current USD 2014): USD 1,358 # ATMs per 100,000 adults (2014): 10.2
Total Retail Sales Value (2014) USD 11,473 M # POS terminals per 100,000 adults (2014): n/a
Table A6.3.1 – Selected Country Indicators: Kenya
Source: Global Findex and WDI by the World Bank; Euromonitor Passport Consumer Finance and Economics Database; IMF FAS.
Retailers by Size Grocery Retailers Non-Grocery Retailers Total MSMR Outlets
Micro (0-5 Employees) 47,740 13,160 60,900Small (6-25 Employees) 29,439 10,487 39,926Medium (26-100 Employees) 17,053 7,800 24,853
Total MSM Retailers 94,232 31,447 125679
Other Retailers (>100 Employees) 7,622 3,784 11,405
Total Retailers 101,853 35,231 137,084
Number of Distributors - - 578,000
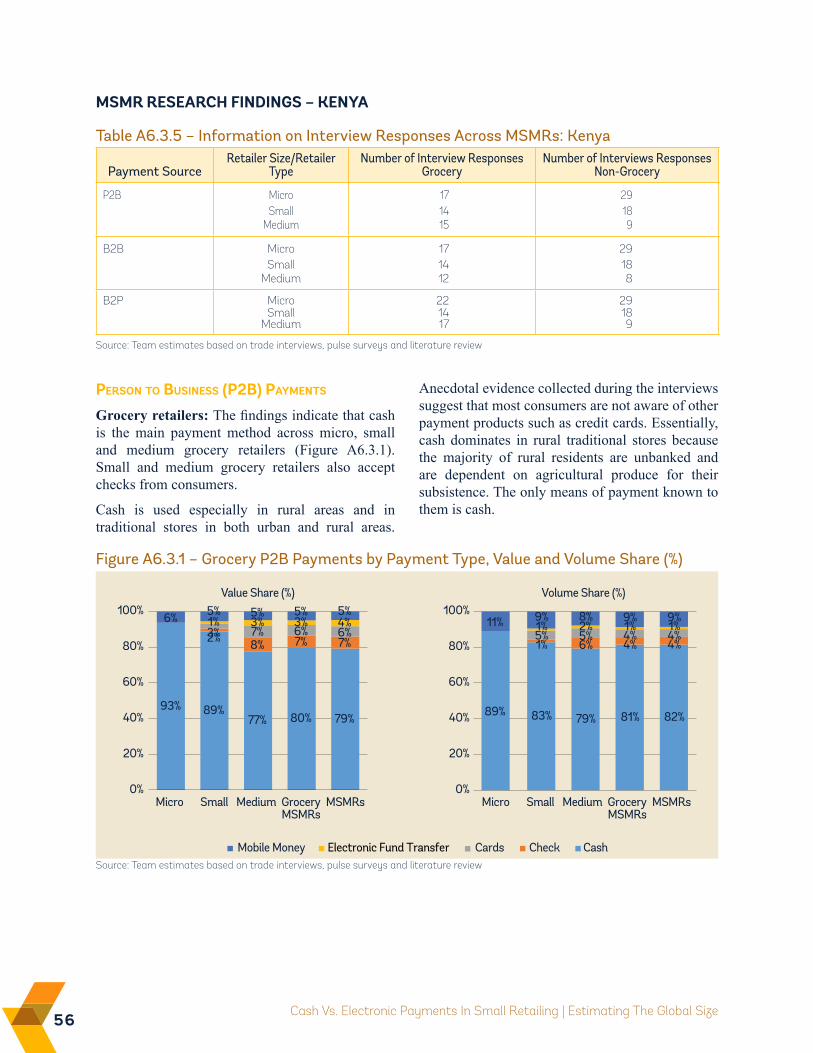
56 Cash Vs. Electronic Payments In Small Retailing | Estimating The Global Size
MSMR RESEARCH FiNDiNGS – KENYA
Person to Business (P2B) PayMents
Grocery retailers: The findings indicate that cash is the main payment method across micro, small and medium grocery retailers (Figure A6.3.1). Small and medium grocery retailers also accept checks from consumers.
Cash is used especially in rural areas and in traditional stores in both urban and rural areas.
Figure A6.3.1 – Grocery P2B Payments by Payment Type, Value and Volume Share (%)
Mobile Money Electronic Fund Transfer Cards CashCheck
0%
20%
40%
60%
80%
100%
Micro Small Medium GroceryMSMRs
MSMRsMicro Small Medium GroceryMSMRs
MSMRs
Value Share (%)
0%
20%
40%
60%
80%
100%Volume Share (%)
8%
93% 89%77% 80% 79%
2% 8% 7% 7%3% 7% 6% 6%1% 3% 3% 4%6% 5% 5% 5% 5%
89% 83% 79% 81% 82%
1% 6% 4% 4%5% 5% 4% 4%1% 2% 1% 1%11% 9% 8% 9% 9%
Anecdotal evidence collected during the interviews suggest that most consumers are not aware of other payment products such as credit cards. Essentially, cash dominates in rural traditional stores because the majority of rural residents are unbanked and are dependent on agricultural produce for their subsistence. The only means of payment known to them is cash.
Source: Team estimates based on trade interviews, pulse surveys and literature review
Payment SourceRetailer Size/Retailer
TypeNumber of Interview Responses
GroceryNumber of Interviews Responses
Non-Grocery
P2B Micro 17 29Small 14 18
Medium 15 9
B2B Micro 17 29Small 14 18
Medium 12 8
B2P Micro 22 29Small 14 18
Medium 17 9
Table A6.3.5 – Information on Interview Responses Across MSMRs: Kenya
Source: Team estimates based on trade interviews, pulse surveys and literature review
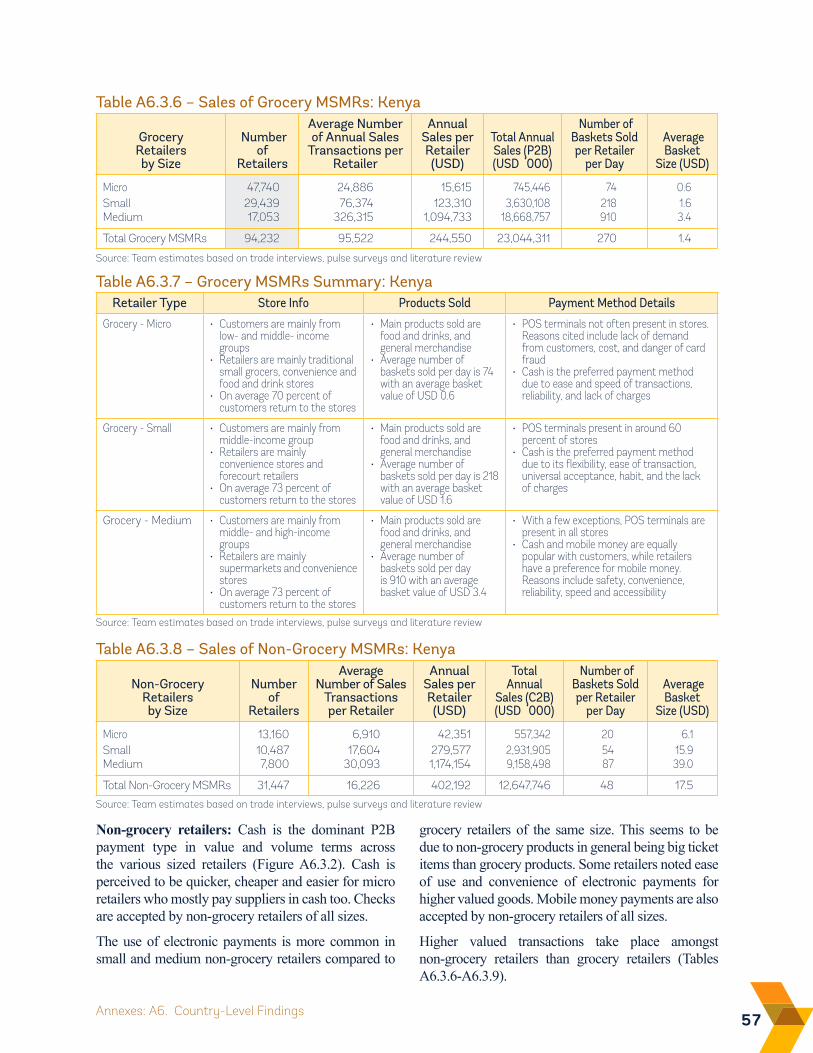
57Annexes: A6. Country-Level Findings
Table A6.3.6 – Sales of Grocery MSMRs: Kenya
Source: Team estimates based on trade interviews, pulse surveys and literature review
Retailer Type Store Info Products Sold Payment Method Details
Grocery - Micro • Customers are mainly from low- and middle- income groups
• Retailers are mainly traditional small grocers, convenience and food and drink stores
• On average 70 percent of customers return to the stores
• Main products sold are food and drinks, and general merchandise
• Average number of baskets sold per day is 74 with an average basket value of USD 0.6
• POS terminals not often present in stores. Reasons cited include lack of demand from customers, cost, and danger of card fraud
• Cash is the preferred payment method due to ease and speed of transactions, reliability, and lack of charges
Grocery - Small • Customers are mainly from middle-income group
• Retailers are mainly convenience stores and forecourt retailers
• On average 73 percent of customers return to the stores
• Main products sold are food and drinks, and general merchandise
• Average number of baskets sold per day is 218 with an average basket value of USD 1.6
• POS terminals present in around 60 percent of stores
• Cash is the preferred payment method due to its flexibility, ease of transaction, universal acceptance, habit, and the lack of charges
Grocery - Medium • Customers are mainly from middle- and high-income groups
• Retailers are mainly supermarkets and convenience stores
• On average 73 percent of customers return to the stores
• Main products sold are food and drinks, and general merchandise
• Average number of baskets sold per day is 910 with an average basket value of USD 3.4
• With a few exceptions, POS terminals are present in all stores
• Cash and mobile money are equally popular with customers, while retailers have a preference for mobile money. Reasons include safety, convenience, reliability, speed and accessibility
Table A6.3.7 – Grocery MSMRs Summary: Kenya
Source: Team estimates based on trade interviews, pulse surveys and literature review
Non-Grocery Retailers by Size
Number of
Retailers
Average Number of Sales
Transactions per Retailer
Annual Sales per Retailer (USD)
Total Annual
Sales (C2B) (USD ‘000)
Number of Baskets Sold per Retailer
per Day
Average Basket
Size (USD)
Micro 13,160 6,910 42,351 557,342 20 6.1Small 10,487 17,604 279,577 2,931,905 54 15.9Medium 7,800 30,093 1,174,154 9,158,498 87 39.0
Total Non-Grocery MSMRs 31,447 16,226 402,192 12,647,746 48 17.5
Table A6.3.8 – Sales of Non-Grocery MSMRs: Kenya
Source: Team estimates based on trade interviews, pulse surveys and literature review
Non-grocery retailers: Cash is the dominant P2B payment type in value and volume terms across the various sized retailers (Figure A6.3.2). Cash is perceived to be quicker, cheaper and easier for micro retailers who mostly pay suppliers in cash too. Checks are accepted by non-grocery retailers of all sizes.
The use of electronic payments is more common in small and medium non-grocery retailers compared to
grocery retailers of the same size. This seems to be due to non-grocery products in general being big ticket items than grocery products. Some retailers noted ease of use and convenience of electronic payments for higher valued goods. Mobile money payments are also accepted by non-grocery retailers of all sizes.
Higher valued transactions take place amongst non-grocery retailers than grocery retailers (Tables A6.3.6-A6.3.9).
Grocery Retailers by Size
Number of
Retailers
Average Number of Annual Sales
Transactions per Retailer
Annual Sales per Retailer (USD)
Total Annual Sales (P2B) (USD ‘000)
Number of Baskets Sold per Retailer
per Day
Average Basket
Size (USD)
Micro 47,740 24,886 15,615 745,446 74 0.6Small 29,439 76,374 123,310 3,630,108 218 1.6Medium 17,053 326,315 1,094,733 18,668,757 910 3.4
Total Grocery MSMRs 94,232 95,522 244,550 23,044,311 270 1.4
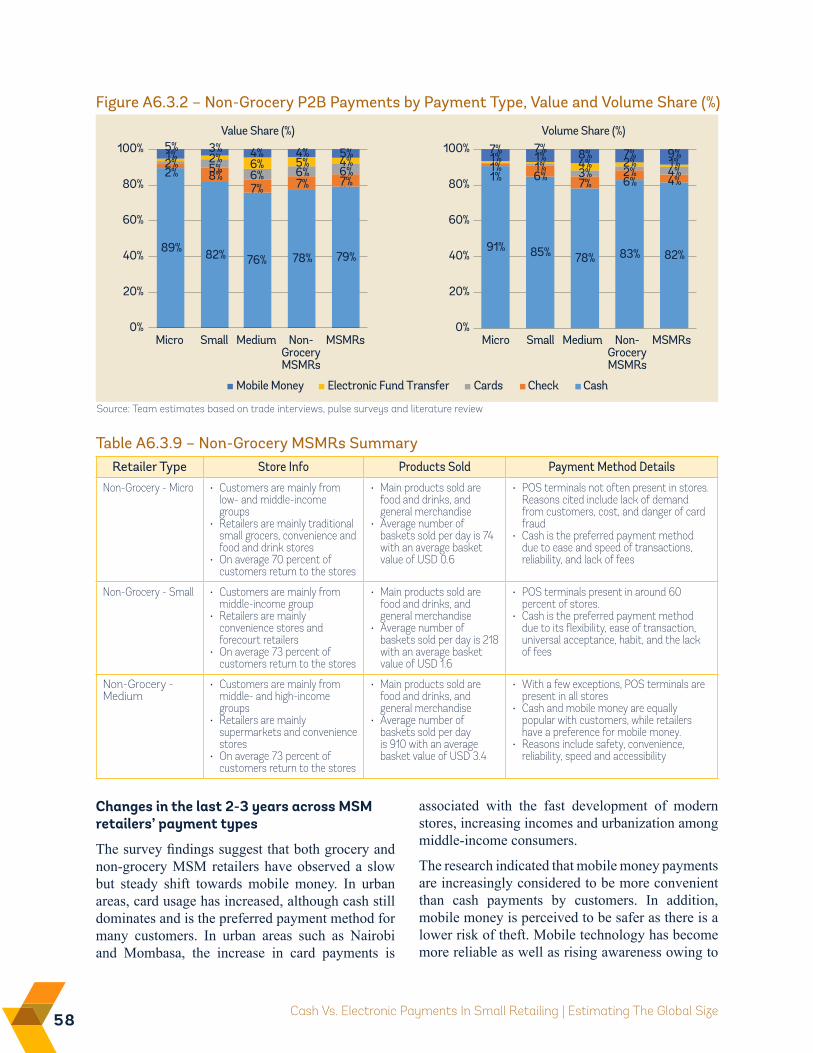
58 Cash Vs. Electronic Payments In Small Retailing | Estimating The Global Size
Figure A6.3.2 – Non-Grocery P2B Payments by Payment Type, Value and Volume Share (%)
Mobile Money Electronic Fund Transfer Cards CashCheck
0%
20%
40%
60%
80%
100%
Micro Small Medium Non-GroceryMSMRs
MSMRsMicro Small Medium Non-GroceryMSMRs
MSMRs
Value Share (%)
0%
20%
40%
60%
80%
100%Volume Share (%)
5%
89% 82% 76% 78% 79%
2% 8%7% 7% 7%
2% 5% 6% 6% 6%1% 2% 6% 5% 4%5% 3% 4% 4% 5%
91% 85% 78% 83% 82%
1%6% 7% 6% 4%1%1% 3% 2% 4%1%1% 4% 2% 1%
7% 7% 8% 7% 9%
Retailer Type Store Info Products Sold Payment Method Details
Non-Grocery - Micro • Customers are mainly from low- and middle-income groups
• Retailers are mainly traditional small grocers, convenience and food and drink stores
• On average 70 percent of customers return to the stores
• Main products sold are food and drinks, and general merchandise
• Average number of baskets sold per day is 74 with an average basket value of USD 0.6
• POS terminals not often present in stores. Reasons cited include lack of demand from customers, cost, and danger of card fraud
• Cash is the preferred payment method due to ease and speed of transactions, reliability, and lack of fees
Non-Grocery - Small • Customers are mainly from middle-income group
• Retailers are mainly convenience stores and forecourt retailers
• On average 73 percent of customers return to the stores
• Main products sold are food and drinks, and general merchandise
• Average number of baskets sold per day is 218 with an average basket value of USD 1.6
• POS terminals present in around 60 percent of stores.
• Cash is the preferred payment method due to its flexibility, ease of transaction, universal acceptance, habit, and the lack of fees
Non-Grocery - Medium
• Customers are mainly from middle- and high-income groups
• Retailers are mainly supermarkets and convenience stores
• On average 73 percent of customers return to the stores
• Main products sold are food and drinks, and general merchandise
• Average number of baskets sold per day is 910 with an average basket value of USD 3.4
• With a few exceptions, POS terminals are present in all stores
• Cash and mobile money are equally popular with customers, while retailers have a preference for mobile money.
• Reasons include safety, convenience, reliability, speed and accessibility
Table A6.3.9 – Non-Grocery MSMRs Summary
Source: Team estimates based on trade interviews, pulse surveys and literature review
Changes in the last 2-3 years across MSM retailers’ payment types
The survey findings suggest that both grocery and non-grocery MSM retailers have observed a slow but steady shift towards mobile money. In urban areas, card usage has increased, although cash still dominates and is the preferred payment method for many customers. In urban areas such as Nairobi and Mombasa, the increase in card payments is
associated with the fast development of modern stores, increasing incomes and urbanization among middle-income consumers.
The research indicated that mobile money payments are increasingly considered to be more convenient than cash payments by customers. In addition, mobile money is perceived to be safer as there is a lower risk of theft. Mobile technology has become more reliable as well as rising awareness owing to
59Annexes: A6. Country-Level Findings
Grocery Retailers by Size
Number of
Distributors
Average Number of Supplier Payment
Transactions per Retailer
Annual Payments to Suppliers per Retailer (USD)
Total Annual Payments
to Suppliers (USD ‘000)
Average B2B Value per
Transaction (USD)
Micro - 127 11,790 562,858 93Small - 160 90,581 2,666,594 565Medium - 190 782,917 13,351,276 4,121
Total Grocery MSMRs - 149 175,957 16,580,728 1,184
Distributors/Suppliers 578,000 - - - -
Table A6.3.10 – Supplier Payments by Grocery MSMRs: Kenya
Source: Team estimates based on trade interviews, pulse surveys and literature review
cases, the payment method depends on the type and/or quantity of goods ordered, with checks preferred for larger order values.
Non-grocery retailers: Figure A6.3.4 summarizes the findings of the research for non-grocery retailers. The most common payment method for supplier payments by non-grocery MSMRs are cash and check. Micro non-grocery retailers use cash, checks and electronic payments in the same proportion on average, i.e. the share of each in supplier payments (both in value and in volume) is about one thirds. For small and medium non-grocery retailers paper payments mainly consist of checks, which are considered safer than cash, especially for larger sums.
Electronic fund transfers are of greater importance for small non-grocery retailers, followed by micro non-grocery retailers, but play a significantly smaller role for medium non-grocery retailers in paying their suppliers, for whom mobile money payments are more important than for the other two retailer sizes. In addition, electronic fund transfers tend to be more popular in urban areas, according to interview respondents, as they are quicker and convenient to use for larger transaction amounts. Mobile banking and agency banking have made electronic fund transfers more popular.
Similar to their grocery counterparts, for non-grocery retailers, in most cases, the payment type is determined by supplier preferences regardless of the size of the retailer. Convenience, speed and safety of payment methods and associated charges are key factors again.
On average, larger non-grocery retailers make more B2B transactions per year. At the same time, value of these transactions, on average, is larger as the size of the retailer is bigger (Table A6.3.11).
telecoms operators' promotional campaigns have also been quoted as supporting factors for the increased use of mobile money.
Many retailers noted that customers still find it easy to carry out their payment transactions in cash and believe that all other payment types carry additional charges.
Business-to-Business (B2B) PayMents
Twenty-seven percent of all supplier payments in value and 25 percent in volume are made electronically by the MSMRs in Kenya (Figure A6.3.3).
Grocery retailers: Paper payments are the most common method used to pay suppliers, both in value and in volume (Figure A6.3.3). Cash dominates supplier payments made by micro grocery retailers, and accounts for the largest share of B2B payments of small grocery retailers, while checks are the most common payment method used by medium grocery retailers to pay suppliers. Small grocery retailers also use electronic fund transfers commonly, and so do the medium grocery retailers. Other types of electronic payments are of limited use.
The number of B2B transactions made by grocery retailers in a year is larger for larger retailers, as well as the average transaction value.
The majority of grocery retailers are not granted credit lines by suppliers. Where credit lines are being granted, they mainly range from one week to one month/30 days for micro and small grocery retailers. For medium grocery retailers, credit lines are somewhat more common and range from 15 to 120 days.
In general, regardless of the retailer size, payment method is determined by supplier preferences. Convenience, speed and safety of payment methods are key factors, as are the fees involved. In some
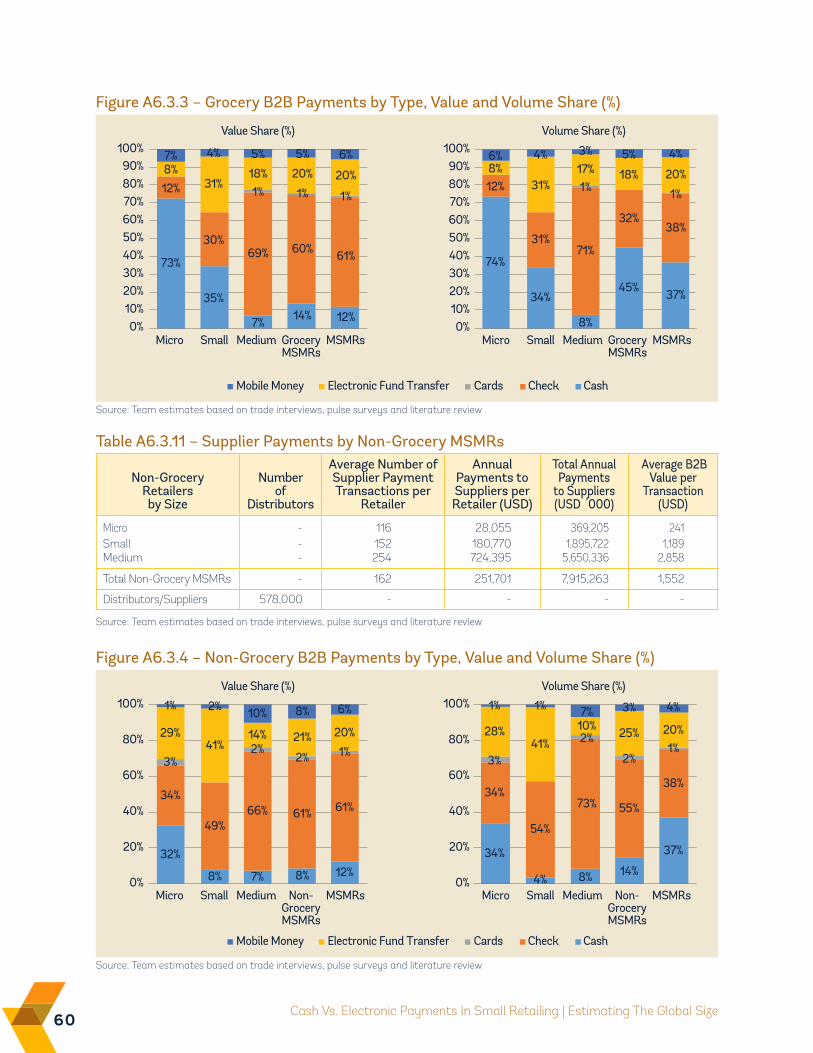
60 Cash Vs. Electronic Payments In Small Retailing | Estimating The Global Size
Figure A6.3.3 – Grocery B2B Payments by Type, Value and Volume Share (%)
100%
Micro Small Medium GroceryMSMRs
MSMRsMicro Small Medium GroceryMSMRs
MSMRs
Value Share (%) Volume Share (%)
0%10%20%30%40%50%60%70%80%90%
0%10%20%30%40%50%60%70%80%90%
100%
Mobile Money Electronic Fund Transfer Cards CashCheck
73%
35%
7% 14% 12%
12%
30%69% 60% 61%
1% 1% 1%
8%31%
18% 20% 20%
7% 4% 5% 5% 6%
74%
34%
8%
45% 37%
12%
31%71%
32%38%
1% 1%
8%31%
17% 18% 20%6% 4% 3% 5% 4%
Source: Team estimates based on trade interviews, pulse surveys and literature review
Table A6.3.11 – Supplier Payments by Non-Grocery MSMRs
Non-Grocery Retailers by Size
Number of
Distributors
Average Number of Supplier Payment Transactions per
Retailer
Annual Payments to Suppliers per Retailer (USD)
Total Annual Payments
to Suppliers (USD ‘000)
Average B2B Value per
Transaction (USD)
Micro - 116 28,055 369,205 241Small - 152 180,770 1,895,722 1,189Medium - 254 724,395 5,650,336 2,858
Total Non-Grocery MSMRs - 162 251,701 7,915,263 1,552
Distributors/Suppliers 578,000 - - - -
Source: Team estimates based on trade interviews, pulse surveys and literature review
Figure A6.3.4 – Non-Grocery B2B Payments by Type, Value and Volume Share (%)
Mobile Money Electronic Fund Transfer Cards CashCheck
0%
20%
40%
60%
80%
100%
Micro Small Medium Non-GroceryMSMRs
MSMRsMicro Small Medium Non-GroceryMSMRs
MSMRs
Value Share (%)
0%
20%
40%
60%
80%
100%Volume Share (%)
32%
8% 7% 8% 12%
34%
49%66% 61% 61%
3%2%
2% 1%29%
41%14% 21% 20%10% 8% 6%
34%
4% 8% 14%
37%
34%
54%
73% 55%
38%
3%
2%
2%1%
28%41%
10% 25% 20%7%1% 2% 1% 1% 3% 4%
Source: Team estimates based on trade interviews, pulse surveys and literature review
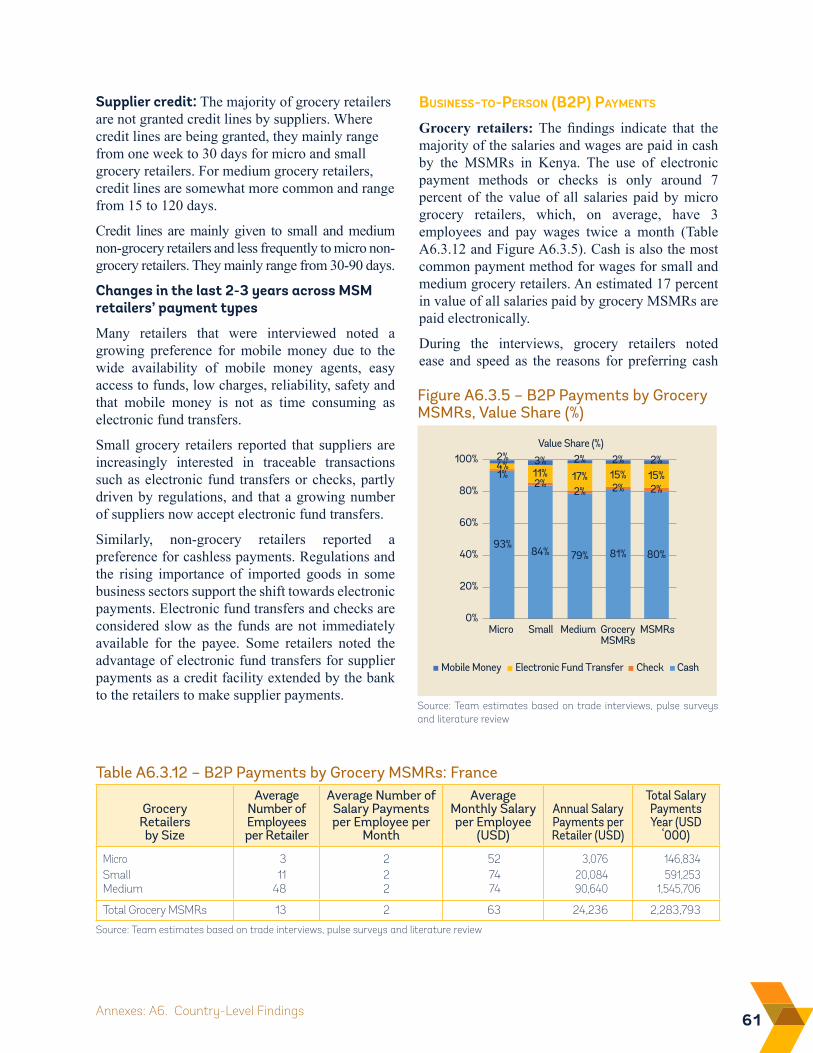
61Annexes: A6. Country-Level Findings
Supplier credit: The majority of grocery retailers are not granted credit lines by suppliers. Where credit lines are being granted, they mainly range from one week to 30 days for micro and small grocery retailers. For medium grocery retailers, credit lines are somewhat more common and range from 15 to 120 days.
Credit lines are mainly given to small and medium non-grocery retailers and less frequently to micro non-grocery retailers. They mainly range from 30-90 days.
Changes in the last 2-3 years across MSM retailers’ payment types
Many retailers that were interviewed noted a growing preference for mobile money due to the wide availability of mobile money agents, easy access to funds, low charges, reliability, safety and that mobile money is not as time consuming as electronic fund transfers.
Small grocery retailers reported that suppliers are increasingly interested in traceable transactions such as electronic fund transfers or checks, partly driven by regulations, and that a growing number of suppliers now accept electronic fund transfers.
Similarly, non-grocery retailers reported a preference for cashless payments. Regulations and the rising importance of imported goods in some business sectors support the shift towards electronic payments. Electronic fund transfers and checks are considered slow as the funds are not immediately available for the payee. Some retailers noted the advantage of electronic fund transfers for supplier payments as a credit facility extended by the bank to the retailers to make supplier payments.
Business-to-Person (B2P) PayMents
Grocery retailers: The findings indicate that the majority of the salaries and wages are paid in cash by the MSMRs in Kenya. The use of electronic payment methods or checks is only around 7 percent of the value of all salaries paid by micro grocery retailers, which, on average, have 3 employees and pay wages twice a month (Table A6.3.12 and Figure A6.3.5). Cash is also the most common payment method for wages for small and medium grocery retailers. An estimated 17 percent in value of all salaries paid by grocery MSMRs are paid electronically.
During the interviews, grocery retailers noted ease and speed as the reasons for preferring cash
Table A6.3.12 – B2P Payments by Grocery MSMRs: France
Grocery Retailers by Size
Average Number of Employees per Retailer
Average Number of Salary Payments per Employee per
Month
Average Monthly Salary per Employee
(USD)
Annual Salary Payments per Retailer (USD)
Total Salary Payments Year (USD
‘000)
Micro 3 2 52 3,076 146,834Small 11 2 74 20,084 591,253Medium 48 2 74 90,640 1,545,706
Total Grocery MSMRs 13 2 63 24,236 2,283,793
Source: Team estimates based on trade interviews, pulse surveys and literature review
Figure A6.3.5 – B2P Payments by Grocery MSMRs, Value Share (%)
Mobile Money Electronic Fund Transfer Check Cash
0%
20%
40%
60%
80%
100%
Micro Small Medium GroceryMSMRs
MSMRs
Value Share (%)
93%84% 79% 81% 80%
1%2%
2% 2% 2%
4%11% 17% 15% 15%
2% 3% 2% 2% 2%
Source: Team estimates based on trade interviews, pulse surveys and literature review
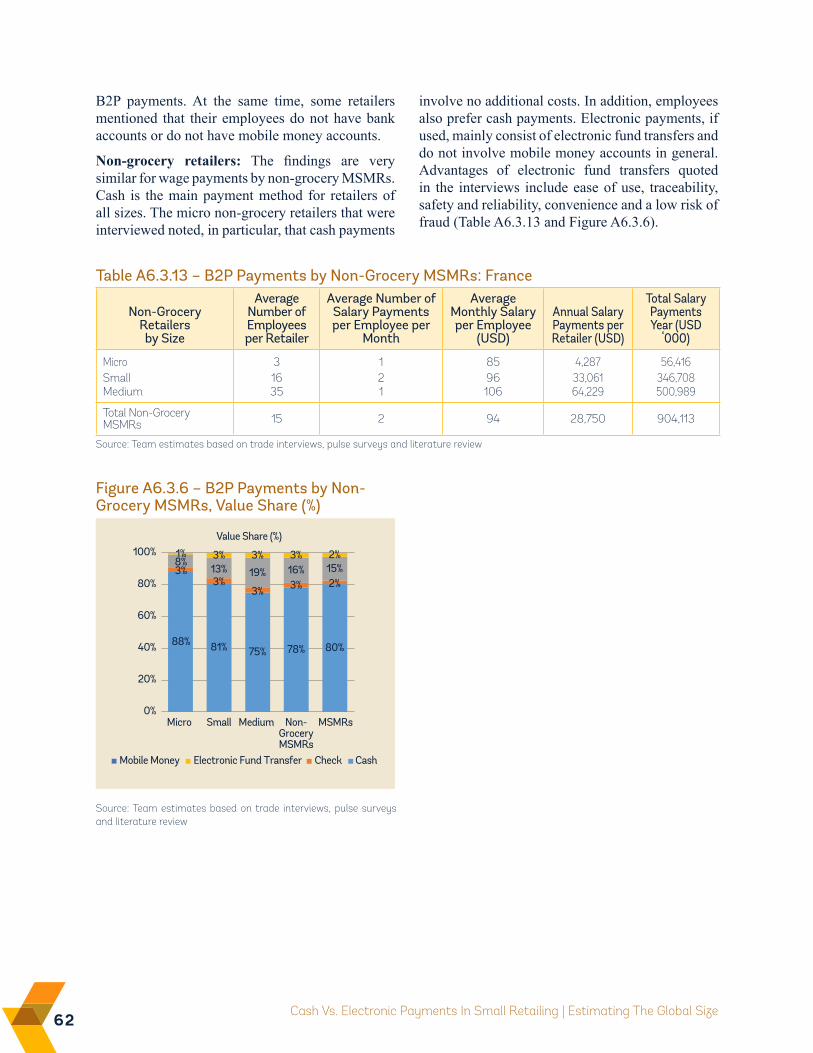
62 Cash Vs. Electronic Payments In Small Retailing | Estimating The Global Size
B2P payments. At the same time, some retailers mentioned that their employees do not have bank accounts or do not have mobile money accounts.
Non-grocery retailers: The findings are very similar for wage payments by non-grocery MSMRs. Cash is the main payment method for retailers of all sizes. The micro non-grocery retailers that were interviewed noted, in particular, that cash payments
involve no additional costs. In addition, employees also prefer cash payments. Electronic payments, if used, mainly consist of electronic fund transfers and do not involve mobile money accounts in general. Advantages of electronic fund transfers quoted in the interviews include ease of use, traceability, safety and reliability, convenience and a low risk of fraud (Table A6.3.13 and Figure A6.3.6).
Table A6.3.13 – B2P Payments by Non-Grocery MSMRs: France
Non-Grocery Retailers by Size
Average Number of Employees per Retailer
Average Number of Salary Payments per Employee per
Month
Average Monthly Salary per Employee
(USD)
Annual Salary Payments per Retailer (USD)
Total Salary Payments Year (USD
‘000)
Micro 3 1 85 4,287 56,416Small 16 2 96 33,061 346,708Medium 35 1 106 64,229 500,989
Total Non-Grocery MSMRs 15 2 94 28,750 904,113
Source: Team estimates based on trade interviews, pulse surveys and literature review
Figure A6.3.6 – B2P Payments by Non-Grocery MSMRs, Value Share (%)
Mobile Money Electronic Fund Transfer Check Cash
0%
20%
40%
60%
80%
100%
Micro Small Medium Non-GroceryMSMRs
MSMRs
Value Share (%)
88% 81% 75% 78% 80%
3%3%
3% 3% 2%
8%13% 19% 16% 15%3% 3% 3% 2%1%
Source: Team estimates based on trade interviews, pulse surveys and literature review
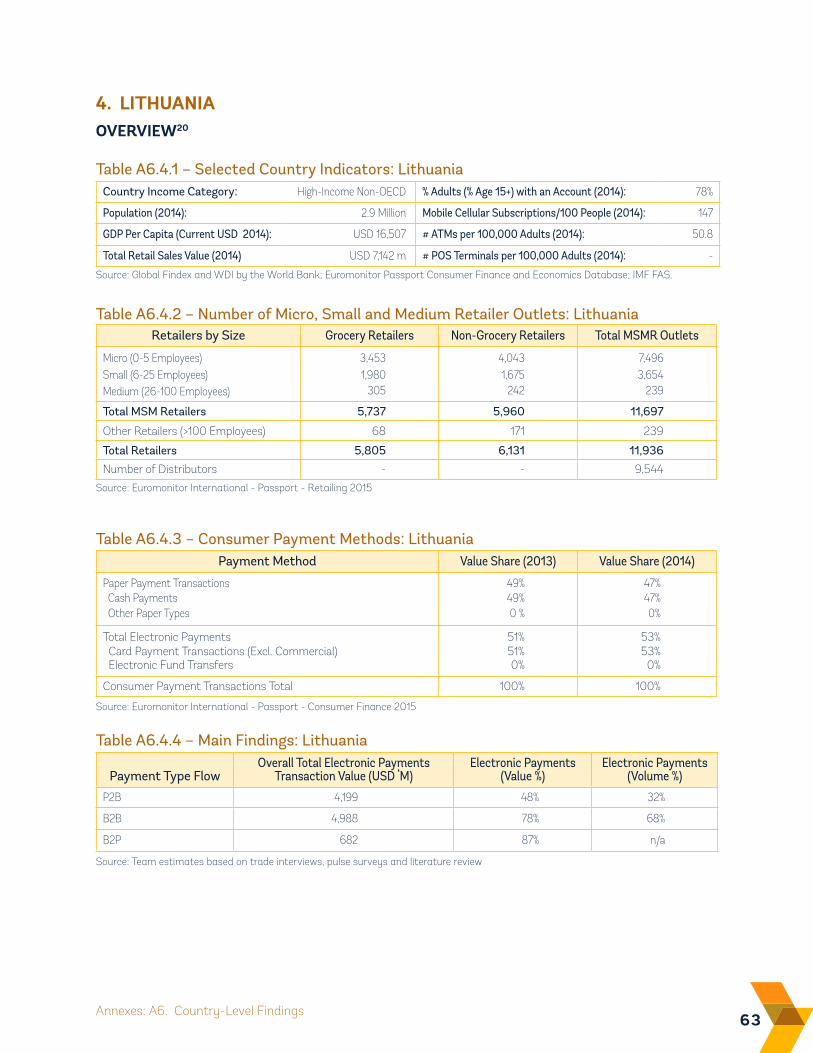
63Annexes: A6. Country-Level Findings
Table A6.4.2 – Number of Micro, Small and Medium Retailer Outlets: Lithuania
Source: Euromonitor International - Passport - Retailing 2015
Payment Method Value Share (2013) Value Share (2014)
Paper Payment Transactions 49% 47% Cash Payments 49% 47% Other Paper Types 0 % 0%
Total Electronic Payments 51% 53% Card Payment Transactions (Excl. Commercial) 51% 53% Electronic Fund Transfers 0% 0%
Consumer Payment Transactions Total 100% 100%
Table A6.4.3 – Consumer Payment Methods: Lithuania
Source: Euromonitor International - Passport - Consumer Finance 2015
Payment Type FlowOverall Total Electronic Payments
Transaction Value (USD ‘M)Electronic Payments
(Value %)Electronic Payments
(Volume %)
P2B 4,199 48% 32%
B2B 4,988 78% 68%
B2P 682 87% n/a
Table A6.4.4 – Main Findings: Lithuania
Source: Team estimates based on trade interviews, pulse surveys and literature review
4. LiTHUANiAOvERviEW20
Country Income Category: High-Income Non-OECD % Adults (% Age 15+) with an Account (2014): 78%
Population (2014): 2.9 Million Mobile Cellular Subscriptions/100 People (2014): 147
GDP Per Capita (Current USD 2014): USD 16,507 # ATMs per 100,000 Adults (2014): 50.8
Total Retail Sales Value (2014) USD 7,142 m # POS Terminals per 100,000 Adults (2014): -
Table A6.4.1 – Selected Country Indicators: Lithuania
Source: Global Findex and WDI by the World Bank; Euromonitor Passport Consumer Finance and Economics Database; IMF FAS.
Retailers by Size Grocery Retailers Non-Grocery Retailers Total MSMR Outlets
Micro (0-5 Employees) 3,453 4,043 7,496Small (6-25 Employees) 1,980 1,675 3,654Medium (26-100 Employees) 305 242 239
Total MSM Retailers 5,737 5,960 11,697
Other Retailers (>100 Employees) 68 171 239
Total Retailers 5,805 6,131 11,936
Number of Distributors - - 9,544
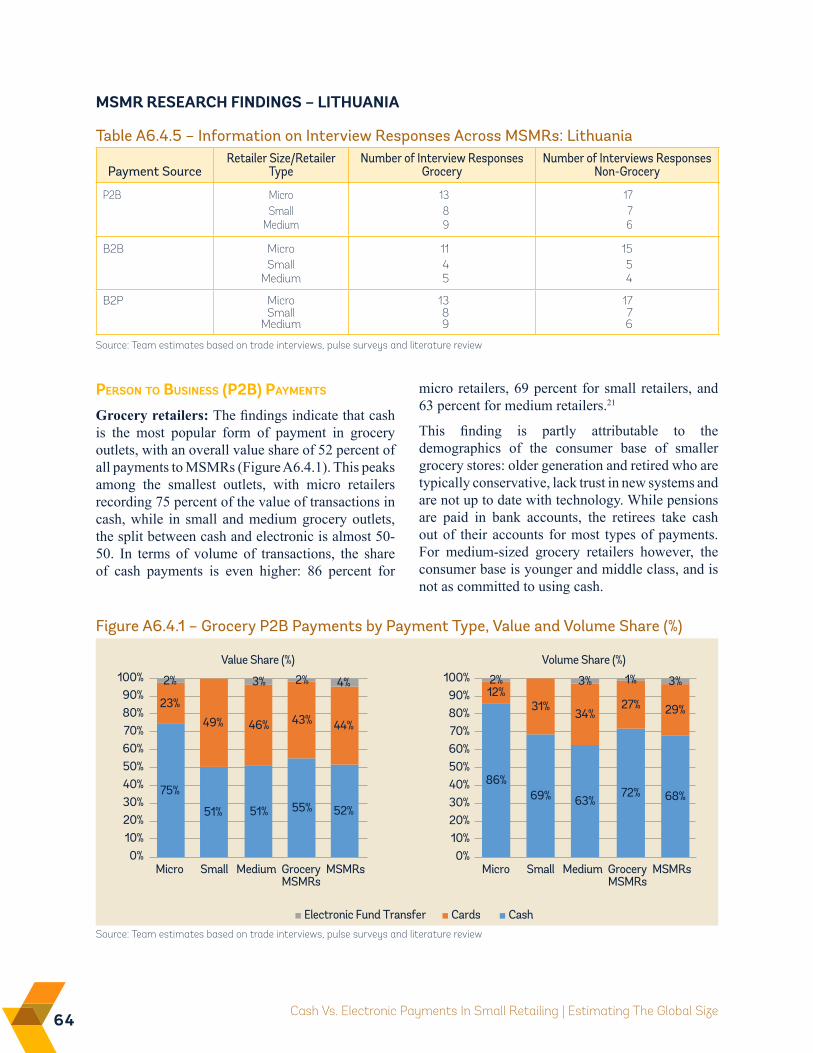
64 Cash Vs. Electronic Payments In Small Retailing | Estimating The Global Size
MSMR RESEARCH FiNDiNGS – LiTHUANiA
Person to Business (P2B) PayMents
Grocery retailers: The findings indicate that cash is the most popular form of payment in grocery outlets, with an overall value share of 52 percent of all payments to MSMRs (Figure A6.4.1). This peaks among the smallest outlets, with micro retailers recording 75 percent of the value of transactions in cash, while in small and medium grocery outlets, the split between cash and electronic is almost 50-50. In terms of volume of transactions, the share of cash payments is even higher: 86 percent for
Figure A6.4.1 – Grocery P2B Payments by Payment Type, Value and Volume Share (%)
Electronic Fund Transfer Cards Cash
100%
Micro Small Medium GroceryMSMRs
MSMRsMicro Small Medium GroceryMSMRs
MSMRs
Value Share (%) Volume Share (%)
0%10%20%30%40%50%60%70%80%90%
0%10%20%30%40%50%60%70%80%90%
100%
75%
51% 51% 55% 52%
23%
49% 46% 43% 44%
2% 3% 2% 4%
86%69% 63%
72% 68%
12%31%
34%27% 29%
2% 3% 1% 3%
micro retailers, 69 percent for small retailers, and 63 percent for medium retailers.21
This finding is partly attributable to the demographics of the consumer base of smaller grocery stores: older generation and retired who are typically conservative, lack trust in new systems and are not up to date with technology. While pensions are paid in bank accounts, the retirees take cash out of their accounts for most types of payments. For medium-sized grocery retailers however, the consumer base is younger and middle class, and is not as committed to using cash.
Source: Team estimates based on trade interviews, pulse surveys and literature review
Payment SourceRetailer Size/Retailer
TypeNumber of Interview Responses
GroceryNumber of Interviews Responses
Non-Grocery
P2B Micro 13 17Small 8 7
Medium 9 6
B2B Micro 11 15Small 4 5
Medium 5 4
B2P Micro 13 17Small 8 7
Medium 9 6
Table A6.4.5 – Information on Interview Responses Across MSMRs: Lithuania
Source: Team estimates based on trade interviews, pulse surveys and literature review
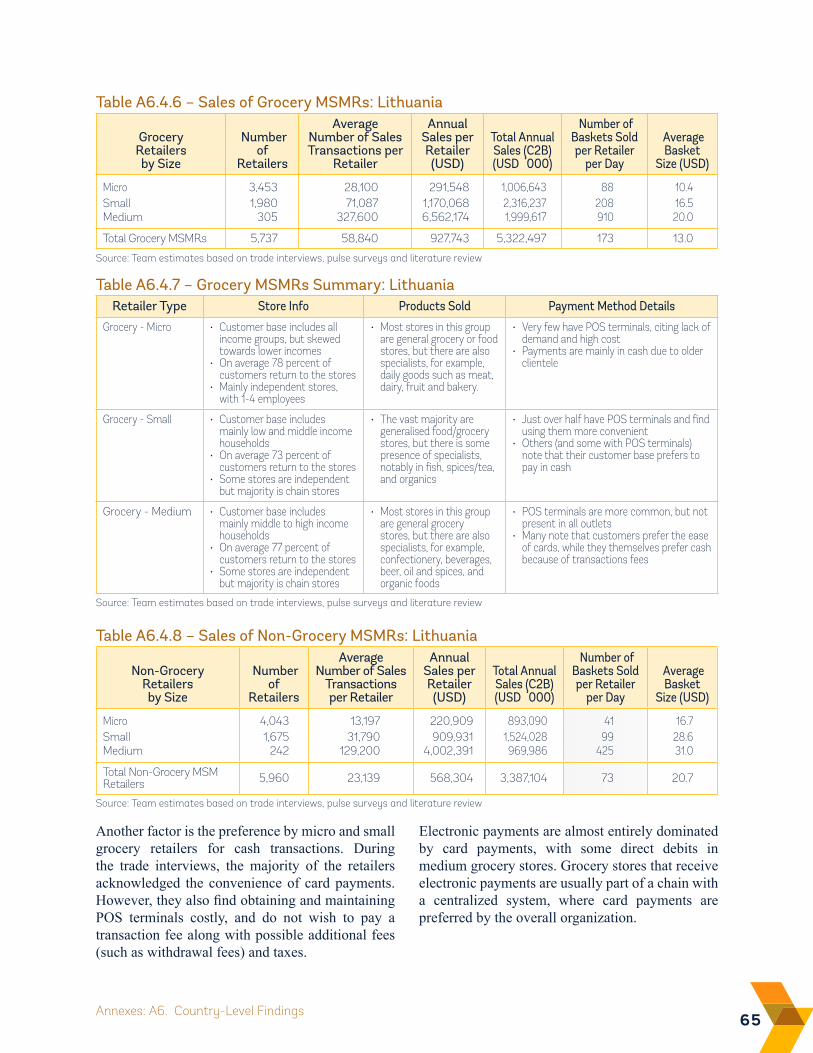
65Annexes: A6. Country-Level Findings
Table A6.4.6 – Sales of Grocery MSMRs: Lithuania
Source: Team estimates based on trade interviews, pulse surveys and literature review
Retailer Type Store Info Products Sold Payment Method Details
Grocery - Micro • Customer base includes all income groups, but skewed towards lower incomes
• On average 78 percent of customers return to the stores
• Mainly independent stores, with 1-4 employees
• Most stores in this group are general grocery or food stores, but there are also specialists, for example, daily goods such as meat, dairy, fruit and bakery.
• Very few have POS terminals, citing lack of demand and high cost
• Payments are mainly in cash due to older clientele
Grocery - Small • Customer base includes mainly low and middle income households
• On average 73 percent of customers return to the stores
• Some stores are independent but majority is chain stores
• The vast majority are generalised food/grocery stores, but there is some presence of specialists, notably in fish, spices/tea, and organics
• Just over half have POS terminals and find using them more convenient
• Others (and some with POS terminals) note that their customer base prefers to pay in cash
Grocery - Medium • Customer base includes mainly middle to high income households
• On average 77 percent of customers return to the stores
• Some stores are independent but majority is chain stores
• Most stores in this group are general grocery stores, but there are also specialists, for example, confectionery, beverages, beer, oil and spices, and organic foods
• POS terminals are more common, but not present in all outlets
• Many note that customers prefer the ease of cards, while they themselves prefer cash because of transactions fees
Table A6.4.7 – Grocery MSMRs Summary: Lithuania
Source: Team estimates based on trade interviews, pulse surveys and literature review
Non-Grocery Retailers by Size
Number of
Retailers
Average Number of Sales
Transactions per Retailer
Annual Sales per Retailer (USD)
Total Annual Sales (C2B) (USD ‘000)
Number of Baskets Sold per Retailer
per Day
Average Basket
Size (USD)
Micro 4,043 13,197 220,909 893,090 41 16.7Small 1,675 31,790 909,931 1,524,028 99 28.6Medium 242 129,200 4,002,391 969,986 425 31.0
Total Non-Grocery MSM Retailers 5,960 23,139 568,304 3,387,104 73 20.7
Table A6.4.8 – Sales of Non-Grocery MSMRs: Lithuania
Source: Team estimates based on trade interviews, pulse surveys and literature review
Grocery Retailers by Size
Number of
Retailers
Average Number of Sales Transactions per
Retailer
Annual Sales per Retailer (USD)
Total Annual Sales (C2B) (USD ‘000)
Number of Baskets Sold per Retailer
per Day
Average Basket
Size (USD)
Micro 3,453 28,100 291,548 1,006,643 88 10.4Small 1,980 71,087 1,170,068 2,316,237 208 16.5Medium 305 327,600 6,562,174 1,999,617 910 20.0
Total Grocery MSMRs 5,737 58,840 927,743 5,322,497 173 13.0
Another factor is the preference by micro and small grocery retailers for cash transactions. During the trade interviews, the majority of the retailers acknowledged the convenience of card payments. However, they also find obtaining and maintaining POS terminals costly, and do not wish to pay a transaction fee along with possible additional fees (such as withdrawal fees) and taxes.
Electronic payments are almost entirely dominated by card payments, with some direct debits in medium grocery stores. Grocery stores that receive electronic payments are usually part of a chain with a centralized system, where card payments are preferred by the overall organization.
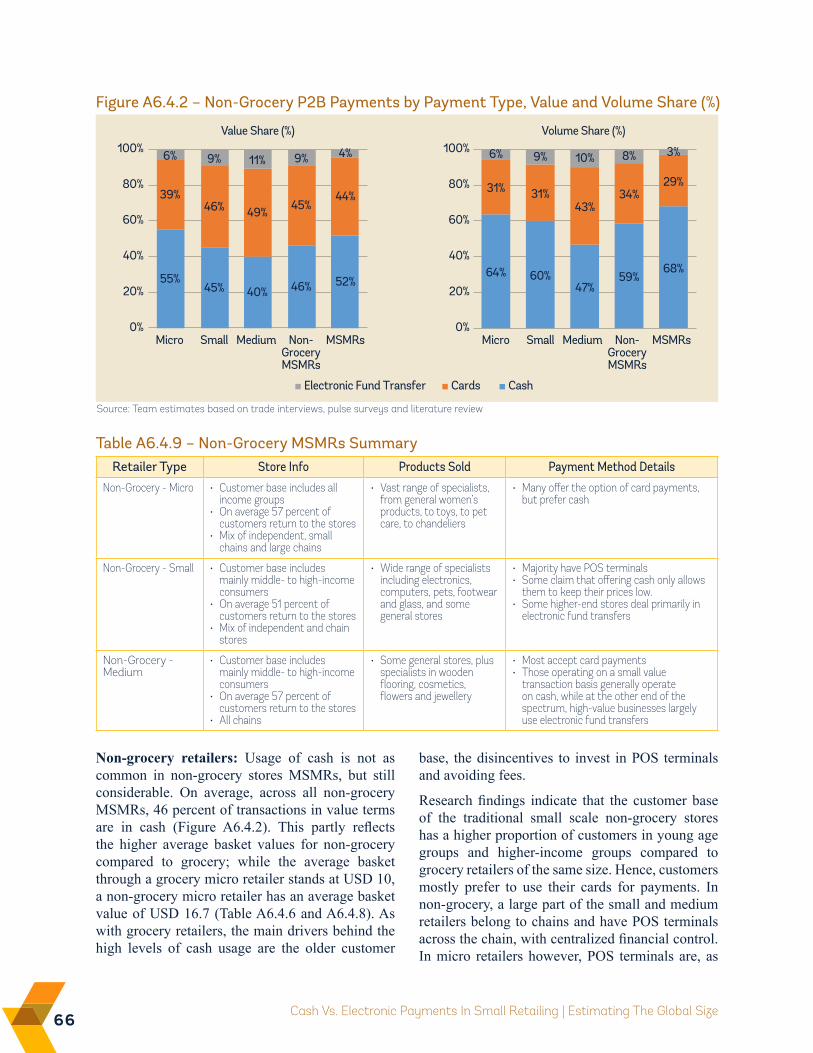
66 Cash Vs. Electronic Payments In Small Retailing | Estimating The Global Size
Figure A6.4.2 – Non-Grocery P2B Payments by Payment Type, Value and Volume Share (%)
Electronic Fund Transfer Cards Cash
0%
20%
40%
60%
80%
100%
Micro Small Medium Non-GroceryMSMRs
MSMRsMicro Small Medium Non-GroceryMSMRs
MSMRs
Value Share (%)
0%
20%
40%
60%
80%
100%Volume Share (%)
55%45% 40% 46% 52%
39%46% 49% 45%
44%
6% 9% 11% 9% 4%
64% 60%47%
59%68%
31% 31%43%
34%29%
6% 9% 10% 8% 3%
Retailer Type Store Info Products Sold Payment Method Details
Non-Grocery - Micro • Customer base includes all income groups
• On average 57 percent of customers return to the stores
• Mix of independent, small chains and large chains
• Vast range of specialists, from general women’s products, to toys, to pet care, to chandeliers
• Many offer the option of card payments, but prefer cash
Non-Grocery - Small • Customer base includes mainly middle- to high-income consumers
• On average 51 percent of customers return to the stores
• Mix of independent and chain stores
• Wide range of specialists including electronics, computers, pets, footwear and glass, and some general stores
• Majority have POS terminals • Some claim that offering cash only allows
them to keep their prices low.• Some higher-end stores deal primarily in
electronic fund transfers
Non-Grocery - Medium
• Customer base includes mainly middle- to high-income consumers
• On average 57 percent of customers return to the stores
• All chains
• Some general stores, plus specialists in wooden flooring, cosmetics, flowers and jewellery
• Most accept card payments • Those operating on a small value
transaction basis generally operate on cash, while at the other end of the spectrum, high-value businesses largely use electronic fund transfers
Table A6.4.9 – Non-Grocery MSMRs Summary
Source: Team estimates based on trade interviews, pulse surveys and literature review
Non-grocery retailers: Usage of cash is not as common in non-grocery stores MSMRs, but still considerable. On average, across all non-grocery MSMRs, 46 percent of transactions in value terms are in cash (Figure A6.4.2). This partly reflects the higher average basket values for non-grocery compared to grocery; while the average basket through a grocery micro retailer stands at USD 10, a non-grocery micro retailer has an average basket value of USD 16.7 (Table A6.4.6 and A6.4.8). As with grocery retailers, the main drivers behind the high levels of cash usage are the older customer
base, the disincentives to invest in POS terminals and avoiding fees.
Research findings indicate that the customer base of the traditional small scale non-grocery stores has a higher proportion of customers in young age groups and higher-income groups compared to grocery retailers of the same size. Hence, customers mostly prefer to use their cards for payments. In non-grocery, a large part of the small and medium retailers belong to chains and have POS terminals across the chain, with centralized financial control. In micro retailers however, POS terminals are, as
67Annexes: A6. Country-Level Findings
Grocery Retailers by Size
Number of Distributors
Average Number of Supplier Payment Transactions per Retailer per Year
Annual Payments to Suppliers per Retailer (USD)
Total Annual Payments
to Suppliers (USD ‘000)
Average B2B Value per
Transaction (USD)
Micro - 194 229,452 792,239 1,182Small - 225 916,330 1,813,944 4,073Medium - 1,968 5,077,298 1,547,147 2,580
Total Grocery MSM Retailers - 299 723,950 4,153,330 2,421
Distributors/Suppliers 9,544
Table A6.4.10 – Supplier Payments within Grocery Retailers
Source: Team estimates based on trade interviews, pulse surveys and literature review
in grocery, less common due to the high costs and customer preference for cash.
Business-to-Business (B2B) PayMents
Grocery retailers: The findings indicate that the majority of supplier payments are carried out electronically. Electronic payments account for 71 percent of all payments for supplier payments by grocery MSMRs. The use of electronic payments increases with scale: medium retailers pay 76 percent of their transactions by electronic means compared to 58 percent for micro retailers (Figure A6.4.3). This reflects the differences between the size and frequency of payments in the different business models; micro retailers have much lower average transaction values than the larger retailers. While medium retailers actually have smaller average transaction values than small retailers, they
also have a much greater number of transactions per month (Table 4.10), and most medium retailers find it simpler and more convenient to automate these payments by using electronic methods. When small and medium retailers may be part of a chain, supplier payments are in general centralized and performed electronically, with large amounts purchased on a daily, weekly or monthly basis.
Retailers and suppliers interviewed for this study indicated that electronic payments (which are all in the form of electronic fund transfers) are also in many cases stipulated by the supplier as part of their terms, particularly for larger suppliers. They see electronic payments as convenient, secure and reliable. Many suppliers offer retailers credit lines which vary from one week to six months, or when goods are sold, and payments are generally made on
Figure A6.4.3 – Grocery B2B Payments by Retailer (Value and Volume)
Electronic Fund Transfer Cash
0%
20%
40%
60%
80%
100%
Micro Small Medium GroceryMSMRs
MSMRsMicro Small Medium GroceryMSMRs
MSMRs
Value Share (%)
0%
20%
40%
60%
80%
100%Volume Share (%)
42%29% 24% 29% 22%
58%71% 76% 71% 78%
48%34% 31% 38% 32%
52%66% 69% 62% 68%
Source: Team estimates based on trade interviews, pulse surveys and literature review
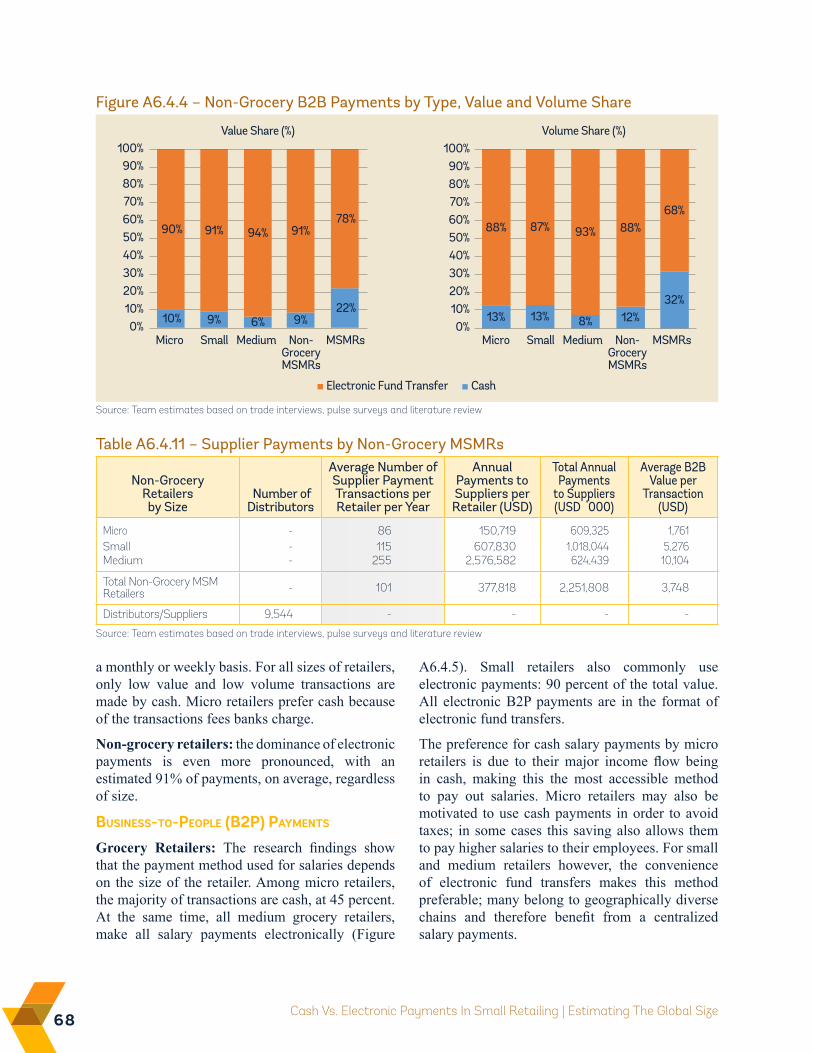
68 Cash Vs. Electronic Payments In Small Retailing | Estimating The Global Size
Table A6.4.11 – Supplier Payments by Non-Grocery MSMRs
Non-Grocery Retailers by Size
Number of Distributors
Average Number of Supplier Payment Transactions per Retailer per Year
Annual Payments to Suppliers per Retailer (USD)
Total Annual Payments
to Suppliers (USD ‘000)
Average B2B Value per
Transaction (USD)
Micro - 86 150,719 609,325 1,761Small - 115 607,830 1,018,044 5,276Medium - 255 2,576,582 624,439 10,104
Total Non-Grocery MSM Retailers - 101 377,818 2,251,808 3,748
Distributors/Suppliers 9,544 - - - -
Source: Team estimates based on trade interviews, pulse surveys and literature review
Figure A6.4.4 – Non-Grocery B2B Payments by Type, Value and Volume Share
Electronic Fund Transfer Cash
100%
Micro Small Medium Non-GroceryMSMRs
MSMRsMicro Small Medium Non-GroceryMSMRs
MSMRs
Value Share (%) Volume Share (%)
0%10%20%30%40%50%60%70%80%90%
0%10%20%30%40%50%60%70%80%90%
100%
10% 9% 6% 9%22%
90% 91% 94% 91%78%
13% 13% 8% 12%32%
88% 87% 93% 88%68%
Source: Team estimates based on trade interviews, pulse surveys and literature review
a monthly or weekly basis. For all sizes of retailers, only low value and low volume transactions are made by cash. Micro retailers prefer cash because of the transactions fees banks charge.
Non-grocery retailers: the dominance of electronic payments is even more pronounced, with an estimated 91% of payments, on average, regardless of size.
Business-to-PeoPle (B2P) PayMents
Grocery Retailers: The research findings show that the payment method used for salaries depends on the size of the retailer. Among micro retailers, the majority of transactions are cash, at 45 percent. At the same time, all medium grocery retailers, make all salary payments electronically (Figure
A6.4.5). Small retailers also commonly use electronic payments: 90 percent of the total value. All electronic B2P payments are in the format of electronic fund transfers.
The preference for cash salary payments by micro retailers is due to their major income flow being in cash, making this the most accessible method to pay out salaries. Micro retailers may also be motivated to use cash payments in order to avoid taxes; in some cases this saving also allows them to pay higher salaries to their employees. For small and medium retailers however, the convenience of electronic fund transfers makes this method preferable; many belong to geographically diverse chains and therefore benefit from a centralized salary payments.
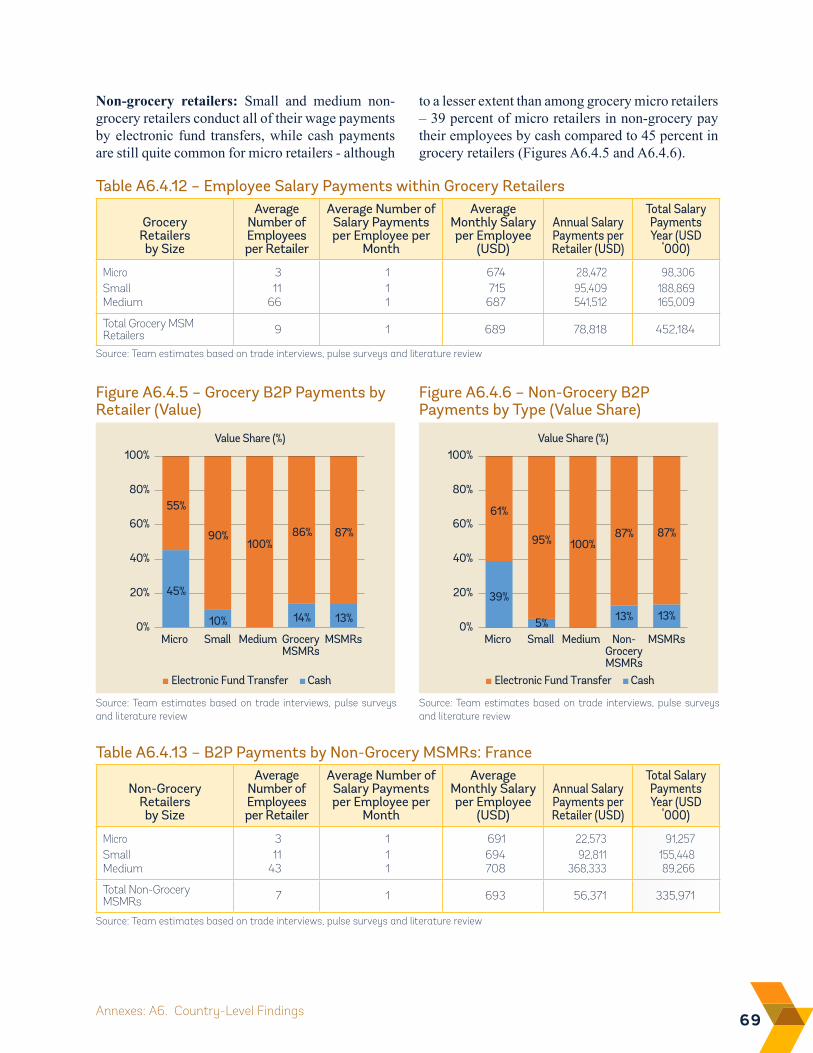
69Annexes: A6. Country-Level Findings
Table A6.4.12 – Employee Salary Payments within Grocery Retailers
Grocery Retailers by Size
Average Number of Employees per Retailer
Average Number of Salary Payments per Employee per
Month
Average Monthly Salary per Employee
(USD)
Annual Salary Payments per Retailer (USD)
Total Salary Payments Year (USD
‘000)
Micro 3 1 674 28,472 98,306Small 11 1 715 95,409 188,869Medium 66 1 687 541,512 165,009
Total Grocery MSM Retailers 9 1 689 78,818 452,184
Source: Team estimates based on trade interviews, pulse surveys and literature review
Figure A6.4.5 – Grocery B2P Payments by Retailer (Value)
Electronic Fund Transfer Cash
0%
20%
40%
60%
80%
100%
Micro Small Medium GroceryMSMRs
MSMRs
Value Share (%)
45%
10% 14% 13%
55%
90%100%
86% 87%
Non-grocery retailers: Small and medium non-grocery retailers conduct all of their wage payments by electronic fund transfers, while cash payments are still quite common for micro retailers - although
to a lesser extent than among grocery micro retailers – 39 percent of micro retailers in non-grocery pay their employees by cash compared to 45 percent in grocery retailers (Figures A6.4.5 and A6.4.6).
Figure A6.4.6 – Non-Grocery B2P Payments by Type (Value Share)
Source: Team estimates based on trade interviews, pulse surveys and literature review
Table A6.4.13 – B2P Payments by Non-Grocery MSMRs: France
Non-Grocery Retailers by Size
Average Number of Employees per Retailer
Average Number of Salary Payments per Employee per
Month
Average Monthly Salary per Employee
(USD)
Annual Salary Payments per Retailer (USD)
Total Salary Payments Year (USD
‘000)
Micro 3 1 691 22,573 91,257Small 11 1 694 92,811 155,448Medium 43 1 708 368,333 89,266
Total Non-Grocery MSMRs 7 1 693 56,371 335,971
Source: Team estimates based on trade interviews, pulse surveys and literature review
Source: Team estimates based on trade interviews, pulse surveys and literature review
Electronic Fund Transfer Cash
0%
20%
40%
60%
80%
100%
Micro Small Medium Non-GroceryMSMRs
MSMRs
Value Share (%)
39%
5% 13% 13%
61%
95% 100%87% 87%
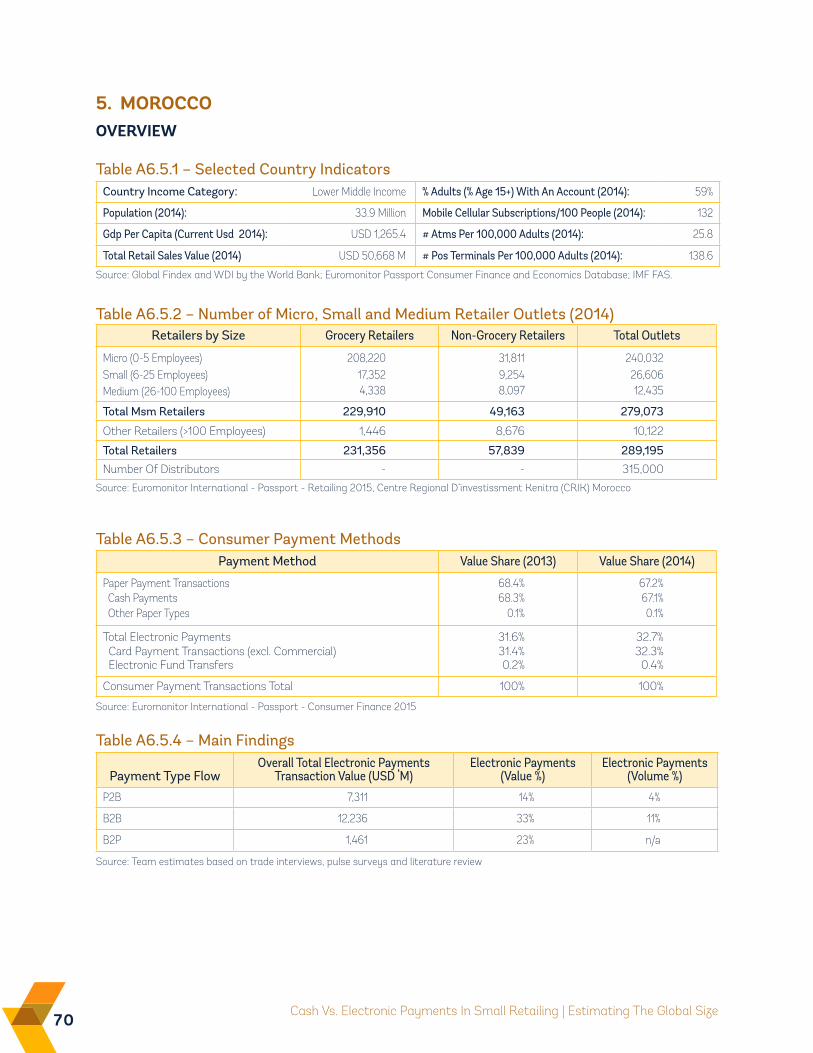
70 Cash Vs. Electronic Payments In Small Retailing | Estimating The Global Size
Table A6.5.2 – Number of Micro, Small and Medium Retailer Outlets (2014)
Source: Euromonitor International - Passport - Retailing 2015, Centre Regional D’investissment Kenitra (CRIK) Morocco
Payment Method Value Share (2013) Value Share (2014)
Paper Payment Transactions 68.4% 67.2% Cash Payments 68.3% 67.1% Other Paper Types 0.1% 0.1%
Total Electronic Payments 31.6% 32.7% Card Payment Transactions (excl. Commercial) 31.4% 32.3% Electronic Fund Transfers 0.2% 0.4%
Consumer Payment Transactions Total 100% 100%
Table A6.5.3 – Consumer Payment Methods
Source: Euromonitor International - Passport - Consumer Finance 2015
Payment Type FlowOverall Total Electronic Payments
Transaction Value (USD ‘M)Electronic Payments
(Value %)Electronic Payments
(Volume %)
P2B 7,311 14% 4%
B2B 12,236 33% 11%
B2P 1,461 23% n/a
Table A6.5.4 – Main Findings
Source: Team estimates based on trade interviews, pulse surveys and literature review
5. MOROCCOOvERviEW
Country Income Category: Lower Middle Income % Adults (% Age 15+) With An Account (2014): 59%
Population (2014): 33.9 Million Mobile Cellular Subscriptions/100 People (2014): 132
Gdp Per Capita (Current Usd 2014): USD 1,265.4 # Atms Per 100,000 Adults (2014): 25.8
Total Retail Sales Value (2014) USD 50,668 M # Pos Terminals Per 100,000 Adults (2014): 138.6
Table A6.5.1 – Selected Country Indicators
Source: Global Findex and WDI by the World Bank; Euromonitor Passport Consumer Finance and Economics Database; IMF FAS.
Retailers by Size Grocery Retailers Non-Grocery Retailers Total Outlets
Micro (0-5 Employees) 208,220 31,811 240,032Small (6-25 Employees) 17,352 9,254 26,606Medium (26-100 Employees) 4,338 8,097 12,435
Total Msm Retailers 229,910 49,163 279,073
Other Retailers (>100 Employees) 1,446 8,676 10,122
Total Retailers 231,356 57,839 289,195
Number Of Distributors - - 315,000
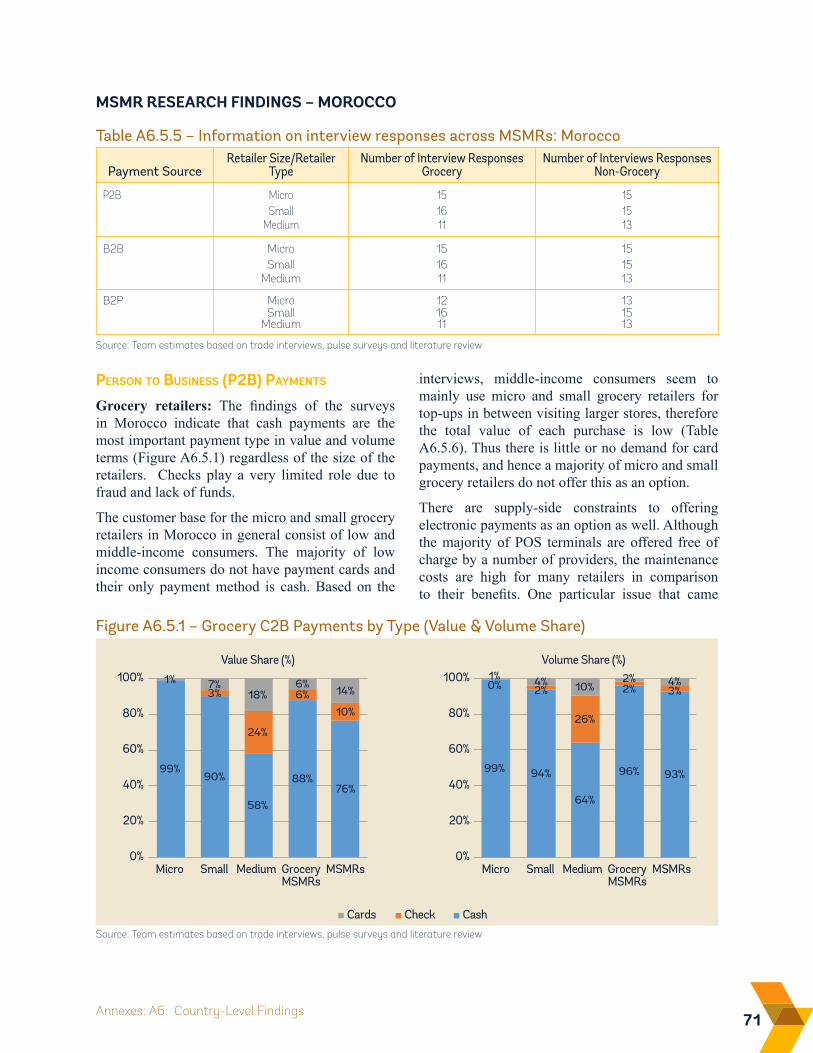
71Annexes: A6. Country-Level Findings
MSMR RESEARCH FiNDiNGS – MOROCCO
Person to Business (P2B) PayMents
Grocery retailers: The findings of the surveys in Morocco indicate that cash payments are the most important payment type in value and volume terms (Figure A6.5.1) regardless of the size of the retailers. Checks play a very limited role due to fraud and lack of funds.
The customer base for the micro and small grocery retailers in Morocco in general consist of low and middle-income consumers. The majority of low income consumers do not have payment cards and their only payment method is cash. Based on the
Figure A6.5.1 – Grocery C2B Payments by Type (Value & Volume Share)
CheckCards Cash
0%
20%
40%
60%
80%
100%
Micro Small Medium GroceryMSMRs
MSMRsMicro Small Medium GroceryMSMRs
MSMRs
Value Share (%)
0%
20%
40%
60%
80%
100%Volume Share (%)
99%90%
58%
88%76%
3%
24%
6%
10%
1% 7%18%
6%14%
99% 94%
64%
96% 93%
0% 2%
26%
2% 3%1% 4% 10%
2% 4%
interviews, middle-income consumers seem to mainly use micro and small grocery retailers for top-ups in between visiting larger stores, therefore the total value of each purchase is low (Table A6.5.6). Thus there is little or no demand for card payments, and hence a majority of micro and small grocery retailers do not offer this as an option.
There are supply-side constraints to offering electronic payments as an option as well. Although the majority of POS terminals are offered free of charge by a number of providers, the maintenance costs are high for many retailers in comparison to their benefits. One particular issue that came
Source: Team estimates based on trade interviews, pulse surveys and literature review
Payment SourceRetailer Size/Retailer
TypeNumber of Interview Responses
GroceryNumber of Interviews Responses
Non-Grocery
P2B Micro 15 15Small 16 15
Medium 11 13
B2B Micro 15 15Small 16 15
Medium 11 13
B2P Micro 12 13Small 16 15
Medium 11 13
Table A6.5.5 – Information on interview responses across MSMRs: Morocco
Source: Team estimates based on trade interviews, pulse surveys and literature review
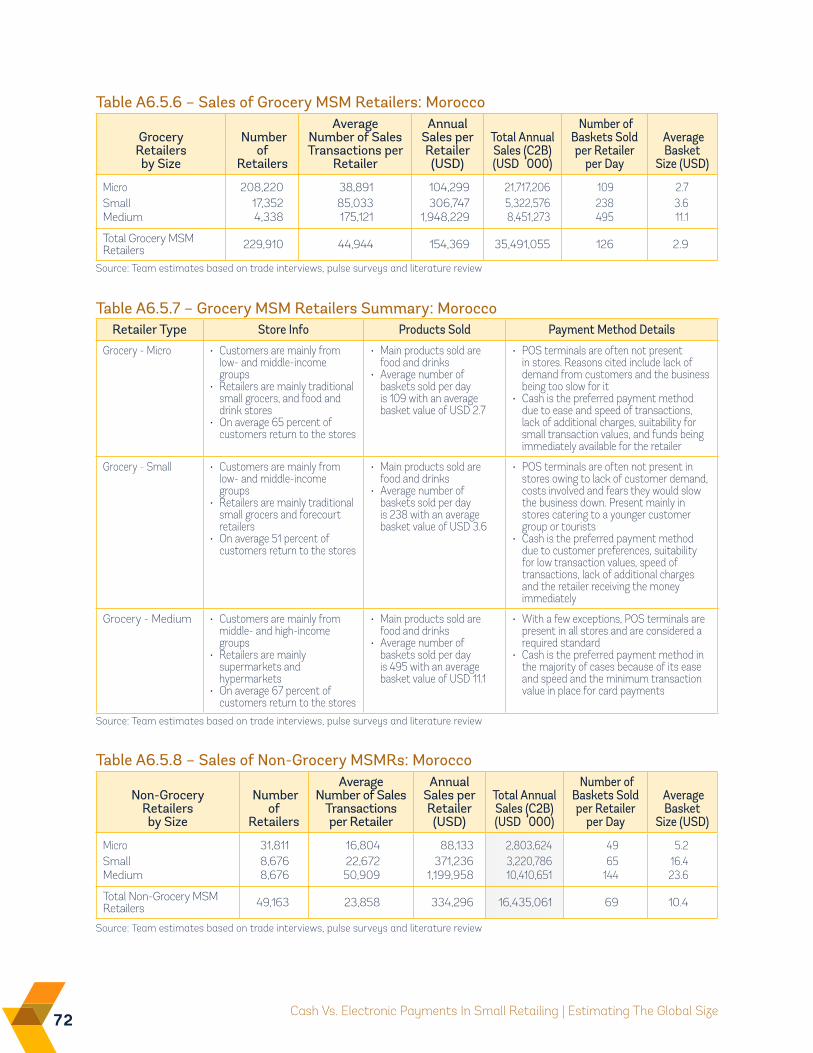
72 Cash Vs. Electronic Payments In Small Retailing | Estimating The Global Size
Table A6.5.6 – Sales of Grocery MSM Retailers: Morocco
Source: Team estimates based on trade interviews, pulse surveys and literature review
Retailer Type Store Info Products Sold Payment Method Details
Grocery - Micro • Customers are mainly from low- and middle-income groups
• Retailers are mainly traditional small grocers, and food and drink stores
• On average 65 percent of customers return to the stores
• Main products sold are food and drinks
• Average number of baskets sold per day is 109 with an average basket value of USD 2.7
• POS terminals are often not present in stores. Reasons cited include lack of demand from customers and the business being too slow for it
• Cash is the preferred payment method due to ease and speed of transactions, lack of additional charges, suitability for small transaction values, and funds being immediately available for the retailer
Grocery - Small • Customers are mainly from low- and middle-income groups
• Retailers are mainly traditional small grocers and forecourt retailers
• On average 51 percent of customers return to the stores
• Main products sold are food and drinks
• Average number of baskets sold per day is 238 with an average basket value of USD 3.6
• POS terminals are often not present in stores owing to lack of customer demand, costs involved and fears they would slow the business down. Present mainly in stores catering to a younger customer group or tourists
• Cash is the preferred payment method due to customer preferences, suitability for low transaction values, speed of transactions, lack of additional charges and the retailer receiving the money immediately
Grocery - Medium • Customers are mainly from middle- and high-income groups
• Retailers are mainly supermarkets and hypermarkets
• On average 67 percent of customers return to the stores
• Main products sold are food and drinks
• Average number of baskets sold per day is 495 with an average basket value of USD 11.1
• With a few exceptions, POS terminals are present in all stores and are considered a required standard
• Cash is the preferred payment method in the majority of cases because of its ease and speed and the minimum transaction value in place for card payments
Table A6.5.7 – Grocery MSM Retailers Summary: Morocco
Source: Team estimates based on trade interviews, pulse surveys and literature review
Non-Grocery Retailers by Size
Number of
Retailers
Average Number of Sales
Transactions per Retailer
Annual Sales per Retailer (USD)
Total Annual Sales (C2B) (USD ‘000)
Number of Baskets Sold per Retailer
per Day
Average Basket
Size (USD)
Micro 31,811 16,804 88,133 2,803,624 49 5.2Small 8,676 22,672 371,236 3,220,786 65 16.4Medium 8,676 50,909 1,199,958 10,410,651 144 23.6
Total Non-Grocery MSM Retailers 49,163 23,858 334,296 16,435,061 69 10.4
Table A6.5.8 – Sales of Non-Grocery MSMRs: Morocco
Source: Team estimates based on trade interviews, pulse surveys and literature review
Grocery Retailers by Size
Number of
Retailers
Average Number of Sales Transactions per
Retailer
Annual Sales per Retailer (USD)
Total Annual Sales (C2B) (USD ‘000)
Number of Baskets Sold per Retailer
per Day
Average Basket
Size (USD)
Micro 208,220 38,891 104,299 21,717,206 109 2.7Small 17,352 85,033 306,747 5,322,576 238 3.6Medium 4,338 175,121 1,948,229 8,451,273 495 11.1
Total Grocery MSM Retailers 229,910 44,944 154,369 35,491,055 126 2.9
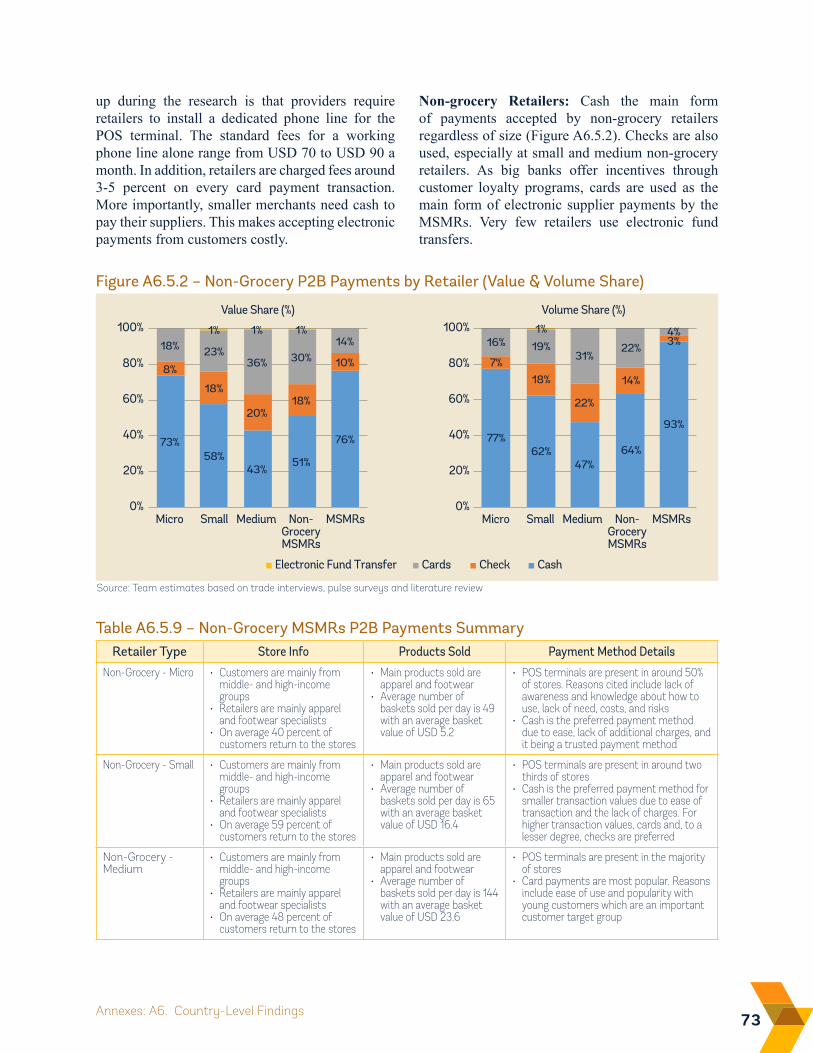
73Annexes: A6. Country-Level Findings
Figure A6.5.2 – Non-Grocery P2B Payments by Retailer (Value & Volume Share)
CheckElectronic Fund Transfer Cards Cash
0%
20%
40%
60%
80%
100%
Micro Small Medium Non-GroceryMSMRs
MSMRsMicro Small Medium Non-GroceryMSMRs
MSMRs
Value Share (%)
0%
20%
40%
60%
80%
100%Volume Share (%)
73%58%
43%51%
76%
8%
18%
20%18%
10%18% 23%
36% 30%14%
77%62%
47%64%
93%
7%18%
22%
14%
3%16% 19%31%
22%
1% 1% 1% 4%1%
Retailer Type Store Info Products Sold Payment Method Details
Non-Grocery - Micro • Customers are mainly from middle- and high-income groups
• Retailers are mainly apparel and footwear specialists
• On average 40 percent of customers return to the stores
• Main products sold are apparel and footwear
• Average number of baskets sold per day is 49 with an average basket value of USD 5.2
• POS terminals are present in around 50% of stores. Reasons cited include lack of awareness and knowledge about how to use, lack of need, costs, and risks
• Cash is the preferred payment method due to ease, lack of additional charges, and it being a trusted payment method
Non-Grocery - Small • Customers are mainly from middle- and high-income groups
• Retailers are mainly apparel and footwear specialists
• On average 59 percent of customers return to the stores
• Main products sold are apparel and footwear
• Average number of baskets sold per day is 65 with an average basket value of USD 16.4
• POS terminals are present in around two thirds of stores
• Cash is the preferred payment method for smaller transaction values due to ease of transaction and the lack of charges. For higher transaction values, cards and, to a lesser degree, checks are preferred
Non-Grocery - Medium
• Customers are mainly from middle- and high-income groups
• Retailers are mainly apparel and footwear specialists
• On average 48 percent of customers return to the stores
• Main products sold are apparel and footwear
• Average number of baskets sold per day is 144 with an average basket value of USD 23.6
• POS terminals are present in the majority of stores
• Card payments are most popular. Reasons include ease of use and popularity with young customers which are an important customer target group
Table A6.5.9 – Non-Grocery MSMRs P2B Payments Summary
Source: Team estimates based on trade interviews, pulse surveys and literature review
up during the research is that providers require retailers to install a dedicated phone line for the POS terminal. The standard fees for a working phone line alone range from USD 70 to USD 90 a month. In addition, retailers are charged fees around 3-5 percent on every card payment transaction. More importantly, smaller merchants need cash to pay their suppliers. This makes accepting electronic payments from customers costly.
Non-grocery Retailers: Cash the main form of payments accepted by non-grocery retailers regardless of size (Figure A6.5.2). Checks are also used, especially at small and medium non-grocery retailers. As big banks offer incentives through customer loyalty programs, cards are used as the main form of electronic supplier payments by the MSMRs. Very few retailers use electronic fund transfers.
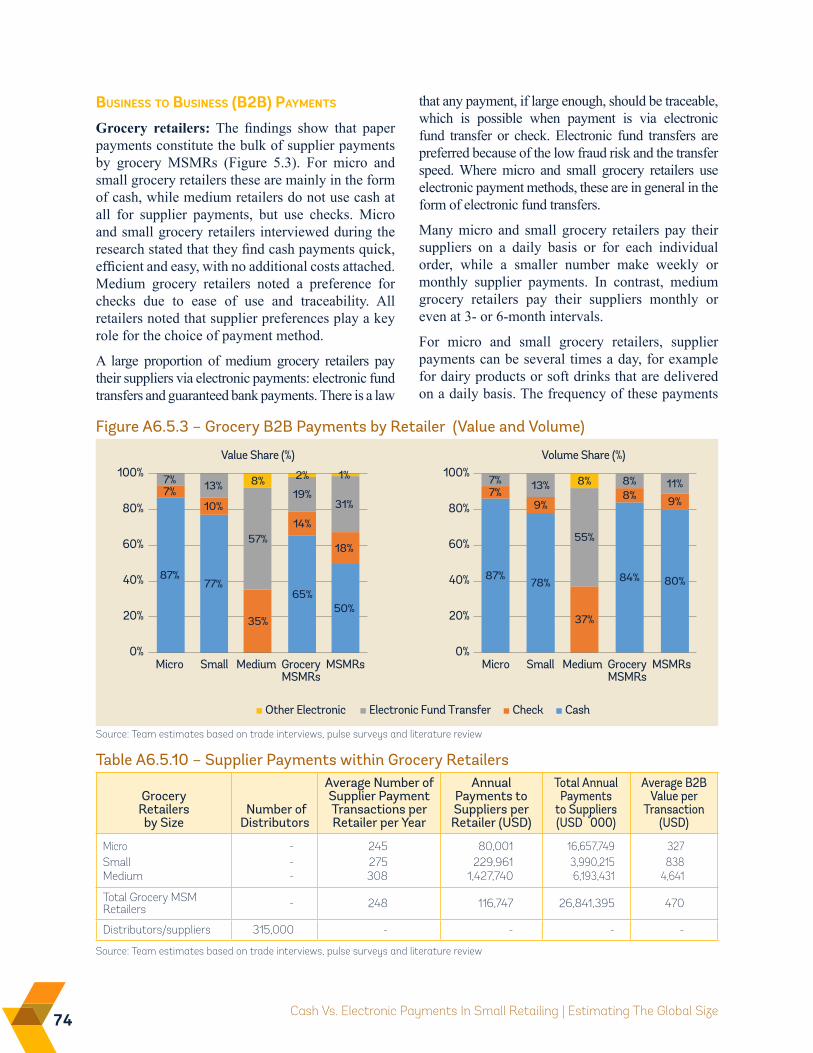
74 Cash Vs. Electronic Payments In Small Retailing | Estimating The Global Size
Grocery Retailers by Size
Number of Distributors
Average Number of Supplier Payment Transactions per Retailer per Year
Annual Payments to Suppliers per Retailer (USD)
Total Annual Payments
to Suppliers (USD ‘000)
Average B2B Value per
Transaction (USD)
Micro - 245 80,001 16,657,749 327Small - 275 229,961 3,990,215 838Medium - 308 1,427,740 6,193,431 4,641
Total Grocery MSM Retailers - 248 116,747 26,841,395 470
Distributors/suppliers 315,000 - - - -
Table A6.5.10 – Supplier Payments within Grocery Retailers
Source: Team estimates based on trade interviews, pulse surveys and literature review
Figure A6.5.3 – Grocery B2B Payments by Retailer (Value and Volume)
CheckOther Electronic Electronic Fund Transfer Cash
0%
20%
40%
60%
80%
100%
Micro Small Medium GroceryMSMRs
MSMRsMicro Small Medium GroceryMSMRs
MSMRs
Value Share (%)
0%
20%
40%
60%
80%
100%Volume Share (%)
87%77%
65%50%
7%10%
35%
14%
18%
7% 13%
57%
19%31%
8%
87%78% 84% 80%
7%9%
37%
8% 9%
7% 13%
55%
8% 11%8%2% 1%
Source: Team estimates based on trade interviews, pulse surveys and literature review
Business to Business (B2B) PayMents
Grocery retailers: The findings show that paper payments constitute the bulk of supplier payments by grocery MSMRs (Figure 5.3). For micro and small grocery retailers these are mainly in the form of cash, while medium retailers do not use cash at all for supplier payments, but use checks. Micro and small grocery retailers interviewed during the research stated that they find cash payments quick, efficient and easy, with no additional costs attached. Medium grocery retailers noted a preference for checks due to ease of use and traceability. All retailers noted that supplier preferences play a key role for the choice of payment method.
A large proportion of medium grocery retailers pay their suppliers via electronic payments: electronic fund transfers and guaranteed bank payments. There is a law
that any payment, if large enough, should be traceable, which is possible when payment is via electronic fund transfer or check. Electronic fund transfers are preferred because of the low fraud risk and the transfer speed. Where micro and small grocery retailers use electronic payment methods, these are in general in the form of electronic fund transfers.
Many micro and small grocery retailers pay their suppliers on a daily basis or for each individual order, while a smaller number make weekly or monthly supplier payments. In contrast, medium grocery retailers pay their suppliers monthly or even at 3- or 6-month intervals.
For micro and small grocery retailers, supplier payments can be several times a day, for example for dairy products or soft drinks that are delivered on a daily basis. The frequency of these payments
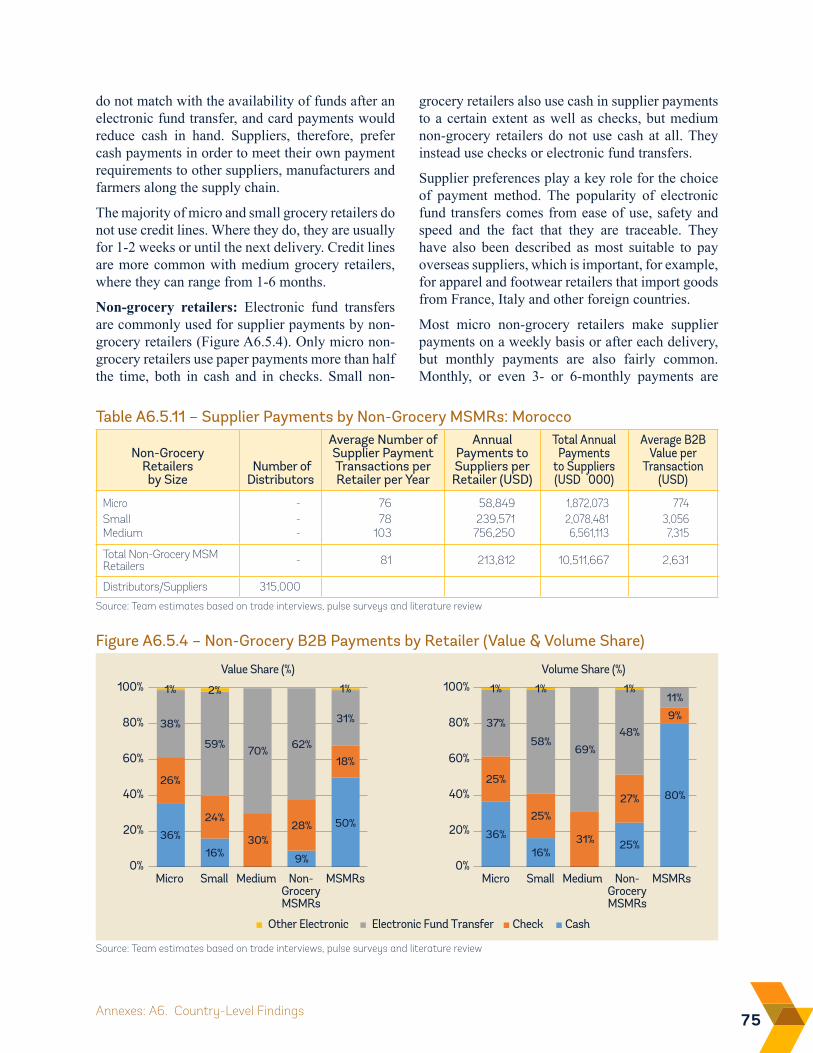
75Annexes: A6. Country-Level Findings
Table A6.5.11 – Supplier Payments by Non-Grocery MSMRs: Morocco
Non-Grocery Retailers by Size
Number of Distributors
Average Number of Supplier Payment Transactions per Retailer per Year
Annual Payments to Suppliers per Retailer (USD)
Total Annual Payments
to Suppliers (USD ‘000)
Average B2B Value per
Transaction (USD)
Micro - 76 58,849 1,872,073 774Small - 78 239,571 2,078,481 3,056Medium - 103 756,250 6,561,113 7,315
Total Non-Grocery MSM Retailers - 81 213,812 10,511,667 2,631
Distributors/Suppliers 315,000
Source: Team estimates based on trade interviews, pulse surveys and literature review
Figure A6.5.4 – Non-Grocery B2B Payments by Retailer (Value & Volume Share)
CheckOther Electronic Electronic Fund Transfer Cash
0%
20%
40%
60%
80%
100%
Micro Small Medium Non-GroceryMSMRs
MSMRsMicro Small Medium Non-GroceryMSMRs
MSMRs
Value Share (%)
0%
20%
40%
60%
80%
100%Volume Share (%)
36%
16% 9%
50%
26%
24%
30%28%
18%
38%
59% 70% 62%
31%
1% 2% 1%
36%
16%25%
80%25%
25%
31%
27%
9%37%
58%69%
48%
11%1% 1% 1%
Source: Team estimates based on trade interviews, pulse surveys and literature review
do not match with the availability of funds after an electronic fund transfer, and card payments would reduce cash in hand. Suppliers, therefore, prefer cash payments in order to meet their own payment requirements to other suppliers, manufacturers and farmers along the supply chain.
The majority of micro and small grocery retailers do not use credit lines. Where they do, they are usually for 1-2 weeks or until the next delivery. Credit lines are more common with medium grocery retailers, where they can range from 1-6 months.
Non-grocery retailers: Electronic fund transfers are commonly used for supplier payments by non-grocery retailers (Figure A6.5.4). Only micro non-grocery retailers use paper payments more than half the time, both in cash and in checks. Small non-
grocery retailers also use cash in supplier payments to a certain extent as well as checks, but medium non-grocery retailers do not use cash at all. They instead use checks or electronic fund transfers.
Supplier preferences play a key role for the choice of payment method. The popularity of electronic fund transfers comes from ease of use, safety and speed and the fact that they are traceable. They have also been described as most suitable to pay overseas suppliers, which is important, for example, for apparel and footwear retailers that import goods from France, Italy and other foreign countries.
Most micro non-grocery retailers make supplier payments on a weekly basis or after each delivery, but monthly payments are also fairly common. Monthly, or even 3- or 6-monthly payments are
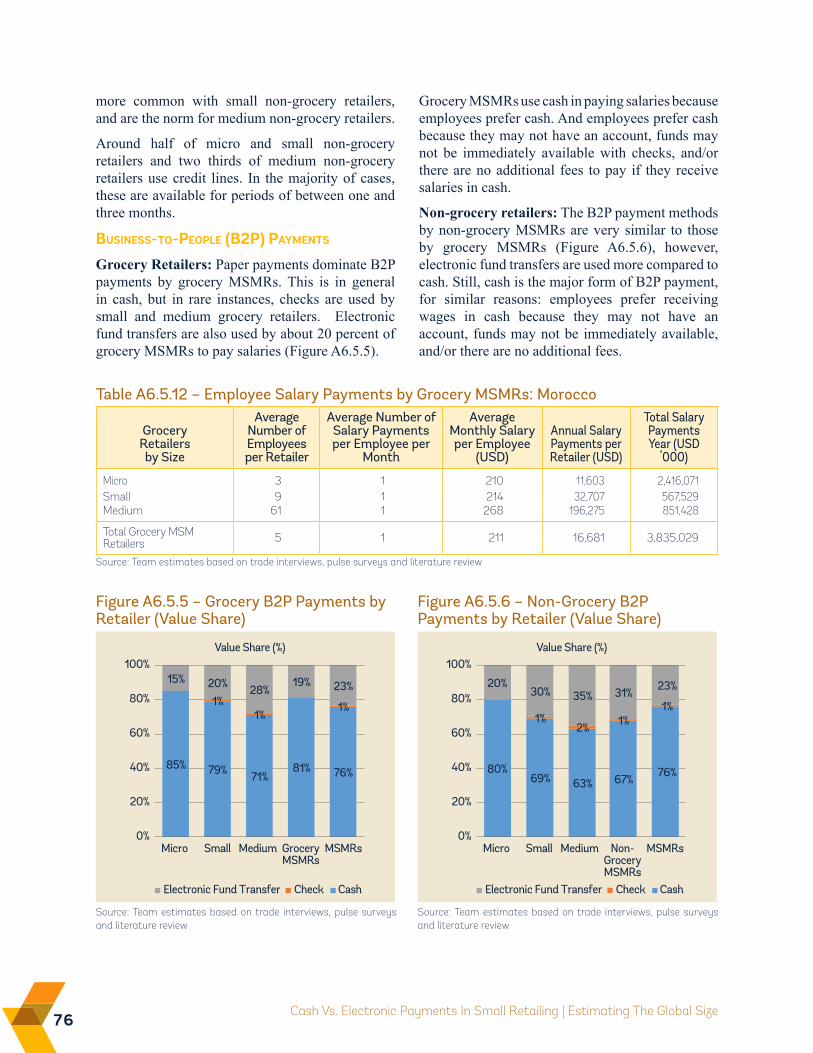
76 Cash Vs. Electronic Payments In Small Retailing | Estimating The Global Size
Figure A6.5.5 – Grocery B2P Payments by Retailer (Value Share)
Electronic Fund Transfer Check Cash
0%
20%
40%
60%
80%
100%
Micro Small Medium GroceryMSMRs
MSMRs
Value Share (%)
85% 79% 71%81% 76%
1%1%
1%
15% 20% 28%19% 23%
Source: Team estimates based on trade interviews, pulse surveys and literature review
Figure A6.5.6 – Non-Grocery B2P Payments by Retailer (Value Share)
Source: Team estimates based on trade interviews, pulse surveys and literature review
Electronic Fund Transfer Check Cash
0%
20%
40%
60%
80%
100%
Micro Small Medium Non-GroceryMSMRs
MSMRs
Value Share (%)
80%69% 63% 67% 76%
1%2% 1%
1%
20%30% 35% 31% 23%
more common with small non-grocery retailers, and are the norm for medium non-grocery retailers.
Around half of micro and small non-grocery retailers and two thirds of medium non-grocery retailers use credit lines. In the majority of cases, these are available for periods of between one and three months.
Business-to-PeoPle (B2P) PayMents
Grocery Retailers: Paper payments dominate B2P payments by grocery MSMRs. This is in general in cash, but in rare instances, checks are used by small and medium grocery retailers. Electronic fund transfers are also used by about 20 percent of grocery MSMRs to pay salaries (Figure A6.5.5).
Table A6.5.12 – Employee Salary Payments by Grocery MSMRs: Morocco
Grocery Retailers by Size
Average Number of Employees per Retailer
Average Number of Salary Payments per Employee per
Month
Average Monthly Salary per Employee
(USD)
Annual Salary Payments per Retailer (USD)
Total Salary Payments Year (USD
‘000)
Micro 3 1 210 11,603 2,416,071Small 9 1 214 32,707 567,529Medium 61 1 268 196,275 851,428
Total Grocery MSM Retailers 5 1 211 16,681 3,835,029
Source: Team estimates based on trade interviews, pulse surveys and literature review
Grocery MSMRs use cash in paying salaries because employees prefer cash. And employees prefer cash because they may not have an account, funds may not be immediately available with checks, and/or there are no additional fees to pay if they receive salaries in cash.
Non-grocery retailers: The B2P payment methods by non-grocery MSMRs are very similar to those by grocery MSMRs (Figure A6.5.6), however, electronic fund transfers are used more compared to cash. Still, cash is the major form of B2P payment, for similar reasons: employees prefer receiving wages in cash because they may not have an account, funds may not be immediately available, and/or there are no additional fees.
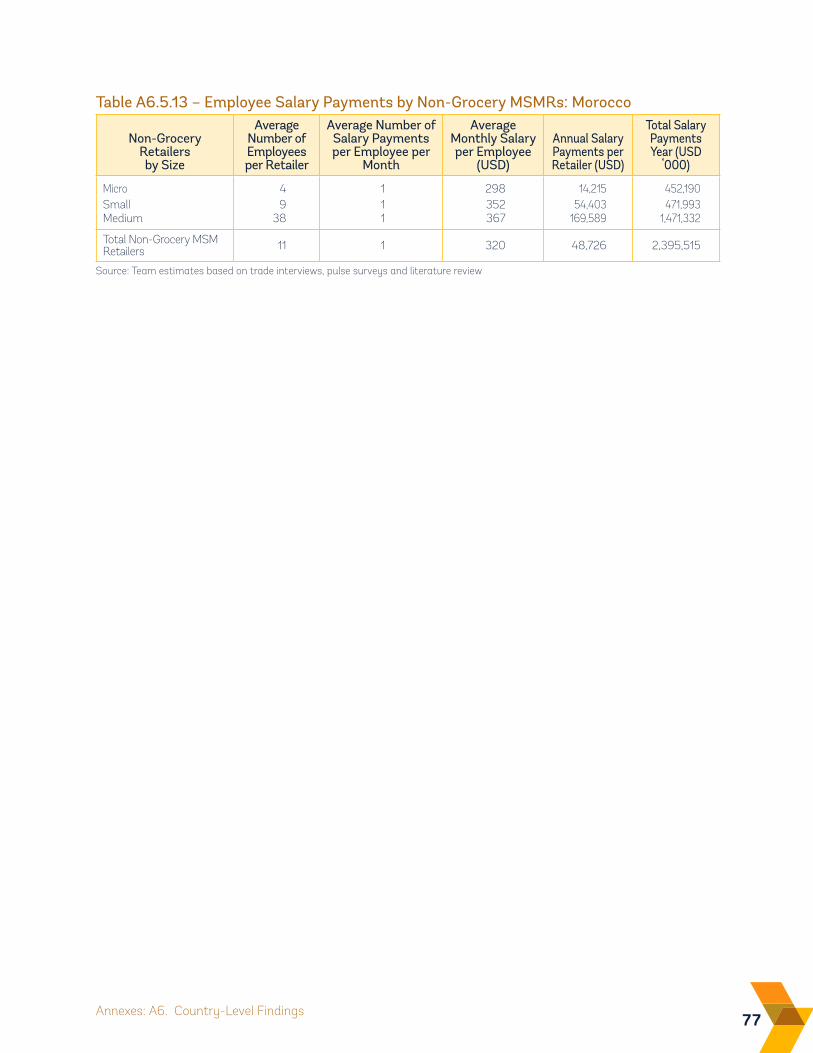
77Annexes: A6. Country-Level Findings
Table A6.5.13 – Employee Salary Payments by Non-Grocery MSMRs: Morocco
Non-Grocery Retailers by Size
Average Number of Employees per Retailer
Average Number of Salary Payments per Employee per
Month
Average Monthly Salary per Employee
(USD)
Annual Salary Payments per Retailer (USD)
Total Salary Payments Year (USD
‘000)
Micro 4 1 298 14,215 452,190Small 9 1 352 54,403 471,993Medium 38 1 367 169,589 1,471,332
Total Non-Grocery MSM Retailers 11 1 320 48,726 2,395,515
Source: Team estimates based on trade interviews, pulse surveys and literature review
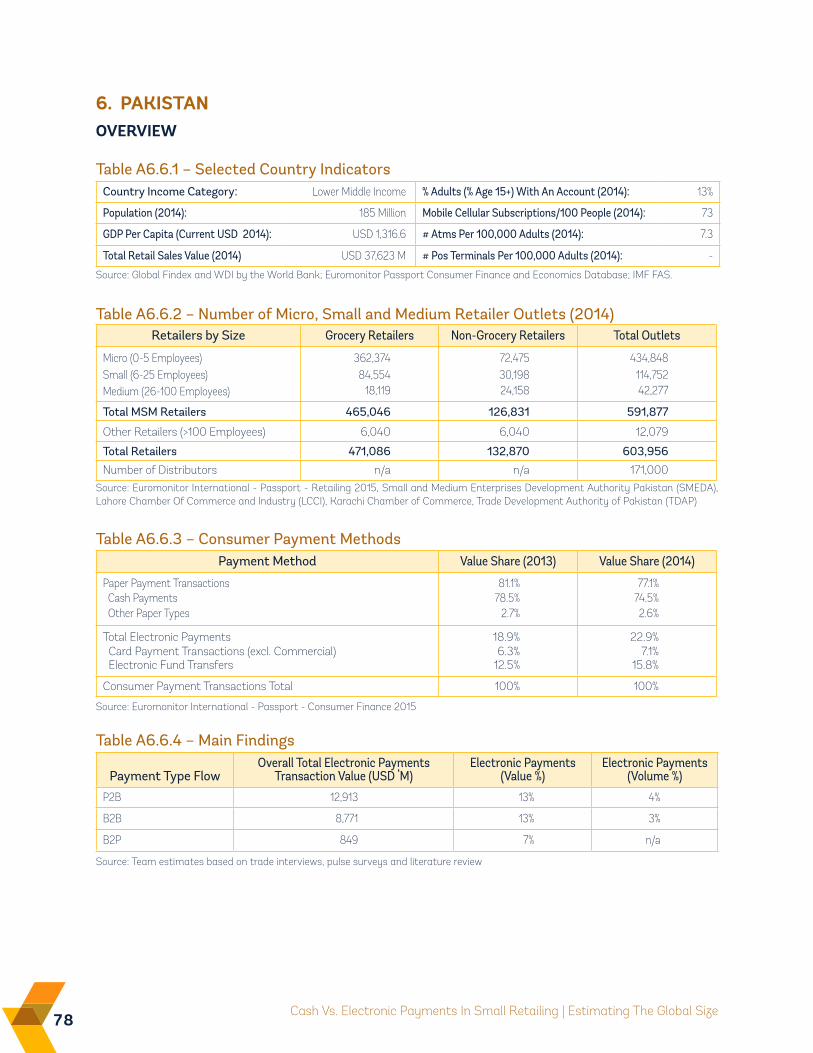
78 Cash Vs. Electronic Payments In Small Retailing | Estimating The Global Size
Table A6.6.2 – Number of Micro, Small and Medium Retailer Outlets (2014)
Source: Euromonitor International - Passport - Retailing 2015, Small and Medium Enterprises Development Authority Pakistan (SMEDA), Lahore Chamber Of Commerce and Industry (LCCI), Karachi Chamber of Commerce, Trade Development Authority of Pakistan (TDAP)
Payment Method Value Share (2013) Value Share (2014)
Paper Payment Transactions 81.1% 77.1% Cash Payments 78.5% 74.5% Other Paper Types 2.7% 2.6%
Total Electronic Payments 18.9% 22.9% Card Payment Transactions (excl. Commercial) 6.3% 7.1% Electronic Fund Transfers 12.5% 15.8%
Consumer Payment Transactions Total 100% 100%
Table A6.6.3 – Consumer Payment Methods
Source: Euromonitor International - Passport - Consumer Finance 2015
Payment Type FlowOverall Total Electronic Payments
Transaction Value (USD ‘M)Electronic Payments
(Value %)Electronic Payments
(Volume %)
P2B 12,913 13% 4%
B2B 8,771 13% 3%
B2P 849 7% n/a
Table A6.6.4 – Main Findings
Source: Team estimates based on trade interviews, pulse surveys and literature review
6. PAKiSTANOvERviEW
Country Income Category: Lower Middle Income % Adults (% Age 15+) With An Account (2014): 13%
Population (2014): 185 Million Mobile Cellular Subscriptions/100 People (2014): 73
GDP Per Capita (Current USD 2014): USD 1,316.6 # Atms Per 100,000 Adults (2014): 7.3
Total Retail Sales Value (2014) USD 37,623 M # Pos Terminals Per 100,000 Adults (2014): -
Table A6.6.1 – Selected Country Indicators
Source: Global Findex and WDI by the World Bank; Euromonitor Passport Consumer Finance and Economics Database; IMF FAS.
Retailers by Size Grocery Retailers Non-Grocery Retailers Total Outlets
Micro (0-5 Employees) 362,374 72,475 434,848Small (6-25 Employees) 84,554 30,198 114,752Medium (26-100 Employees) 18,119 24,158 42,277
Total MSM Retailers 465,046 126,831 591,877
Other Retailers (>100 Employees) 6,040 6,040 12,079
Total Retailers 471,086 132,870 603,956
Number of Distributors n/a n/a 171,000
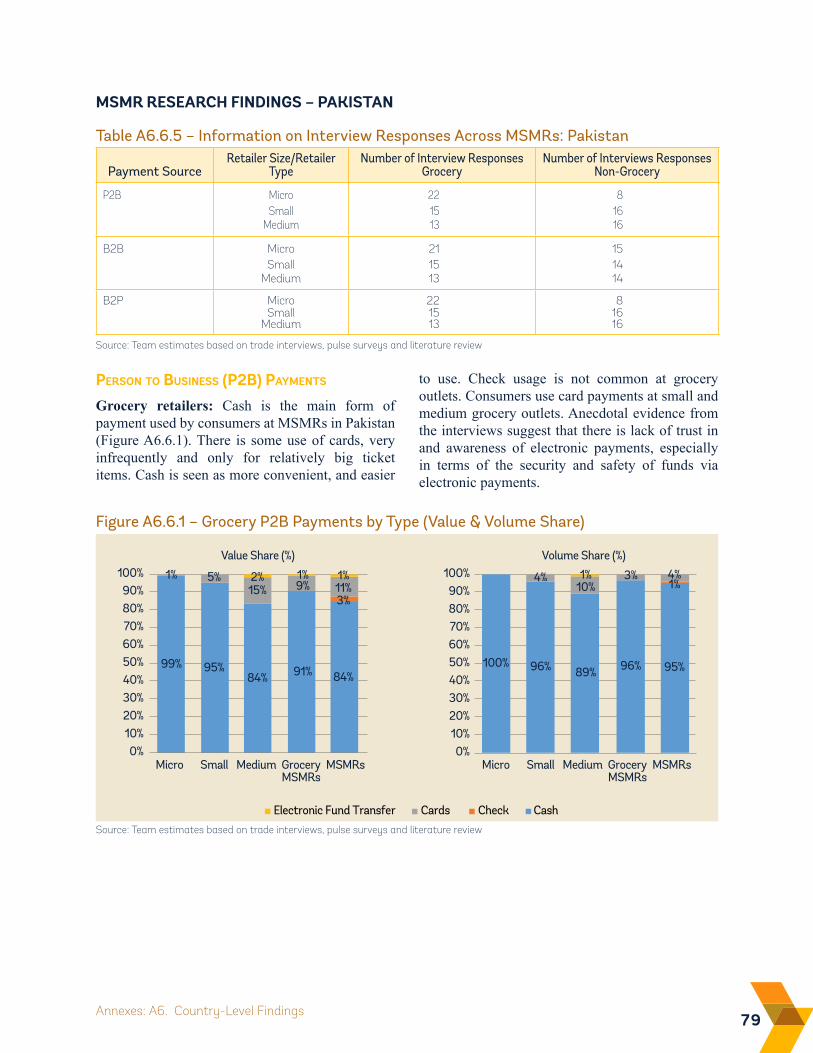
79Annexes: A6. Country-Level Findings
MSMR RESEARCH FiNDiNGS – PAKiSTAN
Person to Business (P2B) PayMents
Grocery retailers: Cash is the main form of payment used by consumers at MSMRs in Pakistan (Figure A6.6.1). There is some use of cards, very infrequently and only for relatively big ticket items. Cash is seen as more convenient, and easier
Figure A6.6.1 – Grocery P2B Payments by Type (Value & Volume Share)
Electronic Fund Transfer Cards Check Cash
100%
Micro Small Medium GroceryMSMRs
MSMRsMicro Small Medium GroceryMSMRs
MSMRs
Value Share (%) Volume Share (%)
0%10%20%30%40%50%60%70%80%90%
0%10%20%30%40%50%60%70%80%90%
100%
99% 95%84% 91% 84%
3%
1% 5%15% 9% 11%2% 1% 1%
100% 96% 89% 96% 95%
1%4%10%
3% 4%1%
to use. Check usage is not common at grocery outlets. Consumers use card payments at small and medium grocery outlets. Anecdotal evidence from the interviews suggest that there is lack of trust in and awareness of electronic payments, especially in terms of the security and safety of funds via electronic payments.
Source: Team estimates based on trade interviews, pulse surveys and literature review
Payment SourceRetailer Size/Retailer
TypeNumber of Interview Responses
GroceryNumber of Interviews Responses
Non-Grocery
P2B Micro 22 8Small 15 16
Medium 13 16
B2B Micro 21 15Small 15 14
Medium 13 14
B2P Micro 22 8Small 15 16
Medium 13 16
Table A6.6.5 – Information on Interview Responses Across MSMRs: Pakistan
Source: Team estimates based on trade interviews, pulse surveys and literature review
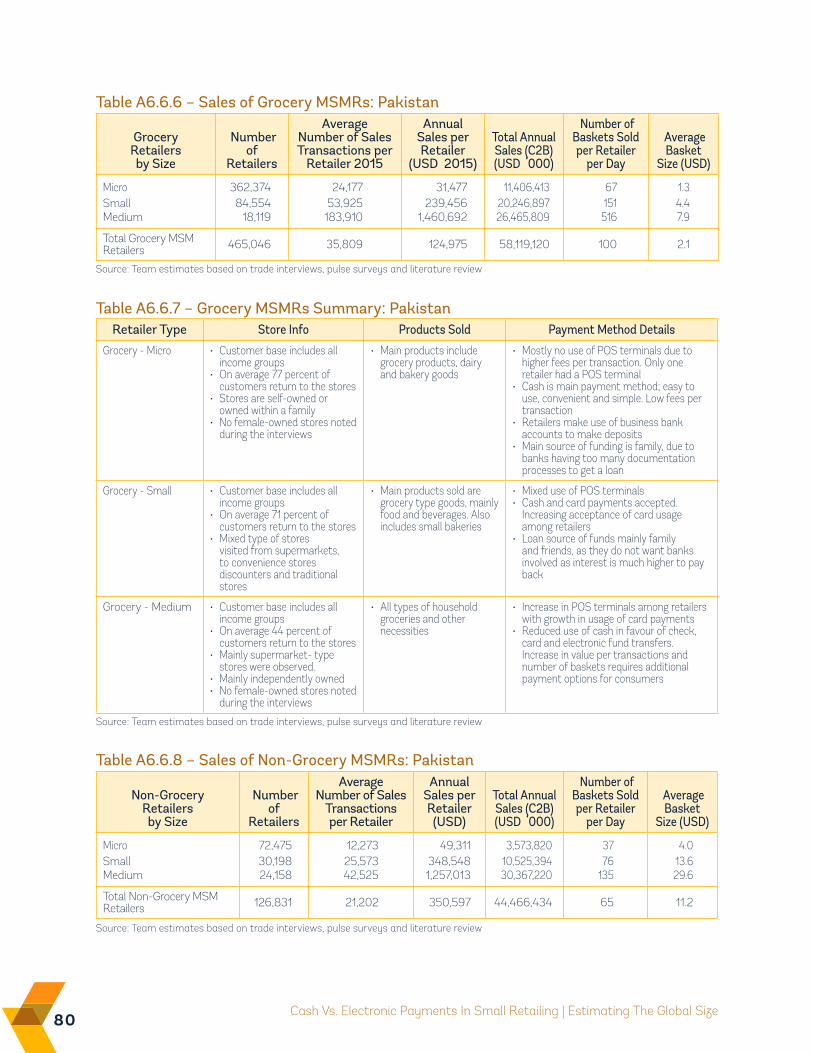
80 Cash Vs. Electronic Payments In Small Retailing | Estimating The Global Size
Table A6.6.6 – Sales of Grocery MSMRs: Pakistan
Source: Team estimates based on trade interviews, pulse surveys and literature review
Retailer Type Store Info Products Sold Payment Method Details
Grocery - Micro • Customer base includes all income groups
• On average 77 percent of customers return to the stores
• Stores are self-owned or owned within a family
• No female-owned stores noted during the interviews
• Main products include grocery products, dairy and bakery goods
• Mostly no use of POS terminals due to higher fees per transaction. Only one retailer had a POS terminal
• Cash is main payment method; easy to use, convenient and simple. Low fees per transaction
• Retailers make use of business bank accounts to make deposits
• Main source of funding is family, due to banks having too many documentation processes to get a loan
Grocery - Small • Customer base includes all income groups
• On average 71 percent of customers return to the stores
• Mixed type of stores visited from supermarkets, to convenience stores discounters and traditional stores
• Main products sold are grocery type goods, mainly food and beverages. Also includes small bakeries
• Mixed use of POS terminals • Cash and card payments accepted.
Increasing acceptance of card usage among retailers
• Loan source of funds mainly family and friends, as they do not want banks involved as interest is much higher to pay back
Grocery - Medium • Customer base includes all income groups
• On average 44 percent of customers return to the stores
• Mainly supermarket- type stores were observed.
• Mainly independently owned• No female-owned stores noted
during the interviews
• All types of household groceries and other necessities
• Increase in POS terminals among retailers with growth in usage of card payments
• Reduced use of cash in favour of check, card and electronic fund transfers. Increase in value per transactions and number of baskets requires additional payment options for consumers
Table A6.6.7 – Grocery MSMRs Summary: Pakistan
Source: Team estimates based on trade interviews, pulse surveys and literature review
Non-Grocery Retailers by Size
Number of
Retailers
Average Number of Sales
Transactions per Retailer
Annual Sales per Retailer (USD)
Total Annual Sales (C2B) (USD ‘000)
Number of Baskets Sold per Retailer
per Day
Average Basket
Size (USD)
Micro 72,475 12,273 49,311 3,573,820 37 4.0Small 30,198 25,573 348,548 10,525,394 76 13.6Medium 24,158 42,525 1,257,013 30,367,220 135 29.6
Total Non-Grocery MSM Retailers 126,831 21,202 350,597 44,466,434 65 11.2
Table A6.6.8 – Sales of Non-Grocery MSMRs: Pakistan
Source: Team estimates based on trade interviews, pulse surveys and literature review
Grocery Retailers by Size
Number of
Retailers
Average Number of Sales Transactions per
Retailer 2015
Annual Sales per Retailer
(USD 2015)
Total Annual Sales (C2B) (USD ‘000)
Number of Baskets Sold per Retailer
per Day
Average Basket
Size (USD)
Micro 362,374 24,177 31,477 11,406,413 67 1.3Small 84,554 53,925 239,456 20,246,897 151 4.4Medium 18,119 183,910 1,460,692 26,465,809 516 7.9
Total Grocery MSM Retailers 465,046 35,809 124,975 58,119,120 100 2.1
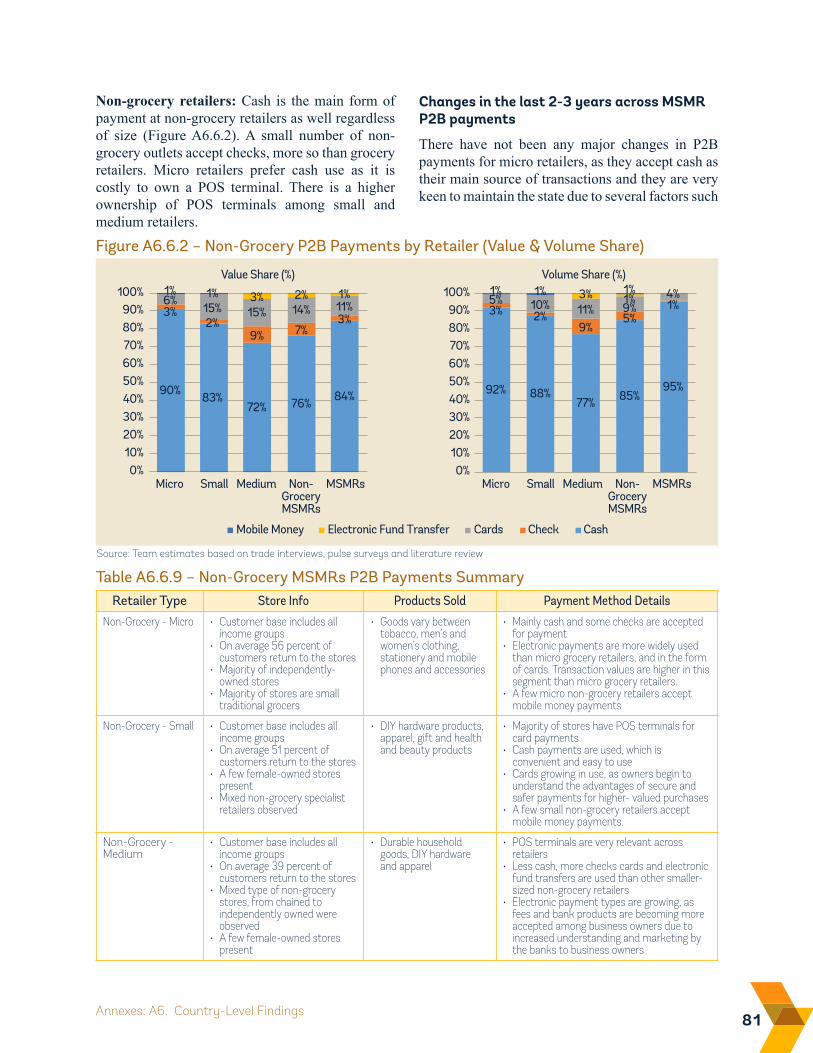
81Annexes: A6. Country-Level Findings
Figure A6.6.2 – Non-Grocery P2B Payments by Retailer (Value & Volume Share)
100%
Micro Small Medium Non-GroceryMSMRs
MSMRsMicro Small Medium Non-GroceryMSMRs
MSMRs
Value Share (%) Volume Share (%)
0%10%20%30%40%50%60%70%80%90%
0%10%20%30%40%50%60%70%80%90%
100%
Mobile Money Electronic Fund Transfer Cards CashCheck
90% 83%72% 76% 84%
3%2%
9% 7%3%
6%15% 15% 14% 11%
92% 88%77% 85%
95%
3% 2%9%
5%1%5% 10% 11% 9%
1%2% 1%1% 1% 3% 4%3% 1%1% 1%
Retailer Type Store Info Products Sold Payment Method Details
Non-Grocery - Micro • Customer base includes all income groups
• On average 56 percent of customers return to the stores
• Majority of independently-owned stores
• Majority of stores are small traditional grocers
• Goods vary between tobacco, men’s and women’s clothing, stationery and mobile phones and accessories
• Mainly cash and some checks are accepted for payment
• Electronic payments are more widely used than micro grocery retailers, and in the form of cards. Transaction values are higher in this segment than micro grocery retailers.
• A few micro non-grocery retailers accept mobile money payments
Non-Grocery - Small • Customer base includes all income groups
• On average 51 percent of customers return to the stores
• A few female-owned stores present
• Mixed non-grocery specialist retailers observed
• DIY hardware products, apparel, gift and health and beauty products
• Majority of stores have POS terminals for card payments
• Cash payments are used, which is convenient and easy to use
• Cards growing in use, as owners begin to understand the advantages of secure and safer payments for higher- valued purchases
• A few small non-grocery retailers accept mobile money payments.
Non-Grocery - Medium
• Customer base includes all income groups
• On average 39 percent of customers return to the stores
• Mixed type of non-grocery stores, from chained to independently owned were observed
• A few female-owned stores present
• Durable household goods, DIY hardware and apparel
• POS terminals are very relevant across retailers
• Less cash, more checks cards and electronic fund transfers are used than other smaller-sized non-grocery retailers
• Electronic payment types are growing, as fees and bank products are becoming more accepted among business owners due to increased understanding and marketing by the banks to business owners
Table A6.6.9 – Non-Grocery MSMRs P2B Payments Summary
Source: Team estimates based on trade interviews, pulse surveys and literature review
Non-grocery retailers: Cash is the main form of payment at non-grocery retailers as well regardless of size (Figure A6.6.2). A small number of non-grocery outlets accept checks, more so than grocery retailers. Micro retailers prefer cash use as it is costly to own a POS terminal. There is a higher ownership of POS terminals among small and medium retailers.
Changes in the last 2-3 years across MSMR P2B payments
There have not been any major changes in P2B payments for micro retailers, as they accept cash as their main source of transactions and they are very keen to maintain the state due to several factors such
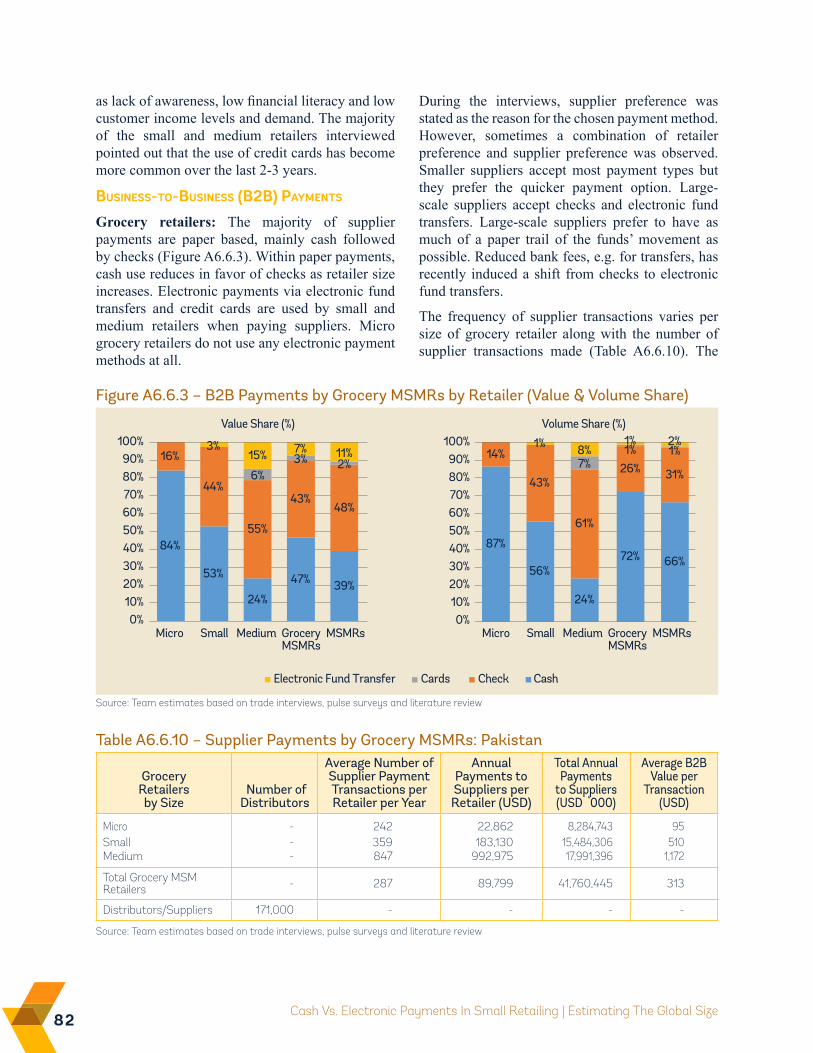
82 Cash Vs. Electronic Payments In Small Retailing | Estimating The Global Size
Grocery Retailers by Size
Number of Distributors
Average Number of Supplier Payment Transactions per Retailer per Year
Annual Payments to Suppliers per Retailer (USD)
Total Annual Payments
to Suppliers (USD ‘000)
Average B2B Value per
Transaction (USD)
Micro - 242 22,862 8,284,743 95Small - 359 183,130 15,484,306 510Medium - 847 992,975 17,991,396 1,172
Total Grocery MSM Retailers - 287 89,799 41,760,445 313
Distributors/Suppliers 171,000 - - - -
Table A6.6.10 – Supplier Payments by Grocery MSMRs: Pakistan
Source: Team estimates based on trade interviews, pulse surveys and literature review
Figure A6.6.3 – B2B Payments by Grocery MSMRs by Retailer (Value & Volume Share)
Electronic Fund Transfer Cards Check Cash
100%
Micro Small Medium GroceryMSMRs
MSMRsMicro Small Medium GroceryMSMRs
MSMRs
Value Share (%) Volume Share (%)
0%10%20%30%40%50%60%70%80%90%
0%10%20%30%40%50%60%70%80%90%
100%
84%
53%
24%
47% 39%
16%
44%
55%
43%48%
6%3% 2%
15% 7% 11%
87%
56%
24%
72% 66%
14%
43%
61%
26% 31%7%
1%8% 1%3% 1%1% 2%
Source: Team estimates based on trade interviews, pulse surveys and literature review
as lack of awareness, low financial literacy and low customer income levels and demand. The majority of the small and medium retailers interviewed pointed out that the use of credit cards has become more common over the last 2-3 years.
Business-to-Business (B2B) PayMents
Grocery retailers: The majority of supplier payments are paper based, mainly cash followed by checks (Figure A6.6.3). Within paper payments, cash use reduces in favor of checks as retailer size increases. Electronic payments via electronic fund transfers and credit cards are used by small and medium retailers when paying suppliers. Micro grocery retailers do not use any electronic payment methods at all.
During the interviews, supplier preference was stated as the reason for the chosen payment method. However, sometimes a combination of retailer preference and supplier preference was observed. Smaller suppliers accept most payment types but they prefer the quicker payment option. Large-scale suppliers accept checks and electronic fund transfers. Large-scale suppliers prefer to have as much of a paper trail of the funds’ movement as possible. Reduced bank fees, e.g. for transfers, has recently induced a shift from checks to electronic fund transfers.
The frequency of supplier transactions varies per size of grocery retailer along with the number of supplier transactions made (Table A6.6.10). The
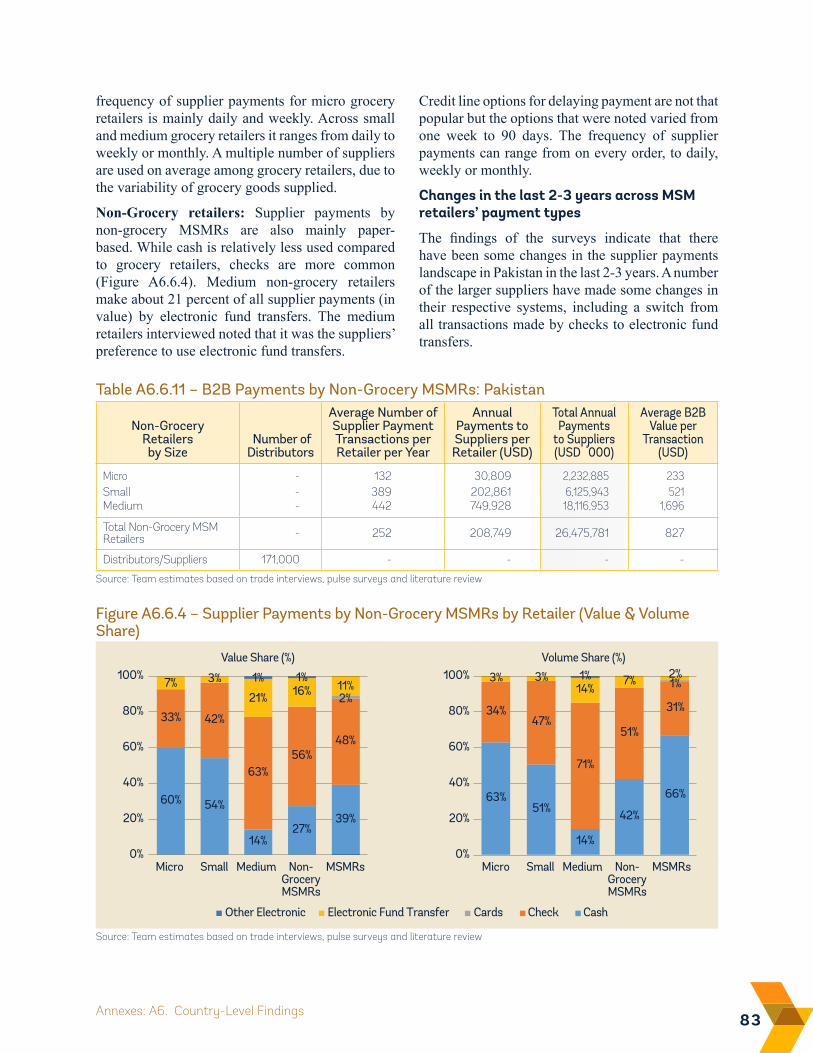
83Annexes: A6. Country-Level Findings
Table A6.6.11 – B2B Payments by Non-Grocery MSMRs: Pakistan
Non-Grocery Retailers by Size
Number of Distributors
Average Number of Supplier Payment Transactions per Retailer per Year
Annual Payments to Suppliers per Retailer (USD)
Total Annual Payments
to Suppliers (USD ‘000)
Average B2B Value per
Transaction (USD)
Micro - 132 30,809 2,232,885 233Small - 389 202,861 6,125,943 521Medium - 442 749,928 18,116,953 1,696
Total Non-Grocery MSM Retailers - 252 208,749 26,475,781 827
Distributors/Suppliers 171,000 - - - -
Source: Team estimates based on trade interviews, pulse surveys and literature review
Figure A6.6.4 – Supplier Payments by Non-Grocery MSMRs by Retailer (Value & Volume Share)
Other Electronic Electronic Fund Transfer Cards CashCheck
0%
20%
40%
60%
80%
100%
Micro Small Medium Non-GroceryMSMRs
MSMRsMicro Small Medium Non-GroceryMSMRs
MSMRs
Value Share (%)
0%
20%
40%
60%
80%
100%Volume Share (%)
60% 54%
14%27%
39%
33% 42%
63%56%
48%
2%7%
21% 16% 11%
63%51%
14%
42%
66%
34%47%
71%
51%
31%
1%14%3% 1% 1% 3% 3% 7% 2%1%
Source: Team estimates based on trade interviews, pulse surveys and literature review
frequency of supplier payments for micro grocery retailers is mainly daily and weekly. Across small and medium grocery retailers it ranges from daily to weekly or monthly. A multiple number of suppliers are used on average among grocery retailers, due to the variability of grocery goods supplied.
Non-Grocery retailers: Supplier payments by non-grocery MSMRs are also mainly paper-based. While cash is relatively less used compared to grocery retailers, checks are more common (Figure A6.6.4). Medium non-grocery retailers make about 21 percent of all supplier payments (in value) by electronic fund transfers. The medium retailers interviewed noted that it was the suppliers’ preference to use electronic fund transfers.
Credit line options for delaying payment are not that popular but the options that were noted varied from one week to 90 days. The frequency of supplier payments can range from on every order, to daily, weekly or monthly.
Changes in the last 2-3 years across MSM retailers’ payment types
The findings of the surveys indicate that there have been some changes in the supplier payments landscape in Pakistan in the last 2-3 years. A number of the larger suppliers have made some changes in their respective systems, including a switch from all transactions made by checks to electronic fund transfers.
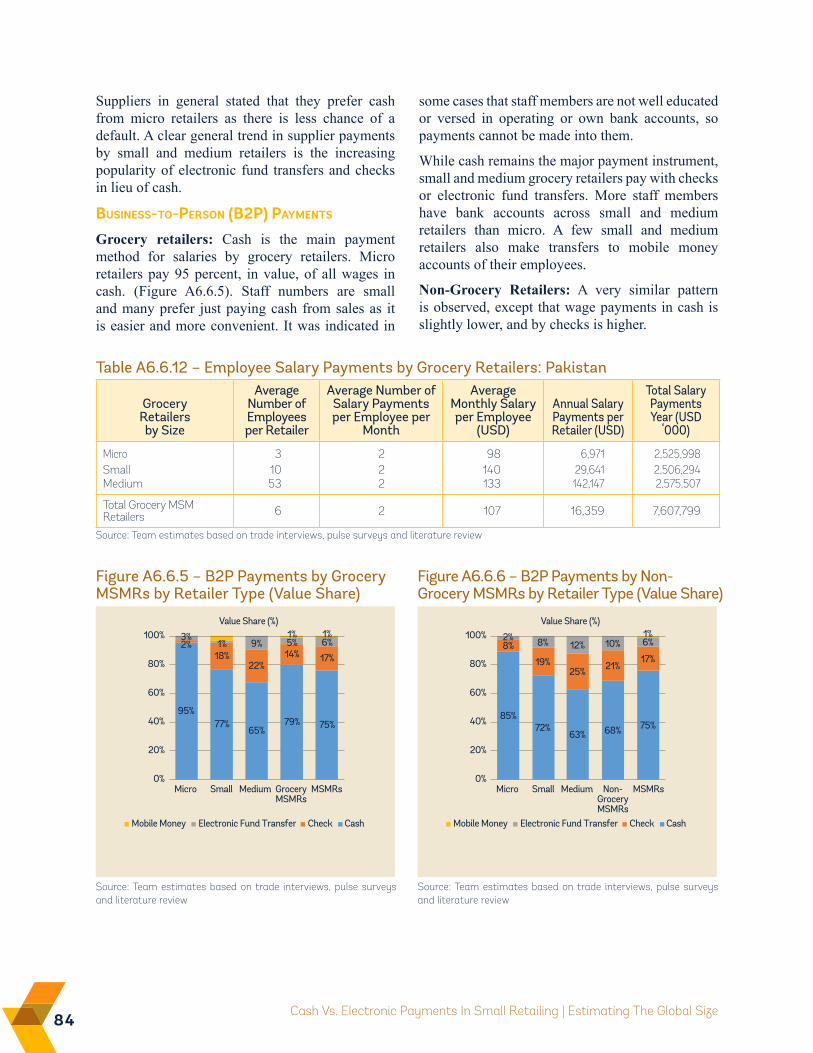
84 Cash Vs. Electronic Payments In Small Retailing | Estimating The Global Size
Suppliers in general stated that they prefer cash from micro retailers as there is less chance of a default. A clear general trend in supplier payments by small and medium retailers is the increasing popularity of electronic fund transfers and checks in lieu of cash.
Business-to-Person (B2P) PayMents
Grocery retailers: Cash is the main payment method for salaries by grocery retailers. Micro retailers pay 95 percent, in value, of all wages in cash. (Figure A6.6.5). Staff numbers are small and many prefer just paying cash from sales as it is easier and more convenient. It was indicated in
some cases that staff members are not well educated or versed in operating or own bank accounts, so payments cannot be made into them.
While cash remains the major payment instrument, small and medium grocery retailers pay with checks or electronic fund transfers. More staff members have bank accounts across small and medium retailers than micro. A few small and medium retailers also make transfers to mobile money accounts of their employees.
Non-Grocery Retailers: A very similar pattern is observed, except that wage payments in cash is slightly lower, and by checks is higher.
Figure A6.6.5 – B2P Payments by Grocery MSMRs by Retailer Type (Value Share)
Mobile Money Electronic Fund Transfer Check Cash
0%
20%
40%
60%
80%
100%
Micro Small Medium GroceryMSMRs
MSMRs
Value Share (%)
95%77%
65%79% 75%
2%18%
22%14% 17%
1% 9% 5% 6%3% 1% 1%
Source: Team estimates based on trade interviews, pulse surveys and literature review
Figure A6.6.6 – B2P Payments by Non- Grocery MSMRs by Retailer Type (Value Share)
Source: Team estimates based on trade interviews, pulse surveys and literature review
Mobile Money Electronic Fund Transfer Check Cash
0%
20%
40%
60%
80%
100%
Micro Small Medium Non-GroceryMSMRs
MSMRs
Value Share (%)
85%72%
63% 68% 75%
8%
19%25% 21%
17%
8% 12% 10% 6%2% 1%
Table A6.6.12 – Employee Salary Payments by Grocery Retailers: Pakistan
Grocery Retailers by Size
Average Number of Employees per Retailer
Average Number of Salary Payments per Employee per
Month
Average Monthly Salary per Employee
(USD)
Annual Salary Payments per Retailer (USD)
Total Salary Payments Year (USD
‘000)
Micro 3 2 98 6,971 2,525,998Small 10 2 140 29,641 2,506,294Medium 53 2 133 142,147 2,575,507
Total Grocery MSM Retailers 6 2 107 16,359 7,607,799
Source: Team estimates based on trade interviews, pulse surveys and literature review
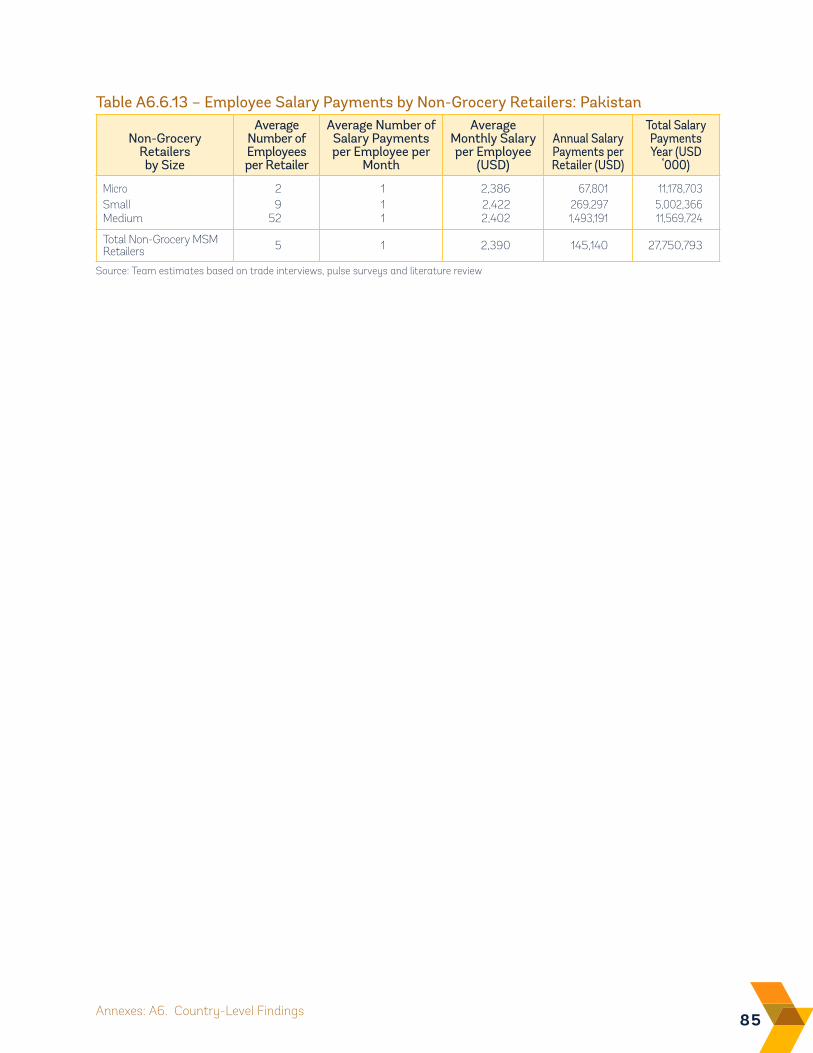
85Annexes: A6. Country-Level Findings
Table A6.6.13 – Employee Salary Payments by Non-Grocery Retailers: Pakistan
Non-Grocery Retailers by Size
Average Number of Employees per Retailer
Average Number of Salary Payments per Employee per
Month
Average Monthly Salary per Employee
(USD)
Annual Salary Payments per Retailer (USD)
Total Salary Payments Year (USD
‘000)
Micro 2 1 2,386 67,801 11,178,703Small 9 1 2,422 269,297 5,002,366Medium 52 1 2,402 1,493,191 11,569,724
Total Non-Grocery MSM Retailers 5 1 2,390 145,140 27,750,793
Source: Team estimates based on trade interviews, pulse surveys and literature review
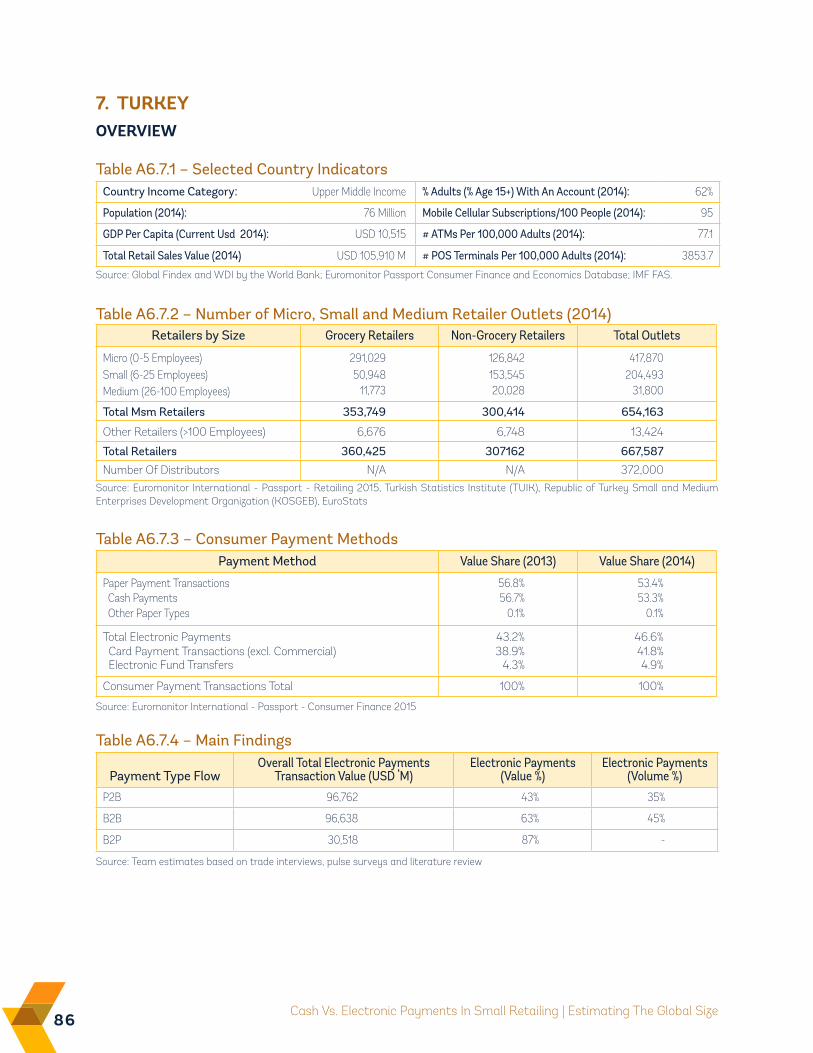
86 Cash Vs. Electronic Payments In Small Retailing | Estimating The Global Size
Table A6.7.2 – Number of Micro, Small and Medium Retailer Outlets (2014)
Source: Euromonitor International - Passport - Retailing 2015, Turkish Statistics Institute (TUIK), Republic of Turkey Small and Medium Enterprises Development Organization (KOSGEB), EuroStats
Payment Method Value Share (2013) Value Share (2014)
Paper Payment Transactions 56.8% 53.4% Cash Payments 56.7% 53.3% Other Paper Types 0.1% 0.1%
Total Electronic Payments 43.2% 46.6% Card Payment Transactions (excl. Commercial) 38.9% 41.8% Electronic Fund Transfers 4.3% 4.9%
Consumer Payment Transactions Total 100% 100%
Table A6.7.3 – Consumer Payment Methods
Source: Euromonitor International - Passport - Consumer Finance 2015
Payment Type FlowOverall Total Electronic Payments
Transaction Value (USD ‘M)Electronic Payments
(Value %)Electronic Payments
(Volume %)
P2B 96,762 43% 35%
B2B 96,638 63% 45%
B2P 30,518 87% -
Table A6.7.4 – Main Findings
Source: Team estimates based on trade interviews, pulse surveys and literature review
7. TURKEYOvERviEW
Country Income Category: Upper Middle Income % Adults (% Age 15+) With An Account (2014): 62%
Population (2014): 76 Million Mobile Cellular Subscriptions/100 People (2014): 95
GDP Per Capita (Current Usd 2014): USD 10,515 # ATMs Per 100,000 Adults (2014): 77.1
Total Retail Sales Value (2014) USD 105,910 M # POS Terminals Per 100,000 Adults (2014): 3853.7
Table A6.7.1 – Selected Country Indicators
Source: Global Findex and WDI by the World Bank; Euromonitor Passport Consumer Finance and Economics Database; IMF FAS.
Retailers by Size Grocery Retailers Non-Grocery Retailers Total Outlets
Micro (0-5 Employees) 291,029 126,842 417,870Small (6-25 Employees) 50,948 153,545 204,493Medium (26-100 Employees) 11,773 20,028 31,800
Total Msm Retailers 353,749 300,414 654,163
Other Retailers (>100 Employees) 6,676 6,748 13,424
Total Retailers 360,425 307162 667,587
Number Of Distributors N/A N/A 372,000
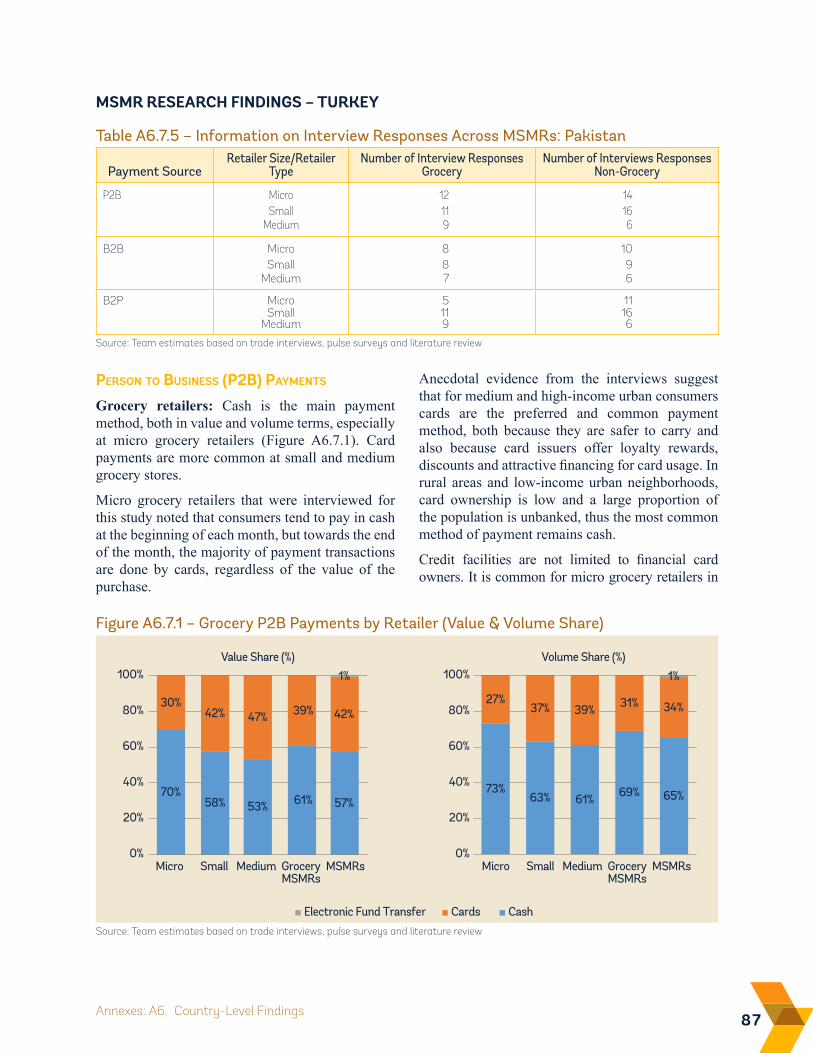
87Annexes: A6. Country-Level Findings
MSMR RESEARCH FiNDiNGS – TURKEY
Person to Business (P2B) PayMents
Grocery retailers: Cash is the main payment method, both in value and volume terms, especially at micro grocery retailers (Figure A6.7.1). Card payments are more common at small and medium grocery stores.
Micro grocery retailers that were interviewed for this study noted that consumers tend to pay in cash at the beginning of each month, but towards the end of the month, the majority of payment transactions are done by cards, regardless of the value of the purchase.
Figure A6.7.1 – Grocery P2B Payments by Retailer (Value & Volume Share)
Electronic Fund Transfer Cards Cash
0%
20%
40%
60%
80%
100%
Micro Small Medium GroceryMSMRs
MSMRsMicro Small Medium GroceryMSMRs
MSMRs
Value Share (%)
0%
20%
40%
60%
80%
100%Volume Share (%)
70%58% 53% 61% 57%
30%42% 47% 39% 42%
73%63% 61% 69% 65%
27%37% 39% 31% 34%
1% 1%
Anecdotal evidence from the interviews suggest that for medium and high-income urban consumers cards are the preferred and common payment method, both because they are safer to carry and also because card issuers offer loyalty rewards, discounts and attractive financing for card usage. In rural areas and low-income urban neighborhoods, card ownership is low and a large proportion of the population is unbanked, thus the most common method of payment remains cash.
Credit facilities are not limited to financial card owners. It is common for micro grocery retailers in
Source: Team estimates based on trade interviews, pulse surveys and literature review
Payment SourceRetailer Size/Retailer
TypeNumber of Interview Responses
GroceryNumber of Interviews Responses
Non-Grocery
P2B Micro 12 14Small 11 16
Medium 9 6
B2B Micro 8 10Small 8 9
Medium 7 6
B2P Micro 5 11Small 11 16
Medium 9 6
Table A6.7.5 – Information on Interview Responses Across MSMRs: Pakistan
Source: Team estimates based on trade interviews, pulse surveys and literature review
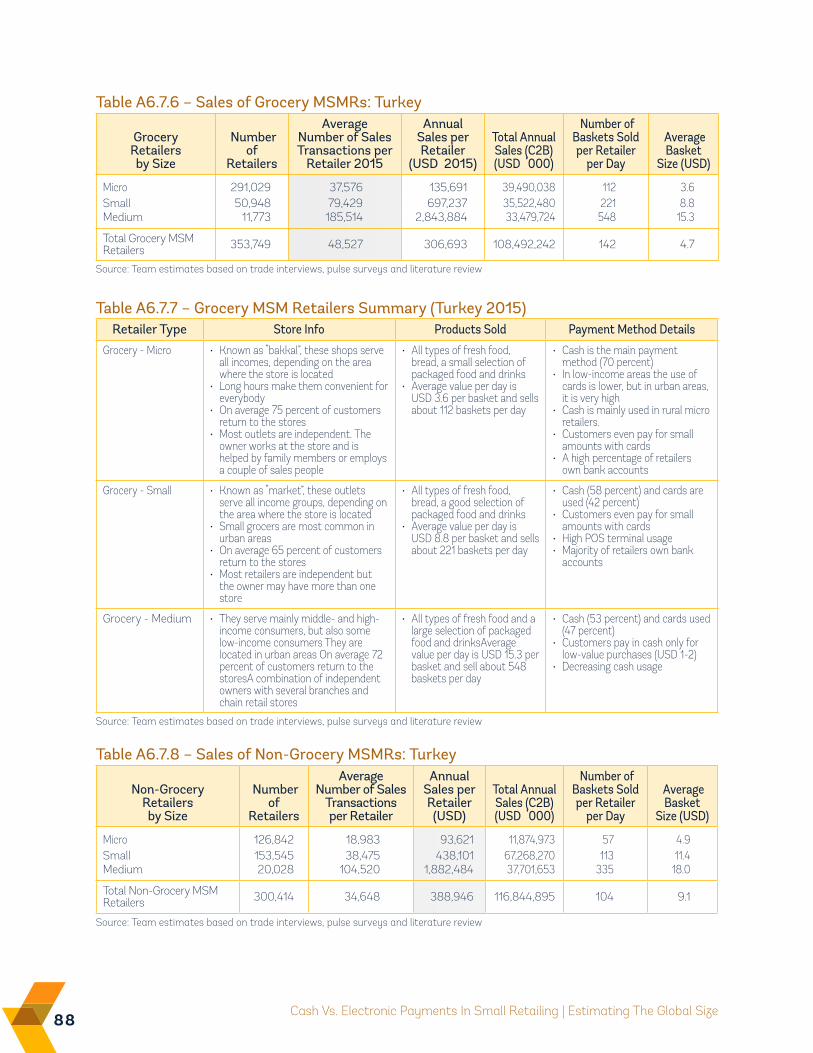
88 Cash Vs. Electronic Payments In Small Retailing | Estimating The Global Size
Table A6.7.6 – Sales of Grocery MSMRs: Turkey
Source: Team estimates based on trade interviews, pulse surveys and literature review
Retailer Type Store Info Products Sold Payment Method Details
Grocery - Micro • Known as “bakkal”, these shops serve all incomes, depending on the area where the store is located
• Long hours make them convenient for everybody
• On average 75 percent of customers return to the stores
• Most outlets are independent. The owner works at the store and is helped by family members or employs a couple of sales people
• All types of fresh food, bread, a small selection of packaged food and drinks
• Average value per day is USD 3.6 per basket and sells about 112 baskets per day
• Cash is the main payment method (70 percent)
• In low-income areas the use of cards is lower, but in urban areas, it is very high
• Cash is mainly used in rural micro retailers.
• Customers even pay for small amounts with cards
• A high percentage of retailers own bank accounts
Grocery - Small • Known as “market”, these outlets serve all income groups, depending on the area where the store is located
• Small grocers are most common in urban areas
• On average 65 percent of customers return to the stores
• Most retailers are independent but the owner may have more than one store
• All types of fresh food, bread, a good selection of packaged food and drinks
• Average value per day is USD 8.8 per basket and sells about 221 baskets per day
• Cash (58 percent) and cards are used (42 percent)
• Customers even pay for small amounts with cards
• High POS terminal usage• Majority of retailers own bank
accounts
Grocery - Medium • They serve mainly middle- and high-income consumers, but also some low-income consumers They are located in urban areas On average 72 percent of customers return to the storesA combination of independent owners with several branches and chain retail stores
• All types of fresh food and a large selection of packaged food and drinksAverage value per day is USD 15.3 per basket and sell about 548 baskets per day
• Cash (53 percent) and cards used (47 percent)
• Customers pay in cash only for low-value purchases (USD 1-2)
• Decreasing cash usage
Table A6.7.7 – Grocery MSM Retailers Summary (Turkey 2015)
Source: Team estimates based on trade interviews, pulse surveys and literature review
Non-Grocery Retailers by Size
Number of
Retailers
Average Number of Sales
Transactions per Retailer
Annual Sales per Retailer (USD)
Total Annual Sales (C2B) (USD ‘000)
Number of Baskets Sold per Retailer
per Day
Average Basket
Size (USD)
Micro 126,842 18,983 93,621 11,874,973 57 4.9Small 153,545 38,475 438,101 67,268,270 113 11.4Medium 20,028 104,520 1,882,484 37,701,653 335 18.0
Total Non-Grocery MSM Retailers 300,414 34,648 388,946 116,844,895 104 9.1
Table A6.7.8 – Sales of Non-Grocery MSMRs: Turkey
Source: Team estimates based on trade interviews, pulse surveys and literature review
Grocery Retailers by Size
Number of
Retailers
Average Number of Sales Transactions per
Retailer 2015
Annual Sales per Retailer
(USD 2015)
Total Annual Sales (C2B) (USD ‘000)
Number of Baskets Sold per Retailer
per Day
Average Basket
Size (USD)
Micro 291,029 37,576 135,691 39,490,038 112 3.6Small 50,948 79,429 697,237 35,522,480 221 8.8Medium 11,773 185,514 2,843,884 33,479,724 548 15.3
Total Grocery MSM Retailers 353,749 48,527 306,693 108,492,242 142 4.7
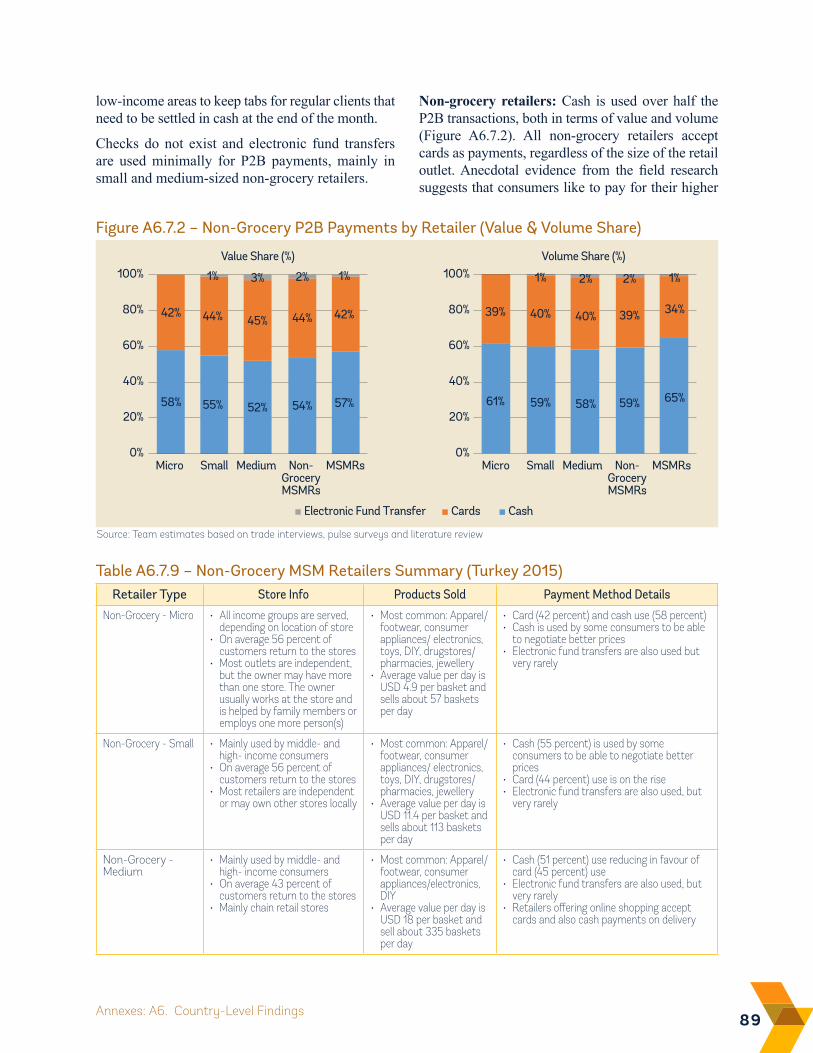
89Annexes: A6. Country-Level Findings
low-income areas to keep tabs for regular clients that need to be settled in cash at the end of the month.
Checks do not exist and electronic fund transfers are used minimally for P2B payments, mainly in small and medium-sized non-grocery retailers.
Figure A6.7.2 – Non-Grocery P2B Payments by Retailer (Value & Volume Share)
Electronic Fund Transfer Cards Cash
0%
20%
40%
60%
80%
100%
Micro Small Medium Non-GroceryMSMRs
MSMRsMicro Small Medium Non-GroceryMSMRs
MSMRs
Value Share (%)
0%
20%
40%
60%
80%
100%Volume Share (%)
58% 55% 52% 54% 57%
42% 44% 45% 44% 42%
61% 59% 58% 59% 65%
39% 40% 40% 39% 34%
1% 3% 2% 1% 1% 2% 2% 1%
Retailer Type Store Info Products Sold Payment Method Details
Non-Grocery - Micro • All income groups are served, depending on location of store
• On average 56 percent of customers return to the stores
• Most outlets are independent, but the owner may have more than one store. The owner usually works at the store and is helped by family members or employs one more person(s)
• Most common: Apparel/ footwear, consumer appliances/ electronics, toys, DIY, drugstores/pharmacies, jewellery
• Average value per day is USD 4.9 per basket and sells about 57 baskets per day
• Card (42 percent) and cash use (58 percent) • Cash is used by some consumers to be able
to negotiate better prices• Electronic fund transfers are also used but
very rarely
Non-Grocery - Small • Mainly used by middle- and high- income consumers
• On average 56 percent of customers return to the stores
• Most retailers are independent or may own other stores locally
• Most common: Apparel/ footwear, consumer appliances/ electronics, toys, DIY, drugstores/pharmacies, jewellery
• Average value per day is USD 11.4 per basket and sells about 113 baskets per day
• Cash (55 percent) is used by some consumers to be able to negotiate better prices
• Card (44 percent) use is on the rise• Electronic fund transfers are also used, but
very rarely
Non-Grocery - Medium
• Mainly used by middle- and high- income consumers
• On average 43 percent of customers return to the stores
• Mainly chain retail stores
• Most common: Apparel/ footwear, consumer appliances/electronics, DIY
• Average value per day is USD 18 per basket and sell about 335 baskets per day
• Cash (51 percent) use reducing in favour of card (45 percent) use
• Electronic fund transfers are also used, but very rarely
• Retailers offering online shopping accept cards and also cash payments on delivery
Table A6.7.9 – Non-Grocery MSM Retailers Summary (Turkey 2015)
Source: Team estimates based on trade interviews, pulse surveys and literature review
Non-grocery retailers: Cash is used over half the P2B transactions, both in terms of value and volume (Figure A6.7.2). All non-grocery retailers accept cards as payments, regardless of the size of the retail outlet. Anecdotal evidence from the field research suggests that consumers like to pay for their higher
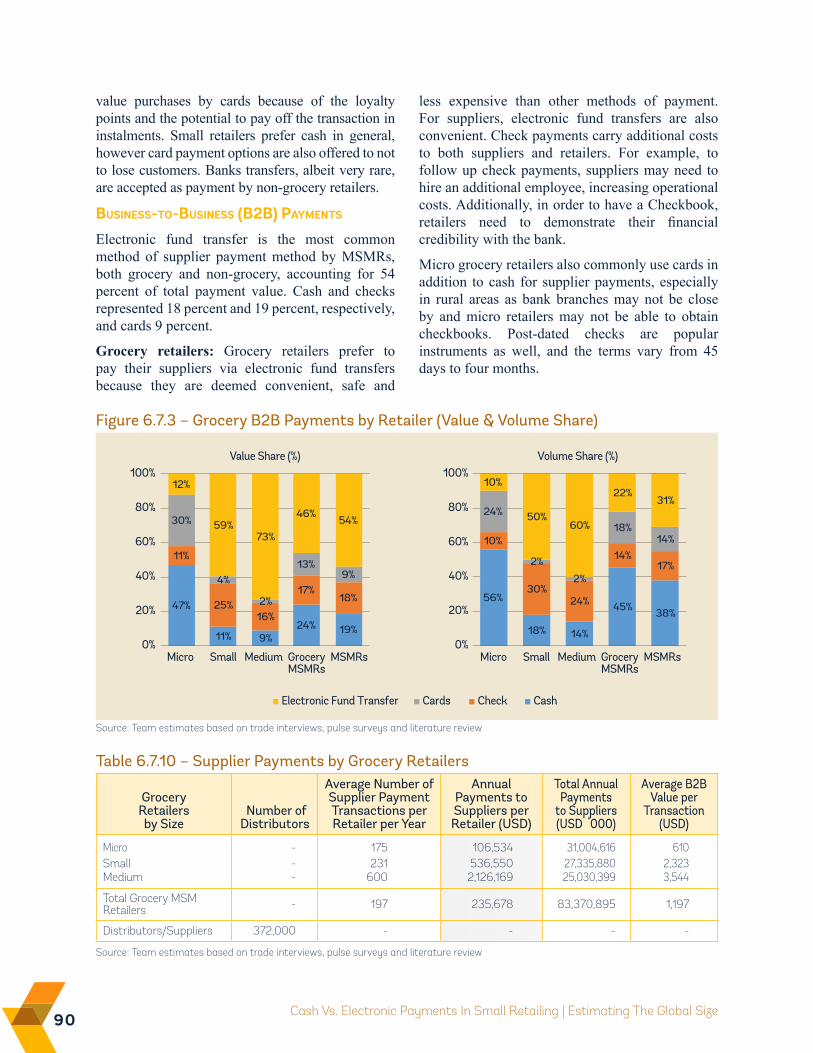
90 Cash Vs. Electronic Payments In Small Retailing | Estimating The Global Size
Grocery Retailers by Size
Number of Distributors
Average Number of Supplier Payment Transactions per Retailer per Year
Annual Payments to Suppliers per Retailer (USD)
Total Annual Payments
to Suppliers (USD ‘000)
Average B2B Value per
Transaction (USD)
Micro - 175 106,534 31,004,616 610Small - 231 536,550 27,335,880 2,323Medium - 600 2,126,169 25,030,399 3,544
Total Grocery MSM Retailers - 197 235,678 83,370,895 1,197
Distributors/Suppliers 372,000 - - - -
Table 6.7.10 – Supplier Payments by Grocery Retailers
Source: Team estimates based on trade interviews, pulse surveys and literature review
Figure 6.7.3 – Grocery B2B Payments by Retailer (Value & Volume Share)
CheckElectronic Fund Transfer Cards Cash
0%
20%
40%
60%
80%
100%
Micro Small Medium GroceryMSMRs
MSMRsMicro Small Medium GroceryMSMRs
MSMRs
Value Share (%)
0%
20%
40%
60%
80%
100%Volume Share (%)
47%
11% 9%24% 19%
11%
25%16%
17%18%
30%
4%
2%
13%9%
12%
59%73%
46%54%
56%
18% 14%
45% 38%
10%
30%24%
14%17%
24%
2%
2%
18%14%
10%
50%60%
22%31%
Source: Team estimates based on trade interviews, pulse surveys and literature review
value purchases by cards because of the loyalty points and the potential to pay off the transaction in instalments. Small retailers prefer cash in general, however card payment options are also offered to not to lose customers. Banks transfers, albeit very rare, are accepted as payment by non-grocery retailers.
Business-to-Business (B2B) PayMents
Electronic fund transfer is the most common method of supplier payment method by MSMRs, both grocery and non-grocery, accounting for 54 percent of total payment value. Cash and checks represented 18 percent and 19 percent, respectively, and cards 9 percent.
Grocery retailers: Grocery retailers prefer to pay their suppliers via electronic fund transfers because they are deemed convenient, safe and
less expensive than other methods of payment. For suppliers, electronic fund transfers are also convenient. Check payments carry additional costs to both suppliers and retailers. For example, to follow up check payments, suppliers may need to hire an additional employee, increasing operational costs. Additionally, in order to have a Checkbook, retailers need to demonstrate their financial credibility with the bank.
Micro grocery retailers also commonly use cards in addition to cash for supplier payments, especially in rural areas as bank branches may not be close by and micro retailers may not be able to obtain checkbooks. Post-dated checks are popular instruments as well, and the terms vary from 45 days to four months.
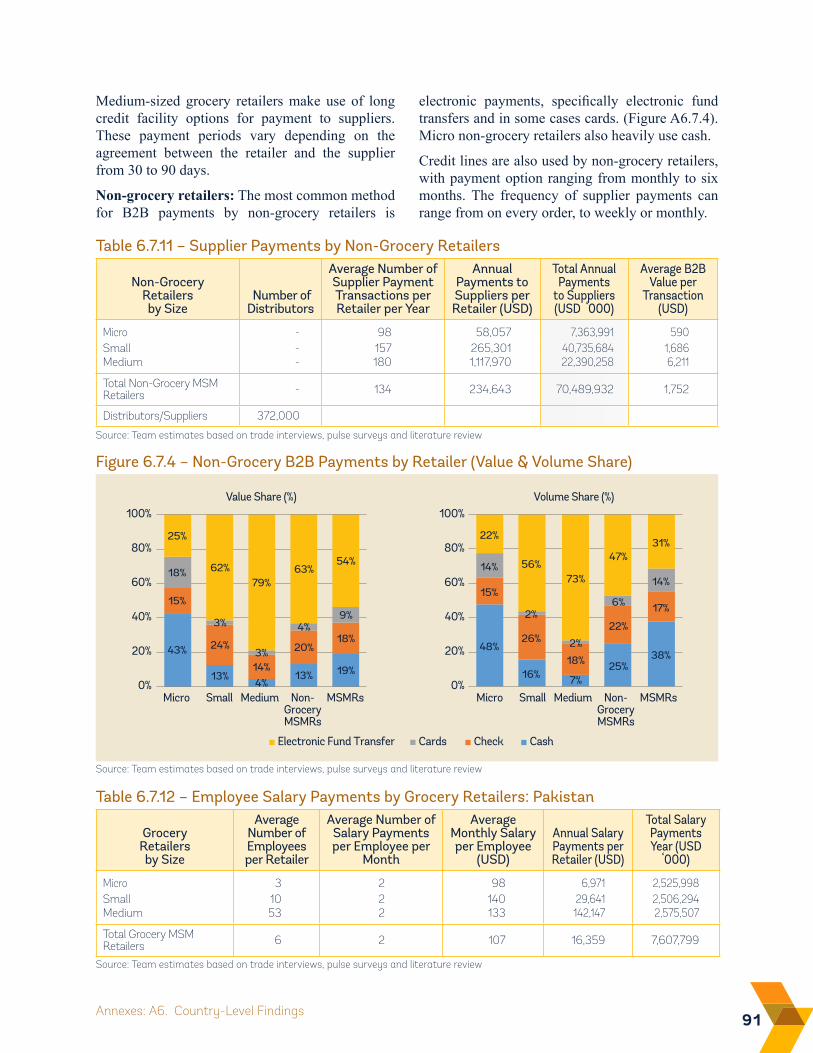
91Annexes: A6. Country-Level Findings
Table 6.7.11 – Supplier Payments by Non-Grocery Retailers
Non-Grocery Retailers by Size
Number of Distributors
Average Number of Supplier Payment Transactions per Retailer per Year
Annual Payments to Suppliers per Retailer (USD)
Total Annual Payments
to Suppliers (USD ‘000)
Average B2B Value per
Transaction (USD)
Micro - 98 58,057 7,363,991 590Small - 157 265,301 40,735,684 1,686Medium - 180 1,117,970 22,390,258 6,211
Total Non-Grocery MSM Retailers - 134 234,643 70,489,932 1,752
Distributors/Suppliers 372,000
Source: Team estimates based on trade interviews, pulse surveys and literature review
Figure 6.7.4 – Non-Grocery B2B Payments by Retailer (Value & Volume Share)
CheckElectronic Fund Transfer Cards Cash
0%
20%
40%
60%
80%
100%
Micro Small Medium Non-GroceryMSMRs
MSMRsMicro Small Medium Non-GroceryMSMRs
MSMRs
Value Share (%)
0%
20%
40%
60%
80%
100%Volume Share (%)
43%
13%4%
13% 19%
15%
24%
14%
20%18%
18%
3%
3%
4%9%
25%
62%79%
63%54%
48%
16% 7%25%
38%
15%
26%
18%
22%
17%
14%
2%
2%
6%
14%
22%
56%73%
47%31%
Source: Team estimates based on trade interviews, pulse surveys and literature review
Medium-sized grocery retailers make use of long credit facility options for payment to suppliers. These payment periods vary depending on the agreement between the retailer and the supplier from 30 to 90 days.
Non-grocery retailers: The most common method for B2B payments by non-grocery retailers is
electronic payments, specifically electronic fund transfers and in some cases cards. (Figure A6.7.4). Micro non-grocery retailers also heavily use cash.
Credit lines are also used by non-grocery retailers, with payment option ranging from monthly to six months. The frequency of supplier payments can range from on every order, to weekly or monthly.
Table 6.7.12 – Employee Salary Payments by Grocery Retailers: Pakistan
Grocery Retailers by Size
Average Number of Employees per Retailer
Average Number of Salary Payments per Employee per
Month
Average Monthly Salary per Employee
(USD)
Annual Salary Payments per Retailer (USD)
Total Salary Payments Year (USD
‘000)
Micro 3 2 98 6,971 2,525,998Small 10 2 140 29,641 2,506,294Medium 53 2 133 142,147 2,575,507
Total Grocery MSM Retailers 6 2 107 16,359 7,607,799
Source: Team estimates based on trade interviews, pulse surveys and literature review
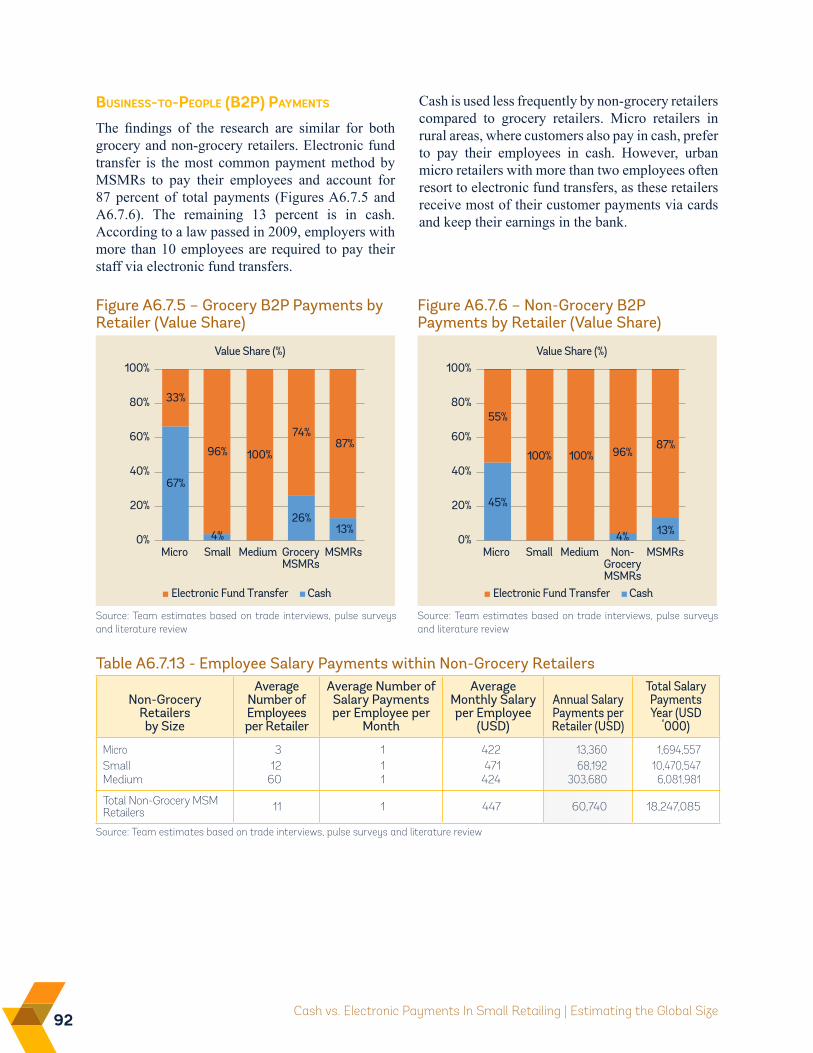
92 Cash vs. Electronic Payments In Small Retailing | Estimating the Global Size
Table A6.7.13 - Employee Salary Payments within Non-Grocery Retailers
Non-Grocery Retailers by Size
Average Number of Employees per Retailer
Average Number of Salary Payments per Employee per
Month
Average Monthly Salary per Employee
(USD)
Annual Salary Payments per Retailer (USD)
Total Salary Payments Year (USD
‘000)
Micro 3 1 422 13,360 1,694,557Small 12 1 471 68,192 10,470,547Medium 60 1 424 303,680 6,081,981
Total Non-Grocery MSM Retailers 11 1 447 60,740 18,247,085
Source: Team estimates based on trade interviews, pulse surveys and literature review
Figure A6.7.5 – Grocery B2P Payments by Retailer (Value Share)
Electronic Fund Transfer Cash
0%
20%
40%
60%
80%
100%
Micro Small Medium GroceryMSMRs
MSMRs
Value Share (%)
67%
4%26%
13%
33%
96% 100%
74%87%
Source: Team estimates based on trade interviews, pulse surveys and literature review
Figure A6.7.6 – Non-Grocery B2P Payments by Retailer (Value Share)
Source: Team estimates based on trade interviews, pulse surveys and literature review
Electronic Fund Transfer Cash
0%
20%
40%
60%
80%
100%
Micro Small Medium Non-GroceryMSMRs
MSMRs
Value Share (%)
45%
4% 13%
55%
100% 100% 96%87%
Business-to-PeoPle (B2P) PayMents
The findings of the research are similar for both grocery and non-grocery retailers. Electronic fund transfer is the most common payment method by MSMRs to pay their employees and account for 87 percent of total payments (Figures A6.7.5 and A6.7.6). The remaining 13 percent is in cash. According to a law passed in 2009, employers with more than 10 employees are required to pay their staff via electronic fund transfers.
Cash is used less frequently by non-grocery retailers compared to grocery retailers. Micro retailers in rural areas, where customers also pay in cash, prefer to pay their employees in cash. However, urban micro retailers with more than two employees often resort to electronic fund transfers, as these retailers receive most of their customer payments via cards and keep their earnings in the bank.
93References
Ayyagari, M., A. Demirgüç-Kunt, and V. Maksimovic (2011). “Small vs. Young Firms Across the World: Contribution to Employment, Job Creation, and Growth,” Policy Research Working Paper 5631. World Bank, Washington, DC.
Bank of Lithuania (2014). Payments Market Review 2014. Vilnius, Lithuania.
Bank of Lithuania (2016). Payments Market Review 2016. Vilnius, Lithuania.
Citigroup (2016). Releasing the Flow of Digital Money: Hitting the Tipping Point of Adoption. Citigroup Global Markets, Inc.
Collins, D., J. Morduch, S. Rutherford, and O. Ruthven (2009). Portfolios of the Poor: How the World’s Poor Live on $2 a Day. Princeton, N.J.: Princeton University Press.
CPMI and World Bank Group (2016). Payment Aspects of Financial Inclusion. BIS: Basel Switzerland and World Bank Group: Washington, D.C.
D’Arcy, P., D. Norman, and S. Shan (2012). “Costs and Margins in the Retail Supply Chain,” Reserve Bank of Australia Bulletin, June 2012.
Deloitte (2015). Global Powers of Retailing 2016: Navigating the New Digital Divide. Deloitte Touche Tohmatsu Limited, UK. Available at: www.deloitte.com
Productivity Commission (2014). “Relative Costs of Doing Business in Australia: Retail Trade,” Research Report, Canberra: Australia.
Schneider, F. (2012). “The Shadow Economy and Work in the Shadow: What Do We (Not) Know?”, Discussion Paper Series, No. 6423, IZA.
Schneider, F. (2013). “Size and Development of the Shadow Economy of 31 European and 5 other OECD Countries from 2003 to 2013: A Further Decline,” Mimeo, Johannes Kepler University, Department of Economics.
Visa (2016). Perspectives on Accelerating Global Payment Acceptance. Visa: www.visa.com.
World Bank (2015). “A Practical Guide for Measuring Retail Payment Costs (Draft for Consultation).” World Bank: Washington, D.C.
World Bank Group and World Economic Forum (2016). Innovative in Electronic Payments Adoption: The Case of Small Retailers. World Bank Group: Washington, DC, and World Economic Forum: New York, NY.

95Endnotes
1. Collins et al. (2009)
2. Ayyagari et al. (2011), and IFC Enterprise Finance Gap database (http://www.smefinanceforum.org/data-sites/ifc-enterprise-finance-gap), respectively.
3. Traditional retail refers to small and independent shopkeepers that operate on a standalone basis, covering a wide range of enterprises including mini-markets, kiosks, etc., and are most often family-run.
4. Transaction account: broadly defined as an account held with a bank or other authorized and/or regulated service provider (including a non-bank) which can be used to make and receive payments. Transaction accounts can be further differentiated into deposit transaction accounts and e-money accounts (CPMI and World Bank Group, 2016).
5. In the retail sector, “person” corresponds to “households,” “individuals,” or “consumers.” This paper uses consumer-to-business, C2B, interchangeably with person-to-business, P2B as well as business-to-consumer, B2C, interchangeably with business-to-person, B2P. B2P in the context of this study is the wage/salary payments by businesses to their employees.
6. The most recent cross-country measure of the informal sector (not restricted to retail) is by Schneider (2012) based on data from 2008-2009. All other data used in this study are from 2014-15. Schneider (2013) has more recent information (for 2011-2013), however only for 31 European countries.
7. The Euromonitor Passport Databases are briefly explained in Annex 2.
8. Annex 4.1 provides detailed information about the selection process by cluster analysis.
9. Please note that these interviews are not based on representative samples. The discussion guides are included in Annex 5.
10. Please note that the volume of B2P payments are not estimated. These depend on the number of employees by MSMRs and the number of times they are paid each month or year.
11. See http://www.eiu.com for details. The countries included are mainly high income OECD economies and upper middle income economies.
12. This implies that the total consumer payments amount to USD 49 trillion. Note that this is broader than retail payments by consumers for grocery and non-grocery purchases made
96 Cash Vs. Electronic Payments In Small Retailing | Estimating The Global Size
at the micro, small and medium retailers, and hence is much larger than the estimate of USD 18.8 trillion of P2B payments at MSMRs for grocery and non-grocery products in this study.
13. http://www.emarketer.com/Article/Retail-Sales-Worldwide-Will-Top-22-Trillion-This-Year/1011765
14. Based on Euromonitor International estimates. For other examples, see D’Arcy et al. (2012), Productivity Commission (2014)
15. Some variables considered are not selected among the five because (i) they did not have a sufficiently large number of observations; (ii) they were outdated, i.e. their most recent value was not from the past 3-4 years; and/or (iii) the correlation between the unselected variable and the chosen ones were too high (larger than 0.6 in magnitude), i.e. the unselected variable would not statistically add much to the information contained within the existing set of chosen variables. Whenever data were available, we opted for indicators that track the state in our targeted segments, after ensuring that the underlying correlations between the selected and unselected variables are meaningful statistically. For example, “urban population” was used instead of “total population” and “adults with formal accounts, poorest 40%” was selected instead of the headline Global Findex indicator.
16. 19,503 different pairwise combinations for 61 dependent variables requires estimating 1.2 million models. These variables are then to be predicted for 161 countries, i.e. a total of 191.5 million predictions.
17. This way, there are 14,093 combinations, rendering 0.86 million models to be estimated and around 138.4 million predictions to be made.
18. MAPEm=∑i|yi-ýi|/yi, where is the i country‘s predicted value using all observations, except the ith.
19. Inverse MAPE (=1/MAPE) are used as weights because the larger the MAPE is for one model, the larger its prediction error is and therefore a lower weight should be assigned to that given model.
20. Lithuania introduced Euro as legal tender in January 2015, a few months prior to the implementation of this study. This study is based on data before and after the introduction of the Euro. That, in addition to the possible effects of the introduction of Euro on payment behavior of consumers and retailers, may have influenced the results. Bank of Lithuania (2016) notes that the likely effect has been an increase in electronic payments, notably card payments, as consumers deposited litas into their accounts in advance of the change and banknotes and coins in circulation reduced by half prior to the change.
21. Bank of Lithuania (2014) estimates that cash transactions accounted for 81 percent of domestic retail payments volume in 2013. At the same time, Bank of Lithuania (2016) notes that due to the introduction of the Euro as legal tender in January 2015, there has been an increase in the use of card payments as opposed to cash, and cash in circulation decreased to half.