Embed Size (px)
Citation preview
TSX: IMG NYSE: IAG
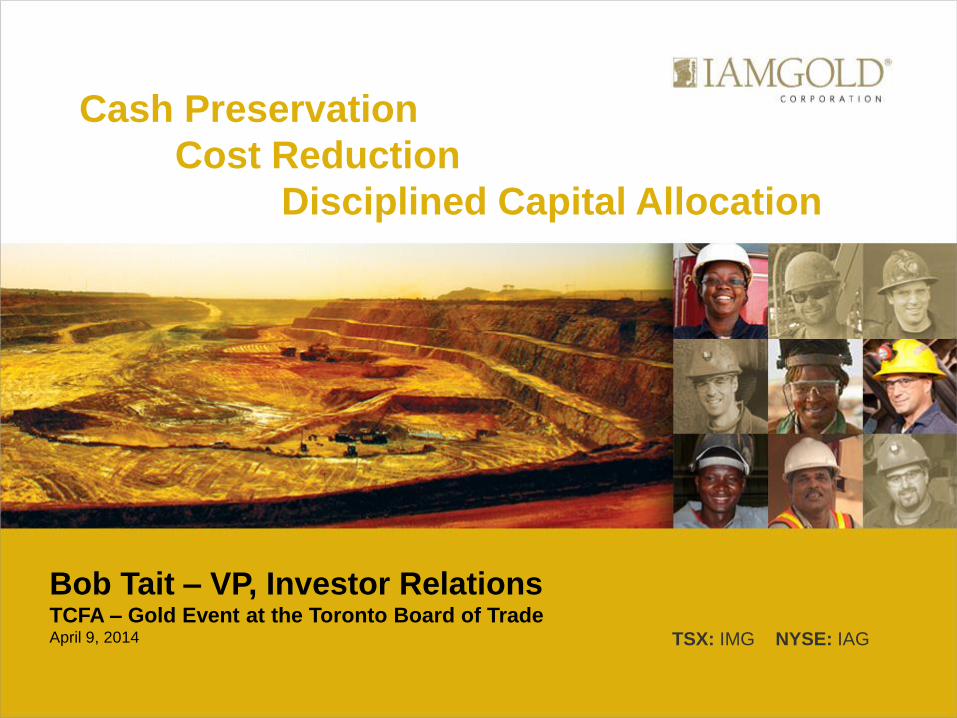
Bob Tait – VP, Investor Relations TCFA – Gold Event at the Toronto Board of Trade April 9, 2014
Cash Preservation
Cost Reduction
Disciplined Capital Allocation
Cautionary Statement on Forward-Looking Information
All information included in this presentation, including any information as to the Company’s future financial or operating performance, and other statements that express management’s
expectations or estimates of future performance, other than statements of historical fact, constitute forward looking information or forward-looking statements and are based on
expectations, estimates and projections as of the date of this presentation. Forward-looking statements contained in this presentation include, without limitation, statements with respect to:
the Company’s guidance for production, cash costs, all-in sustaining costs, depreciation expense, effective tax rate, niobium production and operating margin, capital expenditures,
operations outlook, cost management initiatives, development and expansion projects, exploration, the future price of gold, the estimation of mineral reserves and mineral resources, the
realization of mineral reserve and mineral resource estimates, the timing and amount of estimated future production, costs of production, permitting timelines, currency fluctuations,
requirements for additional capital, government regulation of mining operations, environmental risks, unanticipated reclamation expenses, title disputes or claims and limitations on
insurance coverage. Forward-looking statements are provided for the purpose of providing information about management’s current expectations and plans relating to the future.
Forward-looking statements are generally identifiable by, but are not limited to the, use of the words “may”, “will”, “should”, “continue”, “expect”, “anticipate”, “estimate”, “believe”, “intend”,
“plan”, “suggest”, “guidance”, “outlook”, “potential”, “prospects”, “seek”, “targets”, “strategy” or “project” or the negative of these words or other variations on these words or comparable
terminology. Forward-looking statements are necessarily based upon a number of estimates and assumptions that, while considered reasonable by management, are inherently subject to
significant business, economic and competitive uncertainties and contingencies. The Company cautions the reader that reliance on such forward-looking statements involve risks,
uncertainties and other factors that may cause the actual financial results, performance or achievements of IAMGOLD to be materially different from the Company’s estimated future
results, performance or achievements expressed or implied by those forward-looking statements, and the forward-looking statements are not guarantees of future performance. These
risks, uncertainties and other factors include, but are not limited to, changes in the global prices for gold, niobium, copper, silver or certain other commodities (such as diesel, aluminum
and electricity); changes in U.S. dollar and other currency exchange rates, interest rates or gold lease rates; risks arising from holding derivative instruments; the level of liquidity and
capital resources; access to capital markets, and financing; mining tax regimes; ability to successfully integrate acquired assets; legislative, political or economic developments in the
jurisdictions in which the Company carries on business; operating or technical difficulties in connection with mining or development activities; laws and regulations governing the protection
of the environment; employee relations; availability and increasing costs associated with mining inputs and labour; the speculative nature of exploration and development, including the
risks of diminishing quantities or grades of reserves; adverse changes in the Company’s credit rating; contests over title to properties, particularly title to undeveloped properties; and the
risks involved in the exploration, development and mining business. With respect to development projects, IAMGOLD’s ability to sustain or increase its present levels of gold production is
dependent in part on the success of its projects. Risks and unknowns inherent in all projects include the inaccuracy of estimated reserves and resources, metallurgical recoveries, capital
and operating costs of such projects, and the future prices for the relevant minerals. Development projects have no operating history upon which to base estimates of future cash flows.
The capital expenditures and time required to develop new mines or other projects are considerable, and changes in costs or construction schedules can affect project economics. Actual
costs and economic returns may differ materially from IAMGOLD’s estimates or IAMGOLD could fail to obtain the governmental approvals necessary for the operation of a project; in either
case, the project may not proceed, either on its original timing or at all.
For a more comprehensive discussion of the risks faced by the Company, and which may cause the actual financial results, performance or achievements of IAMGOLD to be materially
different from the company’s estimated future results, performance or achievements expressed or implied by forward-looking information or forward-looking statements, please refer to the
Company’s latest Annual Information Form, filed with Canadian securities regulatory authorities at www.sedar.com, and filed under Form 40-F with the United States Securities Exchange
Commission at www.sec.gov/edgar.html. The risks described in the Annual Information Form (filed and viewable on www.sedar.com and www.sec.gov/edgar.html, and available upon
request from the Company) are hereby incorporated by reference into this presentation.
The Company disclaims any intention or obligation to update or revise any forward-looking statements whether as a result of new information, future events or otherwise except as
required by applicable law.
2
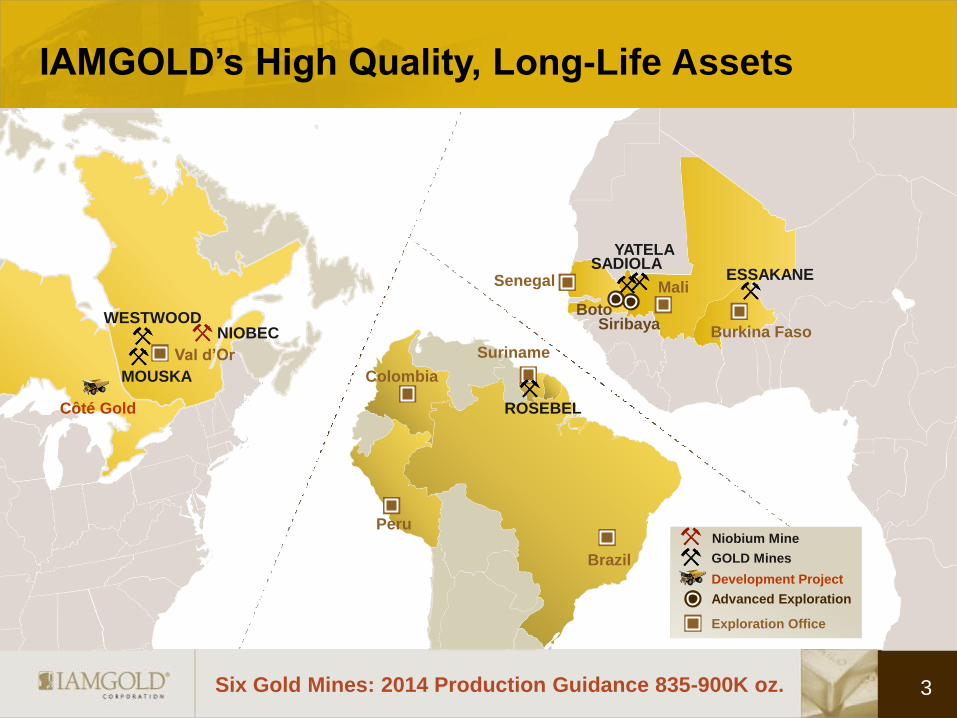
YATELA SADIOLA
Boto Siribaya
IAMGOLD’s High Quality, Long-Life Assets
3 Six Gold Mines: 2014 Production Guidance 835-900K oz.
GOLD Mines
Development Project
Advanced Exploration
Exploration Office
ESSAKANE Senegal
Burkina Faso
Mali
WESTWOOD
MOUSKA
NIOBEC
Val d’Or
Côté Gold ROSEBEL
Brazil
Suriname
Colombia
Peru Niobium Mine
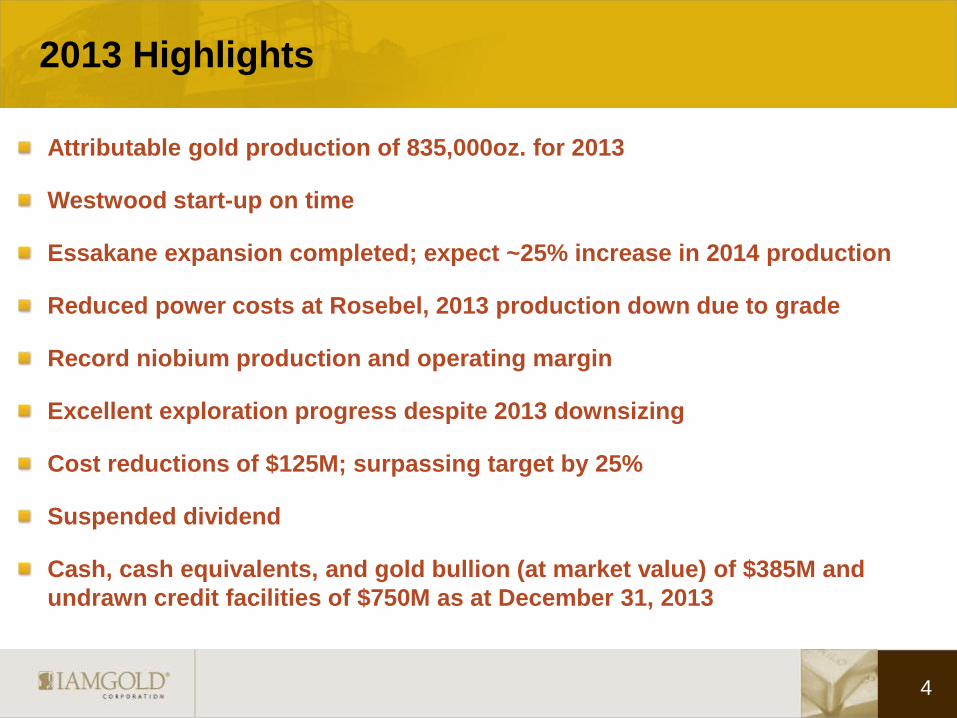
Attributable gold production of 835,000oz. for 2013
Westwood start-up on time
Essakane expansion completed; expect ~25% increase in 2014 production
Reduced power costs at Rosebel, 2013 production down due to grade
Record niobium production and operating margin
Excellent exploration progress despite 2013 downsizing
Cost reductions of $125M; surpassing target by 25%
Suspended dividend
Cash, cash equivalents, and gold bullion (at market value) of $385M and
undrawn credit facilities of $750M as at December 31, 2013
4
2013 Highlights
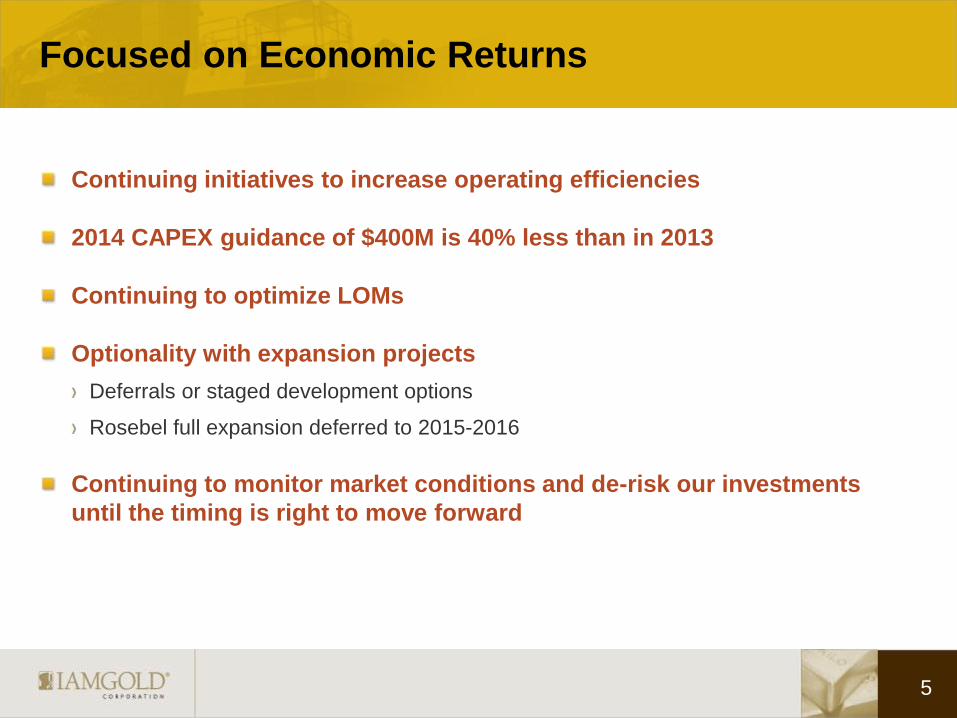
Continuing initiatives to increase operating efficiencies
2014 CAPEX guidance of $400M is 40% less than in 2013
Continuing to optimize LOMs
Optionality with expansion projects
Deferrals or staged development options
Rosebel full expansion deferred to 2015-2016
Continuing to monitor market conditions and de-risk our investments
until the timing is right to move forward
5
Focused on Economic Returns
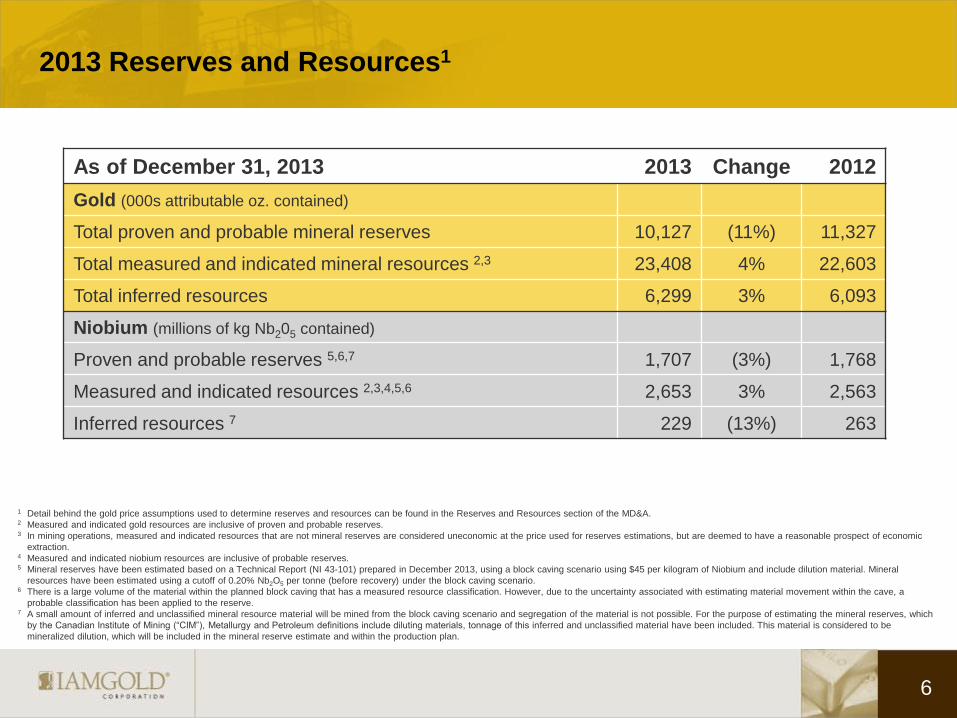
2013 Reserves and Resources1
As of December 31, 2013 2013 Change 2012
Gold (000s attributable oz. contained)
Total proven and probable mineral reserves 10,127 (11%) 11,327
Total measured and indicated mineral resources 2,3 23,408 4% 22,603
Total inferred resources 6,299 3% 6,093
Niobium (millions of kg Nb205 contained)
Proven and probable reserves 5,6,7 1,707 (3%) 1,768
Measured and indicated resources 2,3,4,5,6 2,653 3% 2,563
Inferred resources 7 229 (13%) 263
6
1 Detail behind the gold price assumptions used to determine reserves and resources can be found in the Reserves and Resources section of the MD&A.
2 Measured and indicated gold resources are inclusive of proven and probable reserves. 3 In mining operations, measured and indicated resources that are not mineral reserves are considered uneconomic at the price used for reserves estimations, but are deemed to have a reasonable prospect of economic
extraction. 4 Measured and indicated niobium resources are inclusive of probable reserves. 5 Mineral reserves have been estimated based on a Technical Report (NI 43-101) prepared in December 2013, using a block caving scenario using $45 per kilogram of Niobium and include dilution material. Mineral
resources have been estimated using a cutoff of 0.20% Nb2O5 per tonne (before recovery) under the block caving scenario. 6 There is a large volume of the material within the planned block caving that has a measured resource classification. However, due to the uncertainty associated with estimating material movement within the cave, a
probable classification has been applied to the reserve. 7 A small amount of inferred and unclassified mineral resource material will be mined from the block caving scenario and segregation of the material is not possible. For the purpose of estimating the mineral reserves, which
by the Canadian Institute of Mining (“CIM”), Metallurgy and Petroleum definitions include diluting materials, tonnage of this inferred and unclassified material have been included. This material is considered to be
mineralized dilution, which will be included in the mineral reserve estimate and within the production plan.
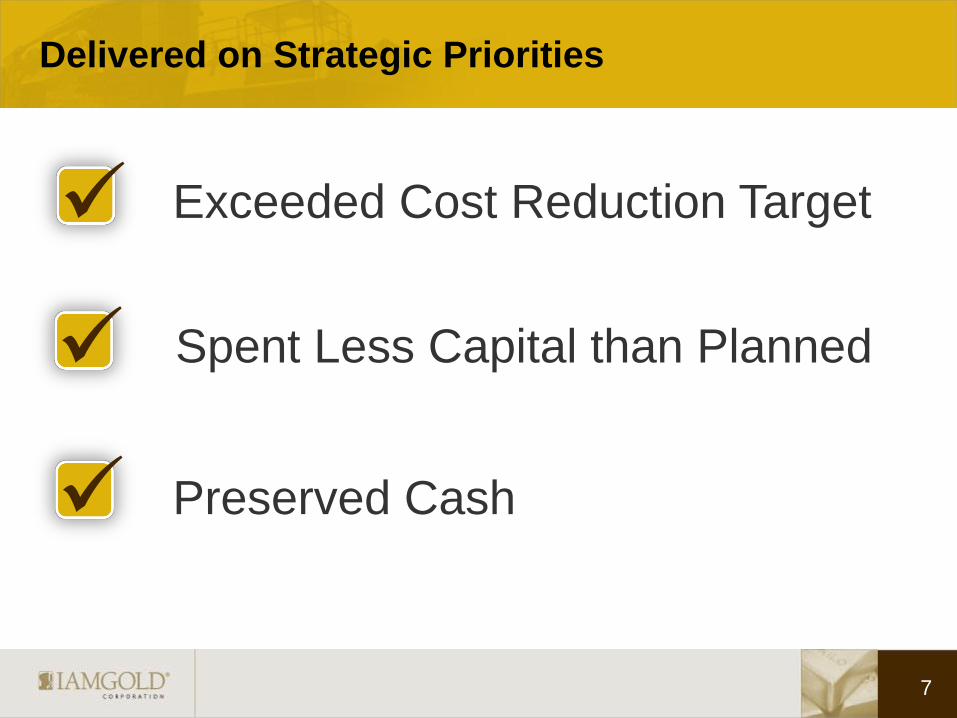
Delivered on Strategic Priorities
Exceeded Cost Reduction Target
Preserved Cash
Spent Less Capital than Planned
7
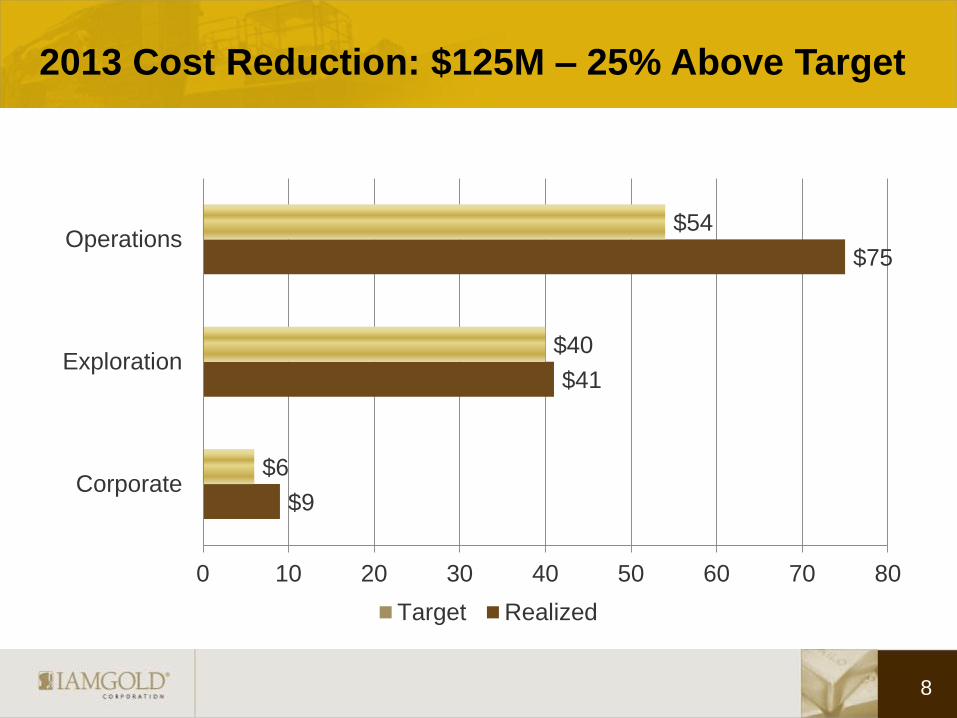
2013 Cost Reduction: $125M – 25% Above Target
8
$9
$41
$75
$6
$40
$54
0 10 20 30 40 50 60 70 80
Corporate
Exploration
Operations
Target Realized
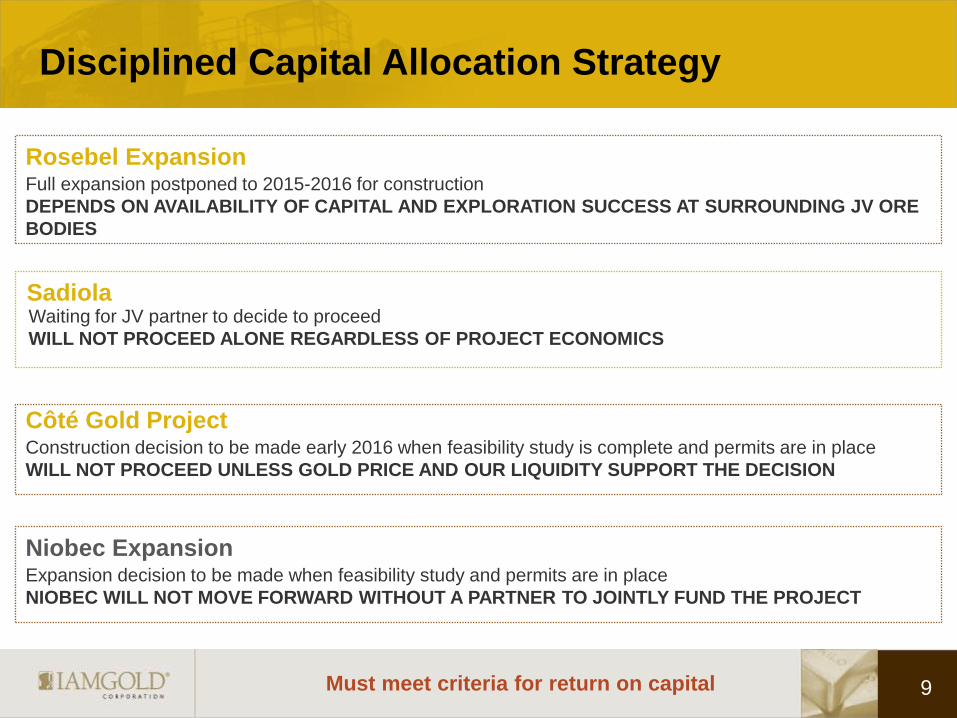
Disciplined Capital Allocation Strategy
9
Construction decision to be made early 2016 when feasibility study is complete and permits are in place
WILL NOT PROCEED UNLESS GOLD PRICE AND OUR LIQUIDITY SUPPORT THE DECISION
Côté Gold Project
Must meet criteria for return on capital
Waiting for JV partner to decide to proceed
WILL NOT PROCEED ALONE REGARDLESS OF PROJECT ECONOMICS
Sadiola
Full expansion postponed to 2015-2016 for construction
DEPENDS ON AVAILABILITY OF CAPITAL AND EXPLORATION SUCCESS AT SURROUNDING JV ORE
BODIES
Rosebel Expansion
Expansion decision to be made when feasibility study and permits are in place
NIOBEC WILL NOT MOVE FORWARD WITHOUT A PARTNER TO JOINTLY FUND THE PROJECT
Niobec Expansion
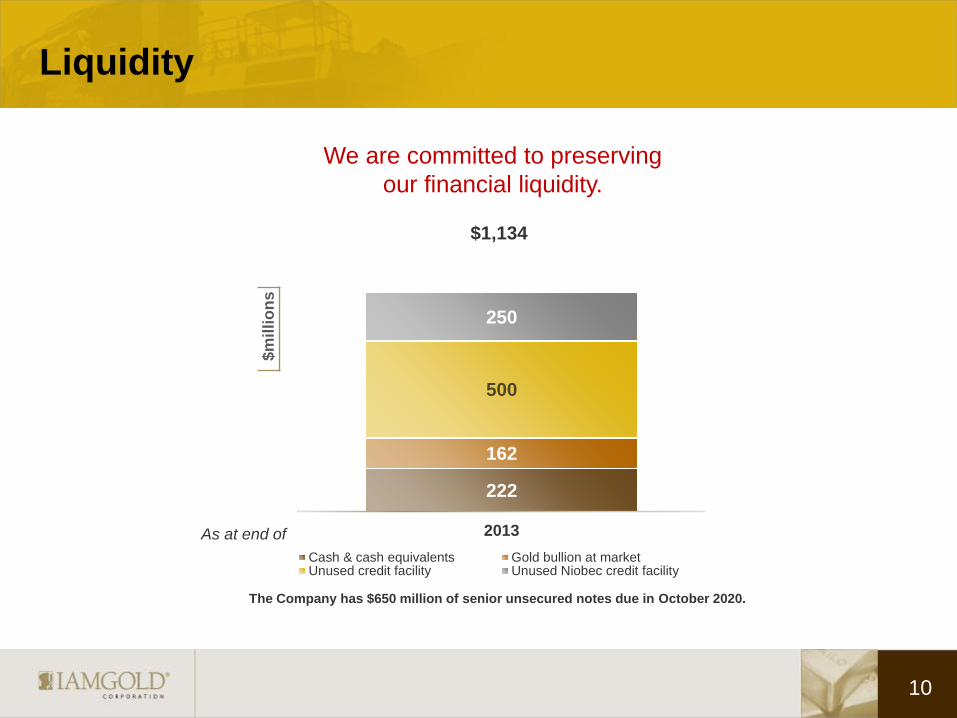
Liquidity
$m
illi
on
s
As at end of
222
162
500
250
2013
Cash & cash equivalents Gold bullion at marketUnused credit facility Unused Niobec credit facility
10
The Company has $650 million of senior unsecured notes due in October 2020.
We are committed to preserving
our financial liquidity.
$1,134
Operations Review
11
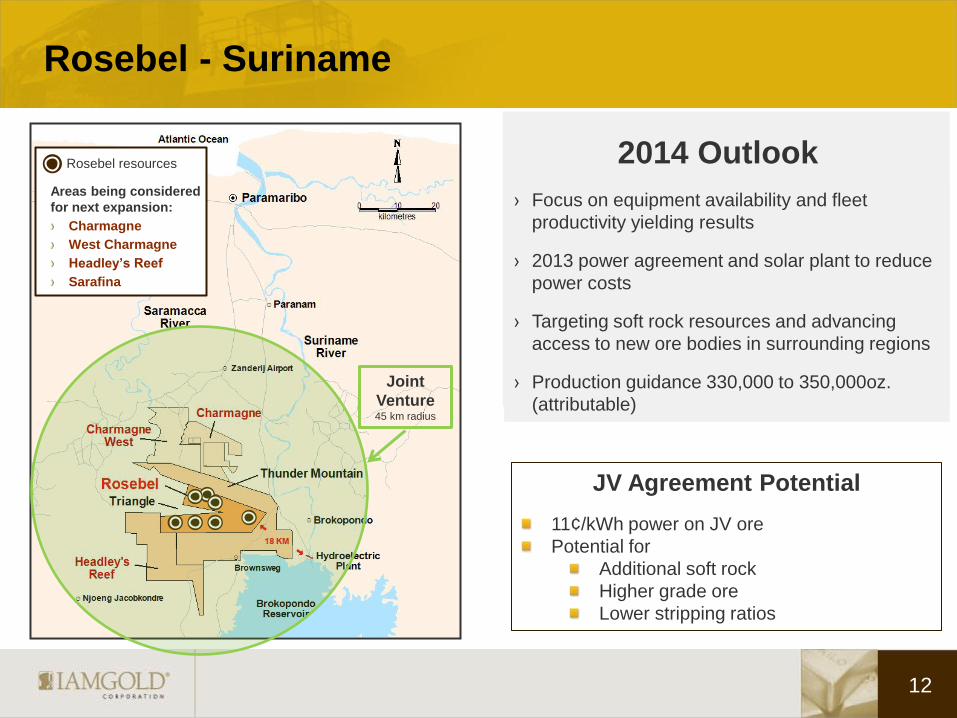
Rosebel - Suriname
12
2014 Outlook
› Focus on equipment availability and fleet
productivity yielding results
› 2013 power agreement and solar plant to reduce
power costs
› Targeting soft rock resources and advancing
access to new ore bodies in surrounding regions
› Production guidance 330,000 to 350,000oz.
(attributable)
12
Rosebel resources
Areas being considered
for next expansion:
Charmagne
West Charmagne
Headley’s Reef
Sarafina
Joint
Venture 45 km radius
JV Agreement Potential
11¢/kWh power on JV ore
Potential for
Additional soft rock
Higher grade ore
Lower stripping ratios
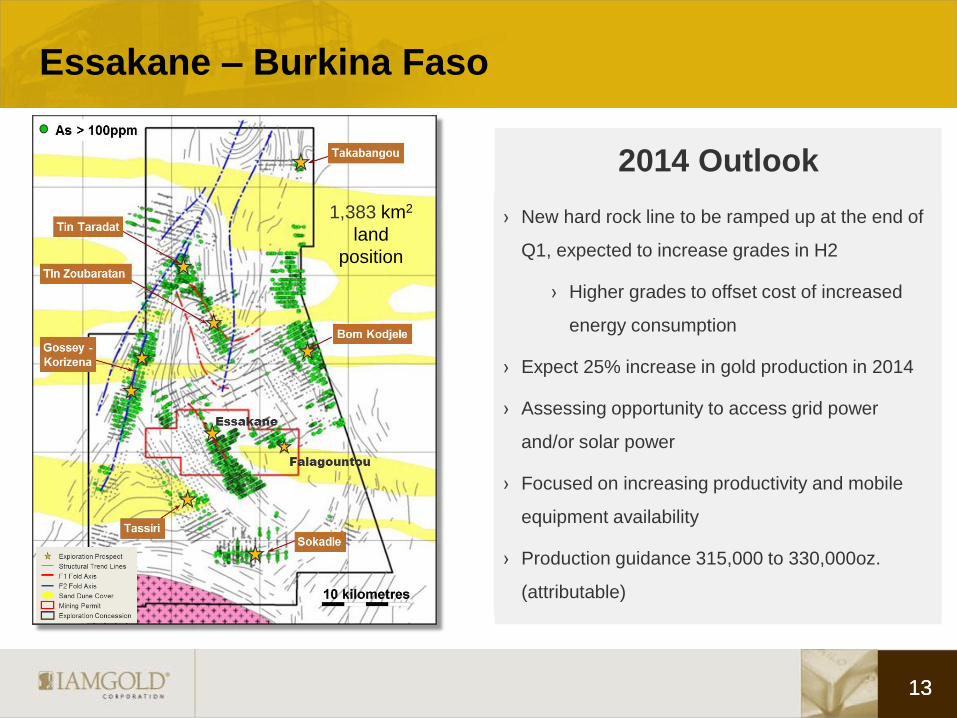
Essakane – Burkina Faso
13
› New hard rock line to be ramped up at the end of
Q1, expected to increase grades in H2
› Higher grades to offset cost of increased
energy consumption
› Expect 25% increase in gold production in 2014
› Assessing opportunity to access grid power
and/or solar power
› Focused on increasing productivity and mobile
equipment availability
› Production guidance 315,000 to 330,000oz.
(attributable)
2014 Outlook
13
1,383 km2
land
position
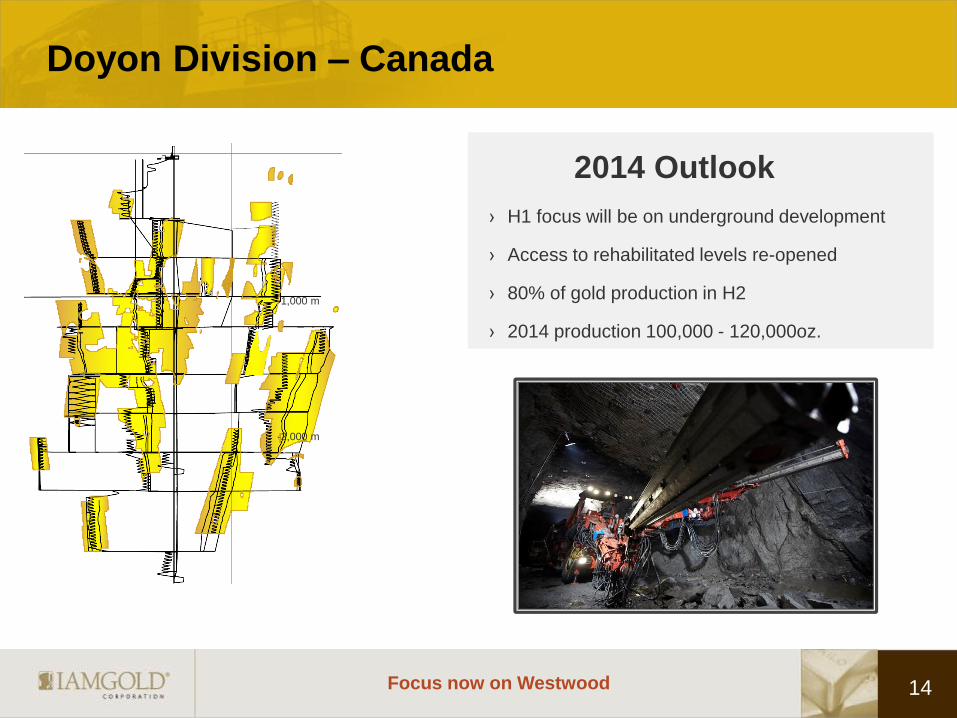
› H1 focus will be on underground development
› Access to rehabilitated levels re-opened
› 80% of gold production in H2
› 2014 production 100,000 - 120,000oz.
Doyon Division – Canada
2014 Outlook
14
-1,000 m
-2,000 m
Focus now on Westwood
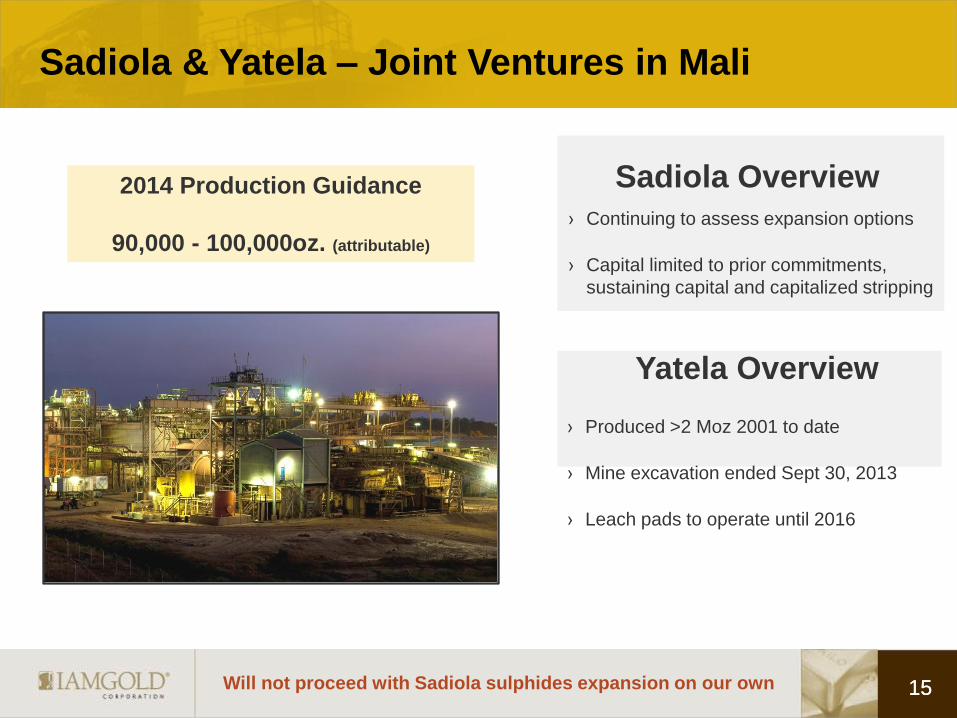
Sadiola & Yatela – Joint Ventures in Mali
15 15
Outlook
2014 Production Guidance
90,000 - 100,000oz. (attributable)
Will not proceed with Sadiola sulphides expansion on our own
› Produced >2 Moz 2001 to date
› Mine excavation ended Sept 30, 2013
› Leach pads to operate until 2016
Yatela Overview
Sadiola Overview
› Continuing to assess expansion options
› Capital limited to prior commitments,
sustaining capital and capitalized stripping
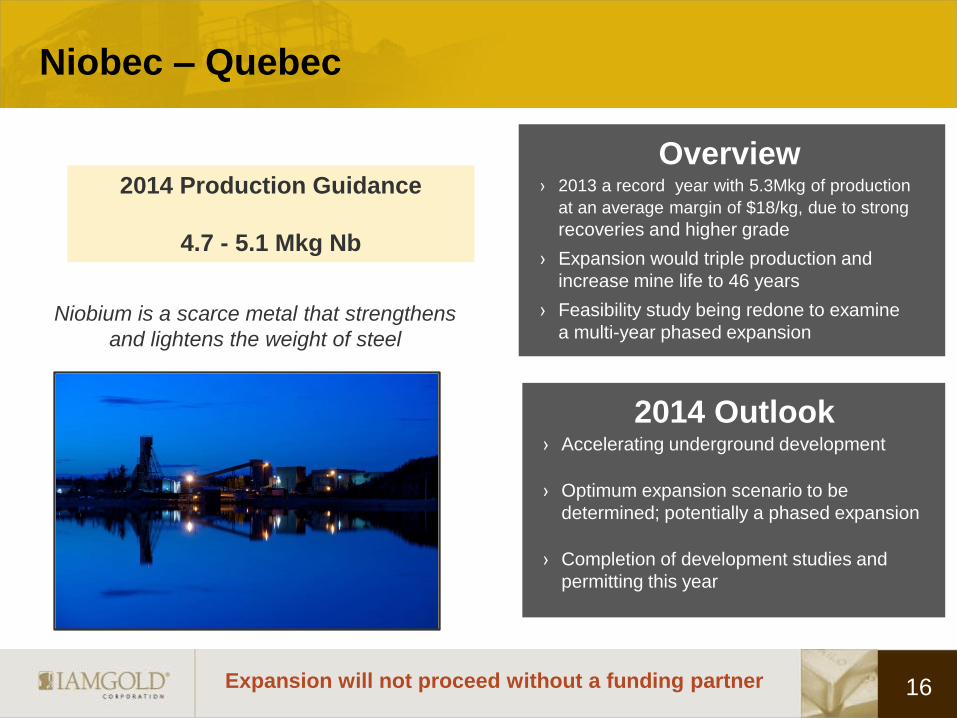
Niobec – Quebec
Overview
› 2013 a record year with 5.3Mkg of production
at an average margin of $18/kg, due to strong
recoveries and higher grade
› Expansion would triple production and
increase mine life to 46 years
› Feasibility study being redone to examine
a multi-year phased expansion
16
2014 Production Guidance
4.7 - 5.1 Mkg Nb
Niobium is a scarce metal that strengthens
and lightens the weight of steel
Expansion will not proceed without a funding partner
2014 Outlook
› Accelerating underground development
› Optimum expansion scenario to be
determined; potentially a phased expansion
› Completion of development studies and
permitting this year
17
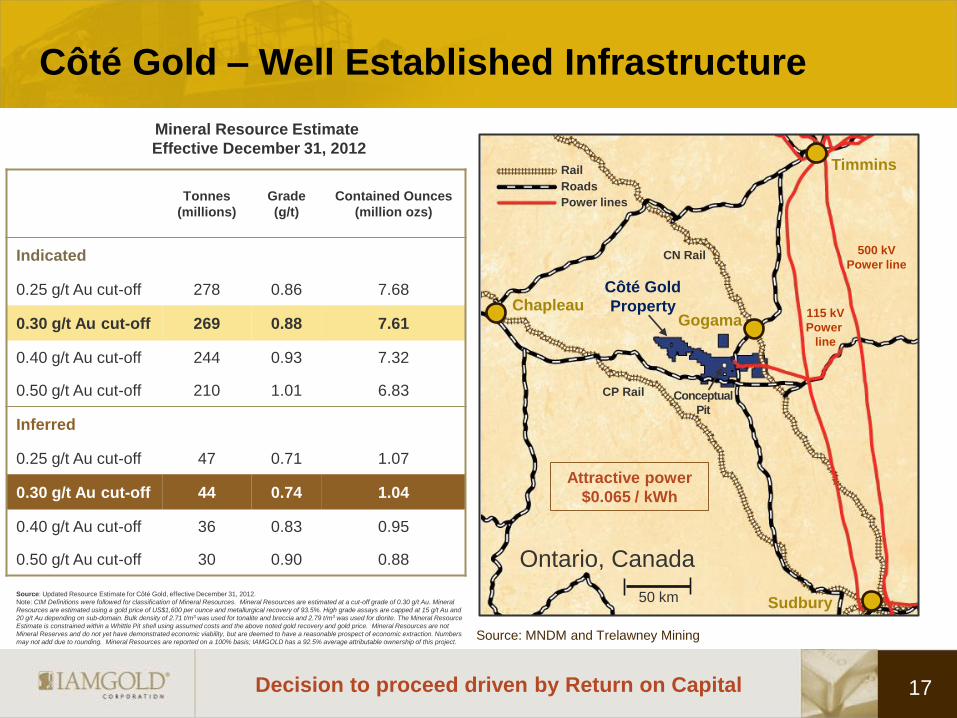
Côté Gold – Well Established Infrastructure
Source: MNDM and Trelawney Mining
Tonnes
(millions)
Grade
(g/t)
Contained Ounces
(million ozs)
Indicated
0.25 g/t Au cut-off 278 0.86 7.68
0.30 g/t Au cut-off 269 0.88 7.61
0.40 g/t Au cut-off 244 0.93 7.32
0.50 g/t Au cut-off 210 1.01 6.83
Inferred
0.25 g/t Au cut-off 47 0.71 1.07
0.30 g/t Au cut-off 44 0.74 1.04
0.40 g/t Au cut-off 36 0.83 0.95
0.50 g/t Au cut-off 30 0.90 0.88
Mineral Resource Estimate
Effective December 31, 2012
Decision to proceed driven by Return on Capital
144
101 CN Rail
CP Rail
Chapleau
Sudbury
Timmins
Côté Gold
Property
500 kV
Power line
115 kV
Power
line
Gogama
Conceptual
Pit
Rail
Roads
Power lines
50 km
Attractive power
$0.065 / kWh
Source: Updated Resource Estimate for Côté Gold, effective December 31, 2012.
Note: CIM Definitions were followed for classification of Mineral Resources. Mineral Resources are estimated at a cut-off grade of 0.30 g/t Au. Mineral
Resources are estimated using a gold price of US$1,600 per ounce and metallurgical recovery of 93.5%. High grade assays are capped at 15 g/t Au and
20 g/t Au depending on sub-domain. Bulk density of 2.71 t/m3 was used for tonalite and breccia and 2.79 t/m3 was used for diorite. The Mineral Resource
Estimate is constrained within a Whittle Pit shell using assumed costs and the above noted gold recovery and gold price. Mineral Resources are not
Mineral Reserves and do not yet have demonstrated economic viability, but are deemed to have a reasonable prospect of economic extraction. Numbers
may not add due to rounding. Mineral Resources are reported on a 100% basis; IAMGOLD has a 92.5% average attributable ownership of this project.
Ontario, Canada
Exploration Review
18
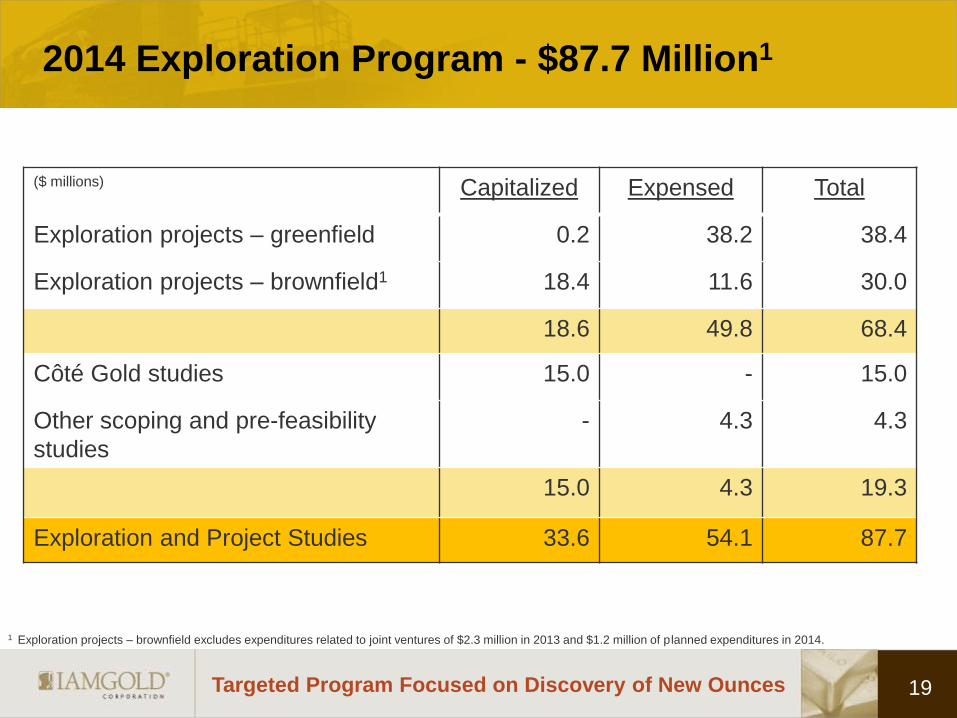
Targeted Program Focused on Discovery of New Ounces
2014 Exploration Program - $87.7 Million1
1 Exploration projects – brownfield excludes expenditures related to joint ventures of $2.3 million in 2013 and $1.2 million of planned expenditures in 2014.
($ millions) Capitalized Expensed Total
Exploration projects – greenfield 0.2 38.2 38.4
Exploration projects – brownfield1 18.4 11.6 30.0
18.6 49.8 68.4
Côté Gold studies 15.0 - 15.0
Other scoping and pre-feasibility
studies
- 4.3 4.3
15.0 4.3 19.3
Exploration and Project Studies 33.6 54.1 87.7
19
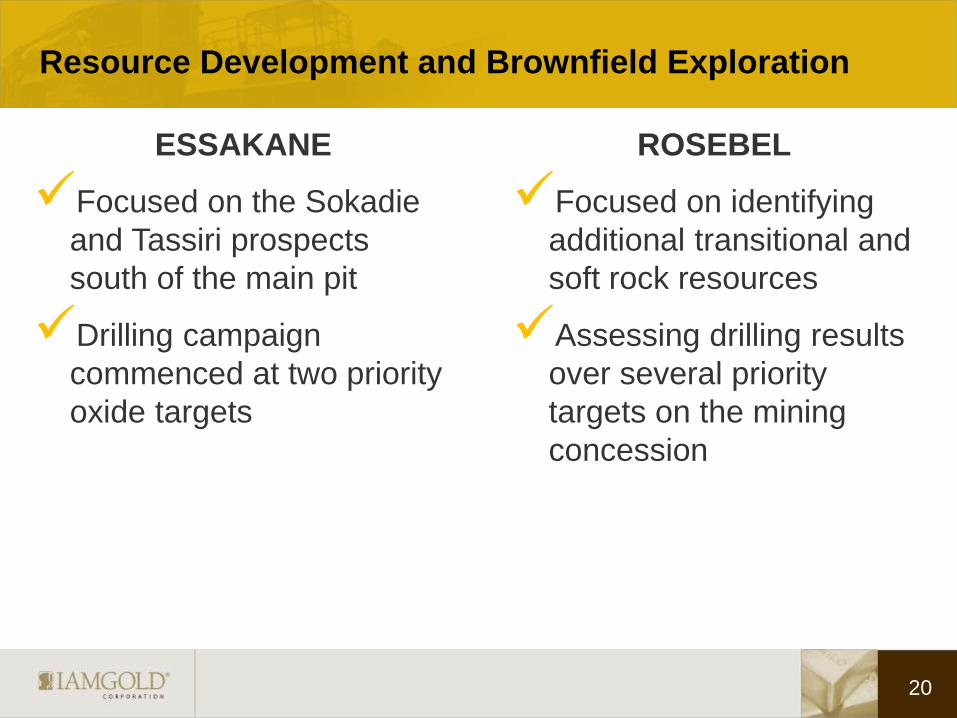
Resource Development and Brownfield Exploration
ESSAKANE
Focused on the Sokadie
and Tassiri prospects
south of the main pit
Drilling campaign
commenced at two priority
oxide targets
ROSEBEL
Focused on identifying
additional transitional and
soft rock resources
Assessing drilling results
over several priority
targets on the mining
concession
20
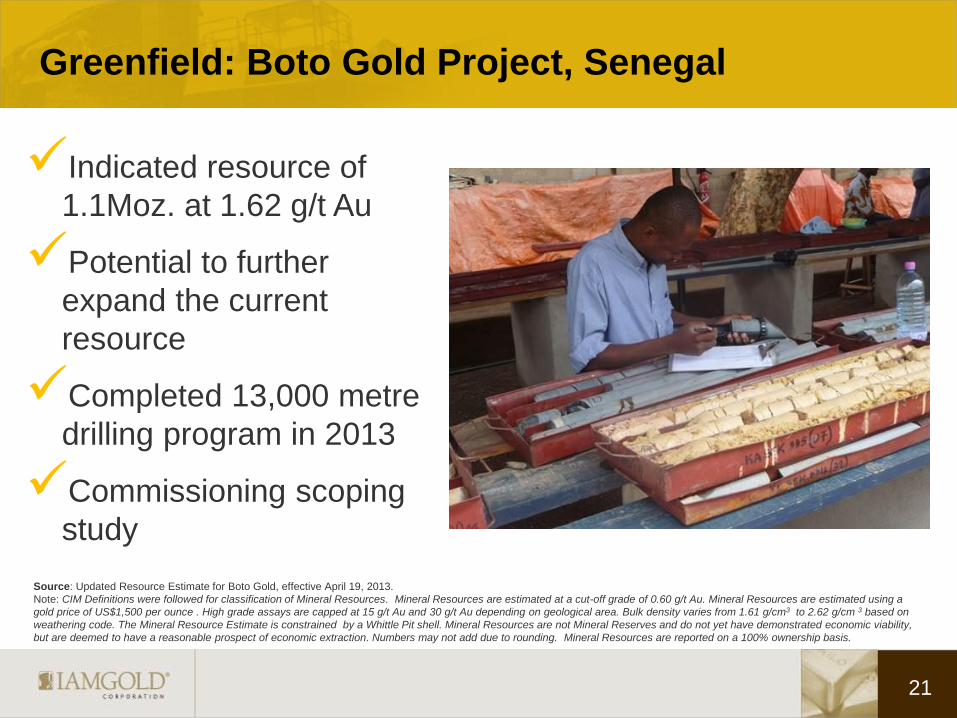
Greenfield: Boto Gold Project, Senegal
Indicated resource of
1.1Moz. at 1.62 g/t Au
Potential to further
expand the current
resource
Completed 13,000 metre
drilling program in 2013
Commissioning scoping
study
Source: Updated Resource Estimate for Boto Gold, effective April 19, 2013.
Note: CIM Definitions were followed for classification of Mineral Resources. Mineral Resources are estimated at a cut-off grade of 0.60 g/t Au. Mineral Resources are estimated using a
gold price of US$1,500 per ounce . High grade assays are capped at 15 g/t Au and 30 g/t Au depending on geological area. Bulk density varies from 1.61 g/cm3 to 2.62 g/cm 3 based on
weathering code. The Mineral Resource Estimate is constrained by a Whittle Pit shell. Mineral Resources are not Mineral Reserves and do not yet have demonstrated economic viability,
but are deemed to have a reasonable prospect of economic extraction. Numbers may not add due to rounding. Mineral Resources are reported on a 100% ownership basis.
21
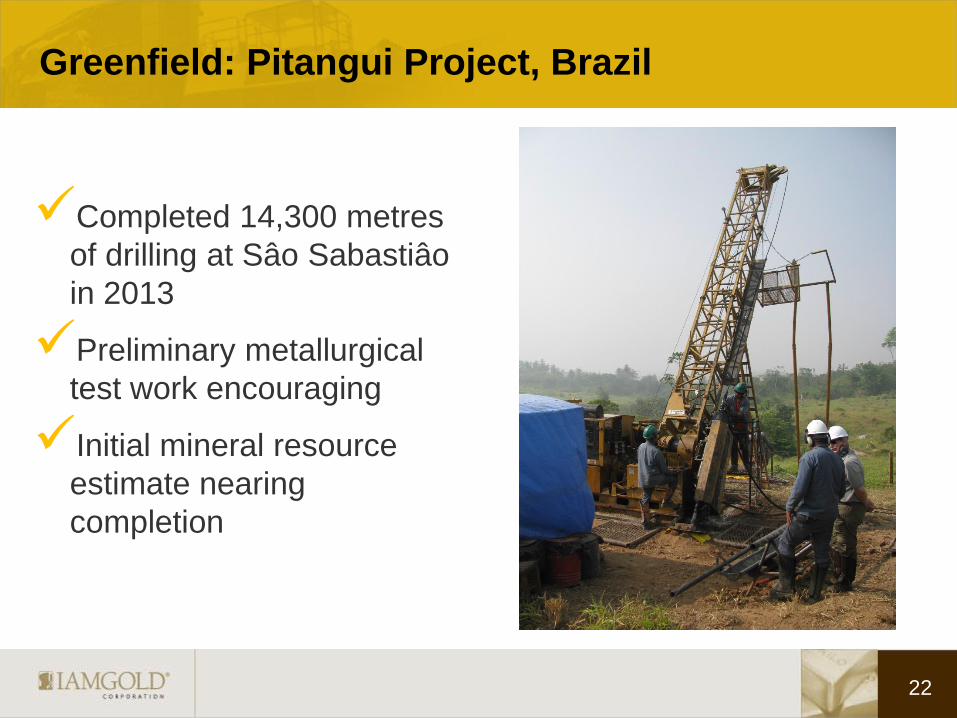
Greenfield: Pitangui Project, Brazil
Completed 14,300 metres
of drilling at Sâo Sabastiâo
in 2013
Preliminary metallurgical
test work encouraging
Initial mineral resource
estimate nearing
completion
22
The future of IAMGOLD
23
Conclusion
2014 Capital Expenditure Outlook
2014 Guidance
Why invest in IAMGOLD?
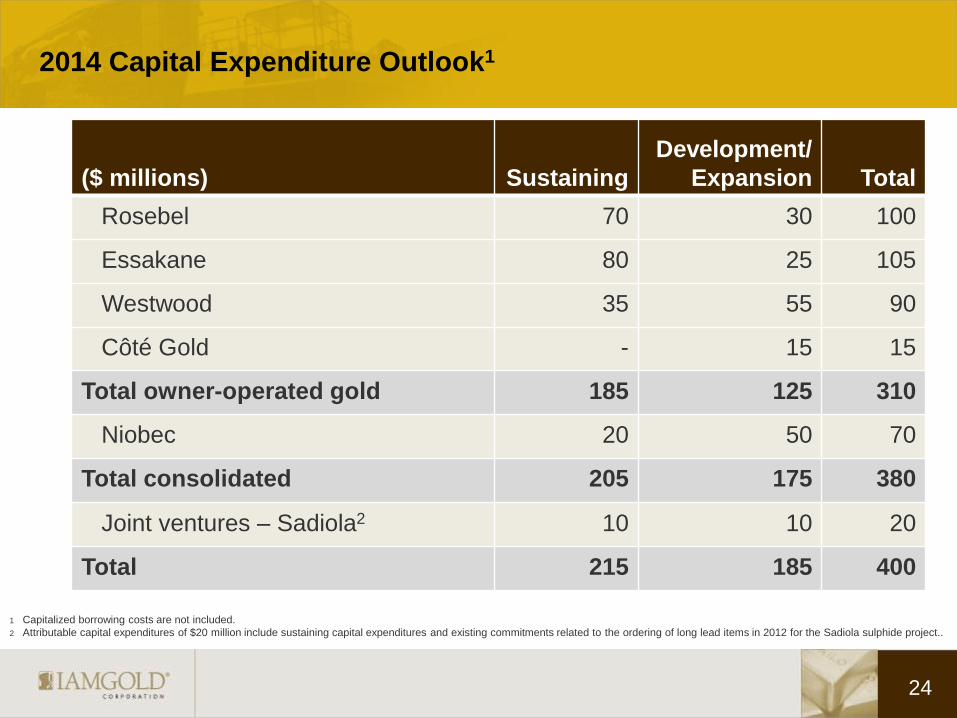
2014 Capital Expenditure Outlook1
($ millions) Sustaining
Development/
Expansion Total
Rosebel 70 30 100
Essakane 80 25 105
Westwood 35 55 90
Côté Gold - 15 15
Total owner-operated gold 185 125 310
Niobec 20 50 70
Total consolidated 205 175 380
Joint ventures – Sadiola2 10 10 20
Total 215 185 400
1 Capitalized borrowing costs are not included.
2 Attributable capital expenditures of $20 million include sustaining capital expenditures and existing commitments related to the ordering of long lead items in 2012 for the Sadiola sulphide project..
24
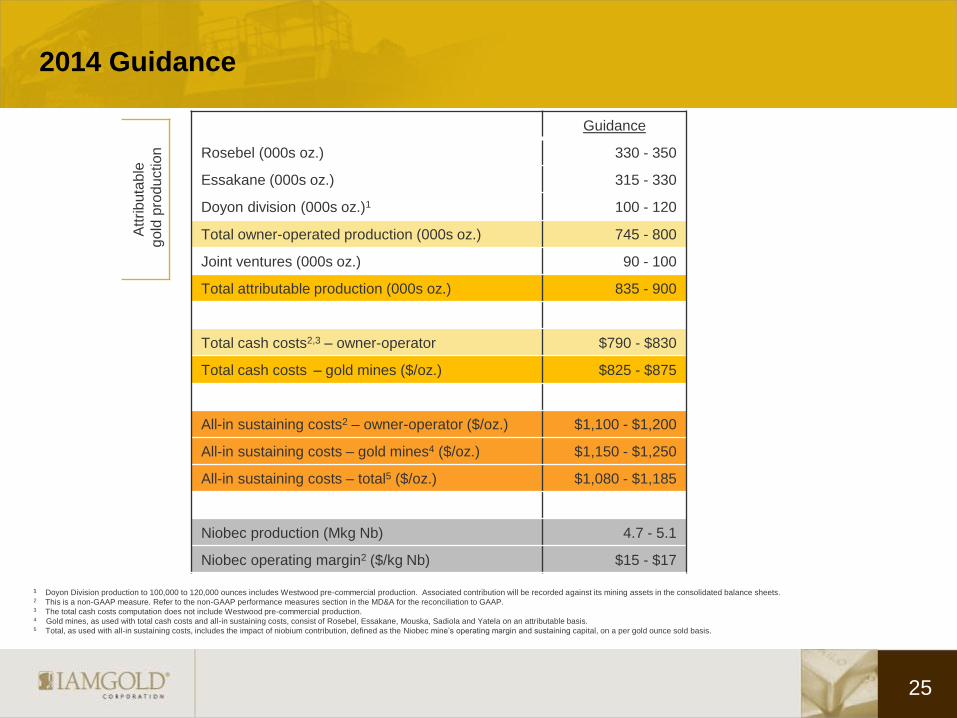
2014 Guidance
Att
rib
uta
ble
go
ld p
rod
uction
Guidance
Rosebel (000s oz.) 330 - 350
Essakane (000s oz.) 315 - 330
Doyon division (000s oz.)1 100 - 120
Total owner-operated production (000s oz.) 745 - 800
Joint ventures (000s oz.) 90 - 100
Total attributable production (000s oz.) 835 - 900
Total cash costs2,3 – owner-operator $790 - $830
Total cash costs – gold mines ($/oz.) $825 - $875
All-in sustaining costs2 – owner-operator ($/oz.) $1,100 - $1,200
All-in sustaining costs – gold mines4 ($/oz.) $1,150 - $1,250
All-in sustaining costs – total5 ($/oz.) $1,080 - $1,185
Niobec production (Mkg Nb) 4.7 - 5.1
Niobec operating margin2 ($/kg Nb) $15 - $17
1 Doyon Division production to 100,000 to 120,000 ounces includes Westwood pre-commercial production. Associated contribution will be recorded against its mining assets in the consolidated balance sheets. 2 This is a non-GAAP measure. Refer to the non-GAAP performance measures section in the MD&A for the reconciliation to GAAP. 3 The total cash costs computation does not include Westwood pre-commercial production. 4 Gold mines, as used with total cash costs and all-in sustaining costs, consist of Rosebel, Essakane, Mouska, Sadiola and Yatela on an attributable basis. 5 Total, as used with all-in sustaining costs, includes the impact of niobium contribution, defined as the Niobec mine’s operating margin and sustaining capital, on a per gold ounce sold basis.
25
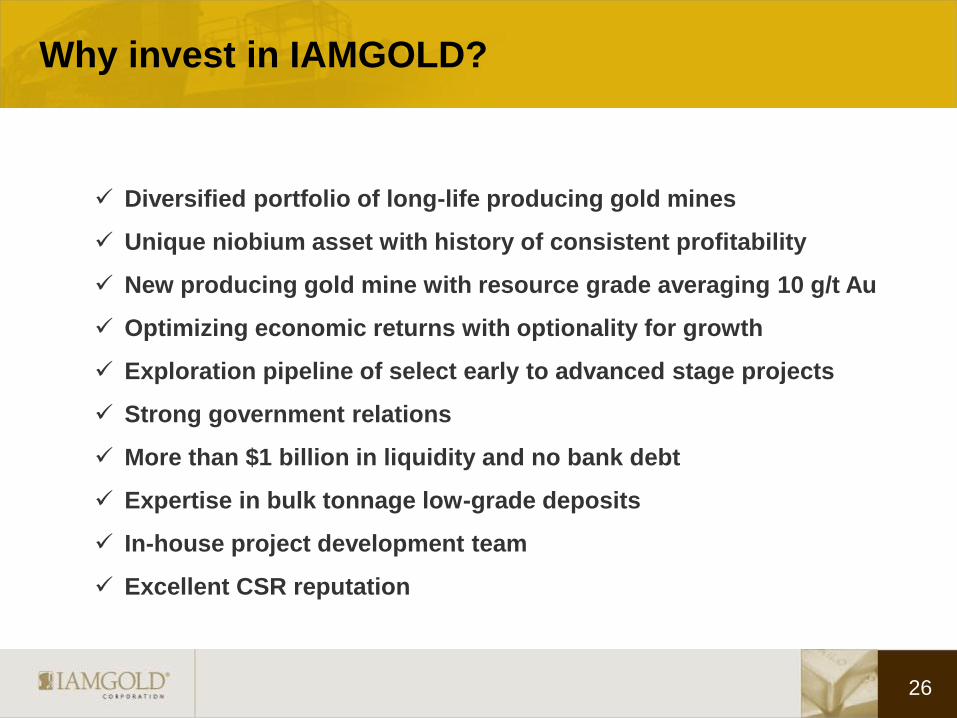
Why invest in IAMGOLD?
26
Diversified portfolio of long-life producing gold mines
Unique niobium asset with history of consistent profitability
New producing gold mine with resource grade averaging 10 g/t Au
Optimizing economic returns with optionality for growth
Exploration pipeline of select early to advanced stage projects
Strong government relations
More than $1 billion in liquidity and no bank debt
Expertise in bulk tonnage low-grade deposits
In-house project development team
Excellent CSR reputation

TSX: IMG NYSE: IAG
Investor Relations [email protected]
Bob Tait
VP, Investor Relations
T: 416-360-4743
Laura Young
Director, Investor Relations
T: 416-933-4952
Penelope Talbot-Kelly
Analyst, Investor Relations
T: 416-933-4738
TCFA – Gold Event April 9, 2014