Embed Size (px)
Citation preview

Cash ConvertersInternational Limited ABN 39 069 141 546
—
Annual Reportfor the year ended 30 June 2017—
cashconverters.com
For
per
sona
l use
onl
y

“ At the heart of any business is its people and I would like to thank and applaud the team at Cash Converters, both colleagues and franchisees, for their resilience through a period of change and their ongoing commitment to success in the future.”
—Mark Reid CEO
Contents—
Corporate directory
Chairman’s report
Chief Executive Officer’s report
Highlights
Operating and financial review
Directors’ report
Corporate governance
Consolidated statement of profit or loss and other comprehensive income
Consolidated statement of financial position
Consolidated statement of changes in equity
Consolidated statement of cash flows
Notes to the financial statements
Directors’ declaration
Auditor’s independence declaration
Independent auditor’s report
Additional securityholder information
4
6
8
10
12
18
60
61
62
63
64
65
111
112
113
118
Cash Converters International Limited – Annual Report 2017 | 32 | Cash Converters International Limited – Annual Report 2017
For
per
sona
l use
onl
y

Directors
Mr Stuart Grimshaw Non-Executive Chairman
Mr Peter Cumins Executive Deputy Chairman
Mr Lachlan Given Non-Executive Director
Mr Kevin Dundo Non-Executive Director
Ms Andrea Waters Non-Executive Director
Ms Ellen Comerford Non-Executive Director
Company Secretary
Mr Brad Edwards
Registered and Principal Office
Level 18, Citibank House 37 St Georges Terrace Perth WA 6000 Australia Tel: +61 8 9221 9111 Web: www.cashconverters.com
Share Registrar
Australia: Computershare Investor Services Pty Ltd Level 11 172 St Georges Terrace Perth WA 6000 Australia Tel: 1300 850 505
Auditors
Deloitte Touche Tohmatsu Brookfield Place, Tower 2 123 St Georges Terrace Perth WA 6000 Australia
Stock Exchange
Australian Securities Exchange Exchange Plaza 2 The Esplanade Perth WA 6000 Australia ASX code: CCV
4 | Cash Converters International Limited – Annual Report 2017
Corporatedirectory—
Cash Converters International Limited – Annual Report 2017 | 54 | Cash Converters International Limited – Annual Report 2017
For
per
sona
l use
onl
y

banks in refusing to provide services to Cash
Converters, then surely all capital markets
should be closed to these banks, given
the significant reputational risks they now
represent.
In addition, UBS in a recent survey introduced
the subject ‘mortgage books are worse than
believed’. The basis of this survey appears to
revolve around a number of loan applications
being ‘soft’ on expenditure disclosures and
aggressive on income assumptions – the UBS
survey found that roughly 29% of the $1.7
trillion of outstanding housing debt was based
on information that was not factual or accurate.
Notwithstanding the apparent tightening in
credit standards that should make access
to credit harder, the respondents to the UBS
mortgage survey found that applicants were
finding it easier to get credit than before. As
the apparent credit tightening occurred, the
banks moved interest rates up. The foregoing
UBS survey would suggest that an ability to
increase profits, while not materially altering
credit standards, was a determined outcome.
The winner of this is the banks and the loser
the customer! We continue to see this trend
in approaches by the banks in trading off
profitability for consumer well-being. For these
same institutions to determine your Company
is not worthy of their support, is difficult to
comprehend.
There were four key principles I mentioned last
year and they continue to hold:
1. We respect our customers and without
us they have to borrow from friends and
families or worse, the bottom of the shadow
finance industry.
2. We are transparent on pricing which is
governed by a high degree of regulatory
oversight and imposed legislative
conditions. Contrast this with recent
comments by the RBA in its submission to
the Productivity Commission, stating that
competition in banking is being restricted
by bundling of products, particularly with
cross-subsidisation “obscuring the pricing
of individual products”.
3. Continued investment in technology and
data analytics will continue to enhance our
underwriting capabilities.
4. The demand for credit from our customer
base will not disappear. Discussion in
certain circles focusing on eliminating the
provision of credit to this segment without
consideration of the impact on the wider
economy or the lives of those concerned,
is ill-informed and misguided. When people
who have never had an issue in obtaining
credit, start determining how people who
cannot get access to credit should behave,
then we have a problem.
We believe that the customers we serve are
an integral part of the fabric of this wonderful
nation and we are proud to serve them.
We have a terrific group of employees who
are passionate about the Company and its
customers and this will continue to lay the
foundation for future sustainable growth.
As always, I thank our shareholders for their
support and patience, and believe we are
positioned to benefit from changes made to
our operating model over the ensuing years.
Stuart Grimshaw
Chairman
“We are there for our customers,
consistently.”
—
Last year I wrote about the challenges
encountered through that period and the
steps being taken to return the Company to its
primary strengths. The first stage was removing
ourselves from the corporate store model in
the UK and reverting to a master franchise
arrangement – this means the Company only
has corporately owned stores in Australia. The
Company recorded a profit in the UK for the
first time as a result of these changes.
The next step was to revitalise the
management team and Board. There were
many layers of action that occurred:
1. Peter Cumins moved from the role of CEO
and Managing Director to that of Executive
Deputy Chairman, focusing on the growth
of the international franchise business.
2. Mark Reid was appointed as Chief
Executive of the Company, previously Chief
Executive Australia.
3. There were numerous management
changes including the retirement of the
CFO at the time, Ralph Groom, who was
replaced by Martyn Jenkins, previously
CEO of the UK operations.
4. We have a relatively new management
team in place under Mark Reid’s guidance
and each executive comes with unique
and broad experience which will benefit the
Company over the coming years.
5. We also have rejuvenated the Board and
dramatically increased the diversity with the
appointment of Andrea Waters (who Chairs
the Audit and Risk Committee) and Ellie
Comerford (who chairs the Remuneration
and Nomination Committee).
6. At last year’s AGM, we acknowledged
the long service of Reginald Webb who
has been outstanding over many years in
supporting the Company and assisting it
through some challenging times.
This restructuring of the management and
Board teams has been achieved seamlessly
and reflects the strong passion each member
has for the Company. The shift in focus to a
more diversified lending business that has seen
a reduced reliance on the SACC product, while
developing the additional medium term loan
and Green Light Auto car financing, will see
a more stable income position evolve as we
grow these businesses. We have continued to
invest in risk management systems and people
to provide the pre-requisite under-pinning
governance to grow these businesses at the
right pace, with the right amount of risk being
both understood and underwritten.
A number of our customers remain unable to
obtain credit from banks – which has been
a benefit to us and we thank the banks for
this. However, while we continue to serve this
segment, the banks continue to determine
that Cash Converters represent ‘reputational
risk’ to their businesses, notwithstanding
we (and the sector) are subject to a high
level of compliance scrutiny and regulatory
oversight. It is somewhat ironic that the banks,
and this is all banks, can maintain a view
of what industries are most appropriate to
the economy. When the commentators talk
about the ‘quadropoly’ of banking, we can
see it most evident in the consistent herd-like
behaviour exhibited in approaches to issues
such as these. Our customers make up a
significant part of the Australian economy
and need immediate access to cash for
emergencies such as car problems, medical
emergencies or utility bills. We are able to
provide comfort to our customers in a very
short time as opposed to the banks who take
a long time and inevitably say ”no”. We are
there for our customers, consistently.
The issue of reputational risk that the banks
have used against your Company is a
mysterious viewpoint when they will not even
allow the Company to open transactional
accounts with them. Ironically, when reviewing
the performance of the banks over the past
few years, what is evident is a focus on
driving profitability at the expense of sound
reputational risk management. We have
seen media commentary around allegations
concerning:
• Life insurance claims being rejected due to
a supposed policy of rejecting or restricting
legitimate claims being paid, through harsh
and restrictive policy definitions.
• Financial advice being provided to
individuals on the investment of their life
savings that benefited the financial return
to the adviser or bank rather than the
individual who had entrusted their life or
retirement savings to these institutions.
• Remuneration targets at branch levels that
were based on objectives inconsistent
with the approach of ‘what is best for the
customer’.
• The use of benchmarks in establishing
repayment capacity of borrowers when a
more focused investigation of expenditure
may have been more appropriate.
• ASIC’s Federal Court case which alleges
the rigging of the BBSW interest rates in
order to drive profits which may effectively
harm small businesses and institutions
whose lending is based off these rates.
• AUSTRAC’s Federal Court case against
a bank, alleging that they failed in their
compliance and enabled transfers of large
sums to suspected terrorist organisations
and drug cartels.
The breadth of these issues is breathtaking
and continues to drive consumer apathy
towards these large institutions. If we were
to use the same underlying reasoning as the
6 | Cash Converters International Limited – Annual Report 2017
Chairman’sreport—
Cash Converters International Limited – Annual Report 2017 | 76 | Cash Converters International Limited – Annual Report 2017
For
per
sona
l use
onl
y
Operational compliance
The Company continued to focus on, and
invest in, improving its compliance and risk
management procedures as we strive to
be leaders in our sector and to consistently
operate at, or exceed, regulatory standards.
During FY 2017 Cash Converters successfully
implemented a comprehensive Income and
Expenditure (I&E) assessment platform which
has considerably enhanced its ability to match
the right loan product to customers depending
on their circumstances, ultimately improving
the overall quality of the Company’s loan book.
This strategic decision resulted in a reduction
in the overall loan book and a change in the
product mix. As a result a notable reduction
was experienced in the Personal Finance net
bad debt expense and the Company expects
the bad debt expense to continue to reduce as
the overall shift in the product mix of the loan
book improves.
Global professional services firm, Deloitte
Touche Tohmatsu Limited (Deloitte), was
commissioned to conduct an independent
review of our processes and procedures
during the year, with a specific focus on the
personal loans and finance operations within
Cash Converters.
Pleasingly, Deloitte’s assessment in an
interim report (dated 6 June 2017) did not
identify any key deficiencies of updated
systems, processes, policies and training
procedures against the relevant legislative and
compliance obligations under the Enforceable
Undertaking (EU).
This review is ongoing and we anticipate
closing out the process with no adverse
findings when the final report is due in
November 2018.
Looking ahead
Our expectations for FY 2018 are to see the
strategy take hold and build on the success
achieved in FY 2017. As the new loan products
continue to gather momentum, we anticipate
a stronger second half to the year, with the
first half putting down the building blocks for
the longer-term growth, and so a comparable
result for the first half of 2018 to the second
half of 2017 is expected.
I am genuinely excited now that we have built
a foundation for sustainable and profitable
growth and, with a continued focus on
our customers, investing in our brand and
technology, and with a revitalised management
team, the encouraging progress made in
FY 2017 will continue throughout FY 2018.
We thank you for your continued support and
look forward to sharing in the future success of
Cash Converters.
Sincerely,
Mark Reid
CEO
“We are beginning to see encouraging signs that the strategy being implemented is having
the desired effect.”
—
The 2017 financial year was one of a transition
for Cash Converters, as we continued the
roll-out of our growth strategy and maintained
our drive to become the most trusted personal
finance lender and second hand retail goods
provider in our markets.
Pleasingly, we are beginning to see
encouraging signs that the strategy is having
the desired effect, which includes improving
the quality of our loan book and building a
sustainable platform for long-term profitable
growth.
The best evidence that we are achieving our
strategic objectives came in the Company’s
delivery of an FY 2017 NPAT of $20.6 million,
which was in line with guidance and a
significant improvement on the 2016 financial
year (FY 2016 $5.3 million loss).
A fall in Revenue and EBITDA from personal
finance and store operations for the financial
year were expected outcomes of the
Company’s deliberate plan to transition the
loan book to higher quality, lower risk products,
as part of a more sustainable model overall.
A profitable contribution from the first full year
of the UK operations functioning as a master
franchise, and the investment in New Zealand
producing its first full year profit, have seen the
franchise division strengthen considerably over
the prior year.
What was important was delivering a positive
result, off lower revenue, and to finish the year
with a strong cash position ($80.6 million, up
9.5%) to fund the ongoing growth plan and
strategic realignment of the business.
Of course, a further measure of performance
is share price and, while a number of factors
impact share price, we believe the strength
of the Cash Converters strategy is becoming
better understood by the market and
reflected in share price appreciation since
early June 2017.
However, at the heart of any business is
its people and I would like to thank and
applaud the team at Cash Converters, both
colleagues and franchisees, for their resilience
through a period of change and their ongoing
commitment to success in the future.
Product development
We have developed new products to reflect
the transition of the loan book, evidenced by
the Medium Amount Credit Contract (MACC)
product which, since its introduction in
November 2016, grew to a $13.4 million
loan book.
A strategic outcome of introducing the MACC
product has been its attraction to a new
segment of the addressable market, with more
than 30% of approved applications for the
MACC product coming from customers new to
Cash Converters.
In addition, growth in loan volumes through
the Green Light Auto (GLA) vehicle finance
business was very encouraging and is
expected to continue to increase as we grow
our finance broker / car dealer network. We
remain extremely confident that this part of our
business will be a key pillar in the future growth
of Cash Converters.
The Company’s investment in online marketing
and product delivery saw online lending
volumes surpass in-store loans for the first
time in January 2017, demonstrating the value
of committing investment to this fast-growing
channel.
Corporate strategy update
Cash Converters undertook a significant
restructure of its leadership team during
FY 2017, ensuring the capabilities of the team
were aligned to the needs of the business to
achieve its strategic objectives.
The transformation of Cash Converters to
become the leading and most trusted provider
of personal finance and second hand retail
goods has required the implementation of a
strategy focused on a number of key initiatives
that were addressed in FY 2017 and will
continue throughout FY 2018, including:
• Evolving the brand, product range and
channels to market;
• Growth of Cash Converters’ international
business;
• Transforming the Company’s digital
capabilities across sales and marketing;
• Continued improvement of our risk
management processes and procedures;
and
• Placing our customer at the centre of
everything we do.
It is our firm view that successful delivery
across these key initiatives will position Cash
Converters for sustainable growth in revenue
and profit whilst providing a better customer
experience, more relevant and appropriate
products and services, and ultimately, stronger
sustainable returns for our shareholders.
8 | Cash Converters International Limited – Annual Report 2017
Chief ExecutiveOfficer’s report—
Cash Converters International Limited – Annual Report 2017 | 98 | Cash Converters International Limited – Annual Report 2017
For
per
sona
l use
onl
y

HighlightsFor the year ended 30 June 2017
—
New MACC loans launched.$15m advanced in first 7 months.
Green Light Auto Finance loan book up to $20.1m. Positioned for profitable FY 2018.
New assessing platform and guidelines implemented.
Retail sales up 2.9% with online revenues up 16.3%.
87% brand awareness.
New leadership.New strategy. Positioned for growth.
Pawn broking revenues up 3.3%. Fourth consecutive year of growth.
New Zealand
The company’s 25% equity investment
in New Zealand returned its first full
year profit. A contribution of $314k.
United Kingdom
United Kingdom operating as a master
franchise. UK operations contributed
$1.7m of EBITDA to the group.
Cash Converters International Limited – Annual Report 2017 | 11
For
per
sona
l use
onl
y

Financial performance
The Company reports a full year net profit after
tax of $20.618 million compared to a prior year
loss after tax of $5.272 million. The prior year
included the effects of the restructure and an
ASIC compliance provision associated with the
enforceable undertaking the Company entered
into with ASIC in November 2016.
Revenue from continuing operations was down
from $311.599 million in 2016 to $271.473
million for the current financial year. This
anticipated and forecast decrease in revenue
is due to changes made to the assessing
process for personal loans and cash advances
in Australia that reduced lending volumes
significantly during the year, resulting in lower
interest revenues for the financial services
operations. All other segment operations’
EBITDA exceeded the prior year, with
increases in retail sales, pawn broking interest
and vehicle finance revenue.
Segment performance
There has been a change in presentation
of the segmental financial information
this year and a corresponding change to
last year’s comparatives in respect to the
financial services business. Financial Services
– Administration and Financial Services –
Personal Loans have been amalgamated
into a single segment, Personal Finance. This
more accurately reflects the operations of
the business and reflects changes to internal
management reporting during the period and
allows a more accurate allocation of costs for
all personal finance activities where resources
were previously shared.
A summary of consolidated revenues and
results by significant segment is set out below:
Segment revenues Segment EBITDA results
2017 2016 2017 2016$’000 $’000 $’000 $’000
Franchise operations 20,199 20,589 10,490 6,925
Store operations 124,222 129,312 17,549 23,541
Personal finance 117,191 151,897 49,472 65,858
Vehicle financing 9,393 8,146 (408) (4,599)
Totals before head office costs 271,005 309,944 77,103 91,725
Head office (i) 468 51 (31,378) (44,028)
Totals after head office costs 271,473 309,995 45,725 47,697
Depreciation, amortisation and impairment (8,123) (6,867)
Finance costs (9,404) (9,659)
Profit before income tax 28,198 31,171
Income tax expense (7,580) (5,277)
Profit after tax from continuing operations 20,618 25,894
Loss from discontinued operations – (31,166)
Profit / (loss) for the year 20,618 (5,272)
(i) Head office segment results for the year ended 30 June 2016 include ASIC compliance provision of $12.500 million
Cash Converters International Limited (the
Company) and entities controlled by the
Company and its subsidiaries (the Group) is
a diverse group generating revenues from
franchising, store operations, personal finance
and vehicle finance, supported by a corporate
head office in Perth, Western Australia. The
Company operates in Australia and the United
Kingdom and also has an equity interest of
25% in Cash Converters New Zealand. There
is a franchise presence in a further 16 countries
around the world.
In the prior year, the Company completed a
significant restructure of its operations in the
UK and the Carboodle vehicle leasing business
in Australia. Cash Converters UK returned to a
master franchise operation and the Carboodle
business changed its business model to Green
Light Auto Finance, offering secured vehicle
finance loans. The costs associated with these
restructures, together with their operational
results were reflected in the prior year accounts
as discontinued operations. There are no
further impacts of the discontinued operations
in the current year results.
$80.6m—
CASH AND CASH EQUIVALENTS
EBITDA AS % OF REVENUE
16.8%—
$20.6m—
4.2¢—
8.8%—
NET PROFIT AFTER TAX
EPS (BASIC)
NET BAD DEBT
Operating and financial reviewFor the year ended 30 June 2017
—
Cash Converters International Limited – Annual Report 2017 | 1312 | Cash Converters International Limited – Annual Report 2017
For
per
sona
l use
onl
y

Franchise operations
Franchise operations encapsulate royalties
and licence fees from 16 countries, franchised
Cash Converters operations, as well as Cash
Converters UK Ltd (CCUK), a wholly owned
subsidiary of the Company, which during the
previous financial year was restructured to
return to a master franchise operation. All
income from CCUK is now reflected in the
franchise operating segment. This segment
also includes fees from 83 franchisee owned
stores in Australia.
The total number of franchised stores globally
now stands at 659 with 83 stores in Australia,
196 in the UK and 380 throughout the rest of
the world. The Company continues to look for
opportunities to expand its franchise network,
both in Australia and internationally. The
performance of this segment remains steady
with long term franchise agreements in place
driving consistent year on year revenue. No
new franchisees were added during the year.
EBITDA for the franchise operations for the
year was $10.490 million, an increase of
$3.566 million over the prior year. CCUK
reported full year EBITDA of $1.746 million
(2016: $12.984 million loss), which now
includes only franchise operations, and is
attributed to the franchise segment for the
current year. CCUK ceased to offer personal
loans in May 2016, and throughout the year
the loan book has been wound down. The
remaining loans outstanding at 30 June 2017
have been handed over to third party debt
recovery agents and hence are fully provided
for in the financial statements.
Australian franchise operations contributed
$4.074 million of revenue (FY 2016 $4.034
million). The franchisee business continues
to drive strong sales, with retail revenues
across the franchise stores up 3.9% on the
previous year.
International franchise revenues increased
by $265 thousand to $739 thousand for the
year, as some international fee negotiations
completed and new stores in France, South
Africa and Spain opened in the prior year
contributed a full year of fees. The Franchise
segment also includes the New Zealand
operations, in which the Company holds a
25% equity interest, and which contributed
a profit of $314 thousand to the division,
compared to a prior year loss of $1.392 million.
Store operations
Store operations combines the performance
of the 71 Company-owned Cash Converters
stores in Australia. Revenue from these stores
is derived from the retailing of new and second
hand goods both in-store and online, as well
as interest from pawn broking loans and
cash advance short term loans. Stores also
receive commission from successful personal
loan applications processed in-store and
referred to the Company’s Personal Finance
business. Store operations also receive a
share of income from successful online loan
applications.
The 2017 performance of the corporate stores
in Australia contributed a segment EBITDA of
$17.548 million, a decrease of $5.992 million
from the FY 2016 result. This decrease was the
result of the reduction in cash advance lending,
which saw outgoings reduce by 33.4% as a
result of the changes to the assessing criteria.
Personal loan commissions to stores also
decreased as a result of the new lending
processes, however the launch of larger loans
in November 2016 helped to offset some of
this decrease. Overall, net store commissions
were down 35.0% on FY 2016.
All other areas of the store network saw
improved performance during the year,
with retail sales up 2.9% on the previous
corresponding year to $74.824 million. Online
retailing continues to grow significantly up
16.3% on FY 2016 and Webshop sales
contributing 8.5% of total retail revenues (2016:
7.5%). During 2017, the online offering from
Cash Converters was expanded to provide
the ‘What’s it Worth’ service. This enables
customers to submit images of items they may
wish to sell and the stores provide an indicative
valuation for the customer to sell the goods or
obtain a secured pawn broking loan against.
Pawn broking revenues also continue to
increase, up 3.3% on the prior year, with
the appeal of non-recourse secured lending
growing as access to other forms of credit are
being restricted. Pawn loans advanced for the
year were also up 5.2% on the prior year.
Corporate stores – United Kingdom
The outcome of the strategic review in the
previous year means there are no corporate
store results for the UK in the FY 2017 result.
The comparative figures are included in
discontinued operations for FY 2016 and
include the restructure costs of $22.668 million.
Personal finance
The personal finance operations incorporate
the trading results of Mon-E Pty Ltd (Mon-E)
and Cash Converters Personal Finance Pty
Ltd (CCPF). The UK Finance Division ceased
issuing new loans in May 2016, and therefore
does not form part of the Group’s continuing
operations. All UK revenues are incorporated in
the franchising operations.
Mon-E is responsible for providing the
administration services for the Cash Converters
network in Australia to offer small cash
advance loans to their customers (average loan
size of $398, FY 2016 $403) and the platform
to refer personal loans from stores to CCPF for
assessing.
The cash advance principal loaned is financed
by the corporate stores and the individual
franchisees for the cash advances provided
by their stores. Mon-E receives commission
from the store network for each cash advance
processed through their systems as a
percentage of fees earned by the store and
successfully collected.
CCPF provides unsecured loans originated
through the franchise and corporate store
networks and directly from customers online.
The loans are underwritten, and the principal
funded, by CCPF, which pays a commission
to the stores (both corporate and franchise) for
the generation of the lead and processing the
application in-store.
During the period under review the segment
EBITDA from continuing operations in this division
was $49.471 million (2016: $65.858 million),
down $16.387 million (24.9%) on last year.
Operating and financial reviewFor the year ended 30 June 2017
—
2017 2016$’000 $’000
EBITDA from continuing operations 45,725 47,697
Normalisation adjustments
Restructure costs 1,740 2,228
Other costs outside normal operating costs – 3,246
Compliance provision and associated expenses 2,088 12,500
Class action legal fees 3,973 2,442
EBITDA normalised 53,526 68,113
Significant events
In November 2016, the Company entered into
an Enforceable Undertaking (EU) with ASIC.
An expense of $12.500 million was provided
for in the prior year. During the current year, the
Company incurred additional costs to meet its
obligations under the EU through investment
in the Risk and Compliance function as well as
one-off costs to effect the customer remediation
program forming part of the EU.
The most significant change to the business
occurred in the Personal Finance division in
Australia, where a comprehensive review of the
Small Amount Credit Contract (SACC) lending
was completed, culminating in the roll out
across the network of an enhancement to the
Company’s loan origination and management
software. This removed the use of benchmarks
in the assessing process and allows the
business to conduct a detailed analysis of the
customer’s income and expenditure through
analysis of the customer’s bank statements.
The intended consequence of this new
assessing process was a significant reduction
in the volume of loans approved. This has
impacted personal finance revenue in the year,
but has begun to improve the overall quality of
the loan book and reduce bad debts.
To address this strategic reduction in SACC
lending, the business has also expanded the
range of financial products. In November 2016,
the business introduced larger loans (from
$2,000 to $5,000). These products, regulated
under the Medium Amount Credit Contract
(MACC) provision of the National Consumer
Credit Protection Act 2009 in Australia, are
offered to higher income customers with a
lower credit risk profile.
Transactional banking facilities were
successfully migrated from Westpac during
the year, taking full utilisation of new service
providers for banking and payment services.
Since the transition, the business has
continued to develop its relationship with
its new providers to improve efficiency and
customer experience.
Throughout the year, the Company incurred
costs that it categorises as outside its normal
operating expenses and has listed these in the
table below, to provide a ‘Normalised EBITDA’
that more accurately reflects the underlying
performance of the business. Specifically
itemised below are the compliance provision
and associated costs, for the FY 2016 year the
$12.500 million relates to the EU remuneration
and penalty, in the current year, the $2.088
million relates to the additional costs associated
with the call centre deployed to manage
the remediation program, the costs of the
independent expert and changes made to
systems to meet the reporting requirements of
the EU. The Class action legal fees of $3.973
million relate to the ongoing defence of the
Queensland Class actions.
Cash Converters International Limited – Annual Report 2017 | 1514 | Cash Converters International Limited – Annual Report 2017
For
per
sona
l use
onl
y

Financial Position
Summarised Financial Position 2017 2016$’000 $’000
Cash at bank 80,571 73,609
Loan receivables 101,970 104,521
Other receivables 31,051 39,417
Inventories 20,991 17,612
Other assets and intangibles 164,262 189,332
Total assets 398,845 424,491
Borrowings 107,237 133,984
Other liabilities 30,769 48,222
Total liabilities 138,006 182,206
Total equity 260,839 242,285
Operating cash flow 43,534 30,074
Gearing (net debt / equity) 10.2% 24.9%
Basic earnings per share from continuing operations (cents) 4.21 cents 5.37 cents
Basic earnings per share from continuing and discontinued operations (cents) 4.21 cents (1.09 cents)
Return on equity 7.9% 10.7%
Receivables (trade and personal loans)
Outstanding loan receivables (personal loans and
vehicle finance loans) for the year have decreased
from $104.521 million to $101.970 million due
to the decrease in SACC outgoings during the
year, and offset by the increase in vehicle finance.
Other trade receivables reflect the run-off of the
Carboodle leases and the repayment of the
loans provided to franchisees in the UK for the
purchase of corporate stores in 2016.
Other assets and intangibles
Capital investment continued throughout 2017,
with $8.162 million of investment in capital
expenditure, largely in software development.
Inventories are also up 19.2% due to increased
demand for in-store buying and a slight
reduction in the pawn broking redemption rates.
Borrowing and gearing
The Company has been successfully
operating its $100 million securitisation
facility with Fortress Investment Group since
it replaced Westpac’s facility in March 2016.
As the facility is linked to the SACC personal
loan book, and the decrease in lending during
the year, the Company has drawn down
the facility to $45.500 million at the end of
FY 2017 (FY 2016 $68.750 million), a net
repayment in borrowings of $23.250 million.
The Company is in negotiations to enable
other loan products offered by the business
to be funded. The increase in free cash and
reduction in borrowings has reduced the
gearing rate to 10.2% (FY 2016 24.9%).
Cash flows
Operating cash flows have increased
significantly due to the reduced lending
volumes of SACCs, and overall cash receipts
from customers far exceeding the outgoings
during the year, with cash and cash equivalents
at year end at $80.571 million (FY 2016
$73.609 million). Free cash of $59.988 million
is held after the exclusion of restricted cash
deposits held as security for the transactional
banking facilities together with cash held in
trust for the securitisation facility. This has
been achieved while funding the growth in
MACCs and vehicle finance lending to the
sum of $33.470 million not funded from the
securitisation facility.
Outlook
The 2017 financial year has been one of
significant transformation, and forms the
baseline for the future growth of the business
as it executes its strategic objectives in the
years ahead. Focussing on compliance and
risk, whilst ensuring value and an exemplary
customer experience, Cash Converters is
looking forward to sustainable growth in its
financial services products as it continues
to offer greater flexibility to new and existing
customers. Significant investment is planned
into digital services and improving the
customer experience at Cash Converters,
whether in-store or online. A sustainable
growth strategy will see the turnaround of
Cash Converters over the coming years, with
new leadership in place to facilitate the drive to
achieve ongoing profitability for the Company
and increased returns for its shareholders,
underpinned by the ambition to be the most
trusted lender in our sector.
Operating and financial reviewFor the year ended 30 June 2017
—Personal loans – Australia
The Company’s personal finance business
experienced the greatest change during 2017.
At the start of the year, the Company began
a comprehensive review of its underwriting
process and related risk appetite. The
culmination of this work was the launch in
November 2016 of the offering of larger
loans (under the MACC lending rules) of up
to $5,000, and in April 2017, the roll out of
the Company’s comprehensive Income and
Expenditure platform. These changes were
aimed to improve the quality of the customer
base and provide a stable and sustainable
lending model to facilitate future growth.
The Income and Expenditure platform,
an expansion of the Company’s in-house
developed software system, has allowed
the business to completely remove the use
of benchmarks in assessing affordability of
customer loans, replacing them with the
comprehensive analysis of the customers’
bank statements and hence arriving at a more
accurate credit decision, through arriving at a
more accurate assessment of the suitability and
affordability of customers’ loan applications.
Aimed to appeal to higher income customers,
providing higher value loans, the MACC
product has grown over the seven months
since launch to comprise 16.4% of the total
personal loan book, with $15.043 million
advanced and an outstanding book of $13.370
million at 30 June 2017.
With the focus for 2017 on quality not quantity
for the personal lending business, the personal
loan book has fallen from $98.719 million at 30
June 2016 to $81.355 million at 30 June 2017,
a drop of 17.6%, with lending of SACCs falling
31.3% during the year. The reduction in lending
has had a significant impact on revenues, with
a $32.795 million decrease from FY 2016.
Due to the revenue recognition for MACC
loans being over the life of the loans, these
loans have yet to provide a significant uplift in
revenue. The uplift in revenue from MACC will
be evidenced in the subsequent financial year
as the book starts to mature.
From a channel perspective, both stores and
online remain vital to the Personal Finance
business with a relatively even split of 52.3%
in-store advances and 47.7% online advances
during the year. As a distribution channel, online
loans have exceeded in-store lending for the
first time in January 2017. Store originated
loans do still make up 51.9% of the outstanding
loans at 30 June 2017 (2016: 54.6%). Despite
the business overhauling its underwriting and
risk appetite during the year, it is clear from
application numbers that demand for the SACC
product is still high, with total applications
increasing by 8.2% year on year.
Also, during the year the Company made the
decision to outsource its collection activity to
Collection House Limited (ASX: CLH), based
in Brisbane. Leveraging the core capabilities
of Collection House to manage the collections
process has allowed Cash Converters to focus
upon its core service delivery to its customers.
The combined contribution from improved
lending and the efforts of Collection House,
has seen the total bad debts written off, net of
recoveries, falling from $32.774 million in FY
2016 to $29.899 million in FY 2017 an 8.8%
improvement. Bad debt levels are projected to
continue to decrease over the coming year, as
the composition of the loan book continues to
shift away from those loans written before the
changes to the assessment process.
Personal loans – United Kingdom
In May 2016, the UK business stopped
advancing principal in regard to personal
loans. Throughout the following year, the
UK collections team continued collecting on
the book. A total of £3.981 million has been
collected to 30 June 2017. The outstanding
balance was fully provided for in the restructure
costs reported in the FY 2016 financials. This
balance has now been outsourced to third
party collection agents and the Company
anticipates a small percentage to be recovered
over the coming year.
Vehicle financing
Green Light Auto Finance is the Company’s
vehicle financing business. In March 2016, the
business ceased to offer its Carboodle vehicle
lease product. These leases are continuing to
be managed by the business to their scheduled
completion. As at 30 June 2017 there were
435 leases still active (30 June 2016: 781). The
new product offered by Green Light Auto since
March 2016 is a traditional secured vehicle loan.
The GLA products are offered through a range
of brokers, car dealerships and Cash Converters
stores, as well as directly to customers online.
The loans range from $5,000 to $50,000 over
a term of up to 7 years, with an average loan
advanced of $18,322 over 56 months. Total
advances in the 2017 year were $17.058 million
(2016: $3.104 million) taking the vehicle finance
loan book to $20.100 million at 30 June 2017
(30 June 2016: $3.327 million).
The business is working to improve efficiency
and systems to position itself for significant
growth over the coming years, with its
migration to the CCPF loan processing
platform already underway. Total revenue
from the vehicle financing operations for
the year was up 15.3% to $9.393 million
with an EBITDA loss of $408 thousand, an
improvement from a normalised EBITDA loss of
$2.371 million for FY 2016 (normalising for the
costs of the restructure of $2.228 million).
Corporate costs
Corporate costs consist of corporate related
activities such as IT, Business Development,
Finance, HR, Risk and Internal Audit, Legal,
Marketing, Board and leadership team. The
business is positioning itself for future growth
and does not anticipate a significant reduction
in Corporate costs in the short term, however
comprehensive cost and efficiency strategic
initiatives are being pursued. During the current
year, the Company has invested in enhancing
resource and capability in its Risk and
Compliance function to ensure the business
is best positioned to continue to execute its
strategy to be the most compliant operator in
the industry.
Cash Converters International Limited – Annual Report 2017 | 1716 | Cash Converters International Limited – Annual Report 2017
For
per
sona
l use
onl
y

Mr Given joined the Board in 2014. He is the Executive Chairman of EZCORP Inc (a major
shareholder in the Company) and also a Director of The Farm Journal Corporation, a 134 year old
pre-eminent US agricultural media company; Senetas Corporation Limited (ASX: SEN), the world’s
leading developer and manufacturer of certified, defence-grade encryption solutions; CANSTAR
Pty Ltd, the leading Australian financial services ratings and research firm; and RateCity.com Pty
Ltd, one of Australia’s largest Internet based financial services comparison organisations.
Mr Given began his career working in the investment banking and equity capital markets divisions
of Merrill Lynch in Hong Kong and Sydney where he specialised in the origination and execution of
a variety of M&A, equity and equity-linked and fixed income transactions.
Mr Given graduated from the Queensland University of Technology with a Bachelor of Business
majoring in Banking and Finance (with distinction).
Over the past 3 years Mr Given has held directorships with the following listed companies:
Company Commenced Ceased
Senetas Corporation Limited 20 March 2013 –
EZCORP Inc 18 July 2014 –
Mr Peter Cumins Executive Deputy Chairman
—
Appointed director April 1995
Mr Cumins joined the Company in August 1990 as Finance and Administration Manager when the
Company had just 23 stores, becoming General Manager in March 1992. He became Managing
Director in April 1995. Mr Cumins moved from this role to the role of Executive Deputy Chairman
on 23 January 2017.
Mr Cumins is a qualified accountant, and has overseen the major growth in the number of
franchisees in Australia as well as the international development of the Cash Converters franchise
system. His experience in the management of large organisations has included senior executive
positions in the government health sector, specifically with the Fremantle Hospital Group, where
he was Finance and Human Resources Manager.
Over the past 3 years Mr Cumins has held a directorship with the following listed company:
Company Commenced Ceased
EZCORP Inc 28 July 2014 –
Mr Lachlan Given Non-Executive Director
—
Appointed director 22 August 2014
The directors of Cash Converters International Limited submit the following report of the Company for the financial year ended 30 June 2017.
In order to comply with the provisions of the Corporations Act 2001, the directors report as follows:
Information about directors
The following persons held office as directors of the Company during the whole of the financial year and until the date of this report unless
otherwise stated:
Mr Stuart Grimshaw Non-Executive Chairman
—
Appointed director 1 November 2014
Appointed Chairman 10 September 2015
Directors’ reportFor the year ended 30 June 2017
—
Mr Grimshaw joined the Board in 2014 and was appointed Non-Executive Chairman on
10 September 2015. Mr Grimshaw is currently the Chief Executive Officer of EZCORP Inc. Prior
to joining EZCORP in November 2014, Mr Grimshaw was the Managing Director and Chief
Executive Officer of Bank of Queensland Limited (BOQ).
During his tenure at BOQ he initiated fundamental changes to BOQ’s culture, operating model
and strategic direction and established a strong track record of execution. In addition, a strong
capital and provisioning strategy resulted in two credit rating upgrades to A-, and BOQ has been
well supported by the equity markets with two global equity offerings successfully raising close
to $800 million. In Mr Grimshaw’s time at the bank, BOQ attracted and developed exceptional
talent across the top four management levels and a unique culture and brand that is now well
recognised by the market.
During his 30-year career in financial services, Mr Grimshaw has held a wide variety of other roles
across many functions of banking and finance, including eight years at the Commonwealth Bank
of Australia (CBA). At CBA, he started as Chief Financial Officer and over time became Group
Executive, responsible for core business lines including Institutional and Business Banking as well
as Wealth Management (Asset Management and Insurance). Prior to joining CBA, he worked for
the National Australia Bank and was the Chief Executive Officer of Great Britain, with responsibility
for large UK consumer banks Yorkshire Bank and Clydesdale Bank.
Mr Grimshaw represented New Zealand at the 1984 Olympics in Field Hockey and has a
Bachelor of Commerce and Administration (Victoria University, Wellington, New Zealand) and
an MBA (Melbourne University, Australia). He has also completed the Program for Management
Development at Harvard Business School.
Over the past 3 years Mr Grimshaw has held directorships with the following listed companies:
Company Commenced Ceased
EZCORP Inc 3 November 2014 –
Cash Converters International Limited – Annual Report 2017 | 1918 | Cash Converters International Limited – Annual Report 2017
For
per
sona
l use
onl
y

Ms Comerford has over 30 years of financial services experience across a range of banking and
insurance businesses. Most recently Ms Comerford was Chief Executive Officer and Managing
Director of Genworth Australia, an ASX top 200 listed company, successfully leading the company
through an IPO in 2014. She has also held various positions with leading global title and specialty
insurance company First American Financial Corporation, both in Australia and internationally,
including CEO and Managing Director for the Australian and New Zealand operations, and Chief
Operating Officer for the international division. Prior to this, she was at Citigroup for approximately
14 years. Ms Comerford brings significant experience in enhancing performance culture within
businesses with a commitment to promoting diversity and she is a member of Chief Executive
Women.
Ms Comerford is also a non-executive director of Hollard Holdings Australia and Hollard Insurance
Company in Australia and Heartland Bank Limited in New Zealand and certain of its subsidiaries
in Australia.
Ms Comerford is Chair of the Company’s Remuneration and Nomination Committee and a
member of the Audit and Risk Committee.
Over the past 3 years Ms Comerford has held directorships with the following listed companies:
Mr Reginald Webb Non-Executive Director
—
Appointed 1997, retired 14 February 2017
Ms Ellen Comerford Non-Executive Director
—
Appointed director 9 February 2017Company Commenced Ceased
Genworth Mortgage Insurance Australia Limited
20 February 2012 9 October 2015
Heartland Bank Limited (NZX) 1 January 2017 –
Mr Webb joined the Board as a director in 1997 and was the Non-Executive Chairman from 2005
until he retired from that position on 10 September 2015. Mr Webb retired from the Board on 14
February 2017, having made a very significant contribution in helping to guide the Company over the
20 years of his directorship.
Over the past three years Mr Webb has not held directorships with any listed companies other than
Cash Converters International Limited.
Directors’ shareholdings
The following table sets out each director’s relevant interest in shares and options in shares of Cash Converters International Limited as at the date
of this report:
Directors Fully paid ordinary shares Share optionsNumber Number
Mr S Grimshaw – –
Mr P Cumins 7,575,694 3,730,000
Mr L Given – –
Mr K Dundo – –
Ms A Waters – –
Ms E Comerford – –
Mr Dundo joined the Board on 20 February 2015. Mr Dundo practises as a lawyer and specialises
in the commercial and corporate field, with experience in the mining sector, the service industry
and the financial services industry. He is a member of the Law Society of Western Australia, Law
Council of Australia, Australian Institute of Company Directors and a Fellow of the Australian
Society of Certified Practising Accountants.
Mr Dundo is currently a Non-Executive Director of ASX-listed Imdex Limited (ASX: IMD) and Non-
Executive Chairman of ASX-listed Red 5 Limited (ASX: RED).
Mr Dundo is a member of the Company’s Audit and Risk Committee and Remuneration
and Nomination Committee, and until 24 February 2017 was the Chair of the Remuneration
Committee.
Over the past 3 years Mr Dundo has held directorships with the following listed companies:
Ms Waters is a Chartered Accountant with an extensive career at KPMG, with 16 years as a Financial
Services Audit Partner (until 2012), specialising in managed investments and superannuation. She
has extensive experience with audit committees, and using this knowledge, she is a professional
non-executive director, with a strong passion for implementing and improving governance and
audit structures within business operations. Ms Waters is also an accredited facilitator for Australian
Institute of Company Directors’ Company Director Course.
Ms Waters is also a non-executive director of Bennelong Funds Management Ltd (also Chair of
the Audit and Risk Committee), Care Super and CityWide Service Solutions (also Chair of the
Audit Committee). She has previously been a non-executive director of Chartered Accountants
Australia and New Zealand, Lord Mayor’s Charitable Foundation and Cancer Council Victoria. Ms
Waters holds a Bachelor of Commerce from the University of Melbourne, is a Fellow of Chartered
Accountants Australia and New Zealand, is a graduate member of the Australian Institute of
Company Directors and the Australian Institute of Superannuation Trustees.
Ms Waters is Chair of the Company’s Audit and Risk Committee and a member of the Remuneration
and Nomination Committee.
Over the past 3 years Ms Waters has not held directorships with any listed companies other than
Cash Converters International Limited.
Company Commenced Ceased
Imdex Limited 14 January 2004 –
Red 5 Limited 29 March 2010 –
Directors’ reportFor the year ended 30 June 2017
—
Mr Kevin Dundo Non-Executive Director
—
Appointed director 20 February 2015
Ms Andrea Waters Non-Executive Director
—
Appointed director 9 February 2017
Cash Converters International Limited – Annual Report 2017 | 2120 | Cash Converters International Limited – Annual Report 2017
For
per
sona
l use
onl
y
Changes in state of affairs
During the financial year, there have been two significant changes to the operations of the business:
i) the Company made a substantial change to its lending processes both in-store and online, with the implementation of new software and
procedures; and
ii) The launch of larger MACC (Medium Amount Credit Contract) loans to customers from $2,000 to $5,000.
The impact of these changes has seen a reduction in lending in the short term and income from SACC (Small Amount Credit Contract) loans.
However, the MACC loan book is increasing and the combined effect of these changes is to improve the overall credit quality of the loan books.
Subsequent events
There have been no events subsequent to the reporting date requiring disclosure in this report.
Future developments
Likely developments in expected results of the Group’s operations in subsequent years and the Group’s business strategies are referred to elsewhere
in this report. In the opinion of the directors, any further information on those matters could prejudice the interest of the Company and has therefore
not been included in this report.
Dividends
The directors of the Company paid a fully franked final dividend of one cent per share on 28 October 2016.
On 22 August 2017 the Company announced that there would be no final dividend in respect of the financial year ended 30 June 2017.
Shares under option or issued on exercise of options
Details of unissued shares or interests under option as at the date of this report are:
Issuing entity
Number of shares
under option Class of shares
Exercise price
of option
Vesting
determination
date
Cash Converters International Limited 102,166 Ordinary Nil 1 Jul 2017
Cash Converters International Limited 6,194,448 Ordinary Nil 30 Jun 2018
Cash Converters International Limited 6,458,766 Ordinary Nil 30 Jun 2019
The performance rights above are in substance share options with an exercise price of nil, which vest and are immediately exercised into ordinary
shares once certain performance / vesting conditions are met.
The holders of these performance rights do not have the right, by virtue of the performance right, to participate in any share issue or interest issue of
the Company or of any other body corporate.
No shares have been issued as a result of the exercise of share options or performance rights during or since the end of the financial year.
Indemnification and insurance of directors and officers
During the financial year, the Company paid a premium in respect of a contract insuring the directors of the Company, the Company Secretary and
all executive officers of the Company and of any related body corporate against a liability incurred as such a director, secretary or executive officer to
the extent permitted by the Corporations Act 2001. The contract of insurance prohibits disclosure of the nature of the liability and the amount of the
premium.
The Company has not otherwise, during or since the end of the financial year, except to the extent permitted by law, indemnified or agreed to
indemnify an officer or auditor of the Company or of any related body corporate against a liability incurred as such an officer or auditor.
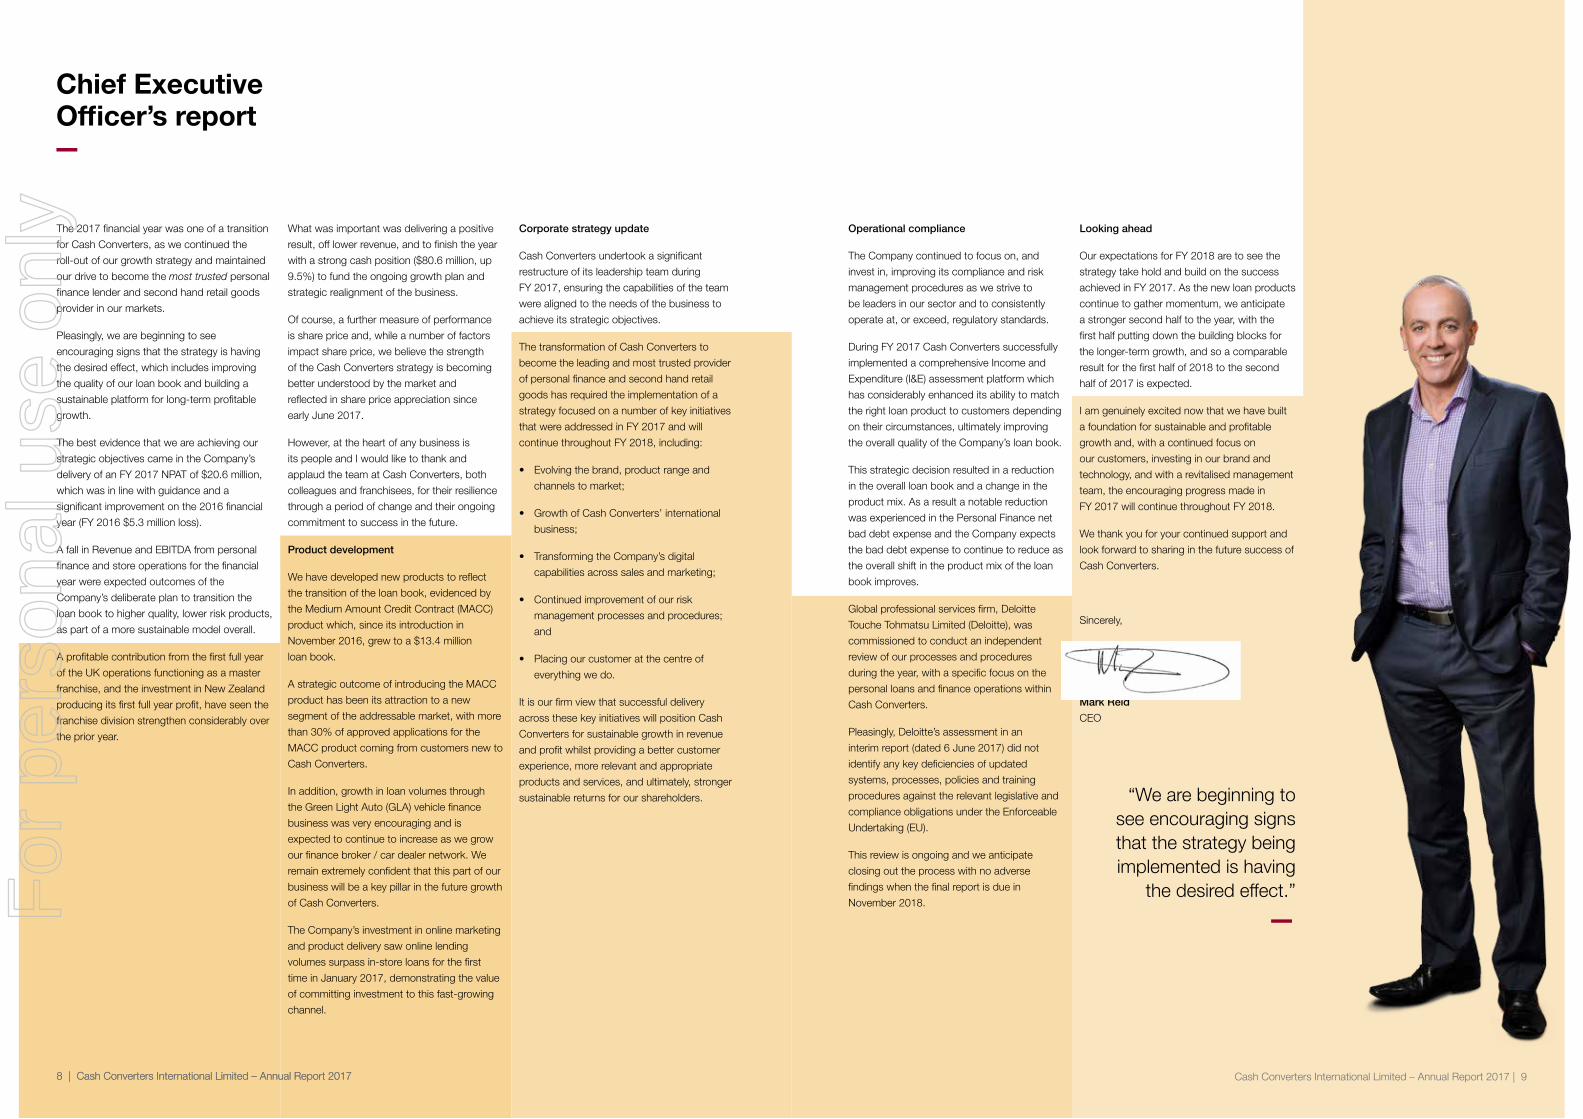
With a background in law, Mr Edwards has extensive private practice and corporate experience,
most notably with the Bank of Queensland Group for 15 years, where he held the roles of Company
Secretary and General Counsel. His career encompasses financial services, including retail
franchising, regulatory matters, dispute resolution and class action litigation, capital markets and
mergers and acquisitions.
Mr Ralph GroomAppointed 1995, resigned 30 June 2017
—
Principal activities
The principal activity of Cash Converters International Limited and its subsidiaries (the Group) is that of a franchisor of second hand goods and
financial services stores, a provider of secured and unsecured loans and the operator of a number of corporate stores in Australia, all of which trade
under the Cash Converters name.
Country master franchise licences are also sold to licensees to allow the development of the Cash Converters brand but without the need for
support from Cash Converters International Limited.
Review of operations
The Group’s net profit attributable to members of the parent entity for the year ended 30 June 2017 was $20.618 million (2016: $5.272 million loss)
after a charge for income tax of $7.580 million (2016: $5.277 million).
A review of the Group’s operations and financial performance has been provided on pages 12 to 17.
Company Secretary
Directors’ reportFor the year ended 30 June 2017
—
Mr Brad EdwardsAppointed 30 June 2017
—
Mr Groom joined Cash Converters in August 1995. Previously he was the Finance Director and
Company Secretary of Tony Barlow Australia Limited, a publicly listed retailer, where he was
responsible for all financial and secretarial matters. Mr Groom is a Fellow of the Chartered Institute of
Management Accountants (UK) (ACMA), a Fellow of Certified Practicing Accountants (FCPA) and a
Fellow of the Chartered Institute of Secretaries and Administrators (FCIS).
Cash Converters International Limited – Annual Report 2017 | 2322 | Cash Converters International Limited – Annual Report 2017
For
per
sona
l use
onl
y

Remuneration Report (audited)
1. Letter from the Chair of the Remuneration and Nomination Committee
2. Persons addressed and scope of the Remuneration Report
3. Context of and changes to KMP remuneration for FY 2017 and into FY 2018
4. Overview of Cash Converters’ Remuneration Governance Framework and strategy
5. Planned executive remuneration for FY 2017 (non-statutory disclosure)
6. Vested / awarded incentives and remuneration outcomes in respect of the completed FY 2017 period (non-statutory disclosure)
7. Performance outcomes for FY 2017 including STI and LTI assessment
8. Changes in KMP-held equity
9. Non-Executive Director fee policy rates for FY 2017 and FY 2018 and fee limit
10. Remuneration records for FY 2017 (statutory disclosures)
11. Employment terms for KMPs
12. Other remuneration-related matters
13. External remuneration consultant advice
Directors’ meetings
The number of meetings of directors and meetings of committees of directors held during the year and the number of meetings attended by each
director were as follows:
Directors Board of directors Audit and Risk Committee
Remuneration and
Nomination Committee
Held Attended Held Attended Held Attended
Mr S Grimshaw 13 13 3 3 2 2
Mr P Cumins 13 13 – – – –
Mr L Given 13 13 3 3 2 2
Mr K Dundo 13 13 5 5 5 5
Ms A Waters 4 4 2 2 3 3
Ms E Comerford 4 4 2 2 3 3
Mr R Webb 9 9 3 3 2 2
Non-audit services
The directors are satisfied that the provision of non-audit services, during the year, by the auditor is compatible with the general standard of
independence for auditors imposed by the Corporations Act 2001.
The directors are satisfied that the provision of non-audit services during the year by the auditor did not compromise the auditor independence
requirements of the Corporations Act 2001, as the nature of the services was limited to income tax and indirect tax compliance, transaction /
compliance related matters and generic accounting advice. All non-audit services have been reviewed and approved to ensure they do not impact
the integrity and objectivity of the auditor, and none of the services undermine the general principles relating to auditor independence as set out
in Code of Conduct APES 110 Code of Ethics for Professional Accountants issued by the Accounting Professional and Ethical Standards Board,
including reviewing or auditing the auditor’s own work, acting in a management or decision-making capacity for the Company, acting as advocate for
the Company or jointly sharing economic risks and rewards.
Details of the amounts paid or payable to the auditor for non-audit services provided during the year by the auditor are outlined in note 6.6 to the
financial statements.
Rounding off of amounts
The Company is a company of the kind referred to in ASIC Corporations (Rounding in Financials / Directors’ Reports) Instrument 2016/191, dated
24 March 2016, and in accordance with that Corporations Instrument, amounts in the directors’ report and the financial statements are rounded off
to the nearest thousand dollars, unless otherwise indicated.
Auditor’s independence declaration
The auditor’s independence declaration is included on page 112.
Directors’ reportFor the year ended 30 June 2017
—
Cash Converters International Limited – Annual Report 2017 | 2524 | Cash Converters International Limited – Annual Report 2017
For
per
sona
l use
onl
y

2. Persons addressed and scope of the Remuneration Report
This remuneration report, which forms part of the directors’ report, sets out in accordance with section 300A of the Corporations Act, for the year
ended 30 June 2017:
(i) the Company’s governance relating to remuneration;
(ii) the policy for determining the nature and amount or value of remuneration of Key Management Personnel (KMP);
(iii) the various components or framework of that remuneration;
(iv) the prescribed details relating to the amount or value paid to KMP, as well as a description of any performance conditions;
(v) the relationship between the policy and the performance of the Company.
The Company has also provided additional information to assist shareholders in obtaining an accurate and complete understanding of the
Company’s approach to the remuneration of KMP.
KMP are the non-executive directors (NEDs), executive directors and senior executive employees who have authority and responsibility for planning,
directing and controlling the activities of the Group. On that basis, the following roles / individuals are addressed in this report:
Non-executive directors Position
Mr Stuart Grimshaw Chairman and non-executive director
Audit and Risk Committee member (to 24 February 2017)
Nomination Committee Chairman (to 24 February 2017)
Mr Lachlan Given Non-executive director
Audit and Risk Committee member (appointed 1 August 2016, to 24 February 2017)
Mr Kevin Dundo Chairman of Audit and Risk Committee (to 24 February 2017)
Audit and Risk Committee member
Chairman of Remuneration Committee and Nomination Committee member (to 24 February
2017)
Ms Andrea Waters Non-executive director (appointed 9 February 2017)
Chair of Audit and Risk Committee (appointed 24 February 2017)
Remuneration and Nomination Committee member (appointed 24 February 2017)
Ms Ellen Comerford Non-executive director (appointed 9 February 2017)
Chair of Remuneration and Nomination Committee (appointed 24 February 2017)
Audit and Risk Committee member (appointed 24 February 2017)
Mr Reginald Webb Non-executive director (retired 14 February 2017)
Audit and Risk Committee member (retired 14 February 2017)
Remuneration Committee and Nomination Committee member (retired 14 February 2017)
Executive director
Mr Peter Cumins Managing Director (to 23 January 2017)
Executive Deputy Chairman (from 23 January 2017)
1. Letter from the Chair of the Remuneration and Nomination Committee
Dear Shareholders
We are pleased to present our FY 2017 Remuneration Report for Cash Converters International Limited.
The Board is focused on continuing to deliver improved performance and pursue growth plans to enhance value to shareholders. To do this the Board is
also committed to achieving a comprehensive remuneration framework that is focused on driving a performance culture and linking remuneration to the
achievement of the strategy and business objectives and ultimately generating improved returns for shareholders.
Financial performance during the year met expectations with a turnaround to achieve net profit after tax of $20.6 million despite the significant changes
to the business. Key aspects to this delivery include: strengthening our digital presence, broadening our personal finance product offering, striving to
achieve being the most compliant lender in our sector and achieving growth within the auto finance business.
This year, parallel with the turnaround in the Company’s financial performance, the Company has undertaken several strategic management changes in
relation to Key Management Personnel (KMP). The Company executed on succession plans to appoint Mr Mark Reid as Chief Executive Officer of the
Company overall (previously CEO Australia) effective 23 January 2017 and transition Mr Peter Cumins to the role of Executive Deputy Chairman focused
on international expansion. The Company has also expanded expertise in the executive leadership team with the addition of executive resources
across areas such as risk and compliance management, marketing and digital, distribution, operations, project management and people and culture
management – all considered key to delivering a continued and sustained improvement in value for shareholders.
The Board believes that it is essential to attract, engage and retain executives with appropriate competencies and capabilities. It is also essential
for remuneration to reflect the contributions made to the achievement of results. The Board will continue to review our remuneration governance
framework and remuneration strategy to strengthen the alignment between executive remuneration and outcomes for shareholders.
The Board continues to engage with key external stakeholders and seeks to respond to feedback as a critical part of the goal of improving linkages
between executive remuneration and returns to shareholders.
Over previous years, responsiveness to feedback has produced the following:
• Review and redesign of Remuneration Governance Framework policies and procedures.
• Redesign of Short Term Incentive (STI) and Long Term Incentive (LTI) plans to be more closely aligned to sustainable shareholder value creation.
• Improved disclosure of incentive plan design features.
• External remuneration benchmarking of KMP.
Key outcomes of execution of our remuneration governance framework and remuneration strategy during FY 2017 include the provision of:
• Expanded disclosure of the criteria under which the short-term incentive payments are awarded.
• Additional transparency on calculation of normalised financial metrics used in determining short-term incentive outcomes for FY 2017.
• Enhanced availability on our website of policies and procedures encompassed in our remuneration governance framework.
• Benchmarking of remuneration for the expanded KMP group.
Priorities for FY 2018 will look to include the further review and shaping of the total reward framework for KMP to ensure alignment with strategy and
long term value creation for shareholders.
The Board recognises that FY 2017 has seen significant changes and challenges for the Company and for shareholders. With improved financial
performance and having completed much of the transition to the new leadership team, the Board is confident that the organisation structure
and associated remuneration arrangements are an appropriate response to the Company’s circumstances and provide a solid foundation for the
continued improvement in performance and creation of shareholder value over the long term.
Yours faithfully,
Ellen Comerford
Chair, Remuneration and Nomination Committee
Remuneration Report (audited) (continued)
Directors’ reportFor the year ended 30 June 2017
—
26 | Cash Converters International Limited – Annual Report 2017 Cash Converters International Limited – Annual Report 2017 | 2726 | Cash Converters International Limited – Annual Report 2017
For
per
sona
l use
onl
y

The Company strengthened the calibre of the Board through the year and also addressed external stakeholders’ views in regard to board
composition, with the appointment of two new independent non-executive directors (NEDs), Ms Ellen Comerford and Ms Andrea Waters. This brings
the total number of directors to six with the number of NEDs to five, three of whom are considered independent. The focus of the Board has been
to continue to improve governance, oversight and compliance with policies and practices developed by the Company and to ensure continued
independent input on KMP remuneration decision-making processes.
The Board is focused on continuing the implementation of its renewed strategy and this involves significant transitioning from previous business
models and approaches. The successful delivery of this strategy requires strong leadership and additional capabilities in the leadership team. To
attract and retain the best possible talent to the leadership team, the Company needs to ensure its remuneration offering reflects the complex and
diverse nature of the business and the challenges facing the business to achieve its strategic objectives.
The Board has endorsed the addition to, and enhancement of, KMP resources with expertise across a range of key functions and disciplines,
including risk management, distribution, digital and marketing, technology, operations, project management and people and culture management,
to support the successful delivery of the strategic objectives of the Company. The following should be noted with regards to significant changes
in the executive team and structure:
• Corresponding with the Company’s current strategy, the long serving Managing Director, Mr Peter Cumins, is in the process of transitioning to an
Executive Deputy Chairman role, where he is focusing on growing the international franchising business. His successor, Mr Mark Reid, previously
the Chief Executive Officer – Australia, was appointed as Chief Executive Officer effective 23 January 2017. This process is expected to be
completed during FY 2018, with the incumbents, and the Board, taking a cautious and staged approach to ensure a successful transition that
preserves the core business built over time by Mr Cumins, while giving Mr Reid an opportunity to explore new business opportunities with the
support of his predecessor.
• Mr Ralph Groom, previously the Chief Financial Officer and Company Secretary, and Mr Glen Fee, Chief Information Officer, departed the
business in July 2017.
• Having been with the Company since 2013 in key roles both in Australia and United Kingdom, Mr Martyn Jenkins was appointed to the role of
Chief Financial Officer effective 3 July 2017.
• Mr Brad Edwards joined the Company on 6 June 2017 as General Counsel and was appointed as Company Secretary effective 30 June 2017.
• Additional members who have joined the executive team during FY 2017 or since the year end are Mr Nathan Carbone, Chief Risk Officer; Ms
Alice Manners, Chief Digital, Marketing and Product; Mr Sam Budiselik, Chief Operating Officer – Personal Finance; Mr Warren Willis, Head of
Transformational Change; Mr James Miles, Chief Technology Officer; and Ms Myrrhine Cutten, Chief Human Resources Officer.
Market capitalisation is one of the factors that influence external assessments of the appropriateness of remuneration, and it is understood that external
groups tend to see it as primary indication of the size and status of the Company, and the field in which the Company is competing for talent. In this
regard it is noted that the market capitalisation of the Company decreased from $211 million at the end of FY 2016 to approximately $155 million as at
the end of FY 2017. As a result of this, the remuneration packages being offered to some of the senior executives, may appear to be less well aligned
with market capitalisation at 30 June 2017, and related peers, than has been the case in previous reports. Given the additions to KMP during FY 2017
and since, the Company has undertaken internal benchmarking utilising data sourced from GRG Remuneration Guide 2017 and from AON Hewitt Data
Centre to review the remuneration packages for KMP to ensure alignment with its remuneration policy. Further benchmarking analysis will be conducted
in relation to overall remuneration during FY 2018.
3.2 Key remuneration matters identified and adjustments made or planned in response, since the previous report
During FY 2017 the following KMP remuneration-related matters were identified by the Board and are being considered and / or actioned during the reporting period and into FY 2018:• Opportunities to continue to improve remuneration governance and disclosure in relation to STI and LTI incentive arrangements as follows: – Disclosure of specific dollar values for the financial performance target measures and stretch / maximum STI where applicable. – Greater clarity on non-financial targets and individual key performance targets as they relate to STI awards. – Greater clarity of use of normalised financial metrics in the STI plan and how individual / non-financial measures are linked to value creation
for shareholders. – Transparency in the use of a normalised EPS vesting condition in the LTI plan and disclosure of those amounts excluded at the Board’s
discretion.
Senior Executives classified as KMP Position
Mr Mark Reid Chief Executive Officer – Australia (to 23 January 2017)
Chief Executive Officer (effective 23 January 2017)
Mr Martyn Jenkins Chief Operating Officer – Financial Services Australia (appointed 1 July 2016)
Chief Financial Officer (effective 3 July 2017)
Mr Shane Prior Chief Operating Officer – Stores
Mr Nathan Carbone (1) Chief Risk Officer (effective 1 July 2016)
Ms Alice Manners Chief Manager Digital, Marketing and Product (from 24 February 2017)
Mr Brad Edwards General Counsel (from 6 June 2017)
Company Secretary (effective 30 June 2017)
Mr Ralph Groom Chief Financial Officer (resigned 3 July 2017) and
Company Secretary (resigned 30 June 2017)
Mr Glen Fee Chief Information Officer (resigned 3 July 2017)
Mr Michael Cooke Group Legal Counsel (retired 31 August 2016)
Other appointments / changes that have occurred to the KMP during or since the end of the financial year are:
Mr Sam Budiselik (2) Chief Operating Officer – Personal Finance (became KMP 3 July 2017)
Ms Myrrhine Cutten Chief Human Resources Officer (became KMP 3 July 2017)
(1) Mr Carbone commenced working with the Company on 20 June 2016. In his role as Chief Risk Officer, he was KMP for the duration of the
financial year on a contract basis to 31 December 2016 and permanent from 1 January 2017.
(2) Mr Budiselik was previously KMP in 2016 and resigned effective 30 June 2016. Mr Budiselik worked with the Company in a consultant
capacity during 2017 and, with the appointment to the role of Chief Operating Officer – Personal Finance has become KMP in FY 2018.
3. Context of and changes to KMP remuneration for FY 2017 and into FY 2018
3.1 Matters identified as relevant context for remuneration governance in FY 2017 and into FY 2018
As is required by regulation, the KMP remuneration structures that are detailed in this report are those that prevailed over FY 2017.
The following outlines important context for the decisions that were made in relation to remuneration for / during FY 2017, the outcomes of which are
presented in this report. Those changes already made in respect of FY 2018 or anticipated to be implemented during the remainder of FY 2018 will
be commented on to the extent relevant to an evaluation of remuneration for FY 2017, with full details given as part of the FY 2018 Annual Report.
The Board has previously undertaken to make continuous improvements to remuneration governance, policies and practices applied to KMP of the
Company, as well as other employees, to ensure appropriateness to the circumstance of the Company as it evolves over time.
During FY 2016 and FY 2017 the Board sought and received feedback from both stakeholder and independent consultant views of KMP
remuneration governance and practices, including taking note of feedback from proxy advisors, and has sought to be responsive to that
feedback. The main themes are dealt with here.
Directors’ reportFor the year ended 30 June 2017
—Remuneration Report (audited) (continued)
Cash Converters International Limited – Annual Report 2017 | 2928 | Cash Converters International Limited – Annual Report 2017
For
per
sona
l use
onl
y

4.2 Remuneration and Nomination Committee Charter
The Remuneration and Nomination Committee Charter (the Charter) was reviewed and approved by the Board in May 2017. The Charter governs the operation of the Remuneration and Nomination Committee (the Committee). It sets out the Committee’s role and responsibilities, composition, structure and membership requirements. The purpose of the Committee, as it relates to remuneration, is to assist the Board by:• providing advice in relation to the remuneration packages of Senior Executives and NEDs, equity-based incentive plans and other employee benefit
programs;• developing and maintaining the policies and other documents that guide and govern KMP remuneration decisions, practices and outcomes;• determining and reviewing the nature of the Company’s disclosure or communication of remuneration practices and policies;• regularly reviewing the Company’s recruitment, retention and termination policies, superannuation arrangements, succession plans, and the
performance of the Board and Senior Executives; and• reviewing the Company’s diversity policy and monitoring diversity within the Company, including monitoring and appraising the size and
composition of the Board.
The Committee has the authority to retain outside legal or other professional advice or assistance on any matters within its terms of reference.
The Board recognises the importance of ensuring that any recommendations given to the Committee provided by remuneration consultants are provided independently of those to whom the recommendations relate. Further information about the parameters under which external remuneration consultants are engaged is provided in Section 4.11.
4.3 Senior Executive Remuneration Policy and Procedure
The Senior Executive Remuneration Policy and Procedure applies to Senior Executives who are defined as follows:• Executive Directors;• Chief Executive Officer (CEO);• Those roles classified as executive KMP; and• Executive Leadership Team (ELT) members who are the direct reports to the CEO – roles that are business unit, functional, or expertise heads
(who may or may not be KMP).
The policy outlines the Company’s intentions regarding Senior Executive remuneration, as well as how remuneration is intended to be structured, benchmarked and adjusted in response to changes in the circumstances of the Company, and in line with good governance.
Broadly the policy describes the following in relation to Senior Executives:
• Remuneration should be composed of: – Fixed Annual Reward (inclusive of salary, superannuation, allowances, benefits and any applicable fringe benefits tax (FBT)) (FAR); – STI which provides a reward for performance against annual objectives; – LTI which provides an equity-based reward for performance against indicators of shareholder benefit or value creation, over a three-year period; – In total the sum of the elements will constitute a total remuneration package (TRP).• Both internal relativities and external market factors should be considered.• Total remuneration packages should be structured with reference to market practices and the circumstances of the Company at the time.• FAR policy mid-points should be set with reference to P50 (the median or the middle) of the relevant market practice.• TRPs at Target (being the FAR plus incentive awards intended to be paid for targeted levels of performance) should be set with reference to P75
(the upper quartile, the point at which 75% of the sample lies below) of the relevant market practice so as to create a strong incentive to achieve targeted objectives in both the short and long term.
• Remuneration will be managed within a range so as to allow for the recognition of individual differences such as the calibre of the incumbent and the competency with which they fulfil a role (a range of +/- 20% is specified in line with common market practices).
• Termination benefits will generally be limited to the default amount allowed for under the Corporations Act (without shareholder approval).
• Remuneration of the Executive KMP: – During FY 2017, the transition strategy involved both the Managing Director and CEO Australia fulfilling the MD / CEO function of the Company,
consistent with the intention to smooth the impact of the change of management over a year or more. – The remuneration package for the CEO was adjusted in January 2017 taking into account additional responsibilities and benchmarking input
against the comparator at the P50 and in line with the Company’s Senior Executive Remuneration Policy. – During the year, various adjustments to remuneration have been made for some executive KMP in line with changes to roles and the new
senior leadership structure reporting to the CEO role. For some executives, this resulted in increases to remuneration packages to reflect the expanded scope, complexity or accountability of their roles. Other executive KMP who joined the Company during FY 2017 have been employed on terms believed to be consistent with policy and appropriate to attract the level of capabilities and expertise for the role.
– Having completed much of the transition to the new leadership team reporting to the CEO, the Board is confident that the current structure and associated remuneration arrangements is an appropriate response to the Company’s circumstances.
– Further benchmarking of KMP executives (including the Executive Deputy Chairman and CEO) is to be conducted in FY 2018 to evaluate the remuneration packages appropriate to the specific job responsibilities and ensure alignment with both strategy and shareholder interest and compliance with the Company’s remuneration policy.
• NED remuneration: – During FY 2017 no changes have been made to the remuneration received by non-executive directors and the Board will not be seeking an
increase to the aggregate fee limit (AFL) for NED remuneration (AFL $800,000 approved by shareholders at the Annual General Meeting 2015). – The Board recently reviewed the current remuneration levels for NEDS and believes that the levels are in line with remuneration policy.• Remuneration policies and procedures: – The Company has sought to improve shareholder engagement and provide further transparency by publishing its formal policies and
procedures as they relate to KMP remuneration, on the Company website, and feedback from shareholders regarding this material is welcome. – It is recommended that this material be considered as part of forming an opinion regarding the appropriateness of the remuneration practices of
the Company.• STI Financial Measures and Normalisation of financial metric calculations for incentive plans: – For FY 2018 and beyond, the Board is evaluating the financial measures used as part of the STI arrangements, currently normalised EBITDA. – Consideration will be given to utilising Net Profit after Tax as a financial measure as this is generally taken to be of greater interest to
shareholders.• Review of incentive plans: – Given the changes to the Senior Executive team and the evolution of the business strategy, both the STI and LTI remuneration policy will be
considered by the Board during FY 2018. – The Board aims to ensure incentive arrangements for KMP are designed appropriately to motivate enhanced and sustainable performance,
build on the risk culture, execute on strategy and ultimately increase shareholder value. – In order to do so, in FY 2018 the Board will review remuneration matters such as relativity of STI and LTI to total remuneration, and the
appropriateness of LTI vesting conditions in view of the Company’s current circumstances.
4. Overview of Cash Converters’ Remuneration Governance Framework and strategy
4.1 Transparency and engagement
The Board seeks input regarding the governance of KMP remuneration from a wide range of sources, including:• Shareholders;• Remuneration and Nomination Committee Members;• Stakeholder groups including proxy advisors;• External remuneration consultants (ERCs);• Other experts and professionals such as tax advisors and lawyers; and• Company management.
The following outlines a summary of Cash Converters’ formal Remuneration Governance Framework that has resulted from those engagements and related considerations.
The complete framework can be accessed on the Company’s remuneration governance portal at www.cashconverters.com/Governance/RemunerationCommittee, and a channel for direct feedback ([email protected]) is provided. Shareholders, proxy advisors and other interested parties are invited to consider this information as part of forming a judgement regarding the remuneration policies, procedures and practices of the Company.
Directors’ reportFor the year ended 30 June 2017
—Remuneration Report (audited) (continued)
Cash Converters International Limited – Annual Report 2017 | 3130 | Cash Converters International Limited – Annual Report 2017
For
per
sona
l use
onl
y

• The measurement period should be three years, noting that with annual grants of overlapping measurement periods, the need for longer periods
is mitigated (continuous improvement framework).
• Non-executive directors are not eligible to participate in the LTI Plan.
• Participants should be provided with an offer letter / invitation, an explanatory booklet and a copy of the LTIP Rules.
• There should be two measures of long-term performance, one that best reflects internal measures of performance and one that best reflects
external measures of performance (see Section 4.13 for indicators selected).
• A termination of employment will trigger a forfeiture of some or all the unvested rights held by an executive depending upon the circumstances of
the termination. Those that are not forfeited will be held for possible vesting, based on performance relative to the vesting conditions following the
end of the measurement period.
• The Board retains discretion to trigger or accelerate payment or vesting of incentives provided the limitation on termination benefits as outlined in
the Corporations Act is not breached.
4.7 Defining threshold, target and stretch for incentive purposes
In relation to the design, implementation and operation of incentives, the Board is of the view that there should, where possible, be a range of
performance and reward outcomes identified and defined. These should be set with regard to the elasticity of the measure, the impact of the
measure on shareholder value creation and the ability of Senior Executives to influence the measure. In order to create clarity and consistency, the
following concepts and principles are generally intended to the design of incentive scales:
• “Threshold”, being a minimum acceptable outcome for a “near miss” of the target, associated with a fraction of the target reward appropriate to
the threshold outcome (generally around 80% probability of achievement);
• “Target”, being a challenging but achievable outcome, and which is the expected outcome for a Senior Executive / team that is of high calibre
and high performing (generally 50% – 60% probability of achievement); and
• “Stretch” (the maximum) levels of objectives, which is intended to be a “blue sky” or exceptional outperformance, not expected to be achieved,
the purpose of which is to create a continuous incentive to outperform when outperformance of the Target has already been achieved (generally
10% – 20% probability of achievement). This is particularly important for shareholders to understand when comparing with other companies
whose maximum levels of incentives may be associated with a planned or target outcome.
Awards for outcomes between these levels should generally be scaled on a pro rata basis dependent on actual performances. This is intended to
provide a motivating opportunity to attain a reward, and to ensure that reward outcomes align with performance, under a range of circumstances.
It is recognised that there is a link between the budget setting culture of the Company and the setting of incentive hurdles. In this regard, the Board
is confident that budgets developed, and agreed to are sufficiently challenging but also achievable, given the circumstances of the Company at the
time of each budget.
4.8 Clawback policy
The Board currently holds the view that a clawback policy is not appropriate since the intention of such policies is to return funds to shareholders
in the case of an employee causing material misstatements in the financial reports of the Company. The cost and complexity of implementing
arrangements that would make it possible for the Company to recover such funds therefore outweigh any possible benefit.
4.9 Securities Trading Policy
The Company’s Securities Trading Policy sets out the guidelines for dealing in any type of Company securities by the Company’s KMP. It also
summarises the law relating to insider trading which applies to everyone, including to all Company employees as well as to KMP. Under the
current policy, KMP may only trade during a “trading window” (with some limited exceptions as set out in the policy). The following periods in
a year are “trading windows”, unless otherwise determined by the Board:
• 6 weeks commencing 24 hours immediately after the day of release of the half-yearly results announcement to the ASX Limited (ASX);
• 6 weeks commencing 24 hours immediately after the day of release of the yearly results announcement to the ASX *;
• 6 weeks commencing 24 hours immediately after the day of release of a disclosure document offering equity securities in the Company; or
• another date as declared by the Board in the circumstances that the Board is of the view that the market can reasonably be expected to be fully
informed on that date.
* the release of the yearly results announcement is determined by the Board as being the release of the audited Financial Report
The policy also outlines the procedure that should be undertaken to review Senior Executive remuneration and determine appropriate changes.
Changes to remuneration resulting from annual reviews are generally to be determined in relation to:
• external benchmarking;
• whether current remuneration for the incumbent is above or below the policy midpoint / benchmark – those below the midpoint will tend to
receive higher increases;
• the competence of the incumbent in fulfilling their role which determines their positioning within the policy range – higher calibre incumbents are
intended to be positioned higher in the range; and
• any changes to internal relativities related to role / organisation design that have occurred since the previous review.
4.4 Non-Executive Director Remuneration Policy and Procedure
The Non-Executive Director Remuneration Policy and Procedure applies to non-executive directors of the Company in their capacity as directors and
as members of committees, and may be summarised as follows:
• Remuneration may be composed of:
– Board fees;
– Committee fees;
– Superannuation;
– Other benefits; and
– Equity (if appropriate at the time, currently not applicable).
• Remuneration will be managed within the aggregate fee limit (AFL) or fee pool approved by shareholders of the Company;
• Guidelines regarding when the Board should seek adjustment to the AFL such as in the case of the appointment of additional NEDs;
• Remuneration should be reviewed annually;
• Termination benefits will not be paid to NEDs;
• A policy level of Board Fees (being the fees paid for membership of the Board, inclusive of superannuation and exclusive of committee fees) will
be set with reference to the P50 (median or middle) of the market of comparable ASX-listed companies;
• Committee fees may be used to recognise additional contributions made by members of committees to the work of the Board. The inclusion of
these fees should result in outcomes that, when combined with Board Fees, should cluster around the P50 of the market of comparable
ASX-listed companies;
• In relation to the Board Chair, a higher positioning in the market, such as P75, is appropriate for the Company.
The policy also outlines the procedure that should be undertaken to review non-executive director remuneration and determine appropriate changes.
4.5 Short-Term Incentive Policy and Procedure
The Short-Term Incentive Policy of the Company, since the commencement of the policy in FY 2016, is that an annual component of executive
remuneration should be at-risk and allow the Company to modulate the cost of employment to align with individual and Company performance while
motivating value creation for shareholders. Key aspects of the policy are as follows:
• Participants will include Senior Executives and other participants who may be invited from time to time.
• Non-executive directors are excluded from participation in the STI Plan.
• STI should be paid in cash unless deferral applies. The Board has the discretion to determine, as part of any offer, that upon calculation of the
awards some portion of achieved STI is to be deferred.
• A termination of employment will trigger a forfeiture of some or all of unearned STI entitlements depending upon the circumstances of the
termination. Amounts that are not forfeited will be tested and potentially paid based on actual performance during employment relative to target
performance to the end of the measurement period (i.e. pro rata).
• The Board retains discretion to trigger or accelerate payment or vesting of incentives provided the limitation on termination benefits as outlined in
the Corporations Act is not breached.
4.6 Long-Term Incentive Policy and Procedure
The Long-Term Incentive Policy of the Company, since the commencement of the policy in FY 2016, is that an annual component of remuneration of
executives should be at-risk and based on equity in the Company to ensure that executives hold a stake in the Company to align their interests with
those of shareholders and share risk with shareholders. Key aspects of the policy are as follows:
• The LTI should be based on Performance Rights that vest based on an assessment of performance against objectives.
Remuneration Report (audited) (continued)
Directors’ reportFor the year ended 30 June 2017
—
Cash Converters International Limited – Annual Report 2017 | 3332 | Cash Converters International Limited – Annual Report 2017
For
per
sona
l use
onl
y

Aspect Plan, Offers and Comments
Key Performance
Indicators (KPIs),
Weighting and
Performance Goals
FY 2017 Invitations
FY 2017 Invitations to participate in the STIP were based on a number of KPIs set for each executive,
summarised as follows and showing the weighting for target performance. Standards of performance are
presented later in this report.
Managing Director and Chief Executive Officer
• Normalised Group EBITDA – 60%
• Ensure the Company meets its obligations in relation to the Enforceable Undertaking – 15%
• Ensure the Company achieves its milestones as set out in its 3 year plan – 15%
• Individual Effectiveness – 10%
Chief Executive Officer of Australia
• Normalised Australian Divisional EBITDA – 40%
• Implement undertakings committed to under the Enforceable Undertaking & achieve the milestones that fall
within FY 2017 – 30%
• Implement the underwriting and collection efficiency gains identified in the 2016 financial services review – 10%
• Normalised Group EBITDA – 10%
• Individual Effectiveness – 10%
The KPI assessments are tailored to each executive to provide specific objectives relevant to their area of
responsibility and business unit, as well as shared objectives such as financial performance of the business
unit or Company set with reference to the annual budget for the financial year.
The KPI metrics for FY 2017 for Other Senior Executives were consistently grouped into key metrics including
Financial, Operations & Customer, and Risk & Compliance. Financial target metrics were based on normalised
Group consolidated and divisional EBITDA and accounted for a minimum weighting of the overall KPI result
of 45%. Refer to Section 7.2 dealing with incentive outcomes for the standards of performance that applied.
For the Executive Deputy Chairman and CEO, the Normalised EBITDA KPI is calculated according to the following scale:
Performance level % of Normalised EBITDA Budget % of Target STI award
Threshold 95% 50%
Target 110% 100%
Stretch / Maximum 140% 200%
Comments
The Board selected these measures as being those that are expected to drive economic profitability, and ultimately shareholder value creation over the long term, within a financial year period. One of the concerns expressed by external stakeholders in relation to the STIP was that little information was given regarding how individual / non-financial measures linked to value creation for shareholders. Such measures are selected as being linked to the execution of the Company’s current strategy, and relevant to each role. More detail is provided in this regard in the latter section of this report dealing with incentive outcomes for the reporting period. Refer Section 7.2.
Plan Gate & Board Discretion
For each Measurement Period the Board will have the discretion to either abandon the plan or adjust award payouts if the Company’s overall performance during the Measurement Period was substantially lower than expectations and resulted in significant loss of value for shareholders. A specified gate condition may apply to offers of STI such that no award will be payable in relation to any KPI if the gate condition is not met or exceeded.
FY 2017 Invitations
A gate of 90% of budget normalised EBITDA applied so that no STI would be payable if this condition was not met or exceeded.
4.10 Equity Holding Policy
The Board has previously seen an equity holding policy as unnecessary since KMP executives received a significant component of remuneration
in the form of equity and executive directors generally have had material equity holdings. The subject of share ownership by KMP will form part of
remuneration governance considerations in FY 2018.
4.11 Executive remuneration consultant engagement policy and procedure
The Company has adopted an executive remuneration consultant (ERC) engagement policy and procedure which is intended to manage the
interactions between the Company and ERCs, so as to ensure their independence and that the Remuneration and Nomination Committee will have
clarity regarding the extent of any interactions between management and the ERC. This policy enables the Board to state with confidence whether
or not the advice received has been independent, and why that view is held. The policy states that ERCs are to be approved and engaged by the
Board before any advice is received, and that such advice may only be provided to a non-executive director. Interactions between management and
the ERC must be approved, and will be overseen by the Remuneration and Nomination Committee when appropriate.
4.12 Variable executive remuneration – Short-term Incentive plan (STIP)
Aspect Plan, Offers and Comments
Purpose The STI Plan’s purpose is to give effect to an element of remuneration. This element of remuneration constitutes
part of a market competitive total remuneration package and aims to increase the commitment of Senior
Executives to deliver and outperform annual business plans, to align their interests with shareholders, reinforce
a performance culture and create a strong link between performance and reward, encourage a pursuit of
sustainable improvements in Group performance, encourage teamwork and co-operation among executive team
members and maintain a stable executive team by helping retain key talent. These objectives aim to be achieved
by a simple plan that rewards participants for performance relative to key performance indicators (KPIs) derived
from annual business plans.
Measurement Period The Company’s financial year (12 months).
Award Opportunities FY 2017 Invitations
The Managing Director (now Executive Deputy Chairman) was offered a target-based STIP equivalent to 50%
of Base Salary for Target performance, with a maximum / stretch opportunity of up to 93% of Base Salary.
The CEO of Australia (now Chief Executive Officer) was offered a target-based STIP equivalent to 50%
of Base Salary for Target performance, with a maximum / stretch opportunity of up to 80% of Base Salary.
The outgoing Chief Financial Officer and Company Secretary was offered a target-based STIP equivalent to 30%
of Base Salary for Target performance, with a maximum / stretch opportunity of up to 51% of Base Salary.
Other Senior Executives who are KMP were offered a target-based STIP in a range equivalent to 20 – 40%
of their Base Salary for Target performance.
Remuneration Report (audited) (continued)
Directors’ reportFor the year ended 30 June 2017
—
Cash Converters International Limited – Annual Report 2017 | 3534 | Cash Converters International Limited – Annual Report 2017
For
per
sona
l use
onl
y

Aspect Plan Rules, Offers and Comments
LTI Value The Board retains discretion to determine the value of LTI to be offered each year, subject to shareholder approval
in relation to Directors, when the Rights are to be settled in the form of a new issue of Company shares. The Board
may also seek shareholder approval for grants to Directors in other circumstances, at its discretion.
FY 2017 Invitations
In relation to the previous MD / CEO, Performance Rights with a Target value equivalent to 75% and a maximum /
stretch value of 150% of the Base Salary were granted. No additional grants have been made upon the change of
role to the Executive Deputy Chairman position.
The new CEO was offered Performance Rights with a Target value equivalent to 30% and a maximum / stretch
value of 60% of FAR eligible to be granted as part of his remuneration package for the role of CEO – Australia.
No additional grants have been made in relation to the change to the CEO role.
The outgoing CFO and Company Secretary was offered Performance Rights with a Target value equivalent to 50%
and a maximum / stretch value of 100% of the Base Salary eligible to be granted as part of his package for the role
of CFO and Company Secretary.
For other Senior Executives Performance Rights with a Target value equivalent to 5% and a maximum / stretch
value of 10% of the Base Salary were granted.
It is important to note that only around half of the grants are expected to vest (refer to definition of Target).
Comments
The number of LTI Rights to be granted is calculated with reference to the maximum / stretch LTI, divided by the Right
value (valued as ignoring vesting conditions). This produces a mathematically identical outcome to the following formula:
Number = Base package x Target LTI% x Tranche Weighting ÷ Right Value ÷ Target Vesting%
The equity-based rights value is the Share price at the time of the calculation (a VWAP calculation is used), less
the expected value of dividends that will not accrue to Right holders (Rights are not eligible to receive dividends).
This is equivalent to a Black-Scholes value ignoring any vesting conditions.
The Board sought and received shareholder approval in relation to the FY 2017 grant to the then Managing
Director at the 2016 AGM.
Measurement Period The Measurement Period will include three financial years unless otherwise determined by the Board (which would only apply in exceptional circumstances).
FY 2017 Invitations
The Measurement Period is from 1 July 2016 to 30 June 2019.
FY 2018 Invitations
The Measurement Period will be from 1 July 2017 to 30 June 2020.
Comments
Three-year Measurement Periods combined with annual grants will produce overlapping cycles that will promote a focus on producing long term sustainable performance / value improvement and mitigates the risk of manipulation and short-termism (continuous improvement). Because of the timing of grants, the life of the Right may be less than 3 years at times, however this does not impact the Measurement Period over which performance is measured.
Remuneration Report (audited) (continued)
Directors’ reportFor the year ended 30 June 2017
—
Aspect Plan, Offers and Comments
Award Determination and Payment
Calculations are performed following the end of the Measurement Period and the auditing of Company accounts. Awards will generally be paid in cash in the September following the end of the Measurement Period. They are to be paid through payroll with PAYG tax and superannuation deducted as appropriate. Deferral of STI is not a current component of the STI Plan on the basis that the mix of STI and LTI should be appropriately weighted, with overlapping measurement periods that mitigate the risk of short-termism.
Cessation of Employment During a Measurement Period
In the event of cessation of employment due to dismissal for cause, all entitlements in relation to the Measurement Period are forfeited.
In the event of cessation of employment due to resignation, all entitlements in relation to the Measurement Period are forfeited, unless the termination is classified as “Other” (good leaver) in the discretion of the Board (see below).
In the case of cessation of employment in other circumstances (good leaver) the award opportunity will be reduced proportionately to reflect the portion of the Measurement Period worked. The actual award earned will not be calculated until after end of the financial year, along with other participants. The Board retains discretion to trigger or accelerate payment or vesting of incentives in the case of a termination, provided that the limitations on termination benefits as outlined in the Corporations Act are not breached.
Change of Control In the event of a Change of Control, including a takeover, the Board may in its discretion decide to:• terminate the STIP for the Measurement Period and pay pro rata awards based on the completed proportion of
the Measurement Period and taking into account performance up to the date of the Change of Control, or• continue the STIP but make interim non-refundable pro rata Awards based on the completed proportion of the
Measurement Period and taking into account performance up to the date of the Change of Control, or• allow the STIP to continue.
Fraud, Gross Misconduct etc.
If the Board forms the view that a Participant has committed fraud, defalcation or gross misconduct in relation to the Company, then all entitlements in relation to the Measurement Period will be forfeited.
Clawback The Board currently holds the view that a clawback policy is not appropriate. Refer to Section 4.8 for discussion regarding this policy.
4.13 Variable executive remuneration – Long-Term Incentive Plan (LTIP) – Performance Rights Plan
Aspect Plan Rules, Offers and Comments
Purpose The LTI Plan’s purpose is to give effect to an element of Senior Executive remuneration. This element of
remuneration constitutes part of a market competitive total remuneration package and aims to ensure that
Senior Executives have commonly shared goals related to producing relatively high returns for Shareholders.
Other purposes of the LTI Plan is to assist Senior Executives to become Shareholders, provide a component of
remuneration to enable the Company to compete effectively for the calibre of talent required for it to be successful
and to help retain employees, thereby minimising turnover and stabilising the workforce such that in periods of
poor performance the cost is lesser (applies to non-market measures under AASB2).
Currently the Company operates a Rights plan for the purposes of the LTIP.
Form of Equity The current Rights plan includes the ability to grant:
a) Performance Rights, which are subject to performance related vesting conditions, for the purposes of the LTIP.
b) Retention Rights, which are subject to service related vesting conditions, (not currently used).
c) Deferred Rights which are not subject to vesting conditions but which are subject to disposal restrictions that
attach to the Shares that result from Rights being exercised (not currently used).
The LTIP is based on grants of Performance Rights. The Rights are Indeterminate Rights and confer the right
(following valid exercise) to the value of a Company Share at the time, either:
• Settled in Shares that may be issued or acquired on-market, or
• Settled in the form of cash,
at the discretion of the Board (a feature intended to ensure appropriate outcomes in the case of terminations).
No dividends accrue to unvested Rights, and no voting rights are attached.
Cash Converters International Limited – Annual Report 2017 | 3736 | Cash Converters International Limited – Annual Report 2017
For
per
sona
l use
onl
y

Aspect Plan Rules, Offers and Comments
Vesting Conditions
(continued)
Comments
The Board recognises that it is important that shareholders understand why the LTI vesting conditions selected
are appropriate to the circumstances of the Company, and therefore seeks to be transparent in this regard.
While the measure that has strongest alignment with shareholders is Total Shareholder Return (TSR), it is
recognised that absolute TSR is influenced by overall economic movements. Therefore grants of LTI will be
offered to executives that vest based on indexed TSR (iTSR) which removes market movements irrelevant to the
performance of the Company from assessments of the Company’s TSR performance and avoids windfall gains
from changes in broad market movements in share prices.
The internal measure of performance that is understood to be well accepted by stakeholders and which the Board
encourages management to focus on, is earnings per share (EPS), which will be assessed on a growth rate basis
against a vesting scale.
The Comparator Group for the assessment of the iTSR vesting conditions is the S&P / ASX All Ordinaries
Accumulation Index (abbreviated to XAOAI, also referred to as Total Return index). This group was selected
because it is the best indicator of broad economic sentiment and market movements, which are to be effectively
removed from the assessment of the Company’s TSR via the iTSR measure.
Retesting None of the grants made in respect of the reporting period included a retesting feature.
Plan Gate & Board
Discretion
FY 2017 Invitations
A gate of Company TSR being positive for the measurement period applied to both vesting conditions, before
performance against the vesting conditions is assessed to ensure that the LTI will not reward executives when
shareholders have lost value.
The Board retains discretion to adjust vesting outcomes in the circumstances that the outcomes from applying the
vesting scales alone would be likely to be seen as inappropriate.
Amount Payable for
Performance Rights
No amount is payable by participants for Performance Rights. The target value of Rights is included in
assessments of remuneration benchmarking and policy positioning. This is standard market practice and
consistent with the nature of Performance Rights.
Exercise of Vested
Performance Rights
Under the plan rules, vested Performance Rights are exercised automatically following vesting. Rights that are
not exercised, lapse. Exercised Rights will be satisfied in the form of ordinary Company shares, except where the
Board exercises its discretion to settle in the form of cash.
Disposal Restrictions etc. Rights may not be disposed of or otherwise dealt with while they remain Rights i.e. prior to exercise.
All shares acquired by Participants as a consequence of exercising vested Rights, shall be subject to a dealing
restriction (Restricted Shares) being that such Restricted Shares may not be disposed of or otherwise dealt with until:
a) The time specified by the Company’s securities trading policy with regards to when executives and directors
may deal in securities of the Company, and
b) The time at which dealing in securities of the Company is permitted under the Corporations Act having regard
to division 3 of Part 7.10 (insider trading restrictions).
Cessation of Employment In the event of cessation of employment in the circumstances of a bad leaver, all unvested Performance Rights
will be forfeited. In the case of Special Circumstances (good leaver) the grant of Performance Rights made in the
year of the termination will be pro rata forfeited for the period with remaining rights to be tested at the end of the
measurement period along with other participants. Other grants made in previous years will be unaffected by
the termination. The Board retains discretion to trigger or accelerate payment or vesting of Performance and / or
Retention Rights in the case of a termination of the employment of a Participant.
Aspect Plan Rules, Offers and Comments
Vesting Conditions The Board has discretion to set vesting conditions for each offer. Performance Rights that do not vest will lapse.
FY 2017 Invitations
Except as indicated below, a participant must remain employed by the Company during the Measurement Period and the performance conditions must be satisfied for Rights to vest.
The FY 2017 Invitations included:• a tranche (50% weighting) with a total shareholder return (TSR) vesting condition, based on indexed TSR (iTSR),
and• a tranche (50% weighting) with normalised earnings per share compound annual growth (NESPG) vesting
condition, as follows:
Tranche 1
Performance level Cash Converters International’s TSR as % XAOAI TSR for the
Measurement Period
% of Tranche Vesting
Stretch ≥200% 100%
> Target % < Stretch > 150% & <200% Pro rata
Target 150% 50%
> Threshold >100% & <150% Pro rata
Threshold 100% 25%
< Threshold <100% Nil
Tranche 2
Performance level Cash Converters International’s Normalised Earnings Per Share Compound Annual Growth Rate
% of Tranche Vesting
Stretch ≥20% 100%
> Target % < Stretch > 16% & <20% Pro rata
Target 16% 50%
> Threshold >12% & <16% Pro rata
Threshold 12% 25%
< Threshold <12% Nil
Normalised EPS will relate to normal operations and will exclude abnormal items as determined by the Board in its discretion. See Section 7.3 for further details in regard to normalisation.
Remuneration Report (audited) (continued)
Directors’ reportFor the year ended 30 June 2017
—
Cash Converters International Limited – Annual Report 2017 | 3938 | Cash Converters International Limited – Annual Report 2017
For
per
sona
l use
onl
y

5.1 Planned executive remuneration at target
FAR Target STI opportunity Target LTI opportunity Total Target
Remuneration
Package
(TRP)Amount
% of
TRP
% of
FAR
STI
amount
% of
TRP
% of
FAR
LTI
amount
% of
TRP
$ % % $ % % $ % $
Mr P Cumins 864,618 45% 48% 416,993 22% 72% 625,489 33% 1,907,100
Mr M Reid* 495,517 63% 29% 145,351 19% 28% 139,465 18% 780,333
Mr M Jenkins 280,633 76% 27% 75,000 21% 4% 12,500 3% 368,133
Mr S Prior 292,933 73% 33% 97,920 24% 4% 12,240 3% 403,093
Mr N Carbone 321,308 89% 12% 39,000 11% 0% – 0% 360,308
Mr R Groom 435,802 57% 29% 126,880 17% 46% 201,620 26% 764,302
Mr G Fee 322,665 88% 9% 29,203 8% 5% 14,602 4% 366,470
* Mr Reid’s stated FAR reflects his contract as at 1 July 2016. The FAR was amended upon change of role effective 23 January 2017 with an increase from $495,517 to $620,633 and STI target increased to 50%.
The above table only includes those KMP who were eligible for STIs and LTIs during the year. KMP employed after 1 January 2017 were not eligible
for participation in STIP.
5.2 Planned executive remuneration at maximum
FAR Maximum STI opportunity Maximum LTI opportunity
Total Maximum
Remuneration
Package (TRP)Amount
% of
TRP
% of
FAR
STI
amount
% of
TRP
% of
FAR
LTI
amount
% of
TRP
$ % % $ % % $ % $
Mr P Cumins 864,618 30% 89% 771,436 27% 145% 1,250,978 43% 2,887,032
Mr M Reid* 495,517 48% 53% 261,632 25% 56% 278,930 27% 1,036,079
Mr M Jenkins 280,633 74% 27% 75,000 20% 9% 25,000 6% 380,633
Mr S Prior 292,933 70% 33% 97,920 24% 8% 24,480 6% 415,333
Mr N Carbone 321,308 89% 12% 39,000 19% 0% – 0% 360,308
Mr R Groom 435,802 41% 49% 215,693 21% 93% 403,239 38% 1,054,734
Mr G Fee 322,665 84% 9% 29,203 8% 9% 29,203 8% 381,071
* Mr Reid’s stated FAR reflects his contract as at 1 July 2016. The FAR was amended upon change of role effective 23 January 2017 with an increase from $495,517 to $620,633 and STI target increased to 50%.
The above table only includes those KMP who were eligible for STIs and LTIs during the year. KMP employed after 1 January 2017 were not eligible
for participation in STIP.
6. Vested / awarded incentives and remuneration outcomes for KMP in respect of the completed FY 2017 period
(non-statutory disclosure)
The statutory disclosure requirements and accounting standards make it difficult for shareholders to obtain a clear understanding of what the actual
remuneration outcomes for executives were in relation to a given reporting period. It should be noted that typically STI for a reporting period is
paid after the end of the financial year / reporting period, following audit, and that LTI vesting is similarly delayed. The following table brings these
outcomes back to the year of performance to which the outcome relates, and which is the reporting period i.e. STI is presented as being part of the
remuneration for the year in which performance was tested, and LTI would be presented as being part of the remuneration for the year during which
performance testing was completed.
Aspect Plan Rules, Offers and Comments
Change of Control
of the Company
If in the opinion of the Board a change of control event has occurred, or is likely to occur, the Vesting Conditions
attached to the Tranche at the time of the Offer will cease to apply and:
a) unvested Performance Rights granted in the financial year of the Change of Control will lapse in the proportion
that the remainder of the financial year bears to the full financial year,
b) all remaining unvested Performance Rights will vest in accordance with the application of the following formula
(noting that negative results will be taken to be nil):
Number of Performance
Rights to Vest=
Unvested Performance Rights
x (Share Price at the Change of Control – Offer Share Price)
÷ Offer Share Price
a) any unvested Performance Rights than do not vest in relation to (b) will lapse unless otherwise determined
by the Board,
b) all unvested Retention Rights will vest, and
c) disposal restrictions applied to Deferred Rights by the Company and specified as part of the terms of the LTI
will be lifted (including the removal of any Company initiated CHESS holding lock if applicable), unless otherwise
determined by the Board and participants notified in writing.
Clawback The Board currently holds the view that a clawback policy is not appropriate. Refer to Section 4.8 for discussion
regarding this policy.
5. Planned executive remuneration for FY 2017 (non-statutory disclosure)
The disclosures required under the Corporations Act (including regulations) and prepared in accordance with applicable accounting standards do not
necessarily provide shareholders with an understanding of the intended remuneration in a given year. For example, the LTI disclosed is not reflective
of the remuneration opportunity for the year being reported on, due to the requirements of AASB 2. Therefore, the following table is provided to
ensure that shareholders have an accurate understanding of the Board’s intention regarding the remuneration offered to executives during FY 2017,
as at target performance, to facilitate an assessment of the alignment between performance and reward. In this regard, the definition of Target needs
to be considered, as provided in this report. Generally, there are opportunities for incentives to exceed the target levels outlined here, as discussed in
the relevant sections, however stretch / maximum incentives are designed to be unlikely to occur.
The incentive levels presented are based on the policy at the time of determining remuneration for the year, and in the case of LTI, translated into
a number of rights at the time of the grant calculation.
Remuneration Report (audited) (continued)
Directors’ reportFor the year ended 30 June 2017
—
Cash Converters International Limited – Annual Report 2017 | 4140 | Cash Converters International Limited – Annual Report 2017
For
per
sona
l use
onl
y

7. Performance outcomes for FY 2017 including STI and LTI assessment
7.1 Company performance
Financial performance during the year met expectations despite the significant changes to the business and its circumstances delivering a profit
of $20.618 million for FY 2017 up from a loss of $5.272 million in FY 2016. Key aspects to this delivery include strengthening our digital presence,
broadening our personal finance product offering, striving to achieve being the most compliant lender in our sector, and achieving growth within the
auto finance business.
During the reporting period the Company has delivered on a number of key objectives:
• Successful launch of new Medium Amount Credit Contract (MACC) loan products
• Growth of the Green Light Auto finance business
• Growth in retail and pawn broking revenues
• UK operations returned to profitability
• Expanded leadership team, bringing new insights and capabilities
• New electronic assessing platform to improve compliance and adherence to responsible lending requirements
• Fulfilment of Enforceable Undertaking requirements
The following outlines the performance of the Company over the year ended 30 June 2017 and the previous four financial years in accordance with
the requirements of the Corporations Act:
Year ended 30 June
2017 2016 2015 2014 2013$’000 $’000 $’000 $’000 $’000
Revenue from continuing operations 271,473 311,599 288,666 331,669 272,723
Net profit before tax from continuing
operations 28,198 31,171 3,855 32,040 47,664
Net profit / (loss) after tax
– continuing operations 20,618 25,894 (1,255) 21,132 32,870
– discontinued operations – (31,166) (20,430) – –
Profit / (loss) after tax 20,618 (5,272) (21,685) 21,132 32,870
Share price cents cents cents cents cents
– beginning of year 43.5 70.0 108.0 107.0 64.5
– end of year 31.5 43.5 70.0 108.0 107.0
Dividend (i)
– interim – 2.00 2.00 2.00 2.00
– final dividend – 1.00 – 2.00 2.00
Earnings per share from continuing
and discontinued operations
– basic 4.21 (1.09) (4.69) 5.67 8.09
– diluted 4.12 (1.09) (4.69) 5.56 7.92
(i) Franked to 100% at 30% corporate income tax rate.
Remuneration Report (audited) (continued)
Directors’ reportFor the year ended 30 June 2017
—
Name & role Year FAR
Total STI
awarded following
completion of
financial year
(cash and equity) (i)
Value of LTI vested
following completion
of measurement
period / financial
year (ii)
Total
remuneration
package
(TRP)
Gain / loss on
vested LTI from
change in value
during vesting
period (iii)
$
% of
TRP $
% of
TRP $
% of
TRP $ $
Mr P Cumins
Executive Deputy
Chairman
Managing Director
2017
2016
874,942
864,246
71%
100%
364,875
–
29%
0%
–
–
0%
0%
1,239,818
864,246
–
–
Mr M Reid
Chief Executive Officer 2017 ^550,923 66% *285,046 34% – 0% 835,969 –
Chief Executive
Officer – Australia 2016 #323,825 87% 47,500 13% – 0% 371,325 –
Mr M Jenkins
Chief Operating
Officer – Personal Finance
General Manager – UK
2017
2016
278,318
296,012
79%
86%
75,833
50,000
21%
14%
–
–
0%
0%
354,151
346,012
–
–
Mr S Prior
Chief Operating
Officer – Stores
2017
2016
292,933
287,453
86%
87%
39,168
41,500
12%
13%
8,143
–
2%
0%
340,244
328,953
(5,466)
–
Mr N Carbone
Chief Risk Officer
N/A
2017
2016
~321,308
–
89%
0%
39,000
–
11%
0%
–
–
0%
0%
360,308
–
–
–
Mr R Groom
Chief Financial Officer
& Company Secretary
2017
2016
447,865
432,367
80%
100%
38,064
–
7%
0%
73,446
–
13%
0%
559,375
432,367
(49,296)
–
Mr G Fee
Chief Information
Officer
2017
2016
321,639
320,688
91%
92%
16,062
28,631
4%
8%
16,286
–
5%
0%
353,987
349,319
(10,931)
–
(i) This is the value of the total STI award calculated following the end of the Financial Year
(ii) This is the value as at time of the calculation of the grant of the LTI (using a Right value of $0.96) that vested in relation to the completion of
the specified financial year, noting that vesting is determined and occurs following the end of the Measurement Period i.e. number that vested
multiplied by the undiscounted Right Value
(iii) This is the number of LTI Rights that vested following the completion of the Financial Year, multiplied by the closing Share Price on the date of
vesting (being $0.315), less the grant value ^ Remuneration adjusted 23 January 2017 from FAR $495,517 to $620,633
* Includes $35,625 ex gratia payment during FY 2017 # Part year employment from 2 November 2015 to 30 June 2016 ~ Based on contract role from 1 July 2016 to 31 December 2016 and permanent role from 1 January 2017 to 30 June 2017
Details regarding the assessments of performance that gave rise to the incentive outcomes for FY 2017 are given below.
Cash Converters International Limited – Annual Report 2017 | 4342 | Cash Converters International Limited – Annual Report 2017
For
per
sona
l use
onl
y

Name & role FY 2017 KPI summary
Award outcomes FY 2017,
paid FY 2018
KPI summary
Weighting % Threshold Target Stretch
Target award
$ AchievementAwarded
$
Total STI award
$
Mr P CuminsExecutive DeputyChairman
Normalised Group EBITDA
60% 95% budget
110% budget
140% budget
250,200 100% 250,196
364,875Operational objectives
30% Pro rata Achieved Achieved 125,100Partially
achieved 93,825
Individual effectiveness
10%Meets
expectationsAbove
expectationsOutstanding 41,700
Meets expectations 20,850
Mr M Reid (1)Chief Executive Officer
Normalised Australian EBITDA
40% 95% budget
110% budget 140% budget 105,020 100% 105,020
249,420
Operational objectives
40% Pro rata Achieved Achieved 105,020 Achieved105,050
Individual effectiveness
10%Meets
expectationsAbove
expectationsOutstanding 26,255
Meets expectations 13,125
Group normalised EBITDA
10%95%
budget110%
budget140%
budget26,255 Achieved
26,255
Mr M JenkinsChief Operating Officer – Financial Services Australia
Normalised Group and Australian
EBITDA
63% N/A 110% N/A
75,833 100% 75,833 75,833
Operational objectives
27% N/A Achieved N/A
Behaviours 10% N/A Achieved N/A
Mr S PriorChief Operating Officer – Stores
Normalised Divisional and
Australian EBITDA
45% N/A 110% N/A
97,920 40% 39,168 39,168Operational objectives
45% N/A Achieved N/A
Behaviours 10% N/A Achieved N/A
Mr N Carbone (2)Chief Risk Officer
Normalised Divisional and
Australian EBITDA
45% N/A 110% N/A
39,000 100% 39,000 39,000Operational objectives
45% N/A Achieved N/A
Behaviours 10% N/A Achieved N/A
The table below sets out the comparison between Cash Converters internal targets set by the Company compared to actual performance for the
key performance metrics that are the main drivers of incentive outcomes in FY 2017. This gives some indication of a correlation between planning
and outcomes.
Year ended 30 June Actual EBITDA Budgeted EBITDA$’000 $’000
2017 45,725 44,210
2016 47,697 73,969
For FY 2017, the normalised EBITDA result, for the purpose of incentive plan calculation, was $49.108 million. Refer to Section 7.3 for information on
normalisation adjustments.
7.2 Links between performance and reward including STI and LTI determination
The remuneration of executive KMP is intended to be composed of three parts as outlined earlier, being:
• FAR, which is not intended to vary with performance but which tends to increase as the scale of the business increases (i.e. following success),
• STI, which is intended to vary with indicators of annual Company and individual performance, and
• LTI, which is intended to deliver a variable reward based on long-term measures of Company performance.
Short Term Incentives
The Board believes there are strong links between internal measures of Company performance and the payment of short-term incentives. The STI
achieved in relation to the FY 2016 period, was paid during the FY 2017 period in September 2016. As a result of the FY 2016 full year result being
below expectations, only a small number of individual and operational STI payments were made and, as previously reported, on average equated to
12% of the maximum award opportunity.
The STI achieved in relation to the FY 2017 period being completed will be paid after the end of the period (i.e. during FY 2018, usually in September).
On average 78.4% of the target award opportunity or 47.3% of the maximum award opportunity available was paid. This level of award was considered
appropriate under the STI plan since the objectives were set and offers made in relation to the achievement of each KPI at the beginning of the financial
year, and the majority of those objectives were met.
In relation to the completed FY 2017 period the payment of STI was calculated as follows:
Remuneration Report (audited) (continued)
Directors’ reportFor the year ended 30 June 2017
—
Cash Converters International Limited – Annual Report 2017 | 4544 | Cash Converters International Limited – Annual Report 2017
For
per
sona
l use
onl
y

In relation to the completion of the FY 2017 reporting period, previous grants of equity made under the previous LTI plan vested in relation to
grants that were made on 25 September 2014 (Tranche 12) i.e. vesting during FY 2018 in relation to the performance period completed during
FY 2017. This Tranche 12 is the last of the grants made under the previous LTI plan, which has been replaced with the existing LTI plan approved
by shareholders in November 2015.
The vesting conditions of Tranche 12 and performance against the conditions is as follows:
• The executive’s responsible entity / division achieving budgeted Net Profit After Tax for the financial year ended 30 June 2017.
The responsible entity for Mr Groom and Mr Fee is the consolidated Group of Cash Converters International Limited.
Budgeted Net Profit After Tax for year ended 30 June 2017 for the Company was $20.333 million.
Actual Net Profit After Tax for year ended 30 June 2017 for the Company was $20.618 million.
The responsible entity / division for Mr Prior is Corporate Stores – Australia.
Budgeted Net Profit After Tax for the year ended 30 June 2017 for Corporate Stores – Australia division was $5.456 million.
Actual Net Profit After Tax for the year ended 30 June 2017 for Corporate Stores – Australia division was $5.519 million.
• Continuous employment through to vesting determination date, being 1 July 2017.
Only those participants who were employed by the Company on 1 July 2017 were deemed eligible.
Having reviewed the performance against vesting conditions and noting that the conditions had been met, the Board approved the vesting
of performance rights under Tranche 12 as follows:
Name Tranche Grant date
Rights eligible
to vest during
FY 2018
for FY 2017
completion
% of grant
vested Rights vested
Grant date
value *
Value of LTI
that vested
(at grant date
VWAP)
Number Number $ $
Mr S Prior 12 24 Sep 2014 8,500 100% 8,500 0.96 8,143
Mr R Groom 12 24 Sep 2014 76,666 100% 76,666 0.96 73,446
Mr G Fee 12 24 Sep 2014 17,000 100% 17,000 0.96 16,286
Total 102,166 102,166 97,875
*Performance rights were valued using a binomial option pricing model.
7.3 Impact of normalisation on incentives
The Board recognises that the use of normalisation to adjust indicators of profitability has been an issue of concern to some external stakeholders in
recent years, particularly with regards to the calculation of incentive outcomes. It is important that there is transparency regarding this practice and
the rationale for its use, and therefore the following information is provided in this regard.
The Board sees it as appropriate to apply normalisation to profit measures for the purposes of incentive calculation so as to ensure that the right
behaviours are motivated, and inappropriate behaviours are not motivated, in respect of the profit calculation. Generally, adjustments will be balanced
so that the impact of normalisation is not skewed to create advantage e.g. if the cost of the acquisition of a new business is excluded, the revenue
from the business unit will also be excluded. The Board has discretion to determine which adjustments will be appropriate given the circumstances,
and business plans, and the following summarises where / how the Board exercised its discretion in relation to FY 2017 and FY 2016 outcomes:
Name & role FY 2017 KPI summary
Award outcomes FY 2017,
paid FY 2018
KPI summary
Weighting % Threshold Target Stretch
Target award
$ AchievementAwarded
$
Total STI award
$
Mr R GroomChief Financial Officer & Company Secretary
Normalised Group EBITDA
60% 95% budget 110% budget 140% budget 76,128 50% 38,064
38,064Operational objectives
30% N/A Achieved Achieved 38,064 – –
Individual effectiveness
10%Meets
expectationsAbove
expectationsOutstanding 12,688 – –
Mr G FeeChief Information Officer
Normalised Divisional and
Australian EBITDA
45% N/A 110% N/A
29,203 55% 16,065 16,065Operational
objective45% N/A Achieved N/A
Operational effect 10% N/A Achieved N/A
(1) Pro rata during FY 2017 for change of role / salary effective 23 January 2017
(2) Pro rata during FY 2017 based on 6 months contract (target 10%) from 1 July 2016 and permanent from 1 January 2017 (target 20%)
The KPIs selected were based on them reflecting and linking to the most significant matters expected to contribute to the success of the Company
during FY 2017 in the case of each role. As previously outlined in this report, the KPI Metrics for FY 2017 for Other Senior Executives were tailored
to specific objectives relevant to role and shared objectives of financial performance of the relevant business unit and Company set with reference
to the annual budget for the financial year. The KPIs were consistently grouped into key metrics including Financial, Operations & Customer, and
Risk & Compliance. Financial target metrics were based on normalised Group consolidated and divisional EBITDA and accounted for a minimum
weighting of the overall KPI result of 45%.
Following the end of the Measurement Period (the financial year), the Company accounts were audited and reports on the Company’s activities
during the year were prepared for the Board. The Board then assessed the extent to which target levels of performance had been achieved in
relation to each KPI and used the pro-rata scales (for non-binary measures) to calculate the total award payable. This method of performance
assessment was chosen because it is the most objective approach to short term incentive governance, and reflective of market best practices.
As part of implementing the STI plan in FY 2016, the Board formed the view that normalised Group EBITDA, divisional EBITDA and strategy
implementation, particularly in areas of risk and compliance and operations and customer services are the key short-term drivers of long term value
creation for shareholders. Responding to shareholder feedback, and as noted elsewhere, the Board is considering using net profit after tax as a
financial metric for FY 2018. The matter of normalisation is addressed below.
During FY 2017 the Board exercised its discretion to increase the awarding of STI for Mark Reid by making an ex gratia payment of $35,625 in line
with the addition to responsibilities and achievements thereon.
Long Term Incentives
In FY 2017 grants of equity were made to executive KMP in relation to the LTI Plan as part of remuneration for FY 2017, but did not vest due to the
presence of the long-term measurement period and vesting conditions that are yet to be completed / assessed. Details are given elsewhere in this
report in relation to changes in equity interests.
Previous grants of equity made under the previous LTI plan (Tranches 2, 9 and 11) did not vest during FY 2017 due to the financial performance of
FY 2016 year and vesting conditions not being met.
Directors’ reportFor the year ended 30 June 2017
—Remuneration Report (audited) (continued)
Cash Converters International Limited – Annual Report 2017 | 4746 | Cash Converters International Limited – Annual Report 2017
For
per
sona
l use
onl
y

8. Changes in KMP-held equity
The following tables outline the changes in equity held by KMP over the financial year.
Fully paid ordinary shares of Cash Converters International Limited
Balance at
1 July 2016
Granted as
remuneration
Received
on exercise
of options
Net other
change
Balance at
30 June 2017
Number Number Number Number Number
Directors
Mr P Cumins 10,513,030 – – (2,937,336) 7,575,694
Mr S Grimshaw – – – – –
Mr L Given – – – – –
Mr K Dundo – – – – –
Ms A Waters (1) – – – – –
Ms E Comerford (1) – – – – –
Mr R Webb (2) 1,012,500 – – – 1,012,500
Other key management personnel
Mr M Reid – – – – –
Mr M Jenkins 3,375 – – – 3,375
Mr S Prior – – – – –
Mr N Carbone (1) – – – – –
Ms A Manners (1) – – – – –
Mr B Edwards (1) 84,511 – – – 84,511
Mr R Groom 249,525 – – (249,525) –
Mr G Fee 102,000 – – (90,000) 12,000
Mr M Cooke (2) – – – – –
11,964,941 – – (3,276,861) 8,688,080
(1) Opening balance at date of appointment
(2) Closing balance at date of resignation
FY 2017 net adjustments – $3.383 million
• Legal expenses (excess to budget class action legal costs).
• Risk and Compliance Project costs (excess to budget one off costs associated with EU remediation).
• Restructuring costs related to operating efficiency projects and permanent ongoing reduction in annual expenses.
• Portion of 2016 incentive and other payments expensed but not utilised and released to FY 2017 result.
FY 2016 net adjustments – nil
• No adjustments made.
7.4 Links between Company strategy and remuneration
The Company intends to attract the superior talent required to successfully implement the Company’s strategies at a reasonable and appropriately
variable cost by:
• positioning FAR (the fixed element) around relevant market data benchmarks when they are undertaken, and
• supplementing the FAR with at-risk remuneration, being incentives that motivate executive focus on:
– short to mid-term objectives linked to the strategy via KPIs and annual performance assessments, and
– long term value creation for shareholders by linking a material component of remuneration to those factors that shareholders have expressed
should be the long-term focus of executives and the Board.
To the extent appropriate, the Company links strategic implementation and measures of success of the strategy, directly to incentives in the way that
measures are selected and calibrated.
Directors’ reportFor the year ended 30 June 2017
—Remuneration Report (audited) (continued)
Cash Converters International Limited – Annual Report 2017 | 4948 | Cash Converters International Limited – Annual Report 2017
For
per
sona
l use
onl
y

Performance rights of Cash Converters International Limited
Balance at
1 July 2016
Granted as
remuneration
Options /
rights exercised
Options lapsed
/ forfeited
Balance at
30 June 2017
Number Number Number Number Number
Directors
Mr P Cumins 3,730,000 4,572,920 – – 8,302,920
Mr S Grimshaw – – – – –
Ms A Waters (1) – – – – –
Ms E Comerford (1) – – – – –
Mr L Given – – – – –
Mr K Dundo – – – – –
Mr R Webb – – – – –
Other key management personnel
Mr M Reid 844,440 1,035,220 – – 1,879,660
Mr M Jenkins 523,200 106,904 – – 630,104
Mr S Prior 90,518 100,548 – – 191,066
Mr N Carbone (1) – – – – –
Ms A Manners (1) – – – – –
Mr B Edwards (1) – – – – –
Mr R Groom 1,305,226 1,506,120 – (1,413,600) 1,397,746
Mr G Fee 107,552 111,012 – (104,192) 114,372
Mr M Cooke (2) – – – – –
6,600,936 7,432,724 – (1,517,792) 12,515,868
(1) Opening balance at date of becoming member of KMP
(2) Closing balance at date of resignation
Balance at
1 July 2015
Granted as
remuneration
Received
on exercise
of options
Net other
change
Balance at
30 June 2016
Number Number Number Number Number
Directors
Mr P Cumins 10,313,030 – – 200,000 10,513,030
Mr S Grimshaw – – – – –
Mr R Webb 1,012,500 – – – 1,012,500
Mr L Given – – – – –
Mr K Dundo – – – – –
Other key management personnel
Mr R Groom 19,525 – 230,000 – 249,525
Mr M Reid (1) – – – – –
Mr G Fee 51,000 – 51,000 – 102,000
Mr M Jenkins – – – 3,375 3,375
Mr M Cooke – – – – –
Mr S Prior (1) – – 8,500 (8,500) –
Mr S Budiselik (1) – – – – –
Mr I Day (2) – – 200,000 – 200,000
11,396,055 – 489,500 194,875 12,080,430
(1) Opening balance at date of becoming member of KMP
(2) Closing balance at date of resignation
Directors’ reportFor the year ended 30 June 2017
—Remuneration Report (audited) (continued)
Fully paid ordinary shares of Cash Converters International Limited (continued)
Cash Converters International Limited – Annual Report 2017 | 5150 | Cash Converters International Limited – Annual Report 2017
For
per
sona
l use
onl
y

Terms and conditions of share-based payment arrangements affecting remuneration of KMP in the current or future financial years is set out below:
There has been no alteration of the terms and conditions of the above share-based payment arrangements since the grant date.
The following table outlines the value of equity granted to KMP during the year that may be realised in the future:
Tranche Grant date
Grant date
fair value (i)
Exercise
price
Expiry
date
Vesting
date
$ $
Tranche 12 (ii) 25 Sep 2014 0.96 – 01 Jul 2017 01 Jul 2017
Tranche 13 18 Nov 2015 0.23 – 30 Jun 2018 30 Jun 2018
Tranche 14 18 Nov 2015 0.41 – 30 Jun 2018 30 Jun 2018
Tranche 15 28 Jan 2016 0.26 – 30 Jun 2018 30 Jun 2018
Tranche 16 28 Jan 2016 0.45 – 30 Jun 2018 30 Jun 2018
Tranche 17 23 Nov 2016 0.20 – 30 Jun 2019 30 Jun 2019
Tranche 18 23 Nov 2016 0.31 – 30 Jun 2019 30 Jun 2019
Tranche 19 12 Dec 2016 0.17 – 30 Jun 2019 30 Jun 2019
Tranche 20 12 Dec 2016 0.29 – 30 Jun 2019 30 Jun 2019
(i) The grant date fair value is calculated as at the grant date using a Monte Carlo pricing model for tranches 13, 15, 17 and 19 and a binomial
pricing model for other tranches.
(ii) Tranche 12 is the last existing tranche under the previous LTI plan. The vesting date was previously incorrectly reported in the FY 2016 annual
report as 15 September 2017.
Name Tranche Number of rights Value at grant
Value expensed
in current year
Value to be
expensed in
future years
Per right
$
Total
$ $ $
Mr P Cumins 17 2,286,460 0.20 448,832 103,577 345,255
18 2,286,460 0.31 712,415 164,404 548,011
Mr M Reid 19 517,610 0.17 89,805 19,313 70,492
20 517,610 0.29 151,494 32,579 118,915
Mr M Jenkins 19 53,452 0.17 9,274 1,994 7,280
20 53,452 0.29 15,644 3,364 12,280
Mr S Prior 19 50,274 0.17 8,723 1,876 6,847
20 50,274 0.29 14,714 3,164 11,550
Mr R Groom (i) 19 251,020 0.17 43,552 28,098 15,454
20 251,020 0.29 73,469 47,399 26,070
Mr G Fee (i) 19 18,502 0.17 3,210 2,071 1,139
20 18,502 0.29 5,415 3,494 1,921
Total 6,354,636 1,576,547 411,333 1,165,214
(i) Pro rata value expensed for Mr Groom and Mr Fee given their departure from the Company in July 2017
Balance at
1 July 2015
Granted as
remuneration
Options /
rights exercised
Options lapsed
/ forfeited
Balance at
30 June 2016
Number Number Number Number Number
Directors
Mr P Cumins 6,000,000 3,730,000 – (6,000,000) 3,730,000
Mr S Grimshaw – – – – –
Mr R Webb – – – – –
Mr L Given – – – – –
Mr K Dundo – – – – –
Other key management personnel
Mr R Groom 459,999 1,228,560 (230,000) (153,333) 1,305,226
Mr M Reid (1) – 844,440 – – 844,440
Mr G Fee 102,000 90,552 (51,000) (34,000) 107,552
Mr M Jenkins – 523,200 – – 523,200
Mr M Cooke 1,800,000 – – (1,800,000) –
Mr S Prior (1) 25,500 82,018 (8,500) (8,500) 90,518
Mr S Budiselik (1) – – – – –
Mr I Day (2) 399,999 – (200,000) (199,999) –
8,787,498 6,498,770 (489,500) (8,195,832) 6,600,936
(1) Opening balance at date of becoming member of KMP
(2) Closing balance at date of resignation
Directors’ reportFor the year ended 30 June 2017
—Remuneration Report (audited) (continued)
Performance rights of Cash Converters International Limited (continued)
Cash Converters International Limited – Annual Report 2017 | 5352 | Cash Converters International Limited – Annual Report 2017
For
per
sona
l use
onl
y
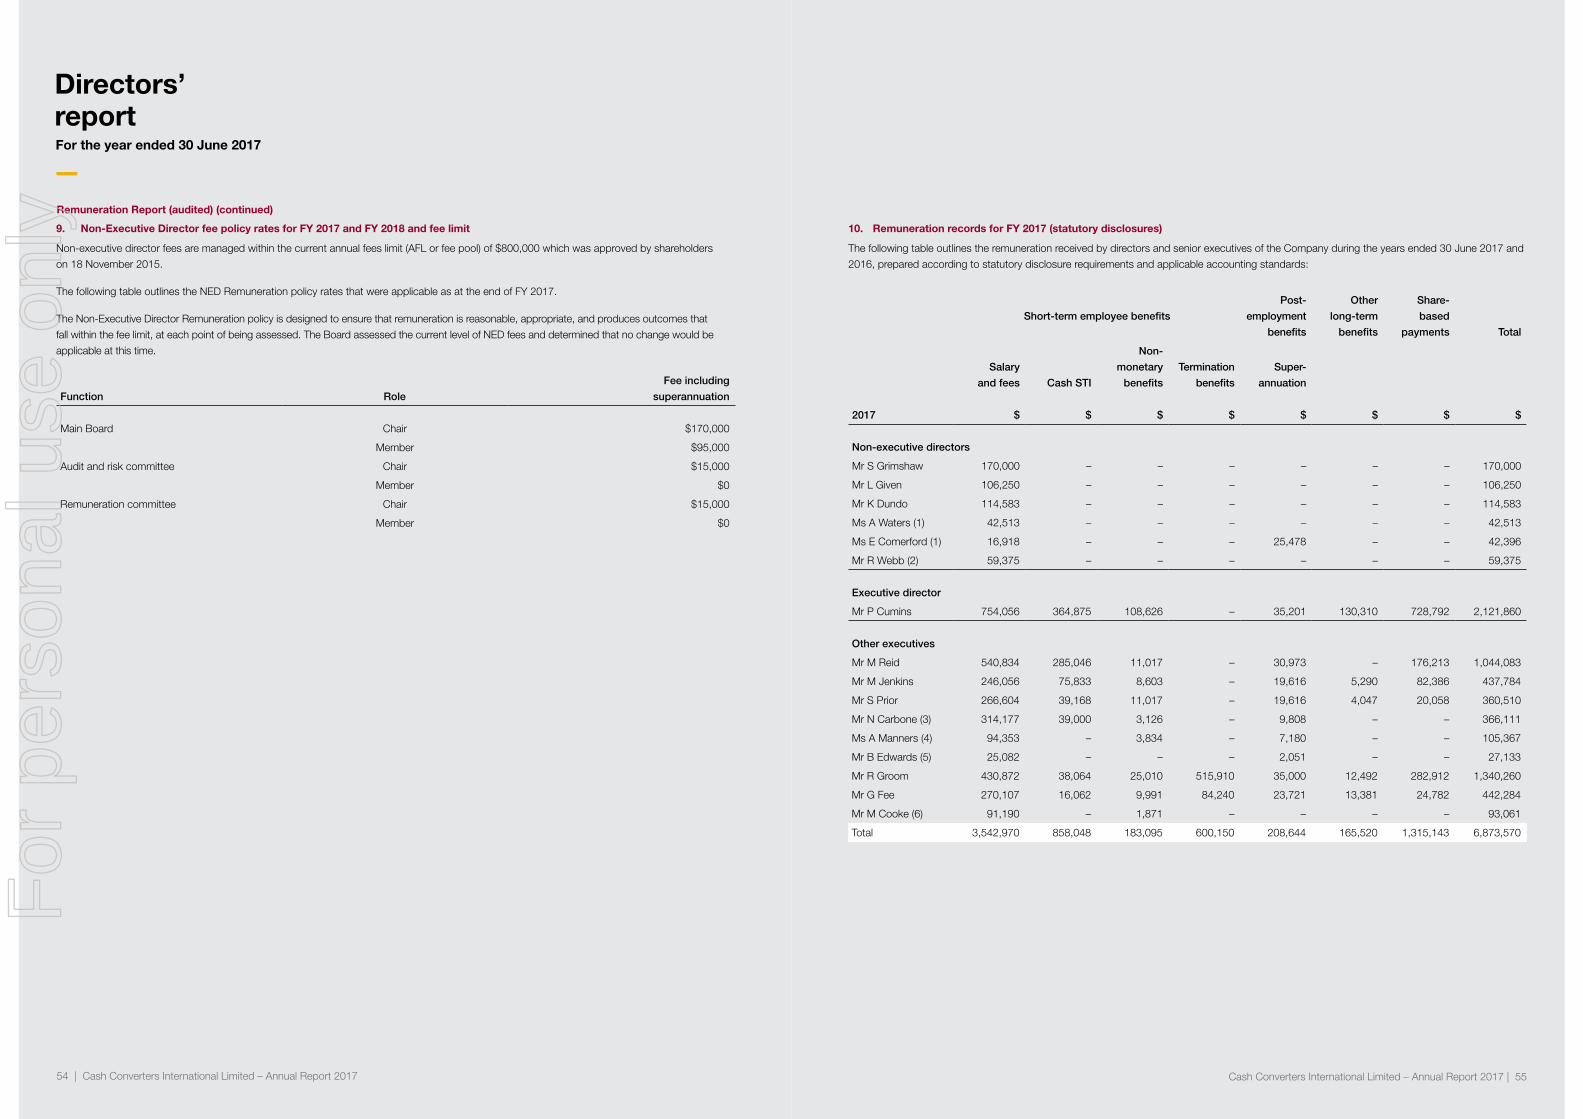
10. Remuneration records for FY 2017 (statutory disclosures)
The following table outlines the remuneration received by directors and senior executives of the Company during the years ended 30 June 2017 and
2016, prepared according to statutory disclosure requirements and applicable accounting standards:
Short-term employee benefits
Post-
employment
benefits
Other
long-term
benefits
Share-
based
payments Total
Salary
and fees Cash STI
Non-
monetary
benefits
Termination
benefits
Super-
annuation
2017 $ $ $ $ $ $ $ $
Non-executive directors
Mr S Grimshaw 170,000 – – – – – – 170,000
Mr L Given 106,250 – – – – – – 106,250
Mr K Dundo 114,583 – – – – – – 114,583
Ms A Waters (1) 42,513 – – – – – – 42,513
Ms E Comerford (1) 16,918 – – – 25,478 – – 42,396
Mr R Webb (2) 59,375 – – – – – – 59,375
Executive director
Mr P Cumins 754,056 364,875 108,626 – 35,201 130,310 728,792 2,121,860
Other executives
Mr M Reid 540,834 285,046 11,017 – 30,973 – 176,213 1,044,083
Mr M Jenkins 246,056 75,833 8,603 – 19,616 5,290 82,386 437,784
Mr S Prior 266,604 39,168 11,017 – 19,616 4,047 20,058 360,510
Mr N Carbone (3) 314,177 39,000 3,126 – 9,808 – – 366,111
Ms A Manners (4) 94,353 – 3,834 – 7,180 – – 105,367
Mr B Edwards (5) 25,082 – – – 2,051 – – 27,133
Mr R Groom 430,872 38,064 25,010 515,910 35,000 12,492 282,912 1,340,260
Mr G Fee 270,107 16,062 9,991 84,240 23,721 13,381 24,782 442,284
Mr M Cooke (6) 91,190 – 1,871 – – – – 93,061
Total 3,542,970 858,048 183,095 600,150 208,644 165,520 1,315,143 6,873,570
9. Non-Executive Director fee policy rates for FY 2017 and FY 2018 and fee limit
Non-executive director fees are managed within the current annual fees limit (AFL or fee pool) of $800,000 which was approved by shareholders
on 18 November 2015.
The following table outlines the NED Remuneration policy rates that were applicable as at the end of FY 2017.
The Non-Executive Director Remuneration policy is designed to ensure that remuneration is reasonable, appropriate, and produces outcomes that
fall within the fee limit, at each point of being assessed. The Board assessed the current level of NED fees and determined that no change would be
applicable at this time.
Function Role
Fee including
superannuation
Main Board Chair $170,000
Member $95,000
Audit and risk committee Chair $15,000
Member $0
Remuneration committee Chair $15,000
Member $0
Directors’ reportFor the year ended 30 June 2017
—Remuneration Report (audited) (continued)
Cash Converters International Limited – Annual Report 2017 | 5554 | Cash Converters International Limited – Annual Report 2017
For
per
sona
l use
onl
y
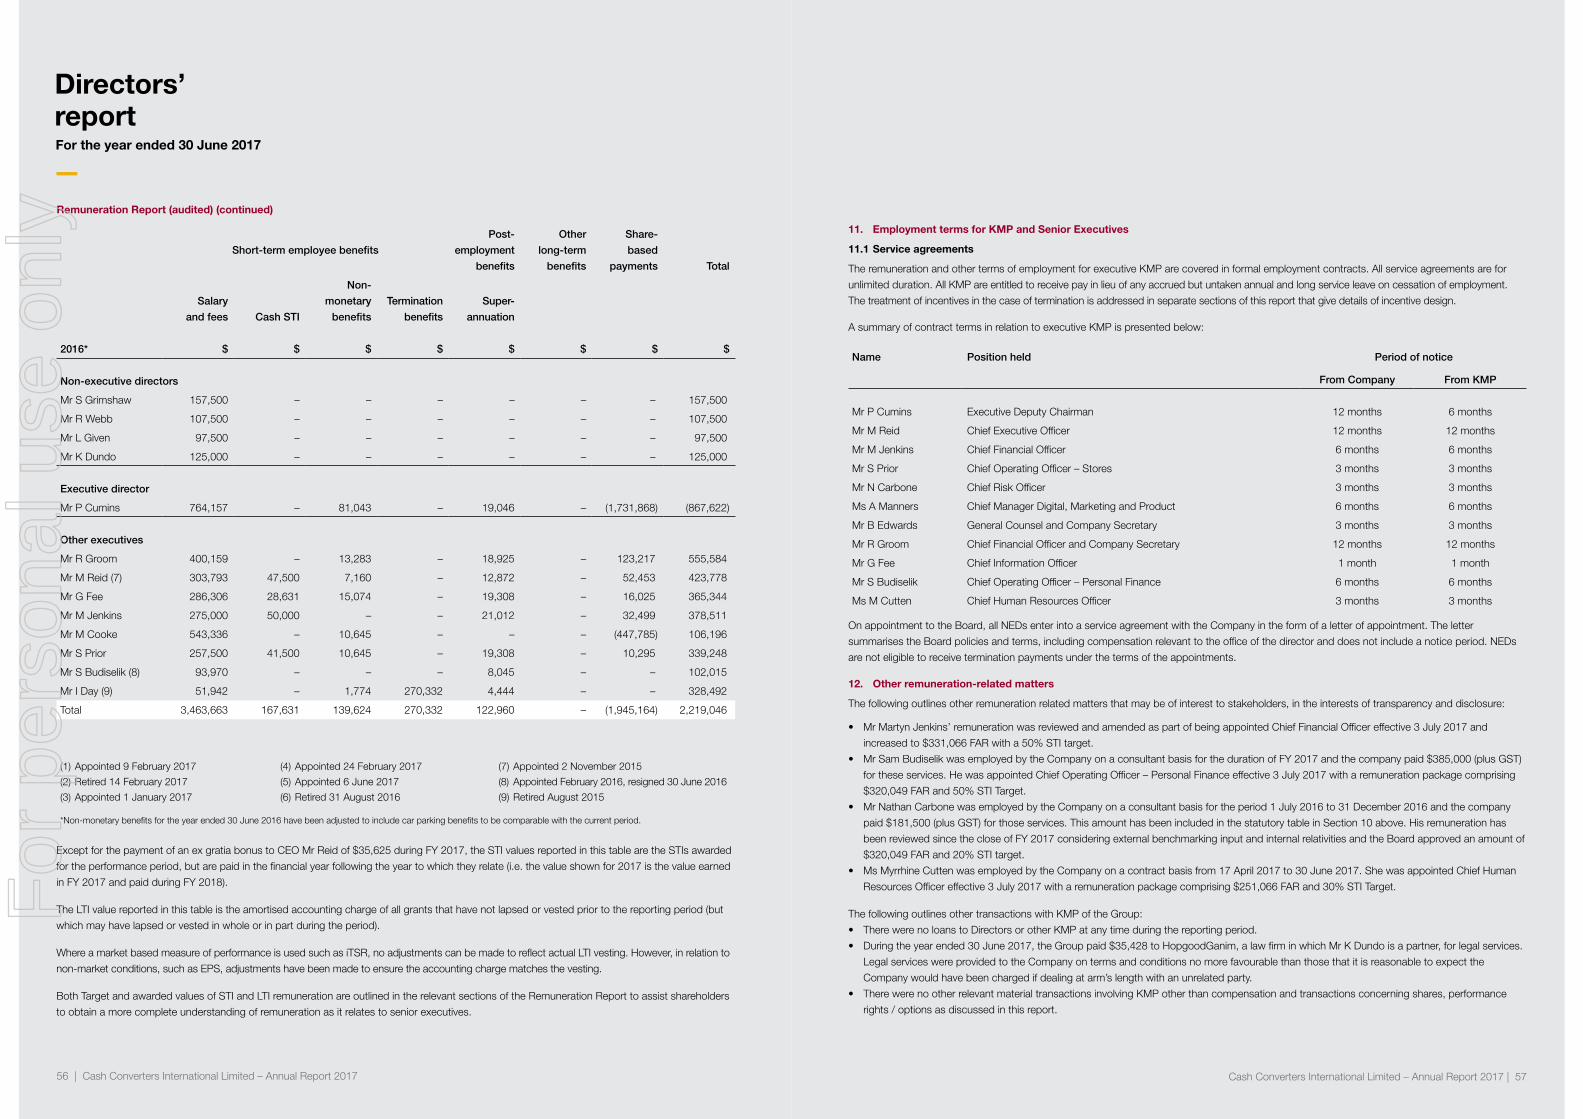
11. Employment terms for KMP and Senior Executives
11.1 Service agreements
The remuneration and other terms of employment for executive KMP are covered in formal employment contracts. All service agreements are for
unlimited duration. All KMP are entitled to receive pay in lieu of any accrued but untaken annual and long service leave on cessation of employment.
The treatment of incentives in the case of termination is addressed in separate sections of this report that give details of incentive design.
On appointment to the Board, all NEDs enter into a service agreement with the Company in the form of a letter of appointment. The letter
summarises the Board policies and terms, including compensation relevant to the office of the director and does not include a notice period. NEDs
are not eligible to receive termination payments under the terms of the appointments.
A summary of contract terms in relation to executive KMP is presented below:
Name Position held Period of notice
From Company From KMP
Mr P Cumins Executive Deputy Chairman 12 months 6 months
Mr M Reid Chief Executive Officer 12 months 12 months
Mr M Jenkins Chief Financial Officer 6 months 6 months
Mr S Prior Chief Operating Officer – Stores 3 months 3 months
Mr N Carbone Chief Risk Officer 3 months 3 months
Ms A Manners Chief Manager Digital, Marketing and Product 6 months 6 months
Mr B Edwards General Counsel and Company Secretary 3 months 3 months
Mr R Groom Chief Financial Officer and Company Secretary 12 months 12 months
Mr G Fee Chief Information Officer 1 month 1 month
Mr S Budiselik Chief Operating Officer – Personal Finance 6 months 6 months
Ms M Cutten Chief Human Resources Officer 3 months 3 months
12. Other remuneration-related matters
The following outlines other remuneration related matters that may be of interest to stakeholders, in the interests of transparency and disclosure:
• Mr Martyn Jenkins’ remuneration was reviewed and amended as part of being appointed Chief Financial Officer effective 3 July 2017 and
increased to $331,066 FAR with a 50% STI target.
• Mr Sam Budiselik was employed by the Company on a consultant basis for the duration of FY 2017 and the company paid $385,000 (plus GST)
for these services. He was appointed Chief Operating Officer – Personal Finance effective 3 July 2017 with a remuneration package comprising
$320,049 FAR and 50% STI Target.
• Mr Nathan Carbone was employed by the Company on a consultant basis for the period 1 July 2016 to 31 December 2016 and the company
paid $181,500 (plus GST) for those services. This amount has been included in the statutory table in Section 10 above. His remuneration has
been reviewed since the close of FY 2017 considering external benchmarking input and internal relativities and the Board approved an amount of
$320,049 FAR and 20% STI target.
• Ms Myrrhine Cutten was employed by the Company on a contract basis from 17 April 2017 to 30 June 2017. She was appointed Chief Human
Resources Officer effective 3 July 2017 with a remuneration package comprising $251,066 FAR and 30% STI Target.
The following outlines other transactions with KMP of the Group:
• There were no loans to Directors or other KMP at any time during the reporting period.
• During the year ended 30 June 2017, the Group paid $35,428 to HopgoodGanim, a law firm in which Mr K Dundo is a partner, for legal services.
Legal services were provided to the Company on terms and conditions no more favourable than those that it is reasonable to expect the
Company would have been charged if dealing at arm’s length with an unrelated party.
• There were no other relevant material transactions involving KMP other than compensation and transactions concerning shares, performance
rights / options as discussed in this report.
Short-term employee benefits
Post-
employment
benefits
Other
long-term
benefits
Share-
based
payments Total
Salary
and fees Cash STI
Non-
monetary
benefits
Termination
benefits
Super-
annuation
2016* $ $ $ $ $ $ $ $
Non-executive directors
Mr S Grimshaw 157,500 – – – – – – 157,500
Mr R Webb 107,500 – – – – – – 107,500
Mr L Given 97,500 – – – – – – 97,500
Mr K Dundo 125,000 – – – – – – 125,000
Executive director
Mr P Cumins 764,157 – 81,043 – 19,046 – (1,731,868) (867,622)
Other executives
Mr R Groom 400,159 – 13,283 – 18,925 – 123,217 555,584
Mr M Reid (7) 303,793 47,500 7,160 – 12,872 – 52,453 423,778
Mr G Fee 286,306 28,631 15,074 – 19,308 – 16,025 365,344
Mr M Jenkins 275,000 50,000 – – 21,012 – 32,499 378,511
Mr M Cooke 543,336 – 10,645 – – – (447,785) 106,196
Mr S Prior 257,500 41,500 10,645 – 19,308 – 10,295 339,248
Mr S Budiselik (8) 93,970 – – – 8,045 – – 102,015
Mr I Day (9) 51,942 – 1,774 270,332 4,444 – – 328,492
Total 3,463,663 167,631 139,624 270,332 122,960 – (1,945,164) 2,219,046
Except for the payment of an ex gratia bonus to CEO Mr Reid of $35,625 during FY 2017, the STI values reported in this table are the STIs awarded
for the performance period, but are paid in the financial year following the year to which they relate (i.e. the value shown for 2017 is the value earned
in FY 2017 and paid during FY 2018).
The LTI value reported in this table is the amortised accounting charge of all grants that have not lapsed or vested prior to the reporting period (but
which may have lapsed or vested in whole or in part during the period).
Where a market based measure of performance is used such as iTSR, no adjustments can be made to reflect actual LTI vesting. However, in relation to
non-market conditions, such as EPS, adjustments have been made to ensure the accounting charge matches the vesting.
Both Target and awarded values of STI and LTI remuneration are outlined in the relevant sections of the Remuneration Report to assist shareholders
to obtain a more complete understanding of remuneration as it relates to senior executives.
(1) Appointed 9 February 2017
(2) Retired 14 February 2017
(3) Appointed 1 January 2017
(4) Appointed 24 February 2017
(5) Appointed 6 June 2017
(6) Retired 31 August 2016
(7) Appointed 2 November 2015
(8) Appointed February 2016, resigned 30 June 2016
(9) Retired August 2015
*Non-monetary benefits for the year ended 30 June 2016 have been adjusted to include car parking benefits to be comparable with the current period.
Directors’ reportFor the year ended 30 June 2017
—Remuneration Report (audited) (continued)
Cash Converters International Limited – Annual Report 2017 | 5756 | Cash Converters International Limited – Annual Report 2017
For
per
sona
l use
onl
y
Directors’ reportFor the year ended 30 June 2017
—Remuneration Report (audited) (continued)
The following summarises the treatment of remuneration in respect of those KMP who are no longer employed by the Company during or since
the reporting period:
Mr Michael Cooke – Group Legal Counsel
The remuneration disclosed in relation to Mr Michael Cooke, General Counsel of Cash Converters International Limited, represents consulting fees
(a retainer) paid to his firm (Cooke & Co) under a consulting agreement (negotiated 24 September 2001). The fees cover the cost of Mr Cooke’s
consulting and the work of his firm’s colleagues in relation to fulfilling the General Counsel function (solicitor) for Cash Converters International
Limited. Mr Cooke retired from this role on 31 August 2016. Mr Cooke was not eligible for participation in the STI plan in FY 2017. The Company
entered into a separate arrangement with Mr Cooke on 19 September 2016 for payment of a monthly retainer in regard to ongoing provision of
legal services.
Mr Ralph Groom – Chief Financial Officer and Company Secretary and Mr Glen Fee – Chief Information Officer
In addition to contractual termination payments accounted for in FY 2017 and disclosed in Section 10, Mr Groom and Mr Fee continue to participate
in the Company LTI Plan on a pro rata basis in Tranches 15, 16, 19 and 20. It is anticipated that this continued participation supports alignment with
the interest of shareholders post the incumbents’ separation from the Company.
13. External remuneration consultant advice
During the reporting period, the Board approved and engaged an external remuneration consultant (ERC) to provide KMP remuneration
recommendations and advice. The consultants and the amount payable for the information and work that led to their recommendations are
listed below:
Godfrey Remuneration
Group Pty Limited
Review of and advice on role transitioning addressing role changes and unvested equity $10,000
Activities approved by the Board and not classified as remuneration advice / recommendation
including providing feedback on the FY 2016 Remuneration Report prior to it being published, and
reviewing LTI vesting scenarios in relation to the FY 2016 LTI grant.
$9,500
Subsequent to the end of the reporting period, the ERC has continued to be engaged to support the Board with ongoing KMP remuneration
considerations. Specifically, the ERC has been engaged to assist with re-drafting the remuneration report, to provide the 2017 GRG Remuneration
guide and to proffer advisory input in regard to the LTI incentive plan. Fees charged in relation to this activity of $13,700 have been expensed in
FY 2017.
The Board is satisfied that the KMP remuneration recommendations received were free from undue influence from KMP to whom the
recommendations related. The reasons the Board is so satisfied include that it is confident that the policy for engaging external remuneration
consultants is being adhered to and is operating as intended, the Board has been closely involved in all dealings with the external remuneration
consultants and each KMP remuneration recommendation received during the year was accompanied by a legal declaration from the consultant to
the effect that their advice was provided free from undue influence from the KMP to whom the recommendations related.
This directors’ report is signed in accordance with a resolution of directors made pursuant to s298(2) of the Corporations Act 2001.
On behalf of the directors
Stuart Grimshaw
Director
Perth, Western Australia
7 September 2017
58 | Cash Converters International Limited – Annual Report 2017 Cash Converters International Limited – Annual Report 2017 | 59
For
per
sona
l use
onl
y
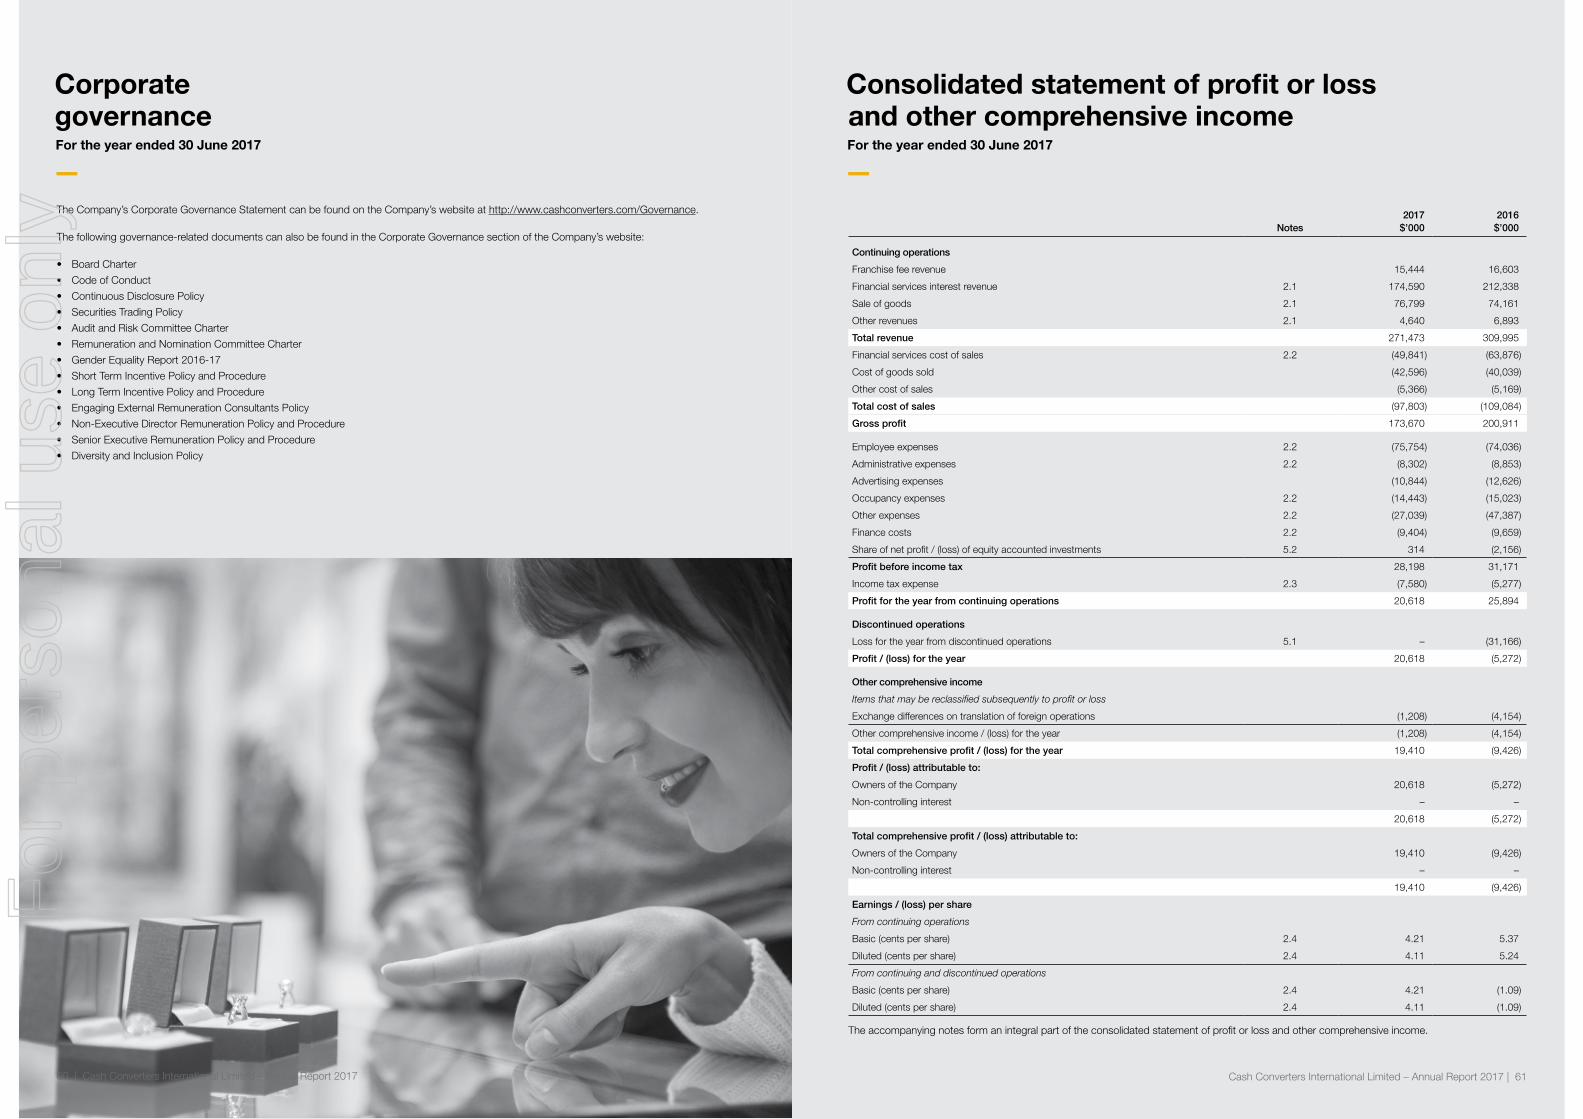
2017 2016Notes $’000 $’000
Continuing operations
Franchise fee revenue 15,444 16,603
Financial services interest revenue 2.1 174,590 212,338
Sale of goods 2.1 76,799 74,161
Other revenues 2.1 4,640 6,893
Total revenue 271,473 309,995
Financial services cost of sales 2.2 (49,841) (63,876)
Cost of goods sold (42,596) (40,039)
Other cost of sales (5,366) (5,169)
Total cost of sales (97,803) (109,084)
Gross profit 173,670 200,911
Employee expenses 2.2 (75,754) (74,036)
Administrative expenses 2.2 (8,302) (8,853)
Advertising expenses (10,844) (12,626)
Occupancy expenses 2.2 (14,443) (15,023)
Other expenses 2.2 (27,039) (47,387)
Finance costs 2.2 (9,404) (9,659)
Share of net profit / (loss) of equity accounted investments 5.2 314 (2,156)
Profit before income tax 28,198 31,171
Income tax expense 2.3 (7,580) (5,277)
Profit for the year from continuing operations 20,618 25,894
Discontinued operations
Loss for the year from discontinued operations 5.1 – (31,166)
Profit / (loss) for the year 20,618 (5,272)
Other comprehensive income
Items that may be reclassified subsequently to profit or loss
Exchange differences on translation of foreign operations (1,208) (4,154)
Other comprehensive income / (loss) for the year (1,208) (4,154)
Total comprehensive profit / (loss) for the year 19,410 (9,426)
Profit / (loss) attributable to:
Owners of the Company 20,618 (5,272)
Non-controlling interest – –
20,618 (5,272)
Total comprehensive profit / (loss) attributable to:
Owners of the Company 19,410 (9,426)
Non-controlling interest – –
19,410 (9,426)
Earnings / (loss) per share
From continuing operations
Basic (cents per share) 2.4 4.21 5.37
Diluted (cents per share) 2.4 4.11 5.24
From continuing and discontinued operations
Basic (cents per share) 2.4 4.21 (1.09)
Diluted (cents per share) 2.4 4.11 (1.09)
The accompanying notes form an integral part of the consolidated statement of profit or loss and other comprehensive income.
Consolidated statement of profit or loss and other comprehensive incomeFor the year ended 30 June 2017
—The Company’s Corporate Governance Statement can be found on the Company’s website at http://www.cashconverters.com/Governance.
The following governance-related documents can also be found in the Corporate Governance section of the Company’s website:
• Board Charter
• Code of Conduct
• Continuous Disclosure Policy
• Securities Trading Policy
• Audit and Risk Committee Charter
• Remuneration and Nomination Committee Charter
• Gender Equality Report 2016-17
• Short Term Incentive Policy and Procedure
• Long Term Incentive Policy and Procedure
• Engaging External Remuneration Consultants Policy
• Non-Executive Director Remuneration Policy and Procedure
• Senior Executive Remuneration Policy and Procedure
• Diversity and Inclusion Policy
60 | Cash Converters International Limited – Annual Report 2017
Corporate governanceFor the year ended 30 June 2017
—
Cash Converters International Limited – Annual Report 2017 | 6160 | Cash Converters International Limited – Annual Report 2017
For
per
sona
l use
onl
y

Issued
capital
Foreign
currency
translation
reserve
Non-
controlling
interest
acquisition
reserve
Share-
based
payment
reserve
Retained
earnings Total
$’000 $’000 $’000 $’000 $’000 $’000
Balance at 1 July 2015 205,399 10,697 (15,809) 3,032 58,379 261,698
Loss for the year – – – – (5,272) (5,272)
Exchange differences
arising on translation of
foreign operations – (4,154) – – – (4,154)
Total comprehensive
income for the year – (4,154) – – (5,272) (9,426)
Dividend reinvestment plan 1,572 – – – – 1,572
Share-based payments – – – (1,923) – (1,923)
Shares issued on exercise
of performance rights 569 – – (569) – –
Dividends paid – – – – (9,636) (9,636)
Balance at 30 June 2016 207,540 6,543 (15,809) 540 43,471 242,285
Profit for the year – – – – 20,618 20,618
Exchange differences
arising on translation of
foreign operations – (1,208) – – – (1,208)
Total comprehensive
income for the year – (1,208) – – 20,618 19,410
Dividend reinvestment plan 2,663 – – – – 2,663
Share-based payments – – – 1,331 – 1,331
Dividends paid – – – – (4,850) (4,850)
Transfer reserve balance to
retained earnings – – 15,809 – (15,809) –
Balance at 30 June 2017 210,203 5,335 – 1,871 43,430 260,839
The accompanying notes form an integral part of the consolidated statement of changes in equity.
Consolidated statement of changes in equity For the year ended 30 June 2017
—2017 2016
Notes $’000 $’000
Current assets
Cash and cash equivalents 4.1 80,571 73,609
Trade receivables 3.1 7,571 13,651
Loan receivables 3.2 87,933 102,419
Inventories 3.3 20,991 17,612
Prepayments 5,512 9,767
Current tax receivable 35 9,851
202,613 226,909
Assets associated with discontinued operations 5.1 – 7,448
Total current assets 202,613 234,357
Non-current assets
Trade and other receivables 3.1 23,480 25,766
Loan receivables 3.2 14,037 2,102
Plant and equipment 3.4 10,233 13,853
Deferred tax assets 2.3 9,879 13,075
Goodwill 3.5 107,009 107,009
Other intangible assets 3.6 26,987 24,034
Investments in associates 5.2 4,607 4,295
Total non-current assets 196,232 190,134
Total assets 398,845 424,491
Current liabilities
Trade and other payables 3.7 21,288 19,821
Borrowings 4.2 46,303 70,023
Provisions 3.8 7,064 22,427
Total current liabilities 74,655 112,271
Non-current liabilities
Borrowings 4.2 60,934 63,961
Provisions 3.8 2,417 5,974
Total non-current liabilities 63,351 69,935
Total liabilities 138,006 182,206
Net assets 260,839 242,285
Equity
Issued capital 4.4 210,203 207,540
Reserves 7,206 (8,726)
Retained earnings 43,430 43,471
Total equity 260,839 242,285
The accompanying notes form an integral part of the consolidated statement of financial position.
Consolidated statement of financial positionAs at 30 June 2017
—
62 | Cash Converters International Limited – Annual Report 2017 Cash Converters International Limited – Annual Report 2017 | 6362 | Cash Converters International Limited – Annual Report 2017
For
per
sona
l use
onl
y
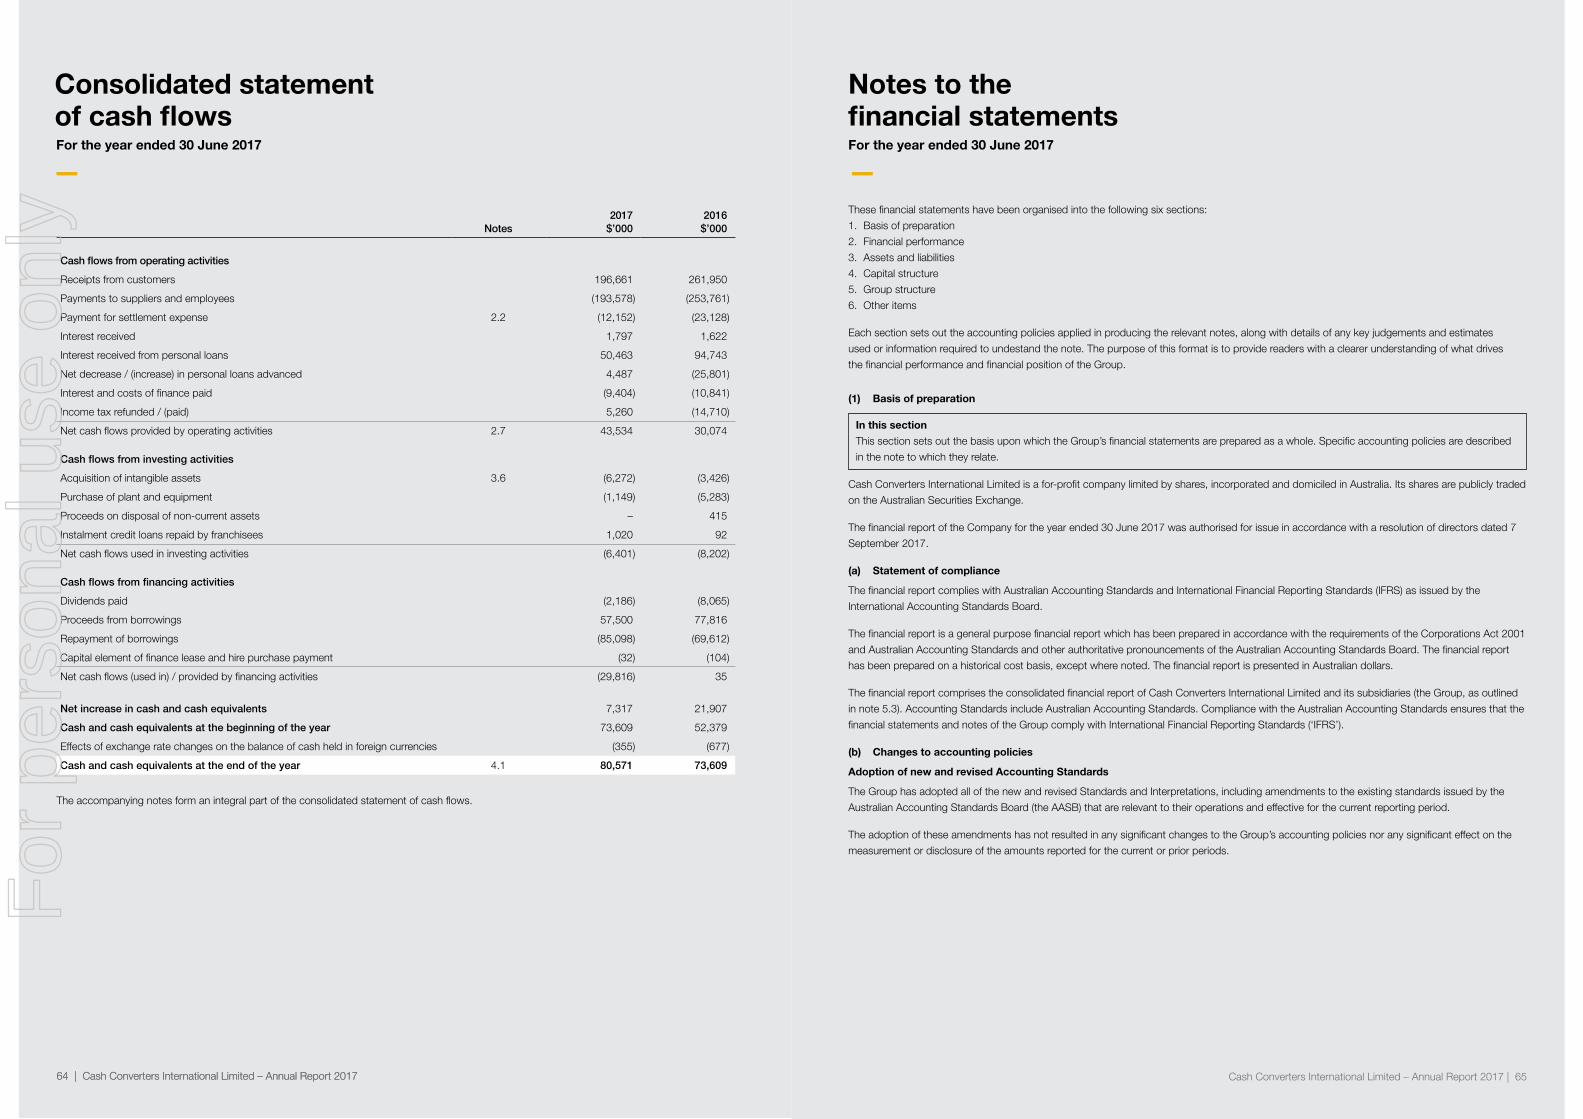
In this section
This section sets out the basis upon which the Group’s financial statements are prepared as a whole. Specific accounting policies are described
in the note to which they relate.
Cash Converters International Limited is a for-profit company limited by shares, incorporated and domiciled in Australia. Its shares are publicly traded
on the Australian Securities Exchange.
The financial report of the Company for the year ended 30 June 2017 was authorised for issue in accordance with a resolution of directors dated 7
September 2017.
(a) Statement of compliance
The financial report complies with Australian Accounting Standards and International Financial Reporting Standards (IFRS) as issued by the
International Accounting Standards Board.
The financial report is a general purpose financial report which has been prepared in accordance with the requirements of the Corporations Act 2001
and Australian Accounting Standards and other authoritative pronouncements of the Australian Accounting Standards Board. The financial report
has been prepared on a historical cost basis, except where noted. The financial report is presented in Australian dollars.
The financial report comprises the consolidated financial report of Cash Converters International Limited and its subsidiaries (the Group, as outlined
in note 5.3). Accounting Standards include Australian Accounting Standards. Compliance with the Australian Accounting Standards ensures that the
financial statements and notes of the Group comply with International Financial Reporting Standards (‘IFRS’).
(b) Changes to accounting policies
Adoption of new and revised Accounting Standards
The Group has adopted all of the new and revised Standards and Interpretations, including amendments to the existing standards issued by the
Australian Accounting Standards Board (the AASB) that are relevant to their operations and effective for the current reporting period.
The adoption of these amendments has not resulted in any significant changes to the Group’s accounting policies nor any significant effect on the
measurement or disclosure of the amounts reported for the current or prior periods.
These financial statements have been organised into the following six sections:
1. Basis of preparation
2. Financial performance
3. Assets and liabilities
4. Capital structure
5. Group structure
6. Other items
Each section sets out the accounting policies applied in producing the relevant notes, along with details of any key judgements and estimates
used or information required to undestand the note. The purpose of this format is to provide readers with a clearer understanding of what drives
the financial performance and financial position of the Group.
Notes to the financial statements For the year ended 30 June 2017
—
(1) Basis of preparation
2017 2016Notes $’000 $’000
Cash flows from operating activities
Receipts from customers 196,661 261,950
Payments to suppliers and employees (193,578) (253,761)
Payment for settlement expense 2.2 (12,152) (23,128)
Interest received 1,797 1,622
Interest received from personal loans 50,463 94,743
Net decrease / (increase) in personal loans advanced 4,487 (25,801)
Interest and costs of finance paid (9,404) (10,841)
Income tax refunded / (paid) 5,260 (14,710)
Net cash flows provided by operating activities 2.7 43,534 30,074
Cash flows from investing activities
Acquisition of intangible assets 3.6 (6,272) (3,426)
Purchase of plant and equipment (1,149) (5,283)
Proceeds on disposal of non-current assets – 415
Instalment credit loans repaid by franchisees 1,020 92
Net cash flows used in investing activities (6,401) (8,202)
Cash flows from financing activities
Dividends paid (2,186) (8,065)
Proceeds from borrowings 57,500 77,816
Repayment of borrowings (85,098) (69,612)
Capital element of finance lease and hire purchase payment (32) (104)
Net cash flows (used in) / provided by financing activities (29,816) 35
Net increase in cash and cash equivalents 7,317 21,907
Cash and cash equivalents at the beginning of the year 73,609 52,379
Effects of exchange rate changes on the balance of cash held in foreign currencies (355) (677)
Cash and cash equivalents at the end of the year 4.1 80,571 73,609
The accompanying notes form an integral part of the consolidated statement of cash flows.
Consolidated statementof cash flowsFor the year ended 30 June 2017
—
64 | Cash Converters International Limited – Annual Report 2017 Cash Converters International Limited – Annual Report 2017 | 6564 | Cash Converters International Limited – Annual Report 2017
For
per
sona
l use
onl
y

AASB 15 ‘Revenue from Contracts with Customers’
AASB 15 replaces AASB 118 ‘Revenue’ and will be applied from 1 July 2018. AASB 15 provides a single, principles-based
five-step model to be applied to all contracts with customers. Guidance is provided on topics such as the point at which revenue is recognised,
accounting for variable consideration, costs of fulfilling and obtaining a contract and various related matters. New disclosures regarding revenue are
also introduced.
An initial impact assessment has been performed and, based on material revenue streams in FY 2017, no significant risk of an impact to revenue
recognition has been identified. This analysis considered the Company’s current accounting policies for material revenue streams to which the new
standard applies, including retail goods sold and franchise fees. The Company will formalise its impact assessment during FY 2018.
AASB 16 ‘Leases’
AASB 16 replaces AASB 117 ‘Leases’ and will be applied from 1 July 2019. AASB 16 will significantly impact the accounting for operating leases
as it requires the recognition of a lease liability being the present value of future lease payments and corresponding right-of-use asset, which will
initially be recognised at the same value as the lease liability or lower amount depending on the transition approach adopted. The Company operates
a corporate store network of 71 stores, each carrying a property lease and therefore the impact of the standard will most likely result in significant
increases in assets and liabilities. It will also likely result in increased EBITDA, as the current operating lease expense will be recognised as a
combination of interest and depreciation under the new standard, and result in earlier recognition of expenses over the life of the contract due to the
front-loading of interest expense under the new standard.
(c) Key judgements and estimates
In applying the Group’s accounting policies, management continually evaluates judgements, estimates and assumptions based on experience and
other factors, including expectations of future events that may have an impact on the Group. All judgements, estimates and assumptions made are
believed to be reasonable based on the most current set of circumstances available to management. Actual results may differ from the judgements,
estimates and assumptions. Significant judgements, estimates and assumptions made by management in the preparation of these financial
statements are outlined below:
Significant accounting judgements
In the process of applying the Group’s accounting policies, management has made the following judgements, apart from those involving estimations,
which have the most significant effect on the amount recognised in the financial statements:
• Recoverability of deferred tax assets – see note 2.3(g)
• Classification of contingent liabilities – see note 6.1
Significant accounting estimates and assumptions
The carrying amounts of certain assets and liabilities are often determined based on estimates and assumptions of future events. The key estimates
and assumptions that have a significant risk of causing a material adjustment to the carrying amounts of certain assets and liabilities within the next
annual reporting period are:
• Impairment of goodwill and other intangible assets – see note 3.5 and 3.6
• Useful lives of other intangible assets – see note 3.6
• Impairment of financial assets (including personal loan receivables) – see note 3.2
• Impairment for inventory obsolescence – see note 3.3
(d) Basis of consolidation
The consolidated financial statements comprise the financial statements of Cash Converters International Limited and entities controlled by the
Company and its subsidiaries (the Group, as outlined in note 5.3). Control is achieved when the Company:
• has power over the investee:
• is exposed, or has rights, to variable returns from its involvement with the investee; and
• has the ability to use its power to affect its returns.
The Company reassesses whether or not it controls an investee if facts and circumstances indicate that there are changes to one or more of the
three elements of control listed above.
Standards and interpretations in issue not yet adopted
At the date of authorisation of the financial statements, the Standards and Interpretations that were issued but not yet effective are listed below:
Standard / Interpretation
Effective for
annual reporting
periods beginning
on or after
Expected to be
initially applied
in financial year
ending
AASB 9 ‘Financial Instruments’, and the relevant amending standards 1 January 2018 30 June 2019
AASB 15 ‘Revenue from Contracts with Customers’, AASB 2014-5 ‘Amendments to Australian
Accounting Standards arising from AASB 15’, AASB 2015-8 ‘Amendments to Australian
Accounting Standards – Effective date of AASB 15’ 1 January 2018 30 June 2019
AASB 16 ‘Leases’ 1 January 2019 30 June 2020
AASB 2014-10 ‘Amendments to Australian Accounting Standards – Sale or Contribution of Assets
between an Investor and its Associate or Joint Venture’ and AASB 2015-10 ‘Amendments to
Australian Accounting Standards – Effective Date of Amendments
to AASB 10 and AASB 128’ 1 January 2018 30 June 2019
AASB 2016-1 ‘Amendments to Australian Accounting Standards – Recognition of Deferred
Tax Assets for Unrealised Losses’ 1 January 2017 30 June 2018
AASB 2016-2 ‘Amendments to Australian Accounting Standards – Disclosure Initiative:
Amendments to AASB 107’ 1 January 2017 30 June 2018
AASB 2016-5 ‘Amendments to Australian Accounting Standards – Classification and
Measurement of Share-based Payment Transactions’ 1 January 2018 30 June 2019
AASB 2017-2 ‘Amendments to Australian Accounting Standards – Further Annual
Improvements 2014-2016’ 1 January 2017 30 June 2018
AASB 2017-4 Amendments to Australian Accounting Standards – Uncertainty over Tax Treatment 1 January 2017 30 June 2018
Impact of changes to Australian Accounting Standards and Interpretations
A number of Australian Accounting Standards and Interpretations are in issue but are not effective for the current year end. The Company has
considered the potential impact of these new standards as outlined below.
AASB 9 ‘Financial Instruments’, and the relevant amending standards
AASB 9 will be applied from 1 July 2018 and replaces AASB 139 ‘Financial instruments: Recognition and measurement’. AASB 9 significantly changes
the recognition of impairment on customer receivables with the standard introducing an expected loss model. Under this approach impairment provisions
are recognised at inception of the loan based on the life time expected loss on a loan. This differs from the current incurred loss model under AASB 139
whereby impairment provisions are only reflected when there is objective evidence of impairment. The standard also includes a single approach for the
classification and measurement of financial assets based on cash flow characteristics and the business model used for the management of the financial
instruments. Additionally, the standard amends the rules on hedge accounting to align the treatment with risk management practices. While the Company
does not currently utilise hedge accounting this development could provide opportunities to implement hedge accounting in the future.
The Company has been assessing the potential impact of AASB 9, which includes the establishment of a project plan and production of a timetable
for implementation and an initial impact assessment.
Of the changes that AASB 9 introduces, the Company has identified the impact of the revised credit provisioning approach to have the most
significant impact. The impact would be that impairment provisions under AASB 9 are recognised earlier in the income statement. This will result in a
one-off adjustment to receivables and reserves on adoption and for those loan products experiencing growth, the growth in profitability will be slower.
Due to the recent enhancements to internal credit assessment processes and the relatively immature loan books for new products, any assessment
on historic performance by the Company to quantify the impact of AASB 9 will be unlikely to reflect the impact when the standard is adopted. As the
changes to the composition of the loan book stabilise in the period prior to application date, the Company will be able to quantify the impact with
more relevance to the actual outcome. The Company will formalise its impact assessments and choice of transition approach before June 2018.
(1) Basis of preparation (continued)
Notes to thefinancial statementsFor the year ended 30 June 2017
—
Cash Converters International Limited – Annual Report 2017 | 6766 | Cash Converters International Limited – Annual Report 2017
For
per
sona
l use
onl
y

In this section
This section explains the results and performance of the Group. This section provides additional information about those individual line items
in the financial statements that the Directors consider most relevant in the context of the operations of the Group, including:
a) Accounting policies that are relevant for understanding the items recognised in the financial statements; and
b) Analysis of the Group’s result for the year by reference to key areas, including revenue, results by operating segment and income tax.
2.1 Revenue
2017 2016$’000 $’000
Financial services interest revenue
Personal loan interest 65,932 85,981
Loan establishment fees 45,737 53,481
Pawn broking fees 29,057 28,128
Cash advance fee income 26,702 40,260
Vehicle loan interest 2,546 94
Vehicle loan establishment fees 1,043 4
Other financial services revenue 3,573 4,390
174,590 212,338
Sale of goods
Retail sales 76,125 73,728
Vehicle trade sales 674 433
76,799 74,161
Other revenue
Bank interest 591 593
Other vehicle revenue 3,103 4,920
Other revenue 946 1,380
4,640 6,893
(2) Financial performance
Consolidation of a subsidiary begins when the Company obtains control over the subsidiary and ceases when the Company loses control of the
subsidiary. Specifically, income and expenses of a subsidiary acquired or disposed of during the year are included in the consolidated statement of
profit or loss and other comprehensive income from the date the Company gains control until the date when the Company ceases to control the
subsidiary.
Profit or loss and each component of other comprehensive income are attributed to the owners of the Company and to the non-controlling interests.
Total comprehensive income of subsidiaries is attributed to the owners of the Company and to the non-controlling interests even if this results in the
non-controlling interests having a deficit balance.
All intragroup assets and liabilities, equity, income, expenses and cash flows relating to transactions between members of the Group are eliminated
in full on consolidation.
(e) Foreign currency
Both the functional and presentation currency of Cash Converters International Limited and its Australian subsidiaries is Australian dollars ($).
The functional and presentation currency of the non-Australian Group companies is the national currency of the country of operation.
As at the reporting date, the assets and liabilities of foreign subsidiaries are translated into Australian dollars at the rate of exchange ruling at the
reporting date and the statements of comprehensive income are translated at the average exchange rates for the year. The exchange differences
arising on the translation are taken directly to a separate component of equity, the foreign currency translation reserve.
Transactions in foreign currencies are initially recorded in the functional currency at the exchange rates ruling at the date of the transaction. Monetary
assets and liabilities denominated in foreign currencies are translated at the rate of exchange ruling at the balance sheet date. Foreign currency
differences arising on translation are recognised in the income statement.
(f) Other accounting policies
Significant and other accounting policies that summarise the measurement basis used, and are relevant to, an understanding of the financial
statements are provided throughout the notes to the financial statements.
(g) Reclassification of comparative financial information
Comparative information within the statement of financial position relating to current vehicle finance loans of $1.104 million and non-current vehicle
finance loans of $2.102 million has been reclassified from current trade and other receivables to current loan receivables and from non-current trade
and other receivables to non-current loan receivables respectively due to an increase in the vehicle loan business during the year, to be comparable
to the current year presentation.
Comparative information in the statement of profit or loss and other comprehensive income and segment note has been reclassified as follows to be
comparable to the current year presentation:
• advertising and training revenues and expenses have been grossed up by $6.740 million to reflect revenue and expenses that were netted off in
the prior year
• other revenue of $367 thousand has been reclassified from financial services interest revenue to other revenues
• area agent fees / commission of $16.345 million and $5.710 million of other expenditure has been reclassified from other expenses to financial
services cost of sales in the current period to better align with management’s consideration of these costs following operational changes in the
current period
• a further $475 thousand of cost of sales expenditure has been reclassified from other expenses to other cost of sales
• several other changes to the line items included within administrative expenses and other expenses have been made to provide further detail on
expenses.
(h) Rounding
The Company is a company of the kind referred to in ASIC Corporations (Rounding in Financial / Directors’ Reports) Instrument, dated 24 March
2016, and in accordance with that Corporations Instrument amounts in the financial report are rounded off to the nearest thousand dollars, unless
otherwise indicated.
(1) Basis of preparation (continued)
Notes to thefinancial statementsFor the year ended 30 June 2017
—
Cash Converters International Limited – Annual Report 2017 | 6968 | Cash Converters International Limited – Annual Report 2017
For
per
sona
l use
onl
y

2017 2016Notes $’000 $’000
Occupancy expenses
Rent 10,540 10,938
Outgoings 1,745 1,839
Other 2,158 2,246
14,443 15,023
Other expenses
Legal fees 5,209 3,636
Professional and registry costs 4,879 5,075
Auditing and accounting services 670 671
Bank charges 1,775 3,111
ASIC compliance settlement provision 3.8 – 12,500
Green Light Auto restructure costs – 2,228
Other expenses from ordinary activities 6,383 9,562
Depreciation 3,580 3,589
Amortisation 3,717 3,278
Loss on write down of assets 826 3,737
27,039 47,387
Finance costs
Interest 9,339 9,592
Finance lease charge 65 67
9,404 9,659
ASIC compliance settlement
On 9 November 2016 the Company announced that it had entered into an enforceable undertaking with ASIC in relation to its compliance with certain provisions applicable to small amount credit contracts under the National Consumer Credit Protection Act 2009 (Cth). Prior to this announcement, the Company had recognised a provision of $12.500 million in respect of any potential compliance issues in its credit assessment processes, based on Cash Converters’ best estimate of the likely outcome of discussions with ASIC at the date of the 2016 financial report. As at 30 June 2017 $391 thousand for customer remediation remains outstanding and is classified within trade payables, the balance having been paid during the year.
Settlement expense
During the year ended 30 June 2016 a payment of $23.128 million was made in respect of the settlement of the NSW Class Action. This was recognised in profit and loss in the year ended 30 June 2015.
Accounting policies
Employee benefits expense
The Group’s accounting policy for liabilities associated with employee benefits is set out in note 3.8. The policy relating to share-based payments is set out in note 6.5.
Leasing
Leases are classified as finance leases whenever the terms of the lease transfer substantially all the risks and rewards of ownership to the lessee. All other leases are classified as operating leases.
Assets held under finance leases are initially recognised as assets of the Group at their fair value at the inception of the lease or, if lower, at the present value of the minimum lease payments. The corresponding liability to the lessor is included in the statement of financial position as a finance lease obligation. Lease payments are apportioned between finance expenses and reduction of the lease obligation so as to achieve a constant rate of interest on the remaining balance of the liability. Finance expenses are recognised immediately in profit or loss, unless they are directly attributable to qualifying assets, in which case they are capitalised in accordance with the Group’s general policy on borrowing costs (see note 4.2 below).
Accounting policies
Franchise fees
Franchise fees and levies in respect of particular services are recognised as income when they become due and receivable and the costs in relation
to the income are recognised as expenses when incurred.
Personal loan, cash advance, vehicle finance, vehicle lease and pawn broking interest
Interest revenue in relation to personal loans, vehicle finance, vehicle leases and pawn broking is accrued on a time basis by reference to the principal
outstanding and at the effective interest rate applicable, which is the rate that exactly discounts estimated future cash receipts through the expected
life of the financial asset to that asset’s net carrying amount. Due to the short term nature of the Cash Advance product, Cash Advance fee income is
recognised on a cash basis as repayments are successfully collected.
Loan establishment fee revenue
Establishment fees are deferred and recognised over the life of the loans at the effective interest rate applicable so as to recognise revenue at a constant
rate to the underlying principal over the expected life of the loan.
Other vehicle revenue
Charges relating to the vehicle leases such as vehicle maintenance, warranty, registration and insurance are recognised over the life of the lease.
Other categories of revenue
Other categories of revenue, such as financial services commission and retail sales, are recognised when the Group has transferred the risks and
rewards of the goods to the buyer or when the services are provided. Bank interest is recognised as earned on an accruals basis.
2.2 Expenses
2017 2016Notes $’000 $’000
Financial services cost of sales
Net bad and doubtful debt expense 29,759 41,068
Commissions 14,357 16,345
Other financial services cost of sales 5,725 6,463
49,841 63,876
Refer below for details of finance costs.
Employee expenses
Employee benefits 69,416 70,639
Share-based payments (i) 1,331 (1,923)
Superannuation expense 5,007 5,320
75,754 74,036
Administrative expenses
General administrative expenses 2,784 3,223
Communications expenses 2,119 2,673
IT expenses 2,523 745
Travel costs 876 1,368
8,302 8,009
(i) During the year ended 30 June 2016 a number of performance rights issued to employees of the Company lapsed unvested, and share-based
payments expense amounts that had been expensed in prior years in respect of these rights were reversed, resulting in a negative share-based
payments expense for the year. Refer to note 6.5 for further information on share-based payments.
2.1 Revenue (continued)
Notes to thefinancial statementsFor the year ended 30 June 2017
—
Cash Converters International Limited – Annual Report 2017 | 7170 | Cash Converters International Limited – Annual Report 2017
For
per
sona
l use
onl
y

(b) Deferred tax
Deferred income tax in the statement of financial position relates to the following:
2017 2016$’000 $’000
Deferred tax assets
Allowance for doubtful debts 7,082 7,892
Accruals 665 573
Provision for employee entitlements 1,858 1,986
Other provisions 665 691
Other 1,665 2,943
Carry forward losses 2,620 2,792
14,555 16,877
Deferred tax liabilities
Fixed assets (3,375) (2,583)
Intangible assets (1,301) (1,219)
(4,676) (3,802)
Net deferred tax assets 9,879 13,075
Reconciliation of net deferred tax assets
Opening balance at beginning of period 13,075 10,875
Tax (expense) / benefit during period recognised in profit or loss (2,685) 2,635
Prior year adjustment (340) (179)
Other (171) (256)
Closing balance at end of period 9,879 13,075
(c) Unrecognised deferred tax balances
Deferred income tax relating to the UK in the balance sheet excludes the following:
Tax losses – revenue 4,904 5,253
Operating lease payments are recognised as an expense on a straight-line basis over the lease term, except where another systematic basis is more
representative of the time pattern in which economic benefits from the leased asset are consumed.
Impairment
Impairment expenses are recognised to the extent that the carrying amount of assets exceeds their recoverable amount. Refer to note 3.5 for further
details on impairment.
2.3 Taxation
This note sets out the Group tax accounting policies and provides an analysis of the Group’s income tax expense / benefit and deferred tax balances,
including a reconciliation of tax expense to accounting profit.
Income tax is accounted for using the balance sheet method. Accounting income is not always the same as taxable income, creating timing
differences. These differences usually reverse over time. Until they reverse, a deferred tax asset or liability must be recognised in the statement of
financial position.
(a) Consolidated income statement
The major components of tax expense are:
2017 2016$’000 $’000
Current income tax expense
Current year 4,153 7,868
Adjustment for prior years 402 (134)
Deferred income tax expense
Temporary differences 2,685 (2,635)
Adjustment for prior years 340 178
Income tax expense reported in income statement 7,580 5,277
Tax reconciliation
Profit before tax from continuing operations 28,198 31,171
Income tax at the statutory rate of 30% (2016: 30%) 8,459 9,351
Research and development tax benefits recognised (958) –
Adjustments relating to prior years (20) 44
Income tax rate differential (170) (1,625)
Non-deductible items 203 (2,677)
Tax effect of share-based payment expense 399 (653)
Recognition of previously impaired tax losses (341)
Impairment of tax losses – 837
Other 8 –
Income tax expense on profit before tax 7,580 5,277
2.2 Expenses (continued)
Notes to thefinancial statementsFor the year ended 30 June 2017
—
Cash Converters International Limited – Annual Report 2017 | 7372 | Cash Converters International Limited – Annual Report 2017
For
per
sona
l use
onl
y
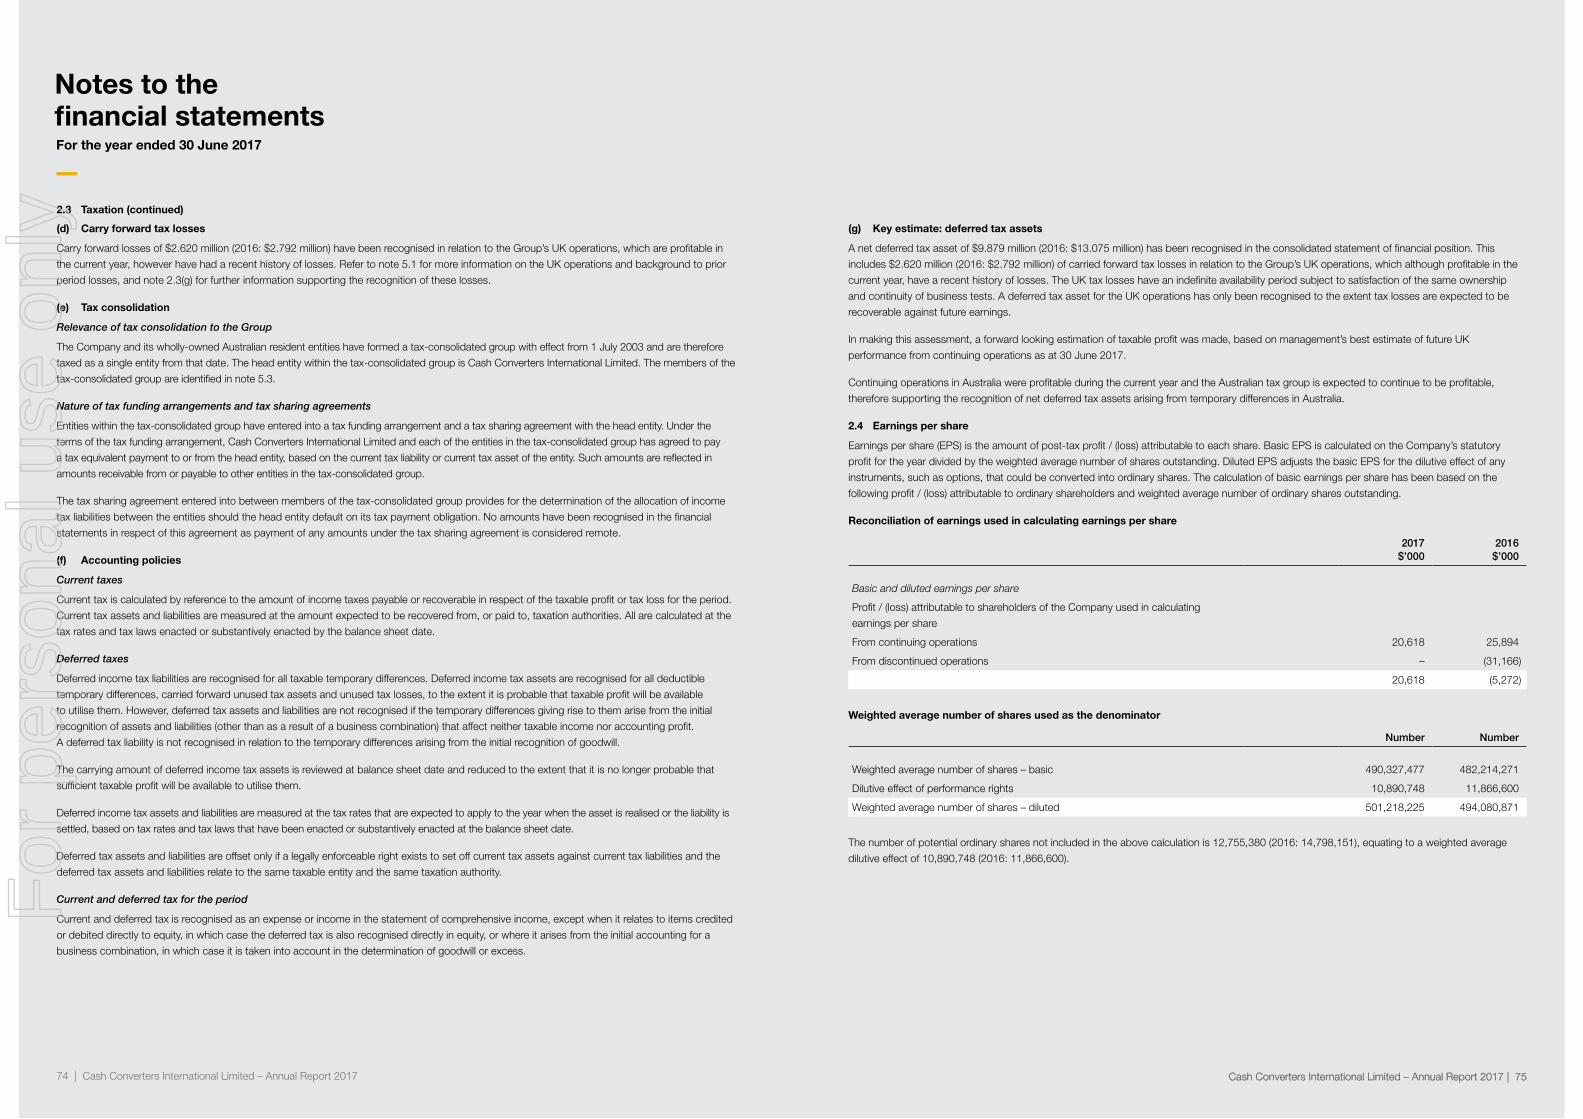
Cash Converters International Limited – Annual Report 2017 | 75
(g) Key estimate: deferred tax assets
A net deferred tax asset of $9.879 million (2016: $13.075 million) has been recognised in the consolidated statement of financial position. This
includes $2.620 million (2016: $2.792 million) of carried forward tax losses in relation to the Group’s UK operations, which although profitable in the
current year, have a recent history of losses. The UK tax losses have an indefinite availability period subject to satisfaction of the same ownership
and continuity of business tests. A deferred tax asset for the UK operations has only been recognised to the extent tax losses are expected to be
recoverable against future earnings.
In making this assessment, a forward looking estimation of taxable profit was made, based on management’s best estimate of future UK
performance from continuing operations as at 30 June 2017.
Continuing operations in Australia were profitable during the current year and the Australian tax group is expected to continue to be profitable,
therefore supporting the recognition of net deferred tax assets arising from temporary differences in Australia.
2.4 Earnings per share
Earnings per share (EPS) is the amount of post-tax profit / (loss) attributable to each share. Basic EPS is calculated on the Company’s statutory
profit for the year divided by the weighted average number of shares outstanding. Diluted EPS adjusts the basic EPS for the dilutive effect of any
instruments, such as options, that could be converted into ordinary shares. The calculation of basic earnings per share has been based on the
following profit / (loss) attributable to ordinary shareholders and weighted average number of ordinary shares outstanding.
Reconciliation of earnings used in calculating earnings per share
2017 2016$’000 $’000
Basic and diluted earnings per share
Profit / (loss) attributable to shareholders of the Company used in calculating
earnings per share
From continuing operations 20,618 25,894
From discontinued operations – (31,166)
20,618 (5,272)
Weighted average number of shares used as the denominator
Number Number
Weighted average number of shares – basic 490,327,477 482,214,271
Dilutive effect of performance rights 10,890,748 11,866,600
Weighted average number of shares – diluted 501,218,225 494,080,871
The number of potential ordinary shares not included in the above calculation is 12,755,380 (2016: 14,798,151), equating to a weighted average
dilutive effect of 10,890,748 (2016: 11,866,600).
(d) Carry forward tax losses
Carry forward losses of $2.620 million (2016: $2.792 million) have been recognised in relation to the Group’s UK operations, which are profitable in
the current year, however have had a recent history of losses. Refer to note 5.1 for more information on the UK operations and background to prior
period losses, and note 2.3(g) for further information supporting the recognition of these losses.
(e) Tax consolidation
Relevance of tax consolidation to the Group
The Company and its wholly-owned Australian resident entities have formed a tax-consolidated group with effect from 1 July 2003 and are therefore
taxed as a single entity from that date. The head entity within the tax-consolidated group is Cash Converters International Limited. The members of the
tax-consolidated group are identified in note 5.3.
Nature of tax funding arrangements and tax sharing agreements
Entities within the tax-consolidated group have entered into a tax funding arrangement and a tax sharing agreement with the head entity. Under the
terms of the tax funding arrangement, Cash Converters International Limited and each of the entities in the tax-consolidated group has agreed to pay
a tax equivalent payment to or from the head entity, based on the current tax liability or current tax asset of the entity. Such amounts are reflected in
amounts receivable from or payable to other entities in the tax-consolidated group.
The tax sharing agreement entered into between members of the tax-consolidated group provides for the determination of the allocation of income
tax liabilities between the entities should the head entity default on its tax payment obligation. No amounts have been recognised in the financial
statements in respect of this agreement as payment of any amounts under the tax sharing agreement is considered remote.
(f) Accounting policies
Current taxes
Current tax is calculated by reference to the amount of income taxes payable or recoverable in respect of the taxable profit or tax loss for the period.
Current tax assets and liabilities are measured at the amount expected to be recovered from, or paid to, taxation authorities. All are calculated at the
tax rates and tax laws enacted or substantively enacted by the balance sheet date.
Deferred taxes
Deferred income tax liabilities are recognised for all taxable temporary differences. Deferred income tax assets are recognised for all deductible
temporary differences, carried forward unused tax assets and unused tax losses, to the extent it is probable that taxable profit will be available
to utilise them. However, deferred tax assets and liabilities are not recognised if the temporary differences giving rise to them arise from the initial
recognition of assets and liabilities (other than as a result of a business combination) that affect neither taxable income nor accounting profit.
A deferred tax liability is not recognised in relation to the temporary differences arising from the initial recognition of goodwill.
The carrying amount of deferred income tax assets is reviewed at balance sheet date and reduced to the extent that it is no longer probable that
sufficient taxable profit will be available to utilise them.
Deferred income tax assets and liabilities are measured at the tax rates that are expected to apply to the year when the asset is realised or the liability is
settled, based on tax rates and tax laws that have been enacted or substantively enacted at the balance sheet date.
Deferred tax assets and liabilities are offset only if a legally enforceable right exists to set off current tax assets against current tax liabilities and the
deferred tax assets and liabilities relate to the same taxable entity and the same taxation authority.
Current and deferred tax for the period
Current and deferred tax is recognised as an expense or income in the statement of comprehensive income, except when it relates to items credited
or debited directly to equity, in which case the deferred tax is also recognised directly in equity, or where it arises from the initial accounting for a
business combination, in which case it is taken into account in the determination of goodwill or excess.
2.3 Taxation (continued)
Notes to thefinancial statementsFor the year ended 30 June 2017
—
Cash Converters International Limited – Annual Report 2017 | 7574 | Cash Converters International Limited – Annual Report 2017
For
per
sona
l use
onl
y

Cash Converters International Limited – Annual Report 2017 | 77
Franchise
operations
Store
operations
Personal
finance
Vehicle
financing
Corporate
head office Total
$’000 $’000 $’000 $’000 $’000 $’000
Year ended 30 June 2017
Interest revenue (i) 2,898 56,511 121,652 5,604 – 186,665
Other revenue 17,983 75,222 – 3,777 – 96,982
Gross revenue 20,881 131,733 121,652 9,381 – 283,647
Less inter-company sales (682) (7,524) (4,558) – – (12,764)
Segment revenue 20,199 124,209 117,094 9,381 – 270,883
External interest revenue (ii) – 13 97 12 468 590
Total revenue 20,199 124,222 117,191 9,393 468 271,473
EBITDA (iii) 11,172 12,318 54,014 (401) (31,378) 45,725
Less inter-company eliminations (682) 5,231 (4,542) (7) – –
Segment EBITDA 10,490 17,549 49,472 (408) (31,378) 45,725
Depreciation and amortisation (149) (3,859) (1,116) (69) (2,930) (8,123)
EBIT 10,341 13,690 48,356 (477) (34,308) 37,602
Interest expense – – (4,154) (415) (4,835) (9,404)
Profit / (loss) before tax from
continuing operations 10,341 13,690 44,202 (892) (39,143) 28,198
Year ended 30 June 2017
Interest revenue (i) 2,053 67,170 158,416 2,743 – 230,382
Other revenue 24,977 73,197 2 5,398 14 103,588
Gross revenue 27,030 140,367 158,418 8,141 14 333,970
Less inter-company sales (6,441) (11,132) (6,995) – – (24,568)
Segment revenue 20,589 129,235 151,423 8,141 14 309,402
External interest revenue (ii) – 77 474 5 37 593
Total revenue 20,589 129,312 151,897 8,146 51 309,995
EBITDA (iii) (iv) 7,271 17,420 65,537 (4,599) (37,932) 47,697
Less inter-company eliminations (346) 6,121 321 – (6,096) –
Segment EBITDA 6,925 23,541 65,858 (4,599) (44,028) 47,697
Depreciation and amortisation (235) (3,936) (302) (133) (2,261) (6,867)
EBIT 6,690 19,605 65,556 (4,732) (46,289) 40,830
Interest expense – (1) (4,116) (508) (5,034) (9,659)
Profit / (loss) before tax from
continuing operations 6,690 19,604 61,440 (5,240) (51,323) 31,171
(i) Interest revenue comprises personal loan interest, cash advance fee income, pawn broking interest from customers and commercial loan
interest from third parties
(ii) External interest is interest received on bank deposits
(iii) EBITDA is earnings before interest, tax, depreciation, amortisation and impairment
(iv) Includes ASIC compliance settlement provision of $12.500 million in corporate head office
2.5 Segment information
The Group’s operating segments are organised and managed separately according to the nature of their operations. Each segment represents a
strategic business unit that provides different services to different categories of customer. The Chief Executive Officer (chief operating decision-
maker) monitors the operating results of the business units separately for the purpose of making decisions about resource allocation and
performance assessment. The Group’s reportable segments under AASB 8 Operating Segments are therefore as follows:
Franchise operations
This involves the sale of franchises for the retail sale of new and second hand goods and the sale of master licenses for the development of
franchises in countries around the world.
Store operations
This segment involves the retail sale of new and second hand goods, cash advance and pawn broking operations at corporate owned stores in
Australia.
Personal finance
This segment comprises the Cash Converters Personal Finance personal loans business and Mon-E, which is responsible for providing the internet
platform and administration services for the Cash Converters network in Australia to offer small cash advance loans to customers. In prior years, this
segment has been disclosed as two separate segments, financial services – personal loans and financial services – administration.
Vehicle financing
This segment comprises Green Light Auto Group Pty Ltd, which provides motor vehicle finance since March 2016, and fully maintained vehicles
through a lease product to customers for a term of up to 4 years (a product that the Group ceased to offer during the 2016 financial year).
The segmental profit analysis has been presented for both financial years for continuing operations only. Refer to note 5.1 for information related to
the Group’s discontinued operations.
The accounting policies of the reportable segments are the same as the Group’s accounting policies.
The following is an analysis of the Group’s revenue and results by reportable operating segment for the periods under review.
Segment profit represents the profit earned by each segment without the allocation of central administration costs and directors’ fees and expenses,
interest income and expense in relation to corporate facilities and tax expense. This is the measure reported to the chief executive officer (chief
operating decision maker) for the purpose of resource allocation and assessment of segment performance.
Notes to thefinancial statementsFor the year ended 30 June 2017
—
Cash Converters International Limited – Annual Report 2017 | 7776 | Cash Converters International Limited – Annual Report 2017
For
per
sona
l use
onl
y

Geographical information
The Group operates in two principal geographical areas – Australia (country of domicile) and the United Kingdom. The Group’s revenue from
continuing operations from external customers and information about its non-current assets by geographical location are detailed below.
Revenue from external customers Non-current assets
2017 2016 2017 2016$’000 $’000 $’000 $’000
Australia 259,345 295,435 142,516 143,654
United Kingdom 11,389 15,707 1,713 1,242
Rest of world 739 457 – –
271,473 311,599 144,229 144,896
Non-current assets include property, plant and equipment, goodwill and other intangible assets, and exclude deferred tax assets, trade and other
receivables and other financial assets.
2.6 Dividends
2017 2016
Per share Total Per share Total
cents $’000 cents $’000
Recognised amounts
Final dividend – prior year 100% franked at 30% 1.00 4,850 – –
Interim dividend – current year 100% franked at 30% – – 2.00 9,637
1.00 4,850 2.00 9,637
Unrecognised amounts
Final dividend – current year 100% franked at 30% – – 1.00 4,850
On 28 October 2016 the Company paid a fully franked final dividend of 1.0 cent per share in respect of the financial year ended 30 June 2016.
The total interim dividend paid was $4.850 million.
On 22 August 2017 the Company announced that there would be no final dividend in respect of the financial year ended 30 June 2017.
The Company has Australian franking credits available of $57.782 million on a tax paid basis (2016: $67.786 million).
2017 2016$’000 $’000
Group assets by reportable segment
Franchise operations 36,573 39,992
Store operations 73,409 84,052
Personal finance 186,195 244,527
Vehicle financing 24,977 13,260
Total of all segments 321,154 381,831
Unallocated assets 77,691 35,212
Total segment assets 398,845 417,043
Assets relating to discontinued operations
Unallocated – 7,448
Consolidated total assets 398,845 424,491
Unallocated assets include various corporate assets including cash held at a corporate level that has not been allocated to the underlying segments.
Group liabilities by reportable segment
Franchise operations 6,879 –
Store operations 7,604 7,636
Personal finance 51,226 87,606
Vehicle financing 3,978 10,291
Total of all segments 69,687 105,533
Unallocated liabilities 68,319 76,673
Consolidated total liabilities 138,006 182,206
Unallocated liabilities include Group borrowings not specifically allocated to the underlying segments.
Other segment information
Depreciation, amortisation
and impairment *
Additions to
non-current assets
2017 2016 2016 2016$’000 $’000 $’000 $’000
Franchise operations 104 1,999 570 4,010
Store operations 3,855 3,935 1,555 3,182
Personal finance 1,081 302 4,291 159
Vehicle financing 72 133 364 136
Total of all segments 5,112 6,369 6,780 7,487
Unallocated 2,185 498 224 321
Total 7,297 6,867 7,004 7,808
* Depreciation, amortisation and impairment from continuing operations
2.5 Segment information (continued)
Notes to thefinancial statementsFor the year ended 30 June 2017
—
Cash Converters International Limited – Annual Report 2017 | 7978 | Cash Converters International Limited – Annual Report 2017
For
per
sona
l use
onl
y

In this section
This section shows the assets used to generate Cash Converters’ trading performance and the liabilities incurred as a result.
Information on other assets and liabilities are in the following sections:
• Section 2 – Deferred tax assets and liabilities
• Section 4 – Financing activities
• Section 5 – Equity-accounted investments
3.1 Trade and other receivables
2017 2016Notes $’000 $’000
Current
Trade receivables (i) 1,187 5,940
Allowance for impairment losses (58) (2,309)
Total trade receivables (net) 1,129 3,631
Finance lease receivables (ii) 506 4,091
Vendor finance loans (iii) 1,521 1,049
Other receivables (iv) 4,415 4,880
Total trade receivables 7,571 13,651
Non-current
Finance lease receivables (ii) 1,932 2,677
Vendor finance loans (iii) 6,628 8,164
Loan to associate (v) 14,908 14,841
Other receivables (iv) 12 84
Total trade and other receivables 23,480 25,766
(i) Trade receivables include weekly franchise fees, wholesale sales, pawn broking fees, cash advance fees, default fees and OTC fees. Where the
collection of the debtor is doubtful, an allowance for impairment losses is recognised. The average credit period on sales is 30 days. No interest is
charged for the first 30 days from the date of the invoice. Thereafter, interest is charged at 2% per month on the outstanding balance.
(ii) The Group entered into finance lease arrangements with customers for leasing of vehicles. All leases are denominated in Australian dollars.
The average term of finance leases entered into is 4 years. The Group ceased entering into such finance lease arrangements from March 2016.
(iii) Vendor finance loans are loans made to purchasers of the Group’s UK corporate stores during the prior year as part of the purchase
agreement. The loans have various terms of up to 6 years, and bear interest at rates between nil and 9%. The receivables are held at amortised
cost. No receivables are past due or impaired at 30 June 2017 (2016: nil).
(iv) Other receivables include GST receivable, development agent fees outstanding, sub-master license sales, Mon-E fees, financial commission
and instalment credit loans. None of these receivables are past due or considered impaired.
(v) Commercial loan advanced to Cash Converters Holdings LP (New Zealand master franchisee) with a maturity date of 15 September 2018.
Interest is charged quarterly at a rate of 8% per annum.
(3) Assets and liabilities2.7 Notes to cash flow statement
Reconciliation of loss to net cash flow from operating activities:
2017 2016$’000 $’000
Profit / (loss) after tax 20,618 (5,272)
Non-cash adjustment to reconcile profit after tax to net cash flows:
Amortisation 3,717 3,334
Depreciation 3,580 5,293
Impairment of non-current assets – 2,247
Share-based payments 1,331 (1,923)
Loss on disposal of non-current assets 826 12,878
Share of net (profit) / loss of equity accounted investment (314) 2,032
Changes in assets and liabilities:
Trade and loan receivables 14,786 14,917
Inventories (3,469) 7,648
Other assets 3,879 976
Trade and other payables (1,686) (6,692)
Provisions (12,574) 3,503
Income tax payables 12,840 (8,867)
Net cash provided by operating activities 43,534 30,074
Cash flows are included in the cash flow statement on a net basis. The GST component of cash flows arising from investing and financing activities
which is recoverable from, or payable to, the taxation authority is classified as operating cash flows.
Notes to thefinancial statementsFor the year ended 30 June 2017
—
Cash Converters International Limited – Annual Report 2017 | 8180 | Cash Converters International Limited – Annual Report 2017
For
per
sona
l use
onl
y

3.2 Loan receivables
2017 2016Notes $’000 $’000
Current
Personal short term loans (i) 117,585 139,526
Allowance for impairment losses (25,286) (26,302)
Deferred establishment fees (ii) (9,575) (11,909)
Total personal short term loans (net) 82,724 101,315
Vehicle finance loans (iii) 5,586 1,134
Allowance for impairment losses (377) (30)
Total vehicle finance loans (net) 5,209 1,104
Total loan receivables 87,933 102,419
Non-current
Vehicle finance loans (iii) 14,037 2,102
(i) The credit period provided in relation to personal short term unsecured loans varies from 30 days to 12 months. Interest is charged on these loans
at a fixed rate which varies dependent on the state or country of origin. An allowance has been made for estimated unrecoverable amounts arising
from loans already issued, which has been determined by reference to past default experience. Before accepting any new customers, the Group
uses an external scoring system to assess the potential customer’s credit quality and define credit limits by customer. There is no concentration of
credit risk within the personal loan book.
(ii) Deferred establishment fees relate to establishment fees charged on personal loans. The full amount of the fee is deferred at the commencement
of the loan and is then recognised through the income statement at an effective interest rate over the life of the loan. The balance shown above
reflects the amount of the fees still to be recognised at the end of the reporting period.
(iii) Vehicle finance loans are secured loans advanced for financing the purchase of vehicles. The average term of these loans is 4.6 years and the
average interest rate is 25.0%.
As at 30 June the ageing analysis of personal loan receivables was as follows:
0 to 30 days 91,277 110,461
31 to 60 days past due not impaired 698 1,434
61 to 90 days past due not impaired 173 401
90 + days past due not impaired 151 161
Considered impaired 25,286 27,069
Balance at end of year 117,585 139,526
As at 30 June the ageing analysis of vehicle finance loan receivables was as follows:
0 to 30 days 18,442 3,206
31 to 60 days past due not impaired 590 –
61 to 90 days past due not impaired 111 –
90 + days past due not impaired 103 –
Considered impaired 377 30
Balance at end of year 19,623 3,236
3.1 Trade and other receivables (continued)
2017 2016Notes $’000 $’000
0 to 30 days 634 3,623
31 to 60 days past due not impaired 21 1
61 to 90 days past due not impaired 22 7
90 + days past due not impaired 452 –
Considered impaired 58 2,309
Balance at end of year 1,187 5,940
Accounting policy
Trade receivables and other receivables that have fixed or determinable payments that are not quoted in an active market are classified as trade and other receivables and are measured at amortised costs using the effective interest method, less any impairment. Interest income is recognised by applying the effective interest rate, except for short-term receivables when the effect of discounting is immaterial.
Amounts due from lessees under finance leases are recognised as receivables at the amount of the Group’s net investment in the leases. Finance lease income is allocated to accounting periods so as to reflect a constant periodic rate of return on the Group’s net investment outstanding in respect of the leases.
Allowance for impairment losses
As at 30 June 2017, trade receivables and instalment credit loans of $58 thousand (2016: $2.309 million) were impaired and fully provided for. Movements in the provision for impairment of trade receivables were as follows:
Balance at beginning of year 2,309 2,553
Impairment losses recognised on receivables 58 311
Amounts written off as uncollectible (2,309) (555)
Balance at end of year 58 2,309
Amounts receivable under finance leases
Minimum lease payments
Present value of minimum
lease payments
2017 2016 2017 2016$’000 $’000 $’000 $’000
Not later than one year 3,309 7,030 1,768 5,174
Later than one year and not later than five years 1,734 7,614 1,932 2,677
5,043 14,644 3,700 7,851
Less unearned finance income (1,343) (6,793) – –
Present value of minimum lease payments receivable 3,700 7,851 3,700 7,851
Allowance for uncollectible lease payments (1,262) (1,083) (1,262) (1,083)
2,438 6,768 2,438 6,768
Unguaranteed residual values of assets leased under finance leases at the end of the reporting period are estimated at $1.312 million (30 June 2016: $2.213 million). The residual amounts have been excluded from the above calculations in the present value amounts – the amounts only relate to the minimum repayments.
The interest rate inherent in the leases is fixed at the contract date for the entire lease term. The average effective interest rate contracted is approximately 26.0% (30 June 2016: 26.6%) per annum.
As at 30 June the ageing analysis of trade receivables was as follows:
Notes to thefinancial statementsFor the year ended 30 June 2017
—
Cash Converters International Limited – Annual Report 2017 | 8382 | Cash Converters International Limited – Annual Report 2017
For
per
sona
l use
onl
y

3.4 Plant and equipment
Leasehold
improvements
Plant and
equipment
Leasehold
improvements
under finance
lease Total
$’000 $’000 $’000 $’000
Cost
Balance at 1 July 2015 13,219 36,351 1,049 50,619
Additions 2,652 1,346 – 3,998
Transfers to intangible assets – (4,626) – (4,626)
Disposals (3,497) (19,765) (1) (23,263)
Foreign currency exchange differences (29) (187) – (216)
Balance at 30 June 2016 12,345 13,119 1,048 26,512
Additions 543 666 – 1,209
Transfers between asset categories 772 276 (1,048) –
Transfers to intangible assets – (1,020) – (1,020)
Disposals – (1,298) – (1,298)
Foreign currency exchange differences (4) (39) – (43)
Balance at 30 June 2017 13,656 11,704 – 25,360
Depreciation and impairment
Balance at 1 July 2015 5,670 18,760 831 25,261
Disposals (2,106) (15,698) – (17,804)
Depreciation expense 1,693 3,478 122 5,293
Impairment – 116 – 116
Foreign currency exchange differences (24) (183) – (207)
Balance at 30 June 2016 5,233 6,473 953 12,659
Disposals – (1,070) – (1,070)
Transfers between asset categories 181 772 (953) –
Depreciation expense 1,688 1,892 – 3,580
Foreign currency exchange differences (4) (38) – (42)
Balance at 30 June 2017 7,098 8,029 – 15,127
Net book value
As at 30 June 2016 7,112 6,646 95 13,853
As at 30 June 2017 6,558 3,675 – 10,233
Total depreciation expense for the year ended 30 June 2016 includes $1.704 million of depreciation relating to discontinued operations.
Accounting policies
Plant and equipment, leasehold improvements and equipment under finance lease are stated at cost less accumulated depreciation and impairment.
Cost includes expenditure that is directly attributable to the acquisition of the item. In the event that settlement of all or part of the purchase
consideration is deferred, cost is determined by discounting the amounts payable in the future to their present value as at the date of acquisition.
Allowance for impairment losses
As at 30 June 2017, personal loan receivables of $25.286 million (2016: $26.302 million) were impaired and fully provided for. Movements in the provision for impairment of personal loan receivables were as follows:
2017 2016$’000 $’000
Balance at beginning of year 26,302 29,104
Impairment losses recognised on receivables 37,295 39,303
Amounts written off as uncollectible (38,311) (42,105)
Balance at end of year 25,286 26,302
In determining the recoverability of a personal loan, the Group considers any change in the credit quality of the receivable from the date credit was initially granted up to the reporting date. The concentration of credit risk is limited due to the customer base being large and unrelated. Accordingly, the directors believe that there is no further credit provision required in excess of the allowance for doubtful debts.
As at 30 June 2017 vehicle finance loan receivables of $377 thousand (2016: nil) were impaired and fully provided for. Movements in the provision for impairment of vehicle finance loan receivables were as follows:
Balance at beginning of year 30 –
Impairment losses recognised on receivables 347 30
Amounts written off as uncollectible – –
Balance at end of year 377 30
In determining the recoverability of a vehicle finance loan, the Group considers any change in the credit quality of the receivable from the date credit was initially granted up to the reporting date. As the current customer base is relatively small, the Group has made a provision based on known historical losses and reasonable estimation of expected future losses. As these loans are secured by the underlying vehicle financed, the total loss will be reduced by the recoverable amount. Accordingly, the directors believe that there is no further credit provision required in excess of the allowance for doubtful debts.
Accounting policy
Loan receivables that have fixed or determinable payments that are not quoted in an active market are classified as loan receivables and are measured at amortised costs using the effective interest method, less any impairment. Interest income is recognised by applying the effective interest rate, except for short-term receivables when the effect of discounting is immaterial.
Key estimate – impairment of financial assets
The impairment of personal loans requires the Group to assess impairment regularly. The credit provisions raised (specific and collective) represent management’s best estimate of the losses incurred in the loan portfolio at reporting date based on their experienced judgment. The collective provision is estimated on the basis of historical loss experience for assets with similar credit characteristics. The historical loss experience is adjusted based on current observable data and events. The use of such judgments and reasonable estimates is considered appropriate.
3.3 Inventories
New and pre-owned goods at cost 20,651 16,927
New and used motor vehicles at cost 340 685
20,991 17,612
Accounting policies
Inventories are valued at the lower of cost and net realisable value. Costs, including purchase costs on a first in first out basis are assigned to inventory on hand by the method most appropriate to each particular class of inventory, with the majority being valued on a first in first out basis. Net realisable value represents the estimated selling price less all estimated costs of completion and costs necessary to make the sale. With a significant proportion of inventory being jewellery, which retains its value, acquired from customers across 71 corporate stores and by the diverse range of other products, the overall exposure to obsolescence is minimal. Inventory is appropriately discounted in stores as it ages in order to effect a sale. The Company has therefore determined no obsolescence provision is required.
3.2 Loan receivables (continued)
Notes to thefinancial statementsFor the year ended 30 June 2017
—
Cash Converters International Limited – Annual Report 2017 | 8584 | Cash Converters International Limited – Annual Report 2017
For
per
sona
l use
onl
y

Allocation of goodwill to CGUs
Goodwill has been allocated for impairment testing purposes to the following CGUs or groups of CGUs:
2017 2016$’000 $’000
Personal finance 90,561 90,561
Store operations 16,448 16,448
107,009 107,009
Impairment losses recognised
No impairment losses have been recognised in the year ended 30 June 2017.
Year ended 30 June 2016
Impairment testing of non-current assets, including those with indefinite useful lives, using value in use calculations, at 31 December 2015 identified
goodwill balances of $1.354 million, other intangible asset balances of $777 thousand and plant and equipment balances of $116 thousand that
were not considered recoverable. These balances related to specific stores within the UK corporate stores network. Subsequent to the impairment
testing, all of the UK corporate stores were sold, resulting in the derecognition of any related goodwill as part of the loss on disposal. Refer to note
5.1 for further information.
Impairment testing and key assumptions
Impairment testing approach applicable to all CGUs
Impairment modelling for each CGU has been prepared separately based on a value in use model which uses cash flow projections based on budgets
approved by management covering a five-year period. Cash flows beyond the five-year period are estimated using a terminal value calculated based on
a terminal growth rate under standard valuation principles.
Key assumptions are based on a combination of past experience for mature products and external sources (market data) for less mature products and
economic metrics such as interest rates. In FY 2018 revenue and expenses are forecast to reduce due to decreasing loan volumes as a result of the
changes to the Company’s credit assessment process before recovering to grow at levels below those historically observed. Growth in lending volumes
is expected to be driven primarily by the recently launched MACC product.
Working capital requirements are factored into the modelling based on historic requirements for each CGU, and vary in line with earnings growth.
Capital investment, required to run the business (i.e. replacement and non-expansionary capital expenditure) has been included based on budgeted
amounts for the next financial year and incremental growth in subsequent years consistent with increasing revenues.
The recoverable value of all non-current assets, including goodwill, property, plant and equipment (note 3.4) and other intangible assets (note 3.6) is
assessed using the impairment testing as outlined in this note.
Impact of regulations
The Personal Finance business operates in a regulated industry. The impairment testing for this business segment is based on management’s
expectation of performance, taking into account applicable legislative requirements at the date of the impairment testing, being 30 June 2017. Any
material change to legislation impacting this business in future periods may have a significant positive or negative impact on future performance and
may result in an impairment.
Depreciation is provided on plant and equipment. Depreciation is calculated on a straight line basis so as to write off the net cost or other revalued
amount of each asset over its expected useful life to its estimated residual value. Leasehold improvements are depreciated over the period of the
lease or estimated useful life, whichever is the shorter, using the straight line method. The estimated useful lives, residual values and depreciation
method are reviewed at the end of each annual reporting period. The following estimated useful lives are used in the calculation of depreciation:
Leasehold improvements 8 years
Plant and equipment 5 years
Equipment under finance lease 5 years
Fixtures and fittings 8 years
3.5 Goodwill
2017 2016Notes $’000 $’000
Gross carrying amount
Balance at beginning of year 107,009 118,565
Derecognised on disposal of discontinued operations 5.1 – (11,459)
Foreign currency exchange differences – (97)
Balance at end of year 107,009 107,009
Accumulated impairment losses
Balance at beginning of year – 7,157
Impairment losses for year – 1,354
Derecognised on disposal of discontinued operations 5.1 – (8,515)
Foreign currency exchange differences – 4
Balance at end of year – –
Net carrying amount
At beginning of year 107,009 111,408
At end of year 107,009 107,009
Accounting policies
Goodwill arising on an acquisition of a business is carried at cost at the date of acquisition of the business less accumulated impairment losses, if any.
For the purposes of impairment testing, goodwill is allocated to each of the Group’s cash-generating units (CGUs) that are expected to benefit from
the synergies of the combination. CGUs to which goodwill has been allocated are tested for impairment annually, or more frequently when there is an
indication that the unit may be impaired. If the recoverable amount of the CGU is less than its carrying amount, the impairment loss is allocated first to
reduce the carrying amount of any goodwill allocated to the CGU and then to the other assets of the unit pro rata based on the carrying amount of each
asset in the CGU. An impairment loss recognised for goodwill is recognised directly in profit or loss and is not reversed in subsequent periods.
On disposal of the relevant CGU, the attributable amount of goodwill is included in the determination of the profit or loss on disposal.
3.4 Plant and equipment (continued)
Notes to thefinancial statementsFor the year ended 30 June 2017
—
Cash Converters International Limited – Annual Report 2017 | 8786 | Cash Converters International Limited – Annual Report 2017
For
per
sona
l use
onl
y

Whilst ultimately the Group’s business operations could potentially be adjusted to mitigate the impact of these changes, the likely impact of the legislation
if enacted in its current proposed form from 1 July 2018, based on the current profile of the loan book and with reasonably possible changes to other key
assumptions being taken into account, may result in an impairment within a range of $35 million to $48 million.
As outlined above, this estimate is subject to significant variability due to both the ultimate form and enactment date of the legislation, both of which
are uncertain, as well as the profile of the loan book when any applicable legislative changes were to come into effect.
Additionally, at both the date of impairment testing and the date of this report there is no certainty that any change to applicable legislation will be made.
3.6 Other intangible assets
Allocation of other intangible assets to CGUs
Other intangible assets are allocated to their respective CGU and tested for impairment when impairment indicators are identified. Refer to note 3.5 for
details of impairment testing. The recoverable value of other intangible assets is assessed using the same assumptions and methods as the goodwill for
the related CGUs.
No impairment has been recognised in the year ended 30 June 2017 (2016: $777 thousand).
The allocation of other intangible assets to CGUs is as follows:
2017 2016$’000 $’000
Franchise operations (excluding UK) 9,771 8,318
Franchise operations (UK) 2,805 1,222
Personal finance 8,491 11,576
Store operations 4,673 2,908
Vehicle financing 1,247 10
26,987 24,034
The following key assumptions were used in the impairment testing:
Assumption Personal finance Store operations
2018 budget revenue growth / (reduction) (7%) (3%)
2018 budget expense growth / (reduction) (5%) (5%)
Revenue growth rate > 1 year 1% – 5% 1% – 3%
Expense growth rate > 1 year (2%) – 2% 2% – 3%
Terminal growth rate > 5 years 2.5% 2.5%
Pre-tax discount rate applied to cash flows 14.9% 16.0%
Bad debt rates have been forecast based on current average rates and are adjusted in future periods to move towards industry and historical averages
for individual products experienced by the Group. This projection reflects the benefits of the enhanced credit assessment processes which were
implemented in the current year, and consequent anticipated lower bad debt rates.
For the year ended 30 June 2016 the key assumptions used included:
• 2017 growth rates for revenue and expenses in Personal finance of -22% and -17% respectively, in the following years growth rates ranged from
-9% to +11% for revenue and -2% to +6% for expenses;
• 2017 growth rates for revenue and expenses in Store operations of -8% and -3% respectively, in the following years growth rates ranged from
+2% to +3% for revenue and +2% for expenses;
• Pre-tax discount rates ranging from 12.5% to 14.5% and terminal growth rates of 2.5%.
Impairment sensitivity disclosures
Based on the impairment testing completed for all CGUs, management believe that any reasonably possible change in the key assumptions on
which the recoverable amount is based would not cause the carrying amount to exceed the recoverable amount of each CGU as at 30 June 2017.
Reasonably possible changes are considered in the context of regulatory requirements that have been enacted or substantively enacted at the date
of the impairment testing, or where the outcome of future changes can reasonably be modelled at the date of impairment testing.
With this in mind, potential future legislative changes not yet enacted or substantively enacted may significantly impact the Group’s operations,
should they be introduced in future periods.
On 3 March 2016, the Small Amount Credit Contracts Review Final Report (the Final Report) was delivered by the Review Panel (the Panel) to the
Minister for Small Business and Assistant Treasurer. The report outlines proposed regulatory requirements relating to the Protected Earnings Amount
(PEA) cap that have the potential to significantly impact Small Amount Credit Contract (SACC) lending volumes, which would impact the Group’s
Personal Loan and Cash Advance products.
On 28 November 2016, the Minister announced the Government’s response to the report which supported the recommendation to extend the
SACC PEA amount requirement to all consumers, and lowering it to 10 per cent of the consumer’s net income.
Subsequent to this announcement there has been no further public consultation in relation to the proposed scope and form of any potential legislative
changes, and no timetable has been released around when any such proposed draft legislation would be submitted to Parliament for consideration.
Additionally, the industry continues to work with the Government on this important legislative matter.
Consequently, there is significant uncertainty with respect to the timing of enacting any legislative change, as well as the final scope and form of any
eventual change, if any.
The recoverable value of both the Personal finance and Store operations businesses may be impacted by potential future legislative changes given
the impact on both the Group’s personal loan and cash advance operations. Refer to note 2.5 for further information on the Group’s operations.
3.5 Goodwill (continued)
Notes to thefinancial statementsFor the year ended 30 June 2017
—
Cash Converters International Limited – Annual Report 2017 | 8988 | Cash Converters International Limited – Annual Report 2017
For
per
sona
l use
onl
y

Intangible assets are amortised as follows:
Asset Amortisation period
Reacquired rights The remaining life of each franchise agreement as at the acquisition date
Customer relationships Useful life of 5 years based on historic average customer relationships
Trade names Useful life which is not more than 100 years
Software Useful life of between 5 and 8 years based on historic experience
Key estimate – useful lives of other intangible assets
The Company reviews the estimated useful lives of other intangible assets at the end of each annual reporting period. The estimation of the
remaining useful lives of other intangible assets requires the entity to make significant estimates based on both past performance and expectations
of future performance.
3.7 Trade and other payables
2017 2016Notes $’000 $’000
Current
Trade payables 2,495 2,415
Accruals 18,793 17,406
21,288 19,821
The Group has financial risk management policies in place to ensure that all payables are paid within the allowed credit period in order to avoid the
payment of interest on outstanding accounts.
3.8 Provisions
Current
Employee benefits 5,834 6,321
Fringe benefits tax 168 49
ASIC compliance (i) – 12,500
Onerous lease contracts (ii) 1,055 2,205
Other 7 1,352
7,064 22,427
Non-current
Employee benefits 790 298
Onerous lease contracts (ii) 1,627 5,676
2,417 5,974
(i) On 9 November 2016, the Company announced that it had entered into an enforceable undertaking with ASIC in relation to its compliance
with certain provisions applicable to small amount credit contracts under the National Consumer Credit Protection Act 2009 (Cth). Prior to this
announcement, the Company had recognised a provision of $12.500 million in respect of any potential compliance issues in its credit assessment
processes, based on Cash Converters’ best estimate of the likely outcome of discussions with ASIC at the date of the 2016 financial report. As at
30 June 2017 $391 thousand for customer remediation remains outstanding and is classified within trade payables, the balance having been paid
during the year.
(ii) The provision for onerous lease contracts relates to the Group’s discontinued UK operations.
Categories of other intangible assets
Reacquired
rights
Trade names
& customer
relationships Software Total
$’000 $’000 $’000 $’000
Cost
Balance at 1 July 2015 11,360 16,936 12,356 40,652
Additions 172 – 3,638 3,810
Transfers from plant & equipment – – 4,626 4,626
Disposals (3,698) (68) (6,100) (9,866)
Foreign currency exchange differences (135) – – (135)
Balance at 30 June 2016 7,699 16,868 14,520 39,087
Additions – – 6,305 6,305
Transfers from plant & equipment – – 1,020 1,020
Disposals – – (2,719) (2,719)
Foreign currency exchange differences (61) – 4 (57)
Balance at 30 June 2017 7,638 16,868 19,130 43,636
Amortisation and impairment
Balance at 1 July 2015 4,597 6,506 4,842 15,945
Disposals (1,838) (163) (2,972) (4,973)
Amortisation expense 480 1,044 1,810 3,334
Impairment 777 – – 777
Foreign currency exchange differences (30) – – (30)
Balance at 30 June 2016 3,986 7,387 3,680 15,053
Disposals – – (2,109) (2,109)
Amortisation expense 542 964 2,211 3,717
Foreign currency exchange differences (12) – – (12)
Balance at 30 June 2017 4,516 8,351 3,782 16,649
As at 30 June 2016 3,712 9,481 10,840 24,034
As at 30 June 2017 3,122 8,517 15,348 26,987
Total amortisation expense for the year ended 30 June 2016 includes $56 thousand relating to discontinued operations.
Accounting policies
Reacquired rights and Customer relationships acquired through business combinations are recognised at fair value at acquisition date less
accumulated amortisation and impairment.
Trade names relating to repurchased sub-master licenses both overseas and in Australia are recognised at cost less accumulated amortisation.
Software development expenditure is recognised as an asset when it is possible that future economic benefits attributable to the asset will flow.
Software assets are recognised at cost less accumulated amortisation.
3.6 Other intangible assets (continued)
Notes to thefinancial statementsFor the year ended 30 June 2017
—
Cash Converters International Limited – Annual Report 2017 | 9190 | Cash Converters International Limited – Annual Report 2017
For
per
sona
l use
onl
y

4.2 Borrowings
2017 2016Notes $’000 $’000
Current
Securitisation facility (i) 44,426 67,047
Loans – vehicle finance (ii) 1,799 2,945
Hire purchase and lease liabilities 78 31
46,303 70,023
Non-current
Loans – vehicle finance (ii) 1,229 4,432
Bonds (iii) 59,705 59,452
Hire purchase and lease liabilities – 77
60,934 63,961
(i) The securitisation facility represents a liability owed by CCPF Receivables Trust No 1, a consolidated subsidiary established as part of the
borrowing arrangement with the Fortress Investment Group. This liability is secured against eligible personal loan receivables originated by
CCPF, which have been assigned to the Trust and generally have a maturity of less than twelve months. Collections from Trust receivables are
used to pay interest of the securitisation facility, with the remainder remitted to CCPF on a monthly basis. The facility has been presented as
a current liability because the Trust does not have the unconditional right to defer settlement of the liability for at least twelve months after the
reporting period. In the ordinary course of business, the Group currently expects to utilise this facility until at least 15 March 2019.
(ii) Loans – Vehicle Finance represents a vehicle leasing facility with FleetPartners for the provision of high quality fully maintained vehicles for the
use of Green Light Auto’s customers. The underlying financing from FleetPartners is repayable in line with the contractual repayments from the
customer and is therefore repayable over the underlying vehicle lease term.
(iii) Represents a September 2013 issue of $60 million of senior unsecured 7.95% notes which mature in September 2018 with FIIG Securities
Limited. Direct borrowing costs have been capitalised and offset against the liability.
Accounting policies
Borrowings are recorded initially at fair value, net of transaction costs. Subsequent to initial recognition, borrowings are measured at amortised
cost with any difference between the initial recognised amount and the redemption value being recognised in profit and loss over the period of the
borrowing using the effective interest rate method. All other borrowing costs are recognised in profit or loss in the period
in which they are incurred.
Assets held under finance leases are initially recognised at their fair value or, if lower, at amounts equal to the present value of the minimum lease
payments, each determined at the inception of the lease. The corresponding liability to the lessor is included in the balance sheet as a finance lease
obligation. Lease payments are apportioned between finance charges and reduction of the lease obligation so as to achieve a constant rate of
interest on the remaining balance of the liability. Finance charges are charged directly against income.
Accounting policies
Provisions are recognised when the Group has a present obligation, the future sacrifice of economic benefits is probable, and the amount of the
provision can be measured reliably.
The amount recognised as a provision is the best estimate of the consideration required to settle the present obligation at reporting date, taking into
account the risks and uncertainties surrounding the obligation. Where a provision is measured using the cash flows estimated to settle the present
obligation, its carrying amount is the present value of those cash flows.
When some or all of the economic benefits required to settle a provision are expected to be recovered from a third party, the receivable is
recognised as an asset if it is virtually certain that recovery will be received and the amount of the receivable can be measured reliably.
A liability is recognised for benefits accruing to employees in respect of wages and salaries, annual leave, long service leave and personal
leave when it is probable that settlement will be required and they are capable of being measured reliably. Liabilities recognised in respect of
short-term employee benefits are measured at their nominal values using the remuneration rate expected to apply at the time of settlement. Liabilities
recognised in respect of long-term employee benefits are measured as the present value of the estimated future cash outflows to be
made by the Group in respect of services provided by employees up to reporting date.
(4) Capital structure and financing costs
In this section
This section outlines how the Group manages its capital structure and related financing costs, including its balance sheet liquidity and access to
capital markets.
The Board determines the appropriate capital structure of the Group, specifically how much is raised from shareholders (equity) and how much is
borrowed from financial institutions and capital markets (debt), in order to finance the Group’s activities both now and in the future.
The Board considers the Group’s capital structure and its dividend policy at least twice a year ahead of announcing results, in the context of its
ability to continue as a going concern, to execute the strategy and to deliver its business plan.
4.1 Cash and cash equivalents
2017 2016$’000 $’000
Cash on hand 2,991 2,831
Cash at bank 77,580 70,778
80,571 73,609
Cash at bank includes restricted cash of $15.101 million (2016: $21.060 million) that is held in accounts controlled by the CCPF Receivables Trust
No 1 that was established to operate the Company’s securitisation facility with Fortress Finance. The facility prescribes that cash deposited in this
account can only be used to fund new principal advances. Surplus funds at the end of the period are redistributed in keeping with the terms of the
securitisation facility. Cash at bank includes a further $5.482 million (2016: $5.871 million) on deposit as security for banking facilities.
3.8 Provisions (continued)
Notes to thefinancial statementsFor the year ended 30 June 2017
—
Cash Converters International Limited – Annual Report 2017 | 9392 | Cash Converters International Limited – Annual Report 2017
For
per
sona
l use
onl
y

(a) Categories of financial instruments
2017 2016$’000 $’000
Financial assets
Cash and cash equivalents 80,571 73,609
Trade and other receivables 31,051 39,417
Personal loan receivables 101,970 104,521
213,592 217,547
Financial liabilities
Trade and other payables 21,288 19,821
Borrowings 107,237 133,984
128,525 153,805
The Group has no material financial assets or liabilities that are held at fair value.
(b) Financial risk management objectives
The Group’s treasury function provides services to the business, co-ordinates access to domestic and international financial markets, and manages
the financial risks relating to the operations of the Group. The Group does not enter into or trade financial instruments, including derivative financial
instruments, for speculative purposes. The Group’s activities expose it primarily to the financial risks of changes in foreign currency exchange rates
and interest rates.
(c) Market risk
The Group’s activities expose it primarily to the financial risks of changes in foreign currency exchange rates and interest rates. There has been no
change to the Group’s exposure to market risks or the manner in which it manages and measures the risk from the previous period.
(d) Foreign currency risk management
The Group undertakes certain transactions denominated in foreign currencies, hence exposures to exchange rate fluctuations arise. Exchange rate
exposures are relatively small and spot rates are normally used to translate transactions into the reporting currency. There are no foreign currency
denominated monetary assets or monetary liabilities in the Group at the reporting date (2016: nil) other than in the functional currency of the
operating entity.
(e) Interest rate risk management
The Company and the Group are exposed to interest rate risk as entities in the consolidated Group borrow funds at variable rates and place funds
on deposit at variable rates. Personal loans issued by the Group are at fixed rates. The risk is managed by the Group by monitoring interest rates.
The Company and the Group’s exposures to interest rates on financial assets and financial liabilities are detailed in the liquidity risk management
section of this note.
Interest rate sensitivity analysis
The sensitivity analyses below have been determined based on the exposure to interest rates at the reporting date and the stipulated change
taking place at the beginning of the financial year and held constant throughout the reporting period. A 50-basis point increase or decrease is used
because this represents management’s assessment of the possible change in interest rates.
At reporting date, if interest rates had been 50 basis points higher or lower and all other variables were held constant, the Group’s net profit would
increase / decrease by approximately $61 thousand (2016: increase / decrease by approximately $1 thousand).
4.2 Borrowings (continued)
Financing arrangements
Unrestricted access was available at balance date to the following lines of credit:
2017 2016$’000 $’000
Total facilities
Bank overdrafts – 300
Securitisation facilities 100,000 100,000
Bond 60,000 60,000
160,000 160,300
Used at balance date
Bank overdrafts – –
Securitisation facilities 45,500 68,750
Bond 60,000 60,000
105,500 128,750
Unused at balance date
Bank overdrafts – 300
Securitisation facilities 54,500 31,250
54,500 31,550
Refer to note 4.3 for further information in relation to financial instruments.
Loan covenants and review events
The Group has borrowing facilities which are subject to various covenants and review events. The securitisation has various eligibility criteria which the
receivables of the Group must meet to be funded under the facility. Under the bond facility, amongst other covenants, the Group must maintain sufficient
interest cover in the event of new financial indebtedness being incurred and requires dividends only be paid out of available profits. During the reporting
period there have been no events that would cause these covenants to be breached.
4.3 Financial risk factors
The Group’s activities expose the Group to a variety of financial risks: market risks (including currency risk and interest rate risk), credit risk and
liquidity risk. The Group’s overall risk management programme focuses on the unpredictability of financial markets and seeks to minimise potential
adverse effects on financial performance.
Financial risk and capital management is carried out in accordance with policies approved by the Board. The Board reviews and approves written
principles of overall risk management, as well as written policies covering specific areas such as managing capital, mitigating interest rates, liquidity,
foreign exchange and credit risk. The Audit and Risk Committee assists the Board in monitoring the implementation of risk management policies.
Notes to thefinancial statementsFor the year ended 30 June 2017
—
Cash Converters International Limited – Annual Report 2017 | 9594 | Cash Converters International Limited – Annual Report 2017
For
per
sona
l use
onl
y

Financial assets
The following table details the Group’s expected maturity for its financial assets. The table below has been drawn up based on the undiscounted
contractual maturities of the financial assets including interest that will be earned on those assets except where the Company / Group anticipates that
the cash flow will occur in a different period.
Weighted
average
effective
interest rate
1 year
or less
1 to 5
years
More than
5 years Total
% $’000 $’000 $’000 $’000
2017
Non-interest bearing 0.00 35,032 – – 35,032
Fixed interest rate instruments 105.39 179,223 46,452 – 225,675
Variable interest rate instruments 2.10 33,224 – – 33,224
247,479 46,452 – 293,931
2016
Non-interest bearing 0.00 6,105 – – 6,105
Fixed interest rate instruments 112.94 175,673 17,600 – 193,273
Variable interest rate instruments 1.07 69,715 – – 69,715
251,493 17,600 – 269,093
The amounts included above for variable interest rate instruments for both assets and liabilities are subject to change if actual rates differ from those
applied in the above average calculations.
(h) Fair value of financial instruments
The fair value of the Group’s financial assets and liabilities are determined on the following basis:
Financial assets and financial liabilities that are measured at fair value on a recurring basis
Subsequent to initial recognition, at fair value financial instruments are grouped into Levels 1 to 3 based on the degree to which the fair value
is observable. Levels are defined as follows:
• Level 1 fair value measurements are those derived from quoted prices (unadjusted) in active markets for identical assets or liabilities.
• Level 2 fair value measurements are those derived from inputs other than quoted prices included with Level 1 that are observable for the asset
or liability, either directly (i.e. as prices) or indirectly (i.e. derived from prices).
• Level 3 fair value measurements are those derived from valuation techniques that include inputs for the asset or liability that are not based on
observable market data (unobservable inputs).
At 30 June 2017 and 30 June 2016, the Group has no material financial assets and liabilities that are measured on a recurring basis at fair value.
Financial assets and financial liabilities that are not measured at fair value on a recurring basis (but where fair value disclosures are required)
At 30 June 2017 and 30 June 2016, the carrying amount of financial assets and financial liabilities for the Group is considered to approximate their
fair values.
The fair value of the monetary financial assets and financial liabilities is based upon market prices where a market price exists or by discounting the
expected future cash flows by the current interest rates for assets and liabilities with similar risk profiles.
4.3 Financial risk factors (continued)
(f) Credit risk management
Credit risk refers to the risk that a counter-party will default on its contractual obligations resulting in financial loss to the Group. The Group measures
credit risk on a fair value basis. The Group does not have any significant credit risk exposure to any single counterparty or any group of counterparties
having similar characteristics, other than its franchisees. The Group has a policy of obtaining sufficient collateral or other securities from these
franchisees. The majority of loans within the financing division relate to loans made by Cash Converters Personal Finance which may be both secured
and unsecured personal loans. Credit risk is present in relation to all unsecured loans made which is managed within an agreed corporate policy on
customer acceptance and ongoing review of recoverability.
(g) Liquidity risk management
Ultimate responsibility for liquidity risk management rests with the Board of directors, who have built an appropriate liquidity risk management framework
for the management of the Group’s short, medium and long-term funding and liquidity management requirements. The Group manages liquidity risk by
maintaining adequate cash reserves, banking facilities and reserve borrowing facilities by continuously monitoring forecast and actual cash flows and
matching maturity profiles of financial assets and liabilities. Included in note 4.2 is a listing of additional undrawn facilities that the Company / Group has
at its disposal to further reduce liquidity risk.
Liquidity and interest risk tables
Financial liabilities
The following table details the Group’s remaining contractual maturity for its financial liabilities. The table has been drawn up based on the undiscounted
cash flows of financial liabilities based on the earliest date on which the Group can be required to pay. The table includes both interest and principal
cash flows.
To the extent that interest flows are at floating rates, the undiscounted amount is derived from interest rate curves at the end of the reporting period. The
contractual maturity is based on the earliest date on which the Group may be required to pay.
Weighted
average
effective
interest rate
1 year
or less
1 to 5
years
More than
5 years Total
% $’000 $’000 $’000 $’000
2017
Non-interest bearing 0.00 21,288 – – 21,288
Finance lease liability – fixed rate 7.59 83 – – 83
Fixed interest rate instruments 7.93 1,936 66,565 – 68,501
Variable interest rate instruments 7.67 44,426 – – 44,426
67,733 66,565 – 134,298
2016
Non-interest bearing 0.00 19,821 – – 19,821
Finance lease liability – fixed rate 7.59 3,202 5,365 – 8,567
Fixed interest rate instruments 7.95 – 70,732 – 70,732
Variable interest rate instruments 7.90 74,182 – – 74,181
97,205 76,097 – 173,302
Notes to thefinancial statementsFor the year ended 30 June 2017
—
Cash Converters International Limited – Annual Report 2017 | 9796 | Cash Converters International Limited – Annual Report 2017
For
per
sona
l use
onl
y

(5) Group structure
In this section
This section provides information to assist users understand how the Group structure affects the financial position and performance of the Group
as a whole. The Group includes entities that are classified as associates, which are accounted for using the equity method.
In this section of the notes there is information about:
1. Changes to the structure that occurred during the prior year as a result of business combinations or the disposal of a discontinued operation;
2. Investments in associates;
3. Composition of the Group; and
4. Parent entity financial information.
5.1 Discontinued operations
(a) Description
On 29 February 2016, the Company announced that its UK operation would return to its original role as a master franchisor and subsequently
disposed of all the assets and liabilities of the majority of its corporate owned stores to franchisees, with the remainder closed, and ceased lending
through its UK personal loan book. Assets disposed included plant and equipment, intangible assets (reacquired rights, trade names and customer
relationships) and store inventory.
(b) Financial performance and cash flow information
The results of the discontinued operations (UK retail and personal loan business) included in the loss for the year ended 30 June 2016 are set
out below.
2016$’000
Revenue 74,467
Expenses (93,302)
Impairment of non-current assets (2,248)
Loss on disposal of assets (10,083)
Loss before income tax (31,166)
Income tax expense –
Loss after income tax of discontinued operations (31,166)
Net cash flows from discontinued operations
Net cash outflows from operating activities (6,050)
Net cash inflows from investing activities 415
Net cash outflows from financing activities (13)
Net cash (outflows) / inflows from discontinued operations (5,648)
Accounting policies
A discontinued operation is a component of the entity that has been disposed of or is classified as held for sale and that represents a separate
major line of business or geographical area of operations, is part of a single coordinated plan to dispose of such a line of business or area of
operations, or is a subsidiary acquired exclusively with a view to resale. The results of discontinued operations are presented separately in the
statement of profit or loss.
4.4 Issued capital
2017 2016 2017 2016Number Number $’000 $’000
Balance at beginning of year 484,976,037 481,248,259 207,540 205,399
Issued during the year
Dividend reinvestment plan 8,071,387 3,144,278 2,663 1,572
Shares issued on exercise of performance rights – 583,500 – 569
Placement – – – –
Share issue costs – – – –
Balance at end of year 493,047,424 484,976,037 210,203 207,540
Fully paid ordinary shares carry one vote per share and carry the right to dividends.
Changes to the Corporations Act abolished the authorised capital and par value concept in relation to share capital from 1 July 1998. Therefore, the
Company does not have a limited amount of authorised capital and issued shares do not have a par value.
Notes to thefinancial statementsFor the year ended 30 June 2017
—
Cash Converters International Limited – Annual Report 2017 | 9998 | Cash Converters International Limited – Annual Report 2017
For
per
sona
l use
onl
y

The financial statements include the Company’s share of the total recognised gains and losses of associates on an equity accounted basis, from the
date that significant influence commences until the date that significant influence ceases. If the Company’s share of losses exceeds its interest in an
associate, their carrying amount is reduced to nil and recognition of further losses is discontinued except to the extent the Company has incurred
legal or constructive obligations or made payments on behalf of the associate.
Unrealised gains on transactions between the Company and its associates are eliminated to the extent of the Company’s interest in the associates.
Unrealised losses are also eliminated unless the transaction provides evidence of an impairment of the asset transferred.
During the year, the Company held an investment in the Cash Converters Holdings Limited Partnership, the master franchisor in New Zealand. The
Company holds a 25% equity interest (ownership and voting interest) in all aspects of the New Zealand enterprise, including corporate stores,
franchise contracts and financial services.
In the prior year, the Company was involved in a joint venture with EZCORP Inc in South America and Mexico. During the year ended 30 June 2016,
EZCORP Inc made a decision to close this operation and accordingly the Company’s 20% equity interest in the joint venture of $764 thousand was
written off.
5.3 Controlled entities
(a) Composition of the Group
Controlled entities of Cash Converters International Limited:
Name of entity Country of incorporation Ownership interest
2017 2016
BAK Property Pty Ltd (1) Australia 100% 100%
Cash Converters (Cash Advance) Pty Ltd (1) (2) Australia 100% 100%
Cash Converters Finance Corporation Limited (3) Australia 64.33% 64.33%
Cash Converters (NZ) Pty Ltd Australia 100% 100%
Cash Converters Personal Finance Pty Ltd (1) (2) Australia 100% 100%
Cash Converters Pty Ltd (1) (2) Australia 100% 100%
Cash Converters (Stores) Pty Ltd (1) (2) Australia 100% 100%
Cash Converters UK Holdings PLC UK 100% 100%
Cash Converters USA, Inc (3) USA 99.285% 99.285%
Cash Converters USA Limited (3) Australia 99.285% 99.285%
Finance Administrators of Australia Pty Ltd (1) (2) Australia 100% 100%
Green Light Auto Group Pty Limited (1) (2) Australia 100% 100%
Mon-E Pty Ltd (1) (2) Australia 100% 100%
Safrock Finance Corporation (QLD) Pty Ltd (1) (2) Australia 100% 100%
Safrock Finance Corporation WA Pty Ltd (1) (2) Australia 100% 100%
CCPF Receivables Trust No 1 Australia 100% 100%
(1) These companies are parties to the Deed of Cross Guarantee and members of the Closed Group as at 30 June 2017.
(2) These companies are members of the tax consolidated group.
(3) Non-controlling interest is not considered material in these subsidiaries.
5.1 Discontinued operations (continued)
(c) Loss on disposal of assets
2016$’000
Consideration received
Cash 252
Deferred sales proceeds 9,900
Total consideration received 10,152
Assets disposed
Current assets 9,780
Plant and equipment 4,938
Goodwill 2,808
Other intangible assets 2,709
Total assets disposed 20,235
Loss on disposal of assets 10,083
(d) Assets associated with discontinued operations
The following assets were reclassified as associated with discontinued operations as at 30 June 2016:
Assets associated with discontinued operations
Personal loan receivables 7,448
5.2 Investment in associates
Balances of the investments in associates and joint ventures are as follows:
2017 2016$’000 $’000
Balance at beginning of year 4,295 6,288
Net profit / (loss) for year 314 (1,392)
Write off of investment in associate – (764)
Foreign exchange adjustment in value of investment (2) 163
Balance at end of year 4,607 4,295
Associates are those entities over which the Company has significant influence, but not control or joint control, over the financial and operating
policies. Significant influence is the power to participate in the financial and operating policy decisions of the investee, but not control or joint
control over those policies.
Notes to thefinancial statementsFor the year ended 30 June 2017
—
Cash Converters International Limited – Annual Report 2017 | 101100 | Cash Converters International Limited – Annual Report 2017
For
per
sona
l use
onl
y

2017 2016$’000 $’000
Non-current assets
Trade and other receivables 33,364 40,462
Loan receivables 14,037 2,102
Plant and equipment 10,230 13,833
Deferred tax assets 10,927 10,283
Goodwill 107,009 107,009
Other intangible assets 25,276 22,813
Investments in associates 4,607 4,295
Other financial assets 30,250 30,250
Total non-current assets 235,700 231,047
Total assets 429,725 449,494
Current liabilities
Trade and other payables 17,091 18,100
Borrowings 46,303 70,023
Provisions 6,009 20,222
Current tax payable 3,633 –
Total current liabilities 73,036 108,345
Non-current liabilities
Borrowings 60,934 63,961
Provisions 790 298
Total non-current liabilities 61,724 64,259
Total liabilities 134,760 172,604
Net assets 294,965 276,890
Equity
Issued capital 210,203 207,540
Reserves 1,740 (15,398)
Retained earnings 83,022 84,748
Total equity 294,965 276,890
5.3 Controlled entities (continued)
(b) Deed of cross guarantee
Cash Converters International Limited and certain wholly-owned companies (the Closed Group), identified in (a) above, are parties to a Deed of Cross
Guarantee (the Deed). The effect of the Deed is that members of the Closed Group guarantee to each creditor payment in full of any debt in the event
of winding up of any of the members under certain provisions of the Corporations Act 2001. ASIC Corporations Instrument 2016/785, issued on 28
September 2016, provides relief to parties to the Deed from the Corporations Act 2001 requirements for preparation, audit and lodgement of financial
reports and directors’ reports, subject to certain conditions as set out therein.
Pursuant to the requirements of this Corporations Instrument, a summarised consolidated Statement of Profit or Loss and Other Comprehensive
Income for the year ended 30 June 2017 and consolidated Statement of Financial Position as at 30 June 2017, comprising the members of the Closed
Group after eliminating all transactions between members are set out on the following pages.
Summarised statement of profit or loss and comprehensive income
2017 2016$’000 $’000
Profit / (loss) before income tax 26,513 14,501
Income tax benefit / (expense) (7,580) (7,418)
Total comprehensive income 18,933 7,083
Summary of movements in Closed Group’s retained earnings
Retained earnings at beginning of year 84,748 87,302
Transfer reserve balance (15,809) –
Net profit / (loss) 18,933 7,083
Dividends paid or provided for (4,850) (9,637)
Retained earnings at end of year 83,022 84,748
Statement of financial position
Current assets
Cash and cash equivalents 74,645 68,697
Trade receivables 5,243 10,934
Loan receivables 87,933 102,419
Inventories 20,899 17,445
Other assets 5,305 9,102
Current tax receivable – 9,850
Total current assets 194,025 218,447
Notes to thefinancial statementsFor the year ended 30 June 2017
—
Cash Converters International Limited – Annual Report 2017 | 103102 | Cash Converters International Limited – Annual Report 2017
For
per
sona
l use
onl
y
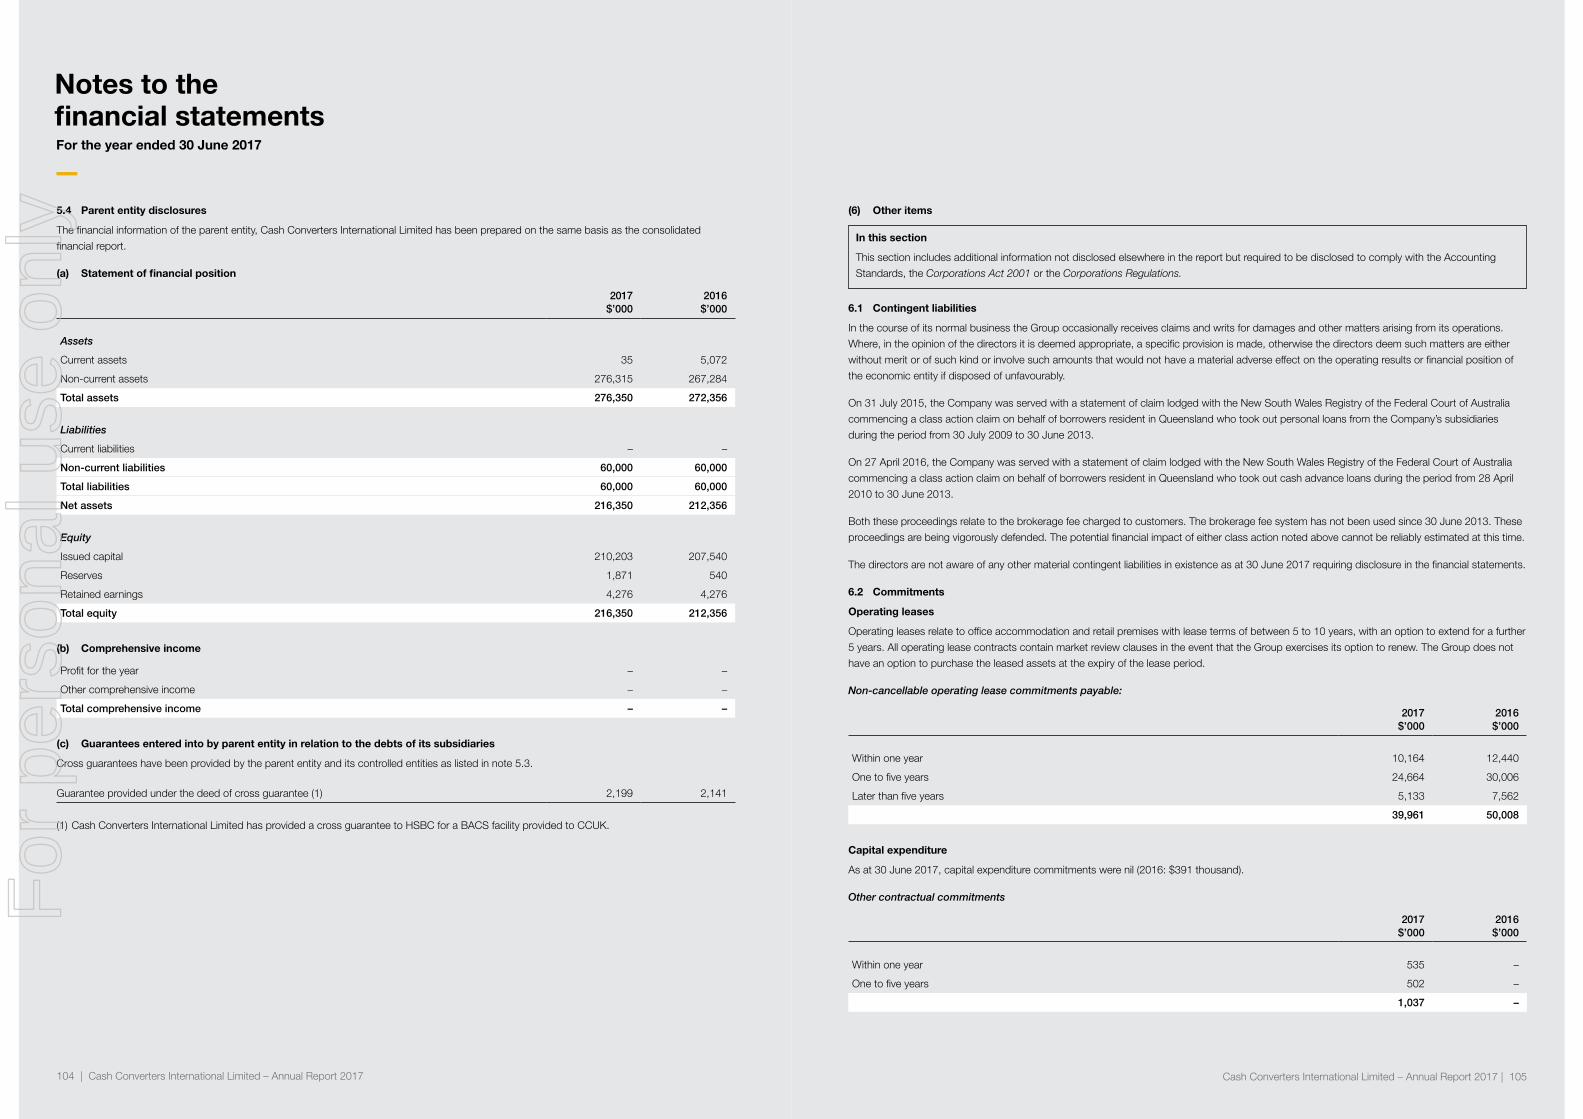
(6) Other items
In this section
This section includes additional information not disclosed elsewhere in the report but required to be disclosed to comply with the Accounting
Standards, the Corporations Act 2001 or the Corporations Regulations.
6.1 Contingent liabilities
In the course of its normal business the Group occasionally receives claims and writs for damages and other matters arising from its operations.
Where, in the opinion of the directors it is deemed appropriate, a specific provision is made, otherwise the directors deem such matters are either
without merit or of such kind or involve such amounts that would not have a material adverse effect on the operating results or financial position of
the economic entity if disposed of unfavourably.
On 31 July 2015, the Company was served with a statement of claim lodged with the New South Wales Registry of the Federal Court of Australia
commencing a class action claim on behalf of borrowers resident in Queensland who took out personal loans from the Company’s subsidiaries
during the period from 30 July 2009 to 30 June 2013.
On 27 April 2016, the Company was served with a statement of claim lodged with the New South Wales Registry of the Federal Court of Australia
commencing a class action claim on behalf of borrowers resident in Queensland who took out cash advance loans during the period from 28 April
2010 to 30 June 2013.
Both these proceedings relate to the brokerage fee charged to customers. The brokerage fee system has not been used since 30 June 2013. These
proceedings are being vigorously defended. The potential financial impact of either class action noted above cannot be reliably estimated at this time.
The directors are not aware of any other material contingent liabilities in existence as at 30 June 2017 requiring disclosure in the financial statements.
6.2 Commitments
Operating leases
Operating leases relate to office accommodation and retail premises with lease terms of between 5 to 10 years, with an option to extend for a further
5 years. All operating lease contracts contain market review clauses in the event that the Group exercises its option to renew. The Group does not
have an option to purchase the leased assets at the expiry of the lease period.
Non-cancellable operating lease commitments payable:
2017 2016$’000 $’000
Within one year 10,164 12,440
One to five years 24,664 30,006
Later than five years 5,133 7,562
39,961 50,008
Capital expenditure
As at 30 June 2017, capital expenditure commitments were nil (2016: $391 thousand).
Other contractual commitments
2017 2016$’000 $’000
Within one year 535 –
One to five years 502 –
1,037 –
5.4 Parent entity disclosures
The financial information of the parent entity, Cash Converters International Limited has been prepared on the same basis as the consolidated
financial report.
(a) Statement of financial position
2017 2016$’000 $’000
Assets
Current assets 35 5,072
Non-current assets 276,315 267,284
Total assets 276,350 272,356
Liabilities
Current liabilities – –
Non-current liabilities 60,000 60,000
Total liabilities 60,000 60,000
Net assets 216,350 212,356
Equity
Issued capital 210,203 207,540
Reserves 1,871 540
Retained earnings 4,276 4,276
Total equity 216,350 212,356
(b) Comprehensive income
Profit for the year – –
Other comprehensive income – –
Total comprehensive income – –
(c) Guarantees entered into by parent entity in relation to the debts of its subsidiaries
Cross guarantees have been provided by the parent entity and its controlled entities as listed in note 5.3.
Guarantee provided under the deed of cross guarantee (1) 2,199 2,141
(1) Cash Converters International Limited has provided a cross guarantee to HSBC for a BACS facility provided to CCUK.
Notes to thefinancial statementsFor the year ended 30 June 2017
—
Cash Converters International Limited – Annual Report 2017 | 105104 | Cash Converters International Limited – Annual Report 2017
For
per
sona
l use
onl
y

6.5 Share-based payments
Cash Converters rights plan
The Cash Converters rights plan, which was approved by shareholders on 18 November 2015, allows the directors of the Company to issue
performance rights which will vest into ordinary shares in the Company upon the achievement of certain vesting conditions. As at 30 June 2017, the
shareholders had approved the issue of 15,920,500 performance rights under the Company’s previous rights plan, approved by shareholders on 30
November 2010 and 14,232,846 performance rights under the new rights plan, to the then managing director (now Executive Deputy Chairman) and
the Company’s senior management team in various tranches with each tranche containing vesting conditions.
Each right entitles the holder to subscribe for one fully paid ordinary share in the Company at the exercise price of nil. During the reporting period, a total
of 7,598,694 performance rights were granted in Tranches 17, 18, 19 and 20 to senior executives of the Company.
The following arrangements were in existence during the current reporting period:
Tranche Grant date
Number
of rights
Grant date
fair value
Exercise
price
Expiry
date
12 25 Sep 2014 124,166 $0.96 $0.00 1 Jul 2017
13 18 Nov 2015 1,865,000 $0.23 $0.00 30 Jun 2018
14 18 Nov 2015 1,865,000 $0.41 $0.00 30 Jun 2018
15 28 Jan 2016 1,232,224 $0.26 $0.00 30 Jun 2018
16 28 Jan 2016 1,232,224 $0.45 $0.00 30 Jun 2018
17 23 Nov 2016 2,286,460 $0.20 $0.00 30 Jun 2019
18 23 Nov 2016 2,286,460 $0.31 $0.00 30 Jun 2019
19 12 Dec 2016 973,843 $0.17 $0.00 30 Jun 2019
20 12 Dec 2016 973,843 $0.29 $0.00 30 Jun 2019
Fair value of performance rights granted during the year
The weighted average fair value of the performance rights granted during the financial year is $0.25 (2016: $0.34). Where relevant, the expected life
used in the model is based on the earliest vesting date possible for each tranche, based on the vesting conditions.
Tranche 17 Tranche 18 Tranche 19 Tranche 20
Grant date 23 Nov 2016 23 Nov 2016 12 Dec 2016 12 Dec 2016
Option pricing model Monte Carlo Binomial Monte Carlo Binomial
Grant date share price $0.36 $0.36 $0.34 $0.34
Exercise price $0.00 $0.00 $0.00 $0.00
Expected volatility 40% 40% 40% 40%
Option life 2.60 years 2.60 years 2.55 years 2.55 years
Dividend yield 5.33% 5.56% 5.80% 5.88%
Risk-free interest rate 1.88% 1.88% 1.95% 1.95%
6.3 Related party disclosures
The immediate parent and ultimate controlling party of the Group is Cash Converters International Limited.
Balances and transactions between the Company and its subsidiaries, which are related parties of the Company, have been eliminated on consolidation
and are not disclosed in this note.
During the year, the Group paid $35,428 to HopgoodGanim, a law firm in which Mr Kevin Dundo is a partner, for legal services. Legal services
were provided to the Group on terms and conditions no more favourable than those that it is reasonable to expect the Company would have
been charged if dealing at arm’s length with an unrelated party.
EZCORP Inc (EZCORP) is a related party of the Company because the Company is an associate due to the substantial holding of the Company’s
listed shares by EZCORP. The balances and transactions between the Company and EZCORP in the year ended 30 June 2016 relate to the South
American and Mexican joint venture (refer note 5.2).
Other than share based payments (as disclosed in note 6.5) and shareholdings of Key Management Personnel (KMP) (as disclosed in the remuneration
report), the parent, its subsidiaries, associates and KMP made no related party transactions during the reporting period.
6.4 Key management personnel disclosures
Details of directors and other members of KMP of Cash Converters International Limited during the year are:
• Mr Stuart Grimshaw (Non-Executive Chairman)
• Mr Lachlan Given (Non-Executive Director)
• Mr Kevin Dundo (Non-Executive Director)
• Ms Andrea Waters (Non-Executive Director, appointed 9 February 2017)
• Ms Ellen Comerford (Non-Executive Director, appointed 9 February 2017)
• Mr Reginald Webb (Non-Executive Director, retired 14 February 2017)
• Mr Peter Cumins (Managing Director to 23 January 2017, Executive Deputy Chairman from 23 January 2017)
• Mr Mark Reid (Chief Executive Officer – Australia to 23 January 2017, Chief Executive Officer from 23 January 2017)
• Mr Martyn Jenkins (Chief Operating Officer – Financial Services Australia from 1 July 2016)
• Mr Shane Prior (Chief Operating Officer – Stores)
• Mr Nathan Carbone (Chief Risk Officer, appointed 1 January 2017)
• Ms Alice Manners (Chief Manager Digital and Marketing, appointed 24 February 2017)
• Mr Brad Edwards (Corporate Counsel, appointed 6 June 2017)
• Mr Ralph Groom (Company Secretary, Chief Financial Officer)
• Mr Glen Fee (Chief Information Officer)
• Mr Michael Cooke (Legal Counsel, retired 31 August 2016)
The aggregate compensation of the KMP of the Group is set out below:
2017 2016$ $
Short-term employee benefits 4,584,113 3,770,918
Post-employment benefits 208,644 122,960
Other long-term benefits 165,520 –
Share-based payments 1,315,143 (1,945,164)
Termination benefits 600,150 270,332
6,873,570 2,219,046
Notes to thefinancial statementsFor the year ended 30 June 2017
—
Cash Converters International Limited – Annual Report 2017 | 107106 | Cash Converters International Limited – Annual Report 2017
For
per
sona
l use
onl
y

Share options outstanding at year end
The total number of options outstanding at 30 June 2017 was 12,755,380 (2016: 6,758,318).
Tranche Grant date Number of rights Grant date fair value Exercise price Expiry date
12 25 Sep 2014 102,166 $0.96 $0.00 1 Jul 2017
13 18 Nov 2015 1,865,000 $0.23 $0.00 30 Jun 2018
14 18 Nov 2015 1,865,000 $0.41 $0.00 30 Jun 2018
15 28 Jan 2016 1,232,224 $0.26 $0.00 30 Jun 2018
16 28 Jan 2016 1,232,224 $0.45 $0.00 30 Jun 2018
17 23 Nov 2016 2,286,460 $0.20 $0.00 30 Jun 2019
18 23 Nov 2016 2,286,460 $0.31 $0.00 30 Jun 2019
19 12 Dec 2016 942,923 $0.17 $0.00 30 Jun 2019
20 12 Dec 2016 942,923 $0.29 $0.00 30 Jun 2019
12,755,380
The weighted average remaining contractual life for the performance rights outstanding at 30 June 2017 was 1.5 years (2016: 2.0 years).
Accounting policies
The Group provides benefits to executives of the Group in the form of share-based payment transactions, whereby KMP render services in
exchange for options (equity-based transactions).
The current plan to provide these benefits is the Executive Performance Rights Plan. The cost of the equity-settled transactions with employees
is measured by reference to the fair value of the equity instruments at the date at which they are granted. The fair value is determined by using an
appropriate valuation methodology.
The cost of equity-based transactions is recognised, together with a corresponding increase in equity, over the period in which the performance and
/ or service conditions are fulfilled (the vesting period), ending on the date on which the relevant employees become fully entitled to the award (vesting
date).
At each subsequent reporting date until vesting, the cumulative charge to the profit or loss is the product of:
• The grant date fair value of the award.
• The current best estimate of the number of the awards that will vest, taking into account such factors as the likelihood of non-market performance
conditions being met.
• The expired portion of the vesting period.
No expense is recognised for awards that do not ultimately vest, except for awards where vesting is conditional upon a market condition.
Where the terms of an equity-settled award are modified, as a minimum, an expense is recognised as if the terms had not been modified. In addition,
an expense is recognised for any increase in the value of the transaction as a result of the modification, as measured at the date of modification.
The dilutive effect, if any, of outstanding options is reflected as additional share dilution in the computation of earnings per share.
6.5 Share-based payments (continued)
Movement in performance rights during the year
The following table illustrates the number of, and movements in, performance rights during the year. The performance rights were issued at no charge, and the weighted average exercise price is nil. No rights were exercisable at the end of the current year.
2017 2016Number Number
Outstanding at beginning of year 6,758,319 8,997,497
Granted during year 7,598,693 6,634,152
Forfeited / lapsed during year (1,601,632) (8,289,831)
Exercised during year – (583,499)
Outstanding at end of year 12,755,380 6,758,319
Share options exercised during the year
Tranche Grant date Number
exercised
Exercise date Share price at
exercise date
Year ended 30 June 2017
–
Year ended 30 June 2016
6 25 Sep 2012 176,997 16 Sep 2015 $0.505
8 24 Sep 2013 199,001 16 Sep 2015 $0.505
10 25 Sep 2014 207,501 16 Sep 2015 $0.505
583,499
Share options forfeited / lapsed during the year
Tranche Grant date Number
lapsed
Year ended 30 June 2017
12 25 Sep 2014 22,000
15 28 Jan 2016 219,852
16 28 Jan 2016 219,852
19 12 Dec 2016 569,964
20 12 Dec 2016 569,964
1,601,632
Year ended 30 June 2016
2 30 Nov 2014 6,000,000
3 19 Sep 2011 1,800,000
9 24 Sep 2013 198,998
11 25 Sep 2014 207,501
12 25 Sep 2014 83,332
8,289,831
Notes to thefinancial statementsFor the year ended 30 June 2017
—
Cash Converters International Limited – Annual Report 2017 | 109108 | Cash Converters International Limited – Annual Report 2017
For
per
sona
l use
onl
y

Directors’declaration—
The directors declare that:
a) in the directors’ opinion, there are reasonable grounds to believe that the Company will be able to pay its debts as and when
they become due and payable;
b) in the directors’ opinion, the attached financial statements are in compliance with International Financial Reporting Standards,
as stated in note 1 to the financial statements;
c) in the directors’ opinion, the attached financial statements and notes thereto are in accordance with the Corporations Act 2001,
including compliance with accounting standards and giving a true and fair view of the financial position and performance of the Group;
and
d) the directors have been given the declarations required by s295A of the Corporations Act 2001.
At the date of this declaration the Company is within the class of companies affected by ASIC Class Order 98/1418. The nature of the
deed of cross guarantee is such that each company which is party to the deed guarantees to each creditor payment in full of any debt
in accordance with the deed of cross guarantee.
In the directors’ opinion, there are reasonable grounds to believe that the Company and the companies to which the ASIC Class Order
applies, as detailed in note 5.3 to the financial statements will, as a group, be able to meet any obligations or liabilities to which they are
or may become subject, by virtue of the deed of cross guarantee.
Signed in accordance with a resolution of the directors made pursuant to s295(5) of the Corporations Act 2001.
On behalf of the directors
Stuart Grimshaw
Director
Perth, Western Australia
7 September 2017
6.6 Auditor’s remuneration
2017 2016$ $
Auditor of the parent entity
Audit / review of the financial report 402,000 545,900
Taxation services 23,680 12,500
Independent expert in relation to Enforceable Undertaking 276,100 –
Other non-audit services 85,950 –
Related practice of the parent entity auditor
Audit 49,553 111,880
Taxation services 14,110 85,740
851,393 756,020
The auditor of Cash Converters International Limited is Deloitte Touche Tohmatsu.
6.7 Events subsequent to the end of the year
There has not been any matter or circumstance other than that referred to in the financial statements or notes thereto, that has arisen since the end
of the financial year, that has significantly affected or may significantly affect the operations of the Group.
Notes to thefinancial statementsFor the year ended 30 June 2017
—
Cash Converters International Limited – Annual Report 2017 | 111110 | Cash Converters International Limited – Annual Report 2017
For
per
sona
l use
onl
y

Liability limited by a scheme approved under Professional Standards Legislation.
Member of Deloitte Touche Tohmatsu Limited
Deloitte Touche Tohmatsu ABN 74 490 121 060 Tower 2, Brookfield Place 123 St Georges Terrace Perth WA 6000 GPO Box A46 Perth WA 6837 Australia Tel: +61 8 9365 7000 Fax: +61 8 9365 7001 www.deloitte.com.au
Independent Auditor’s Report to the members of Cash Converters International Limited Report on the Audit of the Financial Report Opinion We have audited the financial report of Cash Converters International Limited (the “Company”) and its subsidiaries (the “Group”), which comprises the consolidated statement of financial position as at 30 June 2017, the consolidated statement of profit or loss and other comprehensive income, the consolidated statement of changes in equity and the consolidated statement of cash flows for the year then ended, and notes to the financial statements, including a summary of significant accounting policies, and the directors’ declaration. In our opinion, the accompanying financial report of the Group is in accordance with the Corporations Act 2001, including: (i) giving a true and fair view of the Group’s financial position as at 30 June 2017 and of its
financial performance for the year then ended; and
(ii) complying with Australian Accounting Standards and the Corporations Regulations 2001. Basis for Opinion We conducted our audit in accordance with Australian Auditing Standards. Our responsibilities under those standards are further described in the Auditor’s Responsibilities for the Audit of the Financial Report section of our report. We are independent of the Group in accordance with the auditor independence requirements of the Corporations Act 2001 and the ethical requirements of the Accounting Professional and Ethical Standards Board’s APES 110 Code of Ethics for Professional Accountants (the Code) that are relevant to our audit of the financial report in Australia. We have also fulfilled our other ethical responsibilities in accordance with the Code. We confirm that the independence declaration required by the Corporations Act 2001, which has been given to the directors of the Company, would be in the same terms if given to the directors as at the time of this auditor’s report. We believe that the audit evidence we have obtained is sufficient and appropriate to provide a basis for our opinion. Key Audit Matters Key audit matters are those matters that, in our professional judgement, were of most significance in our audit of the financial report for the current period. These matters were addressed in the context of our audit of the financial report as a whole, and in forming our opinion thereon, and we do not provide a separate opinion on these matters.
Liability limited by a scheme approved under Professional Standards Legislation.
Member of Deloitte Touche Tohmatsu Limited.
Deloitte Touche Tohmatsu ABN 74 490 121 060 Tower 2, Brookfield Place 123 St Georges Terrace Perth WA 6000 GPO Box A46 Perth WA 6837 Australia Tel: +61 8 9365 7000 Fax: +61 8 9365 7001 www.deloitte.com.au
The Board of Directors Cash Converters International Limited Level 18 37 St Georges Terrace Perth WA 6000 7 September 2017 Dear Directors
Cash Converters International Limited
In accordance with section 307C of the Corporations Act 2001, I am pleased to provide the following declaration of independence to the directors of Cash Converters International Limited. As lead audit partner for the audit of the financial statements of Cash Converters International Limited for the financial year ended 30 June 2017, I declare that to the best of my knowledge and belief, there have been no contraventions of:
(i) the auditor independence requirements of the Corporations Act 2001 in relation to the audit; and
(ii) any applicable code of professional conduct in relation to the audit. Yours sincerely DELOITTE TOUCHE TOHMATSU David Newman Partner Chartered Accountants
Cash Converters International Limited – Annual Report 2017 | 113112 | Cash Converters International Limited – Annual Report 2017
For
per
sona
l use
onl
y

Key audit matter How the scope of our audit responded to the Key Audit Matter
Allowance for impairment losses – personal loan receivables As disclosed in note 3.2, the carrying value of personal loan receivables as at 30 June 2017 was $82.7 million, net of allowances for impairment losses of $25.3 million.
The assessment of the recoverable value of personal loans requires significant judgement in respect of assumptions such as default rates in making an estimate of the recoverability of loans, on either a specific or collective basis.
Our procedures included, but were not limited to:
evaluating the key controls management have in place in relation to the estimate of the recoverable value of personal loans;
challenging the assumptions and methodology used to determine both the specific and collective allowances;
evaluating forecast default rates against historically observed levels;
performing a look back test of the loans that were written off in the current financial year by aging category, to build an expectation of the allowance as at 30 June 2017 by comparable aging category;
developing an independent expectation of the allowance for doubtful debts based on independent statistical modelling using historic repayment data and comparing this with managements estimates; and
evaluating the adequacy of the disclosures included in the financial report.
Contingent liabilities As disclosed in note 6.1, the Company is subject to two class actions in relation to historic lending practices in Queensland associated with personal loans and cash advance loans.
We focused on this area as a key audit matter due to the potential significance of the class actions to the Group.
We assessed the appropriateness of management’s conclusion that the class actions gave rise to contingent liabilities as at 30 June 2017.
Our procedures included, but were not limited to:
holding discussions with Group Internal Legal Counsel, Management and the Directors;
reviewing minutes of meetings of the board of directors;
obtaining copies of pleadings;
holding discussions with external legal counsel to gain an understanding of the current status of the class actions; and
assessing the adequacy of the disclosures.
Other Information The directors are responsible for the other information. The other information comprises the information included in the annual report, but does not include the financial report and our auditor’s report thereon. Our opinion on the financial report does not cover the other information and we do not express any form of assurance conclusion thereon.
Key audit matter How the scope of our audit responded to the Key Audit Matter
Carrying value of non-current assets As disclosed in notes 3.5 and 3.6, the carrying value of goodwill and other intangible assets as at 30 June 2017 relating to the personal finance and store operations was $99.0 million and $21.1 million respectively.
The assessment of the recoverable value of these assets requires significant judgement in respect of assumptions such as discount rates, forecast loan volumes and forecast bad debt levels.
Our procedures included, but were not limited to:
obtaining an understanding of the key controls management has in place in relation to the estimate of the recoverable amount of the personal finance and store operations;
comparing the forecasts used in calculating the recoverable amount to the Board approved business plan;
evaluating the forecasts used in calculating the recoverable amount by reference to recent performance of the business and assessing historical forecasting accuracy;
in conjunction with our valuation experts we assessed and challenged the assumptions and methodologies used, in particular:
the discount rate against that of comparable companies;
forecast loan volumes for personal loans against recent actual levels and related trending;
forecast bad debt levels for personal loans;
in relation to the assumptions applied above, where possible we corroborated market related assumptions by reference to external data;
management’s consideration of the impact of potential legislative changes on future personal loan volumes;
sample testing management’s models for mathematical accuracy;
applying sensitivities to the forecast cash flows including growth in the number of loans and evolution of bad debt rates to reflect uncertainty with respect to the impact of:
recent changes in lending criteria; and
the early stage of growth of the Medium Amount Credit Contracts loan book.
evaluating the adequacy of the disclosures in the financial report.
Cash Converters International Limited – Annual Report 2017 | 115114 | Cash Converters International Limited – Annual Report 2017
For
per
sona
l use
onl
y

We communicate with the directors regarding, among other matters, the planned scope and timing of the audit and significant audit findings, including any significant deficiencies in internal control that we identify during our audit.
We also provide the directors with a statement that we have complied with relevant ethical requirements regarding independence, and to communicate with them all relationships and other matters that may reasonably be thought to bear on our independence, and where applicable, related safeguards.
From the matters communicated with the directors, we determine those matters that were of most significance in the audit of the financial report of the current period and are therefore the key audit matters. We describe these matters in our auditor’s report unless law or regulation precludes public disclosure about the matter or when, in extremely rare circumstances, we determine that a matter should not be communicated in our report because the adverse consequences of doing so would reasonably be expected to outweigh the public interest benefits of such communication.
Report on the Remuneration Report
Opinion on the Remuneration Report
We have audited the Remuneration Report included in pages 25 to 58 of the directors’ report for the year ended 30 June 2017.
In our opinion, the Remuneration Report of Cash Converters International Limited, for the year ended 30 June 2017, complies with section 300A of the Corporations Act 2001.
Responsibilities
The directors of the Company are responsible for the preparation and presentation of the Remuneration Report in accordance with section 300A of the Corporations Act 2001. Our responsibility is to express an opinion on the Remuneration Report, based on our audit conducted in accordance with Australian Auditing Standards.
DELOITTE TOUCHE TOHMATSU
David Newman Partner Chartered Accountants Perth, 7 September 2017
In connection with our audit of the financial report, our responsibility is to read the other information and, in doing so, consider whether the other information is materially inconsistent with the financial report or our knowledge obtained in the audit or otherwise appears to be materially misstated. If, based on the work we have performed, we conclude that there is a material misstatement of this other information, we are required to report that fact. We have nothing to report in this regard. Directors’ Responsibilities for the Financial Report The directors of the Company are responsible for the preparation of the financial report that gives a true and fair view in accordance with Australian Accounting Standards and the Corporations Act 2001 and for such internal control as the directors determine is necessary to enable the preparation of the financial report that gives a true and fair view and is free from material misstatement, whether due to fraud or error. In preparing the financial report, the directors are responsible for assessing the ability of the Group to continue as a going concern, disclosing, as applicable, matters related to going concern and using the going concern basis of accounting unless the directors either intend to liquidate the Group or to cease operations, or has no realistic alternative but to do so. Auditor’s Responsibilities for the Audit of the Financial Report Our objectives are to obtain reasonable assurance about whether the financial report as a whole is free from material misstatement, whether due to fraud or error, and to issue an auditor’s report that includes our opinion. Reasonable assurance is a high level of assurance, but is not a guarantee that an audit conducted in accordance with the Australian Auditing Standards will always detect a material misstatement when it exists. Misstatements can arise from fraud or error and are considered material if, individually or in the aggregate, they could reasonably be expected to influence the economic decisions of users taken on the basis of this financial report. As part of an audit in accordance with the Australian Auditing Standards, we exercise professional judgement and maintain professional scepticism throughout the audit. We also:
Identify and assess the risks of material misstatement of the financial report, whether due to fraud or error, design and perform audit procedures responsive to those risks, and obtain audit evidence that is sufficient and appropriate to provide a basis for our opinion. The risk of not detecting a material misstatement resulting from fraud is higher than for one resulting from error, as fraud may involve collusion, forgery, intentional omissions, misrepresentations, or the override of internal control.
Obtain an understanding of internal control relevant to the audit in order to design audit procedures that are appropriate in the circumstances, but not for the purpose of expressing an opinion on the effectiveness of the Group’s internal control.
Evaluate the appropriateness of accounting policies used and the reasonableness of accounting estimates and related disclosures made by the directors.
Conclude on the appropriateness of the directors’ use of the going concern basis of accounting and, based on the audit evidence obtained, whether a material uncertainty exists related to events or conditions that may cast significant doubt on the Group’s ability to continue as a going concern. If we conclude that a material uncertainty exists, we are required to draw attention in our auditor’s report to the related disclosures in the financial report or, if such disclosures are inadequate, to modify our opinion. Our conclusions are based on the audit evidence obtained up to the date of our auditor’s report. However, future events or conditions may cause the Group to cease to continue as a going concern.
Evaluate the overall presentation, structure and content of the financial report, including the disclosures, and whether the financial report represents the underlying transactions and events in a manner that achieves fair presentation.
Obtain sufficient appropriate audit evidence regarding the financial information of the entities or business activities within the Group to express an opinion on the financial report. We are responsible for the direction, supervision and performance of the Group audit. We remain solely responsible for our audit opinion.
Cash Converters International Limited – Annual Report 2017 | 117116 | Cash Converters International Limited – Annual Report 2017
For
per
sona
l use
onl
y

1. Number of holders of equity securities
(a) Distribution of holders of equity securities
Holders Number
Fully paid ordinary shares
Number
1 to 1,000 806 405,259
1,001 to 5,000 1,799 5,104,369
5,001 to 10,000 1,098 8,630,126
10,001 to 100,000 1,795 56,385,926
100,001 and over 221 422,521,744
5,719 493,047,424
(b) Voting rights
Each ordinary share is entitled to one vote when a poll is called, otherwise each member present at a meeting or by proxy has one vote on a show
of hands.
(c) Less than marketable parcel of shares
The number of shareholders holding less than a marketable parcel is 1,299, given a share price of $0.385 per share.
(d) Substantial shareholders
Ordinary shareholder Number of shares % of issued shares
EZCORP Inc 156,552,484 31.75
HSBC Custody Nominees (Australia) Limited 88,826,167 18.02
Citicorp Nominees Pty Limited 30,268,324 6.14
2. Twenty largest equity security holders
Ordinary shareholder Number of shares % of issued shares
1. EZCORP Inc 156,552,484 31.75
2. HSBC Custody Nominees (Australia) Limited 88,826,167 18.03
3. Citicorp Nominees Pty Limited 30,268,324 6.14
4. JP Morgan Nominees Australia Limited 21,881,596 4.44
5. BNP Paribas Nominees Pty Ltd <Agency Lending DRP A/C> 12,523,642 2.54
6. BNP Paribas Noms Pty Ltd <DRP> 12,173,630 2.47
7. National Nominees Limited 7,749,676 1.57
8. Riolane Holdings Pty Ltd <Cumins Super Fund A/C> 6,895,226 1.40
9. RBC Investor Services Australia Nominees Pty Limited <BKCust A/C> 5,051,641 1.02
10. RBC Investor Services Australia Nominees Pty Ltd <VFA A/C> 4,987,873 1.01
11. Mr Noel D’Souza + Mrs Christine D’Souza <Mandovi Super Fund A/C> 3,949,898 0.80
12. MICPIP Nominees Pty Ltd <MICPIP Super Fund A/C> 2,775,206 0.56
13. National Nominees Limited <DB A/C> 2,500,014 0.51
14. Narlack Pty Ltd <Piperoglou Pension A/C> 2,361,809 0.48
15. Mr Craig Graeme Chapman <Nampac Discretionary A/C> 2,000,000 0.41
16. Dorran Pty Ltd 1,500,000 0.30
17. Investment Custodial Services Limited <990048401 A/C> 1,400,000 0.28
18. Ms Choi Chu Lee 1,250,000 0.25
19. Mr Frederick Benjamin Warmbrand <FB & LJ Warmbrand Super A/C> 1,240,000 0.25
20. Sporran Lean Pty Ltd <Sporran Lean S/F A/C> 1,199,999 0.24
367,087,185 74.45
Additional securityholderinformationAs at 18 September 2017
—
Cash Converters International Limited – Annual Report 2017 | 119118 | Cash Converters International Limited – Annual Report 2017
For
per
sona
l use
onl
y

cashconverters.com
For
per
sona
l use
onl
y