Embed Size (px)
Citation preview

Cash Continues to Play a Key Role in Consumer Spending:
Evidence from the Diary of Consumer Payment Choice
By: Barbara Bennett, Douglas Conover,
Shaun O’Brien, and Ross Advincula
April 2014
The views in this paper are solely the responsibility of the authors and should not be interpreted as reflecting the
views of the Federal Reserve Bank of San Francisco or the Board of Governors of the Federal Reserve System.

April 2014 Page 2 of 15
Evidence from the Diary of Consumer Payment Choice
Introduction
It’s commonplace these days to predict the
demise of cash. After all, consumers’ use of
the other major physical payment
instrument, the check, has plummeted over
the last decade in favor of payment cards,
especially debit (Figure 1). And with rapid
growth in online commerce, it may not be
too far-fetched to assume that consumers
won’t even be able to use a physical
payment instrument in the future.
However, evidence from the Diary of
Consumer Payment Choice (DCPC),
conducted in October 2012 by the Boston,
Richmond, and San Francisco Federal
Reserve Banks suggests otherwise. Not only is cash a very different payment instrument than checks,
but consumers choose to use cash more frequently than any other payment instrument, including debit
or credit cards. Cash plays a dominant role for small-value transactions, is the leading payment
instrument for many types of purchases, and stands as the key alternative when other options are not
available. In certain cases, including that of mostly lower-income consumers who lack access to
alternative payment options or find them too costly or difficult to obtain, cash is also used for relatively
larger-value transactions. Using the DCPC data, this paper explores where, how, and why people use the
various payment options and highlights the key and enduring roles cash continues to play in consumer
transactions.
Summary of Key Results
Cash is the most used retail payment instrument.
In October 2012, the average American consumer had 59 transactions, including purchases and bill
payments, and 23 of these 59 payments involved cash. Figure 2 shows that, at 40 percent, cash makes
up the single largest share of consumer transaction activity, followed by debit cards at 25 percent, and
credit cards at 17 percent. Electronic methods (online banking bill pay and bank account number
payments) account for 7 percent, while checks make up 7 percent. All other payments represent less
than 5 percent of monthly transaction activity, with text and mobile payments barely registering at less
than one half of one percent.
Source: Triennial Federal Reserve Payments Study 0
5
10
15
20
25
30
35
40
45
50
2000 2003 2006 2009 2012
Bill
ion
s o
f Tr
ansa
ctio
ns
Figure 1 Number of Transactions by Payment
Instrument
Debit cards
Credit cards
Checks
EBT/Prepaid
Source: Triennial Federal Reserve Payments Study

April 2014 Page 3 of 15
Evidence from the Diary of Consumer Payment Choice
By value, cash accounts for a relatively small share of total consumer transaction activity at 14 percent,
while electronic methods make up 27 percent and checks 19 percent. These findings suggest that
although consumers don’t use electronic methods or checks very often, when they do, it tends to be for
much higher-value transactions. In contrast, cash is used quite often, but primarily for low-value
transactions. In fact, the average value of a cash transaction is only $21, compared with $168 for checks
and $44 for debit cards.
Cash is the dominant instrument for low-value payments.
As Figure 3 shows, consumers have a lot of low-value transactions each month, and typically use cash
for these payments. About one-third of the average consumer’s monthly payments involve transactions
with a “ticket size” less than $10, and the
average consumer uses cash for two-thirds
of these transactions. In fact, consumers
use cash for half of all of their transactions
valued at less than $50. Interestingly, both
the actual number of cash transactions and
cash’s share of all transactions fall as the
ticket size rises, while the number of card
payments remains roughly the same
regardless of ticket size.1 As ticket size rises
above $100, the number and share of
electronic payments and checks take a
significant leap, in part due to the influence
of bill payments.
1 Note that while the numbers of card payments stays the same, their shares rise as the total number of
transactions within each value category falls.
14%
40%
19%
7%
16%
17%
18%
25%
27%
7%
5%
4%
Value ofPayments
Number ofPayments
Figure 2 Shares of Transactions by Payment Instrument
Cash Check Credit Debit Electronic Other
0
5
10
15
20
25
$0 to$9.99
$10 to$24.99
$25 to$49.99
$50 to$99.99
$100 andOver
Nu
mb
er
of
tran
sact
ion
s p
er
con
sum
er
Figure 3 Payment Use by Transaction Amount
Cash Check Credit Debit Electronic Other
66%
45%
24%
18%
3
10%
19%
24%
27%
33%
31% 18%
24% 17%
16%
30%
20%

April 2014 Page 4 of 15
Evidence from the Diary of Consumer Payment Choice
Cash is widely used, even where other payment options are typically available.
As shown in Figure 4, cash is the leading payment instrument for several expenditure categories,
including gifts and other transfers between people (P2P); food and personal care supplies;
entertainment and transportation; medical, educational, and personal services; and government and
nonprofit expenditures. It is the second most frequently used payment instrument for all other
categories except housing (and a distant second for financial and professional services). The average
ticket size (see Appendix 1) for many of these expenditure categories is relatively low, suggesting that
the reason cash is the most or second-most frequently used payment instrument is because small value
transactions tend to dominate these categories. Moreover, the fact that debit cards tend to be used
frequently for these expenditures as well indicates that cash usage likely is not the result of a lack of
access to alternative payment options.
Figure 5 provides more evidence that consumers do not use cash as a niche payment instrument, but
actually use it in similar ways to debit and credit cards. Specifically, food and personal care supplies
make up 60 percent of all cash transactions, with entertainment and transportation, general
merchandise, and auto and vehicle related expenditures collectively accounting for an additional 26
percent of cash transactions. The breakdowns by expenditure category for credit and debit cards look
similar to that of cash, with food and personal care items making up the largest share of consumers’ use
8%
17%
27%
29%
34%
39%
42%
51%
67%
26%
17%
16%
5%
3%
8%
39%
9%
13%
12%
22%
30%
32%
18%
27%
10%
14%
6%
20%
26%
22%
15%
17%
33%
44%
11%
7%
5%
15%
8%
9%
5%
5%
6%
0% 10% 20% 30% 40% 50% 60% 70% 80% 90% 100%
Housing related
Financial, professional, miscellaneous services
Medical, education, personal services
General merchandise
Auto and vehicle related
Entertainment and transportation
Government and nonprofit
Food and personal care supplies
Gifts and transfers to people
Number of Transactions, Percent Share
Figure 4 Payment Instrument Shares, by Spending Category
Cash Check Credit Debit Electronic Other

April 2014 Page 5 of 15
Evidence from the Diary of Consumer Payment Choice
of these instruments, as well. In contrast, consumers seldom use checks for these sorts of day-to-day
expenditures.
P2P transactions appear to be a special use case for cash, where they behave more like checks than
cards, most likely because other payment options are less readily available for these transactions.
However, while cash is used for more than two-thirds of P2P transactions (Figure 4), P2P transactions
make up a relatively small share (6 percent) of all cash transactions (Figure 5). The call out box provides
more insight on P2P transactions and cash.
60% 10%
9%
6%
6%
Cash
47%
15%
19%
5%
1%
Debit
52%
16%
16%
5%
1%
Credit
11.9% 5.7%
9.6%
7.6%
4.4% Food and personal care supplies
Auto and vehicle related
General merchandise
Entertainment and transportation
Housing related
Medical, education, personal services
Financial, professional, miscellaneous services
Government and nonprofit
Gifts and transfers to people
Other
Check
Figure 5
How Consumers Use Different Payment Instruments
akljaf

April 2014 Page 6 of 15
Evidence from the Diary of Consumer Payment Choice
Consumers’ payment preferences influence how they pay.
While ticket size plays a role in consumers’ decisions about when to use cash, it is not the only factor
that influences their choices about which payment instrument to use. Indeed, a consumer’s preferences
play a key role.
Cash usage patterns look different when other options may not be as readily available.
In this Box, we take a closer look at P2P transactions as an example of a “use case” for which other
options are generally viewed as less available than cash (and even checks). As the figure shows, for
these transactions, consumers use cash differently than they do for all their other transactions.
Specifically, consumers’ average cash transaction values are 66 percent higher for P2P than for other
types of expenditures ($35 vs. $21)2. This is particularly true for more affluent consumers (i.e., those
with family incomes greater than $100,000 a year) who typically use cash only for small ticket
purchases. However, when they make P2P payments, they not only use cash more frequently, but
they also use it for much higher average value payments. The least affluent consumers (those
making less than $25,000), in contrast, use cash for higher valued transactions in general, and the
difference between P2P expenditures and all other expenditures is therefore less dramatic.
2 The average value for person to person (P2P) payments is slightly different than the average value for the
spending category “Gifts and transfers to people” from Table 1, which includes a sub spending category called
“People who provided goods and service.” Since this sub category is a payment for goods or services rather
than a P2P transfer to another person, it is excluded in the average P2P calculation.
$42
$50
$26
$19
$0
$10
$20
$30
$40
$50
$60
Less than $25K $100K Plus
Average Size of Cash Transactions, by Use Case and Household Income
P2P
All

April 2014 Page 7 of 15
Evidence from the Diary of Consumer Payment Choice
Cash, 30%
Check, 3%
Credit Card, 22%
Debit Card, 43%
Figure 6 Primary Payment Preference About 43 percent of consumers say that the debit card
is their payment instrument of choice (Figure 6), and
consistent with this stated preference, they do, in fact,
use their debit card for the largest share of all their
transactions (Figure 7). Similarly, 30 percent of
consumers say they prefer cash and 22 percent say
credit cards; in both cases, they use their preferred
payment instrument for at least half of their
transactions. Checks, however, are an anomaly: the 3
percent of consumers who prefer checks actually use
cash twice as often as they use checks. This may reflect
subtle (and not so subtle) social pressures to use a faster alternative to the check for the point of sale
transactions that make up a large share of consumers’ everyday expenditures.
Figure 7 also shows that when they do not use their preferred instrument, consumers who prefer debit
and credit cards use cash more frequently than any other payment instrument. While one might expect
consumers to treat debit and credit cards somewhat interchangeably, that does not appear to be the
case. Consumers who prefer debit cards, for example, use cash 36 percent of the time, while the same
group uses credit cards for only 7 percent of their transactions.
77%
49%
31% 36%
2%
25%
4% 3%
5% 10%
57%
7%
10% 10% 4%
50%
5% 6% 4% 4%
0%
20%
40%
60%
80%
100%
Cash Check Credit Card Debit Card
Figure 7 Share of Transactions by Payment Preference
Cash Check Credit Card Debit Card Other

April 2014 Page 8 of 15
Evidence from the Diary of Consumer Payment Choice
Consumers who prefer cash are a diverse group.
As shown in Figures 8 and 9, consumers of all age groups list cash as their preferred payment
instrument. Contrary to conventional wisdom, 40 percent of 18 – 24 year olds actually prefer cash, the
highest percentage of any age group. At the same time, this age group also has the highest preference
for debit cards. It is possible that a segment of younger consumers prefer cash because they have
limited access to banking and other financial products and services, in part due to typically lower
incomes in early adulthood. Older consumers are more likely to prefer credit cards and checks than
younger adults – and are less likely to prefer cash than younger adults. The much higher percentage of
adults over 65 who prefer credit cards relative to other age groups, particularly the youngest adults, is
also likely correlated with income (see Figure 10). However, the fact that virtually no consumers younger
than 35 prefer checks, compared to nearly 8 percent of those older than 65, seems less correlated with
income and may instead be the result of other age-related factors, such as payment habits that were
established in early and mid-adulthood.3
3 While the preliminary results show distinct patterns in preference across age groups, it should be emphasized
that the study has been done only once thus far and, as a consequence, the data cannot discern the effect of age
on a person’s preferences as he or she grows older. Recurring studies that follow the same or similar pool of
survey participants would allow for analysis of how a person’s choice can change as he or she gets older and, as a
corollary, how the stated preference across age groups translates to the actual instrument used in making
payments over time.
40% 31% 31% 32% 25% 25%
6% 8%
7% 18% 18% 23% 23%
33%
51% 51% 48% 40% 41%
32%
0%
20%
40%
60%
80%
100%
18 - 24 25 - 34 35 - 44 45 -54 55 - 64 65 & Older
Figure 8 Payment Preference by Age Group
Cash Check Credit Card Debit Card Other

April 2014 Page 9 of 15
Evidence from the Diary of Consumer Payment Choice
Given these stated preferences, it is not surprising that all ages use cash. However, as Figure 9 shows,
young adults actually use it far more frequently than they do debit cards, which is their most frequently
preferred payment instrument. Indeed, all age groups use cash more frequently than one might expect
based solely on stated payment preferences.
Figure 9 also shows that there is a significant substitution between check and debit, with older age
groups tending to use checks much more frequently than debit cards and vice versa for younger age
groups. This finding is not surprising given that check preference is highly correlated with age.
Income exerts a strong influence on payment preference.
As Figure 10 shows, 55 percent of consumers with household incomes less than $25,000 per year prefer
cash over non-cash payment instruments, while those households making more than $200,000 per year
exhibit a very strong preference for credit cards.4 The preference for cash declines sharply once
household income exceeds $25,000 per year, with debit cards cited as the preferred payment
instrument for all those in household income groups between the two extremes.
4 It is important to note that household income, and not individual income, is used in this analysis. There are
inherent limitations in using households as a proxy for individual consumer income, most obvious of which is that households often have dual income and can skew the results.
16.3 21.0 25.3 28.5
25.8 21.6
2.0 3.3
6.2 9.0
4.5
9.9 9.1
9.6 11.8 13.0
10.0 17.8 18.9
13.8 12.8 8.3
2.8 6.5 7.2 8.0 8.3 7.8
0%
20%
40%
60%
80%
100%
18–24 25–34 35–44 45–54 55–64 65 & Older
Figure 9 Average Number and Shares of Payments per Month by Age Group
Cash Check Credit Debit Other

April 2014 Page 10 of 15
Evidence from the Diary of Consumer Payment Choice
Consistent with payment preference, Figure 11 shows that the highest income group uses credit cards
for more than 40 percent of their monthly transactions – much more frequently than any other payment
option. This likely is due to the fact that more affluent consumers tend to have better access to credit
and financial services and can take advantage of the incentives card issuers offer for using credit cards.
At the same time, the lowest income group uses cash far more frequently than all other options
combined. What is surprising, however, is that, despite the declining preference for cash as income
rises, all income groups use cash for around 22 transactions per month.
55%
29% 22% 16% 16% 14% 10%
5%
15% 24% 35% 37% 37% 66%
31% 51% 49% 46% 43% 40%
15%
0%
20%
40%
60%
80%
100%
Less than$25K
$25k to $50K $50k to $75K $75K to $100K $100K to$125K
$125K to$200K
$200K Plus
Figure 10 Payment Preference by Household Income
Cash Check Credit Debit Other
0
10
20
30
40
50
60
70
80
Less than$25K
$25K to $50K $50K to $75K $75K to$100K
$100K to$125K
$125K to$200K
$200K Plus
Ave
rage
Nu
mb
er
of
Pay
me
nts
pe
r M
on
th
Figure 11 Payment Use by Household Income
Cash Check Credit Debit Electronic Other
57% 41% 38% 33% 33% 35% 33%
12% 18% 25% 25% 25%
41%
22%
28% 28% 25%
21% 20%
8%
April 2014 Page 11 of 15
Evidence from the Diary of Consumer Payment Choice
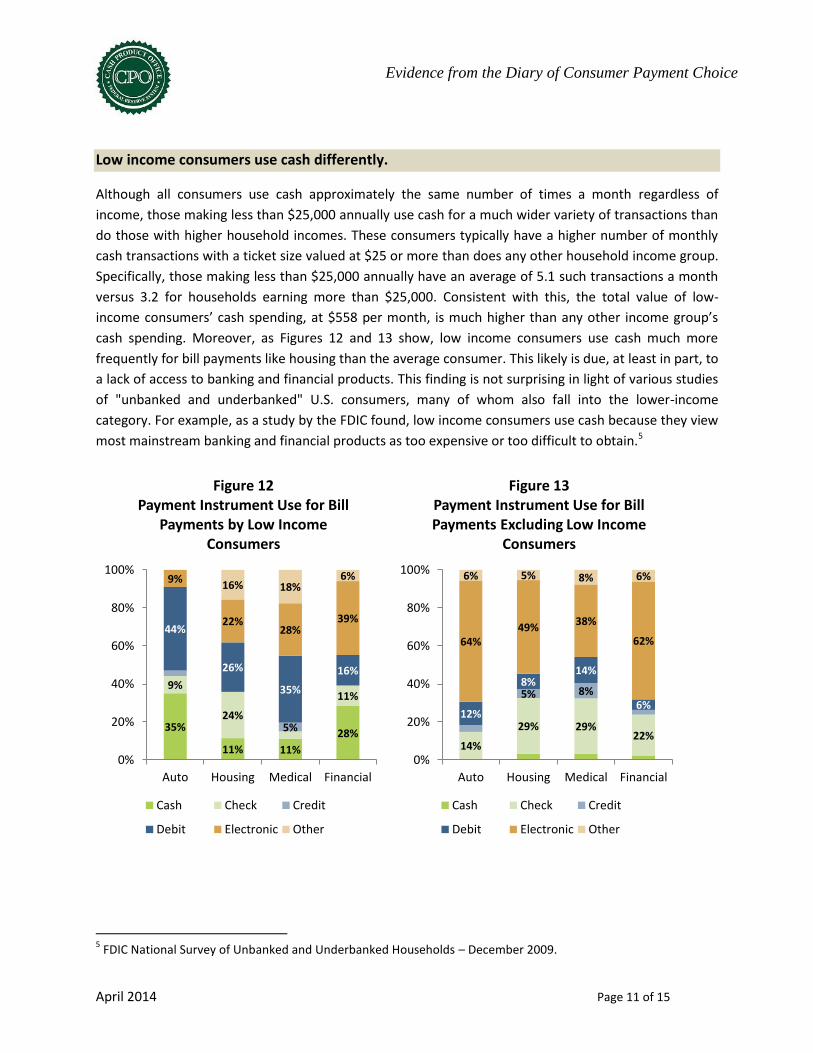
Low income consumers use cash differently.
Although all consumers use cash approximately the same number of times a month regardless of
income, those making less than $25,000 annually use cash for a much wider variety of transactions than
do those with higher household incomes. These consumers typically have a higher number of monthly
cash transactions with a ticket size valued at $25 or more than does any other household income group.
Specifically, those making less than $25,000 annually have an average of 5.1 such transactions a month
versus 3.2 for households earning more than $25,000. Consistent with this, the total value of low-
income consumers’ cash spending, at $558 per month, is much higher than any other income group’s
cash spending. Moreover, as Figures 12 and 13 show, low income consumers use cash much more
frequently for bill payments like housing than the average consumer. This likely is due, at least in part, to
a lack of access to banking and financial products. This finding is not surprising in light of various studies
of "unbanked and underbanked" U.S. consumers, many of whom also fall into the lower-income
category. For example, as a study by the FDIC found, low income consumers use cash because they view
most mainstream banking and financial products as too expensive or too difficult to obtain.5
5 FDIC National Survey of Unbanked and Underbanked Households – December 2009.
35%
11% 11%
28%
9%
24%
11%
5%
44%
26%
35%
16%
9%
22% 28%
39%
16% 18% 6%
0%
20%
40%
60%
80%
100%
Auto Housing Medical Financial
Figure 12 Payment Instrument Use for Bill
Payments by Low Income Consumers
Cash Check Credit
Debit Electronic Other
14%
29% 29% 22%
5% 8%
12%
8% 14%
6%
64% 49%
38%
62%
6% 5% 8% 6%
0%
20%
40%
60%
80%
100%
Auto Housing Medical Financial
Figure 13 Payment Instrument Use for Bill Payments Excluding Low Income
Consumers
Cash Check Credit
Debit Electronic Other

April 2014 Page 12 of 15
Evidence from the Diary of Consumer Payment Choice
Cash is the preferred back-up payment instrument.
Not only does cash play an important role in small value transactions and as the primary payment
instrument for low-income consumers, it also plays a significant role as the fallback payment instrument
for most consumers. As Figure 6 above shows, cash was second to debit cards as consumers’ payment
instrument of choice. When asked about
their backup payment instrument, however,
most consumers who preferred a non-cash
payment instrument declared cash as their
second choice. Sixty percent of consumers
who prefer the debit card, for example,
picked cash as their second choice (see
Figure 14). A similar observation holds true
for other payment instruments.
Additional evidence that cash may function
as the primary back-up payment instrument
for consumers is provided in the above Box,
entitled “Cash usage patterns look different
when other options may not be as readily
available.” In particular, the Box shows that the consumers who typically do not use cash for higher
ticket transactions (i.e., those with relatively high household incomes) tend to use cash differently (i.e.,
for higher values) in use cases where other options are not as readily available.
Conclusion
In summary, the Diary offers transaction-based evidence that cash is the most commonly used payment
instrument and that it plays several key roles in consumer spending. All income and age groups use cash
in roughly equal frequency, and particularly for transactions valued at less than $10, making cash the
dominant payment instrument for very low-value transactions. Moreover, consumers use cash
especially heavily for certain types of everyday expenditures, like food and personal care items. They
also rely heavily on cash as their primary back-up payment instrument in situations where their first
choice may not be available – P2P transactions are a good example. Finally, low-income consumers are
much heavier cash users – even for bill payments – than other consumers who may also have a stated
preference for cash but who tend to choose other options for bill payments and other high-value
transactions.
Thus, while debit and credit cards are growing strongly, and cash’s share of total consumer transactions
may well be declining, the 2012 Diary results suggest that cash still plays a very significant role in the
consumer payments landscape. Looking to future potential changes in cash usage relative to other
38% 55% 60%
33%
17% 13%
16% 26%
22%
12%
26% 20%
31%
10% 8% 5% 8%
0%
20%
40%
60%
80%
100%
Check Credit Debit Other
Primary Preference
Figure 14 Secondary Payment Preference given
Primary Preference
Cash Check Credit Debit Other

April 2014 Page 13 of 15
Evidence from the Diary of Consumer Payment Choice
payment instruments, the Federal Reserve will continue its work to understand how the continued
growth of debit cards, the expansion of prepaid cards among the unbanked, and novel P2P solutions
may influence how consumers use cash, and the potential effects on the Fed’s cash business.
About the Cash Product Office
As the nation’s central bank, the Federal Reserve ensures that cash is available when and where it is
needed, including in times of crisis and business disruption, by providing FedCash® Services to depository
institutions and, through them, to the general public. In fulfilling this role, the Fed’s primary
responsibility is to maintain public confidence in the integrity and availability of U.S. currency.
The Federal Reserve System’s Cash Product Office (CPO) provides strategic leadership for this key
function by formulating and implementing service level policies, operational guidance, and technology
strategies for U.S. currency and coin services provided by Federal Reserve Banks nationally and
internationally. In addition to guiding policies and procedures, the CPO establishes budget guidance for
FedCash® Services, provides support for Federal Reserve currency and coin inventory management, and
supports business continuity planning at the supply chain level. It also conducts market research and
works directly with financial institutions and retailers to analyze trends in cash usage.

April 2014 Page 14 of 15
Evidence from the Diary of Consumer Payment Choice
Appendix 1 Table 1: Average Purchases per Month, by Spending Category
Cash Check Credit Debit Electronic Other Total
Food and Personal Care Supplies
Average Number of Purchases
14.3 0.5 4.8 7.5 0.0 1.1 28.2
Average Transaction Value
$14 $53 $32 $29 $173 $25 $23
Auto and Vehicle Related
Average Number of Purchases
2.4 0.2 1.6 2.3 0.4 0.3 7.1
Average Transaction Value
$31 $214 $51 $53 $357 $58 $65
General Merchandise
Average Number of Purchases
2.2 0.4 2.0 2.3 0.5 0.2 7.5
Average Transaction Value
$22 $127 $71 $47 $107 $37 $54
Entertainment Merchandise
Average Number of Purchases
1.4 0.3 0.5 0.7 0.6 0.2 3.7
Average Transaction Value
$22 $95 $92 $70 $128 $53 $64
Housing Related
Average Number of Purchases
0.3 1.0 0.5 0.5 1.2 0.2 3.7
Average Transaction Value
$136 $271 $113 $117 $296 $229 $224
Medical, Education, and Personal Service
Average Number of Purchases
0.7 0.4 0.5 0.5 0.3 0.1 2.5
Average Transaction Value
$26 $87 $127 $84 $168 $145 $89
Financial, Professional, and Miscellaneous Services
Average Number of Purchases
0.3 0.3 0.1 0.2 0.8 0.1 1.8
Average Transaction Value
$46 $319 $98 $101 $202 $146 $176
Government and Non Profit
Average Number of Purchases
0.5 0.4 0.0 0.0 0.1 0.0 1.1
Average Transaction Value
$15 $128 $161 $78 $178 $233 $86
Gifts and Transfers to People
Average Number of Purchases
1.3 0.2 0.1 0.2 0.2 0.0 1.9
Average Transaction Value
$32 $128 $66 $39 $156 $264 $57
Other
Average Number of Purchases
0.3 0.2 0.1 0.1 0.3 0.0 1.1
Average Transaction Value
$35 $108 $79 $43 $208 $329 $116
Total
Average Number of Purchases
23.7 3.9 10.1 14.4 4.4 2.3 58.7
Average Transaction
Value $21 $168 $56 $44 $216 $69 $59
April 2014 Page 15 of 15
Evidence from the Diary of Consumer Payment Choice
Appendix 2
Methodology
The DCPC was developed jointly by the Boston Fed’s Consumer Payments Research Center (CPRC), the
Federal Reserve’s Cash Product Office (CPO) in San Francisco, and the Payments Studies Group (PSG) at
the Richmond Fed. The Diary is being used to benchmark the CPRC’s Survey of Consumer Payment
Choice, for strategic planning by the CPO, and to enable economic analysis of the payments choices
consumers make. The CPO and the CPRC performed a joint review of the survey responses presented in
this paper.
The diary study is based on a random sample of 2,468 respondents from across the United States, based
on the American Life Panel administered by the Rand Corporation. Using the Census Bureau’s Current
Population Survey, responses were weighted to match national population estimates. October was
selected as a “typical month” to minimize seasonality effects in consumer spending patterns. The survey
was staggered over the month of October 2012 to ensure that there were nearly equal people
participating each day of the month.
Participants were asked to log all of their transactions for three days, including their purchases, bill
payments, cash withdrawals, and deposits. The diary also asked participants how much cash they had in
their wallets at the start of the study and at the end of each day. To track the detail of each payment
made for each day, participants were given a paper journal-like memory aid that also contained a
reference list of payment methods, merchant type, etc. to help respondents classify their payments.
Participants then logged into a website and entered their activity for the day.
Participants were also asked to identify and rank their preferred payment instruments at the outset of
their diary entries. This allowed insight into the relationship between the consumer’s preferences and
the actual payment instrument used in transactions.