Embed Size (px)
Citation preview
ORGANIZATIONAL POLICY & STRATEGY
Page 1 of 24
PROGRAM MASTER OF BUSINESS ADMINISTRATION COURSE ORGANIZATIONAL POLICY & STRATEGY
CASE STUDY – REVLON
ORGANIZATIONAL POLICY & STRATEGY
Page 2 of 24
Acknowledgement
This paper was undertaken during enrollment of master degree of business administration and it is a great
opportunity to share this paper for an academic knowledge and development as well as self-improvement
management skills.
ORGANIZATIONAL POLICY & STRATEGY
Page 3 of 24
Executive Summary
Revlon was founded in 1932 by brothers Charles (Joseph Revson and Charles Lachmann) with a $300
investment from nail products to beauty products. In 1937, Revlon successful started selling products in
department stores and drug stores. Revlon was taken public in 1996 traded on the New York Stock
Exchange.
Today, Revlon is the global company which offering the products over 100 countries and products focus on
skin care, cosmetics, personal care, fragrance and professional products.
In this case study, the strategic management is focusing on the following:
Identify the firm’s vision, mission, objectives and strategies
Develop the statement of vision and mission of the firm
Identify external opportunities and threats
Construct Competitive Profile Matrix (CPM)
Construct External Factor Evaluation (EPE)
Identify internal strengths and weakness
Construct Internal Factor Evaluation
Prepare Strengths-Weakness-Opportunies-Threats Matrix (SWOT), Strategic Position and Action
Evaluation Matrix (SPACE), Internal-External Matrix (IE), Grand Strategy Matrix, Quantitative
Strategic Planning Matrix (QSPM) with advantages and disadvantages of alternative strategies.
Should Revlon concentrate its efforts on international market, given the low value of the dollar and
competitive pressure? Which countries should Revlon focus on?
Should Revlon diversify its operations or develop joint ventures with other cosmetics companies? Would
jewelry be good industry to enter given the aging society?
Does Revlon have too many brands? Should the company keep brands such as ColorStay and get rid of
brands such as Mitchum?
Should Revlon agree to sell itself to Perlman or to a rival firm? What is Revlon worth on the market?
ORGANIZATIONAL POLICY & STRATEGY
Page 4 of 24
The firm’s vision, mission, objectives and strategies
Revlon Perspectives
To create and develop the most consumer-preferred brands;
To be the most valuable partner to our retail customers;
To profitability grow the business and its value for our stakeholders.
The statement of vision and mission of the firm
Revlon does not have visible vision and mission but emphasize on company perspective. It is disadvantage
to Revlon because the direction of the company is fully depending on the leader, Chief Executive Officer.
Because of the company led by leader, it is put the company on risk which each leader has different strategy
and it may not relate the core value of the company.
Therefore, it is suggested the vision and mission for Revlon due to enhancing the primary objective of the
company function and business particularly products penetration to customer needs and wants:
Vision
To be consumer-preferred brands and valuable business partners of growing the business to maximizing the
value for the stakeholders.
Mission
To be premier beauty global company
To be the best choice of customer’s products
To be the best place to work
The vision is defined the core values of Revlon that the business model focus on the brand and offering
product by utilize the resources and contribute the time value of money. This vision is the company direction
towards branding and quality products which offering to the customer needs and wants. Thus, it is giving the
lifestyle long term goal for the company to build potential business for the continuously profit making.
In order to achieve this vision, the missions are needed to define. Premier beauty global company is defined
the growth of business model and structure that continuously focus on core products such as beauty products
penetrate the international market and product developments to satisfy the customer needs. The best choice
of customer’s products is defined the quality of the offering products which giving the highest satisfaction
for customer especially branding that build the strengths and opportunities to compete in the competitive
market and rivals. The best place to work is defined the important of human capital and development that
focus on quality productivity for the maximization of output and welfare of the employees so that proud of
belonging could be built to minimize the labour turnover and motivate the employees for better productivity
especially rewards and incentive.
ORGANIZATIONAL POLICY & STRATEGY
Page 5 of 24
External opportunities and threats
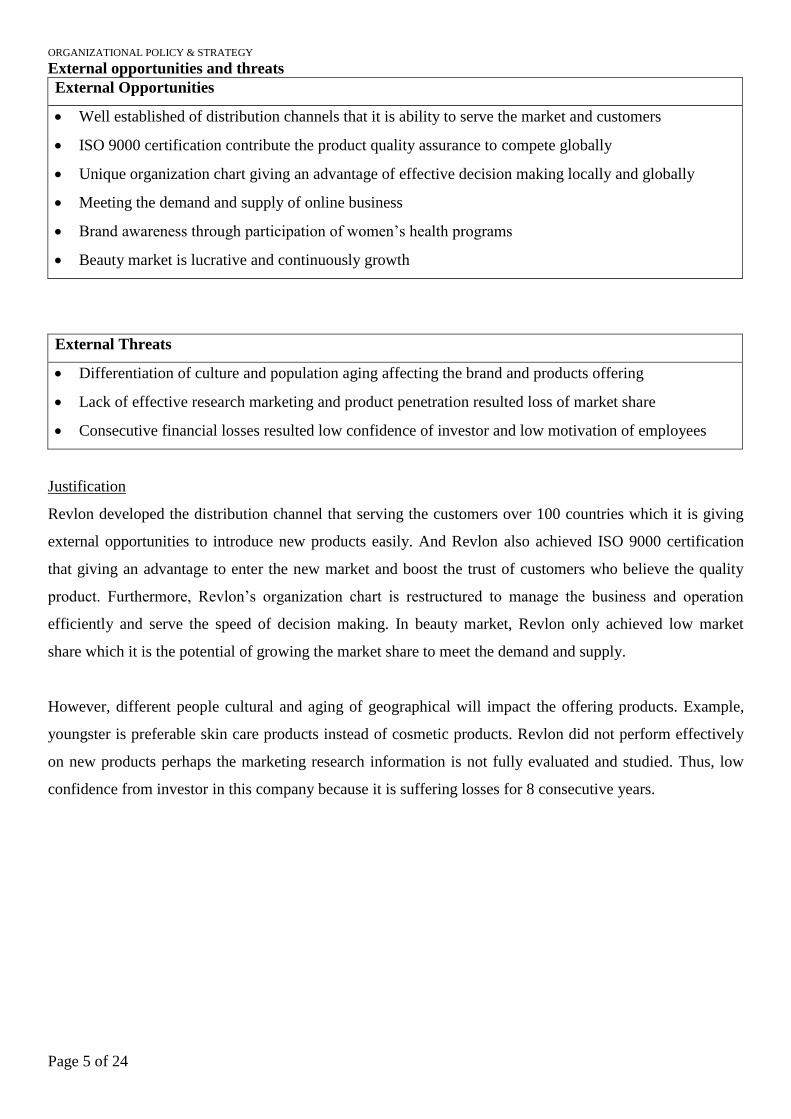
External Opportunities
Well established of distribution channels that it is ability to serve the market and customers
ISO 9000 certification contribute the product quality assurance to compete globally
Unique organization chart giving an advantage of effective decision making locally and globally
Meeting the demand and supply of online business
Brand awareness through participation of women’s health programs
Beauty market is lucrative and continuously growth
External Threats
Differentiation of culture and population aging affecting the brand and products offering
Lack of effective research marketing and product penetration resulted loss of market share
Consecutive financial losses resulted low confidence of investor and low motivation of employees
Justification
Revlon developed the distribution channel that serving the customers over 100 countries which it is giving
external opportunities to introduce new products easily. And Revlon also achieved ISO 9000 certification
that giving an advantage to enter the new market and boost the trust of customers who believe the quality
product. Furthermore, Revlon’s organization chart is restructured to manage the business and operation
efficiently and serve the speed of decision making. In beauty market, Revlon only achieved low market
share which it is the potential of growing the market share to meet the demand and supply.
However, different people cultural and aging of geographical will impact the offering products. Example,
youngster is preferable skin care products instead of cosmetic products. Revlon did not perform effectively
on new products perhaps the marketing research information is not fully evaluated and studied. Thus, low
confidence from investor in this company because it is suffering losses for 8 consecutive years.
ORGANIZATIONAL POLICY & STRATEGY
Page 6 of 24
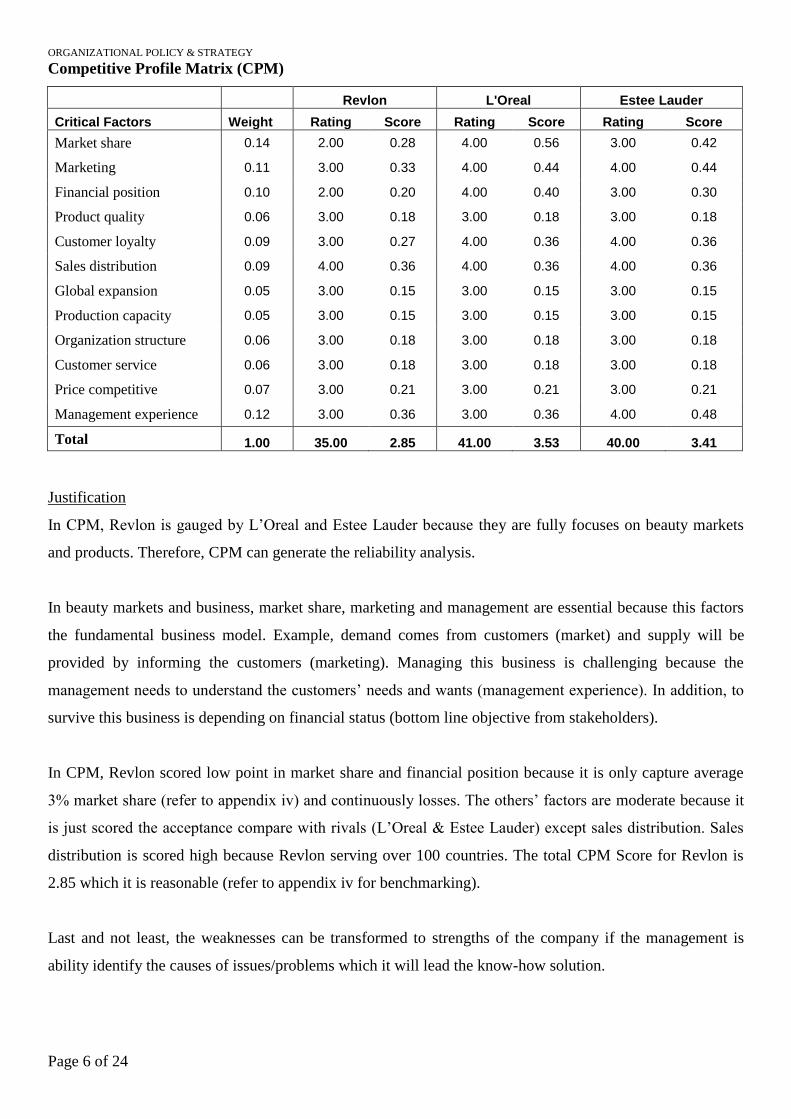
Competitive Profile Matrix (CPM)
Revlon L'Oreal Estee Lauder
Critical Factors Weight Rating Score Rating Score Rating Score
Market share 0.14 2.00 0.28 4.00 0.56 3.00 0.42
Marketing 0.11 3.00 0.33 4.00 0.44 4.00 0.44
Financial position 0.10 2.00 0.20 4.00 0.40 3.00 0.30
Product quality 0.06 3.00 0.18 3.00 0.18 3.00 0.18
Customer loyalty 0.09 3.00 0.27 4.00 0.36 4.00 0.36
Sales distribution 0.09 4.00 0.36 4.00 0.36 4.00 0.36
Global expansion 0.05 3.00 0.15 3.00 0.15 3.00 0.15
Production capacity 0.05 3.00 0.15 3.00 0.15 3.00 0.15
Organization structure 0.06 3.00 0.18 3.00 0.18 3.00 0.18
Customer service 0.06 3.00 0.18 3.00 0.18 3.00 0.18
Price competitive 0.07 3.00 0.21 3.00 0.21 3.00 0.21
Management experience 0.12 3.00 0.36 3.00 0.36 4.00 0.48
Total 1.00 35.00 2.85 41.00 3.53 40.00 3.41
Justification
In CPM, Revlon is gauged by L’Oreal and Estee Lauder because they are fully focuses on beauty markets
and products. Therefore, CPM can generate the reliability analysis.
In beauty markets and business, market share, marketing and management are essential because this factors
the fundamental business model. Example, demand comes from customers (market) and supply will be
provided by informing the customers (marketing). Managing this business is challenging because the
management needs to understand the customers’ needs and wants (management experience). In addition, to
survive this business is depending on financial status (bottom line objective from stakeholders).
In CPM, Revlon scored low point in market share and financial position because it is only capture average
3% market share (refer to appendix iv) and continuously losses. The others’ factors are moderate because it
is just scored the acceptance compare with rivals (L’Oreal & Estee Lauder) except sales distribution. Sales
distribution is scored high because Revlon serving over 100 countries. The total CPM Score for Revlon is
2.85 which it is reasonable (refer to appendix iv for benchmarking).
Last and not least, the weaknesses can be transformed to strengths of the company if the management is
ability identify the causes of issues/problems which it will lead the know-how solution.
ORGANIZATIONAL POLICY & STRATEGY
Page 7 of 24
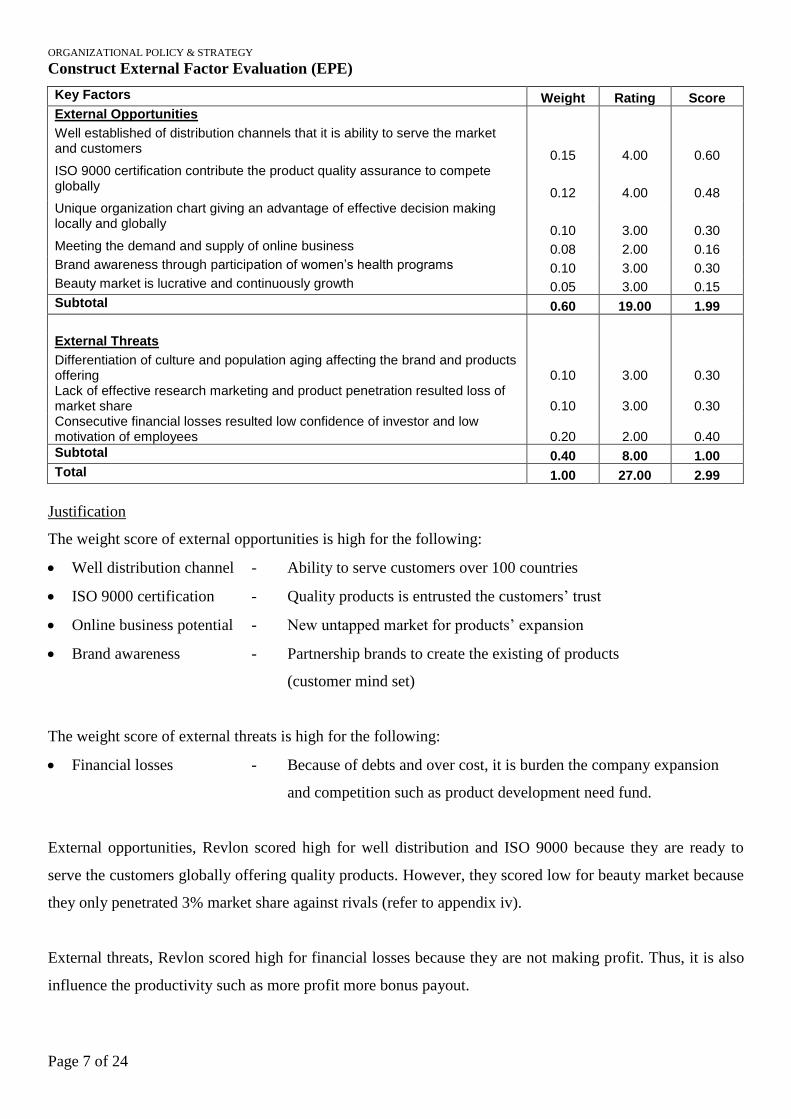
Construct External Factor Evaluation (EPE)
Key Factors Weight Rating Score
External Opportunities Well established of distribution channels that it is ability to serve the market and customers
0.15 4.00 0.60 ISO 9000 certification contribute the product quality assurance to compete globally
0.12 4.00 0.48 Unique organization chart giving an advantage of effective decision making locally and globally
0.10 3.00 0.30 Meeting the demand and supply of online business 0.08 2.00 0.16 Brand awareness through participation of women’s health programs 0.10 3.00 0.30 Beauty market is lucrative and continuously growth 0.05 3.00 0.15
Subtotal 0.60 19.00 1.99
External Threats Differentiation of culture and population aging affecting the brand and products offering 0.10 3.00 0.30 Lack of effective research marketing and product penetration resulted loss of market share 0.10 3.00 0.30 Consecutive financial losses resulted low confidence of investor and low motivation of employees 0.20 2.00 0.40
Subtotal 0.40 8.00 1.00
Total 1.00 27.00 2.99
Justification
The weight score of external opportunities is high for the following:
Well distribution channel - Ability to serve customers over 100 countries
ISO 9000 certification - Quality products is entrusted the customers’ trust
Online business potential - New untapped market for products’ expansion
Brand awareness - Partnership brands to create the existing of products
(customer mind set)
The weight score of external threats is high for the following:
Financial losses - Because of debts and over cost, it is burden the company expansion
and competition such as product development need fund.
External opportunities, Revlon scored high for well distribution and ISO 9000 because they are ready to
serve the customers globally offering quality products. However, they scored low for beauty market because
they only penetrated 3% market share against rivals (refer to appendix iv).
External threats, Revlon scored high for financial losses because they are not making profit. Thus, it is also
influence the productivity such as more profit more bonus payout.
ORGANIZATIONAL POLICY & STRATEGY
Page 8 of 24
Internal strengths and weakness
Internal Strengths
Ability to serve the customers over 100 countries
Cost control management to minimize resources wastage
Restructure management functions and divisions for effective productivity
Quality standard accreditation contribute the product quality to satisfy the customers expectation
Manageable debtors aging
Internal Weakness
Product line is limited to beauty
Lack of innovative and creativity of product development
High debt equity ratio resulted risk-taking firm
Deficit retain earning result low confidence for firm share and investment
Justification
In internal strengths Revlon is ability to serve customers globally with offering ISO 9000 certified products.
Thus, they are successful managing debtors aging (refer appendix iii) resulted turnover cashflow is effective.
In addition, cost control measure is important since Revlon is suffering losses.
Nevertheless, management functions and divisions are restructured to further strengthening the company
position. Based on this experience, Revlon should able to come back in profit once the organization structure
is fully completed and gauge the performance index effectively.
In internal weakness, Revlon only focusing on beauty products resulted alternative market share is untapped.
In addition, some new products are not doing well due to it may lack of specialization/expertise of know-
how customer needs and wants.
As a result, it is giving return on losses in stead of return on investment. Moreover, product development
funds are wasted if the products rejected by customers and markets.
ORGANIZATIONAL POLICY & STRATEGY
Page 9 of 24
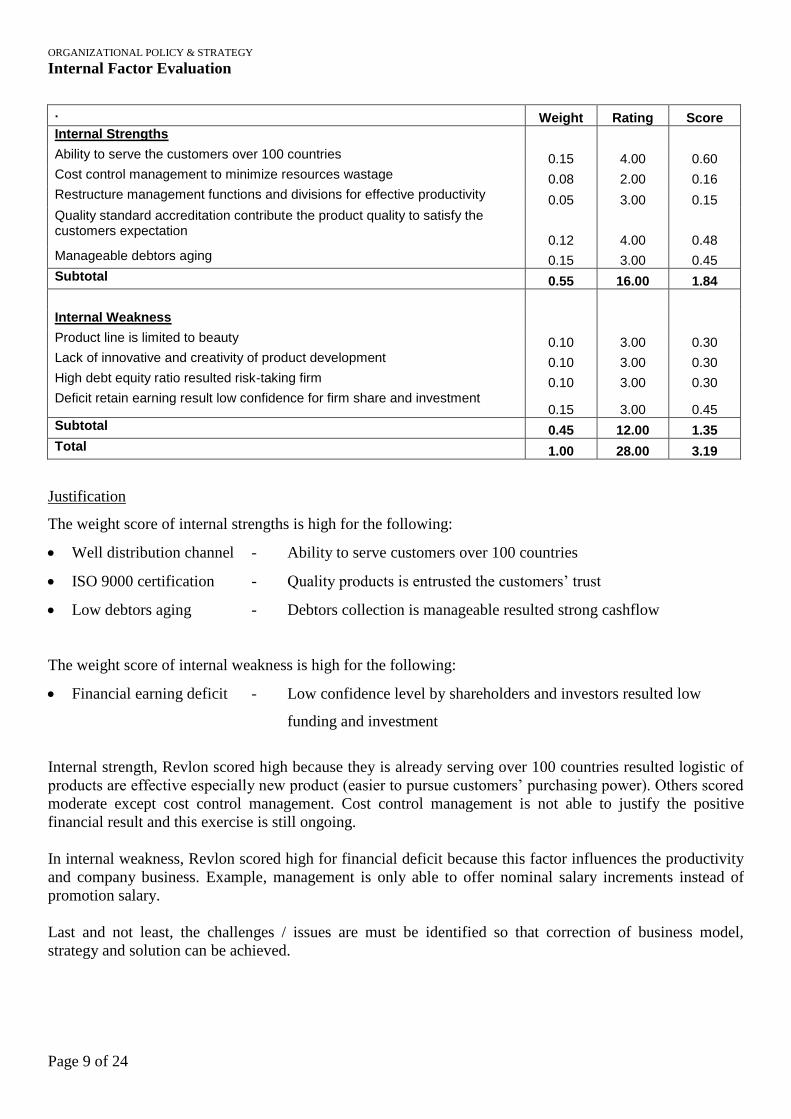
Internal Factor Evaluation
. Weight Rating Score
Internal Strengths Ability to serve the customers over 100 countries 0.15 4.00 0.60 Cost control management to minimize resources wastage 0.08 2.00 0.16 Restructure management functions and divisions for effective productivity 0.05 3.00 0.15 Quality standard accreditation contribute the product quality to satisfy the customers expectation
0.12 4.00 0.48 Manageable debtors aging 0.15 3.00 0.45
Subtotal 0.55 16.00 1.84
Internal Weakness Product line is limited to beauty 0.10 3.00 0.30 Lack of innovative and creativity of product development 0.10 3.00 0.30 High debt equity ratio resulted risk-taking firm 0.10 3.00 0.30 Deficit retain earning result low confidence for firm share and investment
0.15 3.00 0.45
Subtotal 0.45 12.00 1.35
Total 1.00 28.00 3.19
Justification
The weight score of internal strengths is high for the following:
Well distribution channel - Ability to serve customers over 100 countries
ISO 9000 certification - Quality products is entrusted the customers’ trust
Low debtors aging - Debtors collection is manageable resulted strong cashflow
The weight score of internal weakness is high for the following:
Financial earning deficit - Low confidence level by shareholders and investors resulted low
funding and investment
Internal strength, Revlon scored high because they is already serving over 100 countries resulted logistic of
products are effective especially new product (easier to pursue customers’ purchasing power). Others scored
moderate except cost control management. Cost control management is not able to justify the positive
financial result and this exercise is still ongoing.
In internal weakness, Revlon scored high for financial deficit because this factor influences the productivity
and company business. Example, management is only able to offer nominal salary increments instead of
promotion salary.
Last and not least, the challenges / issues are must be identified so that correction of business model,
strategy and solution can be achieved.
ORGANIZATIONAL POLICY & STRATEGY
Page 10 of 24
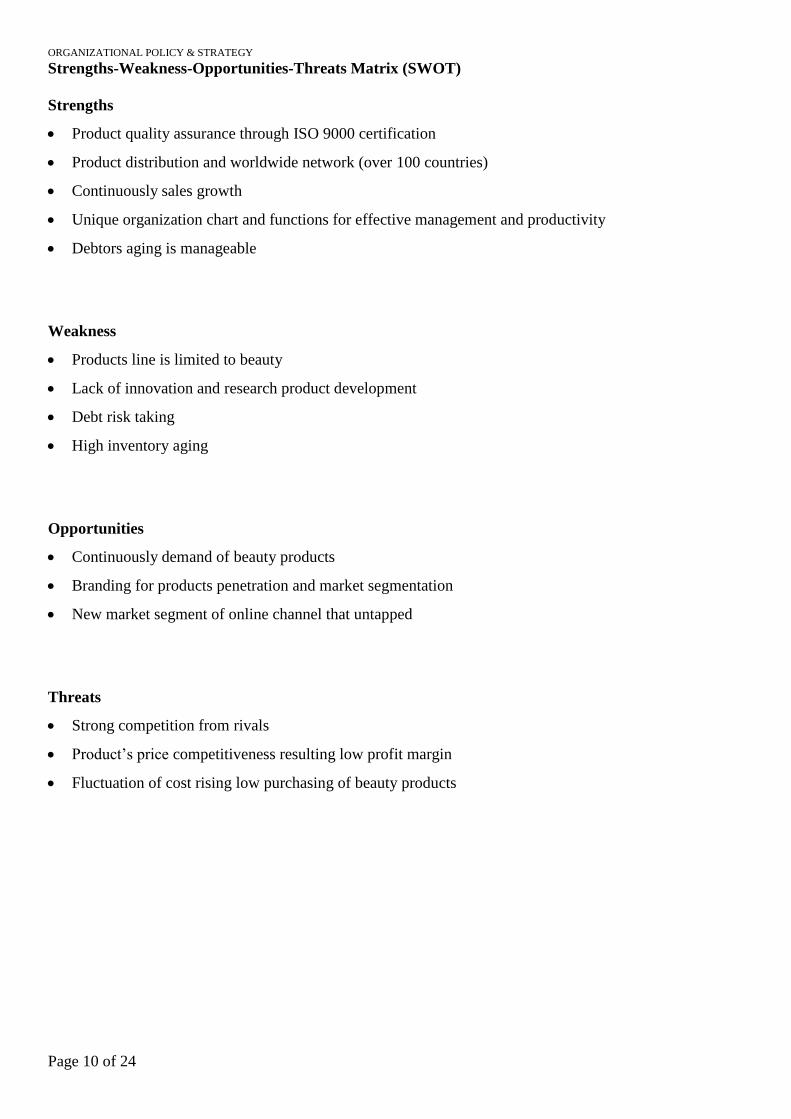
Strengths-Weakness-Opportunities-Threats Matrix (SWOT)
Strengths
Product quality assurance through ISO 9000 certification
Product distribution and worldwide network (over 100 countries)
Continuously sales growth
Unique organization chart and functions for effective management and productivity
Debtors aging is manageable
Weakness
Products line is limited to beauty
Lack of innovation and research product development
Debt risk taking
High inventory aging
Opportunities
Continuously demand of beauty products
Branding for products penetration and market segmentation
New market segment of online channel that untapped
Threats
Strong competition from rivals
Product’s price competitiveness resulting low profit margin
Fluctuation of cost rising low purchasing of beauty products
ORGANIZATIONAL POLICY & STRATEGY
Page 11 of 24
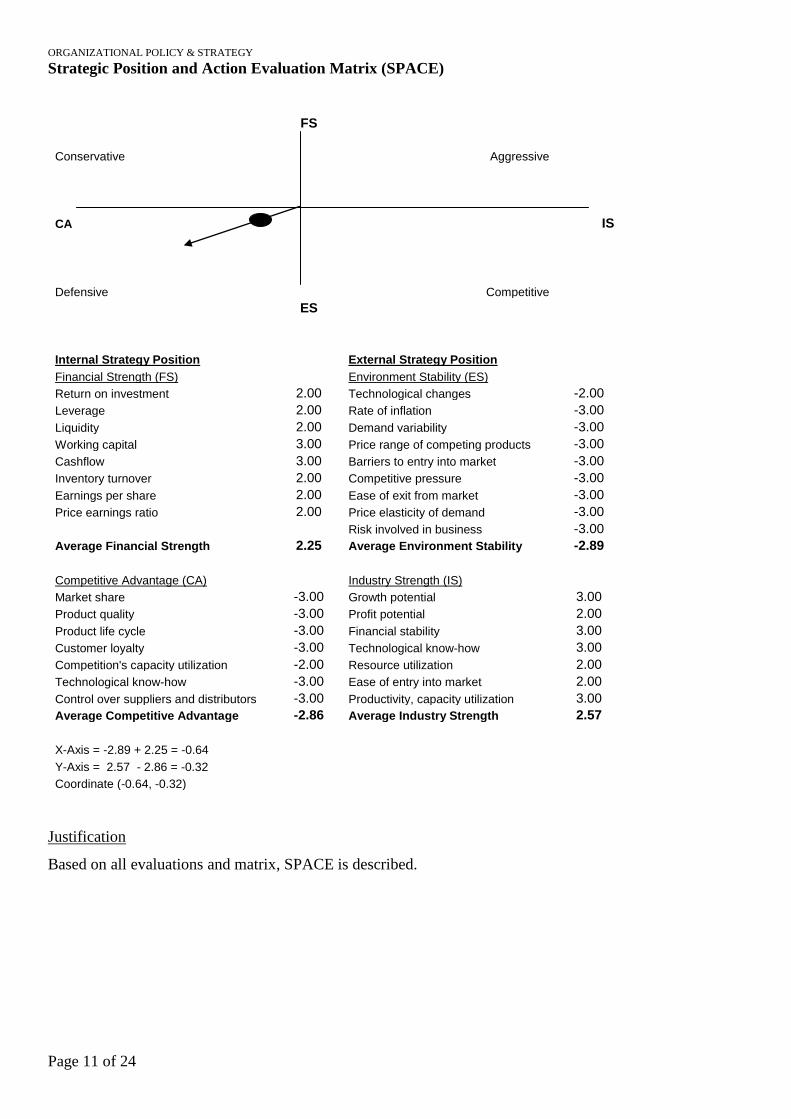
Strategic Position and Action Evaluation Matrix (SPACE)
FS
Conservative
Aggressive
CA IS
Defensive Competitive
ES
Internal Strategy Position External Strategy Position
Financial Strength (FS) Environment Stability (ES)
Return on investment 2.00 Technological changes -2.00
Leverage 2.00 Rate of inflation -3.00
Liquidity 2.00 Demand variability -3.00
Working capital 3.00 Price range of competing products -3.00
Cashflow 3.00 Barriers to entry into market -3.00
Inventory turnover 2.00 Competitive pressure -3.00
Earnings per share 2.00 Ease of exit from market -3.00
Price earnings ratio 2.00 Price elasticity of demand -3.00
Risk involved in business -3.00
Average Financial Strength 2.25 Average Environment Stability -2.89
Competitive Advantage (CA) Industry Strength (IS)
Market share -3.00 Growth potential 3.00
Product quality -3.00 Profit potential 2.00
Product life cycle -3.00 Financial stability 3.00
Customer loyalty -3.00 Technological know-how 3.00
Competition's capacity utilization -2.00 Resource utilization 2.00
Technological know-how -3.00 Ease of entry into market 2.00
Control over suppliers and distributors -3.00 Productivity, capacity utilization 3.00
Average Competitive Advantage -2.86 Average Industry Strength 2.57
X-Axis = -2.89 + 2.25 = -0.64
Y-Axis = 2.57 - 2.86 = -0.32
Coordinate (-0.64, -0.32)
Justification
Based on all evaluations and matrix, SPACE is described.
ORGANIZATIONAL POLICY & STRATEGY
Page 12 of 24
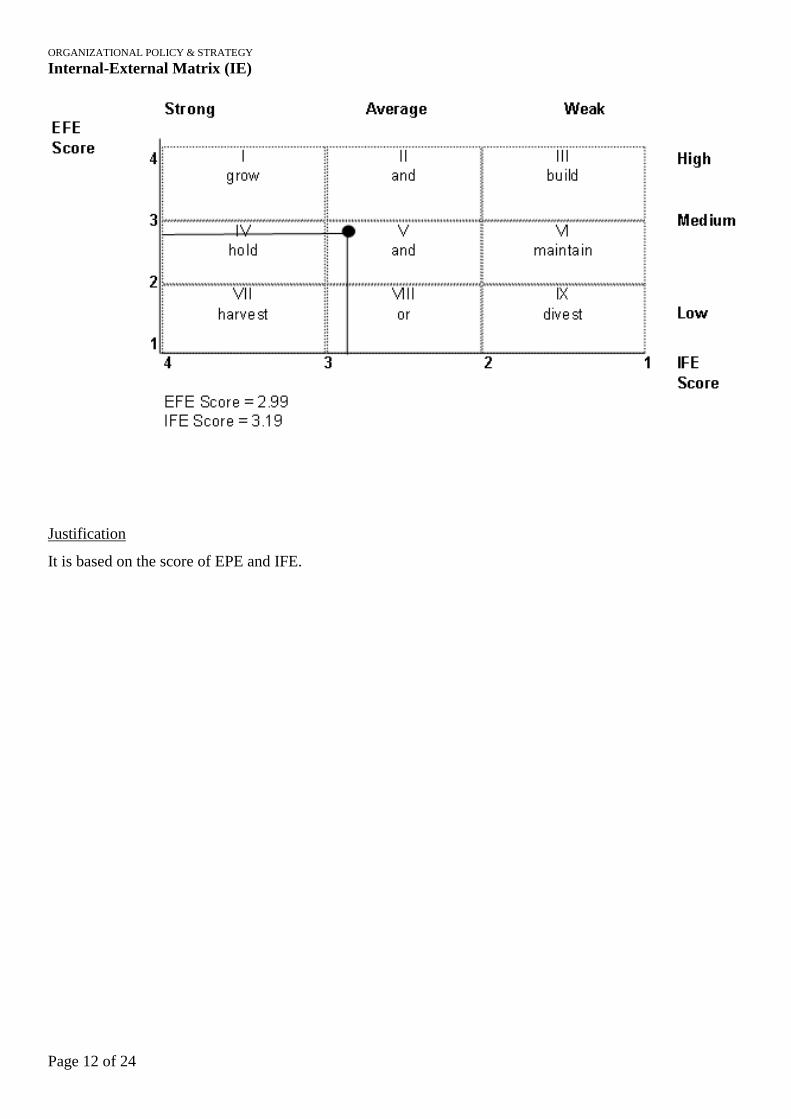
Internal-External Matrix (IE)
Justification
It is based on the score of EPE and IFE.
ORGANIZATIONAL POLICY & STRATEGY
Page 13 of 24
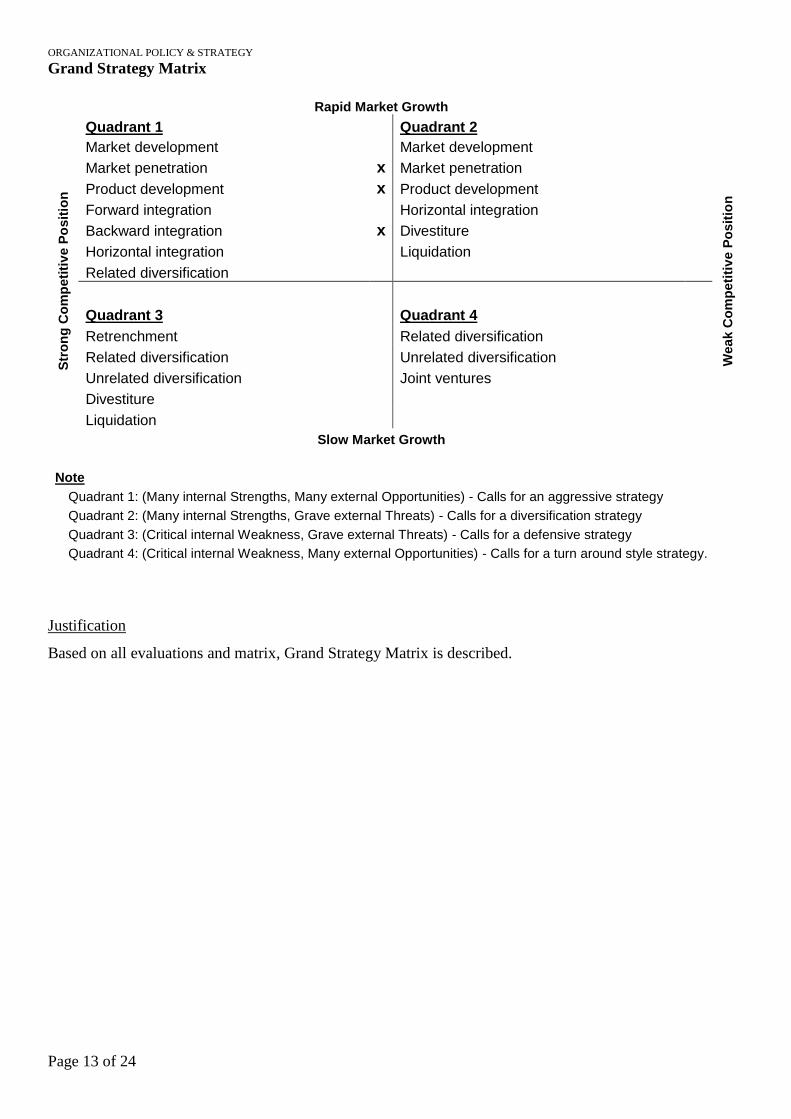
Grand Strategy Matrix
Rapid Market Growth
Str
on
g C
om
peti
tiv
e P
osit
ion
Quadrant 1 Quadrant 2
Wea
k C
om
peti
tiv
e P
osit
ion
Market development Market development
Market penetration x Market penetration
Product development x Product development
Forward integration Horizontal integration
Backward integration x Divestiture
Horizontal integration Liquidation
Related diversification
Quadrant 3 Quadrant 4
Retrenchment Related diversification
Related diversification Unrelated diversification
Unrelated diversification Joint ventures
Divestiture
Liquidation
Slow Market Growth
Note
Quadrant 1: (Many internal Strengths, Many external Opportunities) - Calls for an aggressive strategy
Quadrant 2: (Many internal Strengths, Grave external Threats) - Calls for a diversification strategy
Quadrant 3: (Critical internal Weakness, Grave external Threats) - Calls for a defensive strategy
Quadrant 4: (Critical internal Weakness, Many external Opportunities) - Calls for a turn around style strategy.
Justification
Based on all evaluations and matrix, Grand Strategy Matrix is described.
ORGANIZATIONAL POLICY & STRATEGY
Page 14 of 24
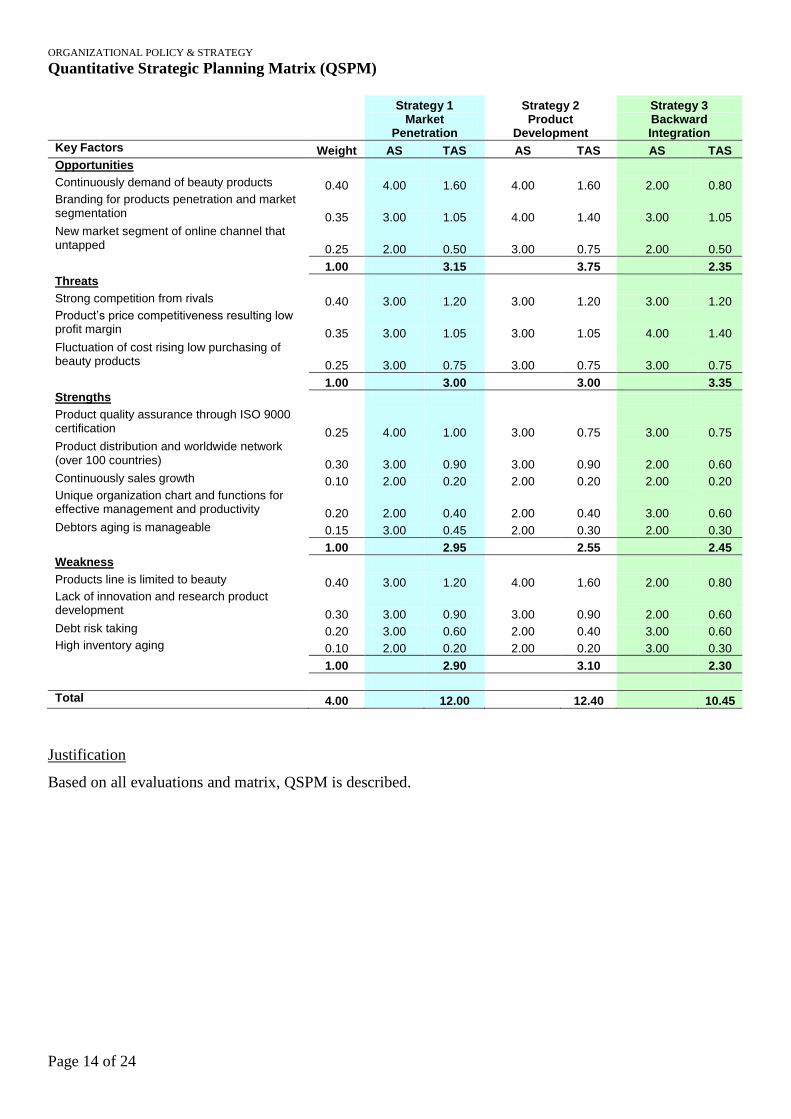
Quantitative Strategic Planning Matrix (QSPM)
Strategy 1 Strategy 2 Strategy 3
Market Penetration
Product Development
Backward Integration
Key Factors Weight AS TAS AS TAS AS TAS
Opportunities Continuously demand of beauty products 0.40 4.00 1.60 4.00 1.60 2.00 0.80 Branding for products penetration and market segmentation 0.35 3.00 1.05 4.00 1.40 3.00 1.05 New market segment of online channel that untapped 0.25 2.00 0.50 3.00 0.75 2.00 0.50
1.00 3.15 3.75 2.35
Threats Strong competition from rivals 0.40 3.00 1.20 3.00 1.20 3.00 1.20 Product’s price competitiveness resulting low profit margin 0.35 3.00 1.05 3.00 1.05 4.00 1.40 Fluctuation of cost rising low purchasing of beauty products 0.25 3.00 0.75 3.00 0.75 3.00 0.75
1.00 3.00 3.00 3.35
Strengths Product quality assurance through ISO 9000 certification 0.25 4.00 1.00 3.00 0.75 3.00 0.75 Product distribution and worldwide network (over 100 countries) 0.30 3.00 0.90 3.00 0.90 2.00 0.60 Continuously sales growth 0.10 2.00 0.20 2.00 0.20 2.00 0.20 Unique organization chart and functions for effective management and productivity 0.20 2.00 0.40 2.00 0.40 3.00 0.60 Debtors aging is manageable 0.15 3.00 0.45 2.00 0.30 2.00 0.30
1.00 2.95 2.55 2.45
Weakness Products line is limited to beauty 0.40 3.00 1.20 4.00 1.60 2.00 0.80 Lack of innovation and research product development 0.30 3.00 0.90 3.00 0.90 2.00 0.60 Debt risk taking 0.20 3.00 0.60 2.00 0.40 3.00 0.60 High inventory aging 0.10 2.00 0.20 2.00 0.20 3.00 0.30
1.00 2.90 3.10 2.30
Total 4.00 12.00 12.40 10.45
Justification
Based on all evaluations and matrix, QSPM is described.
ORGANIZATIONAL POLICY & STRATEGY
Page 15 of 24
Should Revlon adopting Avon’s door-to-door sales tactics? Do you think that is good strategy or not
and why? If yes, to what extend should this new forward integration strategy be pursued? If China,
why not put salespersons on the ground in other countries such as India and even the United States?
Revlon should adopting door-to-door sales strategy in China that it is similar with Avon because of the
following:
Effectiveness to communicate with customers directly and closer understand their expectations so that
product and service improvement can be achieved
Minimize the operation cost via utilize the Multi-Level-Marketing Concept so that win-win situation can
be achieved. Example, people get job as business instead of employment and customers get the best
economic benefits (less involvement of third-party resulted low cost).
Easier to build customer loyalty via using word of mouth strategy. It is easier to serve one-to-one
because marketer is able to focus customer needs and wants.
Revlon should use 5’s P Marketing Strategy for the new forward integration strategy in China. The 5’s P
Marketing Strategy is consisting of Proposal, Product, Price, Promotion and Place.
Proposal is the business start-up plan that the person can become sales agent based on the conditions as
follows:
Fully compliance of domestic regulations
Fully attend the training courses such as sales, sole proprietorship, product and hospitality
Products are the goods from Revlon to the customer that sales agent know-how to demonstration and advise
the application usage. Revlon will be offered the product training to sales agent so that direct selling can be
started. Any challenges/issues during personal selling shall refer to Revlon so that solution can be provided.
Thus, it will giving advantage for both that sales agent can use the solution and Revlon can further
understand the customer behavior, expectation and perceive. As a result, brand and customer royalty can be
built.
ORGANIZATIONAL POLICY & STRATEGY
Page 16 of 24
Price is the cost of the products that customer can enjoy as well as sales agent can make profit. Revlon
should set the reasonable pricing so that customer can enjoy the value of money and sales agent can earn
more money (product profit margin). In addition, price incentive can be introduced based on the conditions:
Larger volume purchase by sales agent can enjoy additional discount
Annual volume purchase by sales agent can enjoy the cash bonus and premium insurance
package
Promotion is the sales incentive that sales agent and customer can be enjoyed. Example, Revlon cosmetics
product can be offered 30% discount at retail value of $1000 if the customer purchase more than $1000
products from all brands.
Place is the products distribution channel. Sales agent will deliver the product to customer directly which the
sales amount below $500. Any purchase amount is more than $500, Revlon will utilize the courier service to
delivery the purchased product. Therefore, it is giving the sales agent to focus directly to customer with fully
utilize working hours. In addition, Revlon can offer online commerce to sales agent and customer for the
following purposes:
Sales agent
o Online request products for personal selling
o Online request delivery of products to customer directly resulted saving costs
o Online seek product information, announcement and training
Customer
o Online purchase product
o Online seek product information especially promotion
ORGANIZATIONAL POLICY & STRATEGY
Page 17 of 24
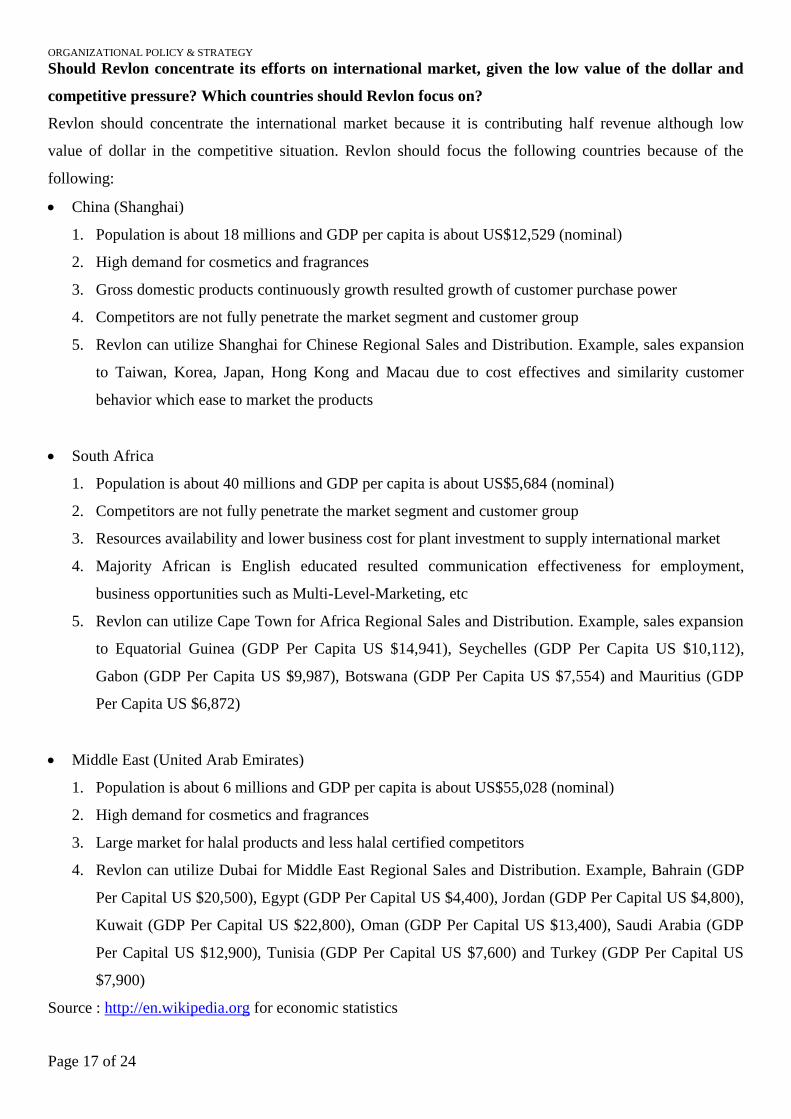
Should Revlon concentrate its efforts on international market, given the low value of the dollar and
competitive pressure? Which countries should Revlon focus on?
Revlon should concentrate the international market because it is contributing half revenue although low
value of dollar in the competitive situation. Revlon should focus the following countries because of the
following:
China (Shanghai)
1. Population is about 18 millions and GDP per capita is about US$12,529 (nominal)
2. High demand for cosmetics and fragrances
3. Gross domestic products continuously growth resulted growth of customer purchase power
4. Competitors are not fully penetrate the market segment and customer group
5. Revlon can utilize Shanghai for Chinese Regional Sales and Distribution. Example, sales expansion
to Taiwan, Korea, Japan, Hong Kong and Macau due to cost effectives and similarity customer
behavior which ease to market the products
South Africa
1. Population is about 40 millions and GDP per capita is about US$5,684 (nominal)
2. Competitors are not fully penetrate the market segment and customer group
3. Resources availability and lower business cost for plant investment to supply international market
4. Majority African is English educated resulted communication effectiveness for employment,
business opportunities such as Multi-Level-Marketing, etc
5. Revlon can utilize Cape Town for Africa Regional Sales and Distribution. Example, sales expansion
to Equatorial Guinea (GDP Per Capita US $14,941), Seychelles (GDP Per Capita US $10,112),
Gabon (GDP Per Capita US $9,987), Botswana (GDP Per Capita US $7,554) and Mauritius (GDP
Per Capita US $6,872)
Middle East (United Arab Emirates)
1. Population is about 6 millions and GDP per capita is about US$55,028 (nominal)
2. High demand for cosmetics and fragrances
3. Large market for halal products and less halal certified competitors
4. Revlon can utilize Dubai for Middle East Regional Sales and Distribution. Example, Bahrain (GDP
Per Capital US $20,500), Egypt (GDP Per Capital US $4,400), Jordan (GDP Per Capital US $4,800),
Kuwait (GDP Per Capital US $22,800), Oman (GDP Per Capital US $13,400), Saudi Arabia (GDP
Per Capital US $12,900), Tunisia (GDP Per Capital US $7,600) and Turkey (GDP Per Capital US
$7,900)
Source : http://en.wikipedia.org for economic statistics
ORGANIZATIONAL POLICY & STRATEGY
Page 18 of 24
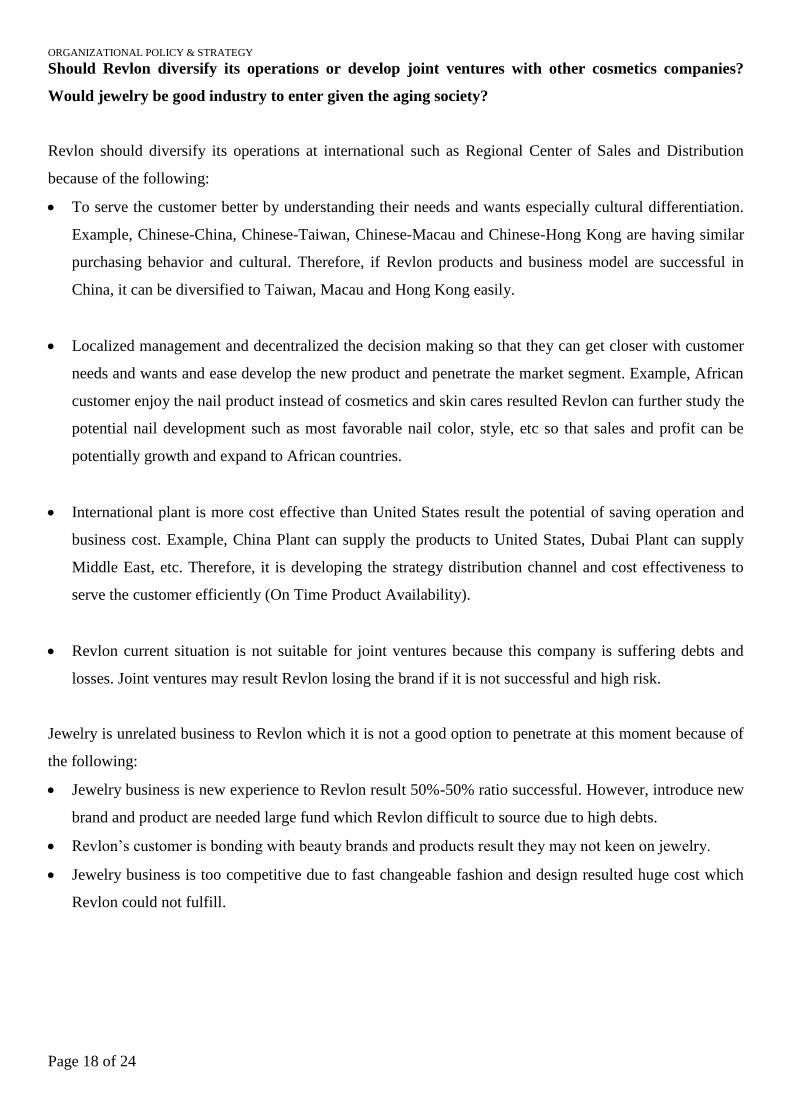
Should Revlon diversify its operations or develop joint ventures with other cosmetics companies?
Would jewelry be good industry to enter given the aging society?
Revlon should diversify its operations at international such as Regional Center of Sales and Distribution
because of the following:
To serve the customer better by understanding their needs and wants especially cultural differentiation.
Example, Chinese-China, Chinese-Taiwan, Chinese-Macau and Chinese-Hong Kong are having similar
purchasing behavior and cultural. Therefore, if Revlon products and business model are successful in
China, it can be diversified to Taiwan, Macau and Hong Kong easily.
Localized management and decentralized the decision making so that they can get closer with customer
needs and wants and ease develop the new product and penetrate the market segment. Example, African
customer enjoy the nail product instead of cosmetics and skin cares resulted Revlon can further study the
potential nail development such as most favorable nail color, style, etc so that sales and profit can be
potentially growth and expand to African countries.
International plant is more cost effective than United States result the potential of saving operation and
business cost. Example, China Plant can supply the products to United States, Dubai Plant can supply
Middle East, etc. Therefore, it is developing the strategy distribution channel and cost effectiveness to
serve the customer efficiently (On Time Product Availability).
Revlon current situation is not suitable for joint ventures because this company is suffering debts and
losses. Joint ventures may result Revlon losing the brand if it is not successful and high risk.
Jewelry is unrelated business to Revlon which it is not a good option to penetrate at this moment because of
the following:
Jewelry business is new experience to Revlon result 50%-50% ratio successful. However, introduce new
brand and product are needed large fund which Revlon difficult to source due to high debts.
Revlon’s customer is bonding with beauty brands and products result they may not keen on jewelry.
Jewelry business is too competitive due to fast changeable fashion and design resulted huge cost which
Revlon could not fulfill.
ORGANIZATIONAL POLICY & STRATEGY
Page 19 of 24
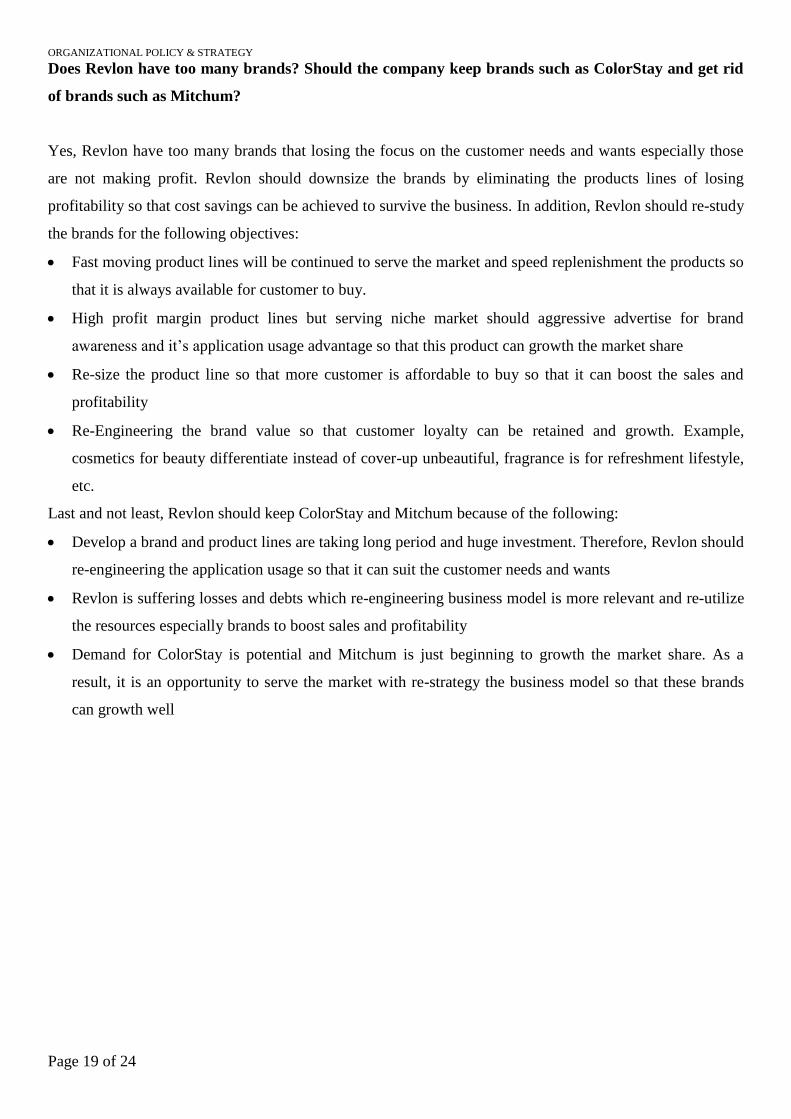
Does Revlon have too many brands? Should the company keep brands such as ColorStay and get rid
of brands such as Mitchum?
Yes, Revlon have too many brands that losing the focus on the customer needs and wants especially those
are not making profit. Revlon should downsize the brands by eliminating the products lines of losing
profitability so that cost savings can be achieved to survive the business. In addition, Revlon should re-study
the brands for the following objectives:
Fast moving product lines will be continued to serve the market and speed replenishment the products so
that it is always available for customer to buy.
High profit margin product lines but serving niche market should aggressive advertise for brand
awareness and it’s application usage advantage so that this product can growth the market share
Re-size the product line so that more customer is affordable to buy so that it can boost the sales and
profitability
Re-Engineering the brand value so that customer loyalty can be retained and growth. Example,
cosmetics for beauty differentiate instead of cover-up unbeautiful, fragrance is for refreshment lifestyle,
etc.
Last and not least, Revlon should keep ColorStay and Mitchum because of the following:
Develop a brand and product lines are taking long period and huge investment. Therefore, Revlon should
re-engineering the application usage so that it can suit the customer needs and wants
Revlon is suffering losses and debts which re-engineering business model is more relevant and re-utilize
the resources especially brands to boost sales and profitability
Demand for ColorStay is potential and Mitchum is just beginning to growth the market share. As a
result, it is an opportunity to serve the market with re-strategy the business model so that these brands
can growth well
ORGANIZATIONAL POLICY & STRATEGY
Page 20 of 24
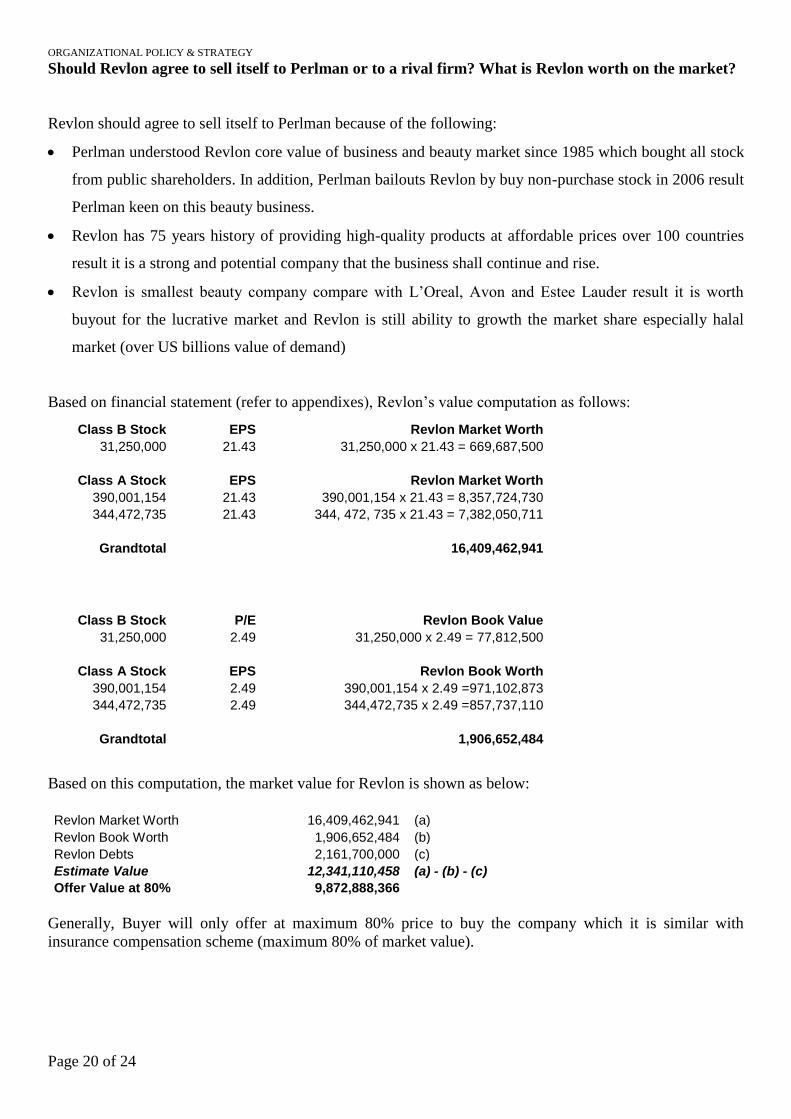
Should Revlon agree to sell itself to Perlman or to a rival firm? What is Revlon worth on the market?
Revlon should agree to sell itself to Perlman because of the following:
Perlman understood Revlon core value of business and beauty market since 1985 which bought all stock
from public shareholders. In addition, Perlman bailouts Revlon by buy non-purchase stock in 2006 result
Perlman keen on this beauty business.
Revlon has 75 years history of providing high-quality products at affordable prices over 100 countries
result it is a strong and potential company that the business shall continue and rise.
Revlon is smallest beauty company compare with L’Oreal, Avon and Estee Lauder result it is worth
buyout for the lucrative market and Revlon is still ability to growth the market share especially halal
market (over US billions value of demand)
Based on financial statement (refer to appendixes), Revlon’s value computation as follows:
Class B Stock EPS Revlon Market Worth
31,250,000 21.43 31,250,000 x 21.43 = 669,687,500
Class A Stock EPS Revlon Market Worth
390,001,154 21.43 390,001,154 x 21.43 = 8,357,724,730
344,472,735 21.43 344, 472, 735 x 21.43 = 7,382,050,711
Grandtotal 16,409,462,941
Class B Stock P/E Revlon Book Value
31,250,000 2.49 31,250,000 x 2.49 = 77,812,500
Class A Stock EPS Revlon Book Worth
390,001,154 2.49 390,001,154 x 2.49 =971,102,873
344,472,735 2.49 344,472,735 x 2.49 =857,737,110
Grandtotal 1,906,652,484
Based on this computation, the market value for Revlon is shown as below:
Revlon Market Worth 16,409,462,941 (a)
Revlon Book Worth 1,906,652,484 (b)
Revlon Debts 2,161,700,000 (c)
Estimate Value 12,341,110,458 (a) - (b) - (c)
Offer Value at 80% 9,872,888,366
Generally, Buyer will only offer at maximum 80% price to buy the company which it is similar with
insurance compensation scheme (maximum 80% of market value).
ORGANIZATIONAL POLICY & STRATEGY
Page 21 of 24
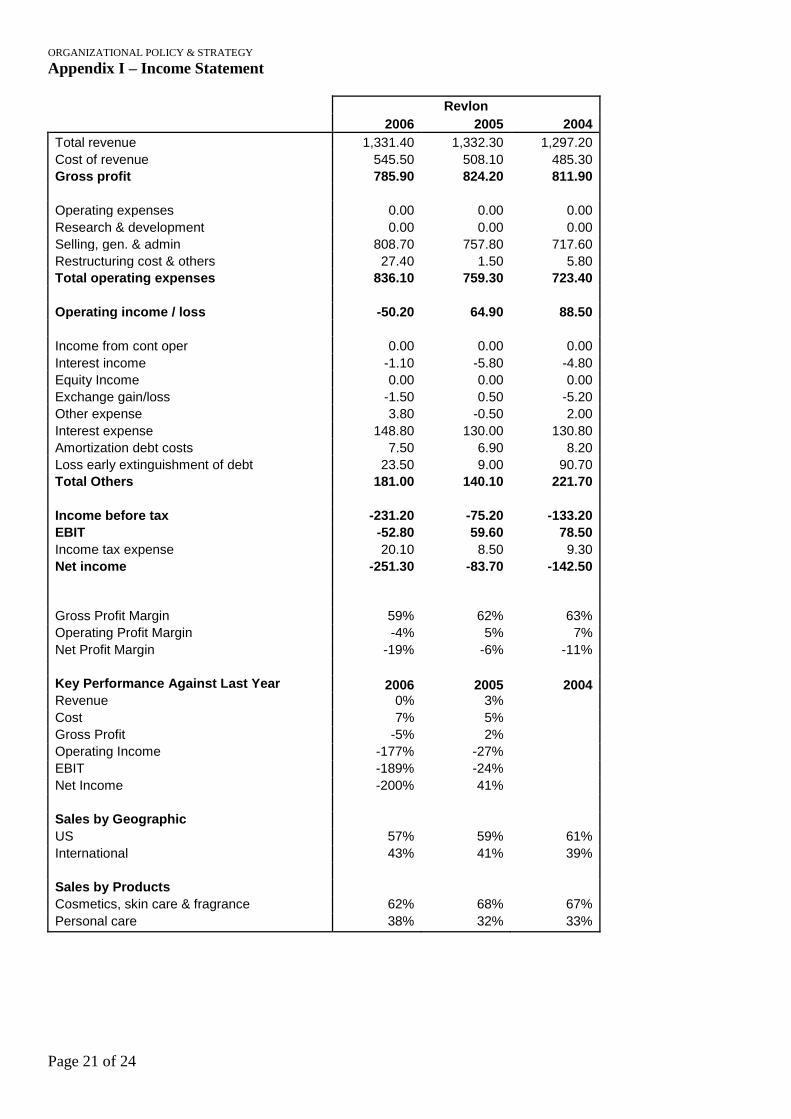
Appendix I – Income Statement
Revlon
2006 2005 2004
Total revenue 1,331.40 1,332.30 1,297.20
Cost of revenue 545.50 508.10 485.30
Gross profit 785.90 824.20 811.90
Operating expenses 0.00 0.00 0.00
Research & development 0.00 0.00 0.00
Selling, gen. & admin 808.70 757.80 717.60
Restructuring cost & others 27.40 1.50 5.80
Total operating expenses 836.10 759.30 723.40
Operating income / loss -50.20 64.90 88.50
Income from cont oper 0.00 0.00 0.00
Interest income -1.10 -5.80 -4.80
Equity Income 0.00 0.00 0.00
Exchange gain/loss -1.50 0.50 -5.20
Other expense 3.80 -0.50 2.00
Interest expense 148.80 130.00 130.80
Amortization debt costs 7.50 6.90 8.20
Loss early extinguishment of debt 23.50 9.00 90.70
Total Others 181.00 140.10 221.70
Income before tax -231.20 -75.20 -133.20
EBIT -52.80 59.60 78.50
Income tax expense 20.10 8.50 9.30
Net income -251.30 -83.70 -142.50
Gross Profit Margin 59% 62% 63%
Operating Profit Margin -4% 5% 7%
Net Profit Margin -19% -6% -11%
Key Performance Against Last Year 2006 2005 2004 Revenue 0% 3%
Cost 7% 5%
Gross Profit -5% 2%
Operating Income -177% -27%
EBIT -189% -24%
Net Income -200% 41%
Sales by Geographic
US 57% 59% 61%
International 43% 41% 39%
Sales by Products
Cosmetics, skin care & fragrance 62% 68% 67%
Personal care 38% 32% 33%
ORGANIZATIONAL POLICY & STRATEGY
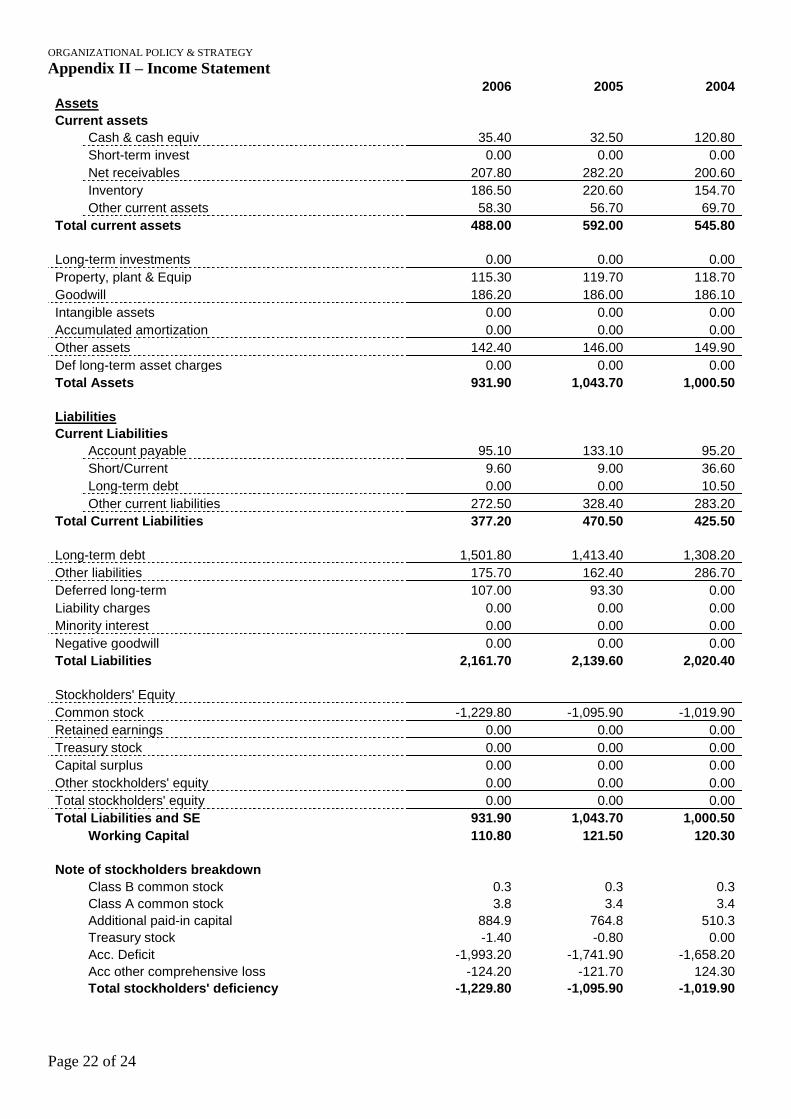
Page 22 of 24
Appendix II – Income Statement 2006 2005 2004
Assets
Current assets
Cash & cash equiv 35.40 32.50 120.80
Short-term invest 0.00 0.00 0.00
Net receivables 207.80 282.20 200.60
Inventory 186.50 220.60 154.70
Other current assets 58.30 56.70 69.70
Total current assets 488.00 592.00 545.80
Long-term investments 0.00 0.00 0.00
Property, plant & Equip 115.30 119.70 118.70
Goodwill 186.20 186.00 186.10
Intangible assets 0.00 0.00 0.00
Accumulated amortization 0.00 0.00 0.00
Other assets 142.40 146.00 149.90
Def long-term asset charges 0.00 0.00 0.00
Total Assets 931.90 1,043.70 1,000.50
Liabilities
Current Liabilities
Account payable 95.10 133.10 95.20
Short/Current 9.60 9.00 36.60
Long-term debt 0.00 0.00 10.50
Other current liabilities 272.50 328.40 283.20
Total Current Liabilities 377.20 470.50 425.50
Long-term debt 1,501.80 1,413.40 1,308.20
Other liabilities 175.70 162.40 286.70
Deferred long-term 107.00 93.30 0.00
Liability charges 0.00 0.00 0.00
Minority interest 0.00 0.00 0.00
Negative goodwill 0.00 0.00 0.00
Total Liabilities 2,161.70 2,139.60 2,020.40
Stockholders' Equity
Common stock -1,229.80 -1,095.90 -1,019.90
Retained earnings 0.00 0.00 0.00
Treasury stock 0.00 0.00 0.00
Capital surplus 0.00 0.00 0.00
Other stockholders' equity 0.00 0.00 0.00
Total stockholders' equity 0.00 0.00 0.00
Total Liabilities and SE 931.90 1,043.70 1,000.50
Working Capital 110.80 121.50 120.30
Note of stockholders breakdown
Class B common stock 0.3 0.3 0.3
Class A common stock 3.8 3.4 3.4
Additional paid-in capital 884.9 764.8 510.3
Treasury stock -1.40 -0.80 0.00
Acc. Deficit -1,993.20 -1,741.90 -1,658.20
Acc other comprehensive loss -124.20 -121.70 124.30
Total stockholders' deficiency -1,229.80 -1,095.90 -1,019.90
ORGANIZATIONAL POLICY & STRATEGY
Page 23 of 24
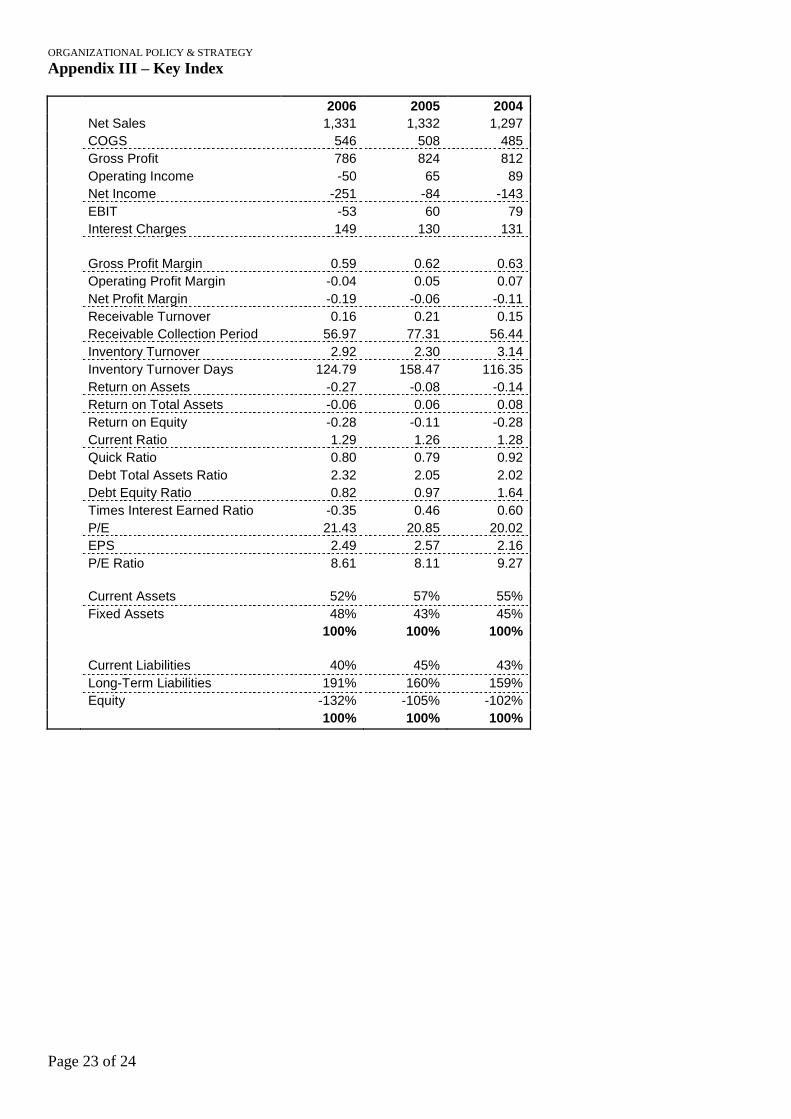
Appendix III – Key Index
2006 2005 2004
Net Sales 1,331 1,332 1,297
COGS 546 508 485
Gross Profit 786 824 812
Operating Income -50 65 89
Net Income -251 -84 -143
EBIT -53 60 79
Interest Charges 149 130 131
Gross Profit Margin 0.59 0.62 0.63
Operating Profit Margin -0.04 0.05 0.07
Net Profit Margin -0.19 -0.06 -0.11
Receivable Turnover 0.16 0.21 0.15
Receivable Collection Period 56.97 77.31 56.44
Inventory Turnover 2.92 2.30 3.14
Inventory Turnover Days 124.79 158.47 116.35
Return on Assets -0.27 -0.08 -0.14
Return on Total Assets -0.06 0.06 0.08
Return on Equity -0.28 -0.11 -0.28
Current Ratio 1.29 1.26 1.28
Quick Ratio 0.80 0.79 0.92
Debt Total Assets Ratio 2.32 2.05 2.02
Debt Equity Ratio 0.82 0.97 1.64
Times Interest Earned Ratio -0.35 0.46 0.60
P/E 21.43 20.85 20.02
EPS 2.49 2.57 2.16
P/E Ratio 8.61 8.11 9.27
Current Assets 52% 57% 55%
Fixed Assets 48% 43% 45%
100% 100% 100%
Current Liabilities 40% 45% 43%
Long-Term Liabilities 191% 160% 159%
Equity -132% -105% -102%
100% 100% 100%
ORGANIZATIONAL POLICY & STRATEGY
Page 24 of 24
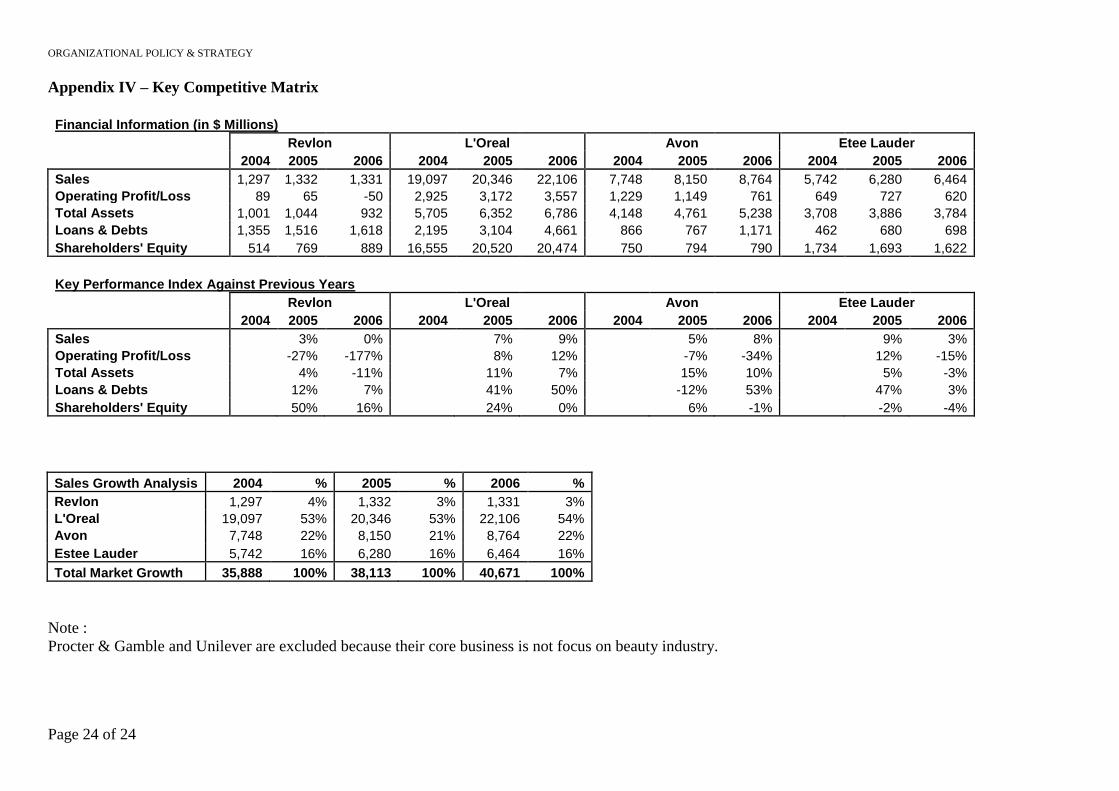
Appendix IV – Key Competitive Matrix
Financial Information (in $ Millions)
Revlon L'Oreal Avon Etee Lauder
2004 2005 2006 2004 2005 2006 2004 2005 2006 2004 2005 2006
Sales 1,297 1,332 1,331 19,097 20,346 22,106 7,748 8,150 8,764 5,742 6,280 6,464
Operating Profit/Loss 89 65 -50 2,925 3,172 3,557 1,229 1,149 761 649 727 620
Total Assets 1,001 1,044 932 5,705 6,352 6,786 4,148 4,761 5,238 3,708 3,886 3,784
Loans & Debts 1,355 1,516 1,618 2,195 3,104 4,661 866 767 1,171 462 680 698
Shareholders' Equity 514 769 889 16,555 20,520 20,474 750 794 790 1,734 1,693 1,622
Key Performance Index Against Previous Years
Revlon L'Oreal Avon Etee Lauder
2004 2005 2006 2004 2005 2006 2004 2005 2006 2004 2005 2006
Sales 3% 0% 7% 9% 5% 8% 9% 3%
Operating Profit/Loss -27% -177% 8% 12% -7% -34% 12% -15%
Total Assets 4% -11% 11% 7% 15% 10% 5% -3%
Loans & Debts 12% 7% 41% 50% -12% 53% 47% 3%
Shareholders' Equity 50% 16% 24% 0% 6% -1% -2% -4%
Sales Growth Analysis 2004 % 2005 % 2006 %
Revlon 1,297 4% 1,332 3% 1,331 3%
L'Oreal 19,097 53% 20,346 53% 22,106 54%
Avon 7,748 22% 8,150 21% 8,764 22%
Estee Lauder 5,742 16% 6,280 16% 6,464 16%
Total Market Growth 35,888 100% 38,113 100% 40,671 100%
Note :
Procter & Gamble and Unilever are excluded because their core business is not focus on beauty industry.

![Revlon Media Kit Final[1] - The Future of Women's …swhr.org/wp-content/uploads/2016/09/Revlon-Media-Kit_Final_2016.pdf · Revlon’“LoveIs’On”’Campaign’Social’Media’Kit](https://img.pdfslide.us/doc/110x75/5b94da7409d3f2d7438b59d4/revlon-media-kit-final1-the-future-of-womens-swhrorgwp-contentuploads201609revlon-media-kitfinal2016pdf.jpg)