Embed Size (px)
Citation preview

Casein protein and the effect on rehydration in comparison to a commercially available sports drink
Thomas Chung
A thesis submitted in partial fulfilment of the requirements for the degree of
Master of Dietetics
At the University of Otago, Dunedin, New Zealand
November 2013

i
Abstract Background: Hypohydration is common across a wide range of sport settings, it has been
shown to impair both physical and cognitive performance. Rehydration studies have
investigated milk as a rehydration beverage and found that it can be more effective than
sports drinks at retaining fluid. The components of milk responsible for this effect are
currently not known. However, it is possible that casein protein, the main protein constituent
in milk could be responsible, to date there are no studies investigating the effect of casein
protein on rehydration.
Objective: To investigate the effect of casein protein on markers of rehydration in
comparison to a sports drink and to investigate any palatability differences between the casein
and sports drink.
Methods: This was a randomised cross over design study, with 10 healthy male participants.
Participants arrived at the clinic in the evening and performed an intermittent cycling protocol
until they were dehydrated by 2% bodyweight. They were then given 150% of their weight
loss in fluids, separated into four boluses provided every 15 minutes. The initial bolus
differed between trials and was either 540 mL of casein protein (containing 20g of protein) or
540 mL of sports drink (5.9% carbohydrates). The remaining three boluses were all equal
amounts of water. Hydration status was measured at 1 hour, 2 hours and in the morning post
exercise using urine specific gravity and urine osmolality. The net fluid balance was also
calculated using fluid intake data and urine output measures. Subjective questionnaires with
100mm analogue scales were used to quantify drink characteristics and to measure any
gastrointestinal symptoms, these questionnaires were given at the same time hydration status
was measured.
ii
Results: There were no significant differences between the two drinks for urine specific
gravity, urine osmolality and net fluid balance (p>0.05). The sports drink was significantly
more pleasant and sweeter than the casein drink (p=0.005).
Conclusion: Casein protein alone as a rehydration beverage did not significantly improve or
impair rehydration and fluid retention after exercise induced dehydration in comparison to a
commercially available carbohydrate -electrolyte sports drink. However, the sports drink was
significantly more pleasant and palatable than the casein drink, this may have implications for
ad-libitum intakes.

iii
Preface This research project was supervised by Dr Katherine Black from the Department of
Human Nutrition, University of Otago, and co-‐supervised by Dr Thomas Love from the
University of Swansea, Wales and Nancy Reher from the School of Physical Education
and Sports and Exercise Sciences.
The candidate was responsible for the following under supervision:
• Coordination of the research project
• Participant recruitment
• Data collection and data entry
• Compiling results and carrying out statistical analysis
• Interpreting results and drawing study conclusions

iv
Acknowledgements Thank you to my supervisor Dr Katherine Black and co supervisors Nancy Reher and
Thomas Love for your guidance throughout the thesis writing journey. Thank you
Katherine for being available constantly throughout the year to answer our questions
and oversee Caleb and I. Without you this project would not have been possible. Thanks
for all the hard work and attention to detail.
Thanks to Caleb Robinson for joining me on this project, its been fun and would not have
been the same without you. Thank you for the work ethic and dedication.
Thanks to all of the participants in the study, thanks for your efforts throughout the
trials and for the countless hours spent in the heat chamber. I owe you guys my degree,
this would not have been possible without you and I could not have asked for a better
group.
Thank you Ash for being an expert in the lab and showing us how to process the samples,
thanks for being so welcoming to us in the lab.
Thank you Jill Hazard for being an absolute expert in the statistical field, thanks for your
patience and belief in our ability to handle our own results and data.
Thanks to my supportive family for the encouragement throughout the past 5 years at
University. Thanks for giving me a home to come back to from University and instilling
in me the hard work and dedication that’s been needed for the past 5 years.
Thanks to all my friends who supported me throughout the past year and throughout
my time at University. You have played a massive role in this thesis without even
knowing it, thanks for making Dunedin my home away from home.
Thanks to the department of physical education sport and exercise science for letting us
use your facilities to conduct our research.
v
Table of Contents
Abstract ....................................................................................................................................... i
Preface ...................................................................................................................................... iii Acknowledgements .................................................................................................................. iv
Table of Contents ....................................................................................................................... v List of Tables ........................................................................................................................... vii
List of Abbreviations ................................................................................................................ ix 1. Introduction ........................................................................................................................... 1
2. Literature Review .................................................................................................................. 3 2.1 Importance of hydration status ........................................................................................ 3
2.1.1 The prevalence of hypohydration in athletes ............................................................ 3 2.1.2 The effect of hydration on performance ................................................................... 4
2.1.3 Effects of rehydration on post exercise adaptation and protein synthesis .................... 4 2.2 The optimal composition of a recovery solution ............................................................. 5
2.2.1 Sodium ...................................................................................................................... 5 2.2.2 Carbohydrates ............................................................................................................... 6 2.2.3 Protein ........................................................................................................................... 8 2.2.4 Volume ......................................................................................................................... 9 2.2.5 Taste ............................................................................................................................ 10 2.3 Review of rehydration with carbohydrate solutions and protein ................................... 11
2.4 Markers of hydration ................................................................................................. 12 2.4.1 Urine specific gravity ............................................................................................. 12 2.4.2 Urine osmolality ..................................................................................................... 14
2.4.3 Urine colour ................................................................................................................ 14 2.4.4 Body mass changes ................................................................................................. 15 2.4.5 Plasma osmolality ................................................................................................... 16
2.4.6 Plasma volume change ............................................................................................... 16 3. Objective Statement ............................................................................................................. 18
4. Participants and Methods ..................................................................................................... 19 4.1 Participant recruitment and ethical approval ................................................................ 19
4.1.1 Eligibility ................................................................................................................ 19 4.2 Pretest protocol .............................................................................................................. 20 4.3 Exercise protocol ........................................................................................................... 20 4.4 Post exercise protocol .................................................................................................... 21 4.5 Sample analysis ............................................................................................................. 23 4.5.1 Urine specific gravity ................................................................................................. 23 4.5.5 Urine osmolality ......................................................................................................... 23
4.5.2 Urine output ............................................................................................................ 23 4.5.3 Subjective questionnaires ....................................................................................... 23
4.6 Statistical analysis .......................................................................................................... 24
5. Results ................................................................................................................................. 25 5.1 Baseline measurements .................................................................................................. 25

vi
5.2 Exercise measurements .................................................................................................. 26 Table 5.2.1: Exercise measures; Exercise time (minutes), weight loss (kg), percentage weight loss (%), drink volume (ml) (mean ± SD) .............................................................. 26 5.3 Urine volume measurements ......................................................................................... 27
5.4 Net fluid balance ........................................................................................................ 28 Figure 5.4.1: Mean (95 % confidence intervals) for net fluid balance during trials casein and sports drink (ml). ........................................................................................................... 29 5.5 Urine specific gravity measurements ............................................................................ 30 Figure 5.5.1: Mean (95 % confidence intervals) for urine specific gravity over time between trials casein and sports drink (g/ml). ..................................................................... 31 5.6 Urine osmolality measurements .................................................................................... 32 5.7 Questionnaire measurements ......................................................................................... 34 5.7.1 Thirst, tiredness and hunger questionnaire data ......................................................... 34
5.7.2 Drink quality questionnaire data ............................................................................. 37 5.7.3 Gastrointestinal symptom questionnaires ............................................................... 37
6. Discussion ............................................................................................................................ 39 6.1 Main findings ................................................................................................................. 39 6.2 Casein protein ................................................................................................................ 39 6.3 Hydration biomarkers .................................................................................................... 41 6.4 Hydration recommendations .......................................................................................... 42 6.5 Drink palatability ........................................................................................................... 43 6.6 Study strengths .............................................................................................................. 43 6.7 Limitations and future research ..................................................................................... 44 6.8 Conclusions ................................................................................................................... 45
7. Application to Practice ........................................................................................................ 46 8. References ........................................................................................................................... 47
9. Appendices .......................................................................................................................... 52

vii
List of Tables
Table 4.4.1: Macronutrient composition of the meals and drinks for the casein and sports
drink groups.
Table 5.1.1: Baseline Characteristics prior to exercise; body mass (kg), baseline USG (g/ml),
baseline osmolality (mOsm/kg) (mean ± SD).
Table 5.2.1: Exercise measures; Exercise time (minutes), weight loss (kg), percentage weight
loss (%), drink volume (ml) (mean ± SD).
Table 5.3.1: Cumulative urine output measures 1 hour post exercise (ml), 2 hours post
exercise (ml) and overnight (ml) (mean ± SD).
Table 5.5.2: Urine specific Gravity (g/ml) in comparison to pre exercise measures 1 hour post
exercise (g/ml), 2 hours post exercise (g/ml) and in the first morning urine sample (g/ml)
(mean ± SD).
Table 5.6.1: Urine osmolality (mOsmol/kg) measures in comparison to baseline measures 1
hour post exercise (mOsmol/kg), 2 hours post exercise (mOsmol/kg) and first morning
(mOsmol/kg) (mean ± SD).
Table 5.7.1.1: Thirst, hunger and tiredness measures pre, post exercise, 1 hour post and 2
hours post exercise (mm) (mean ± SD).
Table 5.7.2.1: Drink questionnaire measures for pleasantness, saltiness and sweetness (mm)
(mean ± SD).
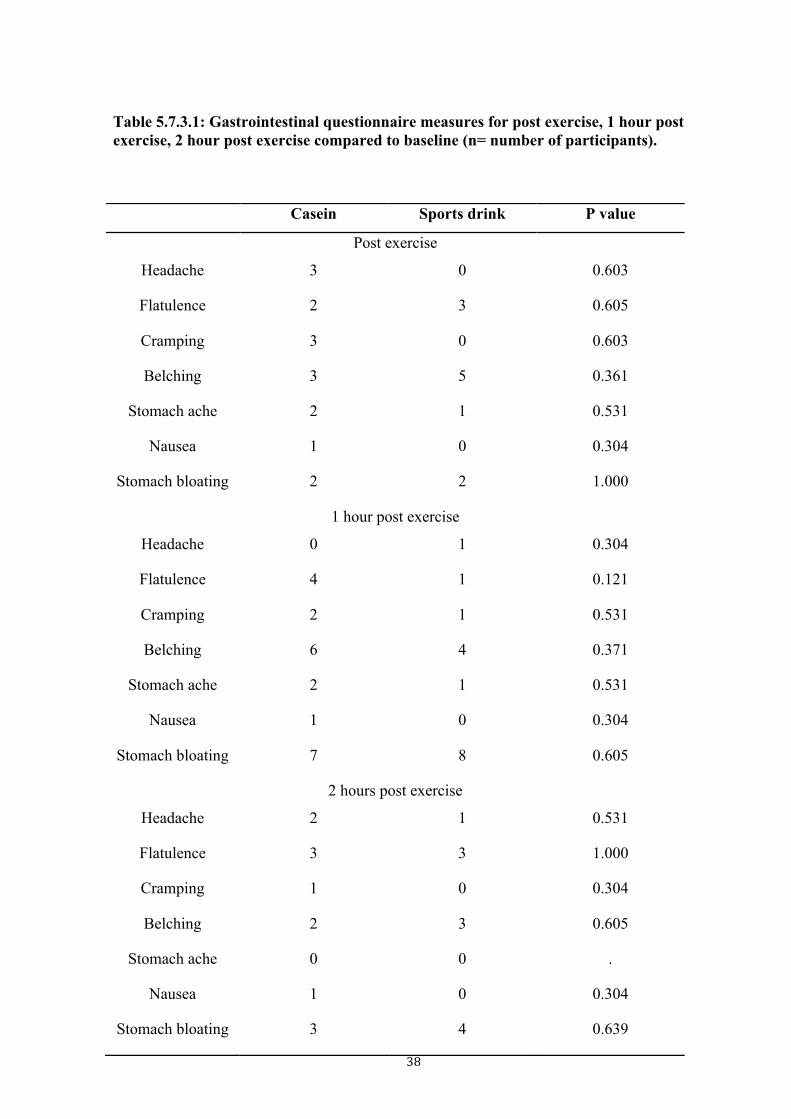
Table 5.7.3.1: Gastrointestinal questionnaire measures for post exercise, 1 hour post exercise,
2 hour post exercise compared to baseline (n= number of participants).
viii
List of Figures Figure 5.4.1: Mean (95% confidence intervals) for net fluid balance during trials casein and
sports drink (ml)
Figure 5.5.1: Mean (95% confidence intervals) for urine specific gravity over time between
trials for trials casein and sports drink (g/kg)
Figure 5.6.1: Mean (95 % confidence intervals) of urine osmolality over time between Casein
and sports drink trials (mOsm/kg).
ix
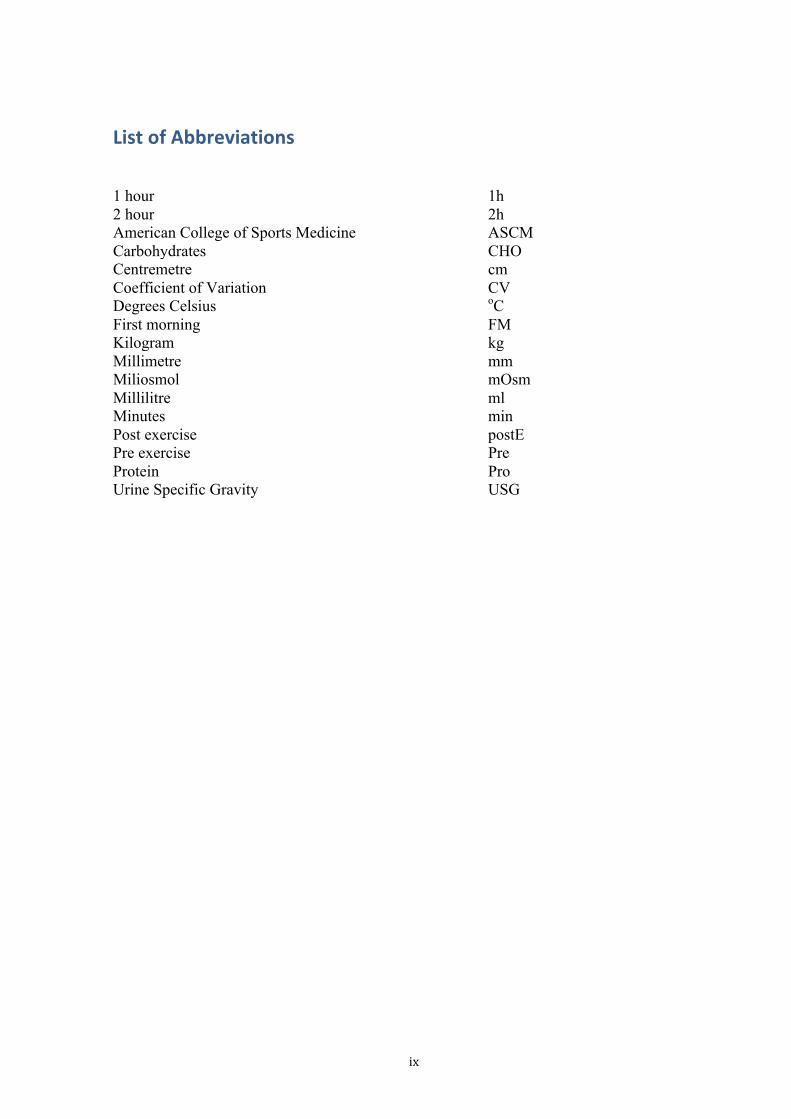
List of Abbreviations 1 hour 1h 2 hour 2h American College of Sports Medicine ASCM Carbohydrates CHO Centremetre Coefficient of Variation
cm CV
Degrees Celsius oC First morning FM Kilogram kg Millimetre mm Miliosmol mOsm Millilitre ml Minutes min Post exercise postE Pre exercise Pre Protein Pro Urine Specific Gravity USG
1
1. Introduction Hypohydration (low total body water) has been widely documented across a range of sporting
environments and events (McDermott, Casa et al. 2009, Hamouti 2010). Given that such a
state has been shown to reduce performance and increase the physiological strain in the
subsequent exercise session, it is important to minimise the occurrence of hypohydration
(Shirreffs, Armstrong et al. 2004, McDermott, Casa et al. 2009, Hamouti 2010, Kordi 2011,
Meir 2011). Hypohydration occurs when the rate of dehydration (fluid loss) exceeds the rate
of fluid replenishment. Although sweat losses occur in all sporting situations, dehydration
leading to hypohydration is most prevalent when exercising in heat, or if the exercise session
is of high intensity or when bouts of exercise occur in close timing resulting in only a short
period for rehydration (Hosey 2004). A process of dehydration is commonly used in weight
category sports whereby an athlete is hypohydrated at the time of weigh-in, they then attempt
to rehydrate prior to the start of the fight (Kordi 2011). Hypohydration has been shown to
impair performance across a multitude of areas; physically, mentally and also recovery wise
for muscle adaptation, the degrees of impairment has been shown to vary depending on the
sport and skill used however the impairment in performance and adaptation has been widely
documented the performance deficit being detrimental for athletes (Epstein 1999, Keller 2003,
Lee 2011, Secher 2012).
Due to these impairments, rehydration strategies have been determined by the American
College of Sports Medicine (ACSM), based on published research studies (Shireffs, Taylor et
al. 1996) they recommend the consumption of 150% of the body mass lost during the

2
exercise session, thereby replacing the sweat lost during exercise and their obligatory losses
(Sawka, Burke et al. 2007).
Rehydration studies investigating the efficacy of the composition of rehydration beverages
have altered the electrolyte composition and the concentration of carbohydrates (Shirreffs
1998, Evans 2009a, Utter 2010). The inclusion of protein in a beverage for rehydration
purposes has been a relatively new area of hydration research studies using milk have found it
to be more effective compared to carbohydrate and electrolyte drinks for fluid retention
(Seifert 2006, Watson, Love et al. 2008). More recent studies which have accounted for the
methodological issues of the past and have balanced drinks for energy have had mixed results
(James, Clayton et al. 2011, James, Gingell et al. 2012, James, Evans et al. 2013). A study by
James, Evans et al. (2013) comparing milk protein with sports drink have found the milk
protein to be a more effective rehydration solution, however a study by James, Gingell et al.
(2012) using whey protein, rather than milk, found no significant difference compared to a
carbohydrate- electrolyte sports drink. These studies suggest that it could be the casein
protein component in milk that is responsible for the greater fluid retention than a
carbohydrate solution, however there have been no studies looking at casein specifically yet.
Therefore the aim of this study was to investigate
1) The effect of casein protein on rehydration measures in comparison to a sports drink.
2) If differences exist in palatability measures between the casein beverage and sports
drink.
3
2. Literature Review
2.1 Importance of hydration status
2.1.1 The prevalence of hypohydration in athletes
Observational studies of various sporting events, have reported athletes arriving at training in
a hypohydrated state (Shirreffs, Armstrong et al. 2004, McDermott, Casa et al. 2009, Hamouti
2010, Kordi 2011, Meir 2011). Hamouti (2010) reported the prevalence of pre-exercise
hypohydration at the start of early morning trainings was 91%, amongst indoor athletes. In
another study by Kordi (2011), 72% of collegiate wrestlers reported having performed fluid
restriction to lose weight regularly before matches therefore were likely to be hypohydrated at
the start of their matches. In soccer training, pre-training urine osmolality measures have
shown a high proportion of players to be hypohydrated (urine osmolality >800 mOsmol/kg),
further these studies have shown that rates of fluid loss are significantly higher than the rates
at which fluids are consumed despite sufficient fluid being provided (Maughan 2004,
Maughan 2005). Both starting exercise hypohydrated and dehydration during exercise have
been shown to reduce performance and increase physiological strain(Sawka, Burke et al.
2007). As fluid ingestion during exercise is sometimes restricted due to limited access to
fluids during the training or competition session, it is important to optimise hydration prior to
the exercise session. Due to the high prevalence of hypohydration and dehydration across
sporting environments there is the need for effective hydration strategies between exercise
sessions in order to prevent hypohydration and to optimise performance.

4
2.1.2 The effect of hydration on performance
Hypohydration has been shown to impair an athletes performance with decrements in
physical performance being reported, as seen in cycling tests to exhaustion (Epstein 1999,
Lee 2011) and it has been shown to potentially impair mental function (Secher 2012). Some
case reports have found that severe hypohydration can be life threatening (Remick 1998). A
review by Secher (2012) found that increasing dehydration led to lower scores in memory and
decision making tasks, however, mixed results have been found in other studies (Benton 2011,
Kempton 2011). The complex relationship between body water and brain function is difficult
to fully examine. These decrements in performance are possibly due to alterations in blood
flow and sweating responses associated with hypohydration. At the onset of exercise there is
an increased blood flow to the periphery to aid thermoregulation and also an increase in blood
flow to the working muscles to provide oxygen and nutrients as well as expel the waste
products associated with muscular contraction. However, hypohydration means there is a
reduction in plasma volume and this effects the body’s ability to deliver blood to the muscles
and reduces the thermoregulatory capacity (Armstrong 2007). Thermoregulation is also
impaired as sweat rates decrease when body water is low. The decrease in blood volume, also
means that less blood returns to the heart reducing stroke volume. Therefore heart rate has to
increase to maintain cardiac output but heart rate can only increase to a certain degree
therefore as dehydration increases cardiac output cannot be maintained thus performance
decreases (Armstrong 2007).
2.1.3 Effects of rehydration on post exercise adaptation and protein synthesis
Hydration status has been shown to affect the recovery process as it plays a role in mediating
cell processes and protein synthesis (Keller 2003, Leser 2011).

5
Keller (2003) investigated the cell size theory and its effect on cell function at differing levels
of hydration. According to the theory, fluid deficits after exercise increase blood osmolality,
which mediates certain cell responses. Cell shrinkages due to the fluid deficit favours
catabolism and glycogen breakdown, these responses are highly unfavourable to recovery and
adaptation to training. Conversely, euhydrated or hyperhydrated favour anabolic processes
and reduced protein breakdown.
It therefore appears that inadequate hydration could cause unfavourable effects on post
exercise recovery. However, this area has not been extensively researched and further
investigations are required. Despite this it does suggest that rehydration is also important for
the adaptive processes associated with training.
2.2 The optimal composition of a recovery solution
It is not only the volume of fluid ingested which is important for rehydration but also the
composition of the drink, which can affect performance and hydration. Many studies have
manipulated beverage formulations to find the most beneficial beverage for rehydrating
athletes effectively. Many variables and dynamics of a beverage have been manipulated to
improve hydration and recovery from exercise.
2.2.1 Sodium
Sodium is believed to be the most important electrolyte in a rehydration beverage as sodium
is the major electrolyte lost through sweating (Maughan 2004). These losses if not
replenished appropriately can contribute to the development of hyponatremia (O'Brien 2001)
Sodium inclusion in beverages also improves retention of fluid within the body, enhancing
the process of rehydration/volume repletion, this occurs through attenuating the osmolality
shifts which can occur from when drinking plain water (Nose 1988).
6
This was shown by Shirreffs (1998) who investigated the effect of increasing the amount of
sodium in rehydration solutions on fluid balance that varying levels produced different results.
It was found found that for hypohydrated participants (1.89% bodyweight) to return to at a
state of euhydration after a 6-hour recovery period, concentrations of 102mmol/L Na were
required to put participants in positive fluid balance (consuming 150% of the water lost),
lesser-concentrated (0-50mmol/L) solutions resulted in negative fluid balance at 6 hours
(Shirreffs, 1998).
Merson (2008) examined the effect of glucose and sodium on hydration status using a similar
protocol to Shirreffs (1998) and found a similar trend for sodium concentration as Shirreffs
(1998), it was concluded that a 50mmol/L Na solution was not sufficient to return participants
to euhydration after 4 hours. As with Shirreffs (1998), Merson also found a positive
correlation between fluid retention and sodium concentration.
In contrast, Jeukendrup (2009) investigated the rate of fluid delivery with changes in sodium
but unlike previous studies they found no significant differences when comparing the drinks
with different sodium concentrations (0 to 60mmol/L) in the 2 hours post drink consumption.
The lack of any significant findings were attributed to the inclusion of 6% glucose in the
drinks, which may have masked any effects of the sodium as glucose is also important for
fluid balance, participants were also not dehydrated. If an individual is euhydrated then the
body acts to maintain this homeostasis so the body would excrete the increased fluid intake
and prevent hyperhydration.
2.2.2 Carbohydrates
The effect of additional carbohydrates to a rehydration beverage has been shown to improve
the level of fluid retention after dehydration. Studies have shown that there is an optimal
range of carbohydrates to be included into drinks to optimise rehydration (Maughan 1999,

7
Evans 2009a, Utter 2010). Small additions of carbohydrates (2-10% CHO) have been shown
to improve fluid retention compared to plain water which has been shown to cause diuresis
and therefore fluid losses rather than retention (Utter 2010). Conversely, high carbohydrate
concentrations can result in a net fluid loss as the concentration gradient can move water out
of the body rather than into the body pool (Shi 2010). Further, the addition of carbohydrates
slows gastric emptying but it improves absorption of sodium with the two being absorbed
together in a co-transport process in the small intestine (Shi 2010). Therefore the
carbohydrate concentration of a recovery beverage needs careful consideration. Overall the
optimal carbohydrate content of a recovery solution will depend on the situation needs,
balancing the fluid, carbohydrate and electrolyte needs.
The provision of a 6% carbohydrate solution given to collegiate wrestlers after 3%
dehydration was shown to be more effective in hydrating participants compared to water
(Utter 2010). The manipulation of the carbohydrate concentration (0,2 and 10%) for a
rehydration solution showed that 2% or 10% glucose in solutions improved fluid balance
compared to a 0% after dehydration but only when fluid intake is restricted to 150% loss, the
recommended intake (Sawka, Burke et al. 2007, Evans 2009a, Evans 2009b). This effect was
diminished when participants were allowed to drink to ad libitum intake, which resulted in no
differences in hydration status at the end of the rehydration period as the amounts consumed
were different between treatment groups.
Not only does carbohydrate ingestion post exercise play a role in the rehydration process but
it is also important for restoring liver and muscle glycogen stores which are depleted by
exercise. Optimal recovery recommendations suggest 1-1.5g/kg every 2 hours for 6 hours of
carbohydrate are ingested (Rodriguez 2009). However, it is beyond the scope of this thesis to
discuss this aspect of recovery nutrition in detail.

8
2.2.3 Protein
The inclusion of protein in rehydration beverages has been a relatively new area of interest
for hydration research. The addition of protein has in some cases been shown to have
beneficial effects on the process of rehydration, as adding protein and therefore energy
reduces the rate of gastric emptying and therefore attenuate the rapid decrease in plasma
osmolality that leads to fluid loss rather than retention (Roy 2008). The research that has
shown positive effects for protein inclusion, on rehydration have received criticisms, as
confounding factors such as energy density, could potentially be the reasons for the beneficial
hydration effects rather than the protein per-se.
The benefits of protein enhancing hydration were investigated by Seifert (2006) who
compared a carbohydrate beverage (6%CHO) with a carbohydrate plus protein beverage
(6%CHO, 1.5%Pro), the protein infused beverage hydrated participants better by 13.1% after
the 3 hour recovery period with the carbohydrate plus protein group producing significantly
lower urine volumes. These results however have been criticised, as the different drinks were
not balanced for osmolality and energy density, both factors, which affect fluid retention and
hydration (Vist and Maughan 1995, Maughan, Leiper et al. 2004, Leser 2011). The results in
the study by Seifert (2006) being reflective of what athletes do in a real world setting, the
drinks not being balanced for energy and osmolality the findings are generalisable to what
happens in practice but being non conclusive on the cause of the effects of protein.
Building from the study by Seifert (2006), studies have balanced for energy and osmolality to
truly determine the effects of protein. Studies by James, Clayton et al. (2011) and James,
Gingell et al. (2012) investigated different types of protein on fluid balance after dehydration
balancing beverages for osmolality, energy and electrolytes. The findings from these studies
suggest that different protein types affect hydration status differently, the addition of whey

9
protein (4% CHO, 2.5% whey protein) showed no significant differences on rehydration
compared to a carbohydrate alone (6.5% CHO) drink. When comparing a carbohydrate drink
(6.5% CHO) with carbohydrate plus milk protein (4% CHO, 2.5% milk protein), a difference
was found, with the protein plus carbohydrate beverage improving fluid balance by 12%.
These different results could be related to the digestion of different proteins on the
rehydration process, primarily gastric emptying, casein protein has been found to coagulate in
the stomach, reducing gastric emptying and therefore reducing the osmolality shift improving
retention whereas whey protein empties faster from the stomach thereby enhancing dieresis
due to rapid fluid movement and reductions in plasma osmolality (Hall 2003).
2.2.4 Volume
Many studies have shown that ingesting volumes of fluid greater than the amount of body
mass lost during exercise are required in order to restore euhydration after dehydrating
exercise, even volumes of 150% of the loss have not been sufficient in restoring fluid balance
after acute dehydration in some studies (Maughan 1995, Shireffs, Taylor et al. 1996, James,
Gingell et al. 2012). Despite this, 150 % of sweat losses is the volume of fluid recommended
for post exercise rehydration as the difference in rehydrating by 150 or 200 % of sweat losses
is insignificant (Shireffs, Taylor et al. 1996, Sawka, Burke et al. 2007).
Studies that have investigated the effects of different rehydration beverages on hydration
status have varied in the research protocol, especially when regarding the volume of fluid
consumed after dehydration. This is important as the volume of fluid consumed has been
shown to affect the results. Evans (2009a), Evans (2009b) demonstrated when participants
were restricted to consuming the recommended fluid volume of 150% (of the volume lost)
compared to ad-libitum intakes, there were significant difference in terms of the fluid retained

10
within the body. As the volume of fluid ingested ad-libitum is dependant on taste, palatability
and satiety, it is important to consider the drink compositions and drinkability of drinks.
2.2.5 Taste
Generally studies measuring subjective feelings have used questionnaires based on a 100-mm
visual analogue scale. Questionnaires have included questions on the sweetness, saltiness,
bitterness, pleasantness and refreshedness of drinks (Merson 2008, James, Clayton et al. 2011,
James, Gingell et al. 2012, James, Evans et al. 2013). Very few studies have found any
significant differences in the taste variables when comparing drinks, therefore in the
hypohydrated state it appears the fluids consumed are similar in taste and overall palatability
(Merson 2008, James, Gingell et al. 2012). This is even the case when protein is added to a
carbohydrate beverage as Merson (2008) and James, Gingell et al. (2012) reported no
differences between a carbohydrate beverage and a carbohydrate plus protein drink.
In comparison, James, Clayton et al. (2011) compared a carbohydrate beverage with a
carbohydrate plus milk protein beverage and reported that the beverage containing protein
was perceived as being less salty (4.5 compared to 13 on a 100mm subjective visual analogue
scale) and less bitter (2 compared to 12) but overall sweetness and pleasantness was not
significantly different.
Evans (2009b) used the same subjective scales when testing rehydration beverages with 0, 2
and 10% carbohydrate beverages and found that although the results were not significantly
different between trials, however, there was a trend of increasing carbohydrate content
resulting in higher subjective scores for bloatedness and stomach fullness.
However, Shirreffs, Watson et al. (2007) assessed the efficacy of milk as a rehydration
beverage compared to a sports drink or plain water and did find some significant differences
in the general palatability and perceived sweetness of a carbohydrate beverage compared to

11
the other drinks. Although, they showed that when dehydrated, the consumption of the
carbohydrate beverage or milk, delayed the perception of hunger compared to the ingestion of
water, the milk drink with added electrolytes was also saltier. The effects of these tasted
differences on intake could not be investigated however as all participants were restricted to
150% of the volume lost through dehydration.
Findings from these studies highlight on the need for rehydration beverages to not only be
effective in rehydrating athletes but also be significantly palatable for consumers, the
effectiveness in a real world setting of the treatment being just as important as the efficacy.
2.3 Review of rehydration with carbohydrate solutions and protein
Studies looking specifically at the effect of carbohydrate containing rehydration beverages in
comparison to differing types and amounts of protein after dehydration have been conducted
but very few have been able to specifically pinpoint the effects of protein on rehydration.
Earlier research has been criticised as they failed to control for confounding factors such as
energy density and osmolality (Seifert 2006, Shirreffs, Watson et al. 2007, Watson, Love et al.
2008), whereas more recent studies have balanced for energy content (James, Clayton et al.
2011, James, Gingell et al. 2012, James, Evans et al. 2013) but potentially lack the real-life
habits of athletes.
Studies by Seifert (2006), Shirreffs, Watson et al. (2007) and Watson, Love et al. (2008)
found that the consumption of a drink with added protein or milk compared to a commercially
available carbohydrate and electrolyte sports drink resulted in improved fluid retention, the
protein inclusion putting participants into positive fluid balance after the recovery periods (3
hours in Watson’s study, 4 hours in Sifert and Shirreffs’ study). In comparison, the
carbohydrate drinks left participants in a net negative fluid balance after acute dehydration.
Watson’s study also included a subsequent exercise test to exhaustion however there was no

12
significant difference between trials despite the difference in hydration. Although the energy
density was different between the drinks, Watson, Love et al. (2008) used a protein beverage
(trim milk) contained 113g of CHO and 75g protein whereas the CHO drink contained 135g
CHO only, the protein drink having significantly higher energy density. Although this does
reflect drinks commercially available to athletes making them more reflective of real world
situations.
Building from these studies, James, Gingell et al. (2012) investigated the effect of whey
protein in addition to a carbohydrate-containing beverage balanced for energy content and
found no significant differences in rehydration after 4 hours. In comparison, a study using the
same protocol but this time using milk protein, a significant difference in rehydration
measures were found the milk protein plus carbohydrates beverage proving to be the better
rehydration beverage; James, Clayton et al. (2011) attributes the significant effect to the
component of milk protein (which is primarily casein) for these effects which slow gastric
emptying. No studies have been conducted looking at casein specifically therefore no
concrete conclusions can be made.
Assessing the literature comparing protein based beverages with carbohydrate beverages; it is
difficult to conclude on the effect of protein specifically on rehydration, the lack of balanced
studies make it difficult to isolate the specific effects with confounding factors being present
in early studies. Future approaches need to account for these factors and also focus on the
specific type of protein as differences have been found between milk protein and whey.
2.4 Markers of hydration
2.4.1 Urine specific gravity
Urine specific gravity (USG) is a measure of the density of urine (as a mass per volume)
compared to water, with values between 1.013 to 1.020 g/ml considered to represent

13
euhydration, it increases with dehydration. Values of 1.020g/ml or greater are considered as
states of hypohydration and a value less than 1.012 is classed as hyperhydrated (Armstrong
2005, Sawka, Burke et al. 2007). The measurement of USG is a relatively easy test to conduct,
quick to measure and relatively non invasive. In comparison to other hydration measures
USG has been shown to be a valid measure in most situations (Armstrong 1994, Armstrong
2005). Compared to urine osmolality measures, the two markers have been found to be
interchangeable (Armstrong 1994). Further compared to serum osmolality, urine specific
gravities have been shown to be just as sensitive in measuring dehydration after exercise or
for measuring overnight hypohydration seen in a study by Hamouti, Del Coso et al. (2012).
Urine specific gravities however, have been found to be affected by muscle mass, seen in a
study by Hamouti (2010) which looked at hydration markers comparing rugby players (high
muscle mass) and cyclists (low muscle mass). Hamouti found a positive correlation between
muscle mass and the presence of protein and other metabolites which falsely increased the
prevalence of hypohydration (the hydration status was validated by serum osmolality), these
results suggest that using urine specific gravities can be inaccurate for measuring
hypohydration in athletes with high muscle masses, multiple measures may need to be taken
to accurately determine an individuals hydration status considering for potential confounders.
Further, in some situations urine sample measures have been criticised for their accuracy due
to the delay in the kidneys ability to react to acute changes in fluid balance. This means that
the concentration of the urine when rapidly dehydrating or rehydrating fails to be
representative of the actual hydration status as there is a time lag. Also during periods of
rehydration, an individual will produce dilute urine when still being hypohydrated, as the
kidneys react to extracellular fluid changes rather than total fluid balance therefore
14
confounding the relationship between the urine measure and the true hydration status
(Popowski 2001, Shirreffs 2003).
2.4.2 Urine osmolality
Urine osmolality is a measure of total urine solute content, urine osmolality can be used to
measure hydration with cut-off values being set and monitored to quantify the level of
hydration of an individual. In a study by Armstrong (1994) the measures obtained from urine
osmolality’s have been seen to be comparable to USG, the two values both being accurate at
measuring hydration. It can be open to confounding as measures can vary between ethnic
groups, age and intercultural differences (Manz 2003). The same criticisms have been raised
for urine osmolality as all urine based indices such as USG have been shown to lag in
response to hydration changes so they are not reflective of hydration changes in specific
circumstances where there is large fluid turnovers (such as during rehydration or rapid
dehydration). A study by Popowski (2001), found that urine osmolality measures were not
accurate in detecting changes in hydration status after a 1% and 3% loss in bodyweight. A lag
phase was apparent during the rehydration period, urine osmolality was not as sensitive in
detecting acute dehydration as plasma osmolality, which was found to be significantly
different even at 1% dehydration and 30 minutes post rehydration (Popowski, 2001).
2.4.3 Urine colour
The colour of urine is dependent on the concentration of urichrome present in the sample
therefore depending on its concentration in urine; the colour of urine will vary. Changes in
urine colour have been shown to vary in a similar pattern as other urine measurement indices
such as USG and urine osmolality in response to fluid loss making the measure a potentially a
very useful and practical measure for hydration status (Armstrong 2005). The benefits of this
method is that it can be utilised by athletes, not requiring any sophisticated equipment to
15
analyse it can be a good measure in field settings (Armstrong 2005). The validity of using
urine colour has been investigated by Armstrong (1998) who found that monitoring colour
changes is as sensitive and valid as other urine measures. Using urine colour as a sole
measure of hydration status has limitations however with non hydration related confounders
which can affect the colour of urine, illness, vitamin supplements and medications can affect
urine colour which can make the measure unsuitable at times (Shirreffs 2000). Urine colour
similar to other urinary indices can be limited due to the time lag apparent during times of
large water turnovers (when large quantities are consumed) (Oppliger 2002).
2.4.4 Body mass changes
Assessing changes in body mass over a training session has been used to measure changes in
hydration status. It is a very safe measure of the acute change in hydration, working on the
premise of if an individual is a state of caloric balance, any loss of mass being due to a loss of
water when accounting for urine, faeces, any fluid intake, evaporation and sweat in clothing
(Armstrong 2005). This measure is accurate for moderate time periods (Cheuvront 2002) as
after longer periods of activity losses due to substrate oxidation and respiratory losses become
significant and need to be accounted for (Mitchell 1972).
A study by Harvey (2008) investigated the validity of body mass changes in measuring
dehydration compared to other methods (urine colour, specific gravity and hematocrit) in
soccer players. Harvey (2008) found that measuring mass changes was the best single
predictor of hydration compared to the all the other models alone however, the best predictor
was the combination of body mass change, USG and urine colour collectively.
Baker (2009) assessed the validity of using body mass changes as a measure of hydration
status in comparison to a deuterium oxide tracer and found that assessing body weight
changes was an accurate and reliable measure, the average difference in measures being
16
0.07kg, which is similar to the accuracy of most scales and of minimal physiological
importance (Baker 2009).
2.4.5 Plasma osmolality
Plasma osmolality is a very common method used in the research to measure hydration status.
It has been found to be moderately accurate in measuring hydration status and highly
repeatable for detecting changes in body water (Coefficient of variation of 0.3-0.4%)
(Popowski 2001, Armstrong 2005), unlike other blood indices which are less sensitive to
small changes in hydration (Shirreffs 2003). The sensitivity of plasma osmolality was tested
in a study by Popowski (2001) where athletes were dehydrated by, 1,3 and 5% bodyweight
with hydration measures taken at each stage, plasma osmolality was found to be the most
sensitive measure being able to detect hypohydration as low as 1%.
Although, measuring plasma osmolality is valid it does have disadvantages. It is invasive for
participants who must provide a blood sample; this also requires a sterile environment, which
is not always practical in the athletic setting. It is also costly, as phlebotomists are required to
obtain the sample, which then needs processing before it is finally measured, this in turn
means that there is a delay in providing the athlete with feedback on their fluid needs
(Armstrong 2005). In a review by Armstrong (2007) plasma osmolality measures were
criticised for not detecting changes in hydration status until 60 minutes post rehydration, it
has also been found in some studies that plasma osmolality failed to measure changes in
hydration highlighting a possible limitation of its use in particular settings where the flux in
hydration status is high.
2.4.6 Plasma volume change
When dehydration occurs, changes in total body water can be measured by monitoring the
changes in blood plasma volume, calculated from changes in haematocrit and haemoglobin.

17
When dehydration occurs, plasma volume decreases as water lost in the extracellular
compartment reduces the size of the extra cellular volume. Dill (1974) found that when
dehydrating male athletes by 4% bodyweight through exercise that plasma volume would
decrease on average by 12.2% calculated by the changes in concentration of haemoglobin and
haematocrit, which concentrations increasing with dehydration.
Plasma volume changes have been criticised for their variable responses between subjects,
which can be caused by factors, which affect extracellular cell volume (posture, electrolyte
concentrations, sweat composition, training and acclimatisation) which can make it unsuitable
to use at times (Harrison 1985). Movement has also been shown to influence plasma volume
therefore the participant has to remain at rest for 20 minutes prior to each blood sample being
obtained (Shirreffs 1994). Similar to most blood measurements for hydration, obtaining blood
samples can also be invasive for participants, expensive to implement with trained
phlebotomists required and unsuitable for field settings.
In conclusion there are a variety of hydration markers which have been shown to be effective
in measuring hydration status for varying situations (Armstrong 2005), these varying
measures all have their strengths and weaknesses with there being no official gold standard,
the best hydration marker can vary depending on the situation of usage, the degree of
precision needed, the timeframe of measurement and practicality of use.
2.5 Conclusion
Based on the findings of this literature review, it is evident that the topic of hydration in sport
is important for optimising performance and recovery. Although many hydration companies
marketing recovery beverages it is still unclear what is the optimal composition of a
rehydration drink. To date no study has investigated the effects of a commercially available
casein supplement on rehydration.
18
3. Objective Statement
Hypohydration in sport has been shown to be highly prevalent across a range of settings
(Maughan 2005, Hamouti 2010, Silva 2011). Hypohydration has also been shown to affect
performance not only physically but also mentally and recovery wise (Epstein 1999, Keller
2003, Lee 2011, Secher 2012). Rehydration beverages have been investigated to aim towards
attenuating to fluid losses with milk being shown to improve fluid retention more so than a
carbohydrate and electrolyte beverages (Shirreffs, Watson et al. 2007, Roy 2008). Different
protein types have been investigated to find out what component in milk is responsible for the
rehydration benefits however there have been no studies to date which have looked at casein
protein (James, Clayton et al. 2011, James, Gingell et al. 2012, James, Evans et al. 2013).
Furthermore, the composition of the drink is not the only important factor when considering
rehydration, but also the amount consumed and palatability have been shown to be important,
drinks needing to be palatable in order to be consumed in an adequate quantity.
Therefore the aim of this study was to investigate:
1) The effect of casein protein on rehydration measures in comparison to a sports drink.
2) If differences exist in palatability measures between the casein beverage and sports
drink.

19
4. Participants and Methods
This was a randomised cross-over intervention study with four arms (Casein protein, Whey
protein, trim milk and sports drink), to investigate their effectiveness as rehydration
beverages and impact on sleep quality. Due to the multiple focuses of this wider study,
specific sample size calculations were not done. This thesis will concentrate on two arms of
the wider study (Casein protein and sports drink) and their effectiveness as a rehydration
beverage.
4.1 Participant recruitment and ethical approval This study received ethical approval from the University of Otago Human Ethics
Committee (Health) (ref 13/169) (appendix a). Participants were recruited through word of
mouth and email. A total of 10 male participants volunteered to participate in the study. Any
questions they had were answered, before written informed consent was provided and a
health screening questionnaire were completed (appendix b). The mean ± standard deviation
for height was 177.88 ± 5.93 cm and age was 23.1 years ± 1.5 years.
4.1.1 Eligibility The inclusion criteria for participation in the study were reporting to be healthy, male, aged
18 to 45 years, exercising on a regular basis (more than 3 times a week). Participants were
excluded if they had any food allergies, history of blood pressure disturbance or
cardiovascular conditions. Participants were also ineligible if they did not meet the inclusion
criteria or if they had any kidney problems, circulation problems, diabetes, sleep disorders,
asthma, or thermoregulatory problems. Participants were also excluded if they had any
current musculoskeletal injury and/or sickness in the 24 hours prior to the trials.

20
4.2 Pretest protocol Prior to arrival at the first testing session, participants kept a weighed diet record for 24 hours
(appendix c). Participants were then asked to follow the same diet and physical activity for
the 24 hours prior to each of the subsequent testing sessions. Four hours prior to each testing
session, participants were asked to refrain from any eating or drinking other than 500mls of
plain water approximately 2 hours before the trial.
Participants arrived at the clinic at 5:30 in the evening. On arrival at the clinic, participants
were asked to empty their bladder completely and provide a urine sample (~20mL) in private.
Following this body mass in minimal clothing (underwear) was obtained (Digi DI-10
Wederburn 150kg, Wederburn, Dunedin, New Zealand). Finally, a 100 mm visual analogue
scale subjective feeling questionnaire (appendix d) was completed, to determine thirst and
gastrointestinal symptoms (appendix e) prior to exercise. Participants then entered the
environmental chamber (temperature; casein: 35.15 ± 0.25 oC Sports Drink: 35.16 ± 0.31 oC
(p = 0.630): Humidity; Casein 60.49 ± 7.96 % Sports drink 61.10 ± 6.04 % (p = 0.959)) and
commenced the exercise protocol.
4.3 Exercise protocol
During the exercise protocol participants initially started cycling at a workload equivalent to 2
Watts per kg of body mass on a cycle ergometer (Monarch ergometer, Cycleurope, Auckland,
New Zealand), this was later adjusted to match the abilities of each participant. Cycling was
undertaken in 10 minute blocks separated by a rest period (5 minutes) during which
participants’ towel dried and body mass was measured until the participant had lost 1.8% of
their initial body mass. Following this participants showered and were reweighed, as sweating
21
continued whilst participants were showering the final level of dehydration was ~2 %. Each
testing session was separated by at least 7 days.
4.4 Post exercise protocol
After the exercise period, participants sat at rest in a thermoneutral environment, fifteen
minutes following the end of exercise, participants were provided with 540 mL of a
rehydration beverage which was either; casein (Pure New Zealand Casein, Reactiv Defining
Nutrition, Auckland, New Zealand) plus sodium chloride (Iodised table salt, Cerebos,
Auckland, New Zealand) or sports drink (Powerade, mountain blast, isotonic powder, Coco-
Cola Amatil, Northmead NSW, Australia) this intervention beverage was consumed within
fifteen minutes post exercise. Upon drink consumption, drink characteristics were measured
using a subjective questionnaire measuring pleasantness, sweetness and saltiness. Over the
following 45 minutes, participants were provided with 3 equal boluses of plain water, these
were provided every 15 minutes and provided a total volume of fluid which was 150 % of
their body mass loss during the exercise protocol. Drinks were given in opaque drink bottles
and participants were not told which drink they were consuming.
One hour post exercise, participants provided a urine sample and answered a questionnaire
regarding any gastrointestinal symptoms, hunger, thirst, and tiredness, they were then
provided with a meal of two slices of white toast (White sliced sandwich bread, Budget,
Auckland, New Zealand) and a 425 g can of spaghetti (Spaghetti, Pams, Auckland, New
Zealand). At the two hour post exercise mark participants again emptied their bladders into a
urine container which was weighed to calculate urine output, a ~20 mL urine sample was
retained for later analysis. A further questionnaire measuring gastrointestinal symptoms,
hunger, thirst and tiredness was completed before participants were free to leave the clinic.
Meal macronutrient tables are shown in Table 4.4.1.

22
When participants left they were given a snack bar (Choc rainbow bubble bar, Pams,
Auckland, New Zealand) and instructed to consume this before they go to bed. Participants
were asked to refrain from eating or drinking until the first morning void the next morning.
All the urine produced from leaving the clinic until the first morning void was to be collected
and measured. Participants were asked to record the time of each void, any gastrointestinal
distress was also recorded and time noted. Participants completed a subjective feelings
questionnaire the following morning.
Table 4.4.1: Macronutrient composition of the meals and drinks for the casein and
sports drink groups.
Food/drink Amount
(g)
Energy
(kJ)
Carbohydrate
(g)
Protein
(g)
Fat
(g)
Sodium
(mg)
Casein 22 356 0.2 20.0 0.33 301
Spaghetti 420 946 45.0 7.2 2.00 1944
Bread 53 535 24.5 4.5 0.85 228
Cereal bar 20 342 14.2 0.5 2.10 227
Total 515 2179 83.9 32.2 5.28 2700
Sports drink 37 510 31.9 0.0 0.00 306
Spaghetti 420 946 45.0 7.2 2.00 1944
Bread 53 535 24.5 4.5 0.85 228
Cereal bar 20 342 14.2 0.5 2.10 227
Total 530 2333 115.6 12.2 4.95 2705

23
4.5 Sample analysis
4.5.1 Urine specific gravity
Urine samples were measured for their urine specific gravity using a handheld refractometer
(Atago, Tokyo, Japan) calibrated using de-ionised water. Coefficient of variation (CV) for
USG measures was 0.2%.
4.5.5 Urine osmolality
Urine osmolality was tested using the freezing point depression method (Osmomat 030,
Genotec, Berlin Germany), a reference standard was used to calibrate the machine, prior to
each batch of sample analysis, CV of 0.78%.
4.5.2 Urine output Participants measured their overnight urine production which was weighed (Electronic
kitchen scale with silicone platform, Salter housewares, Tonbridge, England) and total
amounts recorded to measure net water retention in the morning.
4.5.3 Subjective questionnaires Subjective questionnaires with 100mm visual analogue scales were used to measure drink
qualities and gastrointestinal symptoms pre exercise, 1 hour post exercise and 2 hours post
exercise. The questionnaires included scales to measure Thirst, hunger, tiredness, drink
pleasantness, saltiness, sweetness, the presence of any headache, flatulence, stomach
cramping, belching, stomach ache, nausea, diarrhoea, vomiting, stomach bloating and are
commonly used in research studies (Merson 2008, Evans 2009a, James, Clayton et al. 2011,
James, Gingell et al. 2012, James, Evans et al. 2013). The scales would range from none, to
severe for each of the measured qualities.

24
Gastrointestinal symptom questionnaire data was ranked with ratings above 10mm for a
specific symptom being rated as positive for a symptom, ratings under 10mm would be
ranked as negative for the symptom. (Appendix d)
4.6 Statistical analysis
Data was analysed using Stata 11.2 (StataCorp LP, College Station, Texas, USA). All data
was tested for a normal distribution using a Shapiro-Wilk test, with p≤0.05 indicating the data
were not normally distributed. Differences between conditions were determined using paired
two tailed t-tests for values with a normal distribution, and for non normally distributed data,
Wilcoxon sign rank tests were used. P values less than 0.05 were used to detect statistical
significance. When comparing urine specific gravities and osmolality values from baseline,
mixed model regression analysis was used to determine if there were differences between
conditions across time, accounting for random effects. Residuals were plotted to assess
normality. Proportion tests were used to analyse positive measures in the gastrointestinal
symptom questionnaires between and within groups. Multiple comparisons were carried out
using the Bonferroni method so that chance results were accounted for. This reduces the p-
value used to detect significance, depending on how many comparisons were made.

25
5. Results
5.1 Baseline measurements
At baseline there were no statistical differences in between the casein and sports drink trials
for pre exercise body mass (p = 0.630), pre exercise USG (p = 0.168), or pre exercise urine
osmolality (p = 0.168), table 5.1.1.
Table 5.1.1: Baseline Characteristics prior to exercise; body mass (kg), baseline USG
(g/ml), baseline osmolality (mOsm/kg) (mean ± SD)
Casein Sports drink *P value
Body mass (kg) 82.62 ± 8.22 82.82 ± 8.24 0.630
Baseline USG
(g/ml)
1.0115 ± 0.0072 1.0142 ± 0.0087 0.168
Baseline osmolality
(mOsm/kg)
430.6 ± 281.07 536 ± 341.26 0.168
*P value represents any differences between trials
26
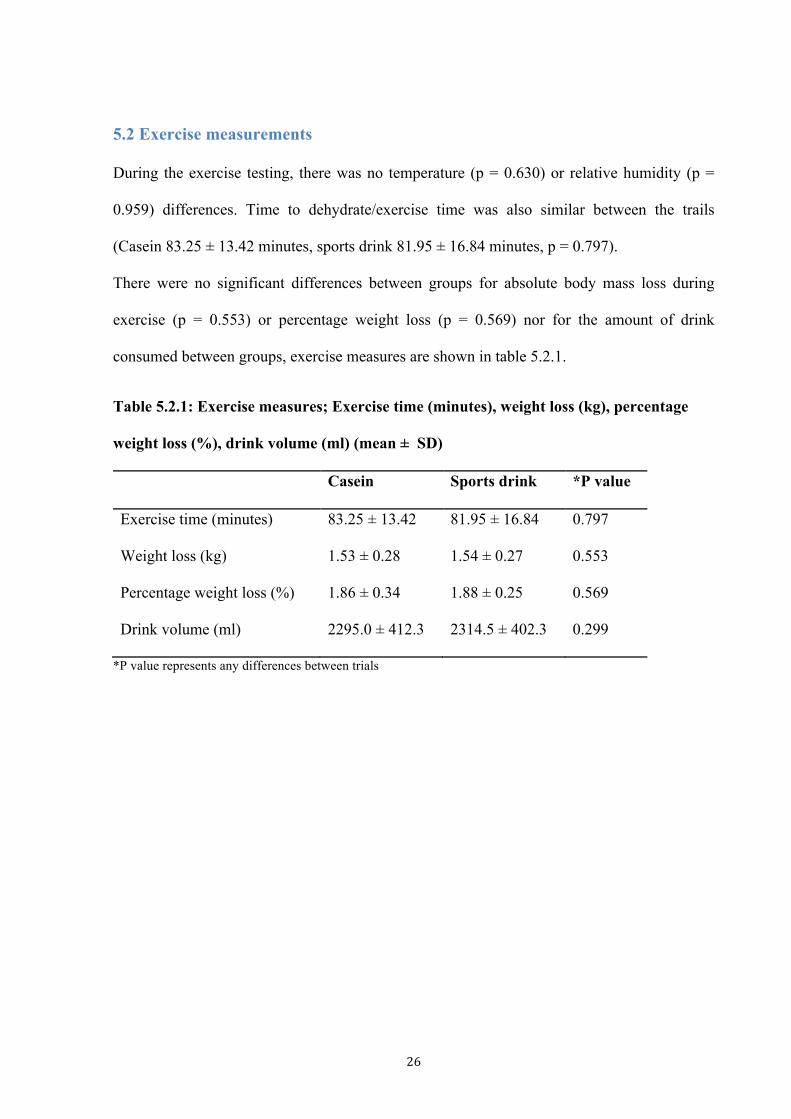
5.2 Exercise measurements
During the exercise testing, there was no temperature (p = 0.630) or relative humidity (p =
0.959) differences. Time to dehydrate/exercise time was also similar between the trails
(Casein 83.25 ± 13.42 minutes, sports drink 81.95 ± 16.84 minutes, p = 0.797).
There were no significant differences between groups for absolute body mass loss during
exercise (p = 0.553) or percentage weight loss (p = 0.569) nor for the amount of drink
consumed between groups, exercise measures are shown in table 5.2.1.
Table 5.2.1: Exercise measures; Exercise time (minutes), weight loss (kg), percentage
weight loss (%), drink volume (ml) (mean ± SD)
Casein Sports drink *P value
Exercise time (minutes) 83.25 ± 13.42 81.95 ± 16.84 0.797
Weight loss (kg) 1.53 ± 0.28 1.54 ± 0.27 0.553
Percentage weight loss (%) 1.86 ± 0.34 1.88 ± 0.25 0.569
Drink volume (ml) 2295.0 ± 412.3 2314.5 ± 402.3 0.299
*P value represents any differences between trials
27
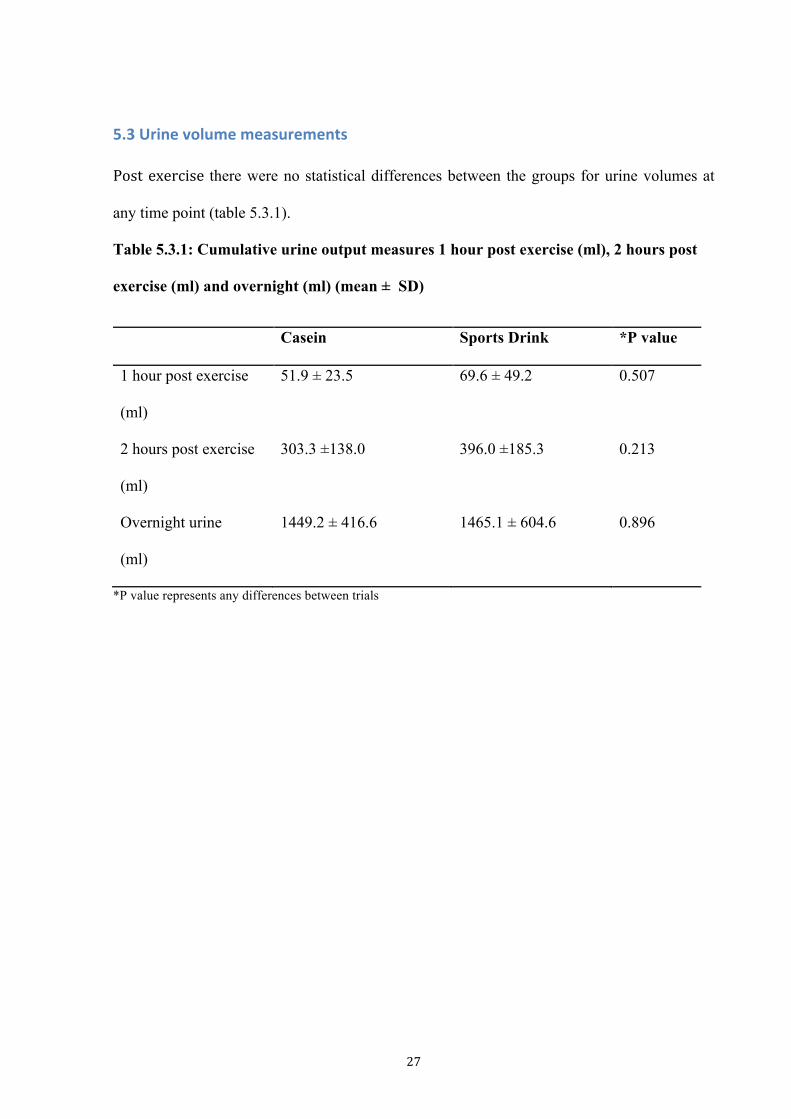
5.3 Urine volume measurements
Post exercise there were no statistical differences between the groups for urine volumes at
any time point (table 5.3.1).
Table 5.3.1: Cumulative urine output measures 1 hour post exercise (ml), 2 hours post
exercise (ml) and overnight (ml) (mean ± SD)
Casein Sports Drink *P value
1 hour post exercise
(ml)
51.9 ± 23.5 69.6 ± 49.2 0.507
2 hours post exercise
(ml)
303.3 ±138.0 396.0 ±185.3 0.213
Overnight urine
(ml)
1449.2 ± 416.6 1465.1 ± 604.6 0.896
*P value represents any differences between trials

28
5.4 Net fluid balance
There were effects by time within groups, all measures were significantly different from
each other (p<0.05) for both the casein and sports drink groups. At each of the time
points there were no statistical differences between groups with regard to net fluid
balance. The net fluid balance trend over time between drinks is shown in figure 5.4.1.
Participants post exercise were in a state of negative fluid balance compared to baseline
hydration, post drink consumption participants were in positive fluid balance which
they remained in remained both 1 and 2 hours post exercise. Participants tended to be
in a negative fluid balance in the morning post exercise. These trends stand for both
drink groups.

29
Figure 5.4.1: Mean (95 % confidence intervals) for net fluid balance during trials casein
and sports drink (ml).
* Significantly different from Pre (p<0.05) for casein and sports drink

30
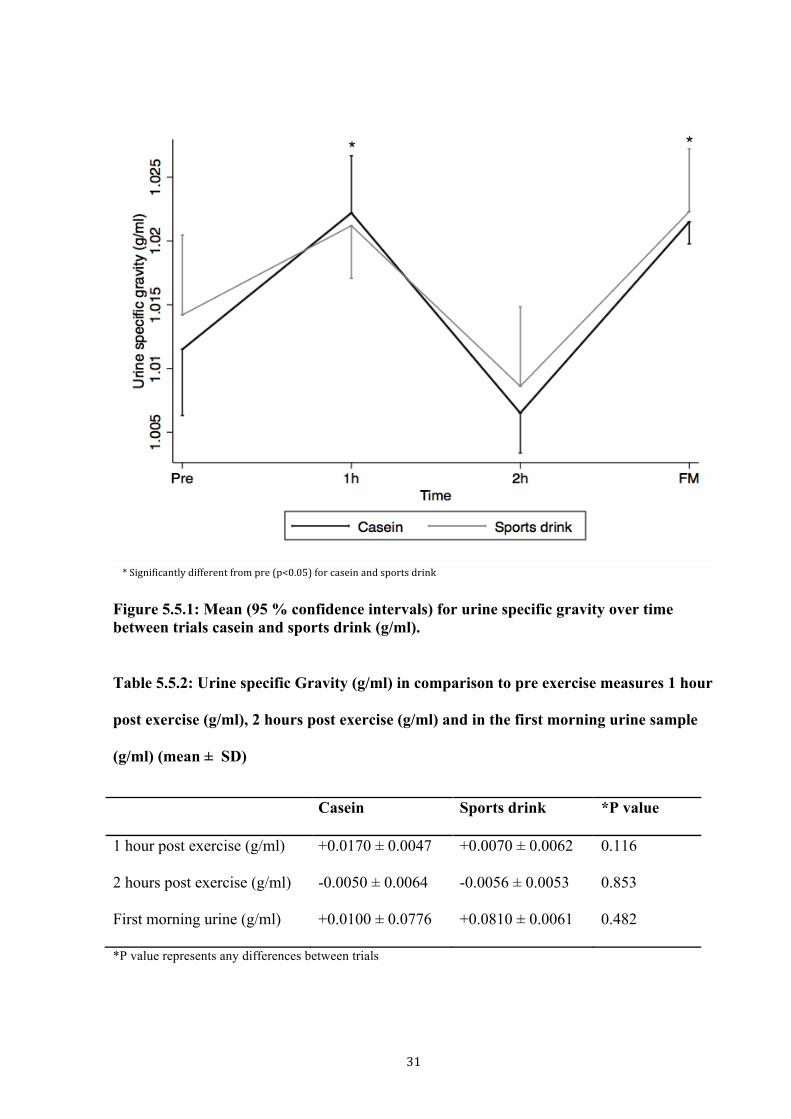
5.5 Urine specific gravity measurements
There was a time effect for USG with casein and sports drink displaying a similar trend.
Baseline measures were significantly different from both 1 hour and the first morning
measure (p <0.05), 1 hour post exercise measures were significantly different from baseline
and 2 hours post exercise (p <0.05). The 2 hour measures were significantly different
compared to 1 hour and first morning measures and the first morning measure was
significantly different compared to baseline and the 2 hour measure. These trends standing for
both casein and sports drink. Comparing the drinks, there were no significant differences at
any of the time points for USG measures at any time points, figure 5.5.1.
31
Figure 5.5.1: Mean (95 % confidence intervals) for urine specific gravity over time between trials casein and sports drink (g/ml). Table 5.5.2: Urine specific Gravity (g/ml) in comparison to pre exercise measures 1 hour
post exercise (g/ml), 2 hours post exercise (g/ml) and in the first morning urine sample
(g/ml) (mean ± SD)
Casein Sports drink *P value
1 hour post exercise (g/ml) +0.0170 ± 0.0047 +0.0070 ± 0.0062 0.116
2 hours post exercise (g/ml) -0.0050 ± 0.0064 -0.0056 ± 0.0053 0.853
First morning urine (g/ml) +0.0100 ± 0.0776 +0.0810 ± 0.0061 0.482
*P value represents any differences between trials
* Significantly different from pre (p<0.05) for casein and sports drink
32
5.6 Urine osmolality measurements
Comparing time points within drinks by time. Similar trends were seen for both drinks
however the level of significance differed between the two drinks as shown in figure 5.6.1.
Comparing drinks the casein and sports drink trials there were no significant differences
between trials for osmolality measures at any time points, figure 5.6.1. Nor were there any
differences when baseline osmolality values were taken into account (P>0.05), table 5.6.1.

33
Figure 5.6.1: Mean (95 % confidence intervals) of urine osmolality over time between
Casein and sports drink trials (mOsm/kg).
* Significantly different from pre (p<0.05) for casein + Significantly different from pre (p<0.05) for sports drink

34
Table 5.6.1: Urine osmolality (mOsmol/L) measures in comparison to baseline measures
1 hour post exercise (mOsmol/kg), 2 hours post exercise (mOsmol/kg) and first morning
(mOsmol/kg) (mean ± SD)
Casein Sports drink *P value
1 hour post exercise (mOsmol/L) 266.80 ± 186.5 157.6 ± 239 0.173
2 hours post exercise (mOsmol/L) -206.0 ± -379.1 -238.5 ± -370.5 0.779
First morning urine (mOsmol/L) 305.7 ± 276.5 233.0 ± 194.2 0.395
*P value represents any differences between trials
5.7 Questionnaire measurements
5.7.1 Thirst, tiredness and hunger questionnaire data
On the sports drink trial participants were significantly thirstier (33.7 ± 20.5mm casein 49.6
± 18.6mm sports drink P=0.009) and more tired (27.6 ± 12.3mm casein 38.2 ± 22.5mm
sports drink P=0.040) than participants in the casein group prior to exercise. At all other time
points, there were no differences between groups (P>0.05). There were no differences
between groups at any time points for hunger. Thirst, hunger and tiredness measures are
shown in table 5.7.1.1.
Comparing thirst hunger and tiredness within groups for casein and sports drink at the
different time points. Participants in the casein group were significantly less thirsty 1 hour
and 2 hours post compared to baseline (differences on questionnaire scales being -28.9mm
(p=0.001), -20.2mm (p=0.009) 1 hour and 2 hours respectively). Post exercise, participants in
the casein group were not significantly thirstier than at baseline (p=0.179). In the sports drink
group comparing to baseline, participants were significantly less thirsty 1 hour post exercise
and 2 hours post exercise (-35.4 (p=0.001), -32.4 (p=0.001), 1 hour and 2 hours respectively).

35
Post exercise, participants in the sports drink group were significantly thirstier than at
baseline before exercise (p=0.030). However after adjustment for multiple comparisons
(Bonferroni), this became non significant (p>0.05) this is suggestive of a chance result.
There were no significant differences in either casein or sports drink groups for hunger within
groups at any of the different time points.
For tiredness, the casein group was significantly more tired post exercise, 1 hour post and 2
hours post exercise (coefficient of variation 31.8 (p=0.001), 33.4 (p=0.001) 36.2 (p=0.001)
compared to baseline, the sports drink group was not significantly more tired than at baseline
for any of the time points (p>0.0125).

36
Table 5.7.1.1: Thirst, hunger and tiredness measures pre, post exercise, 1 hour post and
2 hours post exercise (mm) (mean ± SD)
Casein Sports drink P value
Pre exercise
Thirst 33.7 ± 20.5 49.6 ± 18.6 0.009
Hunger 56.2 ± 24.3 55.7 ± 14.7 0.838
Tiredness 27.6 ± 12.3 38.2 ± 22.5 0.040
Post exercise
Thirst 44.1 ± 25.3 59.9 ± 15.2 0.139
Hunger 68.5 ± 30.9 59.5 ± 26.9 0.125
Tiredness 59.4 ± 17.1 57.8 ± 25.9 0.837
1 hour post exercise
Thirst 4.8 ± 9.6 14.2 ± 13.3 0.080
Hunger 69.1 ± 23.9 58..7 ± 22.8 0.386
Tiredness 61.0 ± 20.8 53.8 ± 20.3 0.425
2 hours post exercise
Thirst 13.5 ± 14.6 17.2 ± 15.7 0.358
Hunger 45.2 ± 25.3 47.1 ± 23.9 0.876
Tiredness 63.8 ± 18.9 55.5 ± 23.7 0.124
37
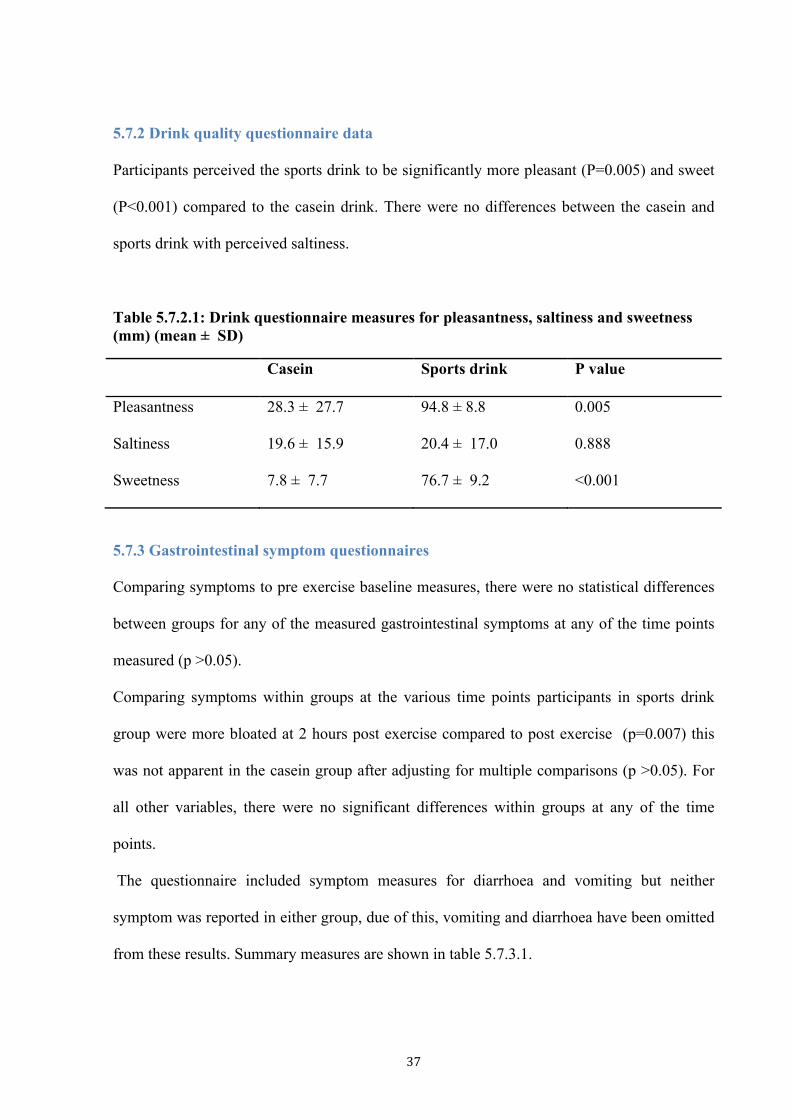
5.7.2 Drink quality questionnaire data
Participants perceived the sports drink to be significantly more pleasant (P=0.005) and sweet
(P<0.001) compared to the casein drink. There were no differences between the casein and
sports drink with perceived saltiness.
Table 5.7.2.1: Drink questionnaire measures for pleasantness, saltiness and sweetness (mm) (mean ± SD)
Casein Sports drink P value
Pleasantness 28.3 ± 27.7 94.8 ± 8.8 0.005
Saltiness 19.6 ± 15.9 20.4 ± 17.0 0.888
Sweetness 7.8 ± 7.7 76.7 ± 9.2 <0.001
5.7.3 Gastrointestinal symptom questionnaires
Comparing symptoms to pre exercise baseline measures, there were no statistical differences
between groups for any of the measured gastrointestinal symptoms at any of the time points
measured (p >0.05).
Comparing symptoms within groups at the various time points participants in sports drink
group were more bloated at 2 hours post exercise compared to post exercise (p=0.007) this
was not apparent in the casein group after adjusting for multiple comparisons (p >0.05). For
all other variables, there were no significant differences within groups at any of the time
points.
The questionnaire included symptom measures for diarrhoea and vomiting but neither
symptom was reported in either group, due of this, vomiting and diarrhoea have been omitted
from these results. Summary measures are shown in table 5.7.3.1.
38
Table 5.7.3.1: Gastrointestinal questionnaire measures for post exercise, 1 hour post exercise, 2 hour post exercise compared to baseline (n= number of participants).
Casein Sports drink P value
Post exercise
Headache 3 0 0.603
Flatulence 2 3 0.605
Cramping 3 0 0.603
Belching 3 5 0.361
Stomach ache 2 1 0.531
Nausea 1 0 0.304
Stomach bloating 2 2 1.000
1 hour post exercise
Headache 0 1 0.304
Flatulence 4 1 0.121
Cramping 2 1 0.531
Belching 6 4 0.371
Stomach ache 2 1 0.531
Nausea 1 0 0.304
Stomach bloating 7 8 0.605
2 hours post exercise
Headache 2 1 0.531
Flatulence 3 3 1.000
Cramping 1 0 0.304
Belching 2 3 0.605
Stomach ache 0 0 .
Nausea 1 0 0.304
Stomach bloating 3 4 0.639

39
6. Discussion
6.1 Main findings
The present study shows that casein protein alone as a rehydration beverage did not
significantly improve or impair rehydration and fluid retention after exercise induced
dehydration in comparison to a commercially available carbohydrate -electrolyte sports drink.
However, the sports drink was significantly more pleasant and sweeter than the casein
beverage which have their implications in the real world setting where drinks are consumed
ad libtium rather than prescribed, potential differences in intakes depending on palatability
can affect overall hydration.
6.2 Casein protein
This is the first study to investigate the efficacy of casein protein alone on rehydration indices,
as previous studies have provided casein in the form of milk. When milk is used as the
rehydration beverage in comparison to sports drink beneficial results have been seen
(Shirreffs, Watson et al. 2007, Watson, Love et al. 2008). These studies have suggested that it
is the casein fraction of the milk which is responsible for the enhancement in rehydration,
however the present study suggests that by itself, it is not the casein that is the beneficial
component making milk a more effective rehydration drink than sports drinks. Other
components in milk, which may influence its absorption, and retention in the body include
whey, sodium, fat, carbohydrates and differences in energy. With the exception of whey
protein, it has been shown that all these factors can influence some aspect of gastric emptying,
intestinal absorption and overall retention (James, Gingell et al. 2012). Gastric emptying can
affect rehydration with fluid delivery rates being influenced by the stomach contents, it has
been seen that more energy dense, higher fat, carbohydrate and protein slow gastric emptying,
reducing the rate of fluid delivery which affects fluid absorption rates for the intestines (Vist

40
and Maughan 1995, Maughan 2004). Intestinal absorption has been shown to be influenced
by drink composition with drinks containing carbohydrates, sodium and other electrolytes
improving absorption through the osmotic concentration gradient the drink components
produce (Maughan and Leiper 1999, Shi 2010). The rates of fluid delivery and intestinal
absorption efficiency have their downstream effects on fluid retention with factors such as
sodium and electrolyte content affecting the blood osmolality shift once fluids are absorbed,
this affects retention with less pronounced osmolality shifts resulting in improved retention
rather than free water clearance (Nose 1988). However, it is difficult to control all of these
factors when assessing two drinks whilst still trying to maintain ecological validity. As this
study aimed to replicate the practices of athletes, the drinks were designed to match the
recovery from exercise guidelines for protein and carbohydrates post exercise making the
findings more applicable to the real world (Sawka, Burke et al. 2007). In the present study
the two drinks had not been balanced for energy the casein drink having 85kcal and the sports
drink having 121kcal. Studies which have used milk in comparison to carbohydrate drinks
normally had the milk drink at a higher energy density than the carbohydrate drink (Shirreffs,
Watson et al. 2007, Watson, Love et al. 2008). However the energy difference between the
drinks seen in the studies by Shirreffs, Watson et al. (2007) (196kcal) and Watson, Love et al.
(2008) (220kcal) were at a much greater magnitude compared to the one used in this study, a
difference of 50kcal although unlikely to have as much of an effect as seen in previous
studies it cannot be ignored. Despite the casein drink having a lower energy content, the
hydration values were similar between the two trials with no significant difference between
the urine specific gravity, urine osmolality and net fluid balance at any of the time points
measured. It would therefore appear that the casein is coagulating in the stomach reducing the
rate of fluid delivery reducing the rate of blood osmolality shift improving the retention of
fluid and free water clearance. This effect has been investigated by Hall (2003) who found
casein to exhibit a slower rate of gastric emptying compared to whey. Therefore at higher
41
energy densities it is possible that the casein would elicit greater rehydration benefits than a
sports drink. It was shown in a study using milk protein (80% casein) when balancing for
energy in comparison to a CHO beverage that participants in the protein group were more
hydrated 4 hours post drink consumption (James, Evans et al. 2013), it is seen here that when
balanced for confounding factors such as energy that significant effects can be found,
however the effect of casein alone may not be concluded upon. As we did not measure urine
outputs up to 4 hours there could have been an effect of the casein being retained longer but
with the large gap in time between the 2 hour and first morning measure this potential effect
was not measured, especially because urine production decreases at night (Noh, Han et al.
2011).
6.3 Hydration biomarkers
Urine hydration measures used in this study were similar to the ones used in the studies by
James, Clayton et al. (2011), James, Gingell et al. (2012) and James, Evans et al. (2013) who
used urine osmolality to measure changes in hydration status. As a supplement to this, urine
specific gravity was also used in this study which has shown to be comparable in accuracy
(Armstrong 1994). These hydration measures however, can be inaccurate and less sensitive in
shorter, acute time frames, in instances where large amounts of fluid turnover are apparent, a
lag effect being apparent confounding the measure. With these limitations of the urine
specific gravity and urine osmolality the recommendations by Sawka, Burke et al. (2007) to
take the measure in the first morning void was followed to ensure that measures were
accurate, it is in the 1 and 2 hour measures where after the large fluid turn over the measures
could be inaccurate however this potential confounder was balanced for with the crossover
design. The crossover design also accommodated for the potential confounder of participant
muscle mass which has been shown to increase urine specific gravity measures in higher
muscle mass individuals (Hamouti 2010).
42
Another limitation to the urine analysis which may have hindered the findings was the
protocol of collecting urine samples at 1 and 2 hours post exercise only. In studies by James,
Clayton et al. (2011) and James, Evans et al. (2013), urine measures were taken up to 4 hours
with both studies finding significant differences after 3 hours. If urine measures were taken
for more than 2 hours in this study, potential significant differences may have been found.
However with the protocols used in this study, exercise testing in the late afternoon made it
impractical to collect urine samples without impacting on the sleep activity of participants
limiting the real world generalisability of results.
In future studies more accurate measures of acute changes should be used to quantify the
hydration status with more precision, measures such as plasma osmolality have been shown
to be more accurate at measuring acute changes, shown in the study by Popowski (2001) and
Armstrong (2005) where plasma osmolality was the best indicator of hydration status at
varying degrees of hypo-hydration significantly detecting 1% dehydration and being able to
detect rehydration after 30 minutes.
6.4 Hydration recommendations
It is interesting to note that even though the participants followed the recommendations for
fluid intake post exercise by consuming 150% of their body mass lost, the mean hydration
status according to urine specific gravity, and overall net fluid balance would suggest that
participants would wake up hypohydrated in the morning post exercise. This is the first study
to investigate an overnight rehydration strategy and may help to explain the observational
findings from field studies which show athletes arrive at training in a hypohydrated state
(Hamouti 2010, Silva 2011). Hamouti (2010) looked at indoor sports players and found that
after a training session which on average lasted 83 minutes even with ad libitum eating and
drinking after training, 91% of players would be hypohydrated in the following morning 3
hours prior to training. It would appear that it is not only important to ensure fluid is

43
consumed post training but that it is also consumed in the morning prior to training based on
the findings from this study to optimise hydration prior to exercise. It is possible that
consuming 150% of the body mass lost over 1 hour post exercise resulted in large shifts in
blood osmolality increasing free water clearance. Jones, Bishop et al. (2010) compared fluid
intakes with of 120% of the amount lost being consumed over 1 hour compared to 4 hours
and found that when the fluid was consumed over the longer period, more would be retained
after dehydration. It is seen here that fluid ingestion rates play a role in overall retention
however there needs to be more studies looking shorter term hydration strategies.
6.5 Drink palatability
When asking athletes to consume a beverage, drink characteristics are important, as they will
consume a greater volume if the drink is palatable. In this study, the casein drink was
perceived to be significantly less pleasant compared to the sports drink. These results have
their implications in practice in situations where there is ad libitum intakes, if drinks are less
pleasant than others then they will be less likely to be consumed (Evans 2009a, Evans 2009b).
In two studies looking at rehydrating participants with either 0, 2 and 10% glucose drinks
there was a significant difference in net fluid balance between the 10% and 0% drink when
drinking 150% of the amount lost but no difference when ad libitum intakes were prescribed,
when ad libitum intake was the protocol, participants tended to drink less although not
significantly different, these findings show how drink quantities can vary when intakes are ad
libitum (Evans 2009a, Evans 2009b).
6.6 Study strengths
The findings from this study have their strengths as the protocols used reflect real world
practice. The findings are applicable and relevant because the current recommendations for
post exercise rehydration was followed (Sawka, Burke et al. 2007). The crossover design
used in this study was a strength with it balancing for a range of confounding factors as
44
discussed earlier with muscle mass, and ethnicity all being balanced for. This study is also the
first of its kind to investigate overnight hydration with studies prior to this only looking at
shorter time periods (Seifert 2006, Watson, Love et al. 2008, James, Clayton et al. 2011,
James, Gingell et al. 2012, James, Evans et al. 2013).
6.7 Limitations and future research
The protocols used for this study were designed to replicate the real world practice, due to
this, there were some limitations to the findings which can limit the generalisability of results.
As mentioned earlier, the drinks were not balanced for energy which may have affected the
overall results, energy density playing a role in gastric emptying, the effect of casein when
balanced for energy is still not completely known. Future studies balancing for energy in the
protein drink would be useful to investigate the effects of casein protein in comparison to
sports drink with energy balanced.
Due to the two drinks being distinctively different in taste, blinding in this study may not
have been effective, with this however, drinks were given in opaque bottles and participants
were blinded until after exercise, their knowledge of the drink being consumed being kept to
as small as possible it is unlikely the knowledge of drink would have influenced the end
results. In the future, masking of the drinks could be useful to further blind the participants, to
minimise any potential effects of drink awareness, this has been done in studies by James,
Gingell et al. (2012) however, in this study, the real world efficacy was the primary measure.
This study found no significant differences in hydration status between the casein and sports
drink. As mentioned earlier, this may have been due to the timing of measurements, urine
measures at 3 and 4 hours could have been important in measuring any differences however
these measures were not taken due to the nature and timing of this study. In future research,
starting the exercise earlier and keeping participants for longer could be included in the
protocol to measure hydration at 3 and 4 hours.

45
Furthermore, subsequent exercise performance post rehydration which has been measured in
a study by Watson, Love et al. (2008) was not included in this study. The primary aim of this
present study was to investigate hydration however the effects on performance were not
measured, a performance test in the morning after exercise would have been useful in
determining the effect on performance.
In future studies, to investigate further into the effects of casein and sports drink on hydration
and performance, measures of protein synthesis, plasma amino acids, tracer proteins, insulin
response rates and glycogen resynthesis can be included in the measures to further clarify on
the most suitable drink for post exercise rehydration. These measures have been used in a
study by Res (2012) using isotope tracers to look at the effect of protein on overnight
recovery after exercise. Glycogen resysthesis rates have been used in a range of studies seen
in a review by Betts (2010). This was not done in the present study due to the cost and
invasiveness for the participants and timeframe of the project.
6.8 Conclusions
In conclusion this study has shown that casein protein did not significantly improve or impair
rehydration compared to a commercially available sports drink. This study has been the first
study of its kind looking at casein protein by itself the findings warrant for further
investigation to balance for energy content and more measures to completely extrapolate
effects. This study has also highlighted on overnight hydration status and the need for further
research into the area to develop an effective protocol to ensure that athletes are hydrated in
the morning to optimise performance.

46
7. Application to Practice The implications of the present study have significant relevance in a multitude of ways to
dietetic practice in the future. This research adds to the knowledge base in the area of
hydration for competitive athletes and with the findings from this study, it can influence
choices for rehydration beverages and rehydration strategies for sport and sporting practice.
The results and findings of this study are applicable and generalisable to the real world setting,
the protocols such as the components in drinks, and practices followed were to match for
what would happen in the real world setting.
It was found in this study that casein alone as a rehydration beverage can act to the same
degree as a commercially available sports drink after exercise induced dehydration.
This study has shown that the fluid recommendations for post exercise rehydration by the
American College of Sports Medicine are not working for overnight hydration when the
fluids are consumed in the period of 1 hour post exercise (Sawka, Burke et al. 2007). This
highlights on the need for further research to investigate hydration strategies for optimising
overnight hydration. From the findings of this study, it would be advantageous for athletes to
not only consume fluids after exercise but also in the morning prior to any more exercise.
This is important advice for dietitians working with athletes especially given the role of
hydration status and performance and health. It is likely that dietitians working with athletes
who train or travel to train in the heat and/or who work with athletes who train several times a
day will use the findings from this project in practice.

47
8. References Armstrong, L. E. (1994). Urinary indices of hydration status. International journal of sport nutrition 4(3): 265-279. Armstrong, L. E. (1998). Urinary indices during dehydration, exercise, and rehydration. International journal of sport nutrition 8(4): 345-355. Armstrong, L. E. (2005). Hydration assessment techniques, International Life Sciences Institute. Armstrong, L. E. (2007). Assessing hydration status: The elusive gold standard. Journal of the American College of Nutrition 26(5): 575-584. Armstrong, L. E. (2007). Exertional heat illness during training and competition. Medicine and science in sports and exercise 39(3): 556-572. Baker, L. B. (2009). Change in body mass accurately and reliably predicts change in body water after endurance exercise. European journal of applied physiology 105(6): 959-967. Benton, D. (2011). Dehydration Influences Mood and Cognition: A Plausible Hypothesis? Nutrients 3(5): 555-573. Betts, J. A. (2010). Short-term recovery from prolonged exercise exploring the potential for protein ingestion to accentuate the benefits of carbohydrate supplements. Sports Medicine 40(11): 941-959. Cheuvront, S. N. (2002). Comparison of sweat loss estimates for women during prolonged high-intensity running. Medicine and science in sports and exercise 34(8): 1344-1350. Dill, D. B. (1974). Calculation of percentage changes in volumes of blood, plasma, and red cells in dehydration. Journal of applied physiology 37(2): 247-248. Epstein, Y. (1999). Fluid-electrolyte balance during labor and exercise: Concepts and misconceptions. International journal of sport nutrition 9(1): 1-12. Evans, G. H. (2009a). Postexercise rehydration in man: the effects of osmolality and carbohydrate content of ingested drinks. Nutrition 25(9): 905-913. Evans, G. H. (2009b). Postexercise rehydration in man: the effects of carbohydrate content and osmolality of drinks ingested ad libitum. Applied physiology, nutrition, and metabolism 34(4): 785-793. Hall, W. L. (2003). Casein and whey exert different effects on plasma amino acid profiles, gastrointestinal hormone secretion and appetite. British journal of nutrition 89(2): 239-248.
48
Hamouti, N. (2010). Dehydration and sodium deficit during indoor practice in elite european male team players. European journal of sport science 10(5): 329-336. Hamouti, N. (2010). Effects of athletes' muscle mass on urinary markers of hydration status. European journal of applied physiology 109(2): 213-219. Hamouti, N., et al. (2012). Comparison between blood and urinary fluid balance indices during dehydrating exercise and the subsequent hypohydration when fluid is not restored. European journal of applied physiology 11(3): 611-620. Harrison, M. H. (1985). Effects of thermal stress and exercise on blood volume in humans. Physiological reviews 65(1): 149-209. Harvey, G. (2008). The use of body mass changes as a practical measure of dehydration in team sports. Journal of science and medicine in sport 11(6): 600-603. Hosey, R. G. (2004). The ergogenics of fluid and electrolyte balance. Current sports medicine reports 3(4): 219-223. James, L. J., et al. (2011). Effect of milk protein addition to a carbohydrate-electrolyte rehydration solution ingested after exercise in the heat. British journal of nutrition 105(3): 393-399. James, L. J., et al. (2013). Effect of varying the concentrations of carbohydrate and milk protein in rehydration solutions ingested after exercise in the heat. British journal of nutrition 110(7): 1285-1291. James, L. J., et al. (2012). Whey protein addition to a carbohydrate-electrolyte rehydration solution ingested after exercise in the heat. Journal of Atheletic Training 47(1): 61-66. Jeukendrup, A. E. (2009). Effect of beverage glucose and sodium content on fluid delivery. Nutrition & metabolism 6(9): 1-7. Jones, E. J., et al. (2010). Effects of Metered Versus Bolus Water Consumption on Urine Production and Rehydration. International Journal of Sport Nutrition & Exercise Metabolism 20(2): 139-144. Keller, U. (2003). Effects of changes in hydration on protein, glucose and lipid metabolism in man: impact on health. European journal of clinical nutrition 57 Suppl 2(2): S69-74. Kempton, M. J. (2011). Dehydration affects brain structure and function in healthy adolescents. Human brain mapping 32(1): 71-79. Kordi, R. (2011). Patterns of weight loss and supplement consumption of male wrestlers in Tehran. Sports medicine, arthroscopy, rehabilitation, therapy, and technology 3(1).

49
Lee, J. K. W. (2011). Effects of ingesting a sports drink during exercise and recovery on subsequent endurance capacity. European journal of sport science 11(2): 77-86. Leser, S. (2011). Potential role for protein in assisting post-exercise rehydration. Nutrition bulletin 36(2): 224-234. Manz, F. (2003). 24-h hydration status: Parameters, epidemiology and recommendations. European journal of clinical nutrition 57(suppl.2): S10-S18. Maughan, R. J. (1995). Sodium intake and post-exercise rehydration in man. European journal of applied physiology and occupational physiology 71(4): 311-319. Maughan, R. J. (1999). Limitations to fluid replacement during exercise. Canadian journal of applied physiology 24(2): 173-187. Maughan, R. J. (2004). Fluid and electrolyte intake and loss in elite soccer players during training. International journal of sport nutrition and exercise metabolism 14(3): 333-346. Maughan, R. J. (2004). Gastric emptying and fluid availability after ingestion of glucose and soy protein hydrolysate solutions in man. Experimental physiology 89(1): 101-108. Maughan, R. J. (2005). Fluid and electrolyte balance in elite male football (soccer) players training in a cool environment. Journal of sports sciences 23(1): 73-79. Maughan, R. J. and J. B. Leiper (1999). Limitations to Fluid Replacement During Exercise. Canadian journal of applied physiology 24(2): 173-187. Maughan, R. J., et al. (2004). Gastric emptying and fluid availability after ingestion of glucose and soy protein hydrolysate solutions in man. Experimental physiology 89(1): 101-108. McDermott, B. P., et al. (2009). Hydration status, sweat rates, and rehydration education of youth football campers. Journal of Sport Rehabilitation 18(4): 535-552. Meir, R. A. (2011). What do changes in prematch vs. postmatch, 1, 2, and 3 days postmatch body weight tell us about fluid status in English Premiership rugby union players? Journal of strength and conditioning research 25(8): 2337-2343. Merson, S. J. (2008). Rehydration with drinks differing in sodium concentration and recovery from moderate exercise-induced hypohydration in man. European journal of applied physiology 103(5): 585-594. Mitchell, J. W. (1972). Respiratory weight losses during exercise. Journal of applied physiology 32(4): 474-476. Noh, J. Y., et al. (2011). Circadian rhythms in urinary functions: possible roles of circadian clocks? International neurourology journal 15(2): 64-73.

50
Nose, H. (1988). Role of osmolality and plasma volume during rehydration in humans. Journal of applied physiology: respiratory, environmental and exercise physiology 65(1): 325-331. O'Brien, K. K. (2001). Hyponatremia associated with overhydration in U.S. Army trainees. Military medicine 166(5): 405-410. Oppliger, R. A. (2002). Hydration testing of athletes. Sports Medicine 32(15): 959-971. Popowski, L. A. (2001). Blood and urinary measures of hydration status during progressive acute dehydration. Medicine and science in sports and exercise 33(5): 747-753. Remick, D. (1998). Hyperthermia and dehydration-related deaths associated with intentional rapid weight loss in three collegiate wrestlers- North Carolina, Wisconsin, and Michigan, November-December 1997. The Journal of the American Medical Association 279(11): 824-825. Res, P. T. (2012). Protein ingestion before sleep improves postexercise overnight recovery. Medicine and science in sports and exercise 44(8): 1560-1569. Rodriguez, N. R. (2009). Position of the American Dietetic Association, Dietitians of Canada, and the American College of Sports Medicine: Nutrition and athletic performance. Journal of the American Dietetic Association 109(3): 509-527. Roy, B. (2008). Milk: the new sports drink? A Review. Journal of the International Society of Sports Nutrition 5(1): 15. Sawka, et al. (2007). American College of Sports Medicine position stand. Exercise and fluid replacement. Medicine and science in sports and exercise 39(2): 377-390. Secher, M. (2012). Hydration and cognitive performance. The Journal of nutrition, health & aging 16(4): 325-329. Seifert, J. (2006). Protein added to a sports drink improves fluid retention. International journal of sport nutrition and exercise metabolism 16(4): 420-429. Shi, X. (2010). Water and solute absorption from carbohydrate-electrolyte solutions in the human proximal small intestine: A review and statistical analysis. International journal of sport nutrition and exercise metabolism 20(5): 427-442. Shireffs, S. M., et al. (1996). Post-exercise rehydration in man: effects of volume consumed and drink sodium content. Medicine and science in sports and exercise 28(10): 1260-1271. Shirreffs, S. M. (1994). The effect of posture change on blood volume, serum potassium and whole body electrical impedance. European journal of applied physiology and occupational physiology 69(5): 461-463.

51
Shirreffs, S. M. (1998). Volume repletion after exercise-induced volume depletion in humans: replacement of water and sodium losses. The American journal of physiology 274(5): F868-875. Shirreffs, S. M. (2000). Markers of hydration status. Journal of sports medicine and physical fitness 40(1): 80-84. Shirreffs, S. M. (2003). Markers of hydration status. European journal of clinical nutrition 57(suppl.2): S6-S9. Shirreffs, S. M., et al. (2004). Fluid and electrolyte needs for preparation and recovery from training and competition. Journal of sports sciences 22(1): 57-63. Shirreffs, S. M., et al. (2007). Milk as an effective post-exercise rehydration drink. British journal of nutrition 98(1): 173-180. Silva, R. P. (2011). Fluid balance of elite Brazilian youth soccer players during consecutive days of training. Journal of sports sciences 29(7): 725-732. Utter, A. C. (2010). Effects of rooibos tea, bottled water, and a carbohydrate beverage on blood and urinary measures of hydration after acute dehydration. Research in sports medicine 18(2): 85-96. Vist, G. E. and R. J. Maughan (1995). The effect of osmolality and carbohydrate content on the rate of gastric emptying of liquids in man. Journal of Physiology 486(2): 523-531. Watson, P., et al. (2008). A comparison of the effects of milk and a carbohydrate-electrolyte drink on the restoration of fluid balance and exercise capacity in a hot, humid environment. European journal of applied physiology 104(4): 633-642.
52
9. Appendices A Ethics B Health screening questionnaire C Food diary C Tiredness, hunger and thirst questionnaire D Gastrointestinal symptom questionnaire

53
Appendix A Ethics
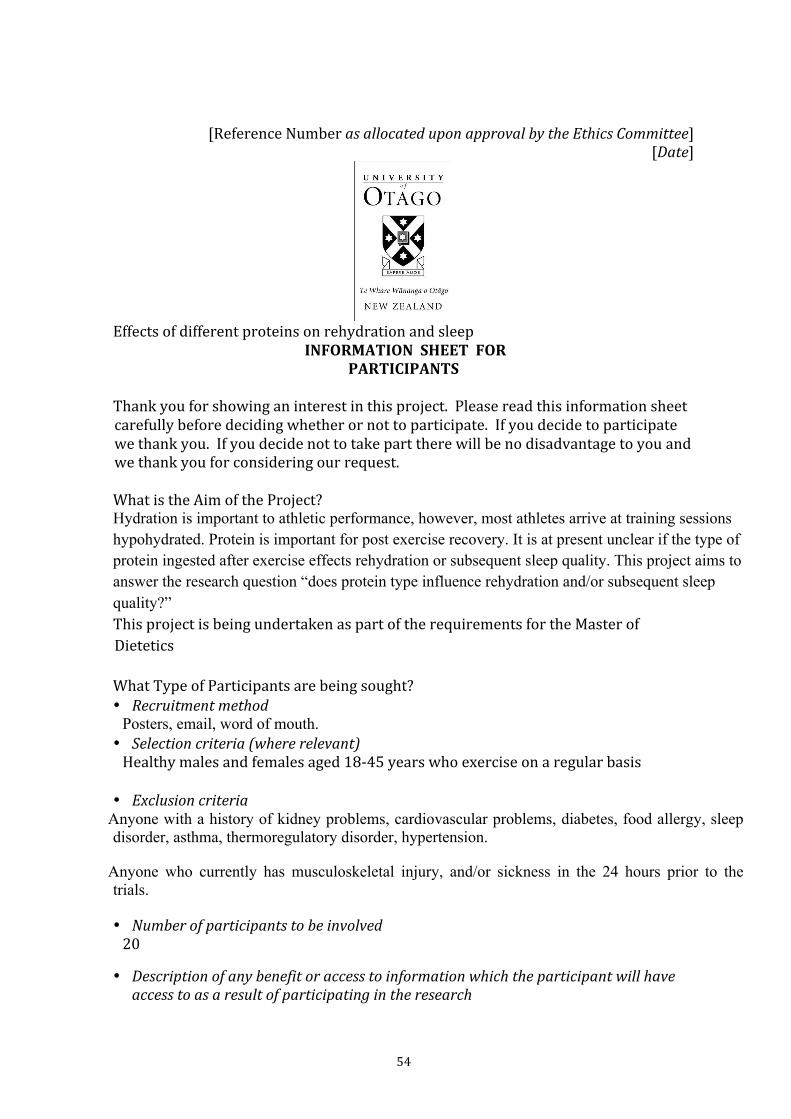
54
[Reference Number as allocated upon approval by the Ethics Committee] [Date]
Effects of different proteins on rehydration and sleep
INFORMATION SHEET FOR PARTICIPANTS
Thank you for showing an interest in this project. Please read this information sheet carefully before deciding whether or not to participate. If you decide to participate we thank you. If you decide not to take part there will be no disadvantage to you and we thank you for considering our request. What is the Aim of the Project? Hydration is important to athletic performance, however, most athletes arrive at training sessions hypohydrated. Protein is important for post exercise recovery. It is at present unclear if the type of protein ingested after exercise effects rehydration or subsequent sleep quality. This project aims to answer the research question “does protein type influence rehydration and/or subsequent sleep quality?” This project is being undertaken as part of the requirements for the Master of Dietetics What Type of Participants are being sought? • Recruitment method
Posters, email, word of mouth. • Selection criteria (where relevant) Healthy males and females aged 18-‐45 years who exercise on a regular basis • Exclusion criteria
Anyone with a history of kidney problems, cardiovascular problems, diabetes, food allergy, sleep disorder, asthma, thermoregulatory disorder, hypertension.
Anyone who currently has musculoskeletal injury, and/or sickness in the 24 hours prior to the trials.
• Number of participants to be involved 20
• Description of any benefit or access to information which the participant will have access to as a result of participating in the research

55
You will be provided with individual feedback on your sweat losses and dietary assessment.
What will Participants be Asked to Do? Should you agree to take part in this project, you will be asked to ...... • Complete 4 trials in random order. For the 24 hours prior to your first trial you will be asked to
keep a food diary and to repeat this diet prior to the remaining 3 trials.
• You should not eat or drink anything for the 4 hours prior to each trial with the exception of 500 mL of water 2 hour prior to arriving at the clinic.
• Upon arrival at the clinic you will be asked to provide a urine sample which will be analysed for hydration status and will then be weighed in minimal clothing and asked to complete a subjective feelings, gastrointestinal comfort and sleep questionnaire.
• Once these measures have been obtained you cycle on a stationary cycle ergometer in the heat (35oC and 50% relative humidity), at a workload equivalent to 2 watts per kg body mass (low to moderate intensity). You will cycle for 10 minutes with 5 minute rest periods, during which time nude body mass will be obtained in private. You will continue cycling until they have lost 1.8 % of your initial body mass (usually around 60-90 minutes).
• You will then shower before another body mass is taken.
• Following this you will be provided with food and given one of four drinks –casein protein, whey protein, trim milk or sports drink. The volume provided will be 1.5 times your body mass losses ie a 1 kg body mass loss = 1.5 litres of drink.
• For the next hour you will sit at rest.
• At the end of exercise, 1, and 2 hours post exercise you will be asked to complete a subjective feelings and gastrointestinal comfort questionnaire, provide a urine sample and will be weighed in minimal clothing.
• At the end of the second hour post exercise you will be provided with a sleep monitor which you will wear around your waist and you will be asked to wear it during the evening and night.
• You will also be provided with a urine containers to collect any urine produced between leaving the clinic and the first urination the following morning, a diary to note the times of urination or any gastrointestinal distress and a sleep questionnaire to complete on waking the following morning.
The time commitment which involvement will entail • Completing the food diary and then repeating your diet before each trial is likely to add about 5 minutes to each drinking and eating occasion.
• The trials are likely to require you to be in the clinic for 3.5 to 4 hours for each trial depending on your sweat rates.
• The urine samples from leaving the clinic to the following morning may take an additional 5 minutes.
• The questionnaire the following morning may take 10 minutes to complete. • Total time per trial around 4.5-‐5 hours * 4 trials = 18-‐20 hours in total.
• Description of discomforts, risks or inconvenience to participants as a result of
participation

56
Exercise always carries some degree of risk however, we will act to minimalise this. The intensity will be reduced to meet your fitness/abilities. Two investigators will be present at all times (at least one will hold a first aid certificate). Please be aware that you may decide not to take part in the project without any disadvantage to yourself of any kind. What Data or Information will be Collected and What Use will be Made of it? • What raw data or information will be collected? We will collect data on your sweat rates and sleep quantity.
• What personal information will be collected? We will collect information on your age, weight, height, sporting activities, training volumes, sex, and ethnicity.
• What are the purposes for which the data or information is being collected? The data is being collected in partial fulfilment of the Master of Dietetics and will be used to form a thesis and potentially a peer reviewed publication.
• Who will have access to the data or information? Only the investigators (Caleb Robinson, Thomas Chung, Dr Katherine Black, Dr Thomas Love and Assoc Prof Nancy Rehrer) will have access to the individual data. • How will data or information be securely managed, stored and destroyed? The data collected will be securely stored in such a way that only those mentioned below will be able to gain access to it. Data obtained as a result of the research will be retained for at least 5 years in secure storage. Any personal information held on the participants such as contact details may be destroyed at the completion of the research even though the data derived from the research will, in most cases, be kept for much longer or possibly indefinitely.
• What data or information will be reflected in the completed research? Data collected from this project will be used to calculate average values for the group and summary statements for the group as a whole. The results of the project may be published and will be available in the University of Otago Library (Dunedin, New Zealand) but every attempt will be made to preserve your anonymity.
• Will the participants have the opportunity to correct or withdraw the data/information?
Upon your completion in the study you will be provided with your data and will be allowed to correct or withdraw data or information if you wish.
• Will participants be provided with the results of the study You will be provided with the results of this study upon its completion.
Can Participants Change their Mind and Withdraw from the Project? You may withdraw from participation in the project at any time and without any disadvantage to yourself of any kind. What if Participants have any Questions?

57
If you have any questions about our project, either now or in the future, please feel free to contact either:-‐ Caleb Robinson email: [email protected]
Thomas Chung email: [email protected] Dr Katherine Black email: [email protected]
Department of Human Nutrition, University Telephone Number:-‐ 034798358 This study has been approved by the University of Otago Human Ethics Committee. If you have any concerns about the ethical conduct of the research you may contact the Committee through the Human Ethics Committee Administrator (ph 03 479 8256). Any issues you raise will be treated in confidence and investigated and you will be informed of the outcome.
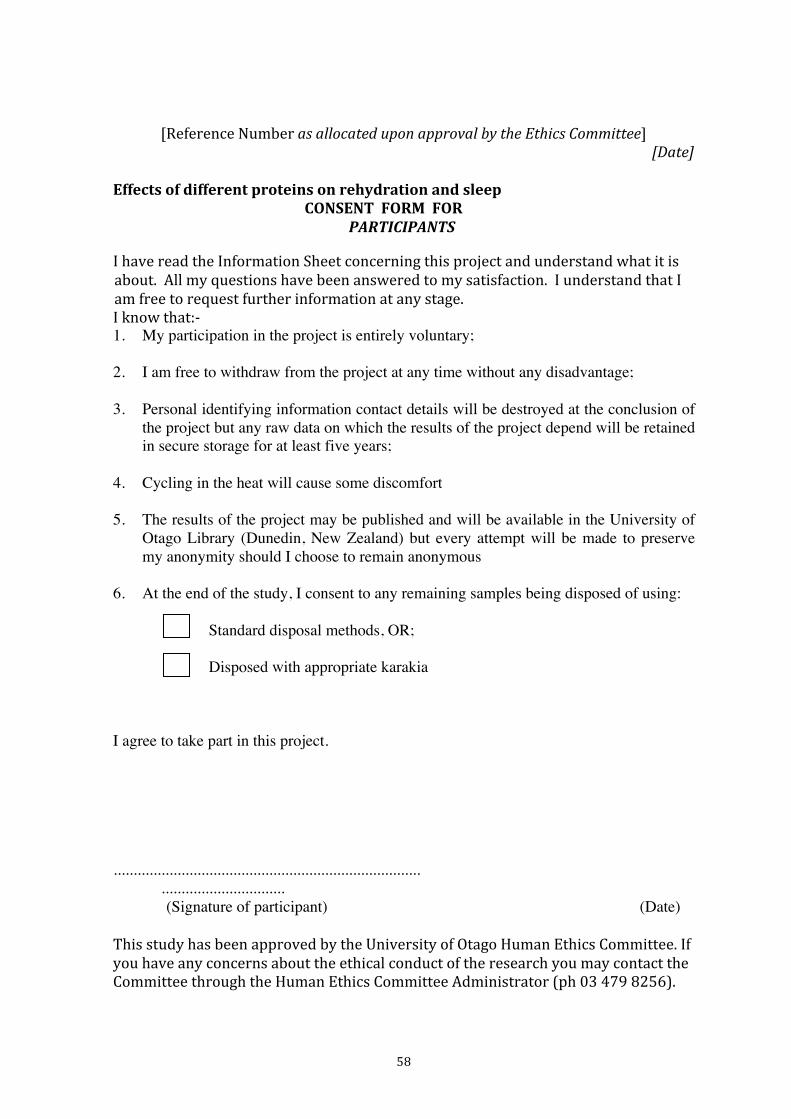
58
[Reference Number as allocated upon approval by the Ethics Committee] [Date]
Effects of different proteins on rehydration and sleep CONSENT FORM FOR
PARTICIPANTS
I have read the Information Sheet concerning this project and understand what it is about. All my questions have been answered to my satisfaction. I understand that I am free to request further information at any stage. I know that:-‐ 1. My participation in the project is entirely voluntary; 2. I am free to withdraw from the project at any time without any disadvantage; 3. Personal identifying information contact details will be destroyed at the conclusion of
the project but any raw data on which the results of the project depend will be retained in secure storage for at least five years;
4. Cycling in the heat will cause some discomfort 5. The results of the project may be published and will be available in the University of
Otago Library (Dunedin, New Zealand) but every attempt will be made to preserve my anonymity should I choose to remain anonymous
6. At the end of the study, I consent to any remaining samples being disposed of using: Standard disposal methods, OR; Disposed with appropriate karakia I agree to take part in this project. .............................................................................
............................... (Signature of participant) (Date) This study has been approved by the University of Otago Human Ethics Committee. If you have any concerns about the ethical conduct of the research you may contact the Committee through the Human Ethics Committee Administrator (ph 03 479 8256).

59
Any issues you raise will be treated in confidence and investigated and you will be informed of the outcome.

60
Appendix B Health Screening questionnaire
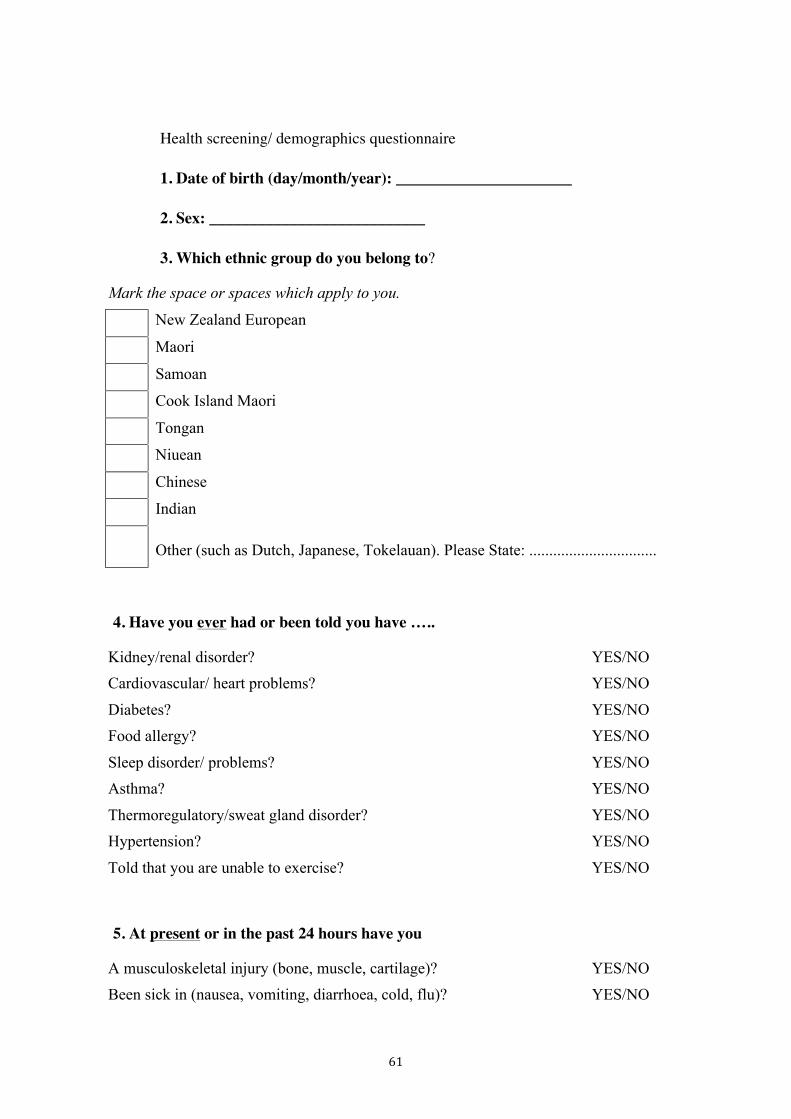
61
Health screening/ demographics questionnaire
1. Date of birth (day/month/year): ______________________
2. Sex: ___________________________
3. Which ethnic group do you belong to?
Mark the space or spaces which apply to you.
New Zealand European
Maori
Samoan
Cook Island Maori
Tongan
Niuean
Chinese
Indian
Other (such as Dutch, Japanese, Tokelauan). Please State: ................................
4. Have you ever had or been told you have …..
Kidney/renal disorder? YES/NO Cardiovascular/ heart problems? YES/NO
Diabetes? YES/NO Food allergy? YES/NO
Sleep disorder/ problems? YES/NO Asthma? YES/NO
Thermoregulatory/sweat gland disorder? YES/NO Hypertension? YES/NO
Told that you are unable to exercise? YES/NO
5. At present or in the past 24 hours have you
A musculoskeletal injury (bone, muscle, cartilage)? YES/NO Been sick in (nausea, vomiting, diarrhoea, cold, flu)? YES/NO

62
6. Have you ever suffered from heat stroke? YES/NO

63
Appendix C Food diary
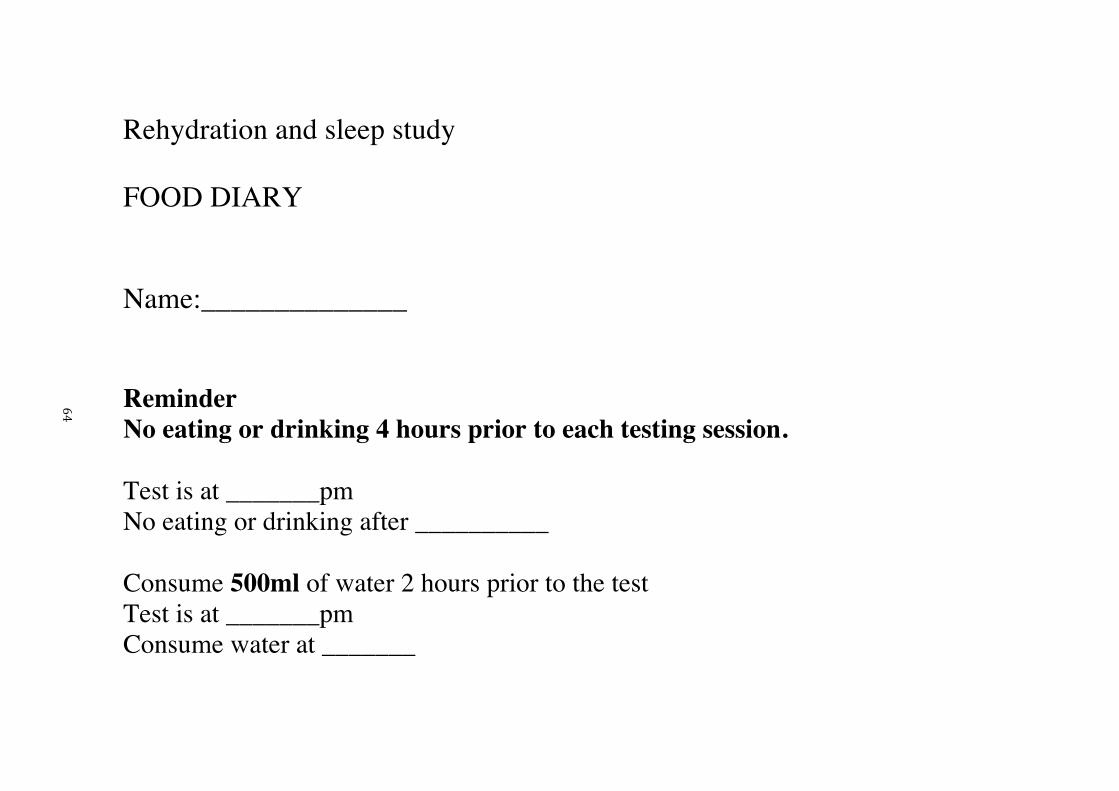
Rehydration and sleep study FOOD DIARY
Name:______________ Reminder No eating or drinking 4 hours prior to each testing session. Test is at _______pm No eating or drinking after __________ Consume 500ml of water 2 hours prior to the test Test is at _______pm Consume water at _______
64

Food Diary
How to fill in your diary
Below is a step-by-step guide on how to fill in your food diary. It is very important that you do not change what you normally eat or drink just
because you are keeping a diary so that we get a true picture of what you eat and drink. Try to fill in the diary each time you have something to eat
or drink rather than leave it until the end of the day so that you don’t forget anything!
Step 1: When
The first thing to do is to find the right time slot in the first column of the diary (on the left) for when you ate or drank something. Then, in the
column next to the time slot, write down the exact time you ate or drank something. So, for example, if you had breakfast at 7.30am, you would go
to the first time slot in the diary (6am to 9am) and in the column next to it write in “7.30am”.
Step 2: What
The next step in the food diary is to describe what you ate or drank, giving as much detail as you can. Include any extras like sugar and milk in your
tea or cereal, butter or other spreads on your bread and sauces such as ketchup and mayonnaise. Do not forget to include drinking water.
If you know the cooking method used (e.g. roast, baked, boiled, fried) please write it down in this section. It would also help us if you can write
down the brand name of any foods or drinks if you know it (e.g. Heinz, Robinsons).
For breakfast cereals, as well as the brand name, please write down the name of the cereal e.g. frosties, cocoa pops, corn flakes.
65
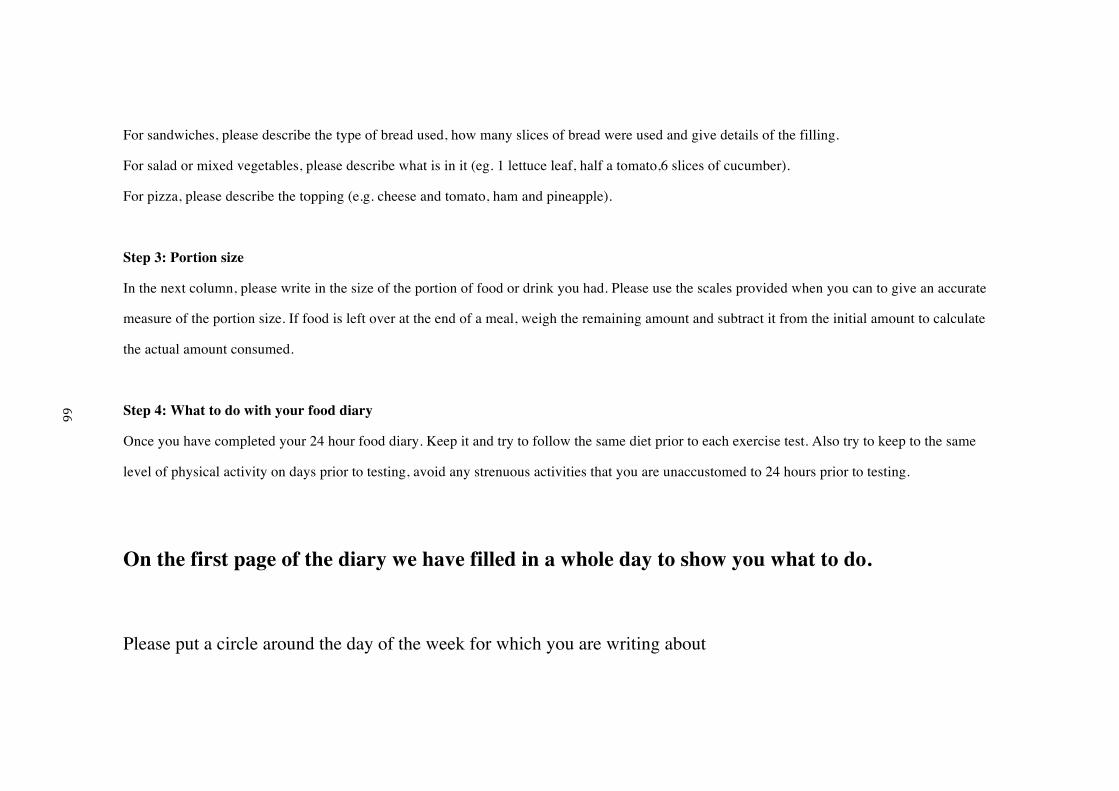
For sandwiches, please describe the type of bread used, how many slices of bread were used and give details of the filling.
For salad or mixed vegetables, please describe what is in it (eg. 1 lettuce leaf, half a tomato,6 slices of cucumber).
For pizza, please describe the topping (e.g. cheese and tomato, ham and pineapple).
Step 3: Portion size
In the next column, please write in the size of the portion of food or drink you had. Please use the scales provided when you can to give an accurate
measure of the portion size. If food is left over at the end of a meal, weigh the remaining amount and subtract it from the initial amount to calculate
the actual amount consumed.
Step 4: What to do with your food diary
Once you have completed your 24 hour food diary. Keep it and try to follow the same diet prior to each exercise test. Also try to keep to the same
level of physical activity on days prior to testing, avoid any strenuous activities that you are unaccustomed to 24 hours prior to testing.
On the first page of the diary we have filled in a whole day to show you what to do.
Please put a circle around the day of the week for which you are writing about
66

Day 1 Day Monday Tuesday Wednesday Thursday Friday Saturday Sunday
Date
Time slot When What Portion size
6am to 9am
8:00
Blackberries Sugar Toast + Flora Jam Apple Juice
10 ¼ teaspoon 1 Slice ½ teaspoon Glass
9am to 12 noon
9 to 10 10:00 11:00
Orange Squash (Robinson’s High Juice) Kellogg’s Fruit Winder Homemade Cup Cake
Sports Bottle 1 1
12 noon to 2pm
12:30
Baked Beans Ham Cheese Toast + Flora Robinson’s High Juice
1 tbsp 1 slice 1 slice 1 slice Beaker
67
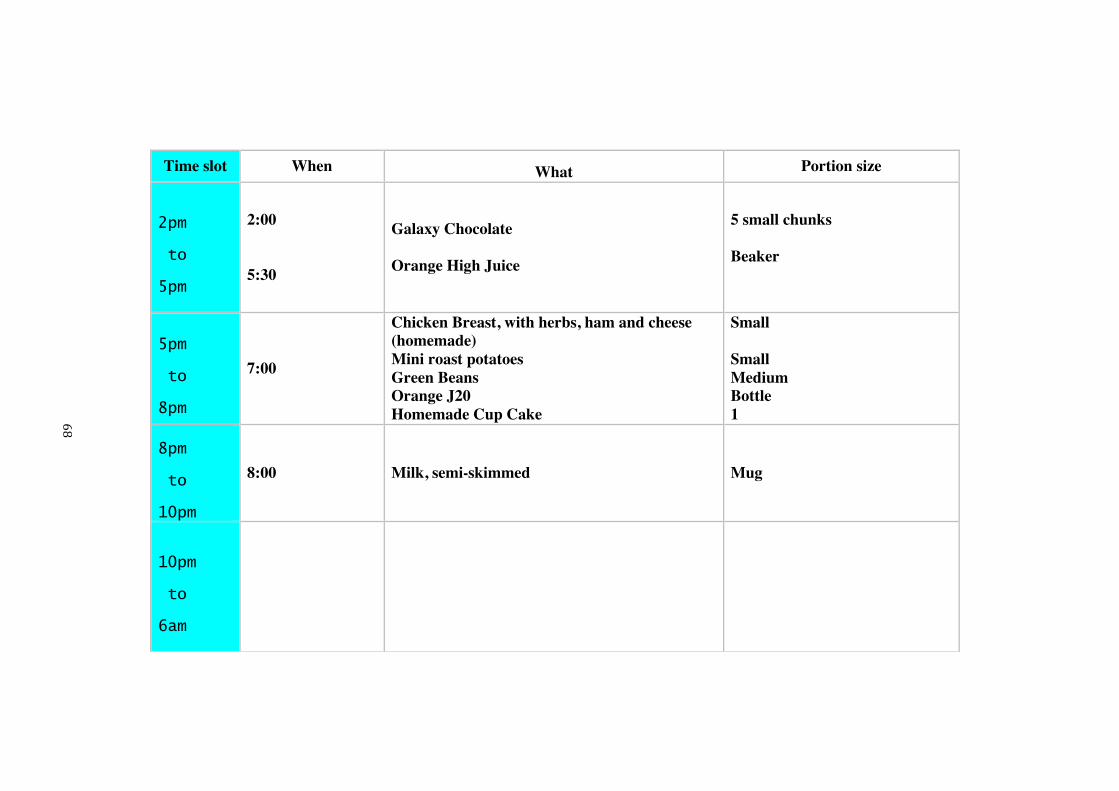
Time slot When What Portion size
2pm to 5pm
2:00 5:30
Galaxy Chocolate Orange High Juice
5 small chunks Beaker
5pm to 8pm
7:00
Chicken Breast, with herbs, ham and cheese (homemade) Mini roast potatoes Green Beans Orange J20 Homemade Cup Cake
Small Small Medium Bottle 1
8pm to 10pm
8:00
Milk, semi-skimmed Mug
10pm to 6am
68

Day 1 Day Monday Tuesday Wednesday Thursday Friday Saturday Sunday
Date
Time slot When What Portion size 2pm to 5pm
5pm to 8pm
8pm to 10pm
10pm to 6am
69
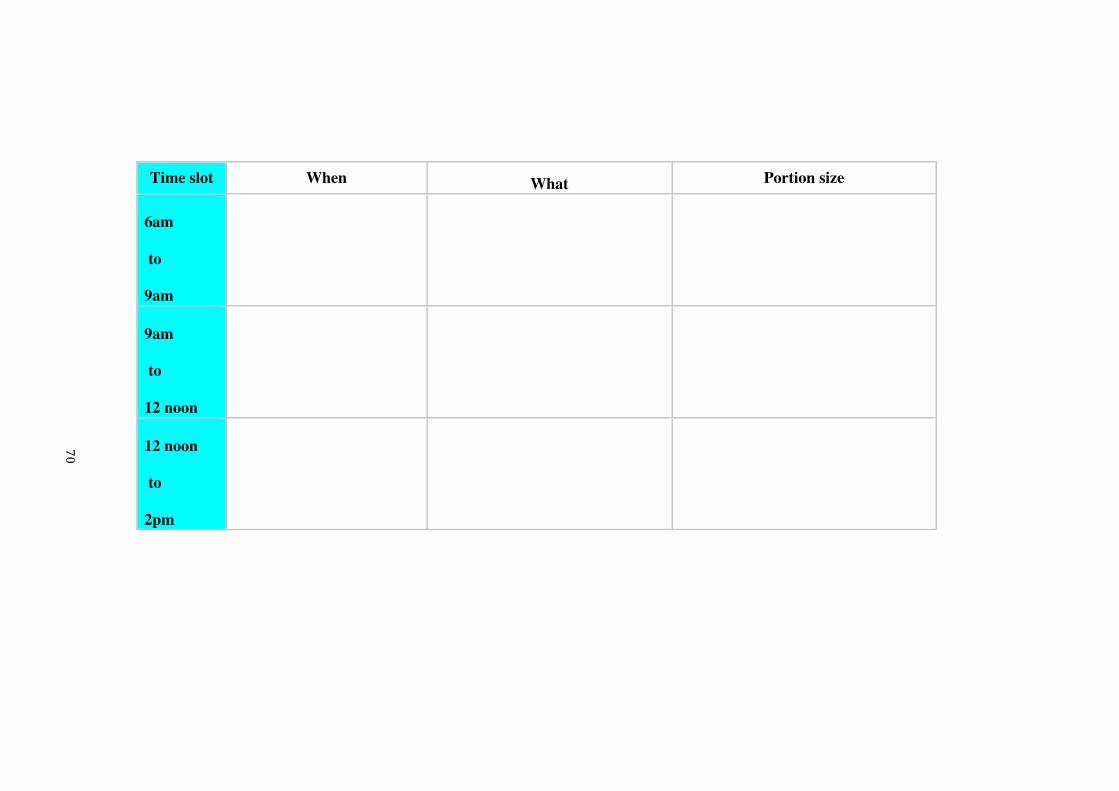
Time slot When What Portion size 6am to 9am
9am to 12 noon
12 noon to 2pm
70

If you have any questions about this diary please contact Katherine, on 4798358,
71

72
Appendix D Thirst hunger and tiredness questionnaire

73
Subjective Feelings (questions 2,3 and 4 only asked post exercise)
Place a vertical mark (|) on the lines below to indicate HOW YOU FEEL AT THE MOMENT.
1) How thirsty do you feel now?
Extremely Not at all thirsty
2) How pleasant was the drink? Extremely pleasant Not at all pleasant
3) How salty was the drink? Extremely salty Not at all salty
4) How sweet was the drink? Extremely sweet Not at all sweet
5) How hungry do you feel now? Not at all hungry Extremely hungry
6) How tired do you feel? Extremely tired Not at all tired

74
Appendix E Gastrointestinal symptom questionnaire
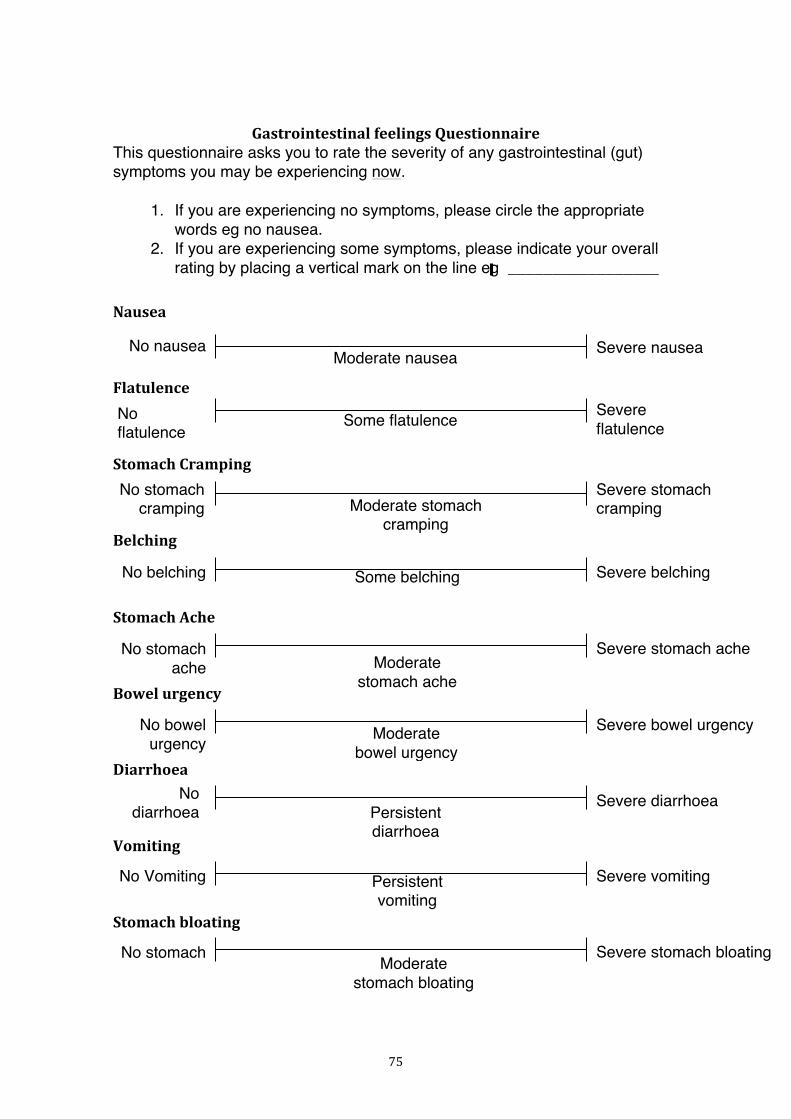
75
Gastrointestinal feelings Questionnaire This questionnaire asks you to rate the severity of any gastrointestinal (gut) symptoms you may be experiencing now.
1. If you are experiencing no symptoms, please circle the appropriate words eg no nausea.
2. If you are experiencing some symptoms, please indicate your overall rating by placing a vertical mark on the line eg _________________
Nausea
Flatulence Stomach Cramping Belching Stomach Ache Bowel urgency Diarrhoea Vomiting Stomach bloating
No nausea Severe nausea
Severe flatulence
No flatulence
Severe stomach cramping
No stomach cramping
Severe belching No belching
Severe stomach ache No stomach ache
Severe bowel urgency No bowel urgency
Severe diarrhoea No diarrhoea
Severe vomiting No Vomiting
Severe stomach bloating No stomach bloating
Moderate nausea
Some flatulence
Moderate stomach cramping
Some belching
Moderate stomach ache
Moderate bowel urgency
Persistent diarrhoea
Persistent vomiting
Moderate stomach bloating
![Alpha-Casein as a Molecular Chaperone · The major protein constituent of casein micelles, accounting for 65% of protein is S-casein [4]. The function of -casein, present at the surface](https://img.pdfslide.us/doc/110x75/5fd57079b24729154a34f060/alpha-casein-as-a-molecular-chaperone-the-major-protein-constituent-of-casein-micelles.jpg)

![A Milk Protein, Casein, as a Proliferation Promoting ... Park, et al: Casein and Prostate Cancer 77 growth factor-1 (IGF-1) [11]. However, among the compo-nents of milk, protein has](https://img.pdfslide.us/doc/110x75/5b034d727f8b9a2e228c30cd/a-milk-protein-casein-as-a-proliferation-promoting-park-et-al-casein-and.jpg)