Embed Size (px)
Citation preview
H. IWAI et al.May 2018 3
1. Introduction
Localized heavy rainfall can often cause flash flooding in densely populated urban areas of Japan. Although the Kanto Plain experiences relatively few thunderstorms in summer in comparison with mountainous areas lying to the north and west of the Kanto Plain (e.g., Horie and Tomine 1998), strong
isolated thunderstorms develop occasionally and are particularly responsible for localized heavy rainfall and flooding in the Tokyo metropolitan area. For example, a thunderstorm that developed on July 21, 1999 in the southern Kanto Plain produced torrential rainfall in the Tokyo metropolitan area (Kobayashi et al. 2001; Kawabata et al. 2007; Seko et al. 2007). The maximum 1-hour rainfall amount was 111 mm at Nerima, and the flash flooding caused by this rainfall drowned one person in a basement. The flash flood-ing at Zoshigaya on August 5, 2008 was caused by isolated thunderstorms with localized heavy rainfall (Kato and Maki 2009; Hirano and Maki 2010; Kim
Journal of the Meteorological Society of Japan, Vol. 96A, pp. 3−23, DOI:10.2151/jmsj.2017-014, 2018Special Issue on Tokyo Metropolitan Area Convection Study for Extreme Weather Resilient Cities (TOMACS)
Case Study on Convection Initiation Associated with an Isolated Convective Storm Developed over Flat Terrain
during TOMACS
Hironori IWAI, Shoken ISHII, Seiji KAWAMURA
National Institute of Information and Communications Technology, Tokyo, Japan
Eiichi SATO, and Kenichi KUSUNOKI
Meteorological Research Institute / Japan Meteorological Agency, Tsukuba, Japan
(Manuscript received 30 September 2016, in final form 14 February 2017)
Abstract
During the Tokyo Metropolitan Area Convection Study for Extreme Weather Resilient Cities (TOMACS), many isolated convective storms developed in the southern Kanto Plain on August 17, 2012. The aim of this study was to clarify the dynamics leading to the convection initiation of one of them using different remote sensing instru-ments.
Before the convection initiation, a southeasterly flow transported water vapor inland from Tokyo Bay and the well-mixed and a cumulus-cloud-topped convective boundary layer developed. A convergence line in the form of a sea breeze front (SBF) also moved inland from Tokyo Bay. A near-surface air parcel was lifted to its lifting condensation level (LCL) by an updraft in a convergence zone with a 3 km horizontal scale, which formed the west edge of the convergence line. The saturated air parcel at the LCL was then lifted to its level of free con-vection (LFC) by the updrafts associated with thermals below the cumulus cloud base. A Ku-band radar detected the first echo of hydrometeors about 6 minutes after the air parcel reached its LFC, then the convective cell de-veloped rapidly. When an SBF arriving from Sagami Bay passed under the cell, the updraft over the nose of the SBF triggered a new precipitation cell, but no intensification of the preexisting cell was observed.
Keywords convection initiation; convergence line; sea breeze front; remote sensing
Corresponding author: Hironori Iwai, National Institute of Information and Communications Technology, 4-2-1, Nukuikita, Koganei, Tokyo 184-8795, JapanE-mail: [email protected] Advance Published Date: 26 April 2017
©The Author(s) 2018. This is an open access article published by the Meteorological Society of Japan under a Creative Commons Attribution 4.0 International (CC BY 4.0) license (http://creativecommons.org/license/by/4.0).
Journal of the Meteorological Society of Japan Vol. 96A4
et al. 2012; Ishihara 2012a, b). The flooding drowned five persons. Fujibe et al. (2002) have shown that a converging airflow pattern, which consists of easterly wind from Kashima-nada and southerly wind from Tokyo Bay and Sagami Bay, often tends to precede the onset of heavy rainfall in Tokyo. In the above cases of localized heavy rainfall at Nerima and Zoshigaya, deep convection was triggered by low-level conver-gence lines.
Convergence lines (regions of low-level conver-gence of air arranged along a line; Bennett et al. 2006) are sometimes precursors to convection initiation in the absence of large-scale forcing. Using Doppler radar data in the plains of eastern Colorado, Wilson and Schreiber (1986) showed that convergence lines could be identified as lines of enhanced radar reflectiv-ity and that convection initiation was closely related to the convergence lines. Examples of convergence lines include outflow boundaries (e.g., Kingsmill 1995), drylines (e.g., Ziegler et al. 1997), cold fronts (e.g., Koch and Clark 1999), and sea breezes (e.g., Lher-mitte and Gilet 1975). Sea breeze fronts (SBFs) are boundaries between the warm air over the land and the cool marine air, and the associated convergence lines can sometimes trigger convection along SBFs. There have been a large number of studies on sea-breeze- induced convection initiation in the United States. In the Convection and Precipitation/Electrification (CaPE) project, which was carried out in Florida during the summer of 1991, Wakimoto and Atkins (1994) and Atkins et al. (1995) showed that intersec-tions of horizontal convective rolls with SBFs were preferential areas of convection initiation.
The Kanto Plain is known for sea breezes resulting in convergence lines, and the SBFs are important triggering mechanisms of deep convection. However, only a few detailed observational studies of con-vection initiation associated with sea breezes have been reported. Kobayashi et al. (2007) observed an isolated cumulonimbus initiation using an X-band Doppler radar and Doppler sodars in the Tokyo met-ropolitan area in the summer of 2004. They showed that convection initiation triggered by a surface wind shear line formed in a heat low, and a radar echo was intensified by a stationary SBF. Kusunoki et al. (2012) reported a case study of convection initiation using a C-band Doppler radar in the Tokyo metropolitan area in the summer of 2011. They showed that several con-vections initiated along convergence lines organized as an SBF moving inland from Tokyo Bay. The above studies showed that sea breezes play an important role in the initiation and development of convection in the
Kanto Plain.The prediction of small-scale convective storms
with weak forcing is still a challenge in numerical weather prediction (Kawabata et al. 2011). A major difficulty in predicting convective storms is in pre-dicting the timing and location of new convection. The mechanisms leading to convection initiation are inadequately understood in the Kanto Plain because it is difficult to observe the mesoscale pre-storm environment, particularly for features such as con-vergence lines. Field experiments were performed on convection initiation in the Great Plains of the United States (the International H2O Project (IHOP); Weck-werth et al. 2004), the southern United Kingdom (the Convective Storm Initiation Project; Browning et al. 2007), and the southwestern Germany and eastern France (the Convective and Orographically-induced Precipitation Study (COPS); Wulfmeyer et al. 2008). Although there are similarities between the mecha-nisms leading to convection initiation in the Kanto Plain and those described in the previous studies, the dominant factors may be different because the Kanto Plain is a highly developed and urbanized area with a relatively flat topography and fronts the Pacific Ocean, Tokyo Bay, and Sagami Bay.
This study is based on data from a field program called the Tokyo Metropolitan Area Convection Study for Extreme Weather Resilient Cities (TOMACS; Na-katani et al. 2015). The aim of TOMACS is to collect data to help improve the monitoring and prediction of extreme weather as a step toward decreasing the damage caused by severe local weather phenomena such as wind gusts and floods (Maki et al. 2012). In this paper, we present an observational case study of an isolated convective storm that formed over the southern Kanto Plain on August 17, 2012. The structure and evolution of isolated convective storms are important topics of active research; however, in this study, we focus only on the early stages of the convective storm. The goal of this study is to clarify the dynamics leading to the convection initiation of the storm using different remote sensing instruments. The key measurement systems used in this study were a Doppler lidar, a wind profiler radar (WPR), a Ku-band radar, and a C-band radar. The Ku-band radar provided the detailed features of the initiation and development of deep convection. The Doppler lidar and C-band radar detected convergence lines caused by the initiation of deep convection. Using a vertical beam, the WPR directly and continuously observed an air parcel that reached its lifting condensation level (LCL) and level of free convection (LFC) and
H. IWAI et al.May 2018 5
then rose with a significant updraft. Direct and con-tinuous observations of rising air parcels resulting in convection initiation have rarely been made in previous studies. Although Karan and Knupp (2006) and Demoz et al. (2006) observed vertical velocities at convergence lines using WPRs during IHOP, they could not observe the vertical velocities at locations of convection initiation. In situ aircraft and airborne Doppler radar observations of vertical velocities at convergence lines were conducted during IHOP and COPS (e.g., Wakimoto et al. 2006; Behrendt et al. 2011). Although airborne instruments yield a spatially detailed description of the convergence line structure, continuous measurements at locations of convection initiation are difficult. Therefore, observational data and knowledge at the location of convection initiation obtained by the present case study are important and valuable.
Section 2 describes a summary of observational data. Section 3 presents the evolution of deep con-vection based on the C-band and Ku-band radar data and the synoptic conditions. Section 4 presents observational results leading to convection initiation, with discussion provided in Section 5. A summary and conclusions follow in Section 6.
2. Observational data
The TOMACS field campaign was conducted in the summer of 2011 to 2013 in the Tokyo metropolitan area (Fig. 1). The remote sensing instruments used in this study are listed in Table 1.
2.1 Doppler lidarA Doppler lidar was developed to measure CO2
concentration and radial wind speed (Ishii et al. 2010). It was stationed on the rooftop of a building at the National Institute of Information and Communications Technology (NICT) headquarters (35.71°N, 139.49°E, height 75 m above mean sea level (AMSL), denoted by the open square in Fig. 1), 20 m above ground level (AGL). A 2-μm conductively cooled, laser diode pumped single-frequency Q-switched Tm, Ho:YLF laser (Mizutani et al. 2015) was used in the Doppler lidar to make long-range CO2 and wind measure-ments. The accuracy and precision of Doppler velocity measurements have been verified by Iwai et al. (2013). In this experiment, the Doppler lidar range gates had a length of about 76 m with the center of the first gate at 150 m. With 80 range gates per beam, the maximum range was about 6 km depending on the aerosol load present. Plan position indicator (PPI) and range-height indicator (RHI) scans were performed.
2.2. WPRA WPR was developed on the base of the 1.3-
GHz WPR referred to as LQ-7 (Imai et al. 2007). The location of the WPR was about 450 m south of the Doppler lidar. The WPR has a phased array antenna composed of four Luneburg lenses of 800 mm diam-eter. The center frequency is 1357.5 MHz, and the peak output power is 1600 W. Each lens has five feeds directed toward the vertical direction and four inclined directions (north, east, south, and west) with a zenith angle of 14°. The WPR measured radial velocities at each beam direction with a range resolution of 100 m every 1 minute. The maximum range is 8 km with 80 range gates per beam. The horizontal winds are estimated by the Doppler beam swinging (DBS) technique from four inclined beams. WPRs are sensi-tive to refractive index fluctuations in clear air. In the boundary layer, humidity mainly affects the refractive index.
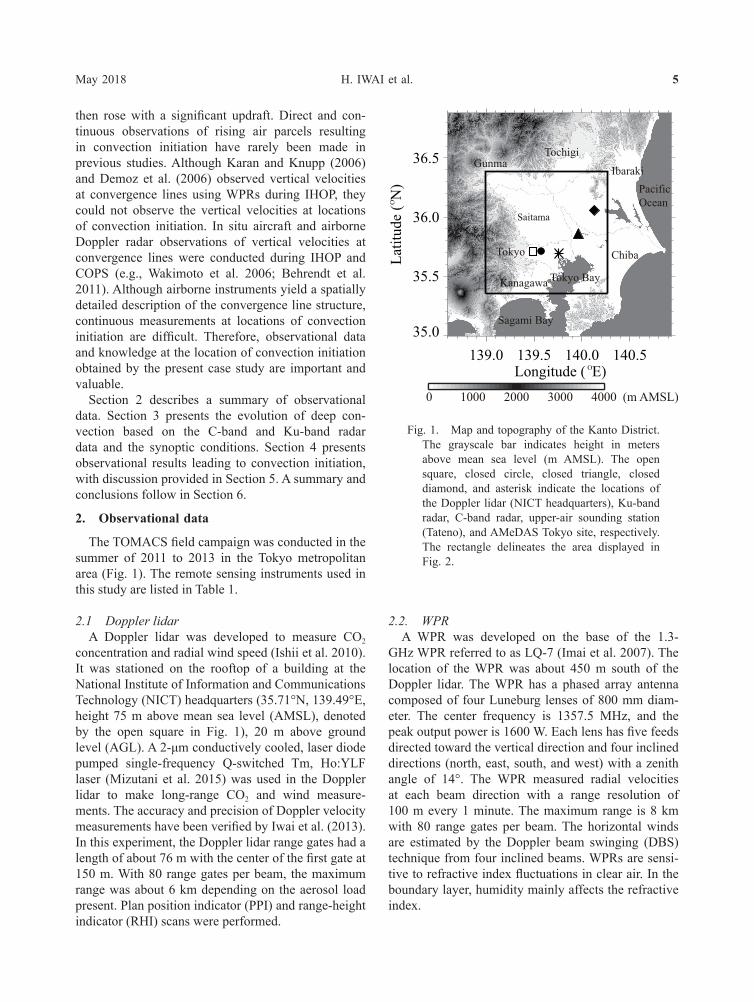
Fig. 1. Map and topography of the Kanto District. The grayscale bar indicates height in meters above mean sea level (m AMSL). The open square, closed circle, closed triangle, closed diamond, and asterisk indicate the locations of the Doppler lidar (NICT headquarters), Ku-band radar, C-band radar, upper-air sounding station (Tateno), and AMeDAS Tokyo site, respectively. The rectangle delineates the area displayed in Fig. 2.
139.0 139.5 140.0 140.5Longitude ( OE)
35.0
35.5
36.0
36.5
Latit
ude
(ON
)
Tokyo
Kanagawa
Chiba
Ibaraki
Saitama
TochigiGunma
Sagami Bay
Tokyo Bay
Pacific Ocean
0 1000 400030002000 (m AMSL)
Journal of the Meteorological Society of Japan Vol. 96A6
2.3 Ku-band radarA Ku-band radar was installed on the roof of a
building of Seikei University, Musashino, Tokyo, Japan (35.62°N, 139.36°E, height 65 m AMSL denot-ed by the closed circle in Fig. 1) and operated by the Meteorological Research Institute (MRI; Sato et al. 2013). To achieve a high range resolution (2.38 m), the Ku-band radar transmits and receives wideband [80 MHz (max)] signals at 15.75 GHz using pulse com-pression (Mega et al. 2007; Yoshikawa et al. 2010). The Ku-band radar has a bistatic antenna system composed of two primary feeds and two 450-mm-di-ameter Luneburg lenses with a beamwidth of 3°. The Ku-band radar was operated in the spiral scan mode to observe radar reflectivities and Doppler velocities in the whole sky with an update rate of about 1 minute. Although the maximum observation range (19.5 km) is limited due to strong precipitation attenuation in the Ku band, the Ku-band radar can observe the precipi-tation with high temporal and spatial resolution. The observed radar reflectivities and Doppler velocities are interpolated in a Cartesian grid system with a hori-zontal and vertical spacing of 200 m using a Cressman weighting function (Cressman 1959).
2.4 C-band radar The Japan Meteorological Agency (JMA) C-band
operational radar is located in Kashiwa, Chiba, Japan (35.86°N, 139.96°E, height 74 m AMSL denoted by the closed triangle in Fig. 1). The range and azimuthal resolutions are 500 m and 0.7°, respectively. Doppler velocity and radar reflectivity data were collected at 13 and 26 elevations every 10 minutes, respectively. The C-band radar, which has high sensitivity, provid-ed the observations of optically clear-air echoes in the boundary layer. Convergence lines are typically formed as lines of enhanced radar reflectivity with a width of 1 – 3 km (e.g., Wilson and Schreiber 1986). The clear-air echoes have radar reflectivity values of over 0 dBZ, and typical values are 10 – 20 dBZ over the Kanto Plain (Kusunoki and Matsumura 1999; Kusunoki 2002).
2.5 Other instruments and dataAn in situ surface meteorological sensor (Vaisala
WXT520) was mounted on a tower at the NICT headquarters (55 m AGL) for measuring wind speed and direction, barometric pressure, temperature, and relative humidity. The location of the sensor was about 120 m south of the Doppler lidar. Data are
Table 1. Key observing systems including their locations, supporting institution, and specifications.
Instrument Doppler lidar WPR Ku-band radar C-band radarLocation 35.71°N
139.49°E95 m AMSL
35.71°N139.49°E75 m AMSL
35.62°N139.36°E65 m AMSL
35.86°N139.96°E74 m AMSL
Institution NICT NICT MRI JMAWavelength (lidar)Frequency (radar)
2.05125 µm 1.3575 GHz 15.75 GHz 5.3625 GHz
Antenna Optical telescope Four Luneburg lenses Two Luneburg lenses (Bistatic)
Parabolic antenna
Quantities measured or calculated
Doppler velocitySNR (clear air)
Vertical velocitySNRHorizontal windDoppler spectra(precipitation and clear air)
Doppler velocityRadar reflectivity(precipitation)
Doppler velocityRadar reflectivity(precipitation and clear air)
Measurement range 0.15 to 6 km (horizontal)surface to 4 km (height)
0.1 to 8 km (height) 19.5 km (horizontal)19.5 km(maximum height)
400 km (horizontal)
Range / Azimuth resolution
76 m / 2° 100 m / – 2.38 m / 3° 500 m / 0.7°
Temporal resolution 2 minutes (PPI)1 minute (RHI)
About 1 minute(5 beams)
About 1 minute(Spiral scan)
10 minutes
H. IWAI et al.May 2018 7
recorded every minute. A ceilometer (Vaisala CT25K) was deployed on the ground and placed about 50 m northwest of the Doppler lidar. It measures the optical backscattering coefficient of the air at a wavelength of 905 nm. It can retrieve cloud base heights every 15 seconds up to 7.5 km above the ground with a vertical resolution of 30 m.
Surface meteorological data observed using the Automated Meteorological Data Acquisition System (AMeDAS) Tokyo site (35.69°N, 139.76°E, height 6.1 m AMSL denoted by the asterisk in Fig. 1), MTSAT- 1R data, upper sounding data at Tateno (36.05°N, 140.13°E, height 31 m AMSL; denoted by the closed diamond in Fig. 1), mesoscale objective analysis (MANAL) data, and weather charts published by the JMA were also used for the analysis. Geolocation errors in the MTSAT-1R visible images were correct-ed by match-ups comparing coastlines indicated in the images with their known geographic locations (Saito et al. 2013). The MANAL data includes 3-hourly wind velocities, temperature, and relative humidity with a horizontal grid spacing of 5 km and 15 vertical pressure layers (Saito et al. 2006; JMA 2013). The observation errors for conventional observations and WPRs are summarized in Table 2.6.2a in JMA (2013).
3. Overview of August 17, 2012
3.1 Evolution of deep convectionOn August 17, convective rainfall had already
begun in the morning in the surrounding mountainous areas lying to the north and west of the Kanto Plain. At 1400 Local Standard Time (LST), convective rainfall also began in the northern part of the Kanto Plain (Fig. 2a). Clear-air echoes were detected within the 30-km range of the C-band radar. The radar re-flectivity field showed no echoes around the Doppler lidar site. At 1450 LST, a weak radar echo formed at 2 km west of the Doppler lidar site (Fig. 2b), but it had dissipated 10 minutes later (not shown). An examined isolated convective storm was initiated at 1545 LST (Fig. 2c) and slowly moved to the west. The storm rapidly became enhanced, having a diameter of 10 km, with a maximum radar reflectivity of 57 dBZ (Fig. 2d).
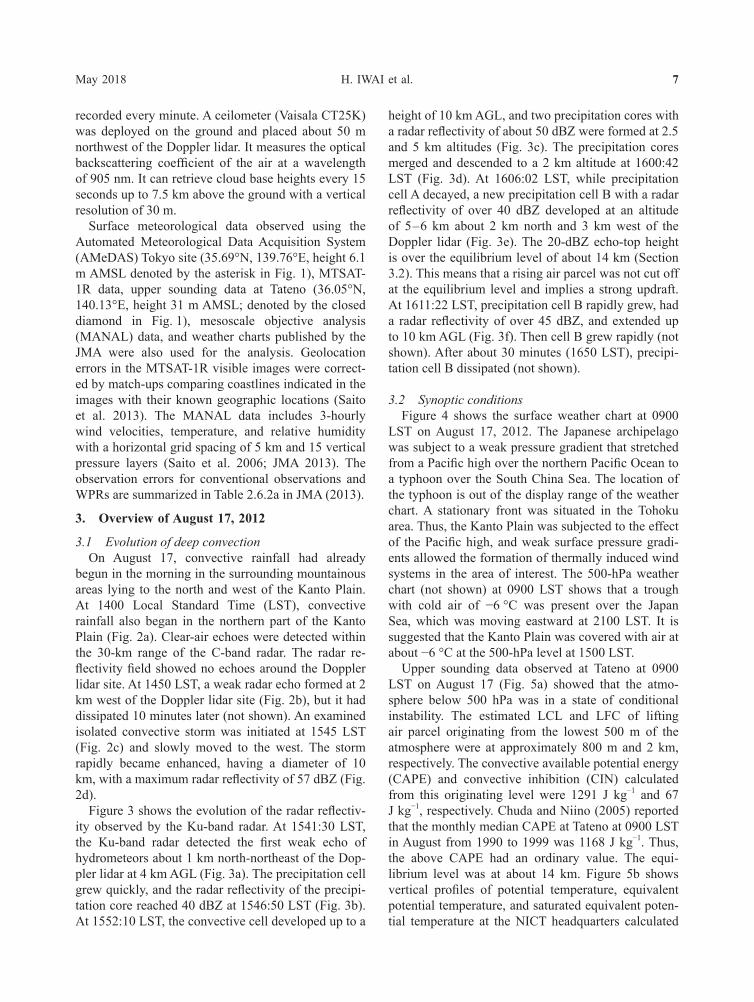
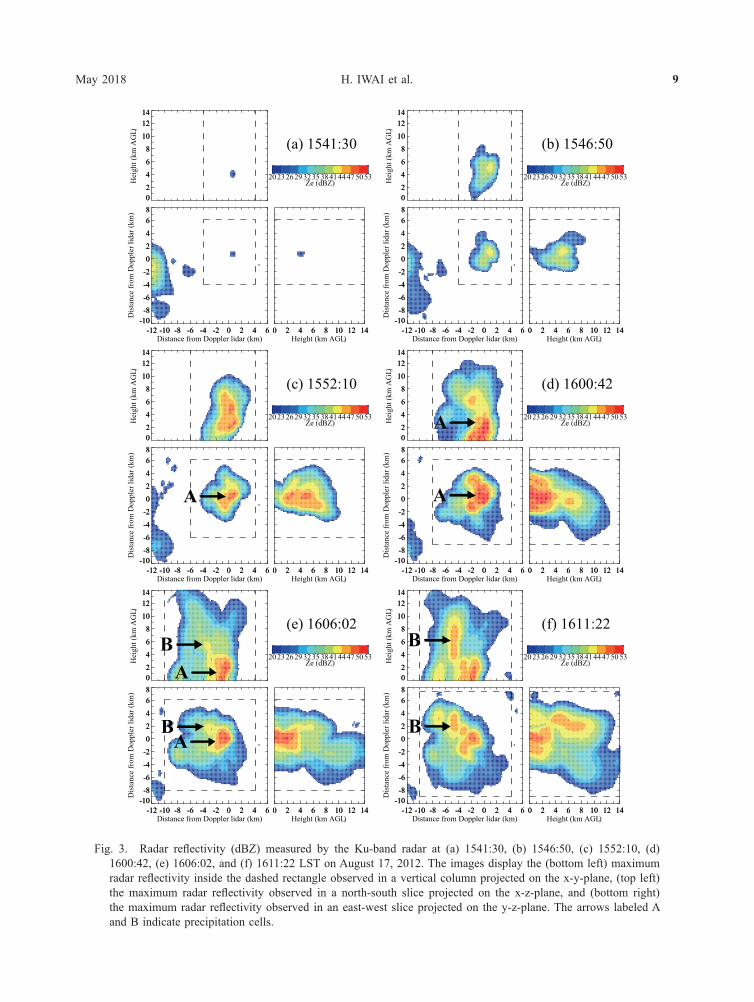
Figure 3 shows the evolution of the radar reflectiv-ity observed by the Ku-band radar. At 1541:30 LST, the Ku-band radar detected the first weak echo of hydrometeors about 1 km north-northeast of the Dop-pler lidar at 4 km AGL (Fig. 3a). The precipitation cell grew quickly, and the radar reflectivity of the precipi-tation core reached 40 dBZ at 1546:50 LST (Fig. 3b). At 1552:10 LST, the convective cell developed up to a
height of 10 km AGL, and two precipitation cores with a radar reflectivity of about 50 dBZ were formed at 2.5 and 5 km altitudes (Fig. 3c). The precipitation cores merged and descended to a 2 km altitude at 1600:42 LST (Fig. 3d). At 1606:02 LST, while precipitation cell A decayed, a new precipitation cell B with a radar reflectivity of over 40 dBZ developed at an altitude of 5 – 6 km about 2 km north and 3 km west of the Doppler lidar (Fig. 3e). The 20-dBZ echo-top height is over the equilibrium level of about 14 km (Section 3.2). This means that a rising air parcel was not cut off at the equilibrium level and implies a strong updraft. At 1611:22 LST, precipitation cell B rapidly grew, had a radar reflectivity of over 45 dBZ, and extended up to 10 km AGL (Fig. 3f). Then cell B grew rapidly (not shown). After about 30 minutes (1650 LST), precipi-tation cell B dissipated (not shown).
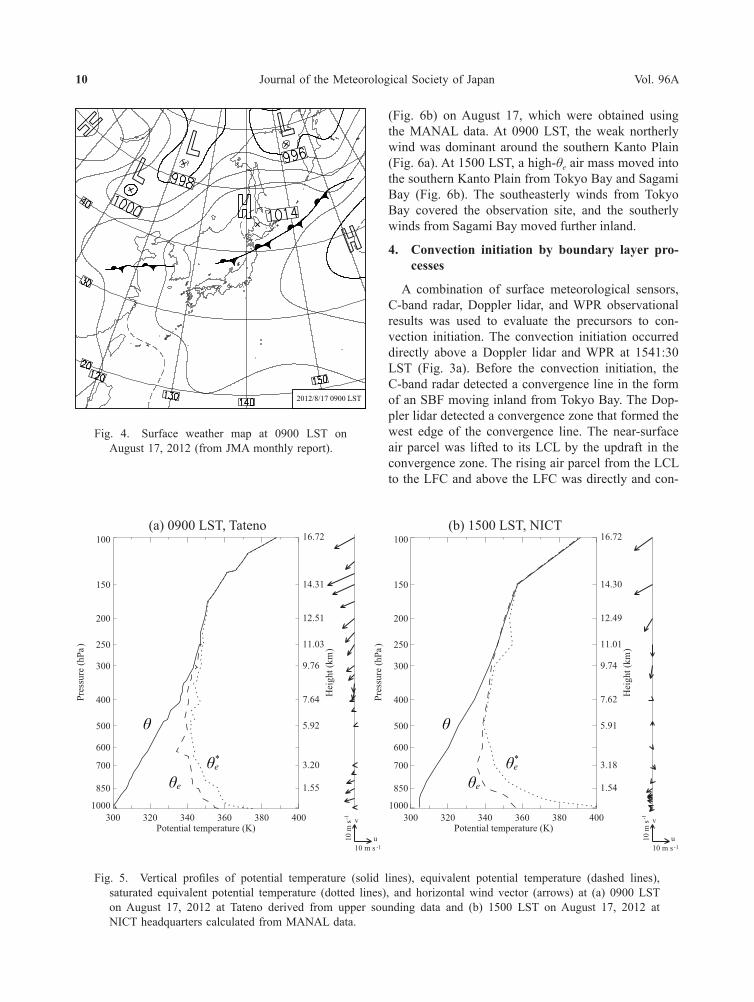
3.2 Synoptic conditionsFigure 4 shows the surface weather chart at 0900
LST on August 17, 2012. The Japanese archipelago was subject to a weak pressure gradient that stretched from a Pacific high over the northern Pacific Ocean to a typhoon over the South China Sea. The location of the typhoon is out of the display range of the weather chart. A stationary front was situated in the Tohoku area. Thus, the Kanto Plain was subjected to the effect of the Pacific high, and weak surface pressure gradi-ents allowed the formation of thermally induced wind systems in the area of interest. The 500-hPa weather chart (not shown) at 0900 LST shows that a trough with cold air of −6 °C was present over the Japan Sea, which was moving eastward at 2100 LST. It is suggested that the Kanto Plain was covered with air at about −6 °C at the 500-hPa level at 1500 LST.
Upper sounding data observed at Tateno at 0900 LST on August 17 (Fig. 5a) showed that the atmo-sphere below 500 hPa was in a state of conditional instability. The estimated LCL and LFC of lifting air parcel originating from the lowest 500 m of the atmosphere were at approximately 800 m and 2 km, respectively. The convective available potential energy (CAPE) and convective inhibition (CIN) calculated from this originating level were 1291 J kg−1 and 67 J kg−1, respectively. Chuda and Niino (2005) reported that the monthly median CAPE at Tateno at 0900 LST in August from 1990 to 1999 was 1168 J kg−1. Thus, the above CAPE had an ordinary value. The equi-librium level was at about 14 km. Figure 5b shows vertical profiles of potential temperature, equivalent potential temperature, and saturated equivalent poten-tial temperature at the NICT headquarters calculated
Journal of the Meteorological Society of Japan Vol. 96A8
from MANAL data about 40 minutes before the storm developed over the NICT headquarters (1500 LST). The atmosphere below the 500-hPa level was in a state of conditional instability. By this time, the CAPE had increased to approximately 2000 J kg−1, and the CIN was approximately 100 J kg−1. While the LCL ascended to approximately 1.5 km, the LFC slightly descended to approximately 1.8 km. Although the CAPE became high, a strong trigger is necessary for the occurrence of storms over a flat terrain to lift low- level moist air to the LFC. The equilibrium level was at about 14 km, which is the same as that at 0900 LST at Tateno. If convection reached the LFC, it would have been possible for deep convective clouds to
develop. The wind profile at 0900 LST at Tateno was characterized by moderate east-northeasterly flow below 3 km, and the vertical wind shear between the lowest layer and 1 km was approximately 5 × 10⁻³ s−1. Between 3 and 7 km, there was weak wind. At 1500 LST at the NICT headquarters, a weak east-southeast-erly to east-northeasterly flow blew below 2 km, and the vertical wind shear between the lowest layer and 1 km was approximately 2 × 10⁻³ s−1. Between 2 and 8 km, there was weak wind. Therefore, the vertical wind shear was weak.
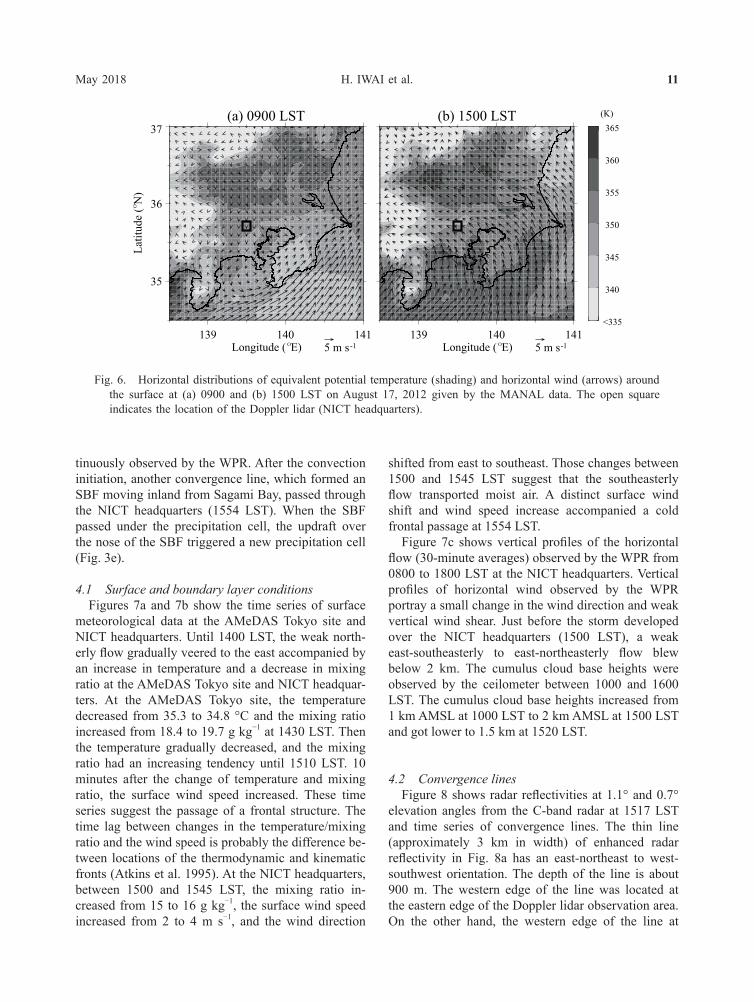
Figure 6 shows the horizontal distribution of equiv-alent potential temperature (θe) and horizontal wind near the surface at 0900 LST (Fig. 6a) and 1500 LST
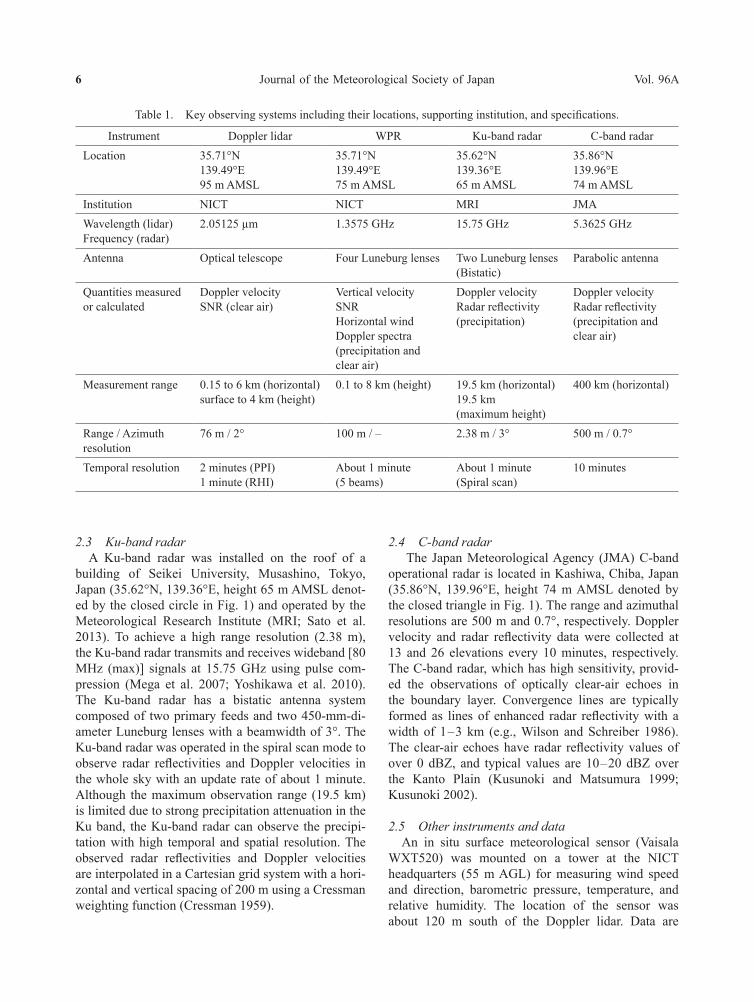
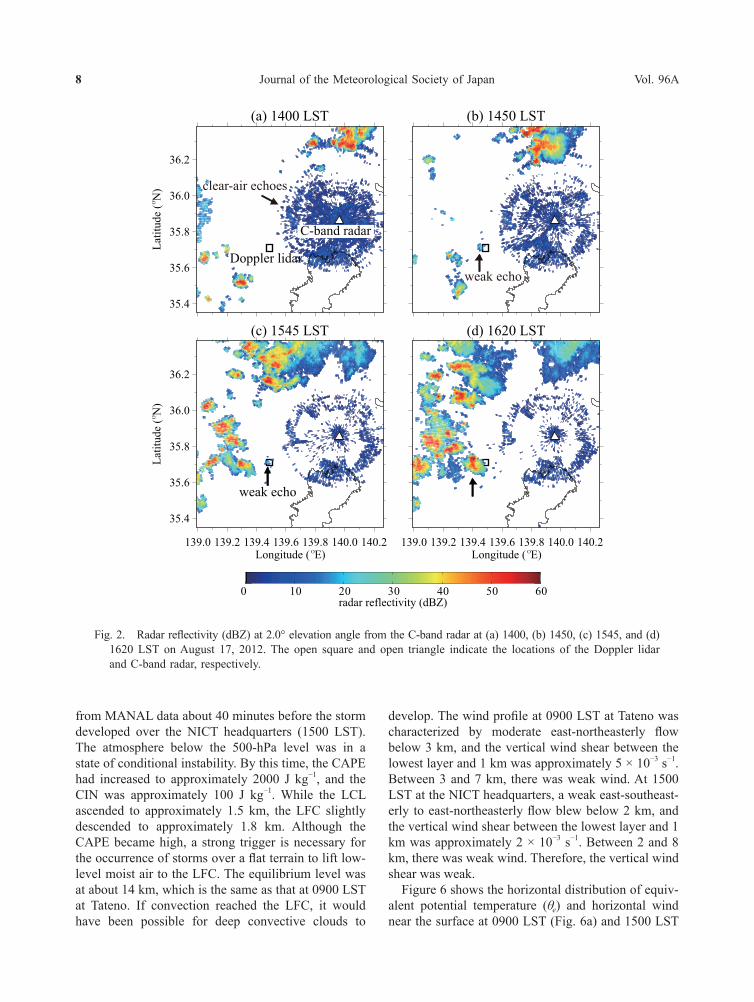
Fig. 2. Radar reflectivity (dBZ) at 2.0° elevation angle from the C-band radar at (a) 1400, (b) 1450, (c) 1545, and (d) 1620 LST on August 17, 2012. The open square and open triangle indicate the locations of the Doppler lidar and C-band radar, respectively.
(a) 1400 LST
35.4
35.6
35.8
36.0
36.2La
titud
e (O
N)
(b) 1450 LST
(c) 1545 LST
139.0 139.2 139.4 139.6 139.8 140.0 140.2Longitude ( OE)
35.4
35.6
35.8
36.0
36.2
Latit
ude
(ON
)
(d) 1620 LST
139.0 139.2 139.4 139.6 139.8 140.0 140.2Longitude ( OE)
0 10 20 30 40 50 60
radar reflectivity (dBZ)
clear-air echoes
Doppler lidar
C-band radar
weak echo
weak echo
H. IWAI et al.May 2018 9
Fig. 3. Radar reflectivity (dBZ) measured by the Ku-band radar at (a) 1541:30, (b) 1546:50, (c) 1552:10, (d) 1600:42, (e) 1606:02, and (f) 1611:22 LST on August 17, 2012. The images display the (bottom left) maximum radar reflectivity inside the dashed rectangle observed in a vertical column projected on the x-y-plane, (top left) the maximum radar reflectivity observed in a north-south slice projected on the x-z-plane, and (bottom right) the maximum radar reflectivity observed in an east-west slice projected on the y-z-plane. The arrows labeled A and B indicate precipitation cells.
-12 -10 -8 -6 -4 -2 0 2 4 6Distance from Doppler lidar (km)
-10-8
-6
-4
-20
2
4
68
Dis
tanc
e fr
om D
oppl
er li
dar (
km)
-12 -10 -8 -6 -4 -2 0 2 4 6-10-8
-6
-4
-20
2
4
6802
4
6
810
1214
Hei
ght (
km A
GL)
02
4
6
810
1214
0 2 4 6 8 10 12 14Height (km AGL)
0 2 4 6 8 10 12 14
(a) 1541:30
202326293235384144475053
Ze (dBZ)
-12 -10 -8 -6 -4 -2 0 2 4 6Distance from Doppler lidar (km)
-10-8
-6
-4
-20
2
4
68
Dis
tanc
e fr
om D
oppl
er li
dar (
km)
-12 -10 -8 -6 -4 -2 0 2 4 6-10-8
-6
-4
-20
2
4
6802
4
6
810
1214
Hei
ght (
km A
GL)
02
4
6
810
1214
0 2 4 6 8 10 12 14Height (km AGL)
0 2 4 6 8 10 12 14
(b) 1546:50
202326293235384144475053
Ze (dBZ)
-12 -10 -8 -6 -4 -2 0 2 4 6Distance from Doppler lidar (km)
-10-8
-6
-4
-20
2
4
68
Dis
tanc
e fr
om D
oppl
er li
dar (
km)
-12 -10 -8 -6 -4 -2 0 2 4 6-10-8
-6
-4
-20
2
4
6802
4
6
8
10
1214
Hei
ght (
km A
GL)
02
4
6
8
10
1214
0 2 4 6 8 10 12 14Height (km AGL)
0 2 4 6 8 10 12 14
(c) 1552:10
202326293235384144475053
Ze (dBZ)
-12 -10 -8 -6 -4 -2 0 2 4 6Distance from Doppler lidar (km)
-10-8
-6
-4
-20
2
4
68
Dis
tanc
e fr
om D
oppl
er li
dar (
km)
-12 -10 -8 -6 -4 -2 0 2 4 6-10-8
-6
-4
-20
2
4
6802
4
6
8
10
1214
Hei
ght (
km A
GL)
02
4
6
8
10
1214
0 2 4 6 8 10 12 14Height (km AGL)
0 2 4 6 8 10 12 14
(d) 1600:42
202326293235384144475053
Ze (dBZ)
-12 -10 -8 -6 -4 -2 0 2 4 6Distance from Doppler lidar (km)
-10-8
-6
-4
-20
2
4
68
Dis
tanc
e fr
om D
oppl
er li
dar (
km)
-12 -10 -8 -6 -4 -2 0 2 4 6-10-8
-6
-4
-20
2
4
6802
4
6
810
1214
Hei
ght (
km A
GL)
02
4
6
810
1214
0 2 4 6 8 10 12 14Height (km AGL)
0 2 4 6 8 10 12 14
(e) 1606:02
202326293235384144475053
Ze (dBZ)
-12 -10 -8 -6 -4 -2 0 2 4 6Distance from Doppler lidar (km)
-10-8
-6
-4
-20
2
4
68
Dis
tanc
e fr
om D
oppl
er li
dar (
km)
-12 -10 -8 -6 -4 -2 0 2 4 6-10-8
-6
-4
-20
2
4
6802
4
6
810
1214
Hei
ght (
km A
GL)
02
4
6
810
1214
0 2 4 6 8 10 12 14Height (km AGL)
0 2 4 6 8 10 12 14
(f) 1611:22
202326293235384144475053
Ze (dBZ)
A
B
B B
B
A
A
A
A
Journal of the Meteorological Society of Japan Vol. 96A10
(Fig. 6b) on August 17, which were obtained using the MANAL data. At 0900 LST, the weak northerly wind was dominant around the southern Kanto Plain (Fig. 6a). At 1500 LST, a high-θe air mass moved into the southern Kanto Plain from Tokyo Bay and Sagami Bay (Fig. 6b). The southeasterly winds from Tokyo Bay covered the observation site, and the southerly winds from Sagami Bay moved further inland.
4. Convection initiation by boundary layer pro-cesses
A combination of surface meteorological sensors, C-band radar, Doppler lidar, and WPR observational results was used to evaluate the precursors to con-vection initiation. The convection initiation occurred directly above a Doppler lidar and WPR at 1541:30 LST (Fig. 3a). Before the convection initiation, the C-band radar detected a convergence line in the form of an SBF moving inland from Tokyo Bay. The Dop-pler lidar detected a convergence zone that formed the west edge of the convergence line. The near-surface air parcel was lifted to its LCL by the updraft in the convergence zone. The rising air parcel from the LCL to the LFC and above the LFC was directly and con-
2012/8/17 0900 LST
Fig. 4. Surface weather map at 0900 LST on August 17, 2012 (from JMA monthly report).
Fig. 5. Vertical profiles of potential temperature (solid lines), equivalent potential temperature (dashed lines), saturated equivalent potential temperature (dotted lines), and horizontal wind vector (arrows) at (a) 0900 LST on August 17, 2012 at Tateno derived from upper sounding data and (b) 1500 LST on August 17, 2012 at NICT headquarters calculated from MANAL data.
300 320 340 360 380 400Potential temperature (K)
1000
850
700
600
500
400
300
250
200
150
100
Pres
sure
(hPa
)
u10 m s
v
10 m
s
1.55
3.20
5.92
7.64
9.76
11.03
12.51
14.31
16.72
Hei
ght (
km)
300 320 340 360 380 400Potential temperature (K)
1000
850
700
600
500
400
300
250
200
150
100
Pres
sure
(hPa
)
u10 m s
v
10 m
s
1.54
3.18
5.91
7.62
9.74
11.01
12.49
14.30
16.72
Hei
ght (
km)
(a) 0900 LST, Tateno (b) 1500 LST, NICT
-1
-1
-1
-1
θ
θeθe*
θ
θeθe*
H. IWAI et al.May 2018 11
tinuously observed by the WPR. After the convection initiation, another convergence line, which formed an SBF moving inland from Sagami Bay, passed through the NICT headquarters (1554 LST). When the SBF passed under the precipitation cell, the updraft over the nose of the SBF triggered a new precipitation cell (Fig. 3e).
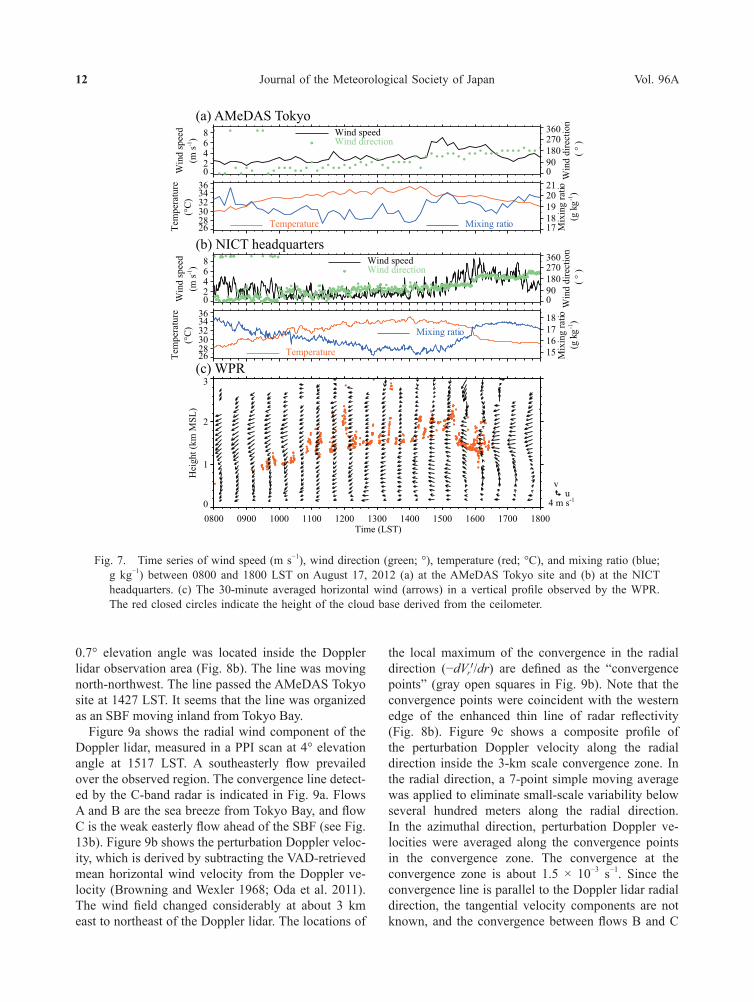
4.1 Surface and boundary layer conditionsFigures 7a and 7b show the time series of surface
meteorological data at the AMeDAS Tokyo site and NICT headquarters. Until 1400 LST, the weak north-erly flow gradually veered to the east accompanied by an increase in temperature and a decrease in mixing ratio at the AMeDAS Tokyo site and NICT headquar-ters. At the AMeDAS Tokyo site, the temperature decreased from 35.3 to 34.8 °C and the mixing ratio increased from 18.4 to 19.7 g kg−1 at 1430 LST. Then the temperature gradually decreased, and the mixing ratio had an increasing tendency until 1510 LST. 10 minutes after the change of temperature and mixing ratio, the surface wind speed increased. These time series suggest the passage of a frontal structure. The time lag between changes in the temperature/mixing ratio and the wind speed is probably the difference be-tween locations of the thermodynamic and kinematic fronts (Atkins et al. 1995). At the NICT headquarters, between 1500 and 1545 LST, the mixing ratio in-creased from 15 to 16 g kg−1, the surface wind speed increased from 2 to 4 m s−1, and the wind direction
shifted from east to southeast. Those changes between 1500 and 1545 LST suggest that the southeasterly flow transported moist air. A distinct surface wind shift and wind speed increase accompanied a cold frontal passage at 1554 LST.
Figure 7c shows vertical profiles of the horizontal flow (30-minute averages) observed by the WPR from 0800 to 1800 LST at the NICT headquarters. Vertical profiles of horizontal wind observed by the WPR portray a small change in the wind direction and weak vertical wind shear. Just before the storm developed over the NICT headquarters (1500 LST), a weak east-southeasterly to east-northeasterly flow blew below 2 km. The cumulus cloud base heights were observed by the ceilometer between 1000 and 1600 LST. The cumulus cloud base heights increased from 1 km AMSL at 1000 LST to 2 km AMSL at 1500 LST and got lower to 1.5 km at 1520 LST.
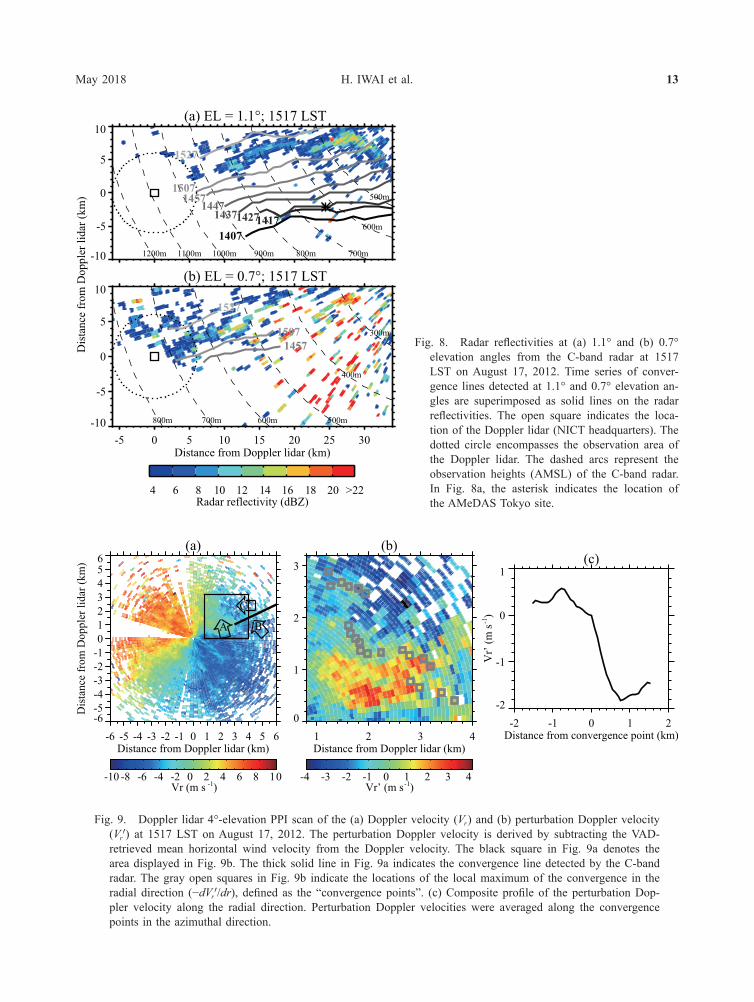
4.2 Convergence linesFigure 8 shows radar reflectivities at 1.1° and 0.7°
elevation angles from the C-band radar at 1517 LST and time series of convergence lines. The thin line (approximately 3 km in width) of enhanced radar reflectivity in Fig. 8a has an east-northeast to west- southwest orientation. The depth of the line is about 900 m. The western edge of the line was located at the eastern edge of the Doppler lidar observation area. On the other hand, the western edge of the line at
(a) 0900 LST
139 140 141Longitude ( OE)
35
36
37La
titud
e (O
N)
5 m s
(b) 1500 LST
139 140 141Longitude ( OE) 5 m s
<335
340
345
350
355
360
365 (K)
-1 -1
Fig. 6. Horizontal distributions of equivalent potential temperature (shading) and horizontal wind (arrows) around the surface at (a) 0900 and (b) 1500 LST on August 17, 2012 given by the MANAL data. The open square indicates the location of the Doppler lidar (NICT headquarters).
Journal of the Meteorological Society of Japan Vol. 96A12
0.7° elevation angle was located inside the Doppler lidar observation area (Fig. 8b). The line was moving north-northwest. The line passed the AMeDAS Tokyo site at 1427 LST. It seems that the line was organized as an SBF moving inland from Tokyo Bay.
Figure 9a shows the radial wind component of the Doppler lidar, measured in a PPI scan at 4° elevation angle at 1517 LST. A southeasterly flow prevailed over the observed region. The convergence line detect-ed by the C-band radar is indicated in Fig. 9a. Flows A and B are the sea breeze from Tokyo Bay, and flow C is the weak easterly flow ahead of the SBF (see Fig. 13b). Figure 9b shows the perturbation Doppler veloc-ity, which is derived by subtracting the VAD-retrieved mean horizontal wind velocity from the Doppler ve-locity (Browning and Wexler 1968; Oda et al. 2011). The wind field changed considerably at about 3 km east to northeast of the Doppler lidar. The locations of
the local maximum of the convergence in the radial direction (−dVr¢/dr) are defined as the “convergence points” (gray open squares in Fig. 9b). Note that the convergence points were coincident with the western edge of the enhanced thin line of radar reflectivity (Fig. 8b). Figure 9c shows a composite profile of the perturbation Doppler velocity along the radial direction inside the 3-km scale convergence zone. In the radial direction, a 7-point simple moving average was applied to eliminate small-scale variability below several hundred meters along the radial direction. In the azimuthal direction, perturbation Doppler ve-locities were averaged along the convergence points in the convergence zone. The convergence at the convergence zone is about 1.5 × 10⁻³ s−1. Since the convergence line is parallel to the Doppler lidar radial direction, the tangential velocity components are not known, and the convergence between flows B and C
262830323436
Tem
pera
ture
(°C
)
Temperature Mixing ratio 1718192021
Mix
ing
ratio
(g k
g-1)
02468
Win
d sp
eed
(m s-1
) Wind speedWind direction
090180270360
Win
d di
rect
ion
( ° )
262830323436
Tem
pera
ture
(°C
)
Temperature
Mixing ratio
15161718
Mix
ing
ratio
(g k
g-1)
02468
Win
d sp
eed
(m s-1
) Wind speedWind direction
090180270360
Win
d di
rect
ion
( ° )
0800 0900 1000 1100 1200 1300 1400 1500 1600 1700 1800Time (LST)
0
1
2
3
Hei
ght (
km M
SL)
u4 m s-1
v
(a) AMeDAS Tokyo
(b) NICT headquarters
(c) WPR
Fig. 7. Time series of wind speed (m s−1), wind direction (green; °), temperature (red; °C), and mixing ratio (blue; g kg−1) between 0800 and 1800 LST on August 17, 2012 (a) at the AMeDAS Tokyo site and (b) at the NICT headquarters. (c) The 30-minute averaged horizontal wind (arrows) in a vertical profile observed by the WPR. The red closed circles indicate the height of the cloud base derived from the ceilometer.
H. IWAI et al.May 2018 13
Fig. 8. Radar reflectivities at (a) 1.1° and (b) 0.7° elevation angles from the C-band radar at 1517 LST on August 17, 2012. Time series of conver-gence lines detected at 1.1° and 0.7° elevation an-gles are superimposed as solid lines on the radar reflectivities. The open square indicates the loca-tion of the Doppler lidar (NICT headquarters). The dotted circle encompasses the observation area of the Doppler lidar. The dashed arcs represent the observation heights (AMSL) of the C-band radar. In Fig. 8a, the asterisk indicates the location of the AMeDAS Tokyo site.
(b) EL = 0.7°; 1517 LST
-5 0 5 10 15 20 25 30Distance from Doppler lidar (km)
-10
-5
0
5
10
Dis
tanc
e fr
om D
oppl
er li
dar (
km)
300m
400m
500m 600m 700m 800m
14571507
1527
(a) EL = 1.1°; 1517 LST
-10
-5
0
5
10
500m
600m
700m 800m 900m1000m1100m1200m
1407141714271437
144714571507
1527
4 6 8 10 12 14 16 18 20 >22Radar reflectivity (dBZ)
Fig. 9. Doppler lidar 4°-elevation PPI scan of the (a) Doppler velocity (Vr) and (b) perturbation Doppler velocity (Vr¢) at 1517 LST on August 17, 2012. The perturbation Doppler velocity is derived by subtracting the VAD- retrieved mean horizontal wind velocity from the Doppler velocity. The black square in Fig. 9a denotes the area displayed in Fig. 9b. The thick solid line in Fig. 9a indicates the convergence line detected by the C-band radar. The gray open squares in Fig. 9b indicate the locations of the local maximum of the convergence in the radial direction (−dVr¢/dr), defined as the “convergence points”. (c) Composite profile of the perturbation Dop-pler velocity along the radial direction. Perturbation Doppler velocities were averaged along the convergence points in the azimuthal direction.
(a)
-6 -5 -4 -3 -2 -1 0 1 2 3 4 5 6Distance from Doppler lidar (km)
-6-5-4-3-2-10123456
Dis
tanc
e fr
om D
oppl
er li
dar (
km)
(b)
1 2 3 4Distance from Doppler lidar (km)
0
1
2
3
-10 -8 -6 -4 -2 0 2 4 6 8 10
Vr (m s -1)
-4 -3 -2 -1 0 1 2 3 4
Vr’ (m s-1)
(c)
-2 -1 0 1 2Distance from convergence point (km)
-2
-1
0
1
Vr’
(m s
-1)
A B
C
Journal of the Meteorological Society of Japan Vol. 96A14
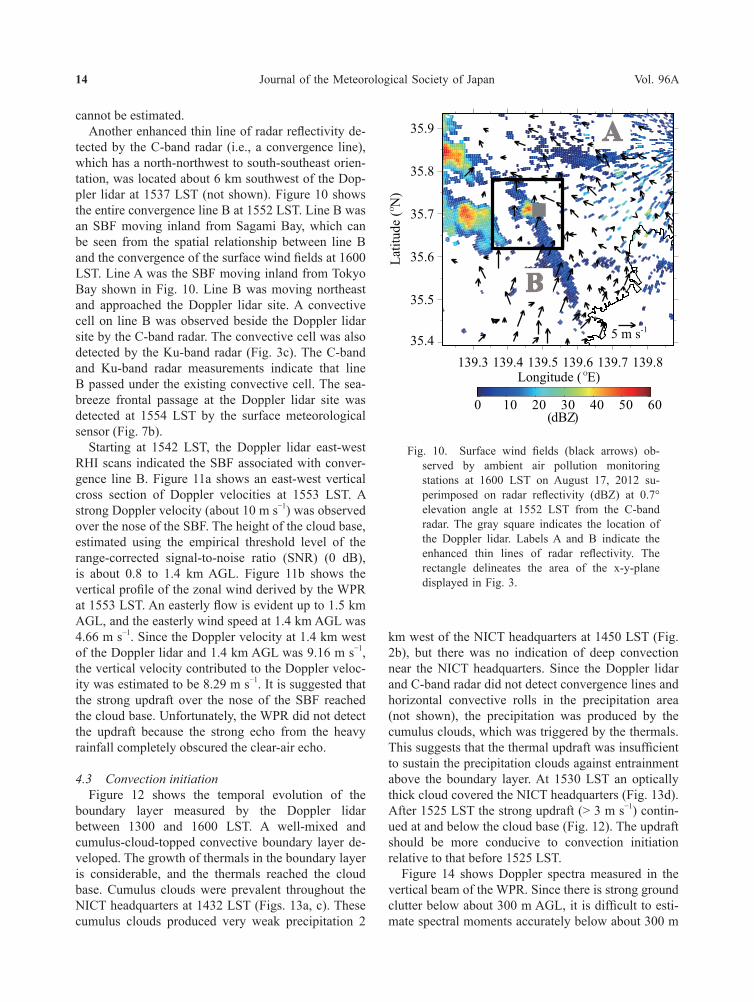
cannot be estimated.Another enhanced thin line of radar reflectivity de-
tected by the C-band radar (i.e., a convergence line), which has a north-northwest to south-southeast orien-tation, was located about 6 km southwest of the Dop-pler lidar at 1537 LST (not shown). Figure 10 shows the entire convergence line B at 1552 LST. Line B was an SBF moving inland from Sagami Bay, which can be seen from the spatial relationship between line B and the convergence of the surface wind fields at 1600 LST. Line A was the SBF moving inland from Tokyo Bay shown in Fig. 10. Line B was moving northeast and approached the Doppler lidar site. A convective cell on line B was observed beside the Doppler lidar site by the C-band radar. The convective cell was also detected by the Ku-band radar (Fig. 3c). The C-band and Ku-band radar measurements indicate that line B passed under the existing convective cell. The sea-breeze frontal passage at the Doppler lidar site was detected at 1554 LST by the surface meteorological sensor (Fig. 7b).
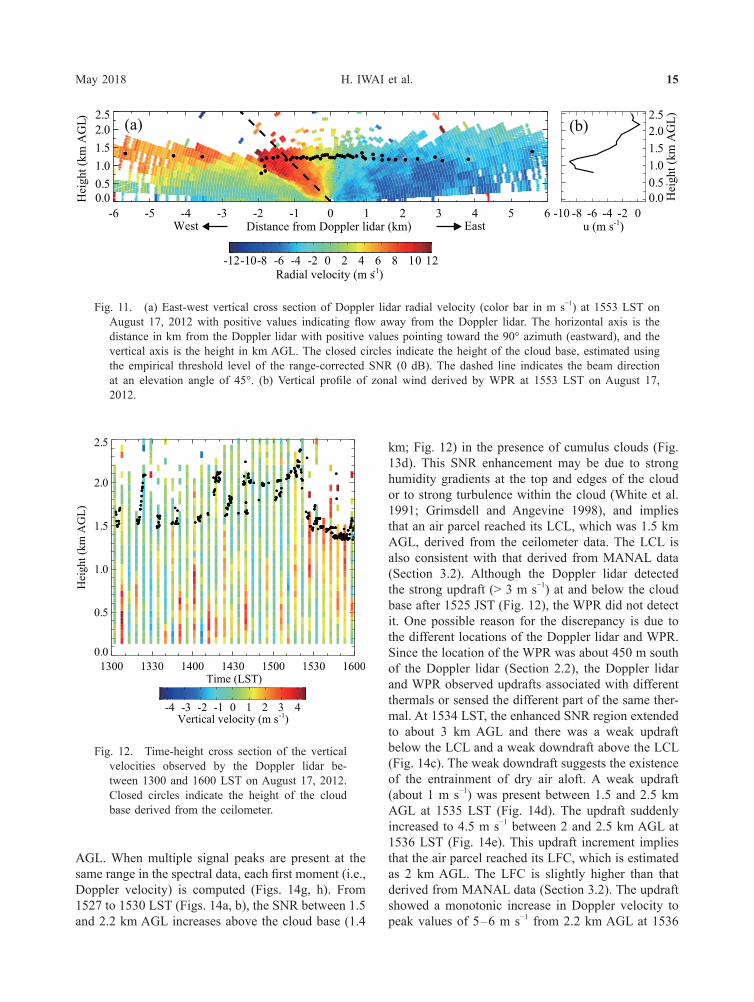
Starting at 1542 LST, the Doppler lidar east-west RHI scans indicated the SBF associated with conver-gence line B. Figure 11a shows an east-west vertical cross section of Doppler velocities at 1553 LST. A strong Doppler velocity (about 10 m s−1) was observed over the nose of the SBF. The height of the cloud base, estimated using the empirical threshold level of the range-corrected signal-to-noise ratio (SNR) (0 dB), is about 0.8 to 1.4 km AGL. Figure 11b shows the vertical profile of the zonal wind derived by the WPR at 1553 LST. An easterly flow is evident up to 1.5 km AGL, and the easterly wind speed at 1.4 km AGL was 4.66 m s−1. Since the Doppler velocity at 1.4 km west of the Doppler lidar and 1.4 km AGL was 9.16 m s−1, the vertical velocity contributed to the Doppler veloc-ity was estimated to be 8.29 m s−1. It is suggested that the strong updraft over the nose of the SBF reached the cloud base. Unfortunately, the WPR did not detect the updraft because the strong echo from the heavy rainfall completely obscured the clear-air echo.
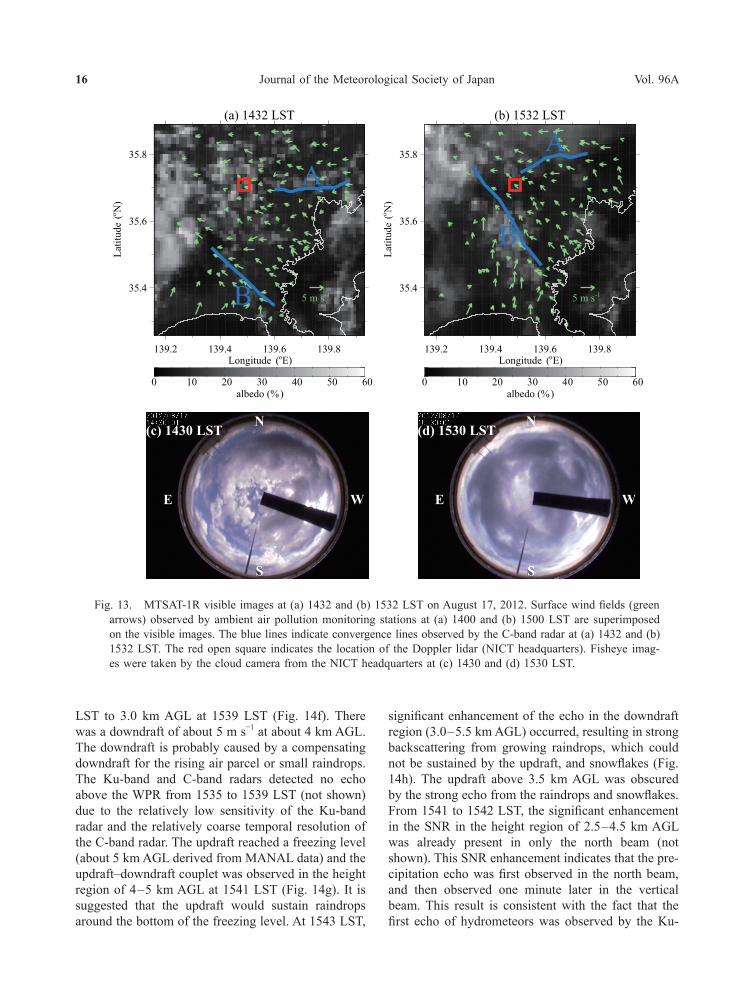
4.3 Convection initiationFigure 12 shows the temporal evolution of the
boundary layer measured by the Doppler lidar between 1300 and 1600 LST. A well-mixed and cumulus-cloud-topped convective boundary layer de-veloped. The growth of thermals in the boundary layer is considerable, and the thermals reached the cloud base. Cumulus clouds were prevalent throughout the NICT headquarters at 1432 LST (Figs. 13a, c). These cumulus clouds produced very weak precipitation 2
km west of the NICT headquarters at 1450 LST (Fig. 2b), but there was no indication of deep convection near the NICT headquarters. Since the Doppler lidar and C-band radar did not detect convergence lines and horizontal convective rolls in the precipitation area (not shown), the precipitation was produced by the cumulus clouds, which was triggered by the thermals. This suggests that the thermal updraft was insufficient to sustain the precipitation clouds against entrainment above the boundary layer. At 1530 LST an optically thick cloud covered the NICT headquarters (Fig. 13d). After 1525 LST the strong updraft (> 3 m s−1) contin-ued at and below the cloud base (Fig. 12). The updraft should be more conducive to convection initiation relative to that before 1525 LST.
Figure 14 shows Doppler spectra measured in the vertical beam of the WPR. Since there is strong ground clutter below about 300 m AGL, it is difficult to esti-mate spectral moments accurately below about 300 m
139.3 139.4 139.5 139.6 139.7 139.8Longitude ( OE)
35.4
35.5
35.6
35.7
35.8
35.9
Latit
ude
(ON
)
5 m s-1
0 10 20 30 40 50 60
(dBZ)
A
B
Fig. 10. Surface wind fields (black arrows) ob-served by ambient air pollution monitoring stations at 1600 LST on August 17, 2012 su-perimposed on radar reflectivity (dBZ) at 0.7° elevation angle at 1552 LST from the C-band radar. The gray square indicates the location of the Doppler lidar. Labels A and B indicate the enhanced thin lines of radar reflectivity. The rectangle delineates the area of the x-y-plane displayed in Fig. 3.
H. IWAI et al.May 2018 15
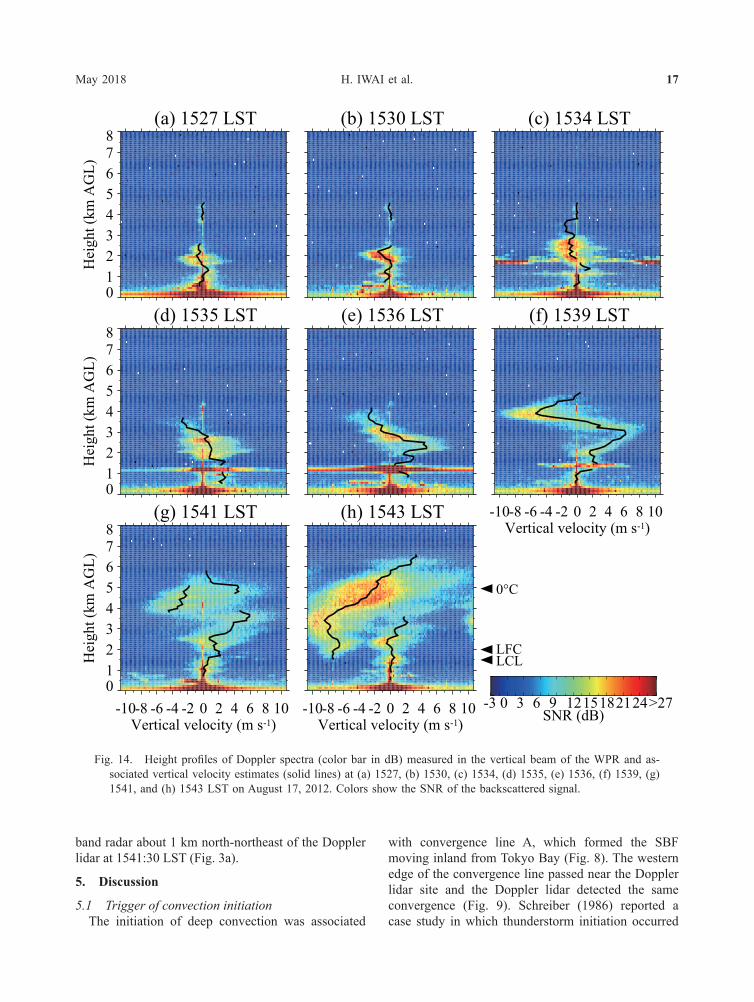
AGL. When multiple signal peaks are present at the same range in the spectral data, each first moment (i.e., Doppler velocity) is computed (Figs. 14g, h). From 1527 to 1530 LST (Figs. 14a, b), the SNR between 1.5 and 2.2 km AGL increases above the cloud base (1.4
km; Fig. 12) in the presence of cumulus clouds (Fig. 13d). This SNR enhancement may be due to strong humidity gradients at the top and edges of the cloud or to strong turbulence within the cloud (White et al. 1991; Grimsdell and Angevine 1998), and implies that an air parcel reached its LCL, which was 1.5 km AGL, derived from the ceilometer data. The LCL is also consistent with that derived from MANAL data (Section 3.2). Although the Doppler lidar detected the strong updraft (> 3 m s−1) at and below the cloud base after 1525 JST (Fig. 12), the WPR did not detect it. One possible reason for the discrepancy is due to the different locations of the Doppler lidar and WPR. Since the location of the WPR was about 450 m south of the Doppler lidar (Section 2.2), the Doppler lidar and WPR observed updrafts associated with different thermals or sensed the different part of the same ther-mal. At 1534 LST, the enhanced SNR region extended to about 3 km AGL and there was a weak updraft below the LCL and a weak downdraft above the LCL (Fig. 14c). The weak downdraft suggests the existence of the entrainment of dry air aloft. A weak updraft (about 1 m s−1) was present between 1.5 and 2.5 km AGL at 1535 LST (Fig. 14d). The updraft suddenly increased to 4.5 m s−1 between 2 and 2.5 km AGL at 1536 LST (Fig. 14e). This updraft increment implies that the air parcel reached its LFC, which is estimated as 2 km AGL. The LFC is slightly higher than that derived from MANAL data (Section 3.2). The updraft showed a monotonic increase in Doppler velocity to peak values of 5 – 6 m s−1 from 2.2 km AGL at 1536
Fig. 11. (a) East-west vertical cross section of Doppler lidar radial velocity (color bar in m s−1) at 1553 LST on August 17, 2012 with positive values indicating flow away from the Doppler lidar. The horizontal axis is the distance in km from the Doppler lidar with positive values pointing toward the 90° azimuth (eastward), and the vertical axis is the height in km AGL. The closed circles indicate the height of the cloud base, estimated using the empirical threshold level of the range-corrected SNR (0 dB). The dashed line indicates the beam direction at an elevation angle of 45°. (b) Vertical profile of zonal wind derived by WPR at 1553 LST on August 17, 2012.
-6 -5 -4 -3 -2 -1 0 1 2 3 4 5 6Distance from Doppler lidar (km)
0.00.51.01.52.02.5
Hei
ght (
km A
GL ) (a)
EastWest
-12-10-8 -6 -4 -2 0 2 4 6 8 10 12
Radial velocity (m s-1)
-10 -8 -6 -4 -2 0u (m s-1)
0.00.51.01.52.02.5
Hei
ght (
km A
GL)(b)
Fig. 12. Time-height cross section of the vertical velocities observed by the Doppler lidar be-tween 1300 and 1600 LST on August 17, 2012. Closed circles indicate the height of the cloud base derived from the ceilometer.
1300 1330 1400 1430 1500 1530 1600Time (LST)
0.0
0.5
1.0
1.5
2.0
2.5
Hei
ght (
km A
GL)
-4 -3 -2 -1 0 1 2 3 4Vertical velocity (m s-1)
Journal of the Meteorological Society of Japan Vol. 96A16
LST to 3.0 km AGL at 1539 LST (Fig. 14f). There was a downdraft of about 5 m s−1 at about 4 km AGL. The downdraft is probably caused by a compensating downdraft for the rising air parcel or small raindrops. The Ku-band and C-band radars detected no echo above the WPR from 1535 to 1539 LST (not shown) due to the relatively low sensitivity of the Ku-band radar and the relatively coarse temporal resolution of the C-band radar. The updraft reached a freezing level (about 5 km AGL derived from MANAL data) and the updraft–downdraft couplet was observed in the height region of 4 – 5 km AGL at 1541 LST (Fig. 14g). It is suggested that the updraft would sustain raindrops around the bottom of the freezing level. At 1543 LST,
significant enhancement of the echo in the downdraft region (3.0 – 5.5 km AGL) occurred, resulting in strong backscattering from growing raindrops, which could not be sustained by the updraft, and snowflakes (Fig. 14h). The updraft above 3.5 km AGL was obscured by the strong echo from the raindrops and snowflakes. From 1541 to 1542 LST, the significant enhancement in the SNR in the height region of 2.5 – 4.5 km AGL was already present in only the north beam (not shown). This SNR enhancement indicates that the pre-cipitation echo was first observed in the north beam, and then observed one minute later in the vertical beam. This result is consistent with the fact that the first echo of hydrometeors was observed by the Ku-
N
S
WE
(c) 1430 LSTN
S
WE
(d) 1530 LST
(a) 1432 LST
139.2 139.4 139.6 139.8Longitude (oE)
35.4
35.6
35.8
Latit
ude
(o N)
5 m s-1B
A
0 10 20 30 40 50 60
albedo (%)
(b) 1532 LST
139.2 139.4 139.6 139.8Longitude (oE)
35.4
35.6
35.8
Latit
ude
(o N)
5 m s-1
B
A
0 10 20 30 40 50 60
albedo (%)
Fig. 13. MTSAT-1R visible images at (a) 1432 and (b) 1532 LST on August 17, 2012. Surface wind fields (green arrows) observed by ambient air pollution monitoring stations at (a) 1400 and (b) 1500 LST are superimposed on the visible images. The blue lines indicate convergence lines observed by the C-band radar at (a) 1432 and (b) 1532 LST. The red open square indicates the location of the Doppler lidar (NICT headquarters). Fisheye imag-es were taken by the cloud camera from the NICT headquarters at (c) 1430 and (d) 1530 LST.
H. IWAI et al.May 2018 17
band radar about 1 km north-northeast of the Doppler lidar at 1541:30 LST (Fig. 3a).
5. Discussion
5.1 Trigger of convection initiationThe initiation of deep convection was associated
with convergence line A, which formed the SBF moving inland from Tokyo Bay (Fig. 8). The western edge of the convergence line passed near the Doppler lidar site and the Doppler lidar detected the same convergence (Fig. 9). Schreiber (1986) reported a case study in which thunderstorm initiation occurred
Fig. 14. Height profiles of Doppler spectra (color bar in dB) measured in the vertical beam of the WPR and as-sociated vertical velocity estimates (solid lines) at (a) 1527, (b) 1530, (c) 1534, (d) 1535, (e) 1536, (f) 1539, (g) 1541, and (h) 1543 LST on August 17, 2012. Colors show the SNR of the backscattered signal.
(a) 1527 LST
012345678
Hei
ght (
km A
GL)
(b) 1530 LST (c) 1534 LST
(d) 1535 LST
012345678
Hei
ght (
km A
GL)
(e) 1536 LST (f) 1539 LST
-10-8 -6 -4 -2 0 2 4 6 8 10Vertical velocity (m s-1)
(g) 1541 LST
-10-8 -6 -4 -2 0 2 4 6 8 10Vertical velocity (m s-1)
012345678
Hei
ght (
km A
GL)
(h) 1543 LST
-10-8 -6 -4 -2 0 2 4 6 8 10Vertical velocity (m s-1)
-3 0 3 6 9 1215182124>27
SNR (dB)
0°C
LFCLCL
Journal of the Meteorological Society of Japan Vol. 96A18
on the extreme south end of a convergence line (Fig. 6 in Schreiber 1986). However, the location where storms will occur along a convergence line is often unknown (Wilson and Schreiber 1986). As mentioned in Section 1, several observational studies have shown that convection initiation is favored at locations where horizontal convective rolls intersect convergence lines (e.g., Wilson et al. 1992; Wakimoto and Atkins 1994; Atkins et al. 1995). However, in our observation, no horizontal convective rolls were observed by the Doppler lidar (Fig. 9) and other instruments. Several observational studies have shown that storms initiate near the collision regions of two boundaries (e.g., Wilson and Schreiber 1986). In our observation, the two convergence lines were observed by the C-band radar (Fig. 10), but they did not collide.
Between 1500 and 1600 LST, the mixing ratio increased from 15 to 16 g kg−1, and the wind direction shifted from east to southeast (Fig. 7b) at the NICT headquarters. This indicates that the southeasterly flow transported water vapor from Tokyo Bay to the NICT headquarters (Fig. 6b). Note that light rain developed 2 km west of the NICT headquarters (Fig. 2b) an hour before the deep convection developed. The light rain was produced by cumulus clouds (Figs. 13a, c), which were triggered by the boundary layer thermals. Wilson and Mueller (1993) and Mueller et al. (1993) found that cumulus clouds are a good indicator of an unsta-ble atmospheric condition since the existence of these clouds suggests that there are regions of deep moisture in the boundary layer. In this study, there is considered to have been deep boundary layer moisture present around the NICT headquarters before the convection initiation.
The strong low-level convergence and updraft at the location of convection initiation are necessary for the low-level moist air parcel to reach its LCL. The con-vergence at the convergence zone, which is the west-ern edge of the convergence line (Fig. 9b), is about 1.5 × 10⁻³ s−1 (Section 4.2). Assuming an incompressible atmosphere and applying the continuity equation, the mean vertical wind speed at the LCL (w (h), h =1.5 km AGL) was calculated as
w h w ux
vydz u
xvyh
h( )= ( )−
∂∂+∂∂
=−
∂∂+∂∂
∫0
0,,
(1)
where w (0) is the vertical velocity at the surface and assumed to be 0, u and v are horizontal wind com-ponents. Thus, the mean vertical wind speed at the LCL was 2.25 m s−1. This value is slightly less than,
but comparable to the vertical velocity observed by the Doppler lidar below the cloud base at 1525 JST (Fig. 12). For the cumulus cloud formation, a rising air parcel must reach its LCL by a persistent updraft (parcel continuity principle; Ziegler and Rasmussen 1998; Ziegler et al. 2007). The time required for the near-surface air parcel to rise to its LCL is about 11 minutes. Since the air parcel was advected west with an easterly flow of about 4 m s−1 (Fig. 7c), the time required for the air parcel to advect from the conver-gence zone to the Doppler lidar/WPR was about 12 minutes. Those time scales of vertical and horizontal advection mean that the saturated air parcel existed over the Doppler lidar/WPR at 1529 LST. At 1530 LST, the SNR between 1.5 and 2.2 km in the vertical beam of the WPR increased above the cloud base (Fig. 14b). This SNR enhancement may be due to strong humidity gradients at the top and edges of clouds. It is consistent with the saturated air parcel advection. The fisheye image (Fig. 13d) showed that convective non-precipitating clouds were above the Doppler lidar/WPR at 1530 LST. However, the convergence line, which triggered the updraft, had already left the region of air parcel lifting (Figs. 8b, 13b). Therefore, an additional lifting mechanism is needed for the air parcel to reach its LFC. After 1525 LST, thermals with a strong updraft (> 3 m s−1) were vigorous at and below the cumulus cloud base (Fig. 12). Then the WPR directly and continuously observed the rising air parcel above the LFC (2 km AGL) after 1536 LST (Fig. 14). It is suggested that the updrafts associated with the thermals were sufficient for the saturated air parcel to reach its LFC. As pointed out by Markowski et al. (2006) and Bergmaier et al. (2014), it is likely that the boundary layer thermals would play an important role in convection initiation. Since the boundary layer ther-mals operate on small spatial and temporal scales, the Doppler lidar and WPR are relevant tools to capture them.
It seems plausible that the weak vertical wind shear at the LCL and LFC (Figs. 5b, 7c) was a preferential factor in convection initiation. By cloud modeling study, Reuter and Yau (1987) have shown that vertical wind shear increases the entrainment of dry air into clouds, which would have reduced the rising air parcel buoyancy. Before 1536 LST, the high SNR region in the vertical beam of the WPR moved upward between 2.2 and 3.0 km (Figs. 14b, c). It is suggested that part of the saturated air parcel at the LCL was lifted to its LFC by the updrafts associated with thermals. The weak downdraft in the enhanced SNR above the LCL also suggests the existence of the entrainment of dry
H. IWAI et al.May 2018 19
air aloft. Since the entrainment that reduces the rising air parcel buoyancy was gradually weak, it seems that the high SNR region moved upward. Then the rising air parcel did not lose its buoyancy and the sudden increase in updraft above the LFC was observed (Fig. 14e).
5.2 Interaction between SBF and preexisting cellConvergence line B, which formed the SBF moving
inland from Sagami Bay, passed through the NICT headquarters after the convection initiation (Fig. 10). According to the analysis of the flow at the SBF using the vertical cross section of Doppler lidar radial velocity, the strong updraft (8.29 m s−1) over the nose of the SBF reached the cloud base at 1553 LST (Fig. 11a). At that time, precipitation cell A had already de-veloped with a radar reflectivity of about 50 dBZ (Fig. 3c). Some previous studies (e.g., Wilson and Mueller 1993; Fankhauser et al. 1995; Kingsmill 1995; Wilson et al. 2001) have documented radar reflectivity inten-sification when convergence lines approach and pass under existing cumulus clouds. Using a WPR, May (1999) directly observed an updraft associated with a gust front, which interacted with a preexisting weak cell, and the cell intensification occurred near the WPR. However, in our case, the updraft over the nose of the SBF was associated with not the intensification of the preexisting cell but the generation of a new precipitation cell. From 1552:10 to 1600:42 LST, precipitation core of cell A descended (Figs. 3c, d), and the peak fall speed of the rain observed by the WPR reached 10 m s−1 below 5 km AGL (not shown). Cell A was not intensified after the SBF passage. It is suggested that the updraft over the nose of the SBF did not overcome the downdraft with heavy rainfall. By contrast, a new precipitation cell B was generated in a relatively weak echo (30 to 35 dBZ) region of cell A. This suggests that there was a preferential region of convection initiation. Note that cell B in Fig. 3e appears to be an embryo of cell A and is similar to a “new misoscale convective echo” (NMCE) reported by Sakurai et al. (2012) using a Ka-band Doppler radar. However, the initiation mechanism of the NMCE has not been clarified. As pointed out by Sakurai et al., a further series of case studies is needed.
6. Summary and conclusions
In this study, we described the dynamics leading to convection initiation associated with an isolated convective storm using observations collected in the southern Kanto Plain on August 17, 2012. Several
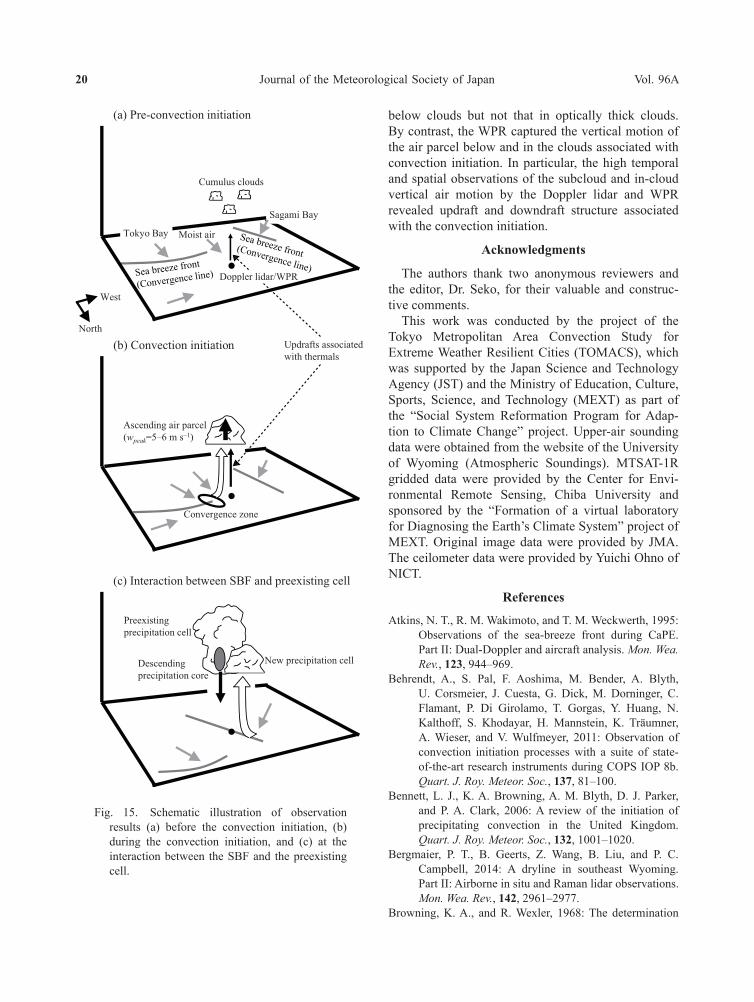
surface sensors and ground-based remote sensing in-struments were operated simultaneously and captured the life cycle of the isolated convective storm. The observation results are summarized in the schematic illustration presented in Fig. 15.
Before the convection initiation, a southeasterly flow transported water vapor from Tokyo Bay to the NICT headquarters, and a well-mixed and cumu-lus-cloud-topped convective boundary layer devel-oped (Fig. 15a). Although the CAPE was high, the CIN was moderate, and the LCL and LFC were large. In such circumstances, one might expect that a strong trigger would be necessary for convection initiation over a flat terrain.
When the convergence line in the form of an SBF moving inland from Tokyo Bay approached near the NICT headquarters, the near-surface air parcel was lifted to its LCL (1.5 km AGL) by the updraft at the western edge of the convergence line (Fig. 15b). The saturated air parcel at the LCL was lifted to its LFC (2 km AGL) by the updrafts associated with thermals at and below the cumulus cloud base. It is possible that the weak vertical wind shear and entrainment at the LCL and LFC did not inhibit convective growth. The air parcel ascended with a peak updraft of 5 – 6 m s−1. About 6 minutes after the air parcel reached to its LFC, the first echo of hydrometeors was detected by the Ku-band radar and WPR. The precipitation cell grew rapidly, and the radar reflectivity of the precipi-tation core reached 50 dBZ about 10 minutes after the first echo.
When the precipitation core descended, the SBF moving inland from Sagami Bay passed under the preexisting precipitation cell (Fig. 15c). Although the updraft over the nose of the SBF was strong, the preexisting precipitation cell was not intensified after the SBF passage owing to the downdraft with heavy rainfall. The updraft triggered a new precipitation cell, which was generated in a relatively weak echo region of the preexisting precipitation cell.
The combined use of different remote sensing instruments was helpful for investigating convection initiation because each instrument has its advantages and limitations. The Ku-band radar provided the precise location of the convection initiation with high temporal and spatial resolution. The C-band radar observed the entire structure, location, and movement of convergence lines in a wide range. The Doppler lidar observed the detailed kinematic structure of the convergence line, such as the convergence and updraft, although its observation area was narrow. The Doppler lidar could observe the vertical velocity
Journal of the Meteorological Society of Japan Vol. 96A20
below clouds but not that in optically thick clouds. By contrast, the WPR captured the vertical motion of the air parcel below and in the clouds associated with convection initiation. In particular, the high temporal and spatial observations of the subcloud and in-cloud vertical air motion by the Doppler lidar and WPR revealed updraft and downdraft structure associated with the convection initiation.
Acknowledgments
The authors thank two anonymous reviewers and the editor, Dr. Seko, for their valuable and construc-tive comments.
This work was conducted by the project of the Tokyo Metropolitan Area Convection Study for Extreme Weather Resilient Cities (TOMACS), which was supported by the Japan Science and Technology Agency (JST) and the Ministry of Education, Culture, Sports, Science, and Technology (MEXT) as part of the “Social System Reformation Program for Adap-tion to Climate Change” project. Upper-air sounding data were obtained from the website of the University of Wyoming (Atmospheric Soundings). MTSAT-1R gridded data were provided by the Center for Envi-ronmental Remote Sensing, Chiba University and sponsored by the “Formation of a virtual laboratory for Diagnosing the Earth’s Climate System” project of MEXT. Original image data were provided by JMA. The ceilometer data were provided by Yuichi Ohno of NICT.
References
Atkins, N. T., R. M. Wakimoto, and T. M. Weckwerth, 1995: Observations of the sea-breeze front during CaPE. Part II: Dual-Doppler and aircraft analysis. Mon. Wea. Rev., 123, 944–969.
Behrendt, A., S. Pal, F. Aoshima, M. Bender, A. Blyth, U. Corsmeier, J. Cuesta, G. Dick, M. Dorninger, C. Flamant, P. Di Girolamo, T. Gorgas, Y. Huang, N. Kalthoff, S. Khodayar, H. Mannstein, K. Träumner, A. Wieser, and V. Wulfmeyer, 2011: Observation of convection initiation processes with a suite of state-of-the-art research instruments during COPS IOP 8b. Quart. J. Roy. Meteor. Soc., 137, 81–100.
Bennett, L. J., K. A. Browning, A. M. Blyth, D. J. Parker, and P. A. Clark, 2006: A review of the initiation of precipitating convection in the United Kingdom. Quart. J. Roy. Meteor. Soc., 132, 1001–1020.
Bergmaier, P. T., B. Geerts, Z. Wang, B. Liu, and P. C. Campbell, 2014: A dryline in southeast Wyoming. Part II: Airborne in situ and Raman lidar observations. Mon. Wea. Rev., 142, 2961–2977.
Browning, K. A., and R. Wexler, 1968: The determination
Cumulus clouds
North
Moist air
West
Sagami Bay
Tokyo Bay
(b) Convection initiation
(a) Pre-convection initiation
(c) Interaction between SBF and preexisting cell
Convergence zone
Updrafts associated with thermals
Ascending air parcel (wpeak=5–6 m s–1)
New precipitation cell
Preexistingprecipitation cell
Descendingprecipitation core
Doppler lidar/WPR
Fig. 15. Schematic illustration of observation results (a) before the convection initiation, (b) during the convection initiation, and (c) at the interaction between the SBF and the preexisting cell.
H. IWAI et al.May 2018 21
of kinematic properties of a wind field using Doppler radar. J. Appl. Meteor., 7, 105–113.
Browning, K. A., C. J. Morcrette, J. Nicol, A. M. Blyth, L. J. Bennett, B. J. Brooks, J. Marsham, S. D. Mobbs, D. J. Parker, F. Perry, P. A. Clark, S. P. Ballard, M. A. Dixon, R. M. Forbes, H. W. Lean, Z. Li, N. M. Rob-erts, U. Corsmeier, C. Barthlott, B. Deny, N. Kalthoff, S. Khodayar, M. Kohler, C. Kottmeier, S. Kraut, M. Kunz, J. Lenfant, A. Wieser, J. L. Agnew, D. Bamber, J. McGregor, K. M. Beswick, M. D. Gray, E. Norton, H. M. A. Ricketts, A. Russell, G. Vaughan, A. R. Webb, M. Bitter, T. Feuerle, R. Hankers, H. Schulz, K. E. Bozier, C. G. Collier, F. Davies, C. Gaffard, T. J. Hewison, D. N. Ladd, E. C. Slack, J. Waight, M. Ramatschi, D. P. Wareing, and R. J. Watson, 2007: The Convective Storm Initiation Project. Bull. Amer. Meteor. Soc., 88, 1939–1955.
Chuda, T., and H. Niino, 2005: Climatology of environmen-tal parameters for mesoscale convections in Japan. J. Meteor. Soc. Japan, 83, 391–408.
Cressman, G. P., 1959: An operational objective analysis system. Mon. Wea. Rev., 87, 367–374.
Demoz, B., C. Flamant, T. Weckwerth, D. Whiteman, K. Evans, F. Fabry, P. Di Girolamo, D. Miller, B. Geerts, W. Brown, G. Schwemmer, B. Gentry, W. Felts, and Z. Wang, 2006: The dryline on 22 May 2002 during IHOP_2002: Convective-scale measurements at the profiling site. Mon. Wea. Rev., 134, 294–310.
Fankhause, J. C., N. A. Crook, J. Tuttle, L. J. Miller, and C. G. Wade, 1995: Initiation of deep convection along boundary layer convergence lines in a semitropical environment. Mon. Wea. Rev., 123, 291–313.
Fujibe, F., K. Sakagami, K. Chubachi, and K. Yamashita, 2002: Surface wind patterns preceding short-time heavy rainfall in Tokyo in the afternoon on midsum-mer days. Tenki, 49, 395–405 (in Japanese).
Grimsdell, A. W., and W. M. Angevine, 1998: Convective boundary layer height measurement with wind profil-ers and comparison to cloud base. J. Atmos. Oceanic Technol., 15, 1331–1338.
Hirano, K., and M. Maki, 2010: Method of VIL calculation for X-band polarimetric radar and potential of VIL for nowcasting of localized severe rainfall —Case study of the Zoshigaya downpour, 5 August 2008—. SOLA, 6, 89–92.
Horie, H., and K. Tomine, 1998: A study on generation and movement of air mass thunderstorms over Kanto area in summer 1995. Tenki, 45, 441–453 (in Japanese).
Imai, K., T. Nakagawa, and H. Hashiguchi, 2007: Devel-opment of tropospheric wind profiler radar with Luneberg lens antenna (WPR LQ-7). SEI Technical Review, 64, 38–42.
Ishihara, M., 2012a: Radar echo population of thunder-storms generated on the 2008 Zoshigaya-rainstorm day and nowcasting of thunderstorm-induced local heavy rainfalls. Part I: Three-dimensional radar echo
population of the thunderstorms. Tenki, 59, 549–561 (in Japanese).
Ishihara, M., 2012b: Radar echo population of thunder-storms generated on the 2008 Zoshigaya-rainstorm day and nowcasting of thunderstorm-induced local heavy rainfalls. Part II: A feasibility study on nowcast-ing of thunderstorm-induced local heavy rainfalls. Tenki, 59, 563–577 (in Japanese).
Ishii, S., K. Mizutani, H. Fukuoka, T. Ishikawa, B. Philippe, H. Iwai, T. Aoki, T. Itabe, A. Sato, and K. Asai, 2010: Coherent 2 μm differential absorption and wind lidar with conductively cooled laser and two-axis scanning device. Appl. Opt., 49, 1809–1817.
Iwai, H., S. Ishii, R. Oda, K. Mizutani, S. Sekizawa, and Y. Murayama, 2013: Performance and technique of coherent 2-μm differential absorption and wind lidar for wind measurement. J. Atmos. Oceanic Technol., 30, 429–449.
JMA, 2013: Outline of the operational numerical weather prediction at the Japan Meteorological Agency. [Available at http://www.jma.go.jp/jma/jma-eng/jma- center/nwp/outline2013-nwp/index.htm.]
Karan, H., and K. Knupp, 2006: Mobile Integrated Profiler System (MIPS) observations of low-level convergent boundaries during IHOP. Mon. Wea. Rev., 134, 92– 112.
Kato, A., and M. Maki, 2009: Localized heavy rainfall near Zoshigaya, Tokyo, Japan on 5 August 2008 observed by X-band polarimetric radar —Preliminary analy-sis —. SOLA, 5, 89–92.
Kawabata, T., H. Seko, K. Saito, T. Kuroda, K. Tamiya, T. Tsuyuki, Y. Honda, and Y. Wakazuki, 2007: An assimilation and forecasting experiment of the Nerima heavy rainfall with a cloud-resolving nonhydrostatic 4-dimensional variational data assimilation system. J. Meteor. Soc. Japan, 85, 255–276.
Kawabata, T., T. Kuroda, H. Seko, and K. Saito, 2011: A cloud-resolving 4DVAR assimilation experiment for a local heavy rainfall event in the Tokyo metropolitan area. Mon. Wea. Rev., 139, 1911–1931.
Kim, D.-S., M. Maki, S. Shimizu, and D.-I. Lee, 2012: X-band dual-polarization radar observations of precipitation core development and structure in a multi-cellular storm over Zoshigaya, Japan, on August 5, 2008. J. Meteor. Soc. Japan, 90, 701–719.
Kingsmill, D. E., 1995: Convection initiation associated with a seabreeze front, a gust front, and their collision. Mon. Wea. Rev., 123, 2913–2933.
Kobayashi, F., Y. Ueno, N. Inatomi, and T. Shimura, 2001: Cumulonimbus which brought heavy rainfall in the metropolitan area on 21 July 1999. Tenki, 48, 3–4 (in Japanese).
Kobayashi, F., H. Sugawara, Y. Ogawa, M. Kanda, and K. Ishii, 2007: Cumulonimbus generation in Tokyo metropolitan area during mid-summer days. J. Atmos. Electr., 27, 41–52.
Journal of the Meteorological Society of Japan Vol. 96A22
Koch, S. E., and W. L. Clark, 1999: A nonclassical cold front observed during COPS-91: Frontal structure and the process of severe storm initiation. J. Atmos. Sci., 56, 2862–2890.
Kusunoki, K., 2002: A preliminary survey of clear-air echo appearances over the Kanto Plain in Japan from July to December 1997. J. Atmos. Oceanic Technol., 19, 1063–1072.
Kusunoki, K., and T. Matsumura, 1999: Clear-air radar echoes in boundary layers: The origin and the clima-tology in Japan. Preprints, 13th Symp. on Boundary Layers and Turbulence, Dallas, TX, Amer. Meteor. Soc., 387–390.
Kusunoki, K., S. Saito, and H. Inoue, 2012: Radar and surface mesonet observations of convection initiation associated with seabreeze front and outflow boundary. Proc. 7th European Conference on Radar in Meteo-rology and Hydrology, Toulouse, France.
Lhermitte, R. M., and M. Gilet, 1975: Dual-Doppler radar observations and study of sea breeze convective storm development. J. Appl. Meteor., 14, 1346–1361.
Maki, M., R. Misumi, T. Nakatani, S. Suzuki, T. Kobayashi, Y. Yamada, A. Adachi, I. Nakamura, M. Ishihara, T. Maesaka, A. Kato, T. Kayahara, S. Shimizu, T. Wakatsuki, Y. Shusse, K. K. Hirano, K. Iwanami, N. Sakurai, D.-S. Kim, O. Suzuki, Y. Shoji, K. Kusunoki, H. Yamauchi, N. Seino, H. Seko, E. Sato, H. Inoue, C. Fujiwara, S. Saito, N. Nagumo, T. Kawabata, S. Origuchi, F. Fujibe, S. Tsuchiya, A. Yamaji, M. Yasui, Y. Fujiyoshi, Y. Suzuki, T. Ushio, K. Sunada, T. Yamada, H. Nakamori, F. Kobayashi, H. Sugawara, H. Yokoyama, H. Hirakuchi, T. Sato, M. Yoshii, A. Togari, D. Tsuji, K. Otsuka, T. Murano, D.-I. Lee, and V. Chandrasekar, 2012: Tokyo Metropolitan Area Convection Study for Extreme Weather Resilient Cities (TOMACS). Proc. 7th European Conference on Radar in Meteorology and Hydrology, Toulouse, France, 10.6. [Available at http://www.meteo.fr/cic/meetings/2012/ERAD/presentations/thursday/10-6.pdf.]
Markowski, P., C. Hannon, and E. Rasmussen, 2006: Obser-vations of convection initiation “failure” from the 12 June 2002 IHOP deployment. Mon. Wea. Rev., 134, 375–405.
May, P. T., 1999: Thermodynamic and vertical velocity structure of two gust fronts observed with a wind profiler / RASS during MCTEX. Mon. Wea. Rev., 127, 1796–1807.
Mega, T., K. Monden, T. Ushio, K. Okamoto, Z. Kawasaki, and T. Morimoto, 2007: A low-power high-resolution broad-band radar using a pulse compression technique for meteorological application. IEEE Geosci. Remote Sens. Lett., 4, 392–396.
Mizutani, K., T. Itabe, S. Ishii, M. Aoki, K. Asai, A. Sato, H. Fukuoka, T. Ishikawa, and K. Noda, 2015: Diode- pumped 2-μm pulse laser with noncomposite Tm,
Ho: YLF rod conductive-cooled down to −80°C. Appl. Opt., 54, 7865–7869.
Mueller, C. K., J. W. Wilson, and N. A. Crook, 1993: The utility of sounding and mesonet data to nowcast thun-derstorm initialization. Wea. Forecasting, 8, 132–146.
Nakatani, T., R. Misumi, Y. Shoji, K. Saito, H. Seko, N. Seino, S. Suzuki, Y. Shusse, T. Maesaka, and H. Sugawara, 2015: Tokyo metropolitan area convection study for extreme weather resilient cities. Bull. Amer. Meteor. Soc., 96, 123–126.
Oda, R., H. Iwai, S. Ishii, S. Sekizawa, K. Mizutani, and Y. Murayama, 2011: Structure of turbulence in the urban atmospheric boundary layer detected in the Doppler lidar observation. J. Japan Soc. Civ. Eng., 67B, I_313–I_318 (in Japanese).
Reuter, G. W., and M. K. Yau, 1987: Mixing mechanisms in cumulus congestus clouds. Part II: Numerical simula-tions. J. Atmos. Sci., 44, 798–827.
Saito, K., T. Fujita, Y. Yamada, J. Ishida, Y. Kumagai, K. Aranami, S. Ohmori, R. Nagasawa, S. Kumagai, C. Muroi, T. Kato, H. Eito, and Y. Yamazaki, 2006: The operational JMA nonhydrostatic mesoscale model. Mon. Wea. Rev., 134, 1266–1298.
Saito, Y., F. Kobayashi, A. Katsura, T. Takamura, T. Takano, and T. Kurino, 2013: The lifetime of an isolated cumu-lonimbus observed by weather satellite (MTSAT-1R) rapid scans. Tenki, 60, 247–260 (in Japanese).
Sakurai, N., K. Iwanami, T. Maesaka, S. Suzuki, S. Shimizu, R. Misumi, D.-S. Kim, and M. Maki, 2012: Case study of misoscale convective echo behavior associ-ated with cumulonimbus development observed by Ka-band Doppler radar in the Kanto Region, Japan. SOLA, 8, 107–110.
Sato, E., C. Fujiwara, K. Kusunoki, and S. Saito, 2013: Characteristics of descending reflectivity cores observed by Ku-band radar. Proc. 36th Conference on Radar Meteorology, Breckenridge, CO, 2A.4. [Available at https://ams.confex.com/ams/36Radar/webprogram/Paper228824.html.]
Schreiber, W. E., 1986: Case studies of thunderstorms Initi-ated by radar-observed convergent lines. Mon. Wea. Rev., 114, 2256–2266.
Seko, H., Y. Shoji, and F. Fujibe, 2007: Evolution and airflow structure of a Kanto thunderstorm on 21 July 1999 (the Nerima heavy rainfall event). J. Meteor. Soc. Japan, 85, 455–477.
Wakimoto, R. M., and N. T. Atkins, 1994: Observations of the sea-breeze front during CaPE. Part I: Single- Doppler, satellite, and cloud photogrammetric analy-sis. Mon. Wea. Rev., 122, 1092–1114.
Wakimoto, R. M., H. V. Murphey, E. V. Browell, and S. Ismail, 2006: The “triple point” on 24 May 2002 during IHOP. Part I: Airborne Doppler and LASE analyses of the frontal boundaries and convection initiation. Mon. Wea. Rev., 134, 231–250.
Weckwerth, T. M., D. B. Parsons, S. E. Koch, J. A. Moore,
H. IWAI et al.May 2018 23
M. A. LeMone, B. B. Demoz, C. Flamant, B. Geerts, J. Wang, and W. F. Feltz, 2004: An overview of the International H2O Project (IHOP_2002) and some preliminary highlights. Bull. Amer. Meteor. Soc., 85, 253–277.
White, A. B., C. W. Fairall, and D. W. Thomson, 1991: Radar observations of humidity variability in and above the marine atmospheric boundary layer. J. Atmos. Oceanic Technol., 8, 639–658.
Wilson, J. W., and W. E. Schreiber, 1986: Initiation of convective storms by radar-observed boundary layer convergent lines. Mon. Wea. Rev., 114, 2516–2536.
Wilson, J. W., and C. K. Mueller, 1993: Nowcasts of thun-derstorm initialization and evolution. Wea. Forecast-ing, 8, 113–131.
Wilson, J. W., G. B. Foote, N. A. Crook, J. C. Fankhauser, C. G. Wade, J. D. Tuttle, C. K. Muller, and S. N. Krueger, 1992: The role of boundary-layer convergence zones and horizontal rolls in the initiation of thunderstorms: A case study. Mon. Wea. Rev., 120, 1785–1815.
Wilson, J. W., R. E. Carbone, J. D. Tuttle, and T. D. Keenan, 2001: Tropical island convection in the absence of significant topography. Part II: Nowcasting storm evolution. Mon. Wea. Rev., 129, 1637–1655.
Wulfmeyer, V., A. Behrendt, H.-S. Bauer, C. Kottmeier, U. Corsmeier, A. Blyth, G. Craig, U. Schumann, M. Hagen, S. Crewell, P. Di Girolamo, C. Flamant, M. Miller, A. Montani, S. Mobbs, E. Richard, M. W.
Rotach, M. Arpagaus, H. Russchenberg, P. Schlüssel, M. König, V. Gärtner, R. Steinacker, M. Dorninger, D. D. Turner, T. Weckwerth, A. Hense, and C. Simmer, 2008: The convective and orographically induced precipitation study: A research and development project of the World Weather Research Program for improving quantitative precipitation forecasting in low-mountain regions. Bull. Amer. Meteor. Soc., 89, 1477–1486.
Yoshikawa, E., T. Ushio, Z. Kawasaki, T. Mega, S. Yoshida, T. Morimoto, K. Imai, and S. Nagayama, 2010: De-velopment and initial observation of high-resolution volume-scanning radar for meteorological application. IEEE Trans. Geosci. Remote Sens., 48, 3225–3235.
Ziegler, C. L., and E. N. Rasmussen, 1998: The initiation of moist convection at the dryline: Forecasting issues from a case study perspective. Wea. Forecasting, 13, 1106–1131.
Ziegler, C. L., T. J. Lee, and R. A. Pielke, Sr., 1997: Convec-tion initiation at the dryline: A modeling study. Mon. Wea. Rev., 125, 1001–1026.
Ziegler, C. L., E. N. Rasmussen, M. S. Buban, Y. P. Richard-son, L. J. Miller, and R. M. Rain, 2007: The “triple point” on 24 May 2002 during IHOP. Part II: Ground-radar and in situ boundary layer analysis of cumulus development and convection initiation. Mon. Wea. Rev., 135, 2443–2472.