Embed Size (px)
Citation preview
Case Study of an Innovative HVAC System with Integral
Dehumidifier
Authors Richard A. Raustad and Don B. Shirey, III
Original Publication Raustad, R., and Shirey, D., "Case Study of an Innovative HVAC System with Integral
Dehumidifier", Sixteenth Symposium on Improving Building Systems in Hot and Humid Climates, December 15-17, 2008, in Dallas, TX.
Publication Number FSEC-PF-440-09
Copyright Copyright © Florida Solar Energy Center/University of Central Florida
1679 Clearlake Road, Cocoa, Florida 32922, USA (321) 638-1000
All rights reserved.
Disclaimer The Florida Solar Energy Center/University of Central Florida nor any agency thereof, nor any of their employees, makes any warranty, express or implied, or assumes any legal liability or responsibility for the accuracy, completeness, or usefulness of any information, apparatus, product, or process disclosed, or represents that its use would not infringe privately owned rights. Reference herein to any specific commercial product, process, or service by trade name, trademark, manufacturer, or otherwise does not necessarily constitute or imply its endorsement, recommendation, or favoring by the Florida Solar Energy Center/University of Central Florida or any agency thereof. The views and opinions of authors expressed herein do not necessarily state or reflect those of the Florida Solar Energy Center/University of Central Florida or any agency thereof.
Case Study of an Innovative HVAC System with Integral Dehumidifier
Richard A. Raustad Don B. Shirey, III Senior Research Engineer Program Manager
Florida Solar Energy Center Cocoa, Florida
ABSTRACT In most applications, heating, ventilating, and air conditioning (HVAC) equipment is controlled to maintain an indoor dry-bulb set point temperature. Moisture removal by the HVAC system is considered to be an operational byproduct. During summer months, the operation of the HVAC system is usually sufficient to meet both the sensible and latent cooling loads. However, during other times of the year when sensible loads are reduced, the moisture load can be significantly higher than the available moisture removal capacity of the air-conditioning system. This can lead to elevated indoor relative humidity levels and an uncomfortable indoor environment. In many cases, designers, engineers and building occupants combat high indoor relative humidity and associated comfort problems with the use of additional dehumidification equipment for both commercial and residential applications. The use of extra dehumidification equipment can be expensive in terms of first cost and annual operating costs. First costs associated with this type of equipment may include additional electrical circuits, condensate drainage, and additional air distribution systems. The loss of usable floor area, localized noise, and zonal “hot-spots” can also be considered a cost penalty. As an alternative to using separate equipment for meeting both the sensible and latent components of a building’s cooling load, off-the-shelf products were used to construct a self-contained air handler. The air handler is controlled using a low-cost thermostat and humidistat. The dehumidification element of the system is completely independent from the air conditioner and works nearly the same as conventional dehumidification equipment. At times, both the dehumidification equipment and the air conditioner operate in unison when the need arises. The use of dehumidification equipment integrated with a conventional AC system provides a unique solution for moisture control applications.
This paper describes the development and testing of this integrated equipment. Although this technology is not new, the integration of a dehumidification system with a standard air conditioner is an innovative strategy that can be used to address moisture control in buildings. This new HVAC configuration would provide a low-cost solution for building owners and a more comfortable indoor environment for building occupants. KEYWORDS Humidity and Comfort, Moisture Removal, Impact of Standard 62, Innovative Strategies. INTRODUCTION Current air conditioners and heat pumps are generally compromise designs that meet equipment rating conditions (ARI Standard 210/240) cost-effectively and work adequately in a variety of climates. However, greater comfort and energy savings can be realized if units are designed for specific regional climates. In particular, a unit optimized for hot-dry conditions can improve efficiency by sacrificing dehumidification ability. And a unit optimized for hot-humid conditions can increase dehumidification and comfort without “over-cooling” a space. The California Energy Commission (CEC), through its Public Interest Energy Research (PIER) program, co-funded the development of a residential air conditioner optimized for hot-dry climates (Proctor Engineering 2007). In addition, the New York State Energy Research and Development Authority (NYSERDA) sponsored a project to develop an air conditioner optimized for northern climates (short duration cooling season with relatively high peak loads that strain utilities and electrical distribution systems). A recent National Association of State Energy Officials (NASEO) and State Technologies Advancement Collaborative (STAC) project was intended to complement the CEC and NYSERDA efforts by developing a residential air conditioner optimized for hot-humid climates.
Initial work on the NASEO/STAC project included a study to evaluate the impacts of conventional and advanced cooling and dehumidification equipment on residential indoor humidity levels and annual energy consumption using whole building computer simulations (Henderson et al. 2007). The life-cycle cost premium for the various advanced dehumidification systems was also estimated. The study results indicated that energy-efficient, properly-ventilated homes in humid climates need equipment options or configurations that can provide a modest amount of additional dehumidification capacity while coordinating their operation with conventional cooling and ventilation systems. Several of the advanced dehumidification systems evaluated as part of the study provided improved energy performance while maintaining proper indoor humidity levels, but some had a high first cost which yielded relatively high life-cycle costs. The research team believed that alternative designs for some of these options could be developed to reduce first cost. The initial simulation study indicated that a standalone room air dehumidifier, used in conjunction with a conventional air-conditioning system, can be a very cost-effective approach to providing high humidity control on a life-cycle basis. In addition, coordination of controls between the dehumidifier and air conditioner can help improve the distribution of conditioned air throughout the house. Based on this information, the development and testing of a prototype air conditioning/dehumidification system was initiated and focused on integrating a standalone room air dehumidifier and a conventional residential air handler into a single package. Potential benefits of the integrated system include lower first cost, improved air distribution due to supply air fan controls, and noise reduction (dehumidifier located in air handler cabinet instead of standalone in the conditioned space). The following sections summarize the design and construction of the prototype unit and the laboratory and field tests that were performed to evaluate the performance of the prototype system. Further details are available in the final task report (Raustad et al. 2007). PROTOTYPE CONSTRUCTION The construction of the prototype air conditioning/dehumidification system involved
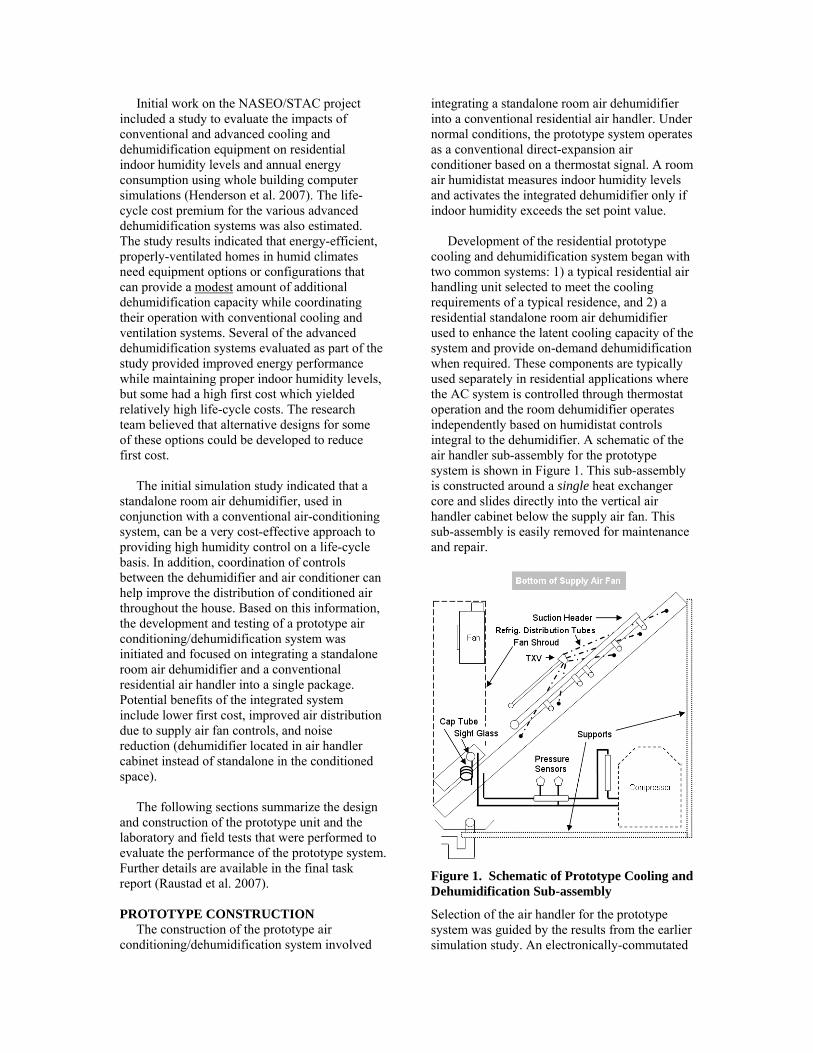
integrating a standalone room air dehumidifier into a conventional residential air handler. Under normal conditions, the prototype system operates as a conventional direct-expansion air conditioner based on a thermostat signal. A room air humidistat measures indoor humidity levels and activates the integrated dehumidifier only if indoor humidity exceeds the set point value. Development of the residential prototype cooling and dehumidification system began with two common systems: 1) a typical residential air handling unit selected to meet the cooling requirements of a typical residence, and 2) a residential standalone room air dehumidifier used to enhance the latent cooling capacity of the system and provide on-demand dehumidification when required. These components are typically used separately in residential applications where the AC system is controlled through thermostat operation and the room dehumidifier operates independently based on humidistat controls integral to the dehumidifier. A schematic of the air handler sub-assembly for the prototype system is shown in Figure 1. This sub-assembly is constructed around a single heat exchanger core and slides directly into the vertical air handler cabinet below the supply air fan. This sub-assembly is easily removed for maintenance and repair.
Figure 1. Schematic of Prototype Cooling and Dehumidification Sub-assembly
Selection of the air handler for the prototype system was guided by the results from the earlier simulation study. An electronically-commutated
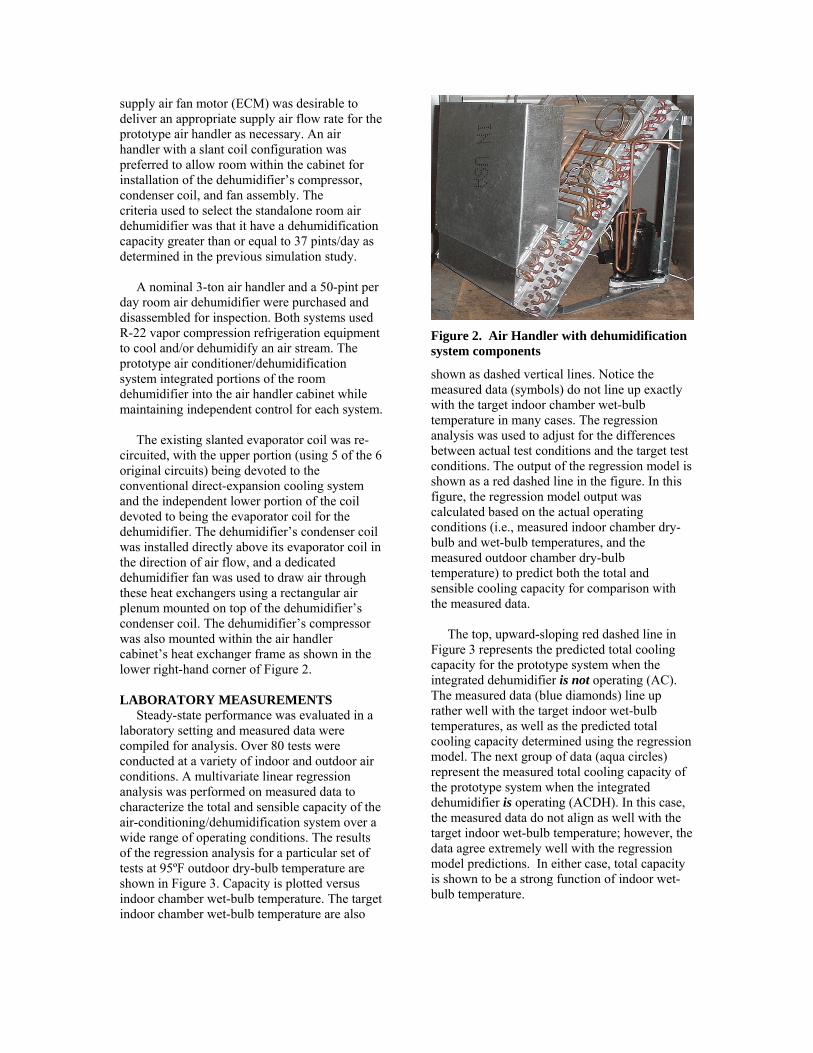
supply air fan motor (ECM) was desirable to deliver an appropriate supply air flow rate for the prototype air handler as necessary. An air handler with a slant coil configuration was preferred to allow room within the cabinet for installation of the dehumidifier’s compressor, condenser coil, and fan assembly. The criteria used to select the standalone room air dehumidifier was that it have a dehumidification capacity greater than or equal to 37 pints/day as determined in the previous simulation study. A nominal 3-ton air handler and a 50-pint per day room air dehumidifier were purchased and disassembled for inspection. Both systems used R-22 vapor compression refrigeration equipment to cool and/or dehumidify an air stream. The prototype air conditioner/dehumidification system integrated portions of the room dehumidifier into the air handler cabinet while maintaining independent control for each system. The existing slanted evaporator coil was re-circuited, with the upper portion (using 5 of the 6 original circuits) being devoted to the conventional direct-expansion cooling system and the independent lower portion of the coil devoted to being the evaporator coil for the dehumidifier. The dehumidifier’s condenser coil was installed directly above its evaporator coil in the direction of air flow, and a dedicated dehumidifier fan was used to draw air through these heat exchangers using a rectangular air plenum mounted on top of the dehumidifier’s condenser coil. The dehumidifier’s compressor was also mounted within the air handler cabinet’s heat exchanger frame as shown in the lower right-hand corner of Figure 2. LABORATORY MEASUREMENTS Steady-state performance was evaluated in a laboratory setting and measured data were compiled for analysis. Over 80 tests were conducted at a variety of indoor and outdoor air conditions. A multivariate linear regression analysis was performed on measured data to characterize the total and sensible capacity of the air-conditioning/dehumidification system over a wide range of operating conditions. The results of the regression analysis for a particular set of tests at 95ºF outdoor dry-bulb temperature are shown in Figure 3. Capacity is plotted versus indoor chamber wet-bulb temperature. The target indoor chamber wet-bulb temperature are also
Figure 2. Air Handler with dehumidification system components
shown as dashed vertical lines. Notice the measured data (symbols) do not line up exactly with the target indoor chamber wet-bulb temperature in many cases. The regression analysis was used to adjust for the differences between actual test conditions and the target test conditions. The output of the regression model is shown as a red dashed line in the figure. In this figure, the regression model output was calculated based on the actual operating conditions (i.e., measured indoor chamber dry-bulb and wet-bulb temperatures, and the measured outdoor chamber dry-bulb temperature) to predict both the total and sensible cooling capacity for comparison with the measured data. The top, upward-sloping red dashed line in Figure 3 represents the predicted total cooling capacity for the prototype system when the integrated dehumidifier is not operating (AC). The measured data (blue diamonds) line up rather well with the target indoor wet-bulb temperatures, as well as the predicted total cooling capacity determined using the regression model. The next group of data (aqua circles) represent the measured total cooling capacity of the prototype system when the integrated dehumidifier is operating (ACDH). In this case, the measured data do not align as well with the target indoor wet-bulb temperature; however, the data agree extremely well with the regression model predictions. In either case, total capacity is shown to be a strong function of indoor wet-bulb temperature.
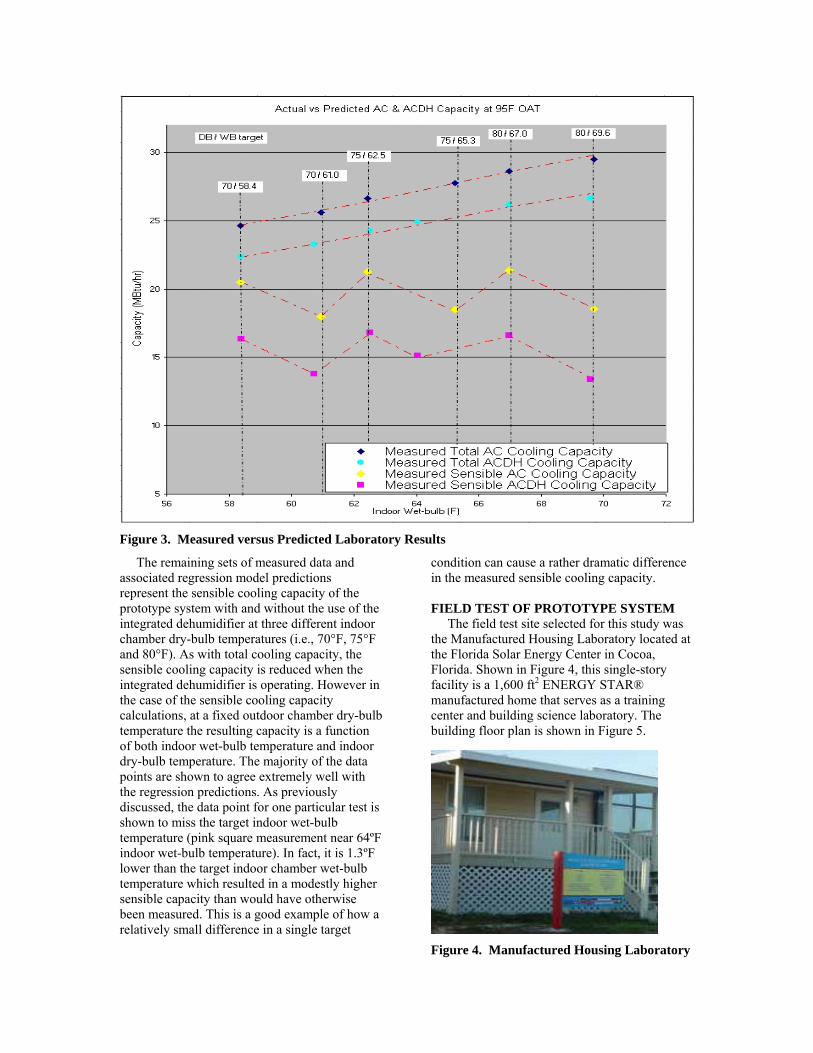
Figure 3. Measured versus Predicted Laboratory Results
The remaining sets of measured data and associated regression model predictions represent the sensible cooling capacity of the prototype system with and without the use of the integrated dehumidifier at three different indoor chamber dry-bulb temperatures (i.e., 70°F, 75°F and 80°F). As with total cooling capacity, the sensible cooling capacity is reduced when the integrated dehumidifier is operating. However in the case of the sensible cooling capacity calculations, at a fixed outdoor chamber dry-bulb temperature the resulting capacity is a function of both indoor wet-bulb temperature and indoor dry-bulb temperature. The majority of the data points are shown to agree extremely well with the regression predictions. As previously discussed, the data point for one particular test is shown to miss the target indoor wet-bulb temperature (pink square measurement near 64ºF indoor wet-bulb temperature). In fact, it is 1.3ºF lower than the target indoor chamber wet-bulb temperature which resulted in a modestly higher sensible capacity than would have otherwise been measured. This is a good example of how a relatively small difference in a single target
condition can cause a rather dramatic difference in the measured sensible cooling capacity. FIELD TEST OF PROTOTYPE SYSTEM The field test site selected for this study was the Manufactured Housing Laboratory located at the Florida Solar Energy Center in Cocoa, Florida. Shown in Figure 4, this single-story facility is a 1,600 ft2 ENERGY STAR® manufactured home that serves as a training center and building science laboratory. The building floor plan is shown in Figure 5.
Figure 4. Manufactured Housing Laboratory
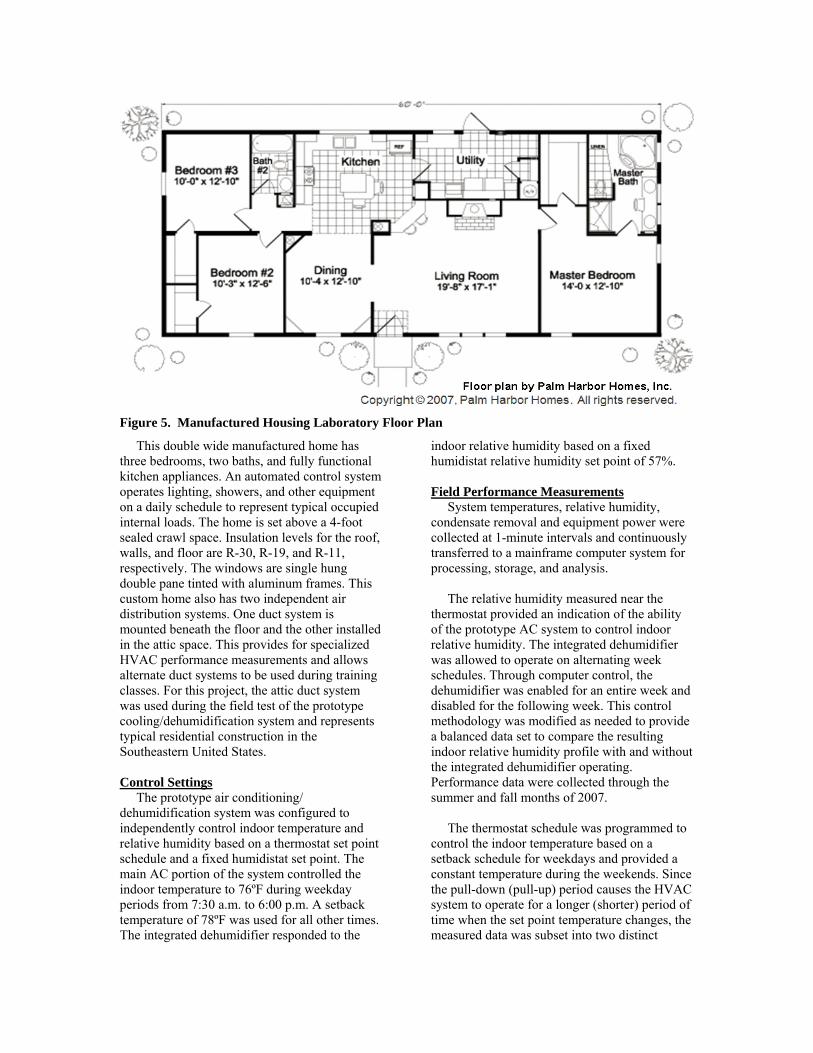
Figure 5. Manufactured Housing Laboratory Floor Plan
This double wide manufactured home has three bedrooms, two baths, and fully functional kitchen appliances. An automated control system operates lighting, showers, and other equipment on a daily schedule to represent typical occupied internal loads. The home is set above a 4-foot sealed crawl space. Insulation levels for the roof, walls, and floor are R-30, R-19, and R-11, respectively. The windows are single hung double pane tinted with aluminum frames. This custom home also has two independent air distribution systems. One duct system is mounted beneath the floor and the other installed in the attic space. This provides for specialized HVAC performance measurements and allows alternate duct systems to be used during training classes. For this project, the attic duct system was used during the field test of the prototype cooling/dehumidification system and represents typical residential construction in the Southeastern United States. Control Settings The prototype air conditioning/ dehumidification system was configured to independently control indoor temperature and relative humidity based on a thermostat set point schedule and a fixed humidistat set point. The main AC portion of the system controlled the indoor temperature to 76ºF during weekday periods from 7:30 a.m. to 6:00 p.m. A setback temperature of 78ºF was used for all other times. The integrated dehumidifier responded to the
indoor relative humidity based on a fixed humidistat relative humidity set point of 57%. Field Performance Measurements System temperatures, relative humidity, condensate removal and equipment power were collected at 1-minute intervals and continuously transferred to a mainframe computer system for processing, storage, and analysis. The relative humidity measured near the thermostat provided an indication of the ability of the prototype AC system to control indoor relative humidity. The integrated dehumidifier was allowed to operate on alternating week schedules. Through computer control, the dehumidifier was enabled for an entire week and disabled for the following week. This control methodology was modified as needed to provide a balanced data set to compare the resulting indoor relative humidity profile with and without the integrated dehumidifier operating. Performance data were collected through the summer and fall months of 2007. The thermostat schedule was programmed to control the indoor temperature based on a setback schedule for weekdays and provided a constant temperature during the weekends. Since the pull-down (pull-up) period causes the HVAC system to operate for a longer (shorter) period of time when the set point temperature changes, the measured data was subset into two distinct
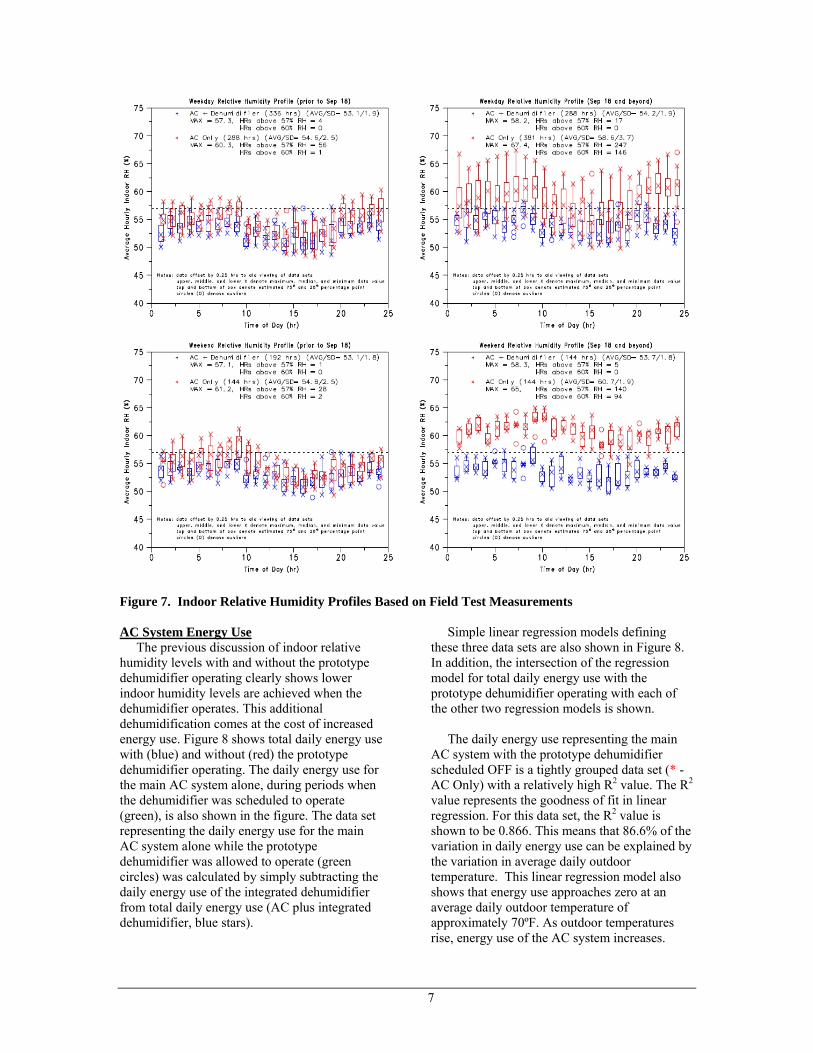
groups; weekdays and weekends. The measured data was further subset to allow review of the impacts of prototype dehumidifier operation during the hotter parts of summer and again during more mild weather conditions. The more mild weather conditions discussed here represent times when the outdoor temperature was low enough to reduce or eliminate operation of the cooling portion of the prototype system. When the runtime of the cooling system is low (or zero), the amount of moisture removed from indoors is also low (or zero). At these times, indoor relative humidity can increase to uncomfortable levels if an alternate means of dehumidification is not used. Figure 7 shows the indoor relative humidity profile for the four subsets of measured data collected throughout the monitoring period. The plots in the upper left and lower left corner of the figure show the relative humidity profile for hot summer weekdays (using setback scheme) and weekends (no setback), respectively. Since the main AC system runtimes are mostly high, there is little need for additional dehumidification. This can be seen for both weekday and weekend data sets. Although the prototype dehumidification system is shown to maintain a slightly lower indoor relative humidity, the need for addition dehumidification is limited since the relative humidity with and without the integrated dehumidifier operating is reasonably controlled at or below 60%. The plots in the upper right and lower right corner of the figure show the relative humidity profile for weekdays and weekends when the outdoor temperature was milder. The indoor relative humidity when the prototype dehumidifier is not operating is shown to be quite high, reaching over 67%. However, when the prototype dehumidifier is operating, the indoor relative humidity is actively controlled to just above the relative humidity set point of 57%. The number of hours that the indoor relative humidity exceeds the humidistat set point of 57% and a 60% relative humidity threshold is shown in each figure. Prior to September 18, 2007, when the daily average outdoor temperatures were high, the number of hours with indoor humidity greater than 60%RH was zero when the integrated dehumidifier operated and only exceeded the relative humidity set point of 57% for a few hours. During this same time period, the number of hours exceeding 60% relative humidity when the integrated dehumidifier did not operate is also low;
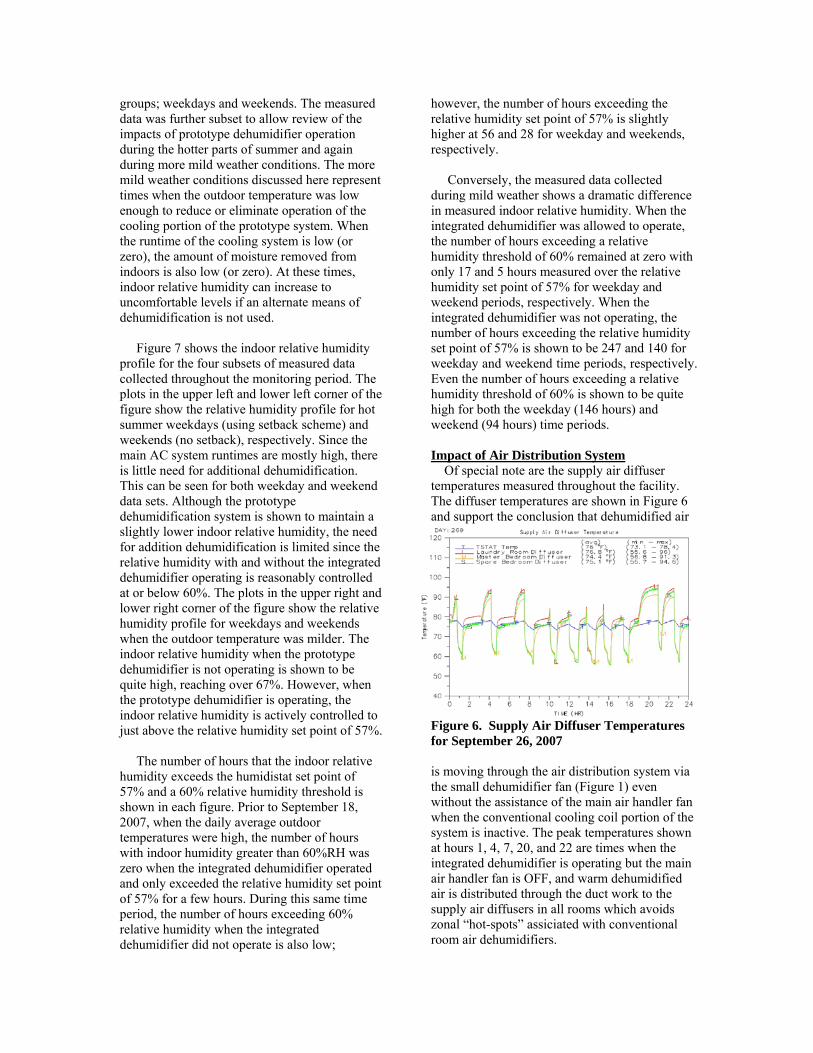
however, the number of hours exceeding the relative humidity set point of 57% is slightly higher at 56 and 28 for weekday and weekends, respectively. Conversely, the measured data collected during mild weather shows a dramatic difference in measured indoor relative humidity. When the integrated dehumidifier was allowed to operate, the number of hours exceeding a relative humidity threshold of 60% remained at zero with only 17 and 5 hours measured over the relative humidity set point of 57% for weekday and weekend periods, respectively. When the integrated dehumidifier was not operating, the number of hours exceeding the relative humidity set point of 57% is shown to be 247 and 140 for weekday and weekend time periods, respectively. Even the number of hours exceeding a relative humidity threshold of 60% is shown to be quite high for both the weekday (146 hours) and weekend (94 hours) time periods. Impact of Air Distribution System Of special note are the supply air diffuser temperatures measured throughout the facility. The diffuser temperatures are shown in Figure 6 and support the conclusion that dehumidified air
Figure 6. Supply Air Diffuser Temperatures for September 26, 2007 is moving through the air distribution system via the small dehumidifier fan (Figure 1) even without the assistance of the main air handler fan when the conventional cooling coil portion of the system is inactive. The peak temperatures shown at hours 1, 4, 7, 20, and 22 are times when the integrated dehumidifier is operating but the main air handler fan is OFF, and warm dehumidified air is distributed through the duct work to the supply air diffusers in all rooms which avoids zonal “hot-spots” assiciated with conventional room air dehumidifiers.
7
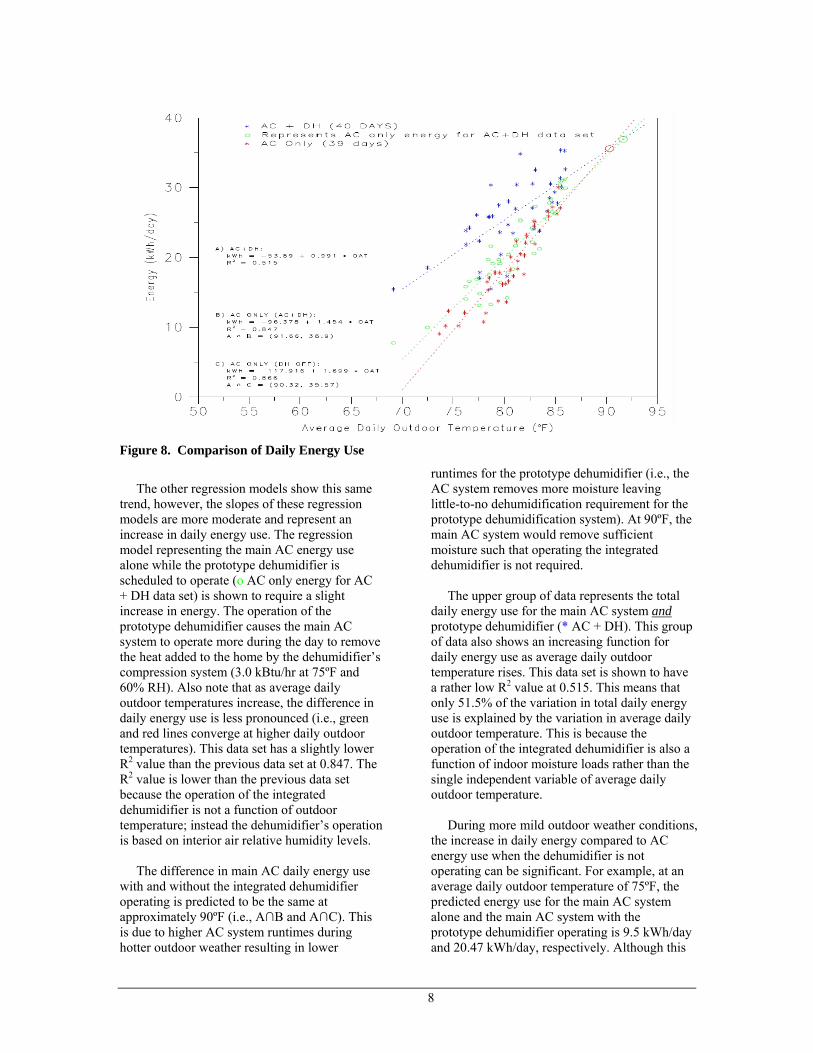
Figure 7. Indoor Relative Humidity Profiles Based on Field Test Measurements AC System Energy Use The previous discussion of indoor relative humidity levels with and without the prototype dehumidifier operating clearly shows lower indoor humidity levels are achieved when the dehumidifier operates. This additional dehumidification comes at the cost of increased energy use. Figure 8 shows total daily energy use with (blue) and without (red) the prototype dehumidifier operating. The daily energy use for the main AC system alone, during periods when the dehumidifier was scheduled to operate (green), is also shown in the figure. The data set representing the daily energy use for the main AC system alone while the prototype dehumidifier was allowed to operate (green circles) was calculated by simply subtracting the daily energy use of the integrated dehumidifier from total daily energy use (AC plus integrated dehumidifier, blue stars).
Simple linear regression models defining these three data sets are also shown in Figure 8. In addition, the intersection of the regression model for total daily energy use with the prototype dehumidifier operating with each of the other two regression models is shown. The daily energy use representing the main AC system with the prototype dehumidifier scheduled OFF is a tightly grouped data set (* - AC Only) with a relatively high R2 value. The R2 value represents the goodness of fit in linear regression. For this data set, the R2 value is shown to be 0.866. This means that 86.6% of the variation in daily energy use can be explained by the variation in average daily outdoor temperature. This linear regression model also shows that energy use approaches zero at an average daily outdoor temperature of approximately 70ºF. As outdoor temperatures rise, energy use of the AC system increases.
8
Figure 8. Comparison of Daily Energy Use
The other regression models show this same trend, however, the slopes of these regression models are more moderate and represent an increase in daily energy use. The regression model representing the main AC energy use alone while the prototype dehumidifier is scheduled to operate (o AC only energy for AC + DH data set) is shown to require a slight increase in energy. The operation of the prototype dehumidifier causes the main AC system to operate more during the day to remove the heat added to the home by the dehumidifier’s compression system (3.0 kBtu/hr at 75ºF and 60% RH). Also note that as average daily outdoor temperatures increase, the difference in daily energy use is less pronounced (i.e., green and red lines converge at higher daily outdoor temperatures). This data set has a slightly lower R2 value than the previous data set at 0.847. The R2 value is lower than the previous data set because the operation of the integrated dehumidifier is not a function of outdoor temperature; instead the dehumidifier’s operation is based on interior air relative humidity levels. The difference in main AC daily energy use with and without the integrated dehumidifier operating is predicted to be the same at approximately 90ºF (i.e., A∩B and A∩C). This is due to higher AC system runtimes during hotter outdoor weather resulting in lower
runtimes for the prototype dehumidifier (i.e., the AC system removes more moisture leaving little-to-no dehumidification requirement for the prototype dehumidification system). At 90ºF, the main AC system would remove sufficient moisture such that operating the integrated dehumidifier is not required. The upper group of data represents the total daily energy use for the main AC system and prototype dehumidifier (* AC + DH). This group of data also shows an increasing function for daily energy use as average daily outdoor temperature rises. This data set is shown to have a rather low R2 value at 0.515. This means that only 51.5% of the variation in total daily energy use is explained by the variation in average daily outdoor temperature. This is because the operation of the integrated dehumidifier is also a function of indoor moisture loads rather than the single independent variable of average daily outdoor temperature. During more mild outdoor weather conditions, the increase in daily energy compared to AC energy use when the dehumidifier is not operating can be significant. For example, at an average daily outdoor temperature of 75ºF, the predicted energy use for the main AC system alone and the main AC system with the prototype dehumidifier operating is 9.5 kWh/day and 20.47 kWh/day, respectively. Although this
9
difference may seem high, these operating conditions only occur during mild weather conditions. During hot summer months, the main AC system operates a significant portion of the day and additional dehumidification requirements are minimal (or non-existent). During winter months, the cool and dry outdoor weather reduces (or eliminates) the need for dehumidification. It is during the shoulder months, in spring and fall, that the operation of the prototype dehumidifier will improve indoor comfort conditions, and thus requires additional energy use. SUMMARY AND CONCLUSIONS This study involved the design, construction and testing of a prototype air conditioning and dehumidification system consisting of a conventional split DX system with a small dehumidifier integrated in the air handler. The prototype system was constructed using currently-available parts and tested in both a laboratory setting and at a field test site. Preliminary results are promising in that a fully-integrated system can be easily constructed and installed in the place of conventional air handling equipment. Controls for the prototype equipment are also simple to install and provide independent control of sensible (temperature) and latent (moisture) loads. Laboratory tests indicate that the integrated dehumidifier can provide increased latent cooling capacity without significantly impacting the total cooling capacity of the system. This results in a reduction of the delivered sensible heat ratio. The main AC cooling coil and the integrated dehumidifier can be independently controlled and provide enhanced dehumidification during times when sensible loads are modest and indoor relative humidity levels tend to rise. A summary of the important topics identified during this phase of this study are:
• An integrated dehumidification system is simple to manufacture
• An integrated system requires little or no additional installation costs (i.e., separate duct system, dedicated condensate drain line, or separate location for a standalone room air dehumidifier)
• The system can be manufactured with only a low to moderate increase in first cost
• The system provides independent control of temperature and relative humidity
• A single duct system seems to adequately distribute dehumidified air
• This configuration eliminates the “hot spot” typically noted by standalone room air dehumidifier users
• Dehumidifier operation dries the interior of the duct work when operating alone
• The space where a standalone room air dehumidifier would be located is recovered
ACKNOWLEDGEMENTS Special thanks go to the National Association of State Energy Officials, the State Technologies Advancement Collaborative, and Southern Company Services for their funding and support throughout this project. The University of Central Florida also provided cost share towards the funding of this project. Special thanks also go to the Building America Industrialized Housing Partnership for providing the manufacturered housing laboratory used for testing the prototype air conditioner/dehumidification system. REFERENCES Henderson, H.I., D. Shirey and R. Raustad. 2007. Task 4 – Develop New Climate-Sensitive Air Conditioner: Simulation Results and Cost Benefit Analysis. Proctor Engineering 2007. Hot Dry Climate Air Conditioner (HDAC) Combined Field Test Report. Final Report. July. Raustad, R.A., D. Shirey, D. Parker, J. Sherwin, H. Henderson. 2007. Development of a New Climate-Sensitive Air Conditioner: Prototype System Design, Construction and Testing. Task 4.2 Final Report FSEC-CR-1731-07.