Embed Size (px)
Citation preview
246
CHAP TER 11
Case Study in Product and/or Industrial Design
Learning Design Wisdom By Augmenting Physical Studio Critique With Online Self-Assessment
Chinmay Kulkarni and Scott Klemmer Stanford University
ABSTRACT
Accurately assessing the quality of one’s work is a crucial skill for professional designers and design students alike. This paper describes teaching materials that help students self-assess their work in a design course at a large university in the US. Using these materials, students have been successful in evaluating themselves—in 69% of all weekly student submissions, self-assessed scores matched independent staff-assessments. Self-assessment accuracy also improved through the term (F(1; 1332) = 31:72; p < 0:001). This submission introduces a novel workflow for integrating studio feedback with self-assessment in design education and describes our experiences using this approach for the last three years with more than 400 students. Student success in self-evaluation suggests that techniques from these materials can be integrated into design environments elsewhere. We outline our plans to extend these materials for use with peer-evaluation and for assessments in large online design classes.
INTRODUCTION
What is good design? Learning the answers to this question is a key part of student’s design education. Furthermore, the ability to accurately assess the quality of one’s work is a useful skill for the designer [3] and, perhaps, for all creative professions. Unfortunately, students (especially in engineering schools) often struggle with both these issues. In part, this is because design places “emphasis on synthesis rather than predominantly on analysis” [3] but also because design often has no clear right or wrong answers. What educators need, then, are techniques that help students learn the characteristics of good design, and enable them to examine their own work for these characteristics.

Case S tud y in Product and /or Indust r ia l Design 247
Self-assessment is an effective technique for building a conceptual model of ‘good’ work in a domain [3]. Prior work has demonstrated that self-assessment also improves learning and student performance. In critical writing, students exposed to self-evaluation outperformed those who weren’t. Furthermore, these gains were larger for weaker students [11]. In engineering design, self evaluation has been demonstrated to help students accurately gauge their own strengths and weaknesses [3]. Student feedback also suggests that self-evaluation changes the role of the teaching staff, making them coaches rather than evaluators. This paper describes materials built around self-assessment for an introductory HCI course at our university. The goal of these materials is to help students learn to evaluate their own design work. These materials comprise five main components:1) a set of detailed weekly assignments that help students learn human-centered design through actual practice of the technique; 2) a set of rubrics students use to evaluate their work in these weekly assignments; 3) an online submission system that encourages students to look at each others’ work to encourage collaborative learning; 4) an assessment system that combines self-assessment, which encourages reflection, with independent staff assessment that provides critical feedback; and 5) an analytic toolset that enables us iterative improvement of the other components.
The next section describes this self-assessment system. Later sections describe how it has helped improve the class, and some challenges we have faced. We conclude with plans for the future, including how these self-assessment materials could be used for other applications, such as online HCI education.
SELF-ASSESSMENT IN ACTION
This paper describes an introductory project-based HCI class. In 2011, the class had 156 enrolled students (both undergrad and graduate) from 22 majors (Figure 11.1). Students participate in a 10-week user-centered design process by designing and implementing a working prototype of a mobile web application of their choosing. Creating a mobile web-app allows students to pursue ideas that are fairly unique, yet sufficiently constrained that they provide homogeneity that enables students to learn from each other. This homogeneity also helps in grading.
This class has introduced a number of components over the last three years that support self-assessment and peer learning, that we describe below.

248 Refra ming Qual i t y Assu ra nce
Weekly Studios
12-15 person weekly studios supplement class lectures. Stu- dents present their work over the past week and share ideas. Studios last 50 minutes and are held by TAs throughout the day every Friday. Besides providing students an opportunity to interact and learn from each other, studios provide a plat- form to receive critical feedback from peers [12].
Figure 11.1. Course enrollment: while a large fraction of students (47%) major in Computer Science, other majors are well-represented.
Weekly Assignments and Online Submissions
Weekly assignments guide students through the design and implementation of a mobile web-app of their choosing. Early assignments are individual, while those in the later half of the term are performed in teams.
All assignments are submitted online. When assignments include paper prototypes or other physical artifacts students exhibit these in studio, and upload pictures online. Online sub- missions (but not the grades) are visible to all students in the class, along with students’ name. Informally, we have noticed that public visibility helps grading to be seen as fair. More importantly, it enables students learn from each other’s online work and incentivizes higher quality work. For instance, in the 2011 version of the class, several student teams developed projects using mobile development frameworks like jQuery- Mobile
Case S tud y in Product and /or Indust r ia l Design 249
and PhoneGap. Though course-staff did not provide any support for these frameworks, these teams taught them- selves the frameworks in a completely community-supported fashion.
Rubrics
Evaluation that is performed with the help of well-defined rubrics leads to students developing a deeper understanding of what constitutes high-quality work and makes the grading seem more fair and transparent [1]. Rubrics also provide students with more detailed and easily understandable feed- back [2] with minimal staff effort.
Every assignment in this course includes a rubric (see Table 11.1 for an example). We think that a clear understanding of the rubric is essential to the success of self-assessment. There- fore, at the end of each studio, a teaching assistant walks stu- dents through the goals and expectations of the next assignment, describes each rubric item in detail and answers any student questions.
SELF-ASSESSMENT AND STAFF GRADING
Self-evaluation occurs at the end of each studio session, after all students have presented and discussed their work with other students. Performing self-evaluation immediately after discussion helps students gain understanding through self- reflection. Discussion with peers enables them to see the relative standing of their work [7].
Once students have submitted their self-evaluation, teaching staff grade the students using the same rubrics that students used for self-assessment. This grading is done blind to the grades the students gave themselves. Our online submissions system automatically calculates the student’s final grade as the self-assigned grade if the self-assigned and staff-assigned grades are close (the 2011 version of the class allowed a 3% difference between the grades). If the grades are not close, then the student is automatically assigned the teaching staff grade. Grades are then released to students, such that feed- back from the staff can inform work on the next assignment.
Incentivizing Accurate Self-assessment
The ability to self-assess is a useful skill in its own right, so we incentivize students to self-assess accurately. For the 2011 year, students were awarded credit based on how close their self-evaluation was to staff grades, with the maximum

250 Refra ming Qual i t y Assu ra nce
bonus worth 2.5% of the points from all assignments. Be- sides incentivizing a useful skill, this also mitigates the effect of “gaming” self-evaluation, by providing students close to the maximum a student could gain by consistently grading herself above the staff-grade. In practice, no student evaluated themselves more than 2.5% above the staff grade across the quarter.
How Accurately do Students Self-assess?
Having two independent measures of a student’s performance (self- and staff-assessment) enables us to measure the effectiveness of self-grading. Overall, for the 2011 year, 69% of all student submissions got their self-assigned grade. Even when students didn’t get their own grade, these grades correlated well with the staff assigned grades. The overall Pearson correlation between the two measures for all submissions was 0.91 (t(2028) = 103.32, p < 0.0001).
Making Rubrics more Flexible
Because the class involves a project of a student’s own choosing, implementation tasks for projects vary widely. As such, it is not possible to come up with a reasonable single rubric that would fit all possible projects. Could students develop their own rubric for evaluating their projects? Guiding questions Bare minimum Satisfactory effort &
Performance Above & Beyond
Point of view. Does your point of view relate to the design brief, clearly express a problem / opportunity, and clearly con- vey what a good solution needs to accomplish? (Max 20: 10 for the problem, 10 for the solution requirement)
0-7: The problem is unclear / missing, the solution requirement is unclear / missing, or the point of view is unrelated to the design brief.
8-15: The point of view relates to the brief and the problem and solution requirement are clearly stated, but the solution requirement is either too general (anything that solves the problem meets the requirement) or too specific (only one partic- ular implementation meets the requirement).
16-20: The problem and solution requirement are clearly stated. The re-quirement provides focus without demanding one specific implementation.
Storyboards. Do they both address your point of view? Do they diverge in the solutions? (Max 40: 20 per story- board)
0-16: The storyboards are hard to follow or do not address the point of view.
17-33: The storyboards reasonably address the point of view, but either a reader may have lingering questions about the situations depicted or the solutions don’t diverge much.
34-40: The storyboards are easy to follow and have diverging solutions. Some- one else could come up with distinct pro- totypes just from looking at your story boards.
Paper prototypes. Did you explore two clearly different interfaces
0-16: The prototypes are incomplete in significant ways.
17-33: The prototypes are mostly complete. The purpose of each screen is
34-40: The prototypes explore two different
Case S tud y in Product and /or Indust r ia l Design 251
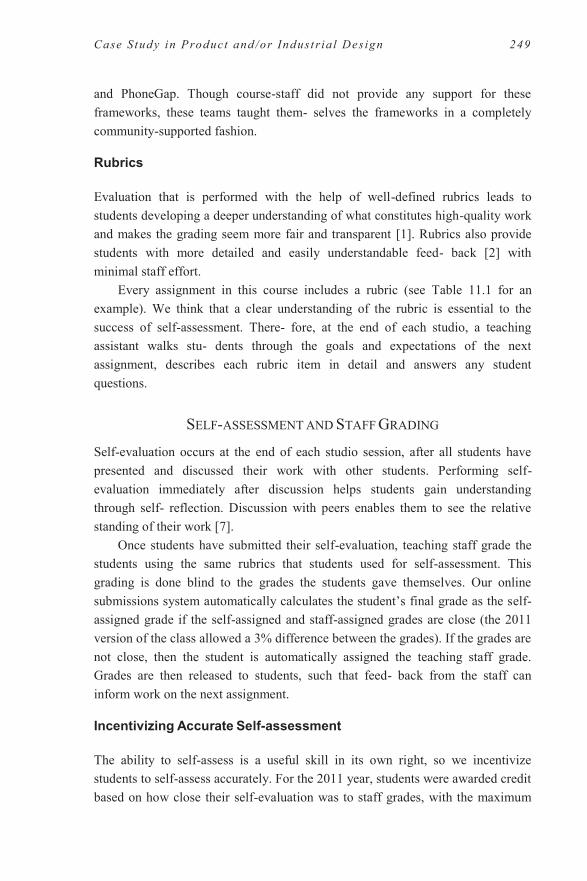
implementing the same idea? How was the quality of paper prototype? Does it feel dynamic, like a working application? Were you creative when implementing the interactions? (Max 40: 20 per prototype)
Many screens refer to screens that are not prototyped, and it’s often unclear what a certain screen does.
clear. But maybe the interfaces are not that distinct and share many similarities. Or maybe a user looking at the proto- type may sometimes have a question about how to navigate between screens, how to use a form on a screen, or what some element on a screen is doing there
interfaces and are detailed enough so that (1) a user can get a good feel for how the application works and flows and (2)
a programmer can use the prototypes to implement a skeleton web-application that has working forms and links.
Table 11.1. Rubric for assignment in Week 3: Prototyping. Rubrics are detailed, and provide objective measures of performance wherever possible.
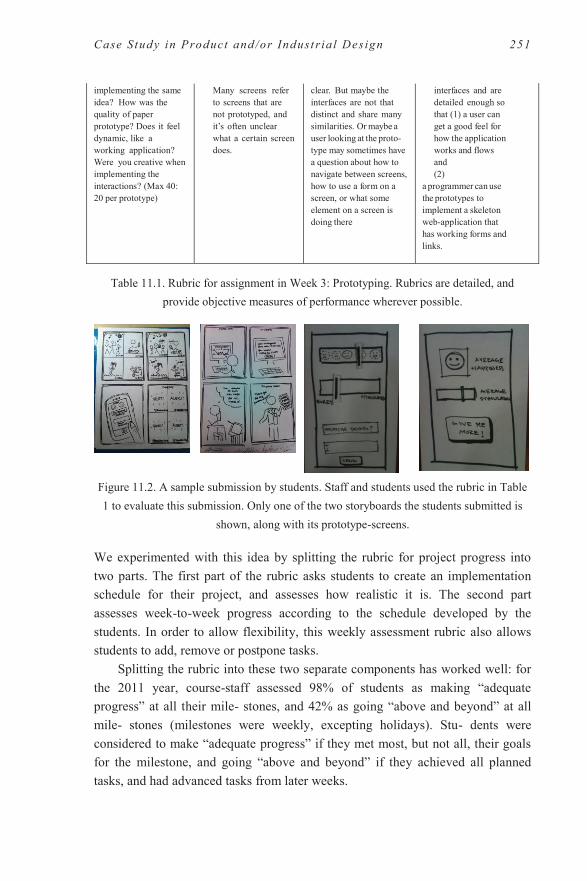
Figure 11.2. A sample submission by students. Staff and students used the rubric in Table 1 to evaluate this submission. Only one of the two storyboards the students submitted is
shown, along with its prototype-screens. We experimented with this idea by splitting the rubric for project progress into two parts. The first part of the rubric asks students to create an implementation schedule for their project, and assesses how realistic it is. The second part assesses week-to-week progress according to the schedule developed by the students. In order to allow flexibility, this weekly assessment rubric also allows students to add, remove or postpone tasks.
Splitting the rubric into these two separate components has worked well: for the 2011 year, course-staff assessed 98% of students as making “adequate progress” at all their mile- stones, and 42% as going “above and beyond” at all mile- stones (milestones were weekly, excepting holidays). Stu- dents were considered to make “adequate progress” if they met most, but not all, their goals for the milestone, and going “above and beyond” if they achieved all planned tasks, and had advanced tasks from later weeks.

252 Refra ming Qual i t y Assu ra nce
This success suggests that such a split approach involving students in their own evaluation could allow rubrics to be used even when the evaluation task is not well-defined. Further- more, Andrade [2] suggests involving students in creating a rubric as a way to help them understand pedagogical goals more clearly; this split-rubric method may make such collaboration practical in large classes.
IMPROVING EDUCATION THROUGH DATA ANALYTICS
Online submissions of assignments lead to a large amount of data in an analyzable form—the time assignments are turned in, how students grade themselves (and how staff grade them), even the actual text of the submission. At our university, we use this data towards three main goals: 1) to en- sure that the course is meeting goals that are hard to measure through other means such as student feedback; 2) to identify problems early and to discover potential areas for improving teaching; and 3) to help staff identify and focus on students that may need help.
Below, we offer vignettes of each of these applications. All numbers are from the 2011 class.
Do Students get Better at Self-assessment?
Answering this question is difficult based on student feedback—formal University feedback doesn’t ask about self-assessment, and students themselves may not be able to accurately gauge themselves.
However, using assignment submission data, we see that students indeed improve. We performed a repeated measures ANOVA on the accuracy of the self-evaluations across the term and found that accuracy improves across the course of the term F (1, 1332) = 31.72, p < 0.001 (Figure 11.3).
Improving Rubrics and Teaching
Analyzing submission data also enables us to improve rubrics by identifying items that are confusing. For instance, we see that given the general trend of decreasing differences between self evaluated and staff assigned scores (Figure 11.3), Assignment 7 (User Testing 1) has an unusually poor correlation between self-assessed and the staff-assessed scores (Pearson = 0.86, vs. the mean 0.91). Looking deeper, we see that the rubric item in assignment 7 which has the lowest self-and- staff correlation asks students to come up with a list of “who did what” that week toward the quarter-long project. This is the first time in the quarter that

Case S tud y in Product and /or Indust r ia l Design 253
such a status update was required, and the data suggest that students did not understand requirements clearly.
Student feedback at the end of the quarter echoed this concern about this assignment “Our group knew what we had to accomplish, and wrote the implementation plan to the level that we needed to, but it never seemed to be good enough...”
Formal student feedback is always helpful, but it is often obtained too late to improve the course for the current term. Using submission data directly, staff could identify the problem, solicit informal feedback, and improve rubrics later in the quarter that asked the “who did what” question.
Similarly, looking at grade distributions for rubric items across the class helps identify areas to improve teaching. For instance, for the 2011 year, a rubric item on a need-finding assignment had the lowest grades. This item required students to list the ideas they brainstormed to solve a user need they’d identified. The rubric graded students exclusively on the number of ideas brainstormed, and did not give more credit to more “insightful” ideas (following Osborn’s advice on brainstorming that “quantity is wanted” [10]). However, students seem to have not understood why credit was given to quantity: one student complained in end-of-quarter feedback, “Generate 20 good ideas instead of 25 silly ones? Expect to lose points.”
Identifying Students Who May Potentially Perform Poorly
The studio model of education relies particularly heavily on engaged students who can contribute meaningfully to their design team. Engagement is affected by two ingredients: the student’s commitment to work on class assignments and the student’s grasp of concepts taught in class. Can we identify students early on who are struggling to acquire these ingredients?

254 Refra ming Qual i t y Assu ra nce
Figure 11.3. Mean absolute error of self-evaluation over staff assigned grades improves over the term (lower is better)
Based on student submissions for the last two years, we have identified questions in early assignments that are predictive of poor performance toward the end of the term. We identify such questions by looking at correlations between the student’s grade on the assignment, and her final grade in the course. For the 2011 class, the three most predictive questions asked students to (a) brainstorm ideas for their project, (b) create storyboards for the use of their application, and to (c) create paper prototypes of their application. In general, questions with high predictive power test both the student’s commitment to work on class assignments (such as number of prototypes created) and the student’s grasp of concepts taught in class (e.g., storyboards should show the prototype being used in context).
Based on the above features and student major and year, we have built a random-forest classifier [4] to identify students who may perform poorly. We plan to use this classifier to identify students who are not sufficiently engaged or who may need help understanding course material.
FUTURE DIRECTIONS
Challenges
The biggest challenge to building a successful self- assessment system is building effective rubrics. To create rubrics that help learners improve, requires one to

Case S tud y in Product and /or Indust r ia l Design 255
articulate heuristics for excellence that are concrete, but not limiting. Experience, student feedback and data analytics help, but the tension between concrete and limiting may be inherent to all creative domains.
Second, self-assessment also changes the role of the teach- ing staff. Instead of simply being graders, TAs are viewed as allies and advisors who help students do well on the rubric. This new role places greater responsibility on TAs, and is often unfamiliar.
Peer Evaluations
Prior work has established that given clear grading criteria, students “can make rational judgments on the achievements of their peers” [13]. For our online class, it is impractical for teaching staff to evaluate every student’s submission. There- fore, we plan to use peer-assessment to supplant assessment by the teaching staff. Rubrics developed for the offline course will be used both for self- and peer- assessment. Rubric-based feedback also addresses a challenge inherent in international audiences: language differences that make it challenging for students to provide written feedback to peers.
Since peer-review is used to supplant staff evaluation, consistency of grading is also a potential concern. Calibrated peer review [6] offers a way to mitigate inconsistency by first training the peer-grader on a number of training assignments, and only allowing them to grade other students once they grade training assignments close enough to staff grades. Such a calibrated peer review system has been used successfully at other universities, e.g., for the Distributed Cognition class at UC San Diego by Edward Hutchins.

256 Refra ming Qual i t y Assu ra nce
Scaling HCI education
Figure 11.4. The upward trend in CS enrollment units at our University
While the importance of user-centered design has long been recognized [9], there is now increasing awareness of its importance in industry. This has led to a greater need and demand for design education. Enrollment in this course has increased every year since 2007, even considering the general upward trend in CS enrollment at our university (Figure 11.4). As another example, the recently launched online version of this class has enrollments in the tens of thousands. With classes getting larger, the ability of traditional staff- driven evaluation to accurately assess and help the student learn is being challenged. However, online design education offers powerful opportunities for building cross-cultural empathy and collaboration.
Self-assessment and related evaluation mechanisms (like peer assessment) offer one of the few hopes of scaling design education. Unlike other engineering disciplines, evaluating de- sign is an inherently human endeavor. Jonathan Grudin writes that “A central tenet of HCI is that we cannot design interaction of any complexity by the application of formal rules. It is always necessary to try interfaces out with people. . . ” [8]. How then could we automate, say, the evaluation of a proto- type? Could the storyboard for a new interactive system be evaluated by algorithm?
Unlike other hard-to-automate problems, however, design evaluation may also be difficult to crowdsource. Tohidi et. al. warn that “. . . design and creativity are specialized skills. There is no reason to expect them to be spontaneously manifest in those not trained in the field” [14]. Leveraging plat- forms like Mechanical Turk can thus be both invalid and also potentially harmful. Peer-

Case S tud y in Product and /or Indust r ia l Design 257
evaluation may solve this problem by using evaluators who, though non-expert, are interested in acquiring relevant skills and in learning the practice of design.
Flipping the Design Studio
An exciting opportunity for future work is to better under- stand the possibilities for a “flipped classroom” in design education. In a “traditional” classroom, students listen to lectures in class, and do problem-sets at home. In a flipped class- room, students do problem-sets in class instead, listening to lectures at home [5]. Given design’s emphasis on in-studio work and collaborative work, design seems like a natural fit for this model.
CONCLUSIONS
This paper introduced a novel workflow for augmenting studio-critique based design education with online self-assessment. Results over the past year demonstrate that this method enables students to accurately evaluate themselves. The accuracy of these evaluations improved over the term, which suggests that this method to be an effective means for teaching this important professional skill.
REFERENCES
Andrade, H. The effects of instructional rubrics on learning to write. Current Issues in Education 4, 4 (2001).
Andrade, H. Teaching with rubrics: The good, the bad, and the ugly. College Teaching 53, 1 (2005), 27–31.
Boud, D. Enhancing learning through self assessment. Routledge, 1995. Breiman, L. Random forests. Machine learning 45, 1 (2001), 5–32. Brown, B. Flipping the classroom (abstract only). In Proceedings of the 43rd
ACM technical symposium on Computer Science Education, ACM (2012), 681–681.
Carlson, P., and Berry, F. Calibrated peer review and assessing learning outcomes. In FRONTIERS IN EDUCATION CONFERENCE, vol. 2, STIPES (2003).
Dow, S., Fortuna, J., Schwartz, D., Altringer, B., Schwartz, D., and Klemmer, S. Prototyping dynamics: sharing multiple designs improves exploration, group rapport, and results. In Proceedings of the 2011 annual conference on Human factors in computing systems, ACM (2011), 2807–2816.

258 Refra ming Qual i t y Assu ra nce
Grudin, J. Ai and hci: Two fields divided by a common focus. AI Magazine 30, 4 (2009), 48.
Kelley, D., and Hartfield, B. The designer’s stance. In Bringing design to software, ACM (1996), 151–170.
Osborn, A. Applied imagination; principles and procedures of creative problem-solving. Scribner, 1963.
Ross, J., Rolheiser, C., and Hogaboam-Gray, A. Effects of self-evaluation training on narrative writing. Assessing Writing 6, 1 (1999), 107–132.
Scho¨n, D. The design studio: An exploration of its traditions and potentials. RIBA Publications for RIBA Building Industry Trust London, 1985.
Stefani, L. Peer, self and tutor assessment: relative reliabilities. Studies in Higher Education 19, 1 (1994), 69–75.
Tohidi, M., Buxton, W., Baecker, R., and Sellen, A. Getting the right design and the design right. In Proceedings of the SIGCHI conference on Human Factors in computing systems, ACM (2006), 1243–1252.
Note: This case study has been copyrighted by the authors and Stanford
University, 2012, and was reprinted in its entirety with permission.