Embed Size (px)
Citation preview
Case Study Guide
Underwriting►
Agency Training & Time
blocking►
Agency Production &
Sales►
Carrier Customer Service & Claims►
Carrier Talent Management,
Investment, KPIs►
Product Development & Management►
Customer Analysis ►
Competitive Analysis ►
Production Detail ►
Analytics:
Source Analysis ►
Agency Performance ►
Carrier Performance ►
Underwriting Detail ►
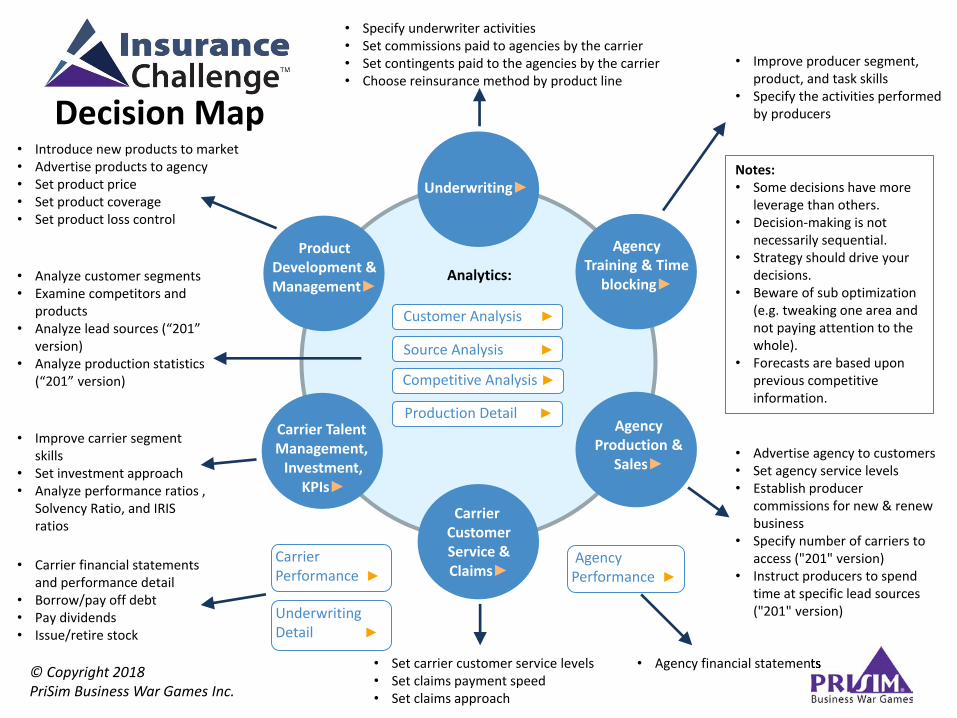
• Improve carrier segment skills
• Set investment approach • Analyze performance ratios ,
Solvency Ratio, and IRIS ratios
Notes: • Some decisions have more
leverage than others. • Decision-making is not
necessarily sequential. • Strategy should drive your
decisions. • Beware of sub optimization
(e.g. tweaking one area and not paying attention to the whole).
• Forecasts are based upon previous competitive information.
© Copyright 2018 PriSim Business War Games Inc.
• Analyze customer segments • Examine competitors and
products • Analyze lead sources (“201”
version) • Analyze production statistics
(“201” version)
• Introduce new products to market • Advertise products to agency • Set product price • Set product coverage • Set product loss control
• Specify underwriter activities • Set commissions paid to agencies by the carrier• Set contingents paid to the agencies by the carrier • Choose reinsurance method by product line
• Set carrier customer service levels • Set claims payment speed • Set claims approach
Decision Map
• Improve producer segment, product, and task skills
• Specify the activities performed by producers
• Advertise agency to customers • Set agency service levels • Establish producer
commissions for new & renew business
• Specify number of carriers to access ("201" version)
• Instruct producers to spend time at specific lead sources ("201" version)
• Carrier financial statements and performance detail
• Borrow/pay off debt • Pay dividends • Issue/retire stock
• Agency financial statements Agency financial statements
www.PriSim.com Page 3
Table of Contents – Case Study Guide
Welcome to the Insurance Challenge™ .................................................... 4
Objectives ................................................................................................ 4
What is a Simulation? ............................................................................... 5
Leading and Managing Your Insurance Business ..................................... 6
Customer Segmentation ........................................................................... 7
Product Development & Management ...................................................... 9
Carrier Underwriting ............................................................................... 10
Agency Production & Sales .................................................................... 12
Agency Training & Time-Blocking ........................................................... 14
Carrier Customer Service & Claims ........................................................ 15
Carrier Talent Management, Investment, KPIs ....................................... 15
Pro-Formas and Corporate Finance ....................................................... 16
Situation Analysis ................................................................................... 17
Customer, Competitor, and Source Analyses ......................................... 18
Production Pipeline................................................................................. 19
Glossary of Selected Terms Used in Insurance Challenge! .................... 21
© Copyright 2018, PriSim Business War Games Inc. (888) 4-PRISIM
Insurance Challenge™ Case Study Guide
All Rights Reserved. No part of this document may be reproduced or transmitted in any form or by any means now known or invented, electronic or mechanical, including photocopying, recording, or by any information storage or retrieval system without written permission. For information about this product, please contact PriSim Business War Games Inc. at (888) 4-PRISIM.
insurance challenge case study guide.docx
12/15/17 4:24 PM
www.PriSim.com Page 4
Welcome to the Insurance Challenge™
Today is your lucky day! You have been selected to be part of the leadership team of a struggling insurance carrier and agency network in competition with several other teams. You and your team will have sole control and responsibility for all decision-making.
Over several simulated decision periods (each period representing one year) you will manage the entire business. Your mission is simple: improve carrier and agency performance. You will make long-term (strategic) decisions as well as shorter-term (tactical) decisions.
At the end of each round of competition, you will receive feedback on your performance. Only time will reveal who will be most successful.
This class is a business class as opposed to a technical/specialty skills class. Our goal is to develop your business thinking, strategic thinking, financial acumen, leadership skills, and overall decision-making effectiveness. To best accomplish this we’ve put you into a live, interactive business laboratory. While the computerized simulation doesn't contain all the complexities and dynamics of your real business, it does contain the dynamics needed to effectively improve your business acumen and decision-making.
Best of luck!
NOTE: There are several versions of the Insurance Challenge. Your pre-read assignment instructions will tell you which version you will be using during your competition.
101-version “Simple Conglomerate”: Consisting of both carrier and agency decisions. 201-version: The 201-version is more complex and involves more decision-making. If you
are not competing in the 201-version then you can ignore items that have been tagged as 201-version only.
Carrier-Only version: If you have been told that you are using the Carrier-Only version of the simulation, then you can skip any agency-level decisions and dynamics that are described in this manual.
Personal Insurance version: If you are using this version, only Personal insurance products will be available, not Commercial or Specialty.
Regardless of what course you attend, the products and markets you will be competing in may be different from those described in this manual.
NOTE: Any product-specific descriptions in this manual are for demonstration purposes only.
Objectives
Running an insurance company and agency network is a complex undertaking. This simulation has been carefully designed to mirror many of the realities of the insurance industry. By challenging you with this task in a controlled environment, we will help you improve your business acumen and decision-making skills. Specifically, this exercise has been designed to help you:
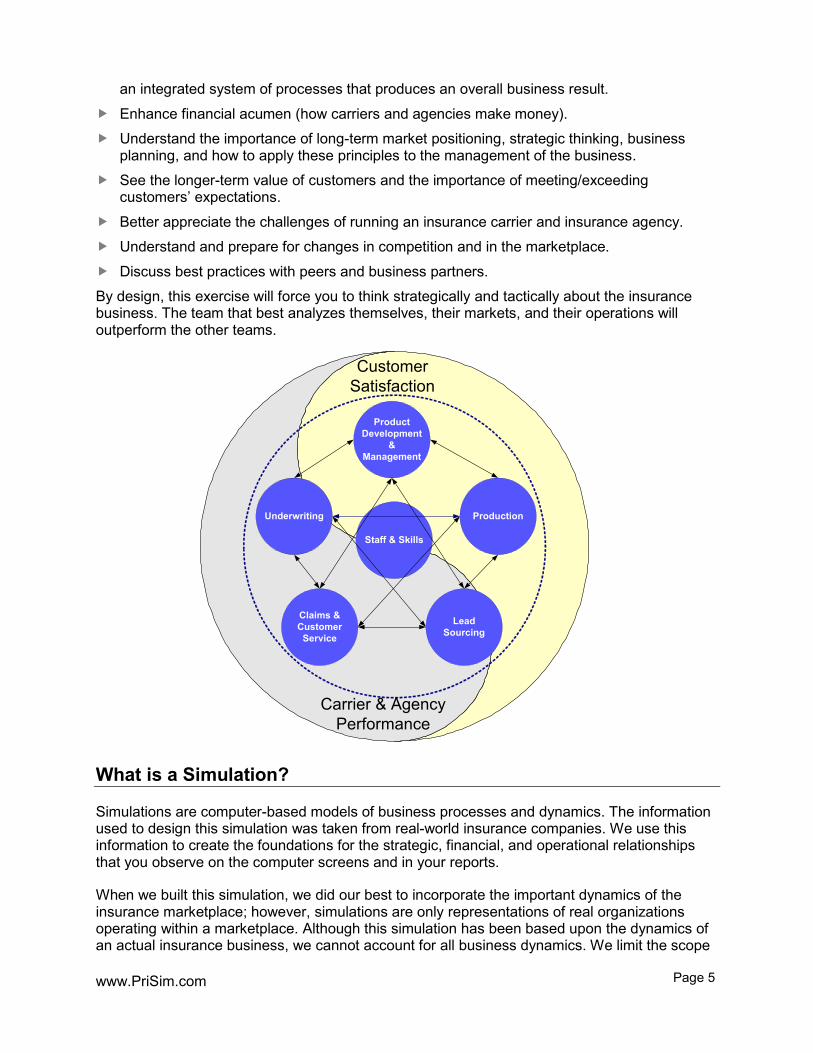
Better understand the “whole picture” of insurance operations – the value chain from agency to carrier. By the end of this exercise you should be thinking of the insurance “business” as
www.PriSim.com Page 5
an integrated system of processes that produces an overall business result. Enhance financial acumen (how carriers and agencies make money). Understand the importance of long-term market positioning, strategic thinking, business
planning, and how to apply these principles to the management of the business. See the longer-term value of customers and the importance of meeting/exceeding
customers’ expectations. Better appreciate the challenges of running an insurance carrier and insurance agency. Understand and prepare for changes in competition and in the marketplace. Discuss best practices with peers and business partners. By design, this exercise will force you to think strategically and tactically about the insurance business. The team that best analyzes themselves, their markets, and their operations will outperform the other teams.
What is a Simulation?
Simulations are computer-based models of business processes and dynamics. The information used to design this simulation was taken from real-world insurance companies. We use this information to create the foundations for the strategic, financial, and operational relationships that you observe on the computer screens and in your reports.
When we built this simulation, we did our best to incorporate the important dynamics of the insurance marketplace; however, simulations are only representations of real organizations operating within a marketplace. Although this simulation has been based upon the dynamics of an actual insurance business, we cannot account for all business dynamics. We limit the scope
Staff & Skills
Product Development
& Management
Production
Claims & Customer
Service
Underwriting
Lead Sourcing
Carrier & AgencyPerformance
CustomerSatisfaction
www.PriSim.com Page 6
of the dynamics, and thus your decisions, to focus your time and thoughts on issues that are critical to your development as an effective business decision-maker.
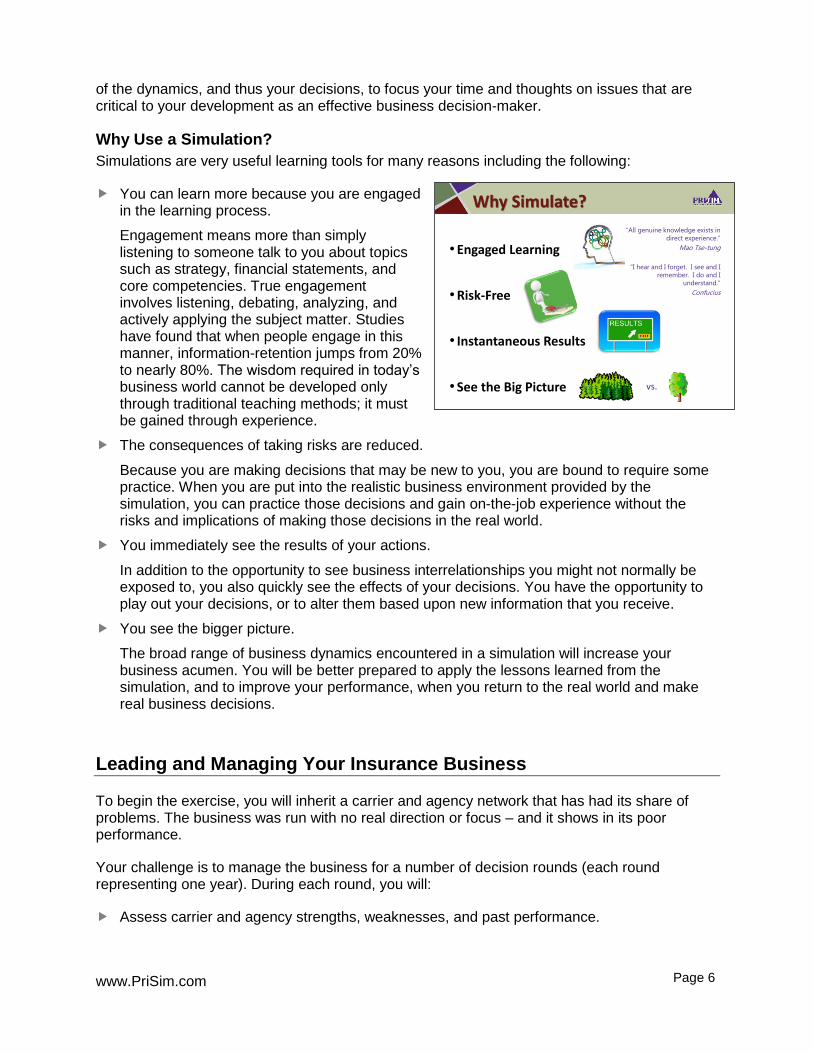
Why Use a Simulation? Simulations are very useful learning tools for many reasons including the following:
You can learn more because you are engaged in the learning process. Engagement means more than simply listening to someone talk to you about topics such as strategy, financial statements, and core competencies. True engagement involves listening, debating, analyzing, and actively applying the subject matter. Studies have found that when people engage in this manner, information-retention jumps from 20% to nearly 80%. The wisdom required in today’s business world cannot be developed only through traditional teaching methods; it must be gained through experience.
The consequences of taking risks are reduced. Because you are making decisions that may be new to you, you are bound to require some practice. When you are put into the realistic business environment provided by the simulation, you can practice those decisions and gain on-the-job experience without the risks and implications of making those decisions in the real world.
You immediately see the results of your actions. In addition to the opportunity to see business interrelationships you might not normally be exposed to, you also quickly see the effects of your decisions. You have the opportunity to play out your decisions, or to alter them based upon new information that you receive.
You see the bigger picture. The broad range of business dynamics encountered in a simulation will increase your business acumen. You will be better prepared to apply the lessons learned from the simulation, and to improve your performance, when you return to the real world and make real business decisions.
Leading and Managing Your Insurance Business
To begin the exercise, you will inherit a carrier and agency network that has had its share of problems. The business was run with no real direction or focus – and it shows in its poor performance.
Your challenge is to manage the business for a number of decision rounds (each round representing one year). During each round, you will:
Assess carrier and agency strengths, weaknesses, and past performance.
Why Simulate?
• Engaged Learning
• Risk-Free
• Instantaneous Results
• See the Big Picture vs.
“All genuine knowledge exists in
direct experience.”
Mao Tse-tung
“I hear and I forget. I see and I
remember. I do and I
understand.”
Confucius

www.PriSim.com Page 7
Analyze opportunities and threats in the external market.
Benchmark against competitors. Set direction and strategy. Execute your strategy by making
decisions regarding: Product Development &
Management – New product development (for new product lines and/or customer/industry segments), product pricing, advertising, coverage, loss control, and profitability analysis.
Underwriting – Underwriting capacity, commissions, reinsurance, Guaranteed Supplemental Compensation (GSC), and activity time-blocking.
Agency Production & Sales – Agency promotion, staffing, service levels, and new business sourcing (201-version only).
Agency Training and Time-Blocking – Producer skills development and time-blocking (where and how much time should be spent on specific activities).
Carrier Customer Service & Claims – Customer and claims service levels. Carrier Talent Management, Investment, KPIs – Carrier competency development,
investment approach, and ratio analysis. Each round will last between one and three hours. After you perform a “Final Save” at the end of a round, the Instructor will collect and process decisions from all the teams in the marketplace. The results of your decisions will be given to you for analysis through a variety of reports. Prior to beginning the next round, the Instructor and all teams will discuss the competitive results. Teams will then return to their team-rooms to make another set of decisions for the next period.
This is a “zero-sum game” in which customers choose the company with the best value proposition as perceived by that customer. If your company wins the business, you can be sure that another company has lost the business. The management team that runs the “best” insurance carrier and agency network wins!
Customer Segmentation
Achieving business success requires that you have a deep understanding of your marketplace and your customers. Customers in the simulated marketplace are concerned about the same things as insurance customers in the real world; that is, they have specific requirements and/or expectations regarding the solutions they seek.
The Process
Break up into insurance
management teams
At the end of each round receive feedback on
performance
1 Round = 1 Year
Winner at end of several rounds!
Each team runs a separate insurance carrier & agency network (initially
identical)
team runs a team runs a
Break up into Break up into insurance insurance insurance
management management management management teamsteams
At the end of each round At the end of each round receive feedback on
Each Each Each separate separate separate separate separate separate separate separate separate separate & & & & agency agency agency agency agency agency agency agency
www.PriSim.com Page 8
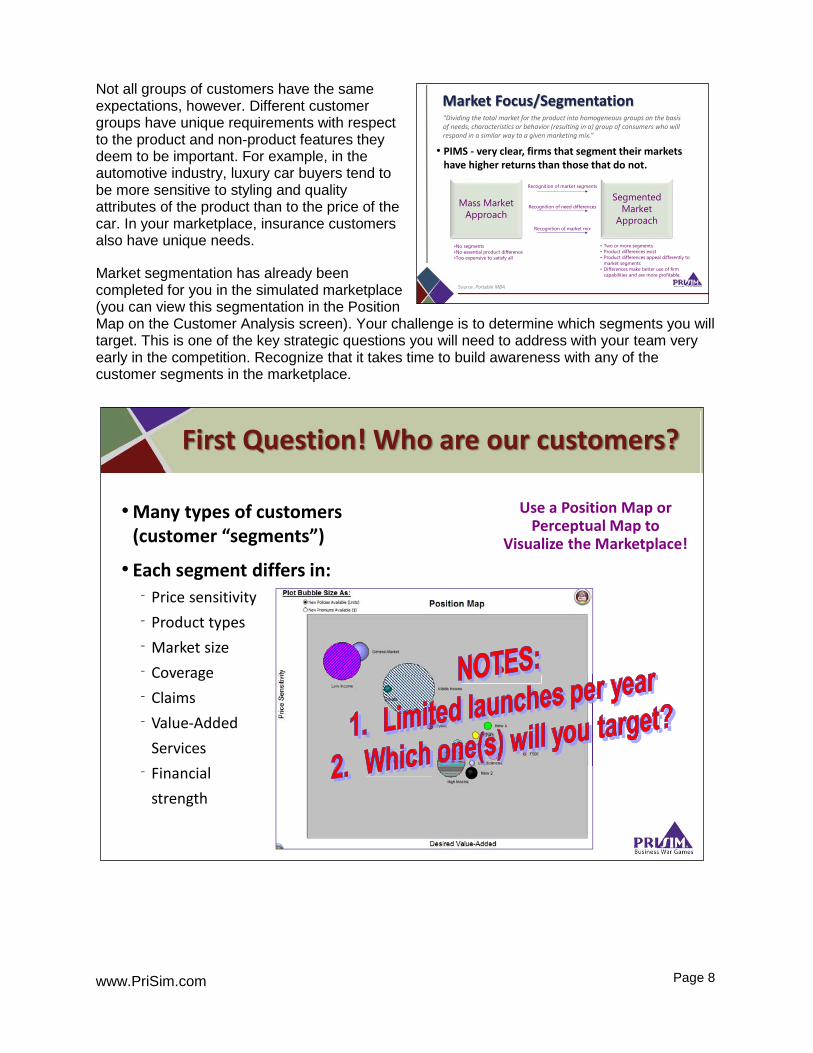
Not all groups of customers have the same expectations, however. Different customer groups have unique requirements with respect to the product and non-product features they deem to be important. For example, in the automotive industry, luxury car buyers tend to be more sensitive to styling and quality attributes of the product than to the price of the car. In your marketplace, insurance customers also have unique needs.
Market segmentation has already been completed for you in the simulated marketplace (you can view this segmentation in the Position Map on the Customer Analysis screen). Your challenge is to determine which segments you will target. This is one of the key strategic questions you will need to address with your team very early in the competition. Recognize that it takes time to build awareness with any of the customer segments in the marketplace.
Market Focus/Segmentation
• PIMS - very clear, firms that segment their markets have higher returns than those that do not.
Mass Market
Approach
Segmented
Market
Approach
• Two or more segments
• Product differences exist
• Product differences appeal differently to
market segments
• Differences make better use of firm
capabilities and are more profitable.
•No segments
•No essential product difference
•Too expensive to satisfy all
Recognition of market segments
Recognition of need differences
Recognition of market mix
Source: Portable MBA
“Dividing the total market for the product into homogeneous groups on the basis of needs, characteristics or behavior (resulting in a) group of consumers who will respond in a similar way to a given marketing mix.”
First Question! Who are our customers?
• Many types of customers (customer “segments”)
• Each segment differs in:
⁻ Price sensitivity
⁻ Product types
⁻ Market size
⁻ Coverage
⁻ Claims
⁻ Value-Added
Services
⁻ Financial
strength
Use a Position Map or Perceptual Map to
Visualize the Marketplace!
www.PriSim.com Page 9
Product Development & Management
As you make decisions that impact product development and management, discuss with your team what products you currently offer and what new products are available for development. Products you currently have are indicated in purple and the cell will contain your forecasted combined ratio for the product. Products available for development, but not carried by your carrier, are indicated in white. If you decide to launch one of these products, a development charge will be incurred. Any product/customer segment indicated in black signifies that the market is not currently available, but may become available in a future round (click on the field to see which round).
NOTE: The number of new products you can launch each period may be limited by your Instructor.
Products have specific characteristics that distinguish them from other products. These characteristics include:
Product Awareness: Driven by your advertising budget and how long the product has been available. Carrier advertising to the agency increases awareness and awareness increases the number of submissions from the agency to the carrier. Even if you have the best product in the market, if no one knows about it, having a “best product” won’t do you much good. NOTE: When you first launch a product, awareness will be very low so make sure to advertise adequately.
Price: Price can be adjusted by plus or minus a percentage of the prior year’s price. For some products, there may be restrictions on how much you can raise prices in any given year.
Coverage: There is a cost incurred for each unit of coverage increased. Beware of increasing coverage without having the appropriate competencies.
Loss Control/Appraisal: Loss Control includes pre-underwriting activities and post-sale client services that can reduce potential losses (e.g. appraisals, security consultations, engineering reviews, safety seminars, quarterly reviews, infrared service, etc). Improvements in Loss Control increase underwriting expenses but may also increase agency submissions and renewals. In addition, better Loss Control can reduce losses for clients that are interested in taking advantage of your Loss Control services. Consider the appropriate level of Loss Control emphasis to set for each of your products (scaled from 1 to 10, with 10 being a higher level).
Losses: Losses are not always reported when they are incurred. The length of time between when a loss happens and when the loss is reported can vary significantly by product. For example, collision damage claims are usually reported and paid soon after a car accident. A back injury claim, on the other hand, may take longer to report and close (due to the fact that the injured was not aware an injury occurred or perhaps because of the time that was required to litigate the claim).
www.PriSim.com Page 10
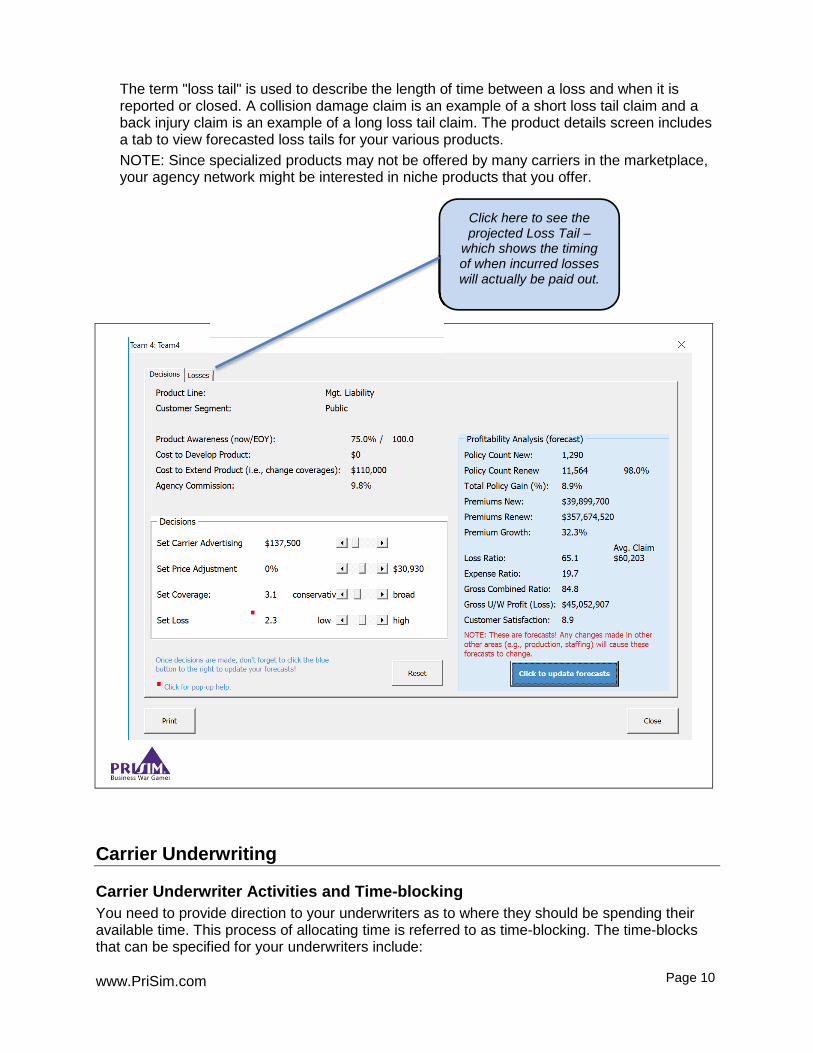
Click here to see the projected Loss Tail –
which shows the timing of when incurred losses will actually be paid out.
The term "loss tail" is used to describe the length of time between a loss and when it is reported or closed. A collision damage claim is an example of a short loss tail claim and a back injury claim is an example of a long loss tail claim. The product details screen includes a tab to view forecasted loss tails for your various products. NOTE: Since specialized products may not be offered by many carriers in the marketplace, your agency network might be interested in niche products that you offer.
Carrier Underwriting
Carrier Underwriter Activities and Time-blocking You need to provide direction to your underwriters as to where they should be spending their available time. This process of allocating time is referred to as time-blocking. The time-blocks that can be specified for your underwriters include:
www.PriSim.com Page 11
Other teams’ decisions will impact customer expectations, and ultimately your success. “Know the enemy and know yourself…” – Sun Tzu, The Art of War
New Business – time spent working with producers on new business submissions. This is calculated for you based upon the volume of new business submissions being generated.
Marketing – time spent calling on producers to update them regarding changes in product approach and focus. Also included in this time-block is time spent rounding out accounts and time spent explaining/up-selling coverages. The more time spent marketing, the better the fit between the type of business you’re seeking and the business producers send to your carrier.
Renew Business – time spent working with producers to renew existing business (e.g., sending reminder letters to agents, notifying agents of changing terms). Increases here can increase the Customer Satisfaction Index (CSI) as well.
Administration and Development – endorsements, training, new product development, home office coordination, branch manager meetings, and agency advertising.
Incentives for Agencies Your agency network is your carrier’s only source for customers. Besides good products and appropriate time-blocking, agencies look at the financial incentives you offer. You can offer two types of incentives to agencies:
Commissions: You can set commissions by product type. Low commissions will likely result in fewer submissions from agencies.
Guaranteed Supplemental Compensation (GSC): Achievements in the current year will be paid out in the following year. Growth GSC
Encourages producers to grow by more aggressively pursuing new business and submitting a greater share of that new business to your carrier.
Loss Ratio GSC Encourages Producers to pass better prospects to you and to conduct more loss control on their own. In addition, agencies will strive to improve the quality of those insureds submitted to you in an effort to reduce your carrier’s losses.
Reinsurance Reinsurance options are provided to help you manage the risk of severe losses and to help you leverage your available equity as you grow. Choices by product line include No Reinsurance, Quota Share, and Excess of Loss. The reinsurance options are all “treaty” reinsurance that would cover your entire book of business in a specific category as opposed to “facultative” reinsurance that would cover specific, individual policies.
You will be shown the charge you’ll incur for your reinsurance choice as a Percentage of Gross Written Premium in the column next to the method chosen. You will also be shown your Net Written Premium forecast to give you a sense for what you are ceding to reinsurance companies as a result of your reinsurance choice.
Each product line can be reinsured through a different method. As you make your choices, there may be changes in Reinsurance Ceded and Insurance Claims on the Income Statement and in Reinsurance Recoverable on the Balance Sheet:
www.PriSim.com Page 12
Consider Quota Share if surplus is tight, and Excess of Loss if Loss Ratios are a concern.
Agency promotion (advertising) helps drive marketplace awareness. Low awareness can lead to poor visibility and low market share, even if you offer excellent capabilities, service levels, and products.
You may wind up with too few Producers (which can result in poor new-business performance), or too many Producers (which can result in high compensation expenses relative to production). Your goal is to optimize your staffing levels for your strategy and target markets.
No Reinsurance – All premiums and losses are kept within the company. Quota Share – Choice of either 80/20 or 50/50 (e.g.,
80/20 means that 80% of premiums and losses are kept with the primary insurer, and 20% go to the reinsurer). This option may make sense if you are growing quickly and regulators/investors have become concerned about your carrier’s financial strength and ability to absorb unanticipated losses.
Excess of Loss – Choice of coverage for loss-ratios in the “band” of either 1.0 to 1.3 (100% to 130%) or 1.1 to 1.3 (110% to 130%). This method of reinsurance will begin coverage only when a book of business has a Gross Incurred Loss Ratio greater than 1.0 or 1.1 respectively, and reinsurance coverage will stop after Loss Ratios exceed 1.3. The books of business that are reinsured will be automatically determined for you based on regional, market, and/or customer risks. This option can help control losses from unusual or extreme risks.
Agency Production & Sales
Agency Awareness Agency Awareness is developed year-over-year through promotion expenditures. Good awareness makes it easier to get an appointment with prospective insureds.
Staffing and Capacity To run any business better than a competitor, management must ensure that it has the right number of people, with the right skills, performing the right set of activities. Strategically managing your most important assets is one of the keys to optimizing your performance:
Managing Attrition Attrition is driven primarily by overtime. Although a Full Time Equivalent (FTE – e.g., 2 half-time staff equal one full time equivalent) has 18 days per month to perform their activities, most FTEs are willing to work some overtime to be successful. Working FTEs too hard, however, will make them cranky and could lead to high turnover (attrition). Producer attrition is also affected by lowering commission rates on new and renewed business. Turnover will not occur until the end of the decision period.
Staffing Levels: Hiring/Firing and Planning for Growth It takes 3 months to recruit a new producer, so you will need to plan well to grow. New producers join your company with only a base set of skills; additional training may be required. If desired, producers can be terminated immediately.
www.PriSim.com Page 13
Service Levels As with your carrier, your agencies must determine the service level they will offer. “Service” means different things to different types of customers but includes:
Value-Added Services: includes security consultations, employee background investigations, warm-transfer for claims (e.g., a direct connect to remediation services in the event of water damage), risk profiling, consulting, safety programs, return to work programs, risk management services, pre-emptive contract reviews, etc. By increasing your value-added services you increase overheads, but may motivate additional new and renewal business. This can also increase your Customer Satisfaction Index (CSI) and your agency fees (a source of revenue) and reduce your insurance carriers’ loss ratio. NOTE: you can only increase your Value-Added Service level by 2 in any given year (on a scale of 1 to 10, where 10 is best).
Carriers Accessed (201-version only): you will need to shop your prospects (leads) to one or more carriers in order to find the best solution. Submitting prospects to multiple carriers takes a little more time in terms of support staff, but increases CSI and strengthens your agency’s position as an independent agency.
Producer Commissions Commissions incent producers to work harder and generate more volume. You can specify separate commissions for new and renew business.
New Business Sourcing Decisions (201-version only) Once you have determined the percentage of time you want your producers to spend on Lead Generation, you must indicate how you want the Lead Generation time divided between the different lead sources (“Centers of Influence”). You accomplish this by assigning percentages to each lead source. For example, if you specified that producers should spend a certain amount of their time in Lead Generation, you must also determine which source they will spend their time working within. Lead sources include:
Direct To Consumer: customer leads that are available by telemarketing, direct mail, and call-ins.
Associations/Affinity: customer leads that are available by involvement in industry-specific associations and other affinity groups.
Carrier Referrals Current Customer Referrals Account Rounding: leads for new policies that are available by talking to existing clients
regarding other risk management needs. NOTE: This source involves spending time with your existing policyholders identifying new opportunities. Other teams will not have access to these leads.
As you adjust the amount of time spent in each source, an indication for how well you’ve “covered” all the potential insureds for that source is displayed. If your coverage is less than 100%, you have not provided enough producer time to contact all potential customers available through that source. If your coverage is 100%, be aware that you may be over-working a channel. In addition, monthly performance is outlined for each lead source. Pipeline success is a function of hard work (i.e., coverage), the ability to turn an appointment into a submission (as measured by the Submissions to Appointment ratio), and the ability to actually write a large percentage of those submissions (as measured by the Written to Submissions ratio – See Appendix).
www.PriSim.com Page 14
Agency Training & Time-Blocking
Training The skill of your employees ultimately determines success. You can train agency personnel on different product types (e.g., Personal Home coverage) and on different customer types (e.g., High Income). You can also train agency producers on the activities they perform.
Training takes producers away from their normal duties and costs money, but influences CSI and sales and helps in reducing losses for your carriers. Agency skills are assessed on a scale from 1-10, with 10 being the most skilled.
NOTE: If you decide not to train, skills may still improve slightly through on-the-job training.
Producer Activities and Time-Blocking (201-version only) Just as you had the opportunity to time-block your carrier’s underwriters, you will do the same for your agency producers. You will need to determine how much time per day you want them to spend on particular activities.
New Business Lead Generation: time spent contacting prospective customers. As you allocate more time in Lead Generation, your producers can spend more time working prospects through the various lead sources. If you change the Lead Generation time-block, or if you change the number of producers at the agency, be sure to re-examine your sourcing decisions as the amount of time you’ve dedicated to Lead Generation at the sources will have changed.
New Business Closing and Lead Conversion: time spent working with leads and submitting their requirements to carriers.
Servicing Existing Accounts: time spent answering calls and checking in with existing clients. While a bulk of servicing is completed by Customer Service Reps, some producer time may be required. More time is required for higher customer service levels.
Renewing Business: time spent renewing business. As the agency matures you will want to spend more time here.
Coordinating With Carriers: time spent improving your understanding of your carriers’ products and services. This allows you to better match a potential insured with the right carrier and improves your written to submitted ratio as well as renewal rates.
Professional Development: time spent training producers. Administration & Slack Each of these segments is given a percentage of time that represents the number of hours per week you want spent on each activity. You can work producers as hard as you want, but working them too hard can lead to burnout and attrition. Unlike producers, your support staff will only work 110% before attrition increases.
www.PriSim.com Page 15
Carrier Customer Service & Claims
On this decision screen you will specify the levels of service you want to provide for your customers:
Customer Service: Indicates how quickly your carrier is able to respond to customer inquiries (e.g., issuing and endorsing policies) and the degree to which you support brokers with value-added services (online account access, payment processing options). As you increase the customer service level (on a scale of 1-10, with 10 being best) your carrier responds more quickly to requests and offers more services, but your underwriting expenses increase (to pay for the additional people, processes and/or technology that improve service). Customers who place a high importance on customer service will reward you for your efforts.
Claims Speed: Indicates how long it takes you to settle a claim. As you increase the level of claims speed you decrease the number of days for payment, but it also directly impacts your cash position, which impacts capital available for investment. For customers that value claims service, increases in speed can increase sales and renewals while increasing underwriting expenses. Quicker payments may also reduce total claims expense.
Claims Approach: Indicates your carrier’s policy on how personalized your approach will be as you handle/resolve claims by customer segment. In addition, your claims approach indicates how strict or liberal you tend to be in covering claims for that segment. As you increase your claims approach for a customer segment, you will increase sales and CSI for that segment, but will also increase your loss adjustment expense and your paid losses (i.e., your loss ratio)!
NOTE: You can only change your Customer Service and Claims levels by 2 each year.
Carrier Talent Management, Investment, KPIs
This decision screen allows you to make investment decisions, displays several key performance ratios, and provides choices in developing your current customer segment competencies.
Investment Decisions: In the Investments section, you can determine the overall investment approach you wish to take, from 1 (conservative) to 10 (aggressive). An aggressive approach begins to put money into alternative investments including stocks, real estate limited partnerships, private investments, and hedge funds. Changes in investment strategies take more than one year to fully implement. Your approach in the current year will not only impact this year's rate of return, but also next year's rate of return.
Performance Indicators: Several metrics are shown on this screen to help you manage your business. Capital, Profitability, IRIS (Insurance Regulatory Information System), Risk Based Capital/Solvency II, and other metrics are provided as indicators of overall performance and your capacity to
www.PriSim.com Page 16
underwrite more business. IRIS ratios were developed by U.S. state insurance regulators to assist state insurance
departments in targeting resources to those insurers in greatest need of regulatory attention.
The Solvency Ratio is the core metric used in the European Union as part of Solvency II, a regulatory program begun in 2016 to assess whether an insurance company is holding enough capital to provide certainty to policyholders that claims can be covered in abnormal years. The formula for the Solvency Ratio is: Solvency Ratio = Surplus / Solvency Capital Requirement (SCR) An insurance company’s Solvency Ratio should be well above 100%. The SCR represents an almost “worst possible case” level of capital that would cover a 1-in-200 year shock occurring in the following 12-months. The SCR for a non-life insurance company is driven by several factors including the following: - Catastrophe Exposure – dependent on the mix of policy-type in the book of
business. Property policies typically carry more cat risk than casualty policies. - Premium Reserve Risk – accounting for losses (other than cat losses) that occur at
a regular frequency. - Lapsing/Canceling Policies Adjustment – assumes that 40% of profitable policies
will be discontinued. - Reinsurance Level – a higher level of reinsurance coverage can reduce risk. - Market Risk – arising from the volatility of financial instruments held by the
company. Impacted by interest rates, equity prices, property prices, exchange rates, etc.
Customer Competencies: Customer competencies are assessed on a scale from 1 to 10. It takes one year to improve competencies. A strong competency in a customer segment indicates a better understanding of the customer, influences agencies to send more submissions to your carrier, helps reduce losses, and increases renewals. As you consider doing business with new customer segments, training will be important. Low competencies, especially in new products, can lead to higher loss ratios.
Pro-Formas and Corporate Finance
As you make decisions you will be able to see how your company’s forecasted financial performance will be impacted through the following reports:
Insurance Challenge! Carrier: Proforma Income Statement Proforma Balance Sheet (including Corporate Finance decisions)
www.PriSim.com Page 17
Proforma Cash Flow Statement Proforma Product Contribution Report
Agency Network: Proforma Income Statement (also known as the Profit and Loss report)
NOTE: Forecasts are estimates based upon last year’s competitive positioning. Although forecasts tend to be conservative, significant changes in lead generation, aggressiveness, product offerings, or sourcing may impact forecast accuracy.
Corporate Finance: If you need cash, short-term debt is available to you (long-term debt will be managed for you). The interest rate you pay on debt is determined by your credit rating. You can also pay off short-term debt when you are ready.
Alternatively, if you’d rather use equity as a source of cash, or if you’d like to repurchase some of your common stock, you may do so. You can also pay out a cash dividend.
NOTE: The dollar-amount of stock you can issue or repurchase will be limited by the amount of stock your company currently has outstanding.
Situation Analysis
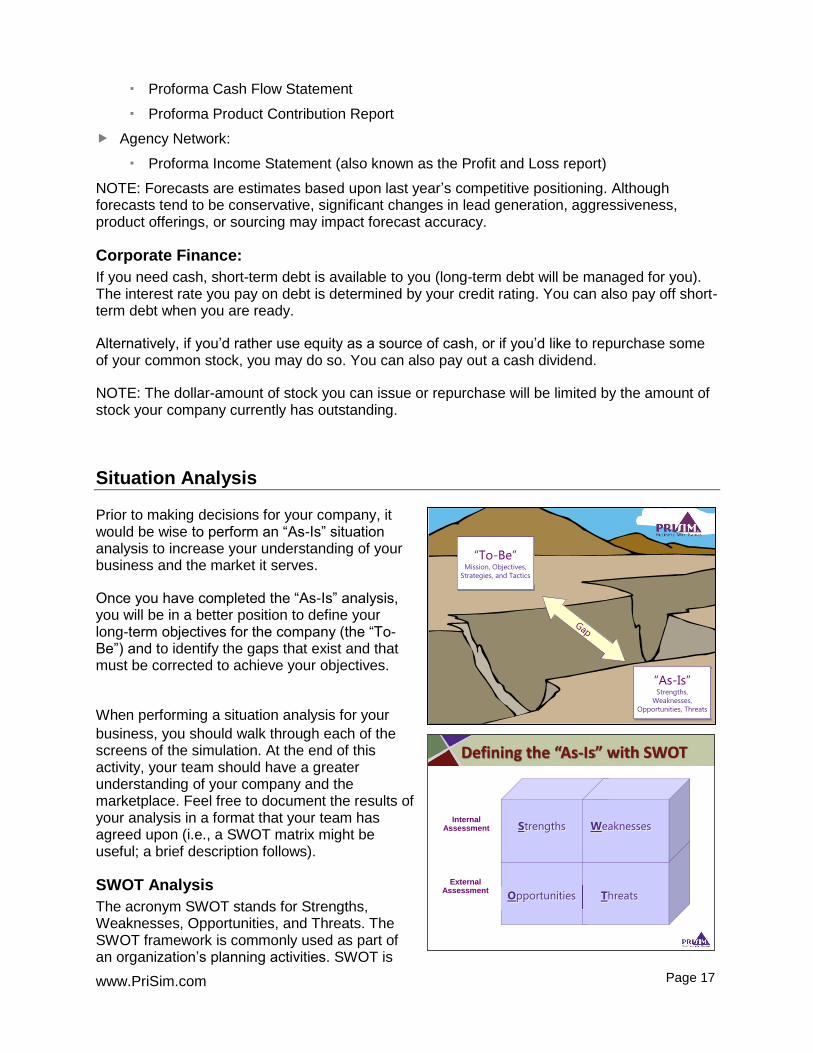
Prior to making decisions for your company, it would be wise to perform an “As-Is” situation analysis to increase your understanding of your business and the market it serves.
Once you have completed the “As-Is” analysis, you will be in a better position to define your long-term objectives for the company (the “To-Be”) and to identify the gaps that exist and that must be corrected to achieve your objectives.
When performing a situation analysis for your business, you should walk through each of the screens of the simulation. At the end of this activity, your team should have a greater understanding of your company and the marketplace. Feel free to document the results of your analysis in a format that your team has agreed upon (i.e., a SWOT matrix might be useful; a brief description follows).
SWOT Analysis The acronym SWOT stands for Strengths, Weaknesses, Opportunities, and Threats. The SWOT framework is commonly used as part of an organization’s planning activities. SWOT is
“To-Be”Mission, Objectives,
Strategies, and Tactics
“As-Is”Strengths,
Weaknesses,
Opportunities, Threats
Defining the “As-Is” with SWOT
Internal Assessment
Opportunities Threats
Strengths Weaknesses
External Assessment
www.PriSim.com Page 18
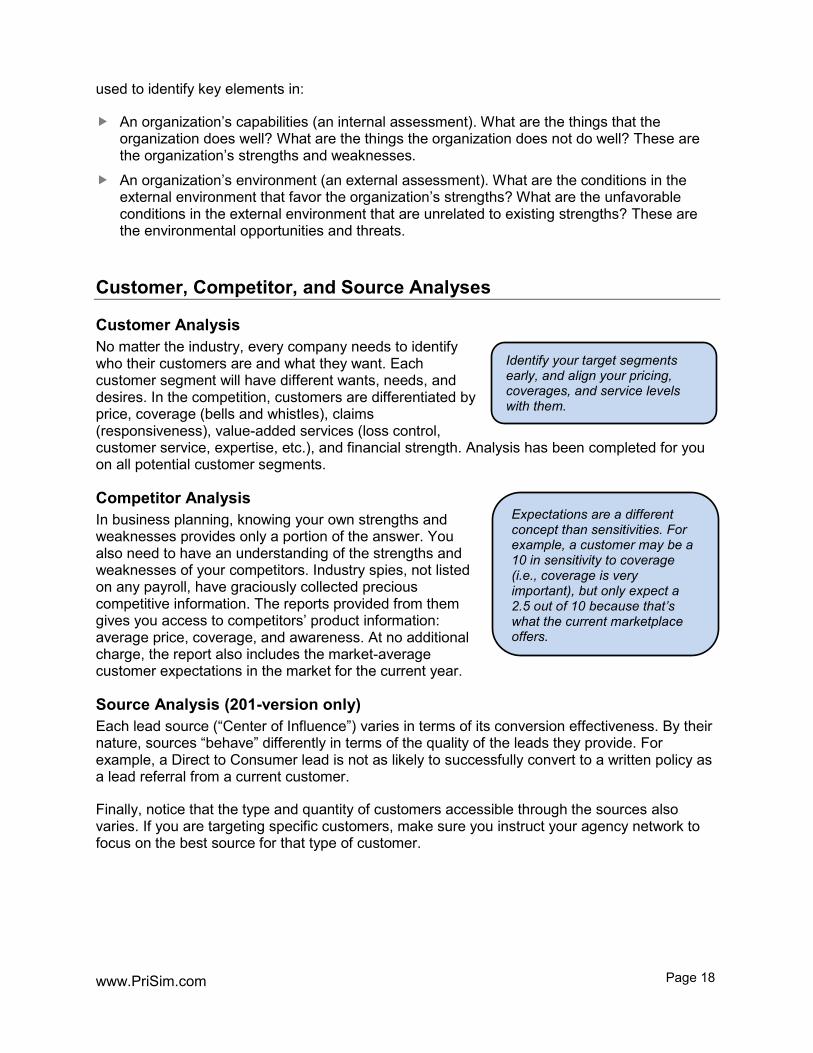
Identify your target segments early, and align your pricing, coverages, and service levels with them.
Expectations are a different concept than sensitivities. For example, a customer may be a 10 in sensitivity to coverage (i.e., coverage is very important), but only expect a 2.5 out of 10 because that’s what the current marketplace offers.
used to identify key elements in:
An organization’s capabilities (an internal assessment). What are the things that the organization does well? What are the things the organization does not do well? These are the organization’s strengths and weaknesses.
An organization’s environment (an external assessment). What are the conditions in the external environment that favor the organization’s strengths? What are the unfavorable conditions in the external environment that are unrelated to existing strengths? These are the environmental opportunities and threats.
Customer, Competitor, and Source Analyses
Customer Analysis No matter the industry, every company needs to identify who their customers are and what they want. Each customer segment will have different wants, needs, and desires. In the competition, customers are differentiated by price, coverage (bells and whistles), claims (responsiveness), value-added services (loss control, customer service, expertise, etc.), and financial strength. Analysis has been completed for you on all potential customer segments.
Competitor Analysis In business planning, knowing your own strengths and weaknesses provides only a portion of the answer. You also need to have an understanding of the strengths and weaknesses of your competitors. Industry spies, not listed on any payroll, have graciously collected precious competitive information. The reports provided from them gives you access to competitors’ product information: average price, coverage, and awareness. At no additional charge, the report also includes the market-average customer expectations in the market for the current year.
Source Analysis (201-version only) Each lead source (“Center of Influence”) varies in terms of its conversion effectiveness. By their nature, sources “behave” differently in terms of the quality of the leads they provide. For example, a Direct to Consumer lead is not as likely to successfully convert to a written policy as a lead referral from a current customer.
Finally, notice that the type and quantity of customers accessible through the sources also varies. If you are targeting specific customers, make sure you instruct your agency network to focus on the best source for that type of customer.
www.PriSim.com Page 19
Agency Network
Insurance Challenge!(TM)
Carrier Other carriers (outside this competition)
Critical Success Factors:
A. Producer appointments with prospects
B. Agency submissions to all carriers
C. Submissions specifically to your carrier
D. Written to submitted ratio
New CustomersNew CustomersDirect To Consumer
Affinity / Associations
Account Rounding
Carrier ReferralsCurrent Customer
Referrals
AA
BB
CC
DD
New Customer Channels Vary By:• Size• Customer type• Effectiveness (hit ratio)
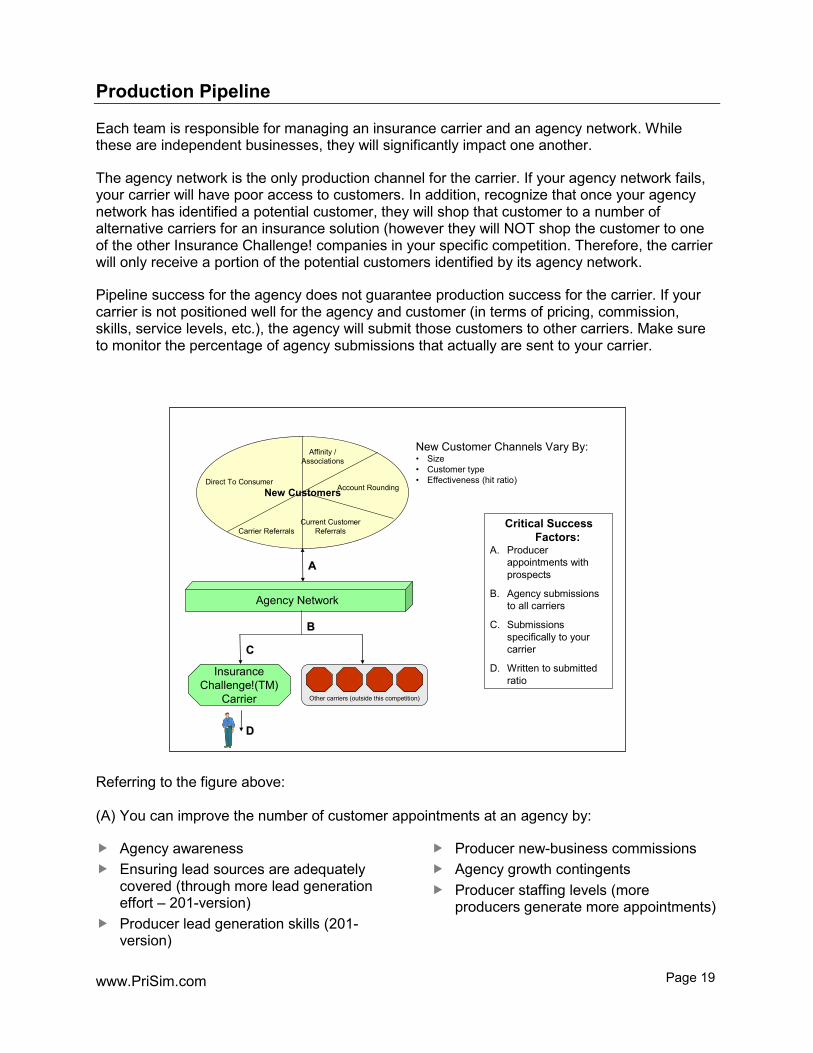
Production Pipeline
Each team is responsible for managing an insurance carrier and an agency network. While these are independent businesses, they will significantly impact one another.
The agency network is the only production channel for the carrier. If your agency network fails, your carrier will have poor access to customers. In addition, recognize that once your agency network has identified a potential customer, they will shop that customer to a number of alternative carriers for an insurance solution (however they will NOT shop the customer to one of the other Insurance Challenge! companies in your specific competition. Therefore, the carrier will only receive a portion of the potential customers identified by its agency network.
Pipeline success for the agency does not guarantee production success for the carrier. If your carrier is not positioned well for the agency and customer (in terms of pricing, commission, skills, service levels, etc.), the agency will submit those customers to other carriers. Make sure to monitor the percentage of agency submissions that actually are sent to your carrier.
Referring to the figure above: (A) You can improve the number of customer appointments at an agency by:
Agency awareness Ensuring lead sources are adequately
covered (through more lead generation effort – 201-version)
Producer lead generation skills (201-version)
Producer new-business commissions Agency growth contingents Producer staffing levels (more
producers generate more appointments)
www.PriSim.com Page 20
(B) You can improve the number of agency submissions to all carriers by:
Agency customer and product skills Producer lead conversion skills and
effort (time-blocking – 201-version)
Agency value-added service
(C) You can improve the percentage of submissions to the Insurance Challenge! carrier by:
Offering more products (the more products offered by your carrier, the tighter the relationship between you and the agency network)
Ensuring agencies are fully aware of your products (product advertising and underwriter marketing)
Increasing incentives (i.e., commissions)
Improving claims speed and approach Improving carrier customer service and
customer skills Enhancing carrier loss control Offering more “non-general” products
(the more specialized products the agency has, the fewer carrier-choices it has to send submissions to)
(D) You can improve your carrier’s Written to Submitted Ratio by:
Time spent by producers and underwriters coordinating with one another (hence better matching prospects with carrier solutions – 201-version)
Reducing number of carriers accessed Price/Premium Product coverage Financial stability Product focus (e.g., you’ll tend to quote
more Personal than Commercial product)
www.PriSim.com Page 21
Production Detail (201-version) Having a good product to offer a customer is important, but if you are not bringing in customers of the right type or quantity, your product positioning doesn’t matter. The Production Detail report identifies how well your agency network is working specific customers. In addition, it breaks out agency sales by carrier and tells you what percentage of customer submissions they’re sending to you versus other carriers.
Production Sourcing (201-version – on the Agency Production and Sales screen) Agencies find new business through a variety of lead sources. How your agencies manage and target these sources can significantly impact both agency and carrier performance.
Source Demand and Mix There are a finite number of new customers available each year from each source. Make sure you know which source is best suited to provide the types of customers you are targeting.
Expected Conversion Efficiencies Each source varies in its conversion efficiencies (calls to appointments, appointments to submissions). Make sure your producers are working sources that have the greatest likelihood of success.
Source Time-Blocking and Coverage As you increase or decrease New Business Lead Generation on the Agency Time Blocking screen, you are directing producers to spend more time in Lead Generation but you are not telling them where to spend that time. You must direct where they spend their time on the Agency Production & Sales screen. Beware of over-covering a lead source. Over-covering implies that you are contacting the same customer multiple times even after being rejected, which can adversely affect your hit ratio. If a source has too much lead generation activity, consider shifting resources to an underutilized source.
Glossary of Selected Terms Used in Insurance Challenge!
Customer Analysis: Financial Strength/Brand: Perceived overall financial strength and corresponding ratings
assigned by independent rating agencies such as AM Best, Moody’s, etc. Product Detail:
Earned Premium: Premiums written that have been earned for coverage provided over a period of time. Earned premiums are recognized as revenues.
Loss Ratio: The ratio of incurred losses and loss adjustment expenses to net earned premiums.
Expense Ratio: The ratio of underwriting expenses to written premiums. Gross Combined Ratio: The sum of the loss ratio and the expense ratio. Gross Underwriting Profit (GWP): Gross UW Profit = Earned Premiums – Incurred
Losses – All Expenses (none deferred).
www.PriSim.com Page 22
Loss Tail: The average length of time by year beyond the policy year that it takes for claims to be settled and paid.
Carrier Underwriting: Net Written Premium (NWP): The sum of premiums written by an insurance company
over a period of time, less premiums ceded to reinsurance companies, plus any reinsurance assumed.
Surplus: Statutory equivalent of GAAP Shareholders’ Equity. Defined as Net Admitted Assets less Liabilities.
Net Written Premiums to Surplus: Net Written Premium as a Percent of Surplus. Reinsurance Methods:
- Quota Share: Premiums and Losses are divided proportionally between the primary insurer and the reinsurance company. Can help a company grow when capital is tight.
- Excess of Loss: Reinsurance is provided when losses are in excess of a retained layer (similar to a deductible). This option can help control losses from unusual or extreme risks.
Reinsurance Charge: The charge incurred for a reinsurance option as a Percentage of Gross Written Premium.
Net Claims % of EP: Claims incurred as a percent of Earned Premium. Carrier Customer Service and Claims:
Invested Assets: Investments in government and corporate bonds, public stock, real estate, etc.
Claims Service Speed: The length of time it takes for a carrier to settle a claim. Carrier Talent Management, Investment, KPIs:
Investment Income: Income generated from the firm’s Invested Assets. Investment Expenses: Expenses incurred in managing the firm’s investments. Current Rate of Return: The gain or loss on an investment over a specified time period,
expressed as a percentage of the investment's cost. Solvency Ratio: The Solvency Ratio is the core metric used in the European Union as
part of Solvency II, a regulatory program begun in 2016 to assess whether an insurance company is holding enough capital to cover its exposure to extreme risks. The Solvency Ratio is defined as the market value of an insurance company’s “Own Funds” (Surplus), divided by the Solvency Capital Requirement (SCR), and should be above 100%. The SCR represents an almost “worst possible case” level of capital that would cover a 1-in-200 year shock occurring in the following 12-months.
ROA: Return on Assets. Defined as Net Profit $ / Total Assets. Indicates the efficiency in managing the assets of the firm.
ROE: Return on Equity. Defined as Net Profit $ / Total Equity. Indicates the profitability of the shareholders’ investment in the firm.
ROS/ROR: Return on Sales, or Return on Revenue. Defined as Net Profit $ / Revenue. Indicates the firm’s profit margin on Revenue earned.
IRIS Ratios: Insurance Regulatory Information System. Developed by state insurance regulators to assist state insurance departments in allocating resources to those
www.PriSim.com Page 23
insurers in greatest need of regulatory attention. Several ratios are used to assess the health of insurance companies.
Income Statement: Investment Income: Income (net of expenses) derived from invested assets carried on
the Balance Sheet. Insurance Claims and Claims Expense: This year's paid loss and paid Loss Adjustment
Expense (LAE), plus changes in Loss Reserves. Amortization of Deferred Policy Acquisition Costs: Commissions and underwriting
expenses that can now be expensed since the premiums have been “earned”. These expenses may have already been paid, but were previously deferred from an accounting standpoint and held on the Balance Sheet.
Credit Rating Forecast: Perceived overall financial strength and corresponding ratings assigned by independent rating agencies such as AM Best, Moody’s, etc. Driven by balance sheet strength and operating performance.
LTV: Lifetime Value in Net Written Premium of the average insured covered by the iChallenge carrier.
Balance Sheet: Unpaid Claims and Claims Expense: Reserves for upcoming anticipated claims. Both
Case and IBNR (Incurred But Not Reported) Reserves. Deferred Policy Acquisition Costs: Deferred portion of underwriting expenses to be
eventually matched to earned premiums and expensed on the Income Statement. Other Assets: Such as Prepaid Reinsurance Premiums, Deferred Income Tax,
Intangible Assets, Goodwill, Buildings, etc.
(888) 4-PRISIM
www.PriSim.com