Embed Size (px)
Citation preview

GEE Papers
Número 73
Julho de 2017
Case Study: DBRS Sovereign Rating of
Portugal. Analysis of Rating Methodology and Rating Decisions
Annika Luisa Hofmann, Miguel Ferreira, João Lampreia

1
Case Study: DBRS Sovereign Rating of Portugal. Analysis of Rating
Methodology and Rating Decisions
Annika Luisa Hofmann, Miguel Ferreira, João Lampreia
1
Abstract
This paper analyzes and assesses the DBRS sovereign credit rating methodology and its rating
decisions on Portugal. A replicated rating model on Portugal allows to assess the DBRS rating
methodology and to identify country-specific risk factors. An OLS regression compares rating effects of ten
fundamental variables among S&P, Moody’s, Fitch Ratings and DBRS. Further, a rating scale model
fractionally disentangles DBRS rating grades into their subjective and objective rating components. Both
qualitative and empirical findings attest DBRS a comparably lenient rating behavior on Portugal – in
comparison to other rating agencies as well as within the DBRS cross-country rating decisions.
Keywords: Sovereign Risk Model, Portugal, Subjective Rating Component
1 I offer my sincere gratitude to everyone who made this work possible. To my academic advisor, Miguel
Ferreira, who provided guidance and help at every point. To my institutional advisor at Banco de Investimento Global, João Lampreia, who professionally and personally supported me along the research process. To my parents, Anita and Manfred Hofmann, who have been giving their unconditional support and love throughout the past 25 years. Finally, to everyone who reviewed my work and gave their valuable and highly appreciated input.

2
CONTENT
1 Introduction ................................................................................................................................... 3
2 Literature Review .......................................................................................................................... 4
3 Qualitative Rating Analysis .......................................................................................................... 5
3.1 Rating History on Portugal .......................................................................................................... 5
3.2 Comparison with S&P, Moody’s and Fitch Ratings ................................................................... 6
4 Rating Model Replication ............................................................................................................. 8
4.1 Structure and Composition .......................................................................................................... 8
4.2 Replication Procedure ................................................................................................................. 8
4.3 Results ....................................................................................................................................... 10
5 Empirical Analysis ...................................................................................................................... 12
5.1 Risk factor effects: Cross-agency comparison .......................................................................... 12
5.2 Subjective rating component analysis among DBRS cross-country ratings ............................. 14
6 Rating Outlook ............................................................................................................................ 17
7 Conclusion .................................................................................................................................... 18
8 References .................................................................................................................................... 19
9 Appendix ...................................................................................................................................... 20
LIST OF FIGURES
Figure 1: Historic sovereign ratings - Portugal ............................................................................. 5
Figure 2: Rating differences – Portugal ........................................................................................ 6
Figure 3: Subjective rating component - Panel results ............................................................. 16
Figure 4: Subjective rating component – Portugal .................................................................... 17
LIST OF TABLES
Table 1: Core rating risk factors of the Big Three and DBRS ............................................................................. 7
Table 2: Replicated model - Data evaluation ...................................................................................................... 9
Table 3: Replicated model - Indicator scaling ..................................................................................................... 9
Table 4: Replicated model – Weighting ............................................................................................................ 10
Table 5: Sovereign scorecard map................................................................................................................... 10
Table 6: Replicated model - Scorecard results for Portugal ............................................................................. 11
Table 7: Definition of variables – OLS regression ............................................................................................ 12
Table 8: OLS regression results ....................................................................................................................... 13
Table 9: Definition of variables - Rating scale model........................................................................................ 15
Table 10: Scenarios of Future Rating Adjustments .......................................................................................... 18

3
1 Introduction
Sovereign credit ratings exercise strong economic and political influence on a country, particularly
through its strong market signaling effects.2 Ratings take a significant role in determining a country’s (re-)
financing conditions on the financial markets. Further, a potential credit downgrade can expose a country
to limited institutional support – institutional investors are legally constrained from buying bonds with
ratings below specific rating levels classified as “non-investment” status. Instancing, Portugal has been
withdrawn the sovereign “investment grade” status by all renown rating agencies in the course of the
financial crisis – primarily due to high public and private sector indebtedness, weak economic growth and a
labile banking sector. The rather unknown Canadian rating agency DBRS on the contrary has been
holding on to attesting Portugal “investment grade” status. The attestation of a sovereign “investment
grade” by at least one major rating agency acts as the legal prerequisite for the government bond buying
and refinancing programs of the ECB, and thereby ascribes the DBRS (future) sovereign risk assessment
of Portugal decisive political and economic influence.3
This paper has been established in the course of a directed research internship at Banco de
Investimento Global. The objective of this paper is to qualitatively and empirically analyze the DBRS
sovereign credit rating methodology. Focus is specifically laid on its rating decisions on Portugal. The
replication of the DBRS sovereign risk model of Portugal serves to identify and quantify key risk factors as
well as give an assessment on technical specifications. The qualitative part assesses cross-agency
historical ratings of Portugal and elaborates on general differences in rating methodologies among the
major rating agencies. The empirical analysis of DBRS ratings closely follows the analysis approach by
Vernazza, Nielsen and Gkionakis (2014). A panel OLS regression allows to compare rating effects of ten
best-fitted fundamental variables among rating agencies. A rating scale model introduced by Studer and
Winkelman (2016) fragments DBRS rating grades into their subjective and objective rating components.
This paper contributes to existing academic literature as well as adds value for active market
participants. Current literature on sovereign ratings is mostly limited to the rating analysis of S&P, Moody’s
and Fitch Ratings. The inclusion of DBRS rating decisions – applied at the case of Portugal – therefore
allows to undertake a more comprehensive discussion on sovereign ratings. Further, an alternative
statistical rating model for the purpose of sovereign risk analysis is being introduced and applied. Against
the backdrop of DBRS’s significance with reference to the continuation of the bond purchase and financial
sector refinancing programs, a better understanding and estimation of DBRS (future) rating decisions
serves a crucial purpose equally for investors, institutions and politicians.
My key findings can be summarized as follow. The DBRS rating methodology lacks transparency.
Susceptibility to debt shocks is significantly underrepresented. The replicated DBRS sovereign risk model
of Portugal identifies the “political commitment to fiscal consolidation” as the striking justification for the
ongoing issuance of investment-grading.4 The OLS regression identifies a country’s past default history,
governmental effectiveness, rule of law and the long-term growth rate to have significantly greater effects
under the DBRS rating framework than it is the case for S&P, Moody’s and Fitch Ratings. The rating scale
model by Studer and Winkelmann attests DBRS to subjectively inflate its objective (fundamental) rating
decisions of Portugal on average by one rating notch. Portugal’s subjective rating component has been
diminishing over time, suggesting the rating grades to gradually approach their “fundamental” value. The
cross-country subjective adjustment average is neutral. The DBRS rating decision on Portugal is, in the
2 Sovereign credit ratings are defined as long-term foreign-currency issuer ratings throughout this paper.
3 The ECB purchases governmental bonds through the Public Sector Purchase Programs (PSPP) since
March 2015. Further, the ECB stimulates bank lending to the real economy through targeted longer-term refinancing operations (TLTRO) since June 2014. 4 DBRS Rating Report of Portugal from 21 October 2016 and 21 April 2017.

4
absence of changes in fundamental economic and political conditions, not expected to change in the
medium-term.
The remainder of my paper proceeds as follows. In Section 2, I present and review relevant literature.
Section 3 covers the qualitative rating analysis. Section 4 presents the DBRS rating model replication.
Section 5 provides the empirical analysis of rating decisions on Portugal, both in comparison with the
major rating agencies as well as within DBRS cross-country ratings. A rating outlook is presented in
section 6. In section 7, I conclude and make suggestions for future rating research.
2 Literature Review
Bhatia and Lin (2002) provide a comprehensive introduction and qualitative evaluation of the sovereign
credit rating methodologies of S&P, Moody’s and Fitch Ratings. Potential methodological improvements
and rating failures across time are thereby examined. Literature on the determinants of sovereign risk is
sizeable. Cantor and Packer (1996) identify per capita income, GDP growth, inflation, external debt, level
of economic development and default history as S&P’s and Moody’s risk determinants under the
application of an OLS regression. Several papers since then have evaluated sovereign risk determinants,
mostly using ordinary least squared regressions or ordered probit models.5 Afonso et al. (2011) extend the
research by distinguishing between short-term and long-term determinants employing linear and ordered
response models.
Given the partially limited access and low transparency on agencies (sovereign) rating methodologies,
the literature on rating model replications is scarce. D’Agostino and Lennkh (2016) reverse-engineer the
Moody’s sovereign rating model to obtain sovereign ratings of 19 Euro member countries from 2005 to
2015.
This paper’s quantitative section closely follows Vernazza, Nielsen and Gkionakis’s research approach
(2014). Ratings are decomposed into their subjective and objective rating components using OLS
regressions. Significant subjective rating distortions for specific country groups – predominantly during the
2009-2011 sovereign debt crisis – are attested. Teker et al. (2013) have followed similar rating analysis
through a factor based ordered probit model. Focus is laid on pre and post-crisis differences of Fitch
Ratings’ decisions for various country groups. Moor, Luitel, Sercu and Vanpee (2017) apply an ordered
logit model to investigate the subjective rating components and find that investment-graded countries are
more prone to positive subjective adjustments. An EC regulatory framework was installed in 2009 with the
purpose to increase transparency in the sovereign rating processes, ergo to reduce the degree of
subjective judgement in final rating decisions.6 However, Amstad and Packer (2015) empirically disprove
methodological improvements.
5 Afonso et al. (2007) identify GDP per capita, real GDP growth, government debt, government
effectiveness, external debt, external reserves and default history as determinants under the application of random effects ordered probit models. 6 EC Regulation No.1060/2009.

5
3 Qualitative Rating Analysis
3.1 Rating History on Portugal
The Canadian rating agency DBRS started issuing sovereign credit ratings in 2000. Since then, DBRS
has continuously been expanding its rating portfolio to a total of 36 countries.7 Portugal was first rated by
the agency in November 2011. In comparison with the Big Three, DBRS follows a rather lenient rating
behaviour on Portugal.8
Source: DBRS, S&P, Fitch Ratings, Moody’s, Bloomberg9
The Big Three have downgraded Portugal in the course of the European sovereign debt crisis 2009-
2011 to “speculative” status. Moody’s firstly withdrew Portugal investment grading in July 2011, Fitch
Ratings and S&P followed shortly in November 2011 respectively January 2012.10
The 10 Year yield curve
of Portugal reacted correspondingly, reaching a record high of 15 percent in January 2012. DBRS on the
contrary has continuously been holding on to attesting Portugal “investment grade” status. While its rating
has also been downgraded in 2011 and 2012, the rating grades have steadily been above the “speculative
grade” threshold. Since December 2012, DBRS attests Portugal the lowest possible sovereign investment
grade “BBB-“. The comparably dovish rating behaviour of DBRS on Portugal cannot be generalized for all
DBRS country rating decisions.11
7 Argentina, Australia, Austria, Belgium, Brazil, Canada, Chile, China, Colombia, Cyprus, Denmark,
Finland, France, Germany, Greece, India, Ireland, Italy, Japan, Luxembourg, Malta, Mexico, Netherlands, Norway, Peru, Poland, Portugal, Singapore, Slovak Republic, Spain, Sweden, Switzerland, Turkey, United Kingdom, United States of America, Uruguay. 8 S&P, Moody’s and Fitch Ratings are referred to as the “ Big Three” throughout this paper.
9 Rating decisions retrieved and collected from S&P, Moody’s, Fitch Rating’s and DBRS’s online
databases. 10
All rating equal or higher than “BBB-“/”Baa3” are defined as “investment grades”, any ratings below “BBB-“/”Baa3” are classified as “speculative”. 11
Instancing, S&P has been issuing Greece the rating “B-“ since January 2016, while DBRS has been issuing the lower “CCC+” grade since June 2016.
Figure 1: Historic sovereign ratings - Portugal

6
3.2 Comparison with S&P, Moody’s and Fitch Ratings
For the purpose to analyze the degree of rating disparities between the Big Three and DBRS, I convert
all four rating agencies’ alphanumeric ratings into their numeric values following the transformation matrix
in Appendix 1.
Figure 2: Rating differences – Portugal
Source: DBRS, S&P, Fitch Ratings, Moody’s12
Followed by S&P and Fitch Ratings, Moody’s shows the biggest discrepancies to DBRS’s rating
decisions on Portugal, up to a maximum of five rating notches.13
Rating disparities have diminished over
time though. Since September 2015 the rating decisions of the Big Three and DBRS differ by only one
rating notch – the decisive rating threshold between “investment grade” and “speculative” status though.
All four rating agencies define sovereign default risk in a different manner. Moody’s ratings capture the
expected loss, a function of the probability default and expected recovery rate after default. S&P ratings
only reflect the probability of a default event; timing, severity and recovery values are subordinate. Fitch
Ratings reflect the probability of default until default occurs, only accounting for expected recovery rates
after the default event already incurred (Bhatia, 2002). DBRS ratings reflect the probability of default or the
likelihood of full debt repayment in a timely manner.14
12
Rating decisions are retrieved and collected from the agencies’ online research portals. 13
In fall 2011, DBRS was issuing a stable investment grade of “A-“ while Moody’s already engaged in attesting Portugal the speculative rating grade “Ba2” (respective “BB”). 14
DBRS. 2016. “Rating Sovereign Governments Methodology” manual.

7
Table 1: Core rating risk factors of the Big Three and DBRS
DBRS S&P Fitch Ratings Moody’s
Fiscal Management and
Policy
Debt and Liquidity
Economic Structure and
Financial Stability
Monetary Policy and
Financial Stability
Balance of Payments
Political Environment
Institutional Assessment
Economic Assessment
External Assessment
Fiscal Assessment
Monetary Assessment
Structural Features
Macroeconomic
Performance, Policies
and Prospects
Public Finances
External Finances
Economic Strength
Institutional Strength
Fiscal Strength
Susceptibility to Event
Risk
Source: DBRS, S&P, Fitch Ratings, Moody’s15
The Moody’s rating model consists of four core risk categories, each indicator’s performance is
assessed on a range of very high plus (VH+) to very low minus (VL-). The rating procedure is rather
cumbersome. Event scenarios under which the scorecard generated ratings are subjectively adjusted are
outlined, the actual adjustment range however remains arbitrary. The S&P rating model is comprised of
five key factors, each factor’s performance is assessed on a scale from one (weakest) to six (strongest).
The final sovereign indicative rating is subject to max. +/- one subjective notch adjustment. The rating
methodology is only partly-transparent, specifications on rating weightings are undisclosed. Fitch Ratings
follows a multiple regression model accounting for 18 key risk variables. A forward-looking “Qualitative
Overlay” framework allows the regression results to be adjusted for factors not captured by the model.
Each one of the four rating pillars are subject to max. +/- two notch adjustments with an overall rating
adjustment range of max. +/- three notches. The DBRS rating framework accounts for total six risk
categories, assessed on a numeric scale of zero (low risk) to ten (high risk). Subjective rating adjustments
are fully incomprehensible. Details on the DBRS rating methodology are introduced in the subsequent
section 4.1.
15
Publicly available methodology manuals of S&P, Moody’s, Fitch Ratings and DBRS.

8
4 Rating Model Replication
4.1 Structure and Composition
The DBRS rating framework is composed of two analytical pillars, a sovereign scorecard and a debt
sustainability analysis. The latter has an effective impact of only five percent on the overall rating grade.
Within the sovereign scorecard, the risk factors (of both qualitative and quantitative nature) are
grouped into six categories. Each risk category is comprised of minimum one primary element, in turn
consisting of minimum one core indicator. Evaluated based on their historical and prospected
performance, risk factors are individually scaled from 0=low risk to 10=high risk. Scores are individually
weighted within and summed across the six categories and thus generate an overall scorecard result from
0=no default risk to 60=high default risk. The composite numeric score is lastly transformed into its
respective alphanumeric rating grade.
DBRS claims that its rating decisions are more responsive to changes in fundamental characteristics
rather than to changes in “cyclical economic conditions” – technical specifications are not disclosed.16
The
transparency on the DBRS sovereign rating approach overall is considerably low – characteristic for the
(sovereign) credit rating industry as a whole. Further, DBRS reserves for its final rating committee
decisions to significantly deviate from the scorecard-generated result as “the relative importance of risk
factors can vary” across countries. Tangible rules or adjustment ranges at this are fully undisclosed.
4.2 Replication Procedure
The replicated sovereign risk model of Portugal consists of total 43 qualitative and quantitative
indicators. DBRS provides the data evaluation, threshold application and weighting of 16 risk indicators
outlined in a hypothetical country rating model.17
I augment this model with additional 27 risk indicators
collected from a risk indicator list further provided by DBRS.18
Those 27 indicators’ evaluation, thresholds
and weightings follow – to the extent possible – the the data assessment, scoring and weighting of the 16
indicators provided with in the hypothetical country rating model. For transparency, the 27 indicators
following self-evaluated data assessment and threshold establishments are color-marked green in my
model. The 16 indicators with fully disclosed data assessment and threshold establishment are non color-
marked.
For simplicity, subsequent rating steps a) - e) are illustrated at hand of the risk category Debt and
Liquidity.19
The full list of all 43 indicators’ data assessment, performance evaluation and weighing is
provided in the Appendix.
a) Data Evaluation
Each risk factor is individually evaluated, predominantly by taking the average of a combination of
historical and forecasted data points. Data is mainly collected from large international institutions such as
IMF, World Bank and OECD. The individual data evaluation of all 43 indicators is provided in Appendix 3.
16
DBRS outlines fiscal responsibility, debt sustainability, economic diversification, price stability and the stability of the political system as exemplary fundamental country factors. 17
DBRS. 2016. “Rating Sovereign Governments Methodology”. Appendix B, Table 1. 18
DBRS. 2016. “Rating Sovereign Governments Methodology”. Appendix A. 19
To shortly exhibit the general model structure at this example, Debt and Liquidity represents one of the six risk categories. Debt Stock, Maturity Structure and Liquid Assets represent two of the category’s primary elements, General Government Gross Debt and Short-Term Public Debt in turn two of its total seven core elements. The number of primary elements and core elements varies across categories.

9
Table 2: Replicated model - Data evaluation
Debt & Liquidity
Indicator Data assessment
Debt Stock General Government Gross Debt (%GDP) Projected debt stock as of end of next calendar year
Private Sector Debt
Non-Financial Corporate Debt (%GDP) Average of 5 years historical data
Household Debt (%GDP) Average of 5 years historical data
Maturity Structure and Liquid Assets
Short-Term Public Debt (%GDP) Last available data
Average Maturity of Public Sector Debt (Years) Last available data
State Borrowing Requirements (%GDP) Average of 3 years projections
Susceptibility to Debt Shocks
Debt Sustainability Analysis - Change in Debt Stock
Total net change from base year 2016 to 2021 (mixed shock scenario) – IMF DSA 2016
b) Indicator Scaling
Evaluated based on their historical and prospected future performance, each factor is scaled from
0=low risk to 10=high risk under the application of individual – and mostly arbitrarily chosen – thresholds. If
not given guidance by similar indicators outlined in the hypothetical country model, indicator values of
worse and better performing OECD countries are used as a strong guide for the threshold establishment of
the additional 27 indicators.20
The indicator scaling for all factors is provided in Appendix 4.
Table 3: Replicated model - Indicator scaling
Debt and Liquidity
Indicator Unit
Thresholds Value
Score (0-10)
Low risk High risk
Debt Stock General Government Gross Debt (%GDP)
% 30,00 130,00 127,73
9,77
Private Sector Debt
Non-Financial Corporate Debt (%GDP)
% 30,00 130,00 147,09
10,00
Household Debt (%GDP) % 30,00 130,00 86,70
5,67
Maturity Structure and Liquid Assets
Short-Term Public Debt (%GDP)
% 5 15 11,93
6,93
Average Maturity of Public Sector Debt
years 10,00 3,00 8,42 2,25
State Borrowing Requirements (%GDP)
% 3,00 10,00 9,17 8,81
Susceptibility to Debt Shocks
Debt Sustainability Analysis - Change in Debt Stock
% 5,00 30,00 18,50
5,40
c) Weightings
Each primary element’s score represents the average of its core elements’ scores, weightings within a
category can vary. Each one of the six categories is equally weighted within the rating framework. The
weighting for my augmented model is built on the weighting structure provided for the DBRS hypothetical
country model.21
The weighting structure of the entire replicated model is outlined in Appendix 5.
20
Instancing, the threshold establishment for income inequality takes the Gini coefficient of Norway (0.25) and Brazil (0.5) as its low and high risk benchmarks. 21
DBRS. 2016. “Rating Sovereign Governments Methodology”. Appendix A. Table 2.

10
Table 4: Replicated model – Weighting
Debt and Liquidity
Indicator Individual Score
Averaged within Primary Element
Weighting within Category
Individual overall rating weight
Debt stock General Government Gross Debt (%GDP)
9,77 9,77 30% 5,00%
Private Sector Debt
Non-Financial Corporate Debt (%GDP)
10,00 7,83 20%
3,33%
Household Debt (%GDP) 5,67 3,33%
Maturity Structure & Liquid Assets
Short-Term Public Debt (%GDP)
6,93
6,00 20%
3,33%
Average Maturity of Public Sector Debt (Years)
2,25 3,33%
State Borrowing Requirements (%GDP)
8,81 3,33%
Susceptibility to Debt Shocks
Debt Susceptibility Analysis - Change in Debt Stock
5,40 5,40 30% 5,00%
d) Scorecard Mapping
Lastly, the indicative scorecard result is transformed into its respective alphanumeric rating grade
following a sovereign scorecard map. In the case of Portugal, the current sovereign credit rating of “BBB-“
corresponds to a numeric value of roughly 34.
Table 5: Sovereign scorecard map
Credit Rating Minimum score
AAA 12
AA range 18
A range 24
BBB range 30
BB range 36
B range 42
CCC range 48
CC range 54
C range 60
Source: DBRS22
e) Foreign currency vs. local currency sovereign rating
As it is the case for all advanced country, the strong international market integration of Portugal makes
a differentiation between foreign currency and local currency sovereign rating redundant.
4.3 Results
My replicated model generates a numeric scorecard result falling within the lower “BBB range” as
corresponding to Table 5. The replicated sovereign scorecard identifies Fiscal Management & Policy and
Debt & Liquidity as the highest risk categories. Positive momentum emanates from Political Environment,
the degree of “political commitment to fiscal consolidation” thereby plays a significant role.23
Strong
22
DBRS.2016. “Rating Sovereign Governments Methodology” manual. 23
DBRS Rating Report of Portugal from 21 October 2016 and 21 April 2017.

11
positive effects emanate from individual risk factors such as the Rate of Inflation, Current Account Balance
and Capital Account Balance.24
Negative momentum originates from the individual risk factors Interest
Payment (% Revenue), Public and Non-Financial Corporate Debt, State Borrowing Requirements, Total
Domestic Savings Rate, Loan to Deposit Ratio as well as Net International Investment Position and Gross
External Liabilities.
Table 6: Replicated model - Scorecard results for Portugal
Categories Scorecard
results
Fiscal Management & Policy 6,78
Debt and Liquidity 7,32
Economic Structure & Performance 4,34
Monetary Policy & Financial Stability
5,43
Balance of Payments 6,17
Political Environment 3,98
Total 34,02
Political Environment is the most qualitatively captured category of all. The category consists of two
purely qualitative primary elements: a) Institutional environment is assessed based on World Bank
Indexes, while b) Political commitment to address economic challenges and service debt is based fully on
the subjective assessment of the DBRS rating committee. Latter holds 50% of the category’s rating scale
and 8.33% on the final rating scale. DBRS provides a qualitative assessment on Political Environment in
its rating reports, the justification and transparency of this category is however not satisfactory. As already
stated, this paper identifies the “political commitment to fiscal consolidation” as the striking justification for
ongoing investment grading of Portugal. The currently most decisive rating aspect therefore underlies a
fully subjective assessment, making potential crucial rating alterations in large part incomprehensible for
external parties.
Although presented as a major rating pillar, the debt sustainability analysis has a rather negligible
effect on DBRS rating decision. Given Portugal’s comparably high public debt stock, its susceptibility to
(external) shocks – along with its harmful risk channels – should be given a stronger significance within the
model.
Given its individual rating weights, the model output is most sensitive to changes in following variables:
Net International Investment Position (4.17%), Gross External Liabilities (4.17%), General Government
Gross Debt (5%), Debt Susceptibility Analysis (5%), and Commitment to address economic challenges
and service debt (8.33%).
The results are evidently subject to the appropriateness of the replicated model. Yet, identified risk
sources are robust to various weight and threshold calibrations.
24
Full list of risk factors’ scores provided in Appendix 4.

12
5 Empirical Analysis
5.1 Risk factor effects: Cross-agency comparison
For the empirical analysis of rating differences among S&P, Moody’s, Fitch Ratings and DBRS, I
compare the cross-agency rating effects of ten fundamental economic variables. I thereby closely follow
the OLS regression approach conducted by Vernazza, Nielsen and Gkionakis (2014), who already
modeled rating decisions of Moody’s, S&P and Fitch Ratings on ten best-fitting risk variables. By
replicating their approach to DBRS rating grades, parameter estimates can directly be compared across all
four rating agencies.
A panel data set of total 224 end-of-year DBRS rating decisions of 36 different countries from
November 2000 until March 2017 are OLS-regressed on the fundamental variables vector and a macro
time effect .25
(1)
Alphanumeric rating variables are again converted into numeric values following the conversion table in
Appendix 1. The ten fundamental economic variables are chosen based on goodness-of-fit tests
conducted by Vernazza, Nielsen and Gkionakis.
Table 7: Definition of variables – OLS regression
Variable Definition
Units
Data Source26
Nominal GDP GDP in current prices USD tn. IMF
GDP per capita Nominal GDP per person, PPP-adjusted USD thous. IMF
GDP growth Average annual real GDP growth, t-9 to t Percent IMF
Public Debt General government gross debt Percent of GDP
IMF, own calculations
Current Account Annual current account balance Percent of GDP
IMF
External Debt Gross external debt Percent of GDP
BIS, own calculations
Past Default Dummy variable taking value 1 in all years following a default event since 1960, 0 otherwise
Binary IMF, Reinhard & Rogoff, own calculation
Advanced Country Dummy variable taking the value 1 if country classified as Advanced Country by IMF, 0 otherwise
Binary IMF
Government World Bank Government Effectiveness Index
Index World Bank
Law World Bank Rule of Law Index Index World Bank
25
Ratings from 2017 are grades published in the first half of the year as end-of-year ratings are not available yet. 26
IMF World Economic Outlook 2017, BIS= Bank of International Settlement

13
Table 8: OLS regression results
Variable Moody’s+a
S&P+a
Fitch Ratings+a
DBRS+
Nominal GDP 0.13 [0.09]
0.17 [0.12]
0.13* [0.07]
0.24*** [0.07]
GDP per capita 0.15*** [0.04]
0.14*** [0.04]
0.14*** [0.04]
0.02 [0.03]
GDP growth 0.10** [0.05]
0.23*** [0.06]
0.11*** [0.04]
0.44*** [0.13]
Public Debt -0.04*** [0.01]
-0.04*** [0.01]
-0.03*** [0.01]
-0.02*** [0.01]
Current Account -0.05*** [0.01]
-0.02 [0.01]
-0.02* [0.01]
-0.04 [0.05]
External Debt -1.5E-4*** [2.6E-5]
-1.3E-4* [7.0E-5]
-8.5E-5*** [1.9E-5]
-5.4E-4 [3.6E-4]
Past Default -1.75*** [0.51]
-0.27 [0.33]
-2.05*** [0.67]
-3.1*** [0.65]
Advanced Country 3.23*** [1.09]
3.98*** [0.98]
2.95** [1.18]
0.01 [1.16]
Government 0.64*** [0.41]
1.01*** [0.32]
1.11*** [0.34]
3.5*** [0.96]
Law 0.48** [0.45]
0.27 [0.34]
7.6E-4 [0.33]
0.95 [0.75]
No. Observations 999 1108 971 224
No. Countries 94 103 94 36
R-sq. 0.79 0.82 0.79 0.98
+ Significance level: * 10%; ** 5%; ***1%
a Regression results for S&P, Moody’s and Fitch Ratings are taken from Vernazza, Nielsen and
Gkionakis (2016), DBRS regression results are depicted in Appendix 2.
A number of DBRS parameters are statistically insignificant. This might be due to the significantly
smaller number of available DBRS rating observations or due to the inappropriateness of the best-fitted
explanatory variables under the DBRS rating framework.27
The regression model predicts Public Debt, Current Account and External Debt to similarily affect rating
decisions across all agencies. GDP per capita and the dummy variable Advanced Country appear to play
a comparably smaller role under the DBRS rating framework, the estimators are also statistically
insignificant. Past Default history, long-term GDP growth as well as the Government and Law index are
expected to have significant larger effects under the DBRS rating framework than it is the case for S&P,
Moody’s or Fitch Ratings.28
27
The S&P results from Vernazza, Nielsen and Gkionakis show similar levels of low significance. 28
As it is the case under most agencies, the Law indicator is statistically insignificant for DBRS as well.

14
5.2 Subjective rating component analysis among DBRS cross-country ratings
In the paper by Vernazza, Nielsen and Gkionakis (2014) rating grades are further broken down into
their subjective and objective rating components. The fitted values of their OLS regressions are thereby
defined as the objective component – ratings solely based on the ten fundamental variables. The
difference between the observed and fitted values (residuals) are interpreted as the subjective rating
adjustment.29
As already assessed in this paper, DBRS fails to deliver tangible rules on its subjective rating
adjustments, thereby leaving a potentially significant component of the DBRS rating decision on Portugal
incomprehensible. The motivation to further analyze the significance of the subjective rating components
for the rating decisions on Portugal – in specific its comparison within the DBRS cross-country ratings – is
therefore considerably high.
Cross-panel DBRS rating decisions are therefore fragmented into their subjective and objective rating
component following the Vernaza, Nielsen and Gkionakis analysis approach. The model itself is however
significantly altered in this paper.
(a)
The analysis of rating dependent variables under the application of an OLS-regression has significant
shortcomings. The dependent variable is unbounded, categories are assumed to be equi-distant and
marginal effects to be constant. Ratings are however bounded within the rating scale from default status
“D” to highest investment grading “AAA”. Changes in risk variables along the rating scale can depict
varying marginal effects – in specific when reaching the upper and lower rating grade limits. An OLS
regression is therefore only suitable to a limited extent. Ordered probit models treat variables as ordinal,
and thereby cannot serve the purpose to fractionally decompose DBRS rating grades. Further, the ordered
probit model’s interpretation becomes laborious with an increasing number of categories – a minimum of
24 ordinal categories in the sovereign risk rating case.
I therefore follow an alternative rating scale model developed by Studer and Winkelmann (2016),
applying a Bernoulli quasi-maximum likelihood estimation (QMLE).30
The random component is
assumed to follow a Bernoulli distribution. The expected value of (mean response) depends on the
linear predictor of the explanatory variables through a probit function .31
The model allows me to
obtain fitted fractional values, to comply with rating boundaries and to allow for non-constant marginal
effects.
Following the Bernoulli distribution, the limited dependent variable has to lie within the range of
[ ] with a probability of 1 and as the rating grade “AAA”. The numerically converted rating
variables (again following the rating conversion table in Appendix 1) therefore need to be transformed into
their respective fractional values. The lowest rating bound “D” corresponds to a numeric value of 2. The
dependent fractional variable therefore has to be computed as follow
with (2)
with the scaled probit model version of
(3)
29
Vernazza, Nielsen and Gkionakis follow a rather “maximalist definition” by lumping the entire residual into the subjective part (Moor, Luitel, Sercu and Vanpee, 2017). 30
Studer and Winkelmann apply the QMLE rating model for the analysis of health care ratings. 31
The model can also be run with a logistic link function, coefficients are however slightly more significant under probit.

15
and the Bernoulli quasi-likelihood function for observations of
∏ ( (
)
)
( (
)
)
(4)
Marginal effects diminish as the model approaches its upper and lower bounds, ultimately reaching
zero in the limit ( .
(5)
Robust standard errors are used, the macro-time effect also remains in place.32
(b)
The ten best-fitting regressors under the Vernazza, Nielsen and Gkionakis OLS model are not fully
satisfactory and appropriate for my QMLE model. I replace PastDefault, Advanced Country, Law and
Government with the new variables Investment, Unemployment Rate, National Savings Rate and
Inflation.33
Further, all variables are evaluated following the DBRS rating methodology.34
Data is collected
from the IMF World Economic Outlook 2017.35
Again, the model is based on a panel data set of 224
observations, consisting of DBRS end-of-year rating decisions of total 36 different countries from
November 2000 until March 2017.
Table 9: Definition of variables - Rating scale model
32
As the dependent variable is not binary but a rating variable, Studer and Winkelmann (2016) apply robust standard errors. 33
Indicators are either insignificant under the new model or not accounted for under the DBRS rating framework. 34
Accounting for the DBRS longer-term rating approach (e.g. taking the average of 10/5 Y historic data + 3 Y forecasted data points), in individual cases constrained by data availability (e.g. External Debt). National Savings Rate is accounted for as “Last available data” and Public Debt as “Projected next calendar year value” value under the DBRS rating framework. 35
With the exception for External Debt, collected from the Bank of International Settlement (SDDS Databank).
Variable Definition
Units
Data Evaluation
Public Debt General Gov. Gross Debt
Percent of GDP Projected next calendar year value
GDP growth Real GDP growth rate
USD tn. 10 years historical data + 3 years projections
GDP p. c Nominal GDP p. c USD thous. 10 years historical data
Structural Balance General Gov. Structural Balance
Percent of GDP 10 years historical data + 3 years projections
Current Account Current Account Percentage of GDP
5 Years historical data + 3 years projections
Investment Total Investment Percent of GDP 5 Years historical data + 3 years projections
Unemployment Rate Unemployment rate Percent of total labor force
5 Years historical data + 3 years projections
Inflation Inflation, Average Consumer Prices
Percentage change
5 Years historical data + 3 years projections
National Savings Rate
Total National Savings
Percent of GDP Last available data
External Debt Gross External Debt Percent of GD Last available data

16
Regression results are presented in Appendix 2. The coefficients reported are asymptotically
equivalent to maximum likelihood estimators. All variables are statistically strongly significant. The
estimated effects and standard errors need to be re-transformed into their actual values by multiplying by
. Parameter signs are as anticipated, with the exception of GDP Growth. Further coefficients
interpretation is however not objective of this empirical analysis.
Following Vernazza, Nielsen and Gkionakis, the difference between observed and fitted ratings
represent the subjective rating component. The fitted fractional rating grades are obtained as follow.
(6)
The model’s goodness-of fit is tested under the criterion of deviance as well as the Akaike (AIC) and
Bayesian (BIC) information criteria.
The model attests DBRS a comparably “dovish” rating behavior on Portugal, on average inflating the
objective rating by one subjective notch adjustment (+1.01). The subjective rating component among all
DBRS cross-country ratings is neutral (-2.5E-5).36
A generally more lenient rating characteristic of DBRS
across all countries can therefore not be testified.
When depicting the subjective rating component of Portugal across time, the extent of subjective rating
adjustment appears to diminish since reaching its peak in 2013. The model therefore suggests DBRS
rating decisions on Portugal to gradually approach their fundamental, quantifiable rating values.37
36
Interestingly, the negative outliers depicted in Figure 3 are DBRS rating decisions on Cyprus in the years 2013 and 2014, and Argentina in 2015. 37
The numeric rating value of 15 corresponds to the alphanumeric rating grade of “BBB-“.
Figure 3: Subjective rating component - Panel results

17
Figure 4: Subjective rating component – Portugal
6 Rating Outlook
S&P and Moody’s have reaffirmed their “BB+” respectively “Ba1” ratings earlier this year, and both
outlooks remain stable. In line with the predictions provided based on preliminary results of my models,
DBRS has kept its rating decision on April 21, 2017 unchanged to “BBB-“ with a stable outlook.
Fundamental economic and political conditions have not changed substantially since its last rating report in
October 2016. The high indebtedness of both the private (non-financial corporate debt level of 117 percent
of GDP) and public sector (gross government debt of 128 percent GDP) remain the limiting factors.
External debt (220 percent of GPD) is one of the highest worldwide. Commitment to fiscal consolidation is
assessed to still be strong. Budget deficit improvements (2 percent of GDP in 2016) will likely allow
Portugal to leave the Excessive Deficit Procedure early. Large parts of fiscal improvements are however
due to one-off measures (e.g. the PERES program) and significant cuts in public investment.38
Receding
banking sector risks (due to e.g. the finalized sale of Novo Banco and the recapitalization of Caixa Geral
de Depositós and Banco Comercial Português) give a positive momentum, are however not expected to
change the rating grade. The share of non-performing loans remains alerting (12% of total loans). The
ECB has been gradually reducing its monthly bond buying purchase volumes, expected to be tapering out
by the end of this year.39
Pressure on governmental bond yields is (ceteris paribus) anticipated.
Against the backdrop of the outlined economic situation of Portugal as well as the potential rating
adjustment scenarios given by DBRS itself, I expect the DBRS rating decision on Portugal to remain
unchanged for this calendar year.
38
Special Program for Reduction of Debt to the State Department (PERES): incentive-creating tax repayment scheme for households and corporations. The program is estimated of having generated 300 Mio. EUR one-off state revenues for the 2016 state budget. 39
Constrained by the capital key and the ECB rule to hold max. one third of a country’s total outstanding debt as well as the PSPP program’s expected termination by the end of this year.

18
Table 10: Scenarios of Future Rating Adjustments
Source: DBRS40
7 Conclusion
In this paper, I provide a comprehensive analysis and assessment of the DBRS sovereign rating
methodology. Both my qualitative and empirical analysis attest DBRS a comparably dovish rating behavior
on Portugal, not only in comparison with the Big Three’s rating decisions but also within the DBRS cross-
country ratings. The replicated model identifies Fiscal Management & Policy and Debt & Liquidity as the
highest risk categories. A positive momemtum emanates from the risk category Political Environment. The
“political commitment to fiscal consolidation” is identified as the striking qualitative justification of ongoing
investment grading of Portugal. The transparency on the DBRS rating methodology is significantly low. On
average, the Portuguese objective rating is subjectively inflated by one rating notch.
From a technical point of view, it could be interesting to study further the rating scale model introduced
by Studer and Winkelmann (2016) and to compare its results obtained in this paper employing alternative
rating analysis approaches.41
Additionally, one could elaborate further what events or indicator changes
underlie the extraordinary positive subjective rating adjustment in 2013. Further, one could extend the
subjective rating component analysis to other countries. For example, Cyprus, Argentina and Greece
would be of great interest to analyze, in specific its component developments during the sovereign debt
crisis.
Just like any other model, the DBRS rating model has its shortcomings. This paper finds significant
subjective rating adjustment in the case of Portugal, which does not necessarily indicate that the DBRS
rating model is flawed and imprecise per se. The incorporation of (qualitative) country-specific advantages
and disadvantages can result in more appropriate and sophisticated final rating decisions than to purely
follow quantifiable output. Rating agencies should however – particularly DBRS – be more transparent in
their rating assessment. D’Agostino and Lennkh (2016) recommend the publication of two distinct credit
ratings: a) a purely quantitatively derived grade as well as b) a final rating including the rating agency’s
subjective adjustment. Market participants could then assess and evaluate the appropriateness of the
subjective rating adjustment by themselves.
40
DBRS Rating Report of Portugal from 21 October 2016 and 21 April 2017. 41
In specific in comparison with the well-established and frequently applied ordered probit model.
Downward Upward
Deterioration in public debt dynamics
Sustainable improvement in public finances
Contraction of fiscal consolidation/political commitment
Robust medium-term growth prospects

19
8 References
Afonso et al. 2007. “What hides behind sovereign debt ratings.” ECB Working Paper Series 711.
Afonso et al. 2011. “Short and long-run determinants of sovereign debt credit ratings.” International Journal
of Finance & Economics.
Amstad and Packer. 2015. “Sovereign ratings of advanced and emerging economies after the crisis. BIS
Quarterly Review December.
Bhatia, Lin.2002.”Sovereign Credit Ratings Methodology: An Evaluation.” IMF Working Paper WP/02/170.
Cantor and Packer.1996.”Determinants and Impact of Sovereign Credit Ratings.” Federal Reserve Bank of
New York Economic Policy Review.
D’Agostino and Lennkh. 2016. ”Euro Area Sovereign Ratings: An Analysis of Fundamental Criteria and
Subjective Judgement.” ESM Working Paper Series. No. 14.
DBRS. 2016. “Rating Sovereign Governments Methodology.”
http://www.dbrs.com/research/300639/rating-sovereign-governments.pdf.
Fitch Ratings. 2016. “Sovereign Rating Criteria.” http://fitchratings.com
Hilbe Joseph M.. 2014. ”Generalized Linear Models.” Arizona State University.
McCullagh and Nelder. 1989. “Generalized Linear Models”. 2d ed. London: Chapman & Hall.
Moody’s. 2016. “Rating Methodology: Sovereign Bond Ratings.”
https://www.moodys.com/researchdocumentcontentpage.aspx?docid=PBC_1044859.
Moor, Luitel, Sercu and Vanpee. 2017. “Subjectivity in sovereign credit ratings.” Faculty of Economics and
Business, KU Leuven.
Standard & Poor’s. 2014. “Sovereign Rating Methodology.”
https://www.standardandpoors.com/en_US/web/guest/article/-/view/type/HTML/id/1813072.
Teker, Pala and Kent. 2013. “Determinants of Sovereign Ratings Factor Based Ordered Probit Models for
Panel Data Analysis Modelling Framework.” International Journal of Economics and Financial Issues,
Volume 3.
Vernazza, Nielsen and Gkionakis. 2014. “The Damaging Bias of Sovereign Ratings.” Unicredit Globals
Themes Series. No.21.
Stata Users Guide. 2015. Version 14. College Station: Stata Press.
Studer and Winkelmann. 2016. “Economic Analysis of Ratings – with an Application to Health and
Wellbeing.” University of Zurich.
McCullagh, Peter, and John A. Nelder. 1989. “Generalized Linear Models.” 2nd ed. London:
Chapman & Hall.
20
9 Appendix
Appendix 1: Rating conversion table
Fitch Ratings
Moody’s S&P DBRS Numerical Scale
AAA Aaa AAA AAA 24
AA+ Aa1 AA+ AA+ 23
AA Aa2 AA AA 22
AA- Aa3 AA- AA- 21
A+ A1 A+ A+ 20
A A2 A A 19
A- A3 A- A- 18
BBB+ Baa1 BBB+ BBB+ 17
BBB Baa2 BBB BBB 16
BBB- Baa3 BBB- BBB- 15
BB+ Ba1 BB+ BB+ 14
BB Ba2 BB BB 13
BB- Ba3 BB- BB- 12
B+ B1 B+ B+ 11
B B2 B B 10
B- B3 B- B- 9
CCC+ Caa1 CCC+ CCC+ 8
CCC Caa2 CCC CCC 7
CCC- Caa3 CCC- CCC- 6
CC Ca CC CC 5
C C C C 4
DDD
SD SD 3
DD
D D 2
D
1
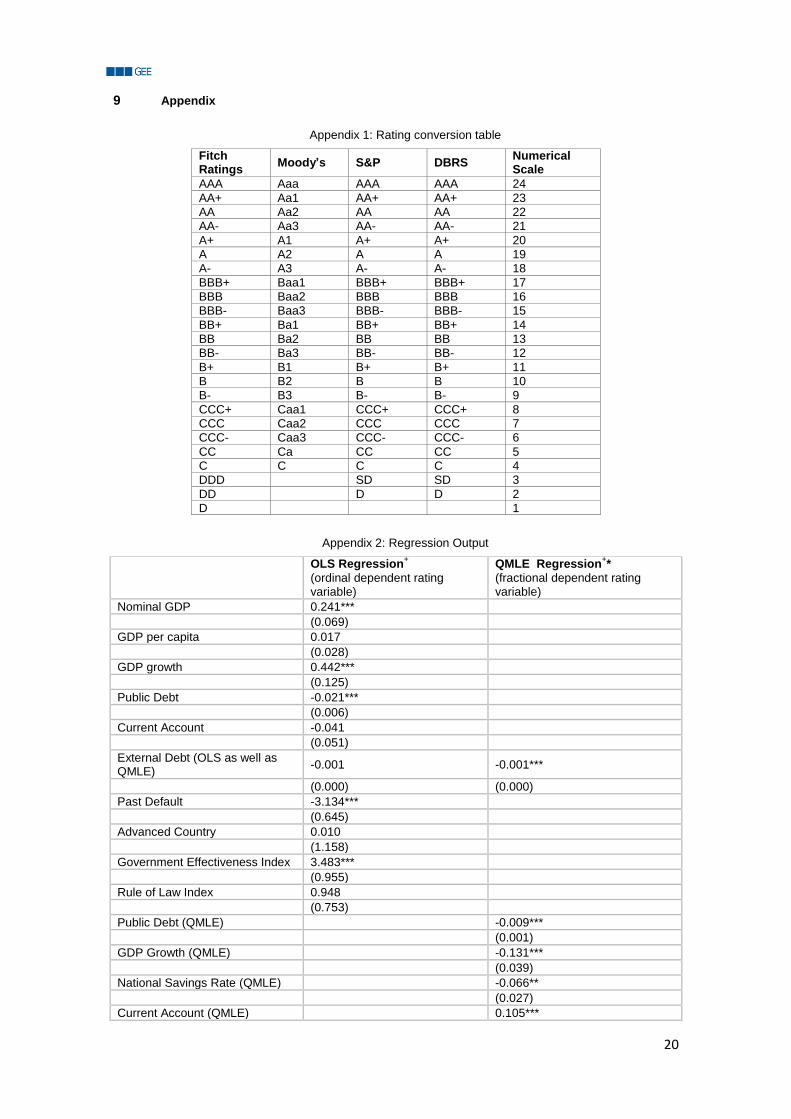
Appendix 2: Regression Output
OLS Regression+
(ordinal dependent rating variable)
QMLE Regression+*
(fractional dependent rating variable)
Nominal GDP 0.241***
(0.069)
GDP per capita 0.017
(0.028)
GDP growth 0.442***
(0.125)
Public Debt -0.021***
(0.006)
Current Account -0.041
(0.051)
External Debt (OLS as well as QMLE)
-0.001 -0.001***
(0.000) (0.000)
Past Default -3.134***
(0.645)
Advanced Country 0.010
(1.158)
Government Effectiveness Index 3.483***
(0.955)
Rule of Law Index 0.948
(0.753)
Public Debt (QMLE) -0.009***
(0.001)
GDP Growth (QMLE) -0.131***
(0.039)
National Savings Rate (QMLE) -0.066**
(0.027)
Current Account (QMLE) 0.105***
21
(0.021)
GDP per capita (QMLE) 0.052***
(0.006)
Structural Balance (QMLE) -0.071***
(0.021)
Unemployment Rate (QMLE) -0.039***
(0.008)
Inflation Rate (QMLE) -0.082***
(0.017)
Investment Rate (QMLE) 0.128***
(0.027)
Observations 224 224
Adjusted 0.984
Deviance 13.55 +Significance level: * 10%; ** 5%; ***1%
*The QMLE Regression uses different data assessment than the OLS regression in the attempt to
replicate the DBRS rating methodology as close as possible (Table 9).
Appendix 3: Replicated Model - Data Assessment
Primary Element Indicator Methodology
Fiscal Management & Policy
Overall Fiscal Performance Overall Fiscal Balance (%GDP) Average of 10 years historical data + 3 years projection
Structural Fiscal Balance (%GDP) Average of 10 years historical data + 3 years projection
Primary Fiscal Balance (%GDP) Average of 10 years historical data + 3 years projection
Interest Payments (%Revenues) Last available data
Gov. Policy Management & Budget Control
Government Policymaking Transparency
Global Competitiveness Index - Last available data
Quality of Public Spending Global Competitiveness Index - Last available data
Public Investment (%GDP) Last available data
Debt and Liquidity
Debt Stock General Government Gross Debt (%GDP)
Projected debt stock as of end of next calendar year
Private Sector Debt Non-Financial Corporate Debt (%GDP) Average of 5 years historical data Household Debt (%GDP) Average of 5 years historical data
Maturity Structure & Liquid Assets
Short-Term Public Debt (%GDP) Last available data
Average Maturity of Public Sector Debt (Years)
Last available data
State Borrowing Requirements (%GDP) Average of 3 years projections
Susceptibility to Debt Shocks Debt Sustainability Analysis - Change in Debt Stock
Total net change from base year 2016 to 2021 (mixed shock scenario) - IMF DSA 2016
Economic Structure & Performance
Econ. Growth & Productivity Real GDP p.c. Growth (%) Average of 10 years historical data + 3 years projections
GDP p.c. (Thous. USD) Average of 10 years historical data Human Development Index UNDP Index - Last available data
Econ. Resilience & Flexibility Output Volatility (%)
Standard deviation of real GDP growth rate measured over 20 years of historical data + projected next 3 years
Unemployment Rate (%) Average of 5 years historical data + 3 years projection
Doing Business Ranking World Bank World Bank Index - Last available data
Change in Real Unit Labor Cost (%) Average of 5 years historical data

22
Private Sector Investment & Savings
Households Investment Rate Average of 5 years historical data
Non-Financial Corporate Investment Rate
Average of 5 years historical data
Demographics Population Growth Average of 10 years historical data + 3 years projection
Income Distribution Gini-Coefficient Last available data
Monetary Policy & Financial Stability
Policy Credibility Rate of Inflation (%) Average of 5 years historical data + 3 years projections
Total Domestic Savings (%GDP) Last available data
Change in 10Y PGB Yields during Economic Slowdown*
Average annual change over 17 years historical data (Bps)
Financial Risk Gross Non-Performing Loans (%Total Loans)
Last available data
Loan to Deposit Ratio Last available data Tier 1 Capital Ratio Last available data
Regulation Securities Exchanges Global Competitiveness Index - Last available data
Balance of Payments
External Imbalance Current Account Balance (%GDP) Average of 5 years historical data + 3 years projections
Capital Account Balance (%GDP) Average of 5 years historical data + 3 years projections
Foreign Direct Investment (%GDP) Average of 5 years historical data Change in Terms of Trade Average of 5 years historical data Net Investment Position & Foreign Reserves Liquidity
Net International Investment Position (%GDP)
Average of 5 years historical data
Gross External Liabilities (%GDP) Average of 5 years historical data
Political Environment
Institutional Environment Voice and Accountability (Index) World Bank Governance Indicators - Last availble data
Rule of Law (Index) World Bank Governance Indicators - Last availble data
Government Effectiveness (Index) Global Competitiveness Index - Last available data
Judicial Independence (Index) Global Competitiveness Index - Last available data
Commitment to address economic challenges and service debt
Government capacity and willingness to act in response to economic and financial challenges
subjective assessment based on thought exchange with institutional representatives and bank-intern discussions
*Economic slowdown defined as: real annual GDP growth ≤ 0.5 of standard deviation of historical real GDP growth (17 years)
Appendix 4: Replicated Model - Indicator Scaling
Primary Element Indicator Unit
Threshold Value
Score (0-10)
Low risk
High risk
Fiscal Management & Policy
Overall Fiscal Performance Overall Fiscal Balance (%GDP) % 0,00 -8,00 -5,25 6,56 Structural Fiscal Balance (%GDP) % 0,00 -6,00 -3,64 6,07 Primary Fiscal Balance (%GDP) % 0,00 -3,00 -1,53 5,08
Interest Payment (%Revenue) % 5,00 8,00 10,29
10,00
Gov. Policy Management & Budget Control
Government Policymaking Transparency
Index 7,00 1,00 3,90 5,17
Quality of Public Spending Index 7,00 1,00 2,80 7,00 Public Investment (%GDP) % 10,00 0,00 2,27 7,73
Debt and Liquidity
Debt Stock General Government Gross Debt (%GDP)
% 30 130 127,73
9,77

23
Private Sector Debt Non-Financial Corporate Debt (%GDP)
% 30,00 130,00 147,09
10,00
Household Debt (%GDP) % 30,00 130,00 86,70
5,67
Maturity Structure & Liquid Assets
Short-Term Public Debt (%GDP) % 5 15 11,93
6,93
Average Maturity of Public Sector Debt
Years 10,00 3,00 8,42 2,25
State Borrowing Requirements (%GDP)
% 3,00 10,00 9,17 8,81
Susceptibility to Debt Shocks Debt Sustainability Analysis - Change in Debt Stock
% 5 30 18,50
5,40
Economic Structure & Performance
Econ. Growth & Productivity Real GDP p.c. Growth (%) % 4,00 -1,00 0,83 6,34
GDP p.c. (Thous. USD) 1000 USD
35 5 21,99
4,34
Human Development Index Index 1,00 0,00 0,83 1,70
Econ. Resilience & Flexibility Output Volatility (%) % 1,00 6,00 2,15 2,31
Unemployment Rate (%) % 5,00 15,00 12,91
7,91
Doing Business Ranking World Bank
Index 100,00 0,00 77,40
2,26
Change in Real Unit Labor Cost (%)
% 0,00 2,00 0,47 2,36
Private Sector Investment & Savings
Households Investment Rate % 10,00 2,00 4,78 6,53
Non-Financial Corporate Investment Rate
% 30,00 10,00 20,33
4,83
Demographics Population Growth % 0,25 -0,25 -0,06 6,18
Income Distribution Gini-Coefficient Index 25,00 50,00 34,00
3,60
Monetary Policy & Financial Stability
Policy Credibility Rate of Inflation (%) % 3,00 15,00 0,88 0,00
Total Domestic Savings (%GDP) % 200 20 14,81
10,00
Change in 10Y PGB Yields during Econ. Slowdown (Bps)
bps -50 200 -41,92
0,32
Financial Risk Gross Non-Performing Loans (%Total Loans)
% 3,00 15,00 12,20
7,67
Loan to Deposit Ratio % 80,00 100,00 109,70
10,00
Tier 1 Capital Ratio % 20,00 8,00 12,78
6,02
Regulation Securities Exchanges Index 7,00 1,00 3,40 6,00
Balance of Payments
External Imbalance Current Account Balance (%GDP) % -1,00 -8,00 -0,28 0,00 Capital Account Balance (%GDP) % -1,00 -5,00 1,40 0,00
Foreign Direct Investment (%GDP)
% 10,00 2,00 5,01 6,24
Change in Terms of Trade % 2,00 -2,00 0,76 3,11
Net Investment Position & Foreign Reserves Liquidity
Net International Investment Position (%GDP)
% 0 -50 -130,18
10,00
Gross External Liabilities (%GDP) % 30,00 130,00 223,13
10,00
Political Environment
Institutional Environment Voice and Accountability (Index) Index 2,50 -2,50 1,12 2,75 Rule of Law (Index) Index 2,50 -2,50 1,14 2,71 Government Effectiveness Index 2,50 -2,50 1,23 2,54 Judicial Independence (Index) Index 7,00 1,00 4,70 3,83
Commitment to address economic challenges and service debt
Gov. capacity & willingness to act in response to economic & financial challenges
arbitrary* 0,00 10,00 5,00 5,00

24
*subjective assessment based on thought exchange with institutional representatives and bank-intern discussions
Appendix 5: Replicated Model - Weighting
Primary Element Indicator Indiv. Scaling
Weightning
Scorecard results
averaged w/in primary element
w/in category
overall individually
Fiscal Management & Policy
6,78
Overall Fiscal Performance
Overall Fiscal Balance (%GDP) 6,56
6,93 50%
2,08%
Structural Fiscal Balance (%GDP) 6,07 2,08%
Primary Fiscal Balance (%GDP) 5,08 2,08%
Interest Payment (%Revenue) 10,00 2,08%
Gov. Policy Management & Budget Control
Government Policymaking Transparency
5,17
6,63 50%
2,78%
Quality of Public Spending 7,00 2,78%
Public Investment (%GDP) 7,73 2,78%
Debt and Liquidity
7,32
Debt stock General Government Gross Debt (%GDP)
9,77 9,77 30% 5,00%
Private Sector Debt
Non-Financial Corporate Debt (%GDP) 10,00 7,83 20%
1,67%
Household Debt (%GDP) 5,67 1,67%
Maturity Structure & Liquid Assets
Short-Term Public Debt (%GDP) 6,93
6,00 20%
1,11%
Average Maturity of Public Sector Debt (Years)
2,25 1,11%
State Borrowing Requirements (%GDP)
8,81 1,11%
Susceptibility to Debt Shocks
Debt Susceptibility Analysis - Change in Debt Stock
5,40 5,40 30% 5,00%
Economic Structure & Performance
4,34
Econ. Growth & Productivity
Real GDP p.c. Growth (%) 6,34
4,12 45%
2,50%
GDP p.c. (Thous. USD) 4,34 2,50%
Human Development Index 1,70 2,50%
Econ. Resilience & Flexibility
Output Volatility (%) 2,31
4,16 30%
1,25%
Unemployment Rate (%) 7,91 1,25%
Doing Business Ranking WorldBank 2,26 1,25%
Change in Real Unit Labor Cost (%) 2,36 1,25%
Private Sector Investment & Savings
Households Investment Rate 6,53
5,68 10%
0,83%
Non-Financial Corporate Investment Rate
4,83 0,83%
Demographics Population Growth 6,18 6,18 5% 0,83%
Income Distribution
Gini-Coefficient 3,60 3,60 10% 1,67%
Monetary Policy & Financial Stability
5,43
Policy credibility
Rate of Inflation (%) 0,00
3,44 50%
2,78%
Total Domestic Savings (%GDP) 10,00 2,78%
Change in 10Y PGB Yields during Econ. Slowdown (Bps)
0,32 2,78%
Financial risk
Gross Non-Performing Loans (%Total Loans)
7,67
7,42 50%
2,08%
Loan to Deposit Ratio 10,00 2,08%
Tier 1 Capital Ratio 6,02 2,08%
Regulation Securities Exchanges 6,00 2,08%
Balance of Payments
6,17

25
External Imbalance
Current Account Balance (%GDP) 0,00
2,34 50%
2,08%
Capital Account Balance (%GDP) 0,00 2,08%
Foreign Direct Investment 6,24 2,08%
Change in Terms of Trade 3,11 2,08%
Net Investment Position & Foreign Reserves Liquidity
Net International Investment Position (%GDP)
10,00
10,00 50%
4,17%
Gross External Liabilities (%GDP) 10,00 4,17%
Political Environment
3,98
Institutional Environment
Voice and Accountability (Index) 2,75
2,96 50%
2,08%
Rule of Law (Index) 2,71 2,08%
Government Effectiveness 2,54 2,08%
Judicial Independence (Index) 3,83 2,08%
Commitment to address economic challenges and service debt
Government capacity and willingness to act in response to economic and financial challenges
5,00 5,00 50% 8,33%