Embed Size (px)
Citation preview
FAO Fisheries and
Aquaculture Circular
FIAM/C1115 (En)
ISSN 2070-6065
CASE STUDIES ON PRICE INTEGRATION IN INTERNATIONAL SEAFOOD TRADE

FAO Fisheries and Aquaculture Circular No. 1115 FIAM/C1115 (En)
CASE STUDIES ON PRICE INTEGRATION IN INTERNATIONAL SEAFOOD TRADE José Fernández-Polanco IDES – Department of Business Management University of Cantabria, Spain Trond Bjørndal Aalesund University College Aalesund, Norway SNF Centre for Applied Research at NHH Bergen, Norway Audun Lem Deputy Director Fisheries and Aquaculture Policy and Resources Division Food and Agriculture Organization Rome, Italy
FOOD AND AGRICULTURE ORGANIZATION OF THE UNITED NATIONS Rome, 2016
The designations employed and the presentation of material in this information product do not imply the expression of any opinion whatsoever on the part of the Food and Agriculture Organization of the United Nations (FAO) concerning the legal or development status of any country, territory, city or area or of its authorities, or concerning the delimitation of its frontiers or boundaries. The mention of specific companies or products of manufacturers, whether or not these have been patented, does not imply that these have been endorsed or recommended by FAO in preference to others of a similar nature that are not mentioned.
The views expressed in this information product are those of the author(s) and do not necessarily reflect the views or policies of FAO.
ISBN 978-92-5-109341-2
© FAO, 2016
FAO encourages the use, reproduction and dissemination of material in this information product. Except where otherwise indicated, material may be copied, downloaded and printed for private study, research and teaching purposes, or for use in non-commercial products or services, provided that appropriate acknowledgement of FAO as the source and copyright holder is given and that FAO’s endorsement of users’ views, products or services is not implied in any way.
All requests for translation and adaptation rights, and for resale and other commercial use rights should be made via www.fao.org/contact-us/licence-request or addressed to [email protected].
FAO information products are available on the FAO website (www.fao.org/publications) and can be purchased through [email protected].
iii
PREPARATION OF THIS DOCUMENT
This report was prepared as part of the terms of reference of a visiting expert’s stay at the Food and Agriculture Organization of the United Nations Products, Trade and Marketing Branch (FAO-FIAM) in the spring of 2015, with the aim of improving knowledge of value-chain dynamics in international seafood markets. The analysis of price transmission in the value chain of fishery products provides information on potential bottlenecks and situations of market power that may affect the distribution of revenue among participants. Three case studies on price transmission of imported seafood products in the Spanish market illustrate scenarios combining developed and developing countries of origin and levels of processing of the commodities.
iv
FAO. 2016. Case studies on price integration in international seafood trade, by José Fernández Polanco, Trond Bjørndal and Audun Lem. Fisheries and Aquaculture Circular No. 1115. Rome, Italy.
ABSTRACT
Methods of price integration have been used to test price competition and transmission in the value chain of a selected group of seafood commodities imported into the Spanish market from developed and developing countries. The selected commodities are salted cod and frozen hake (whole and fillets) and frozen squid. The models studied involve data on prices of imports from different countries and of domestic retail. With the exception of frozen whole hake, price competition across exporters has been found in all the other commodities. Price and quality leaders have been identified in all cases. Price transmission has also been verified in salted cod, frozen hake fillets and frozen squid. Results of this analysis indicate that bargaining power is more likely to be exerted by Spanish importers when the trade partners are developing countries, such as in the case of hake and squid. On the contrary, when exporters are based in developed countries, as is the case for salted cod, bargaining power is more likely to be exerted by exporters than by importers.
v
CONTENTS
Preparation of this document iii
Abbreviations and acronyms vi
Acknowledgements vii 1. INTRODUCTION 1
2. THE SEAFOOD VALUE CHAIN IN SPAIN 3
3. PRICE INTEGRATION IN FISHERIES RESEARCH 6
4. METHODS AND MATERIALS 8
5. CASE STUDY 1. SALTED COD 9
5.1. Production and imports of salted cod 9
5.2. Price integration analysis 11
5.2.1. Data sources 12
5.2.2. Evolution of price series 12
5.2.3. Distributional properties 13
5.2.4. Results 14
5.2.5. Discussion 17
6. CASE STUDY 2. FROZEN HAKE 19
6.1. Production and imports of frozen hake 19
6.2. Price integration analysis 21
6.2.1. Data sources 21
6.2.2. Evolution of price series 21
6.2.3. Distributional properties 24
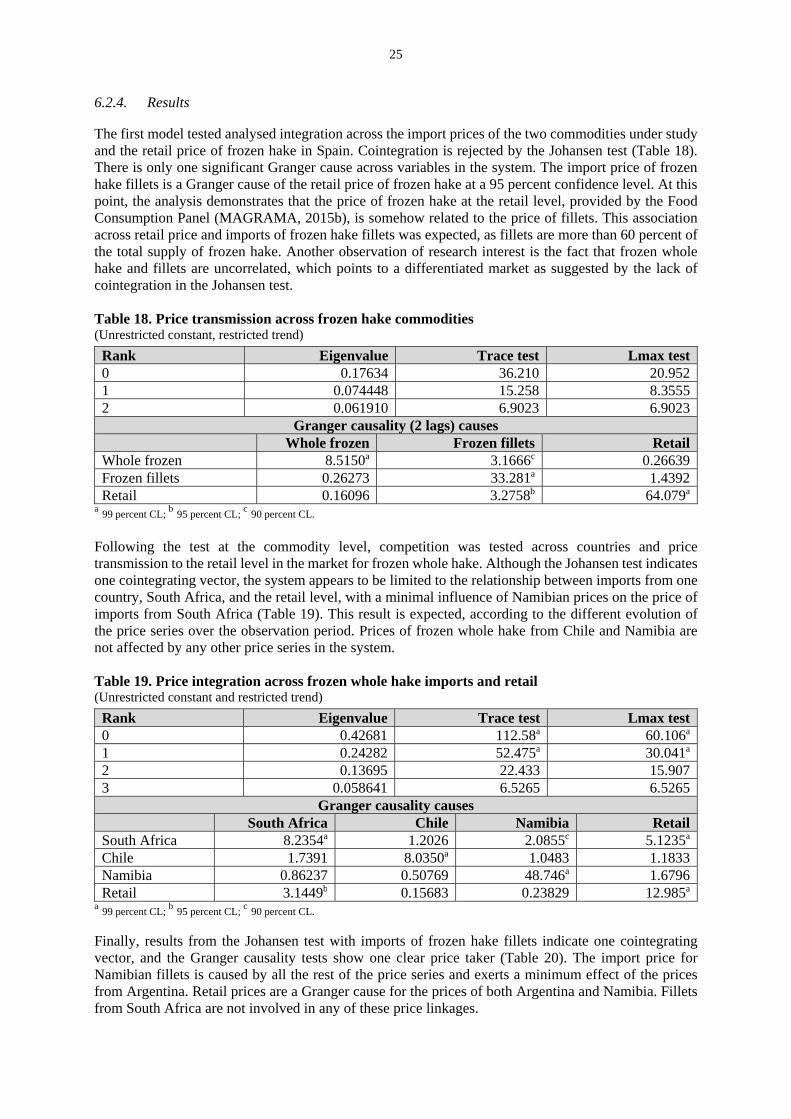
6.2.4. Results 25
6.2.5. Discussion 26
7. CASE STUDY 3. FROZEN SQUID 27
7.1. Production and imports of frozen squid 27
7.2. Price integration analysis 28
7.2.1. Data sources 28
7.2.2. Evolution of price series 28
7.2.3. Distributional properties 29
7.2.4. Results 29
7.2.5. Discussion 30
8. SUMMARY AND CONCLUSIONS 31
9. REFERENCES 33
vi
ABBREVIATION AND ACRONYMS
ADF Augmented Dickey-Fuller CL confidence level FAO Food and Agriculture Organization of the United Nations FIAM Products, Trade and Marketing Branch (Fisheries and Aquaculture Department, FAO) HIALS Aalesund University College (Høgskolen i Ålesund) INE Instituto Nacional de Estadística (Spain) LOP Law of One Price MAGRAMA Ministry of Agriculture, Food and Environment (Ministerio de Agricultura,
Alimentación y Medio Ambiente) NORAD Norwegian Agency for Development Cooperation SUCCESS Strategic Use of Competitiveness towards Consolidating the Economic Sustainability
of the European Seafood Sector
vii
ACKNOWLEDGEMENTS
The models used for this document were developed and tested during a visiting expert’s stay at FAO-FIAM in Rome from April to July 2015. The data, scope and methods are also part of the research project “Competition – cluster and market analyses for the salted cod and the salted & dried cod industry,” funded by the Norwegian Research Council, and the Strategic Use of Competitiveness towards Consolidating the Economic Sustainability of the European Seafood Sector (SUCCESS) project, funded by the European Union (Member Organization)’s “Horizon 2020”, its Framework Programme for Research and Innovation under grant agreement 635188.

1
1. INTRODUCTION
The study of price transmission along value chains allows analysis of the changes in value between intermediaries, helps determine their negotiating power and explains sales margins at different levels of the chain. Analysis of price transmission is relevant to stakeholders in the value chain, as it demonstrates how the value generated by a product or service is distributed among the various actors and helps detect inefficiencies. These analyses are particularly important in activities of the primary sector, where many middlemen are involved and important differences exist in the degree of concentration between stages of the chain. This is especially the case in fisheries, in which the high degree of fragmentation of the extractive sector, especially in small-scale fisheries, puts producers in a weak negotiating position. Due to growing social and economic concern about distribution of the value generated by food products, price transmission along food value chains has received increasing attention in the scientific field. Research interest in such transmission in the seafood market is relatively recent. However, it has been increasing in recent years, and interest is growing in the economic issue of price integration across the stages of the fisheries value chain. The issues of price transmission and distribution of revenues in the fisheries industry are matters of concern to the Food and Agriculture Organization of the United Nations (FAO). In this context, Gudmundsson, Asche and Nielsen (2006) conducted a study of the distribution of revenues from seafood trade over the value chain. Findings indicated that, as in many other primary industries, producers receive a relatively low share of the final product value compared with other agents in the chain. This share of revenues also differs by level of processing and across developed and developing countries. The proportion was found to be higher for fresh rather than highly processed fish, and also higher for producers in developed countries than for those in developing ones. More recently, a research project was undertaken to analyse the value chain in small-scale fisheries in 14 developing and developed countries (Bjørndal, Child and Lem, 2014). The project was funded by the Norwegian Agency for Development Cooperation (NORAD) from 2010 to 2012. Its main purpose was to improve understanding of the dynamics of relevant value chains in international and domestic seafood markets, with special attention to mechanisms of price transmission from the ex-vessel/ex-farm level to the final consumer. As the project covered many geographical locations and development levels, the value chains analysed differed significantly. In general terms, and with exceptions, the case studies found that processors and retailers were those receiving the largest benefits from the value chain, sometimes due to their stronger bargaining power. Despite differences at national levels, a series of general policy recommendations was put forward to improve the earnings of small-scale fishery and aquaculture through the value chain. Spain was part of the FAO/NORAD research project, and price transmission from ex-vessel/ex-farm to retail levels was studied for a set of 13 species of fresh fish, using a series of prices collected weekly since 2004 by the Ministry of Agriculture, Food and Environment (MAGRAMA) through its Observatory of Food Prices (MAGRAMA, 2015a). The main findings (Fernández-Polanco and Llorente, 2015) point to imperfect price transmission in the domestic market for species with both decreasing or increasing prices at the ex-vessel level. While prices had risen or decreased at the producers’ level during the observed period, they remained stable at the retail level. Revenues for retailers and other middlemen increased in the case of species with declining prices such as hake, but decreased in those with increasing prices at origin such as sardine or mackerel. Imports play a role in providing stability for wholesalers’ and retailers’ income shares, resulting in better price transmission. However, this solution benefits traders that appear to have some negotiating power with overseas exporters, and decreases the bargaining ability of local fishers. The ability of traders to exert any kind of market power on local producers was lower and even nonexistent for species with low volumes of imports. Similar results were found in Japan (Sakai et al., 2012), in the same FAO/NORAD project, when analysing species with different shares of imports in the total supply. This report attempts to go one step further by analysing three case studies on price competition and transmission along the value chain of processed seafood commodities imported into the Spanish market. The cases focus on salted cod, frozen hake and frozen squid imported from different parts of the world,
2
covering a wide range of developed and developing countries. Cod, hake and squid species are very popular with Spanish consumers, and are traditionally supplied by the domestic fishing industry. The collapse or overfishing issues of some traditional fishing grounds operated by the Spanish fleet in the 1980s, such as Newfoundland or Gran Sol, along with efforts to reduce measures put into practice when entering the European Union (Member Organization), made it impossible to satisfy the growing demand with products provided by domestic catches. The share of imports in supply increased until reaching nearly 70 percent of total seafood supply today. As the most important market for fish in the European Union (Member Organization), Spain has become one of the most important seafood importers in the world, and a large share of these imports is consumed locally. This fact, added to the availability of price data at import and retail levels, allows a series of analyses to be undertaken on the effect of competition in the international market on the evolution of prices at the domestic level and vice versa. The next section describes the structure of the value chain for seafood products in Spain. Special attention is given to the changes undertaken in recent years, with increasing retail concentration, access to international markets and bargaining power. Sections 3 and 4 respectively provide a literature background and a brief description of the basics of price transmission and the data used. The three case studies analysed are presented and discussed to produce the final general conclusions.
3
2. THE SEAFOOD VALUE CHAIN IN SPAIN
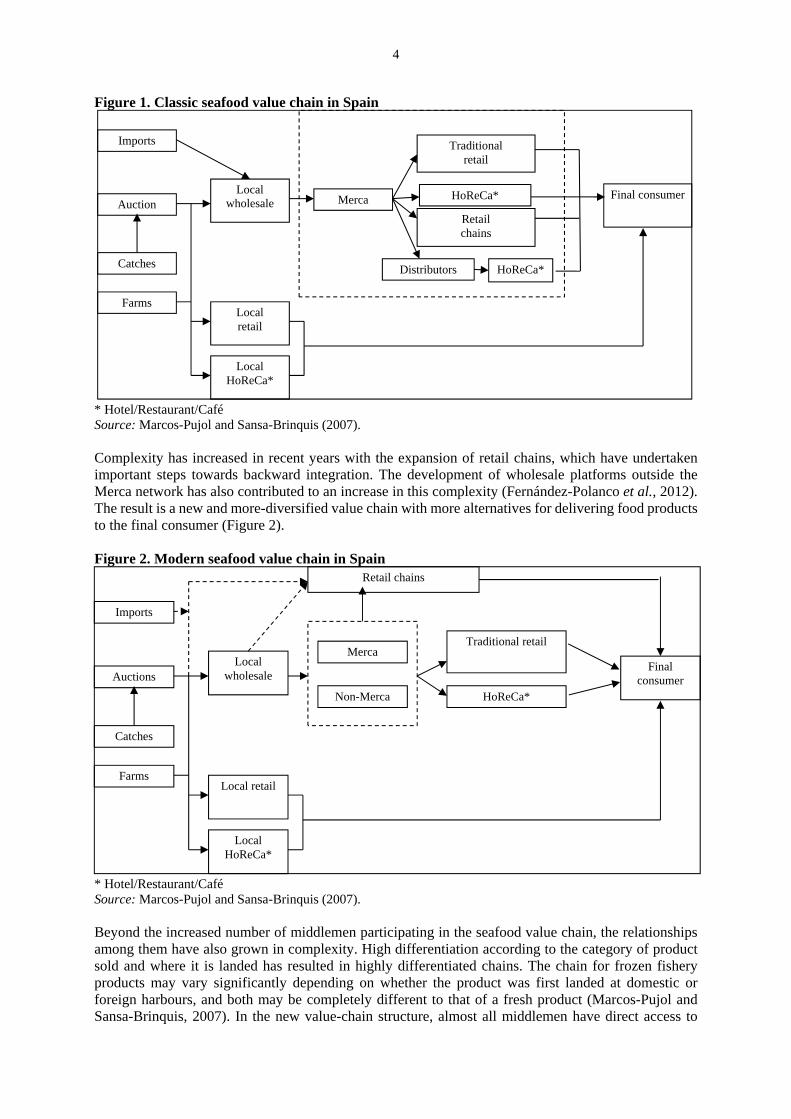
With a present yearly per capita consumption rate of 36.6 kilograms (kg) and a population of 46.7 million people, Spain accounts for the largest seafood market in the European Union (Member Organization) in terms of both quantity and value. Despite some stagnation in consumption due to the economic crisis that has affected the country since 2008 (Fernández-Polanco et al., 2012), Spain is still a strong and relevant actor in the global seafood market. The national fishing fleet has been significantly reduced since the country joined the European Union (Member Organization). The bulk of the fleet is today composed of small-scale operators fishing in domestic waters and using minor and artisanal gears. This kind of fleet harvests traditional species targeted for human consumption, which are then marketed fresh at port auctions. Additionally, there are also a small number of large-scale vessels fishing overseas with an average crew size of 25. These large-scale operators represent about 5 percent of the total fleet (MAGRAMA, 2012). The share of domestic catches in the total seafood supply has fallen from 38.8 percent in 2000 to 33.8 percent in 2010. This decrease in supply has been replaced by imports of a similar amount. Aquaculture production has remained stable, with a share of some 9 percent in the same period (FAO, 2015). During the past decade, the seafood value chain has been increasing in complexity. The emergence of new, non-traditional agents, along with increased retail concentration, are key topics in understanding the most recent evolution in the domestic supply chain of seafood products. The classic seafood value chain was originally divided into two broad stages, consisting of supply at origin and supply at destination markets. This division is now difficult to observe in the present situation, owing to diversification of wholesale operators and the increased complexity of retail chains. Development of more-efficient transportation and communication has resulted in improved access to global markets, increasing concurrency for domestic products (Marcos-Pujol and Sansa-Brinquis, 2007; Fernández-Polanco et al., 2012). Until the end of the last century, seafood products were shipped from port auctions to the retail sector through the Merca network (www.mercasa.es/mercas). This is a nationwide network that gathers the main wholesalers in every province of the country at specialized sales points provided by the governmental company Mercasa (www.mercasa.es/). Until recently, and with the exception of local retailers and restaurants directly accessing port auctions, the vast majority of fishery products within the domestic market have reached sale points through the Merca network (Figure 1). Due to the growth of new alternative agents and chains in Spain, Merca has declined in importance. Despite this trend, network sales still hold a significant share (Mercasa, 2015).
4
Figure 1. Classic seafood value chain in Spain
* Hotel/Restaurant/Café Source: Marcos-Pujol and Sansa-Brinquis (2007).
Complexity has increased in recent years with the expansion of retail chains, which have undertaken important steps towards backward integration. The development of wholesale platforms outside the Merca network has also contributed to an increase in this complexity (Fernández-Polanco et al., 2012). The result is a new and more-diversified value chain with more alternatives for delivering food products to the final consumer (Figure 2). Figure 2. Modern seafood value chain in Spain
* Hotel/Restaurant/Café Source: Marcos-Pujol and Sansa-Brinquis (2007).
Beyond the increased number of middlemen participating in the seafood value chain, the relationships among them have also grown in complexity. High differentiation according to the category of product sold and where it is landed has resulted in highly differentiated chains. The chain for frozen fishery products may vary significantly depending on whether the product was first landed at domestic or foreign harbours, and both may be completely different to that of a fresh product (Marcos-Pujol and Sansa-Brinquis, 2007). In the new value-chain structure, almost all middlemen have direct access to
Catches
Auction Local
wholesale
Local retail
Local HoReCa*
Merca
Traditional retail
HoReCa*
Retail chains
Farms
Imports
Distributors HoReCa*
Final consumer
Catches
Auctions Local
wholesale
Local retail
Local HoReCa*
Merca Traditional retail
HoReCa*
Farms
Imports
Non-Merca
Final consumer
Retail chains
5
producers at origin, including overseas first-sale markets. When this direct access is not possible, wholesalers in the place of origin undertake the task of linking to the retail sector at destination markets. The retail industry can be divided into organized retail chains and small traditional stores. The latter have lost in market share of seafood products in past years, falling from 37.4 percent in 2004 to 28.2 percent in 2011 (Fernández-Polanco et al., 2012). Lower prices, a wider variety of products and a common, strong marketing effort appear to be some of the key drivers behind the growth of supermarkets. National retail chains normally purchase their seafood from local sources, with every branch in charge of buying their seafood individually. In such a system, the Merca regional network plays an important role in supplying supermarkets. Following consolidation of the retail chains, seafood purchases have shifted from regional suppliers to centralized logistical platforms. This new model reduces the importance of the Merca network by integrating and shortening the value chain, increasing control and efficiency. Traditional retailing is composed of small independent fishmongers, often managed by the owner and located in urban areas, alone or grouped into community markets. Traditional retailers purchase their seafood products from a variety of different local and national suppliers. In coastal communities, traditional retailers have direct access to the port auctions, which is the main source of product for this retail segment. In all other cases, the Merca network is the most important source of product for traditional seafood retailers.
6
3. PRICE INTEGRATION IN FISHERIES RESEARCH
Competition and price transmission are analysed using methods of price integration. The most common forms comprise vertical and horizontal integration. Vertical integration focuses on the study of price transmission along the value chain (Asche, Jaffry and Hartmann, 2007). Horizontal integration, or market delimitation, describes price linkages across different market places and commodities (Asche, Bremnes and Wessells, 1999; Singh et al., 2015). The models presented in this report combine the two approaches. Horizontal price integration tests for competition across imports of the same or similar species from different countries. Vertical price transmission tests whether prices resulting from the competitive relations across imports are transferred to consumers through the retail sector. The first studies on horizontal price transmission (Marshall, 1947; Cournot, 1971) provided market definitions based on the relationship between the prices of a group of goods, stating the Law of One Price (LOP) (Asche, Bremnes and Wessells, 1999). Further developments in econometric techniques (Engle & Granger, 1987; Johansen, 1988, 1991) allowed the use of efficient modelling of endogeneity in all price variables to test the degree of market integration within and across commodity markets (Gordon and Maurice, 2015). Research interest in market integration in the seafood industry is relatively recent and new research findings have increased the literature in the last few years. The first approaches were developed in some markets for wild species (Bose and McIIgorm, 1996; Gordon and Hannesson, 1996), and in those for salmon, with particular attention to the role of farmed Atlantic salmon (Gordon, Salvanes and Atkins, 1993; Asche, Steen and Salvanes, 1997; Asche, 1997; Asche, Bremnes and Wessells, 1999). Some recent studies in market delimitation have focused on the possible existence of a degree of integration between different markets for the same species. Nielsen (2004) found that the LOP is in force between the Norwegian and Danish herring markets. Nielsen (2005) identified a partially integrated European first-sale market for whitefish and a strong integration of European cod markets. Vinuya (2007) tested for market integration in world shrimp markets, using import prices from the European Union (Member Organization), Japan and the United States of America. Some other studies analysed competitive relations between wild and farmed products of the same species. Asche et al. (2005) examined market integration between wild and farmed salmon in the Japanese market, and results showed that the species were close substitutes. Moreover, farmed salmon generated price decreases for all salmon species. Asche et al. (2012) developed a cointegration analysis of market integration in the United States shrimp market that considered different product sizes and integration between wild caught and imported farmed shrimp. They found significant evidence of market integration, suggesting that the LOP holds for this industry. This result means that in the case of a supply shock, prices do not rise, instead, imports of foreign farmed fish increase. Rodríguez, Bande and Villasante (2013) found that wild and farmed gilthead sea bream formed two heterogeneous products in the Spanish market. Other researchers analysed the possible existence of market integration between different products in the same market, identifying potential substitute products in different categories. Nielsen et al. (2007) studied markets for trout in Germany and potential imported substitutes. The study found that markets for farmed trout are linked to other fish markets, particularly to capture fish markets, rather than to markets for farmed salmon. Quagrainie and Engle (2002) found that pangasius frozen fillets imported from Viet Nam were competing with channel catfish farmed in the United States of America. However, Norman-López and Asche (2008) found that imports of fresh and frozen tilapia fillets compete in different market segments, while fresh and frozen catfish fillets compete in the same market. The 2008 work was later extended by Norman-López (2009) with a study of the United States tilapia market. It did not find evidence of competition in the same market between tilapia and fresh catfish fillets. However, there was evidence that fresh farmed tilapia fillets compete with wild whole red snapper, wild fresh fillets of sea dab, and blackback flounder. Norman-López and Bjørndal (2009) found that tilapia imports into the United States of America are differentiated by continents, but producers from the same region seem to be competing in a market delimited by ‘continent of origin’ and commodity. Nielsen, Smit and Guillen (2009) analysed market integration of fish in Europe and identified a form of market integration among 13 fresh and 7 frozen fish species. Their conclusions stated that the LOP is in force
7
within the European markets for fresh flatfish, fresh pelagic fish and between frozen cod and plaice. Blomquist (2015) tested market integration among 12 fish species in Sweden using cointegration tests. His results identified market integration for two separate clusters of species and found that the LOP holds for 6 of the 12 species considered. Schrobback, Pascoe and Coglan (2014) provided a new approach to the application of market integration analyses when they addressed the economic competition between the native Sydney rock oyster and the Pacific oyster introduced into the Australian market. The results concluded that markets for the two species are integrated, but the species are not perfect substitutes. Norman-López et al. (2014) investigated the market integration of Australian rock lobster exports to Hong Kong, considering four species and different exporting states. The cointegration analysis indicated that all four species and producing/exporting states considered were substitutes for each other, so that, in the long run, prices paid to operators in the industry would move together. The first studies of vertical price integration were developed in the agriculture industry, starting in the United States of America and following in the European Union (Member Organization). Most studies undertaken focused on a particular species. Guillotreau (2004) analysed changes in the value spread between the intermediaries in the European fish markets after the introduction of farmed salmon. Jaffry (2005) estimated a price transmission model for the value chain of fresh whole hake sold in France. Guillotreau, Le Grel and Simioni (2005) evaluated the effect of structural changes in the mechanisms of price transmission along the fresh salmon value chain between Norway and France. Jiménez-Toribio and García-del-Hoyo (2006) analysed price transmission along the Spanish value chain of red seabream (Pagellus bogaraveo). Other works also considered price transmission in a market as a whole, such as Shirazi and Moghaddasi (2011) for Iranian fish markets or Sakai et al. (2012) for Japanese seafood markets. Finally, there are a few studies that consider and compare price transmission in the seafood value chain between different markets. Jiménez-Toribio, Guillotreau and Mongruel (2010) evaluated price integration relationships between the world market and the major European marketplaces for frozen and canned tuna. Recently, some studies have combined analysis of market integration with the study of price linkages across the value chain. Asche, Jaffry and Hartmann (2007) combined analysis of market integration between Norway and the United Kingdom of Great Britain and Northern Ireland in the French market for smoked salmon with the study of price linkages across the full value chain in French markets. A high degree of price integration was found in both horizontal and vertical analyses. Jiménez-Toribio, Guillotreau and Mongruel (2010) analysed the degree of integration between the world market and the main European markets for tuna through vertical and horizontal price linkages. In the case of horizontal analysis, spatial linkages were investigated to estimate the connection between the European and world market in the primary stage of the value chain. The results showed strong market integration at the ex-vessel stage, and price leadership of yellowfin tuna over skipjack tuna. Gordon and Maurice (2015) tested for vertical and horizontal cointegration in the fish supply chain in Uganda for five important fish species using the Johansen vector error-correction model. They found that a long-run relationship does exist both in horizontal and vertical market segments of the fish supply chain in Uganda. Fernández-Polanco and Llorente (2015) found that market integration across local and imported fresh fish improved price transmission along the Spanish value chain in three popular species. Singh et al. (2015) examined the presence of price transmission asymmetry along the value chain, and price transmission across four main aquaculture species in the Thai fish market. They found that, in general terms, the price of one species does not significantly affect the price of the other species at the same level in the value chain.
8
4. METHODS AND MATERIALS
The logic of price integration is based on the LOP, which states that all products in the same category are equally priced in an efficient market. Under this condition, competition can be tested by the correlation across prices of the different products. Considering a market of two products, the relationship studied in the analysis of integration is given by the expression: Ln(p1t) = + ln(p2t) (1) Where p1t and p2t are the prices of the two products in the same period t, the parameter is a constant term that reflects the differences in quality and marketing cost of product 1 versus product 2, and parameter determines the relationship between prices.
When = 0, prices are unrelated to each other. In a typical case of market delimitation, it indicates that the products in question do not compete with each other. In the present case, if p1 represents the price of a given commodity and p2 represents that of a potential substitute, the conclusion that follows is that changes in the prices of one species do not change the prices of the other, and thus they are not competing in the same market. On the other hand, if = 1, the LOP is verified and it can be concluded that both commodities are competing in the same delimited market. The suitability of the different cointegration techniques is given by the properties of the price series, and whether they are stationary or non-stationary. The Augmented Dickey-Fuller (ADF) (Dickey and Fuller, 1981) is one test used to analyse the time series properties of the data. The null hypothesis of unit root is tested in an autoregressive model for the price levels and their first differences. When the price series are found to be non-stationary, the statistical method recommended for studying the relationships among them is the cointegration analysis, which will be tested using the contrast developed by Johansen (1991). When the price series are found to be stationary, the Johansen test, even less restrictive than other previous cointegration procedures (Ravallion, 1986; Asche, Gordon and Hannesson, 2004), could not be conclusive. In any case, integration across price series can be analysed by performing a vector autoregressive (VAR) model, and Granger causality will test for bivariate linkages across the different price series. Both methods were used in this study, which may also help contribute to consistency of the results. The maximum lag order for the Granger causality analysis was set according to the common criteria used in these cases (Singh et al., 2015). Three different information criteria were used (Akaike, Schwarz Bayesian and Hannan-Quinn) to find the maximum lag, which minimized the corresponding values of the criteria from a starting number of 12 monthly lags for one year. Finally, potential effects from seasonality were assessed in the model by the inclusion of dummy fictitious variables. Data for analysis of the case studies are available from various European and Spanish official sources. The main trade partners exporting the commodities of interest were identified in the Spanish Database of External Trade (Cámaras, 2015). This service provides data from the Spanish customs service from 2010, including quantities, values and countries of origin of imports for every tariff code. Longer series of quantities and the values of Spanish imports from specific countries can be downloaded from the Eurostat (2015) external trade database (Comext). Data on retail quantities and values are available at the MAGRAMA website, from the Food Consumption Panel (MAGRAMA, 2015b).
9
5. CASE STUDY 1. SALTED COD
Spain was one of the pioneering European countries in harvesting cod for processing and commercial purposes. The activity of the Spanish fishing fleet off the coast of Newfoundland has been recorded since 1561. Preparations of salted cod were part of the regular Spanish diet for generations in a period covering at least five centuries. Presently, salted cod continues to be a much-appreciated and valued food product. Traditionally associated with low incomes, today it is considered a luxury. It is a frequent dish on the menus of many fine restaurants and its price is increasing. Consumption has declined in recent decades due to increasing prices and the inconvenience of undertaking the slow process of desalting, which requires about two days of regular water changes. This last issue prevents younger generations and busy consumers from using the product at home. In recent years, several processors have also begun distributing a desalted product, as desalting is not permitted in shops or restaurants. Desalted portions attempt to eliminate the inconvenience of doing this at home. However, a much higher price for the ready-to-eat desalted cod counterbalances the convenience. The product is becoming more popular in restaurants owing to important time savings. 5.1. Production and imports of salted cod
Despite the dramatic decrease in domestic cod catches, Spain still maintains an important drying and salting industry. Yearly average production was 19 000 tonnes from 2008 to 2013. However, production declined by 24.9 percent from 2010 to 2013. The price of locally processed salted cod has moved to about EUR 6–7/kg in the same period (Table 1). As a result of the fall in local catches after collapse of the Newfoundland fishery, the Spanish market became more dependent on imports to satisfy demand by final consumers and the processing industry. Salted or in-brine cod, locally known as ‘green cod’ (bacalao verde), is the main raw material for the processing industry. It is presented in slices with 52–55 percent humidity and a proportion of salt of 15–18 percent. From 127.5 to 135 kg of green cod is required to produce 100 kg at the humidity levels fitting market preferences. In recent years, consumer preferences have moved from the traditional dried, salted cod to a half-maturation or even wet, without any maturation. This change is assumed to be driven by consumer preference for white, thick portions, but also helps local processors reduce their costs due to a shorter maturation period. Table 1. Domestic production and prices of salted cod in 2013 (Excluding fillets)
Tonnes EUR/kg2008 21 755 7.412009 19 862 6.992010 21 737 6.522011 17 920 6.622012 16 600 7.172013 16 317 6.31
Source: INE (2015). Due to the relevance of the domestic processing industry, and the change in consumer preferences, green cod is the most relevant salted cod commodity imported into Spain, covering more than 70 percent of total imports of products in this category. The main engine for these imports is the local cod processing industry, which completes the process of drying the cod at different levels of maturation and cuts and distributes it to domestic and export markets. The market share of green cod significantly increased after 2011 owing to a drop in the quantity of fillets, which decreased from nearly 10 000 tonnes in 2011 to 5 000 in 2013. Compared with 2008, quantities of green cod and fillets decreased by 4.8 percent and 48 percent respectively. Imported quantities of ready-to-eat salted cod increased by 120 percent, resulting in the highest volume since 2001. Dried, unsalted cod is quite a marginal commodity that evolves randomly (Table 2). Prices differ according to the level of processing, resulting in higher prices for fillets and lower ones for green cod. In general, prices of all commodities have been falling since 2008, with decreases of 32 and 35 percent for green cod and fillets respectively, and only 3 percent for dried, salted cod.
10
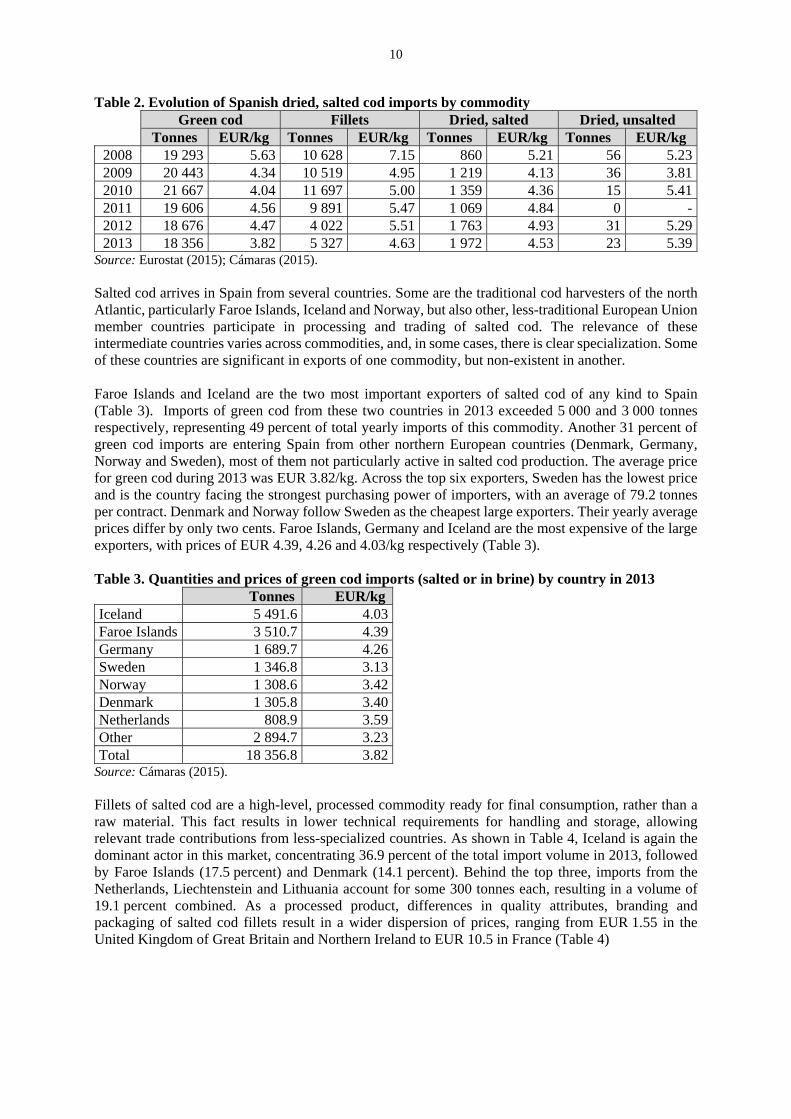
Table 2. Evolution of Spanish dried, salted cod imports by commodity Green cod Fillets Dried, salted Dried, unsalted Tonnes EUR/kg Tonnes EUR/kg Tonnes EUR/kg Tonnes EUR/kg
2008 19 293 5.63 10 628 7.15 860 5.21 56 5.232009 20 443 4.34 10 519 4.95 1 219 4.13 36 3.812010 21 667 4.04 11 697 5.00 1 359 4.36 15 5.412011 19 606 4.56 9 891 5.47 1 069 4.84 0 -2012 18 676 4.47 4 022 5.51 1 763 4.93 31 5.292013 18 356 3.82 5 327 4.63 1 972 4.53 23 5.39
Source: Eurostat (2015); Cámaras (2015). Salted cod arrives in Spain from several countries. Some are the traditional cod harvesters of the north Atlantic, particularly Faroe Islands, Iceland and Norway, but also other, less-traditional European Union member countries participate in processing and trading of salted cod. The relevance of these intermediate countries varies across commodities, and, in some cases, there is clear specialization. Some of these countries are significant in exports of one commodity, but non-existent in another. Faroe Islands and Iceland are the two most important exporters of salted cod of any kind to Spain (Table 3). Imports of green cod from these two countries in 2013 exceeded 5 000 and 3 000 tonnes respectively, representing 49 percent of total yearly imports of this commodity. Another 31 percent of green cod imports are entering Spain from other northern European countries (Denmark, Germany, Norway and Sweden), most of them not particularly active in salted cod production. The average price for green cod during 2013 was EUR 3.82/kg. Across the top six exporters, Sweden has the lowest price and is the country facing the strongest purchasing power of importers, with an average of 79.2 tonnes per contract. Denmark and Norway follow Sweden as the cheapest large exporters. Their yearly average prices differ by only two cents. Faroe Islands, Germany and Iceland are the most expensive of the large exporters, with prices of EUR 4.39, 4.26 and 4.03/kg respectively (Table 3). Table 3. Quantities and prices of green cod imports (salted or in brine) by country in 2013 Tonnes EUR/kgIceland 5 491.6 4.03Faroe Islands 3 510.7 4.39Germany 1 689.7 4.26Sweden 1 346.8 3.13Norway 1 308.6 3.42Denmark 1 305.8 3.40Netherlands 808.9 3.59Other 2 894.7 3.23Total 18 356.8 3.82
Source: Cámaras (2015). Fillets of salted cod are a high-level, processed commodity ready for final consumption, rather than a raw material. This fact results in lower technical requirements for handling and storage, allowing relevant trade contributions from less-specialized countries. As shown in Table 4, Iceland is again the dominant actor in this market, concentrating 36.9 percent of the total import volume in 2013, followed by Faroe Islands (17.5 percent) and Denmark (14.1 percent). Behind the top three, imports from the Netherlands, Liechtenstein and Lithuania account for some 300 tonnes each, resulting in a volume of 19.1 percent combined. As a processed product, differences in quality attributes, branding and packaging of salted cod fillets result in a wider dispersion of prices, ranging from EUR 1.55 in the United Kingdom of Great Britain and Northern Ireland to EUR 10.5 in France (Table 4)
11
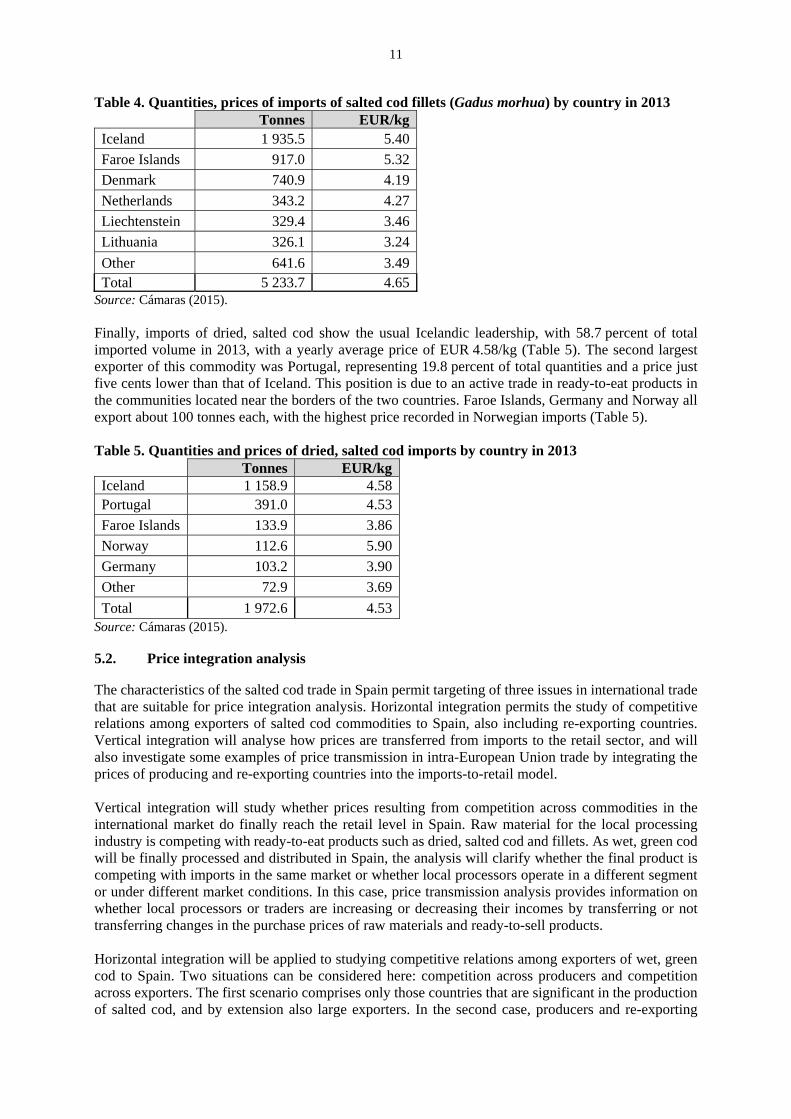
Table 4. Quantities, prices of imports of salted cod fillets (Gadus morhua) by country in 2013 Tonnes EUR/kgIceland 1 935.5 5.40
Faroe Islands 917.0 5.32
Denmark 740.9 4.19
Netherlands 343.2 4.27
Liechtenstein 329.4 3.46
Lithuania 326.1 3.24
Other 641.6 3.49Total 5 233.7 4.65
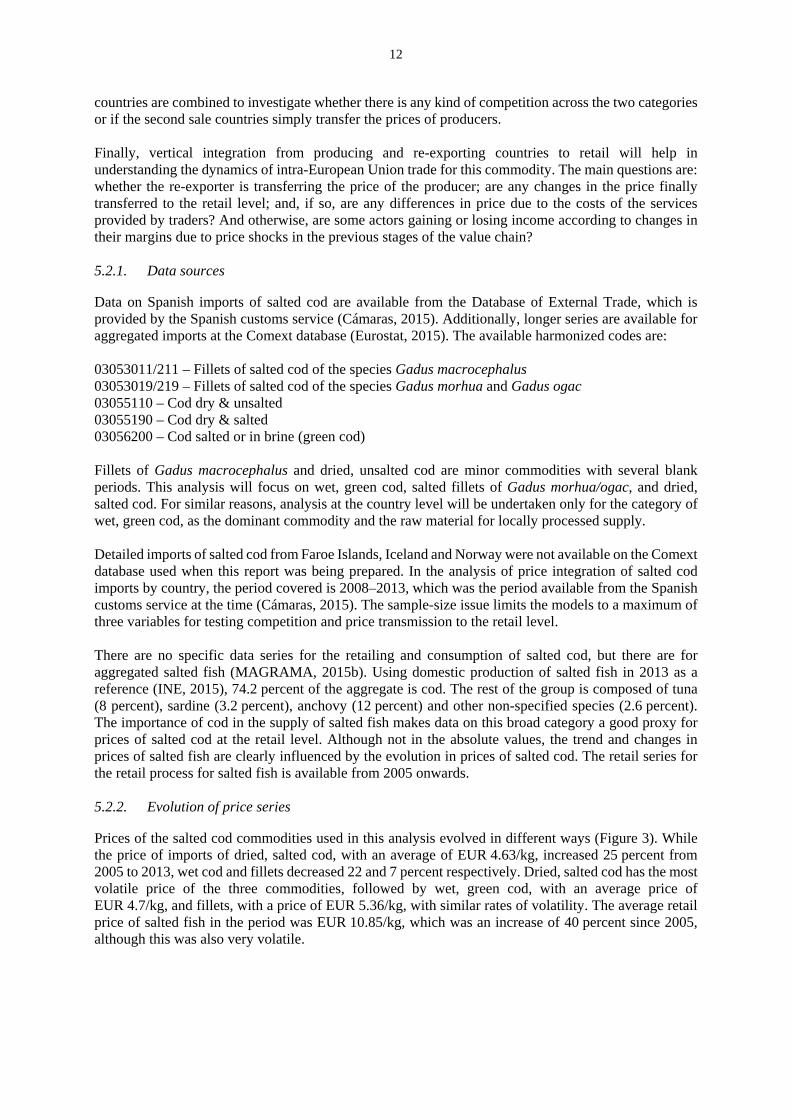
Source: Cámaras (2015). Finally, imports of dried, salted cod show the usual Icelandic leadership, with 58.7 percent of total imported volume in 2013, with a yearly average price of EUR 4.58/kg (Table 5). The second largest exporter of this commodity was Portugal, representing 19.8 percent of total quantities and a price just five cents lower than that of Iceland. This position is due to an active trade in ready-to-eat products in the communities located near the borders of the two countries. Faroe Islands, Germany and Norway all export about 100 tonnes each, with the highest price recorded in Norwegian imports (Table 5). Table 5. Quantities and prices of dried, salted cod imports by country in 2013 Tonnes EUR/kgIceland 1 158.9 4.58Portugal 391.0 4.53
Faroe Islands 133.9 3.86
Norway 112.6 5.90
Germany 103.2 3.90
Other 72.9 3.69
Total 1 972.6 4.53Source: Cámaras (2015). 5.2. Price integration analysis
The characteristics of the salted cod trade in Spain permit targeting of three issues in international trade that are suitable for price integration analysis. Horizontal integration permits the study of competitive relations among exporters of salted cod commodities to Spain, also including re-exporting countries. Vertical integration will analyse how prices are transferred from imports to the retail sector, and will also investigate some examples of price transmission in intra-European Union trade by integrating the prices of producing and re-exporting countries into the imports-to-retail model. Vertical integration will study whether prices resulting from competition across commodities in the international market do finally reach the retail level in Spain. Raw material for the local processing industry is competing with ready-to-eat products such as dried, salted cod and fillets. As wet, green cod will be finally processed and distributed in Spain, the analysis will clarify whether the final product is competing with imports in the same market or whether local processors operate in a different segment or under different market conditions. In this case, price transmission analysis provides information on whether local processors or traders are increasing or decreasing their incomes by transferring or not transferring changes in the purchase prices of raw materials and ready-to-sell products. Horizontal integration will be applied to studying competitive relations among exporters of wet, green cod to Spain. Two situations can be considered here: competition across producers and competition across exporters. The first scenario comprises only those countries that are significant in the production of salted cod, and by extension also large exporters. In the second case, producers and re-exporting
12
countries are combined to investigate whether there is any kind of competition across the two categories or if the second sale countries simply transfer the prices of producers. Finally, vertical integration from producing and re-exporting countries to retail will help in understanding the dynamics of intra-European Union trade for this commodity. The main questions are: whether the re-exporter is transferring the price of the producer; are any changes in the price finally transferred to the retail level; and, if so, are any differences in price due to the costs of the services provided by traders? And otherwise, are some actors gaining or losing income according to changes in their margins due to price shocks in the previous stages of the value chain? 5.2.1. Data sources
Data on Spanish imports of salted cod are available from the Database of External Trade, which is provided by the Spanish customs service (Cámaras, 2015). Additionally, longer series are available for aggregated imports at the Comext database (Eurostat, 2015). The available harmonized codes are: 03053011/211 – Fillets of salted cod of the species Gadus macrocephalus 03053019/219 – Fillets of salted cod of the species Gadus morhua and Gadus ogac 03055110 – Cod dry & unsalted 03055190 – Cod dry & salted 03056200 – Cod salted or in brine (green cod) Fillets of Gadus macrocephalus and dried, unsalted cod are minor commodities with several blank periods. This analysis will focus on wet, green cod, salted fillets of Gadus morhua/ogac, and dried, salted cod. For similar reasons, analysis at the country level will be undertaken only for the category of wet, green cod, as the dominant commodity and the raw material for locally processed supply. Detailed imports of salted cod from Faroe Islands, Iceland and Norway were not available on the Comext database used when this report was being prepared. In the analysis of price integration of salted cod imports by country, the period covered is 2008–2013, which was the period available from the Spanish customs service at the time (Cámaras, 2015). The sample-size issue limits the models to a maximum of three variables for testing competition and price transmission to the retail level. There are no specific data series for the retailing and consumption of salted cod, but there are for aggregated salted fish (MAGRAMA, 2015b). Using domestic production of salted fish in 2013 as a reference (INE, 2015), 74.2 percent of the aggregate is cod. The rest of the group is composed of tuna (8 percent), sardine (3.2 percent), anchovy (12 percent) and other non-specified species (2.6 percent). The importance of cod in the supply of salted fish makes data on this broad category a good proxy for prices of salted cod at the retail level. Although not in the absolute values, the trend and changes in prices of salted fish are clearly influenced by the evolution in prices of salted cod. The retail series for the retail process for salted fish is available from 2005 onwards. 5.2.2. Evolution of price series
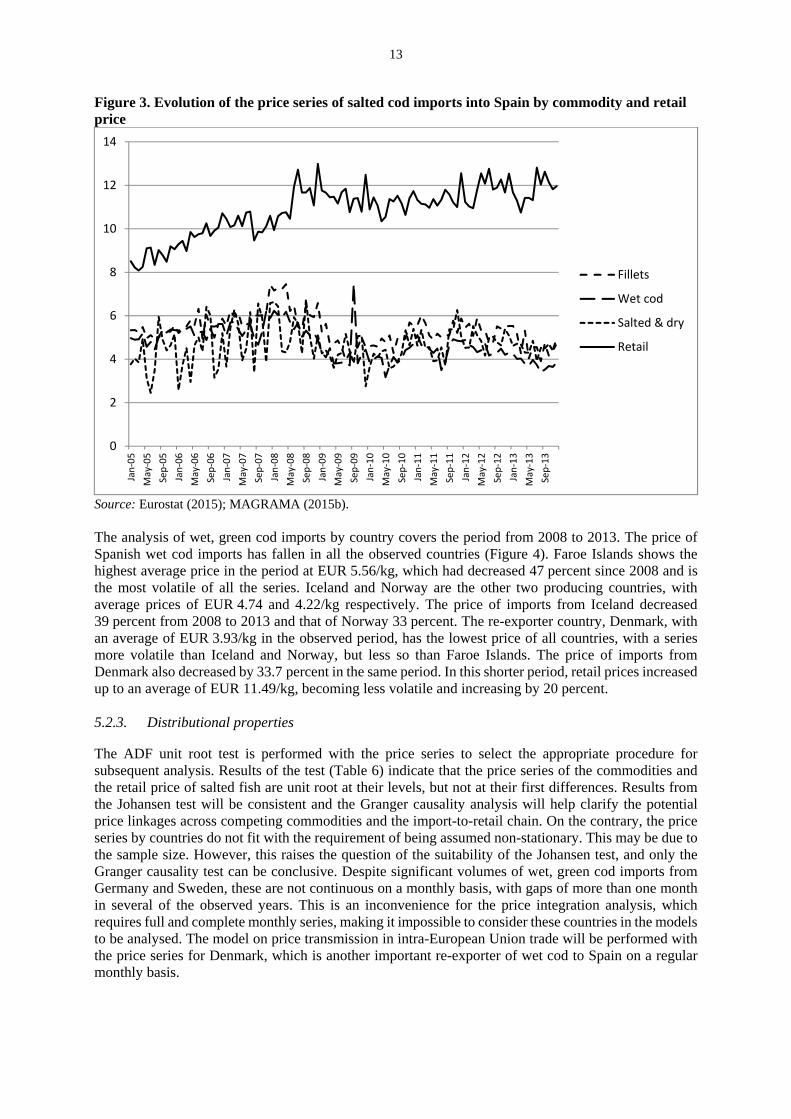
Prices of the salted cod commodities used in this analysis evolved in different ways (Figure 3). While the price of imports of dried, salted cod, with an average of EUR 4.63/kg, increased 25 percent from 2005 to 2013, wet cod and fillets decreased 22 and 7 percent respectively. Dried, salted cod has the most volatile price of the three commodities, followed by wet, green cod, with an average price of EUR 4.7/kg, and fillets, with a price of EUR 5.36/kg, with similar rates of volatility. The average retail price of salted fish in the period was EUR 10.85/kg, which was an increase of 40 percent since 2005, although this was also very volatile.
13
Figure 3. Evolution of the price series of salted cod imports into Spain by commodity and retail price
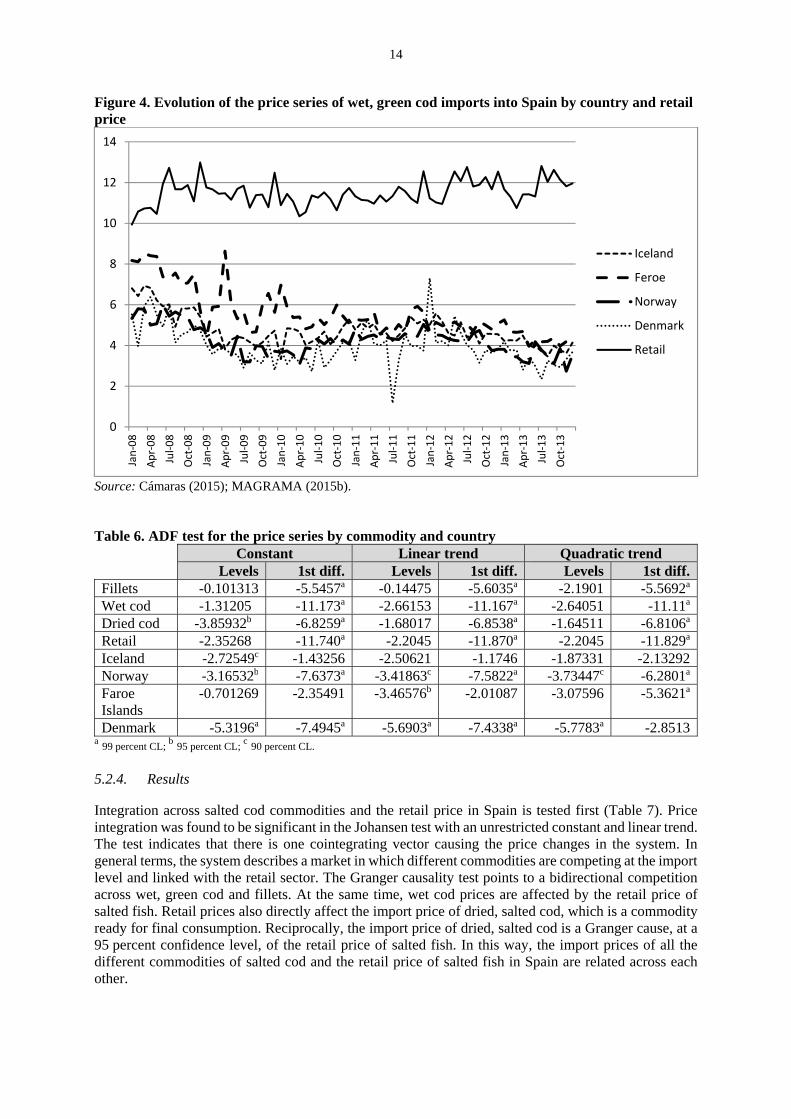
Source: Eurostat (2015); MAGRAMA (2015b). The analysis of wet, green cod imports by country covers the period from 2008 to 2013. The price of Spanish wet cod imports has fallen in all the observed countries (Figure 4). Faroe Islands shows the highest average price in the period at EUR 5.56/kg, which had decreased 47 percent since 2008 and is the most volatile of all the series. Iceland and Norway are the other two producing countries, with average prices of EUR 4.74 and 4.22/kg respectively. The price of imports from Iceland decreased 39 percent from 2008 to 2013 and that of Norway 33 percent. The re-exporter country, Denmark, with an average of EUR 3.93/kg in the observed period, has the lowest price of all countries, with a series more volatile than Iceland and Norway, but less so than Faroe Islands. The price of imports from Denmark also decreased by 33.7 percent in the same period. In this shorter period, retail prices increased up to an average of EUR 11.49/kg, becoming less volatile and increasing by 20 percent. 5.2.3. Distributional properties
The ADF unit root test is performed with the price series to select the appropriate procedure for subsequent analysis. Results of the test (Table 6) indicate that the price series of the commodities and the retail price of salted fish are unit root at their levels, but not at their first differences. Results from the Johansen test will be consistent and the Granger causality analysis will help clarify the potential price linkages across competing commodities and the import-to-retail chain. On the contrary, the price series by countries do not fit with the requirement of being assumed non-stationary. This may be due to the sample size. However, this raises the question of the suitability of the Johansen test, and only the Granger causality test can be conclusive. Despite significant volumes of wet, green cod imports from Germany and Sweden, these are not continuous on a monthly basis, with gaps of more than one month in several of the observed years. This is an inconvenience for the price integration analysis, which requires full and complete monthly series, making it impossible to consider these countries in the models to be analysed. The model on price transmission in intra-European Union trade will be performed with the price series for Denmark, which is another important re-exporter of wet cod to Spain on a regular monthly basis.
0
2
4
6
8
10
12
14Jan‐05
May‐05
Sep‐05
Jan‐06
May‐06
Sep‐06
Jan‐07
May‐07
Sep‐07
Jan‐08
May‐08
Sep‐08
Jan‐09
May‐09
Sep‐09
Jan‐10
May‐10
Sep‐10
Jan‐11
May‐11
Sep‐11
Jan‐12
May‐12
Sep‐12
Jan‐13
May‐13
Sep‐13
Fillets
Wet cod
Salted & dry
Retail
14
Figure 4. Evolution of the price series of wet, green cod imports into Spain by country and retail price
Source: Cámaras (2015); MAGRAMA (2015b). Table 6. ADF test for the price series by commodity and country Constant Linear trend Quadratic trend Levels 1st diff. Levels 1st diff. Levels 1st diff.Fillets -0.101313 -5.5457a -0.14475 -5.6035a -2.1901 -5.5692a
Wet cod -1.31205 -11.173a -2.66153 -11.167a -2.64051 -11.11a
Dried cod -3.85932b -6.8259a -1.68017 -6.8538a -1.64511 -6.8106a
Retail -2.35268 -11.740a -2.2045 -11.870a -2.2045 -11.829a
Iceland -2.72549c -1.43256 -2.50621 -1.1746 -1.87331 -2.13292Norway -3.16532b -7.6373a -3.41863c -7.5822a -3.73447c -6.2801a
Faroe Islands
-0.701269 -2.35491 -3.46576b -2.01087 -3.07596 -5.3621a
Denmark -5.3196a -7.4945a -5.6903a -7.4338a -5.7783a -2.8513a 99 percent CL;
b 95 percent CL; c 90 percent CL.
5.2.4. Results
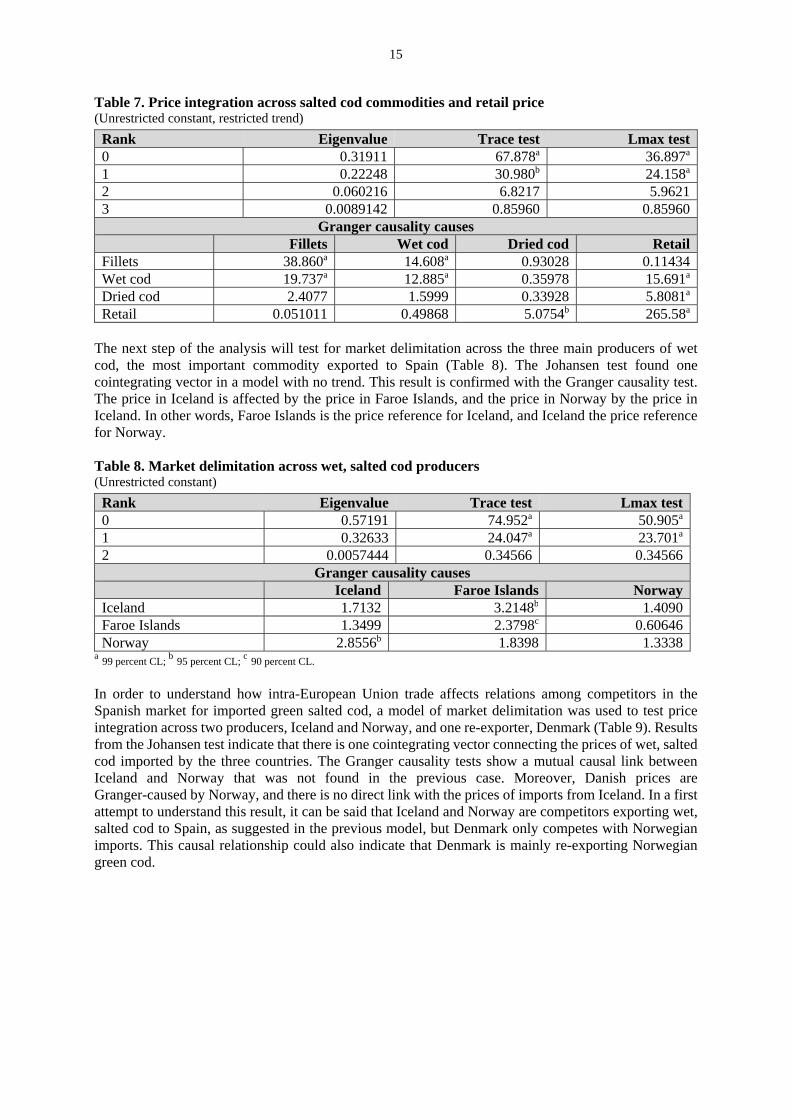
Integration across salted cod commodities and the retail price in Spain is tested first (Table 7). Price integration was found to be significant in the Johansen test with an unrestricted constant and linear trend. The test indicates that there is one cointegrating vector causing the price changes in the system. In general terms, the system describes a market in which different commodities are competing at the import level and linked with the retail sector. The Granger causality test points to a bidirectional competition across wet, green cod and fillets. At the same time, wet cod prices are affected by the retail price of salted fish. Retail prices also directly affect the import price of dried, salted cod, which is a commodity ready for final consumption. Reciprocally, the import price of dried, salted cod is a Granger cause, at a 95 percent confidence level, of the retail price of salted fish. In this way, the import prices of all the different commodities of salted cod and the retail price of salted fish in Spain are related across each other.
0
2
4
6
8
10
12
14Jan‐08
Apr‐08
Jul‐08
Oct‐08
Jan‐09
Apr‐09
Jul‐09
Oct‐09
Jan‐10
Apr‐10
Jul‐10
Oct‐10
Jan‐11
Apr‐11
Jul‐11
Oct‐11
Jan‐12
Apr‐12
Jul‐12
Oct‐12
Jan‐13
Apr‐13
Jul‐13
Oct‐13
Iceland
Feroe
Norway
Denmark
Retail
15
Table 7. Price integration across salted cod commodities and retail price (Unrestricted constant, restricted trend)
Rank Eigenvalue Trace test Lmax test 0 0.31911 67.878a 36.897a
1 0.22248 30.980b 24.158a
2 0.060216 6.8217 5.96213 0.0089142 0.85960 0.85960
Granger causality causes Fillets Wet cod Dried cod RetailFillets 38.860a 14.608a 0.93028 0.11434Wet cod 19.737a 12.885a 0.35978 15.691a
Dried cod 2.4077 1.5999 0.33928 5.8081a
Retail 0.051011 0.49868 5.0754b 265.58a
The next step of the analysis will test for market delimitation across the three main producers of wet cod, the most important commodity exported to Spain (Table 8). The Johansen test found one cointegrating vector in a model with no trend. This result is confirmed with the Granger causality test. The price in Iceland is affected by the price in Faroe Islands, and the price in Norway by the price in Iceland. In other words, Faroe Islands is the price reference for Iceland, and Iceland the price reference for Norway. Table 8. Market delimitation across wet, salted cod producers (Unrestricted constant)
Rank Eigenvalue Trace test Lmax test 0 0.57191 74.952a 50.905a
1 0.32633 24.047a 23.701a
2 0.0057444 0.34566 0.34566Granger causality causes
Iceland Faroe Islands NorwayIceland 1.7132 3.2148b 1.4090Faroe Islands 1.3499 2.3798c 0.60646Norway 2.8556b 1.8398 1.3338
a 99 percent CL; b 95 percent CL;
c 90 percent CL.
In order to understand how intra-European Union trade affects relations among competitors in the Spanish market for imported green salted cod, a model of market delimitation was used to test price integration across two producers, Iceland and Norway, and one re-exporter, Denmark (Table 9). Results from the Johansen test indicate that there is one cointegrating vector connecting the prices of wet, salted cod imported by the three countries. The Granger causality tests show a mutual causal link between Iceland and Norway that was not found in the previous case. Moreover, Danish prices are Granger-caused by Norway, and there is no direct link with the prices of imports from Iceland. In a first attempt to understand this result, it can be said that Iceland and Norway are competitors exporting wet, salted cod to Spain, as suggested in the previous model, but Denmark only competes with Norwegian imports. This causal relationship could also indicate that Denmark is mainly re-exporting Norwegian green cod.
16
Table 9. Price competition across wet, salted cod exporters: Iceland – Norway – Denmark (Unrestricted constant)
Rank Eigenvalue Trace test Lmax test 0 0.53439 67.020a 45.865a
1 0.28647 21.155a 20.252a
2 0.014938 0.90302 0.90302Granger causality causes
Iceland Norway DenmarkIceland 9.5816a 14.211a 2.3216Norway 17.834a 12.088a 0.39226Denmark 1.2157 6.1596a 0.026371
a 99 percent CL; b 95 percent CL;
c 90 percent CL.
Price transmission from imports to the retail level is tested in the first instance in a model considering only producing countries (Table 10). Results suggest cointegration according to the Johansen test, and Granger causality confirms the relationships among the different price series. Competition between Iceland and Norway is evidenced again in this model of price transmission. Moreover, retail prices of salted fish are affected by the price of wet, green cod imports from Iceland and Norway to a lesser extent. Thus retailers are transferring the changes in producers’ prices to their consumers, with no signs of any influence of retailers on a producers’ prices. Table 10. Price transmission from wet, salted cod producers to Spanish retailers (Unrestricted constant and restricted trend)
Rank Eigenvalue Trace test Lmax test 0 0.50253 70.079a 41.894a
1 0.31092 28.186b 22.344a
2 0.092776 5.8419 5.8419Granger causality causes
Iceland Norway RetailIceland 0.51769 3.7364b 2.0071Norway 4.4514a 1.2427 2.0345Retail 4.3246a 2.6318b 2.9355b
a 99 percent CL; b 95 percent CL;
c 90 percent CL.
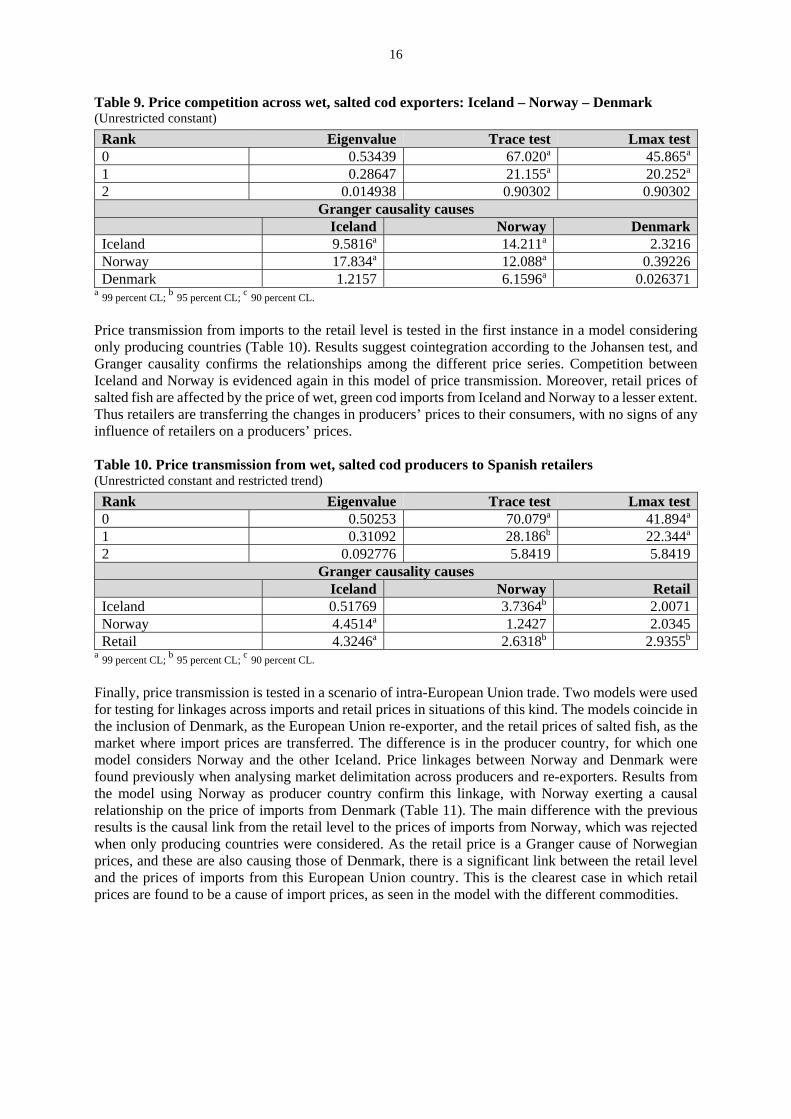
Finally, price transmission is tested in a scenario of intra-European Union trade. Two models were used for testing for linkages across imports and retail prices in situations of this kind. The models coincide in the inclusion of Denmark, as the European Union re-exporter, and the retail prices of salted fish, as the market where import prices are transferred. The difference is in the producer country, for which one model considers Norway and the other Iceland. Price linkages between Norway and Denmark were found previously when analysing market delimitation across producers and re-exporters. Results from the model using Norway as producer country confirm this linkage, with Norway exerting a causal relationship on the price of imports from Denmark (Table 11). The main difference with the previous results is the causal link from the retail level to the prices of imports from Norway, which was rejected when only producing countries were considered. As the retail price is a Granger cause of Norwegian prices, and these are also causing those of Denmark, there is a significant link between the retail level and the prices of imports from this European Union country. This is the clearest case in which retail prices are found to be a cause of import prices, as seen in the model with the different commodities.
17
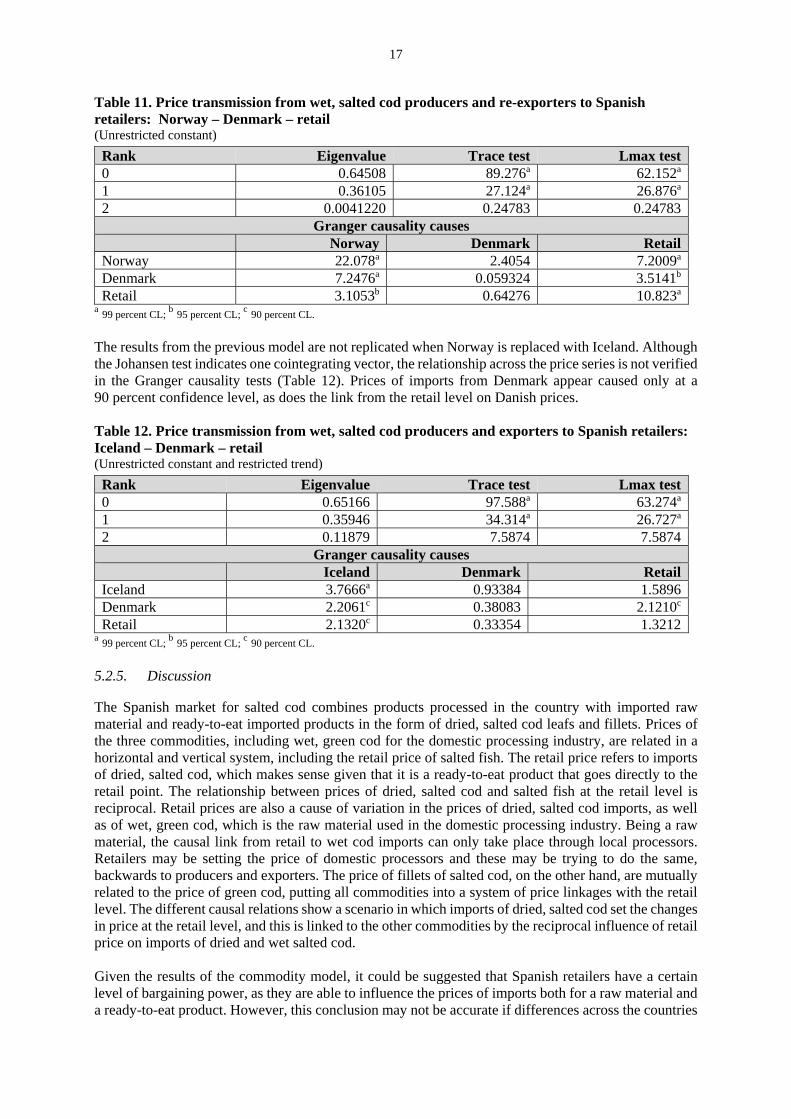
Table 11. Price transmission from wet, salted cod producers and re-exporters to Spanish retailers: Norway – Denmark – retail (Unrestricted constant)
Rank Eigenvalue Trace test Lmax test 0 0.64508 89.276a 62.152a
1 0.36105 27.124a 26.876a
2 0.0041220 0.24783 0.24783Granger causality causes
Norway Denmark RetailNorway 22.078a 2.4054 7.2009a
Denmark 7.2476a 0.059324 3.5141b
Retail 3.1053b 0.64276 10.823a
a 99 percent CL; b 95 percent CL;
c 90 percent CL.
The results from the previous model are not replicated when Norway is replaced with Iceland. Although the Johansen test indicates one cointegrating vector, the relationship across the price series is not verified in the Granger causality tests (Table 12). Prices of imports from Denmark appear caused only at a 90 percent confidence level, as does the link from the retail level on Danish prices. Table 12. Price transmission from wet, salted cod producers and exporters to Spanish retailers: Iceland – Denmark – retail (Unrestricted constant and restricted trend)
Rank Eigenvalue Trace test Lmax test 0 0.65166 97.588a 63.274a
1 0.35946 34.314a 26.727a
2 0.11879 7.5874 7.5874Granger causality causes
Iceland Denmark RetailIceland 3.7666a 0.93384 1.5896Denmark 2.2061c 0.38083 2.1210c
Retail 2.1320c 0.33354 1.3212a 99 percent CL;
b 95 percent CL; c 90 percent CL.
5.2.5. Discussion
The Spanish market for salted cod combines products processed in the country with imported raw material and ready-to-eat imported products in the form of dried, salted cod leafs and fillets. Prices of the three commodities, including wet, green cod for the domestic processing industry, are related in a horizontal and vertical system, including the retail price of salted fish. The retail price refers to imports of dried, salted cod, which makes sense given that it is a ready-to-eat product that goes directly to the retail point. The relationship between prices of dried, salted cod and salted fish at the retail level is reciprocal. Retail prices are also a cause of variation in the prices of dried, salted cod imports, as well as of wet, green cod, which is the raw material used in the domestic processing industry. Being a raw material, the causal link from retail to wet cod imports can only take place through local processors. Retailers may be setting the price of domestic processors and these may be trying to do the same, backwards to producers and exporters. The price of fillets of salted cod, on the other hand, are mutually related to the price of green cod, putting all commodities into a system of price linkages with the retail level. The different causal relations show a scenario in which imports of dried, salted cod set the changes in price at the retail level, and this is linked to the other commodities by the reciprocal influence of retail price on imports of dried and wet salted cod. Given the results of the commodity model, it could be suggested that Spanish retailers have a certain level of bargaining power, as they are able to influence the prices of imports both for a raw material and a ready-to-eat product. However, this conclusion may not be accurate if differences across the countries
18
exporting salted cod commodities to Spain are taken into account. All these commodities can be imported into Spain directly from a producer country such as Faroe Islands, Iceland or Norway, or from a third country within the European Union (Member Organization), which previously imported the product. This product imported into a third country can be immediately shipped to the final destination country or stored, preserved and sold when the current price increases the margin with regard to the price at which it was purchased. This practice enables re-exporters to compete against producers, offering lower prices with minimum or even no loss in their marketing margins. This kind of trade appears to be conducted by other relevant exporters of salted cod to Spain, such as Denmark, Germany, the Netherlands or Sweden, with almost no importance to cod harvesting and processing. Prices of the main producers have been found to be integrated in a delimited market. Faroe Islands, which is the country with the highest price, is used as a reference by Icelandic exporters when shipping wet, green cod to Spain. This explains why the price of imports from Iceland changes after their price from Faroe Islands does. The same appears to be happening with prices in Norway, which change after a shock in prices from Iceland. These relationships across prices of the main producers do not vary when re-exporter countries are included in the model. The causal relationships across producers persist, and linkages may appear across producers and re-exporters, pointing to the origin of the product traded by the third country. What is more relevant here is the fact that the retail price of salted fish becomes endogenous when only producer countries are considered, that is, prices at the retail level are caused by the price of direct imports from producing countries. In this case, processors in Spain are transferring the raw material costs to retailers and these to final consumers. This is a situation of perfect price transmission, without any kind of bargaining power in effect by retailers. However, this situation changes when a third country is included in the system. When a re-exporter is able to provide the product at a lower or similar price than the producer, including transport costs, then the bargaining position of traders in the importing country improves. This situation has been observed in the model of price transmission across Denmark, Norway and the retail price in Spain. The direction of the causal link between Norway and the Spanish retail price changes when Iceland or Denmark is considered as the competitor for imports from Norway. When Iceland and Norway are analysed along with the retail price, Spanish retailers are found to be acting as price takers. The price of salted fish at the retail level reacts to changes in the price of imports of the raw material. In contrast, when the imports in the system are those from Norway and Denmark, then the link between Norwegian and Spanish retail prices becomes bidirectional, with a causal relationship from retail on the imports from Denmark. Local traders improve their ability to exert bargaining power when a re-exporter enters the system. In this particular case, intra-European Union trade is favouring the interests of Spanish retailers, who have the ability to import the same product from another member state, with no tariffs and lower shipping costs, if prices in Norway are not interesting in terms of the targeted marketing margins. This ability increases if there is also a competitive reaction, as was found in the model in Danish prices when Norwegian prices change. By entering into price competition with Norway, Danish traders can supply Spanish processors at a more-attractive price, and these can supply local demand at a more-convenient price for retailers. When negotiating with Norwegian exporters, Spanish importers can use this advantage, and if there is no highly significant difference in terms of quality, Norwegian exporters may see their potential bargaining power reduced.
19
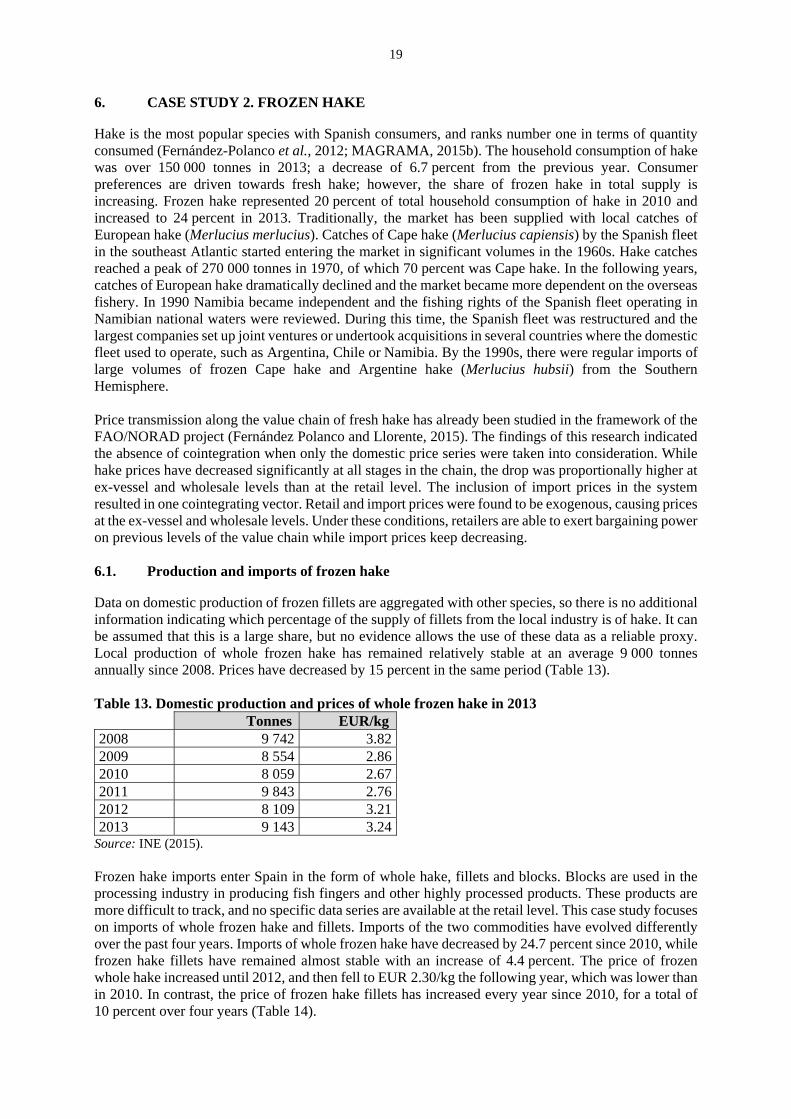
6. CASE STUDY 2. FROZEN HAKE
Hake is the most popular species with Spanish consumers, and ranks number one in terms of quantity consumed (Fernández-Polanco et al., 2012; MAGRAMA, 2015b). The household consumption of hake was over 150 000 tonnes in 2013; a decrease of 6.7 percent from the previous year. Consumer preferences are driven towards fresh hake; however, the share of frozen hake in total supply is increasing. Frozen hake represented 20 percent of total household consumption of hake in 2010 and increased to 24 percent in 2013. Traditionally, the market has been supplied with local catches of European hake (Merlucius merlucius). Catches of Cape hake (Merlucius capiensis) by the Spanish fleet in the southeast Atlantic started entering the market in significant volumes in the 1960s. Hake catches reached a peak of 270 000 tonnes in 1970, of which 70 percent was Cape hake. In the following years, catches of European hake dramatically declined and the market became more dependent on the overseas fishery. In 1990 Namibia became independent and the fishing rights of the Spanish fleet operating in Namibian national waters were reviewed. During this time, the Spanish fleet was restructured and the largest companies set up joint ventures or undertook acquisitions in several countries where the domestic fleet used to operate, such as Argentina, Chile or Namibia. By the 1990s, there were regular imports of large volumes of frozen Cape hake and Argentine hake (Merlucius hubsii) from the Southern Hemisphere. Price transmission along the value chain of fresh hake has already been studied in the framework of the FAO/NORAD project (Fernández Polanco and Llorente, 2015). The findings of this research indicated the absence of cointegration when only the domestic price series were taken into consideration. While hake prices have decreased significantly at all stages in the chain, the drop was proportionally higher at ex-vessel and wholesale levels than at the retail level. The inclusion of import prices in the system resulted in one cointegrating vector. Retail and import prices were found to be exogenous, causing prices at the ex-vessel and wholesale levels. Under these conditions, retailers are able to exert bargaining power on previous levels of the value chain while import prices keep decreasing. 6.1. Production and imports of frozen hake
Data on domestic production of frozen fillets are aggregated with other species, so there is no additional information indicating which percentage of the supply of fillets from the local industry is of hake. It can be assumed that this is a large share, but no evidence allows the use of these data as a reliable proxy. Local production of whole frozen hake has remained relatively stable at an average 9 000 tonnes annually since 2008. Prices have decreased by 15 percent in the same period (Table 13). Table 13. Domestic production and prices of whole frozen hake in 2013 Tonnes EUR/kg2008 9 742 3.822009 8 554 2.862010 8 059 2.672011 9 843 2.762012 8 109 3.212013 9 143 3.24
Source: INE (2015). Frozen hake imports enter Spain in the form of whole hake, fillets and blocks. Blocks are used in the processing industry in producing fish fingers and other highly processed products. These products are more difficult to track, and no specific data series are available at the retail level. This case study focuses on imports of whole frozen hake and fillets. Imports of the two commodities have evolved differently over the past four years. Imports of whole frozen hake have decreased by 24.7 percent since 2010, while frozen hake fillets have remained almost stable with an increase of 4.4 percent. The price of frozen whole hake increased until 2012, and then fell to EUR 2.30/kg the following year, which was lower than in 2010. In contrast, the price of frozen hake fillets has increased every year since 2010, for a total of 10 percent over four years (Table 14).
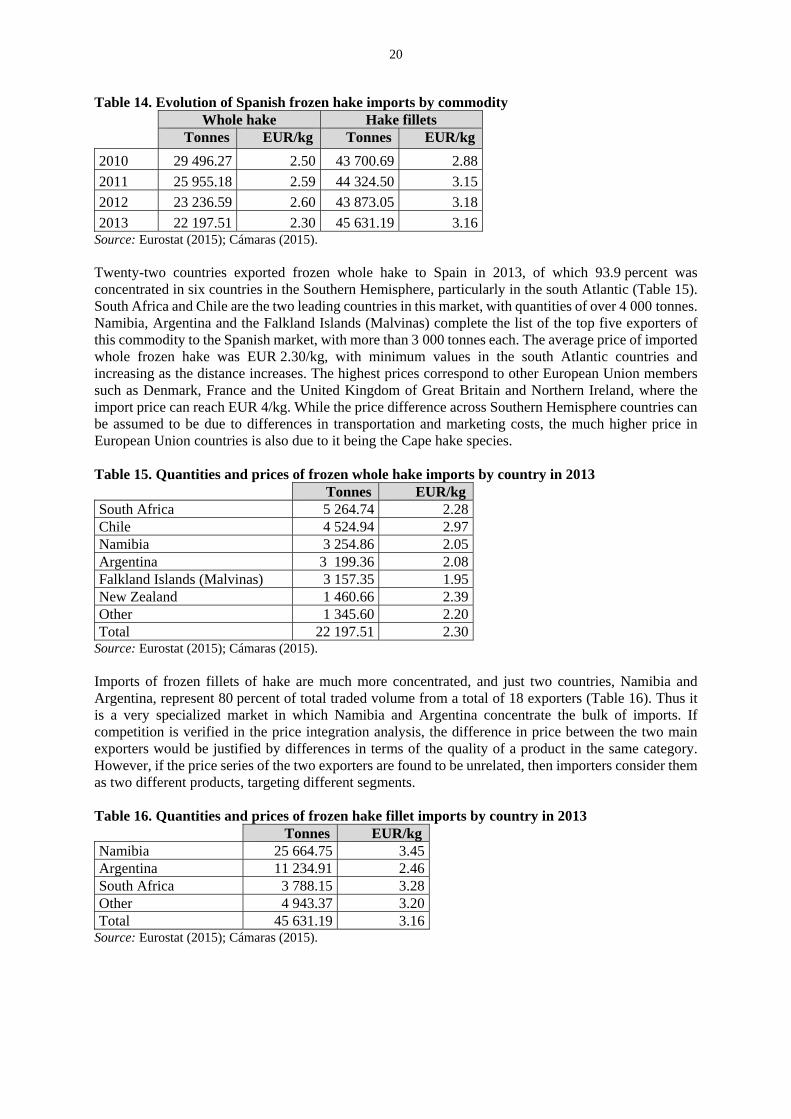
20
Table 14. Evolution of Spanish frozen hake imports by commodity Whole hake Hake fillets Tonnes EUR/kg Tonnes EUR/kg
2010 29 496.27 2.50 43 700.69 2.88
2011 25 955.18 2.59 44 324.50 3.15
2012 23 236.59 2.60 43 873.05 3.18
2013 22 197.51 2.30 45 631.19 3.16Source: Eurostat (2015); Cámaras (2015). Twenty-two countries exported frozen whole hake to Spain in 2013, of which 93.9 percent was concentrated in six countries in the Southern Hemisphere, particularly in the south Atlantic (Table 15). South Africa and Chile are the two leading countries in this market, with quantities of over 4 000 tonnes. Namibia, Argentina and the Falkland Islands (Malvinas) complete the list of the top five exporters of this commodity to the Spanish market, with more than 3 000 tonnes each. The average price of imported whole frozen hake was EUR 2.30/kg, with minimum values in the south Atlantic countries and increasing as the distance increases. The highest prices correspond to other European Union members such as Denmark, France and the United Kingdom of Great Britain and Northern Ireland, where the import price can reach EUR 4/kg. While the price difference across Southern Hemisphere countries can be assumed to be due to differences in transportation and marketing costs, the much higher price in European Union countries is also due to it being the Cape hake species. Table 15. Quantities and prices of frozen whole hake imports by country in 2013 Tonnes EUR/kgSouth Africa 5 264.74 2.28Chile 4 524.94 2.97Namibia 3 254.86 2.05Argentina 3 199.36 2.08Falkland Islands (Malvinas) 3 157.35 1.95New Zealand 1 460.66 2.39Other 1 345.60 2.20Total 22 197.51 2.30
Source: Eurostat (2015); Cámaras (2015). Imports of frozen fillets of hake are much more concentrated, and just two countries, Namibia and Argentina, represent 80 percent of total traded volume from a total of 18 exporters (Table 16). Thus it is a very specialized market in which Namibia and Argentina concentrate the bulk of imports. If competition is verified in the price integration analysis, the difference in price between the two main exporters would be justified by differences in terms of the quality of a product in the same category. However, if the price series of the two exporters are found to be unrelated, then importers consider them as two different products, targeting different segments. Table 16. Quantities and prices of frozen hake fillet imports by country in 2013 Tonnes EUR/kgNamibia 25 664.75 3.45Argentina 11 234.91 2.46South Africa 3 788.15 3.28Other 4 943.37 3.20Total 45 631.19 3.16
Source: Eurostat (2015); Cámaras (2015).
21
6.2. Price integration analysis
The case of frozen hake imported by Spain allows two applications of price integration similar to the case of salted cod. The main difference with the previous case study is the low significance of intra-European Union trade in this market. Thus the analysis undertaken in this case study will focus only on competition across commodities and countries, and links with the retail level in the destination market. Horizontal and vertical integration will be combined to study competition across commodities and price transmission to the retail level. The aggregated price series of whole and filleted frozen hake will be integrated with the retail price of frozen hake. This clarifies two points. The first answers the question of whether there is a delimited market for frozen hake or if the two commodities are targeting different segments. The second point, given that retail data on frozen hake in Spain are not differentiated, will show which of the two commodities, if any, is linked to the total market for frozen hake at the retail level in the country of final consumption. This test will be performed with the aggregated data by commodity and with those countries exporting both commodities. The same combination will be used to study price transmission from countries exporting the same commodities to the retail level in Spain. Two models will account for the price relationship across the three main exporters of whole frozen hake, on the one hand, and those of frozen hake fillets, on the other. Results will illustrate the differences in competition and price transmission of products of the same species at different levels of processing. As data at species level are not available for the full observation period, substitution across species is not included in this case study. 6.2.1. Data sources
Data on imports of frozen hake are also available at the Comext database (Eurostat, 2015). The main trade partners were identified in data provided by the Spanish customs service in the Database of External Trade (Cámaras, 2015). Imports of whole frozen hake are aggregated under the harmonized code 030366/78 “Frozen hake (Merluccius spp., Urophycis spp.)”, while fillets were differentiated by species until 2012. The available harmonized codes are: 03042055/955 Frozen fillets of Cape hake (shallow-water hake) Merluccius capensis and of
deepwater hake (deepwater Cape hake) Merluccius paradoxus 03042056/956 Frozen fillets of Argentine hake (southwest Atlantic hake) Merluccius hubbsi 03042058/958 Frozen fillets of hake Merluccius spp., Urophycis spp. 03042059/959 Frozen fillets of hake Urophycis spp. Data on retailing and the consumption of hake in Spain are not disaggregated by commodity or product but grouped into broad fresh and frozen categories (MAGRAMA, 2015b). Data on domestic production do not provide a good proxy, as frozen fillets are aggregated with other species. According to the distribution of imports of frozen hake, including blocks, in 2013 (Cámaras, 2015), 58 percent of the total frozen hake consumed in the country was fillets. Whole frozen hake accounts for 28 percent of total imports and blocks for 14 percent. According to this distribution, a higher integration would be expected with the aggregated retail price of frozen hake fillets than with frozen whole hake. 6.2.2. Evolution of price series
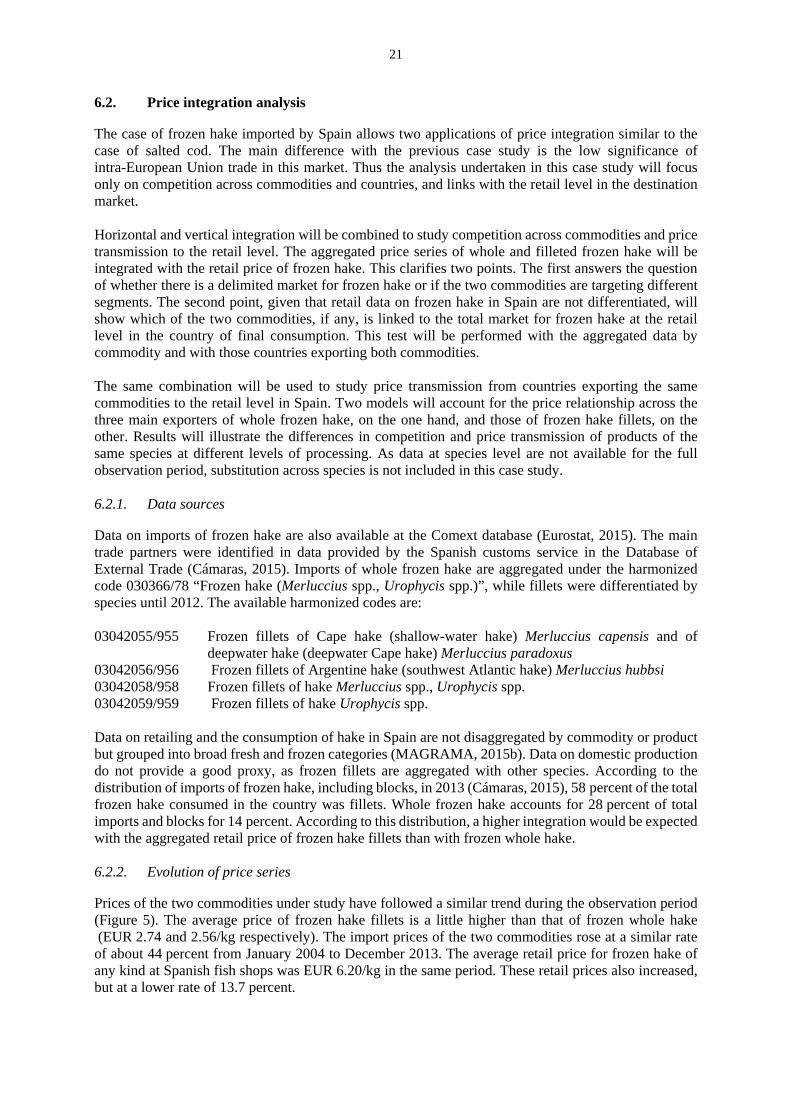
Prices of the two commodities under study have followed a similar trend during the observation period (Figure 5). The average price of frozen hake fillets is a little higher than that of frozen whole hake (EUR 2.74 and 2.56/kg respectively). The import prices of the two commodities rose at a similar rate of about 44 percent from January 2004 to December 2013. The average retail price for frozen hake of any kind at Spanish fish shops was EUR 6.20/kg in the same period. These retail prices also increased, but at a lower rate of 13.7 percent.
22
Figure 5. Evolution of the price series of frozen hake imports by commodity and retail price in Spain
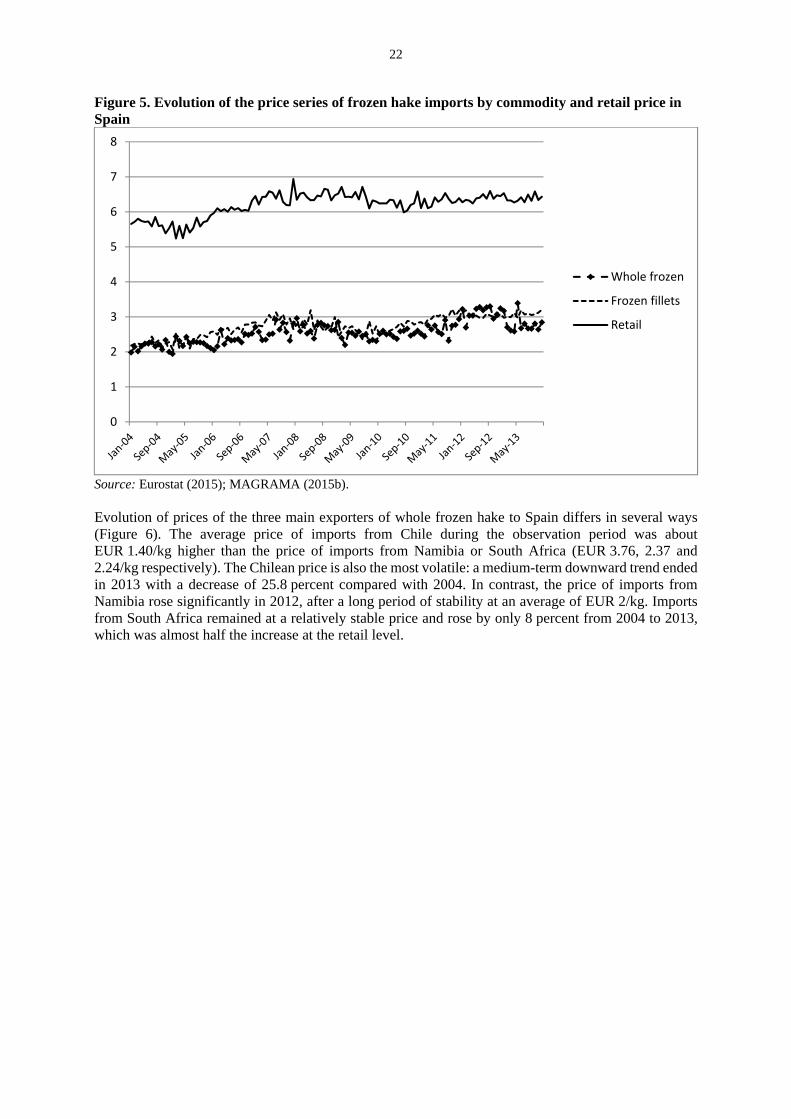
Source: Eurostat (2015); MAGRAMA (2015b). Evolution of prices of the three main exporters of whole frozen hake to Spain differs in several ways (Figure 6). The average price of imports from Chile during the observation period was about EUR 1.40/kg higher than the price of imports from Namibia or South Africa (EUR 3.76, 2.37 and 2.24/kg respectively). The Chilean price is also the most volatile: a medium-term downward trend ended in 2013 with a decrease of 25.8 percent compared with 2004. In contrast, the price of imports from Namibia rose significantly in 2012, after a long period of stability at an average of EUR 2/kg. Imports from South Africa remained at a relatively stable price and rose by only 8 percent from 2004 to 2013, which was almost half the increase at the retail level.
0
1
2
3
4
5
6
7
8
Whole frozen
Frozen fillets
Retail
23
Figure 6. Evolution of the price series of frozen whole hake imports by country and retail price in Spain
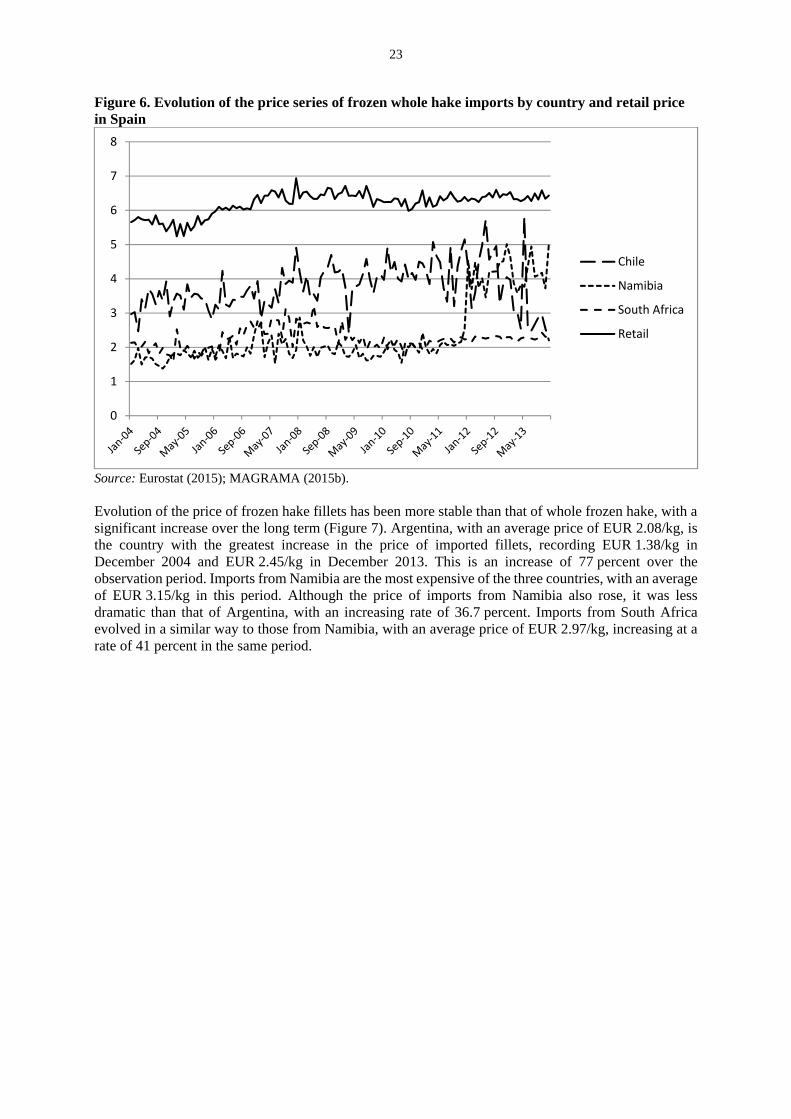
Source: Eurostat (2015); MAGRAMA (2015b). Evolution of the price of frozen hake fillets has been more stable than that of whole frozen hake, with a significant increase over the long term (Figure 7). Argentina, with an average price of EUR 2.08/kg, is the country with the greatest increase in the price of imported fillets, recording EUR 1.38/kg in December 2004 and EUR 2.45/kg in December 2013. This is an increase of 77 percent over the observation period. Imports from Namibia are the most expensive of the three countries, with an average of EUR 3.15/kg in this period. Although the price of imports from Namibia also rose, it was less dramatic than that of Argentina, with an increasing rate of 36.7 percent. Imports from South Africa evolved in a similar way to those from Namibia, with an average price of EUR 2.97/kg, increasing at a rate of 41 percent in the same period.
0
1
2
3
4
5
6
7
8
Chile
Namibia
South Africa
Retail
24
Figure 7. Evolution of the price series of imports of frozen hake fillets by country and retail price in Spain
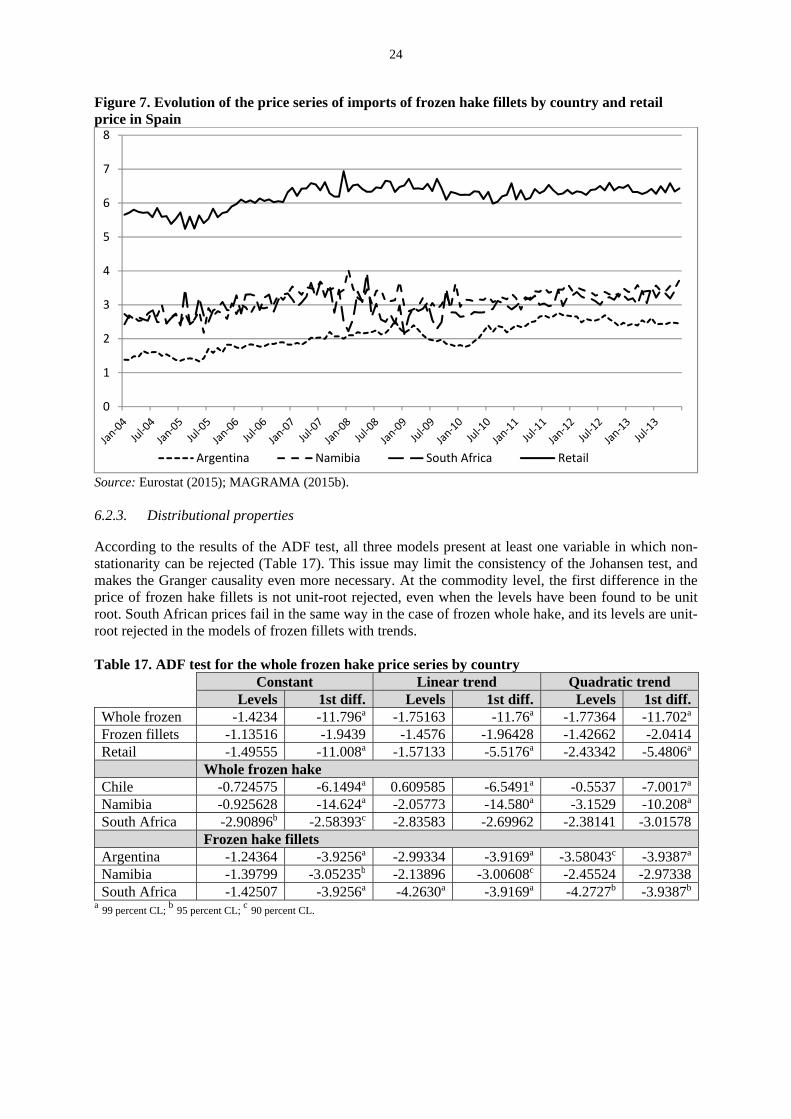
Source: Eurostat (2015); MAGRAMA (2015b). 6.2.3. Distributional properties
According to the results of the ADF test, all three models present at least one variable in which non-stationarity can be rejected (Table 17). This issue may limit the consistency of the Johansen test, and makes the Granger causality even more necessary. At the commodity level, the first difference in the price of frozen hake fillets is not unit-root rejected, even when the levels have been found to be unit root. South African prices fail in the same way in the case of frozen whole hake, and its levels are unit-root rejected in the models of frozen fillets with trends. Table 17. ADF test for the whole frozen hake price series by country Constant Linear trend Quadratic trend Levels 1st diff. Levels 1st diff. Levels 1st diff.Whole frozen -1.4234 -11.796a -1.75163 -11.76a -1.77364 -11.702a
Frozen fillets -1.13516 -1.9439 -1.4576 -1.96428 -1.42662 -2.0414Retail -1.49555 -11.008a -1.57133 -5.5176a -2.43342 -5.4806a
Whole frozen hake Chile -0.724575 -6.1494a 0.609585 -6.5491a -0.5537 -7.0017a
Namibia -0.925628 -14.624a -2.05773 -14.580a -3.1529 -10.208a
South Africa -2.90896b -2.58393c -2.83583 -2.69962 -2.38141 -3.01578 Frozen hake fillets Argentina -1.24364 -3.9256a -2.99334 -3.9169a -3.58043c -3.9387a
Namibia -1.39799 -3.05235b -2.13896 -3.00608c -2.45524 -2.97338South Africa -1.42507 -3.9256a -4.2630a -3.9169a -4.2727b -3.9387b
a 99 percent CL; b 95 percent CL;
c 90 percent CL.
0
1
2
3
4
5
6
7
8
Argentina Namibia South Africa Retail
25
6.2.4. Results
The first model tested analysed integration across the import prices of the two commodities under study and the retail price of frozen hake in Spain. Cointegration is rejected by the Johansen test (Table 18). There is only one significant Granger cause across variables in the system. The import price of frozen hake fillets is a Granger cause of the retail price of frozen hake at a 95 percent confidence level. At this point, the analysis demonstrates that the price of frozen hake at the retail level, provided by the Food Consumption Panel (MAGRAMA, 2015b), is somehow related to the price of fillets. This association across retail price and imports of frozen hake fillets was expected, as fillets are more than 60 percent of the total supply of frozen hake. Another observation of research interest is the fact that frozen whole hake and fillets are uncorrelated, which points to a differentiated market as suggested by the lack of cointegration in the Johansen test. Table 18. Price transmission across frozen hake commodities (Unrestricted constant, restricted trend)
Rank Eigenvalue Trace test Lmax test 0 0.17634 36.210 20.9521 0.074448 15.258 8.35552 0.061910 6.9023 6.9023
Granger causality (2 lags) causes Whole frozen Frozen fillets Retail
Whole frozen 8.5150a 3.1666c 0.26639Frozen fillets 0.26273 33.281a 1.4392Retail 0.16096 3.2758b 64.079a
a 99 percent CL; b 95 percent CL;
c 90 percent CL.
Following the test at the commodity level, competition was tested across countries and price transmission to the retail level in the market for frozen whole hake. Although the Johansen test indicates one cointegrating vector, the system appears to be limited to the relationship between imports from one country, South Africa, and the retail level, with a minimal influence of Namibian prices on the price of imports from South Africa (Table 19). This result is expected, according to the different evolution of the price series over the observation period. Prices of frozen whole hake from Chile and Namibia are not affected by any other price series in the system. Table 19. Price integration across frozen whole hake imports and retail (Unrestricted constant and restricted trend)
Rank Eigenvalue Trace test Lmax test 0 0.42681 112.58a 60.106a
1 0.24282 52.475a 30.041a
2 0.13695 22.433 15.9073 0.058641 6.5265 6.5265
Granger causality causes South Africa Chile Namibia RetailSouth Africa 8.2354a 1.2026 2.0855c 5.1235a
Chile 1.7391 8.0350a 1.0483 1.1833Namibia 0.86237 0.50769 48.746a 1.6796Retail 3.1449b 0.15683 0.23829 12.985a
a 99 percent CL; b 95 percent CL;
c 90 percent CL. Finally, results from the Johansen test with imports of frozen hake fillets indicate one cointegrating vector, and the Granger causality tests show one clear price taker (Table 20). The import price for Namibian fillets is caused by all the rest of the price series and exerts a minimum effect of the prices from Argentina. Retail prices are a Granger cause for the prices of both Argentina and Namibia. Fillets from South Africa are not involved in any of these price linkages.
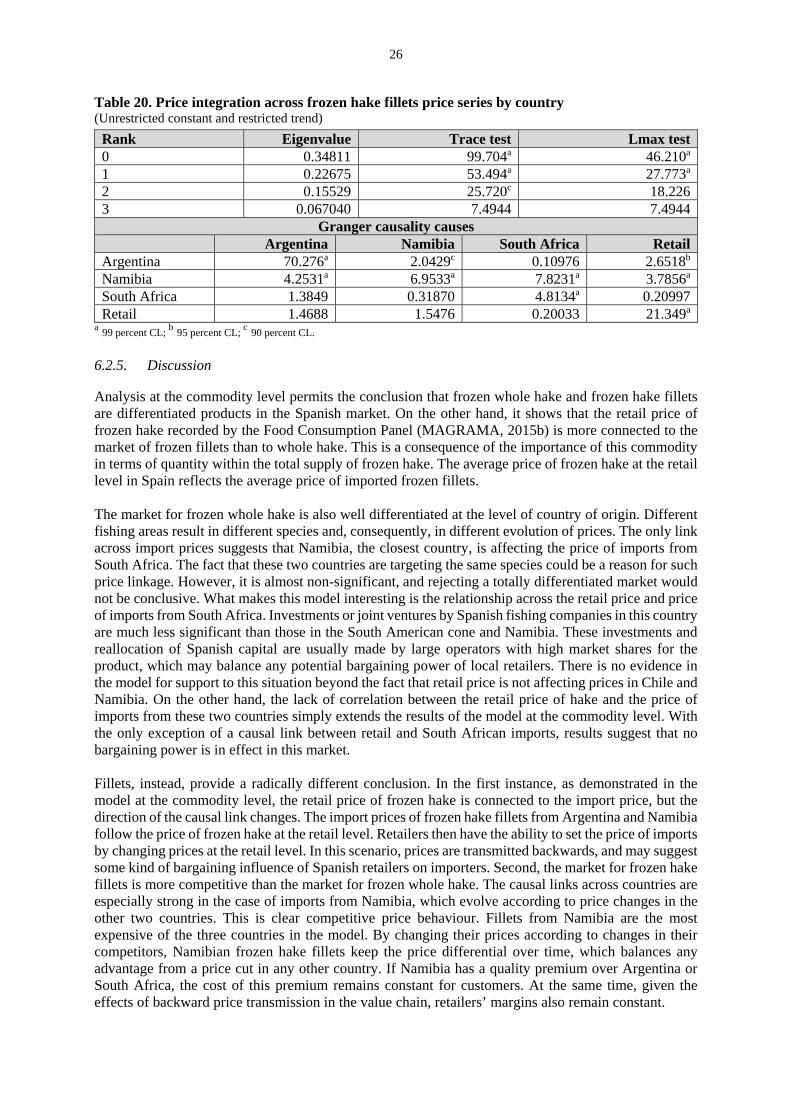
26
Table 20. Price integration across frozen hake fillets price series by country (Unrestricted constant and restricted trend)
Rank Eigenvalue Trace test Lmax test 0 0.34811 99.704a 46.210a
1 0.22675 53.494a 27.773a
2 0.15529 25.720c 18.2263 0.067040 7.4944 7.4944
Granger causality causes Argentina Namibia South Africa RetailArgentina 70.276a 2.0429c 0.10976 2.6518b
Namibia 4.2531a 6.9533a 7.8231a 3.7856a
South Africa 1.3849 0.31870 4.8134a 0.20997Retail 1.4688 1.5476 0.20033 21.349a
a 99 percent CL; b 95 percent CL;
c 90 percent CL.
6.2.5. Discussion
Analysis at the commodity level permits the conclusion that frozen whole hake and frozen hake fillets are differentiated products in the Spanish market. On the other hand, it shows that the retail price of frozen hake recorded by the Food Consumption Panel (MAGRAMA, 2015b) is more connected to the market of frozen fillets than to whole hake. This is a consequence of the importance of this commodity in terms of quantity within the total supply of frozen hake. The average price of frozen hake at the retail level in Spain reflects the average price of imported frozen fillets. The market for frozen whole hake is also well differentiated at the level of country of origin. Different fishing areas result in different species and, consequently, in different evolution of prices. The only link across import prices suggests that Namibia, the closest country, is affecting the price of imports from South Africa. The fact that these two countries are targeting the same species could be a reason for such price linkage. However, it is almost non-significant, and rejecting a totally differentiated market would not be conclusive. What makes this model interesting is the relationship across the retail price and price of imports from South Africa. Investments or joint ventures by Spanish fishing companies in this country are much less significant than those in the South American cone and Namibia. These investments and reallocation of Spanish capital are usually made by large operators with high market shares for the product, which may balance any potential bargaining power of local retailers. There is no evidence in the model for support to this situation beyond the fact that retail price is not affecting prices in Chile and Namibia. On the other hand, the lack of correlation between the retail price of hake and the price of imports from these two countries simply extends the results of the model at the commodity level. With the only exception of a causal link between retail and South African imports, results suggest that no bargaining power is in effect in this market. Fillets, instead, provide a radically different conclusion. In the first instance, as demonstrated in the model at the commodity level, the retail price of frozen hake is connected to the import price, but the direction of the causal link changes. The import prices of frozen hake fillets from Argentina and Namibia follow the price of frozen hake at the retail level. Retailers then have the ability to set the price of imports by changing prices at the retail level. In this scenario, prices are transmitted backwards, and may suggest some kind of bargaining influence of Spanish retailers on importers. Second, the market for frozen hake fillets is more competitive than the market for frozen whole hake. The causal links across countries are especially strong in the case of imports from Namibia, which evolve according to price changes in the other two countries. This is clear competitive price behaviour. Fillets from Namibia are the most expensive of the three countries in the model. By changing their prices according to changes in their competitors, Namibian frozen hake fillets keep the price differential over time, which balances any advantage from a price cut in any other country. If Namibia has a quality premium over Argentina or South Africa, the cost of this premium remains constant for customers. At the same time, given the effects of backward price transmission in the value chain, retailers’ margins also remain constant.
27
7. CASE STUDY 3. FROZEN SQUID
As in the other Mediterranean countries, squid and other cephalopods are popular seafoods among Spanish consumers. The Spanish fishing fleet targets squid of different species in domestic and overseas waters, mainly in the southwest and northwest Atlantic. Domestic catches reached their maximum in the 1990s and then dropped in 1997 as a consequence of lower catches of Patagonian squid in the southwest Atlantic. Although other, alternative species were targeted in the same or new waters, domestic catches decreased by 45 percent between 1989 and 2012, with a critical period in the first years of the new century, owing to another decrease in catches in the southwest Atlantic. In recent years catches appear to be recovering, and the Spanish fleet keeps landing squid of different species from local and overseas waters. However, dependence on imports has increased due to the shortage of squid in the southwest Atlantic over the last two decades. 7.1. Production and imports of frozen squid
Domestic production of frozen squid declined from 18 000 tonnes in 2008 to 13 000 in 2010, and remained at 14 000 in the following two years. Following an increase in domestic catches in 2012, production reached 21 000 tonnes in 2013 (Table 21). Prices increased as production was declining, reaching EUR 3.51/kg in 2011. This trend changed in the following two years, dropping to EUR 2.80/kg in 2013. Table 21. Domestic production and prices of whole frozen hake in 2013 Tonnes EUR/kg2008 18 255 2.552009 15 345 2.572010 13 580 2.932011 14 783 3.512012 14 553 2.902013 21 049 2.80
Source: INE (2015). Spanish imports of frozen squid have been moving a yearly amount of 100 000 tonnes in the last four years, which is a significant volume and much larger than domestic production (Table 22). These figures include squid of different species, with Loligo patagonica being the most frequent. Aggregation of different commodities/species was needed to complete a monthly series for the frozen squid case, given the fishing seasons for the different species and changes in the tariff codes over the years. Prices also remained stable at an average EUR 2.42/kg. Table 22. Evolution of Spanish imports of frozen squid Tonnes EUR/kg2010 108 434.50 2.122011 99 700.16 2.642012 111 727.20 2.482013 92 557.30 2.41
Source: Eurostat (2015); Cámaras (2015). Four countries provide 86.5 percent of total Spanish imports of frozen squid (Table 23). The Falkland Islands (Malvinas) account for 42 percent of total traded volumes of this commodity, with an average price of EUR 1.95/kg, which is the second lowest among the main four exporters of frozen squid. Peru has the lowest average price across imports of frozen squid, with an average EUR 1.38/kg. The differences in price are related to the species targeted. China and India export different species from the Falkland Islands (Malvinas) and this results in a relatively higher price. Morocco, which ranked below Peru with over 6 000 tonnes, exports Loligo vulgaris, which is a more-expensive species, increasing the average price of the aggregate of the rest of the exporters not listed in the table.
28
Table 23. Quantities and prices of frozen squid imports by country in 2013 Tonnes EUR/kgFalkland Islands (Malvinas) 39 091.02 1.95India 16 223.65 2.45China 10 827.85 2.01Peru 8 220.87 1.38Other 12 470.80 5.78Total 92 557.30 2.41
Source: Eurostat (2015); Cámaras (2015). 7.2. Price integration analysis
Given that the data of different commodities are aggregated, the only model to be performed in the frozen squid case will be testing for competition across the main exporters and price transmission to the retail level in Spain. This analysis will combine horizontal and vertical integration in a model with four variables. 7.2.1. Data sources
Data on imports of frozen squid are recorded using different codes and need to be aggregated to work with a full monthly series. The main trade partners for all species were identified in data provided by the Spanish customs service in the Database of External Trade (Cámaras, 2015). Data for producing the price series were extracted from the Comext database (Eurostat, 2015). The available harmonized codes are: 03074931 Frozen squid Loligo vulgaris, with or without shell 03074933 Frozen squid Loligo pealei, with or without shell 03074935 Squid Loligo patagonica, frozen 03074938 Frozen squid Loligo spp. (excl. Loligo vulgaris, pealei and patagonica) 03074951 Frozen squid Loligo spp., with or without shell (excl. Loligo vulgaris and pealei) 03074959 Frozen squid Ommastrephes spp., Nototodarus spp. and Sepioteuthis spp., with or without shell Quantities and values of frozen squid as a single category are available at the Food Consumption Panel provided by MAGRAMA (2015b). Data cover the period from January 2004 to December 2013. 7.2.2. Evolution of price series
The import prices of China, the Falkland Islands (Malvinas) and India evolved around a similar average of EUR 2.13/kg, regardless of the different species traded. However, while prices of imports from the Falkland Islands (Malvinas) remained more or less stable in the observation period and only increased by 17 percent, prices of imports from China and India increased by 80 percent in both cases. The average price at the retail level during the observed period was EUR 5.76/kg, and increased by 20.5 percent from December 2004 to December 2013 (Figure 8).
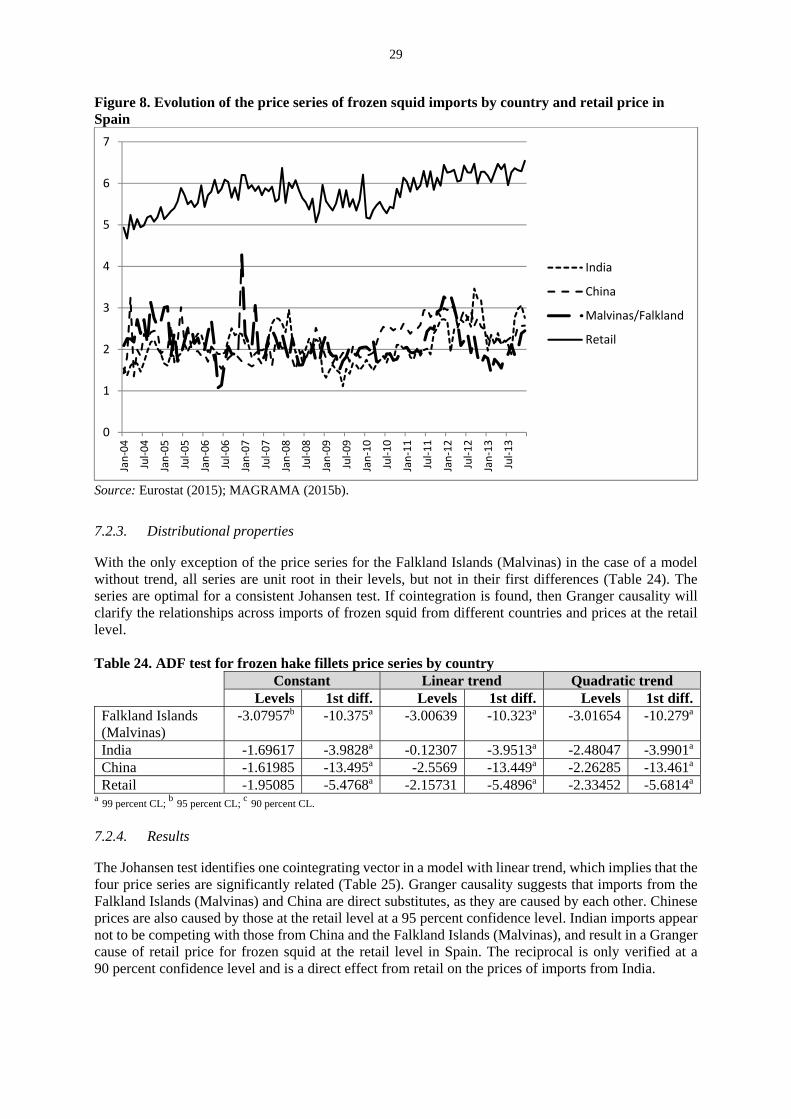
29
Figure 8. Evolution of the price series of frozen squid imports by country and retail price in Spain
Source: Eurostat (2015); MAGRAMA (2015b).
7.2.3. Distributional properties
With the only exception of the price series for the Falkland Islands (Malvinas) in the case of a model without trend, all series are unit root in their levels, but not in their first differences (Table 24). The series are optimal for a consistent Johansen test. If cointegration is found, then Granger causality will clarify the relationships across imports of frozen squid from different countries and prices at the retail level. Table 24. ADF test for frozen hake fillets price series by country Constant Linear trend Quadratic trend Levels 1st diff. Levels 1st diff. Levels 1st diff.Falkland Islands (Malvinas)
-3.07957b -10.375a -3.00639 -10.323a -3.01654 -10.279a
India -1.69617 -3.9828a -0.12307 -3.9513a -2.48047 -3.9901a
China -1.61985 -13.495a -2.5569 -13.449a -2.26285 -13.461a
Retail -1.95085 -5.4768a -2.15731 -5.4896a -2.33452 -5.6814a
a 99 percent CL; b 95 percent CL;
c 90 percent CL.
7.2.4. Results
The Johansen test identifies one cointegrating vector in a model with linear trend, which implies that the four price series are significantly related (Table 25). Granger causality suggests that imports from the Falkland Islands (Malvinas) and China are direct substitutes, as they are caused by each other. Chinese prices are also caused by those at the retail level at a 95 percent confidence level. Indian imports appear not to be competing with those from China and the Falkland Islands (Malvinas), and result in a Granger cause of retail price for frozen squid at the retail level in Spain. The reciprocal is only verified at a 90 percent confidence level and is a direct effect from retail on the prices of imports from India.
0
1
2
3
4
5
6
7
Jan‐04
Jul‐04
Jan‐05
Jul‐05
Jan‐06
Jul‐06
Jan‐07
Jul‐07
Jan‐08
Jul‐08
Jan‐09
Jul‐09
Jan‐10
Jul‐10
Jan‐11
Jul‐11
Jan‐12
Jul‐12
Jan‐13
Jul‐13
India
China
Malvinas/Falkland
Retail

30
Table 25. Price integration across whole hake price series by country (Unrestricted constant; restricted trend)
Rank Eigenvalue Trace test Lmax test 0 0.29166 86.762a 37.242a
1 0.23698 49.519a 29.211a
2 0.13637 20.308 15.8353 0.040577 4.4737 4.4737
Granger causality (2 lag) causes Falkland Islands
(Malvinas)India China Retail
Falkland Islands (Malvinas)
18.500a 0.66674 2.9890b 0.30878
India 1.4324 32.085a 0.81973 2.6876c
China 4.5053a 0.75197 18.894a 3.1895b
Retail 0.50165 5.0290a 0.68003 22.319a
a 99 percent CL; b 95 percent CL;
c 90 percent CL.
7.2.5. Discussion
Despite being an aggregate of different species and commodities, horizontal and vertical price integration has been verified in the Spanish market for imported frozen squid. Price competition between the Falkland Islands (Malvinas) and China has been observed, and results suggest that frozen squid from India is a differentiated product not entering this competition. Retailers played a dual role in the system. On the one hand, they have been transferring the increase in the price of imports directly linked to the evolution of the prices of imports from India. A change in the price of frozen squid from India is followed by a change in the retail price in Spain. On the other hand, by influencing prices of imports from China, they also affect prices from the Falkland Islands (Malvinas), which are causally linked to the Chinese prices. By transferring the price of imports from India, the retailers are not decreasing their margins. However, the Indian price is lower than the price of the other two competitors, which allows a higher margin. By affecting prices of imports from China, retailers may be avoiding higher increases from the two competitors, keeping prices of frozen squid at similar levels to those of India.
31
8. SUMMARY AND CONCLUSIONS
Three examples of international trade in different seafood commodities in the Spanish market have been analysed in the framework of the price integration methodology. This methodology makes possible the study of competition and price transmission along the supply chain. Competition is tested across the same or different products at the same stage in the chain. Price transmission is tested across prices of the same product at different levels in the chain. Price competition was analysed at the import level. Prices of imports for the targeted products were integrated into a test for market delimitation. Results indicate whether the analysed markets are delimited, and whether these are products competing across each other, or are differentiated markets in which the products target different market segments. Price transmission is studied across import and retail levels. Results demonstrate whether prices at the different levels are related, which show price transmission or the lack of it, and if related, which level is at the origin of the price relationship. The actor causing price linkages has the ability to change prices at the other levels to maintain or increase its own marketing margins. Although the analysis cannot demonstrate that market power is being exerted, being able to change prices at the following or previous levels of the value chain is a necessary condition for exerting market power in the chain. The three case studies correspond to salted cod, frozen hake and frozen squid. All are very popular with Spanish consumers. These cases illustrate three different situations in international trade, covering a wide range of geographical areas and levels of development in the exporting countries. Salted cod is produced mainly in the European countries of the north Atlantic, with Faroe Islands, Iceland and Norway being the most important. However, traditionally, salted cod was produced in Spain and supplied by the domestic fleet. The local industry is still important, and today the bulk of salted cod imports are of wet, salted cod or in brine, a subproduct whose maturation is completed by Spanish processors. Although the monthly price series of domestic production are not available, any link across imports and retail should have been connected also to the domestic processing level. Frozen hake and squid are also likely to undergo final processing by Spanish processors, who cut and pack, or deliver to the final markets without transformation, as may be the case for frozen hake fillets. As with salted cod, it is unclear which share of imports is locally processed. However, any link between retail and imports is also expected to affect local processors. One of the main differences between salted cod and the other two commodities is that the first is mainly a raw material for significant ulterior processing, while the processing required for the other two is minimal in comparison. The various locations and levels of economic development of the countries of origin add another element of differentiation across the case studies. Salted cod producers are located in high-income, developed countries, while imports of frozen hake and squid come into Spain mainly from developing and emerging economies. The differences in terms of bargaining power were previously reported in other FAO studies on revenue distribution and price transmission in the value chain of the international seafood trade (Gudmundsson, Asche and Nielsen, 2006; Bjørndal, Child and Lem, 2014). The results of the present case studies also point to differences of this type. As the models do not use price data at the production level in the countries of origin, there is no way to evidence whether they are affected by the bargaining power of Spanish traders. However, if a causal link exists between the retail and import levels, it can only be possible in the long term if the same link exists between importers in Spain and suppliers in the countries of origin, and so on until it reaches producers. In general terms, the three markets studied were found to be delimited. When there is no competition at the commodity level, this can happen across the countries of origin for the same commodity. The one exception in the cases analysed is provided by the market for frozen whole hake, which appears differentiated from frozen hake fillets across the countries of origin of imports. This can be a result of differences across species harvested in Africa and South America or of the relevance of Spanish companies and investments in the different countries analysed. However, despite these potential explanations, the only evidence is that there is no causal relationship across prices of imports from the different countries. On the contrary, frozen fillets of hake illustrate a case in which the two main exporters, Argentina and Namibia, are competing in price, and Namibia, on its own, is using other countries such as South Africa as a reference for pricing the fillets exported to Spain.
32
The market for salted cod was found to be delimited, as was previously verified at the species level (Nielsen, 2005). This delimitation is in effect at the levels of commodity and of country of origin. On the one hand, there are significant causal links across the different commodities, and wet, salted cod, the raw material, is directly or indirectly linked with fillets and dried, salted cod, which are finished products. This relationship is explained in the framework of a price transmission system in which the price of the raw material is transferred by local processors to the retail level, affecting prices of the ready-to-eat products. Competition is also verified at the level of country of origin, whether across producing countries or across producers and re-exporters in some cases. However, while competition across producers was found to be reciprocal when analysing Icelandic and Norwegian prices in a value-chain framework, prices of the re-exporter were found to be caused by the producer, with no ability to affect the price of the producer/competitor. Finally, frozen squid had to be tested with an aggregate of species due to the lack of a differentiated full series. However, differences across countries and regions, even though more than one species can be exported from the same country, also provide information about delimitation or differentiation by commodity. Results indicate a situation similar to that observed for frozen fish fillets. There is a delimited market in which the Falkland Islands (Malvinas) is competing with imports from China and a clearly differentiated product from India. In terms of price transmission in the value chain, results point to different conclusions according to the commodities and exporting countries. As shown in previous research on international seafood trade (Gudmundsson, Asche and Nielsen, 2006; Bjørndal, Child and Lem, 2014), developed countries with well-organized producer associations are less likely to be affected by the bargaining power of traders in the destination markets than are less-organized producers in developing countries. This conclusion also shows exceptions in the results from the three case studies that refer to differentiated products and intra-European Union trade. The effects of this trade in improving the potential ability of Spanish traders to exert bargaining power was found when studying the causal relationships across imports from Denmark and Norway and the retail price of salted fish at the retail level in Spain. Although the price of imports from Norway causally affects the Spanish retail price, the latter can also exert an influence on the Norwegian prices when imports from Denmark into Spain are taken into consideration. However, this situation was not observed in the case of imports from Iceland. The proximity of Norway to Denmark favours this trade, but also results in a potential threat to Norwegian prices, even though they are still mainly exogenous, caused by producers’ costs rather than by the exercise of bargaining power by traders. The other situations in which retail price is caused by imports are frozen whole hake from South Africa and frozen squid from India. Bidirectional relationships can be considered in both cases, but this is only clear for South African hake at a highly significant level. Although there seems to be a differentiated market with no significant competition across countries, the price of imports from South Africa and the average price of frozen hake at the retail level in Spain are mutually related. Frozen squid from India behaves like a perfectly differentiated product, not only at the market delimitation level, but also in terms of price transmission. The price of frozen squid imported from India significantly affects prices at the retail level, which means that at least Spanish importers are transferring the price of their purchases to the following stages of the value chain. Whether the benefits of this price transmission reach Indian producers cannot be assessed with the available data, and will require information from producers and exporters in India. Beyond these exceptions, the most common links between prices at the retail and import levels indicate backward price transmission and suggest the ability of Spanish traders to exert bargaining power on producers and exporters located in developing and emerging countries, as was observed in imports of frozen hake fillets from Argentina and Namibia, and frozen squid from China.
33
9. REFERENCES
Asche, F. 1997. Trade disputes and productivity gains: the curse of farmed salmon production? Marine Resource Economics, 12: 67–73.
Asche, F., Bremnes, H. & Wessells, C.R. 1999. Product aggregation, market integration and relationships between prices: an application to world salmon markets. American Journal of Agricultural Economics, 81(3): 568–581.
Asche, F., Gordon, D.V. & Hannesson, R. 2004. Tests for market integration and the law of one price: the market for whitefish in France. Marine Resource Economics, 19: 195–210.
Asche, F., Jaffry, S. & Hartmann, J. 2007. Price transmission and market integration: vertical and horizontal price linkages for salmon. Applied Economics, 39(19): 2535–2545.
Asche, F., Steen, F. & Salvanes, K.G. 1997. Market delineation and demand structure. American Journal of Agricultural Economics, 79(1): 139–150.
Asche, F., Bennear, L.S., Oglend, A. & Smith, M.D. 2012. US shrimp market integration. Marine Resource Economics, 27(2): 181–192.
Asche, F., Guttormsen, A.G., Sebulonsen, T. & Sissener, E.H. 2005. Competition between farmed and wild salmon: the Japanese salmon market. Agricultural Economics, 33(3): 333–340.
Bjørndal, T., Child, A. & Lem, A., eds. 2014. Value chain dynamics and the small-scale sector: policy recommendations for small-scale fisheries and aquaculture trade. FAO Fisheries and Aquaculture Technical Paper No. 581. Rome, FAO.
Blomquist, J. 2015. Multiple inference and market integration: an application to Swedish fish markets. Journal of Agricultural Economics, 66(1): 221–235.
Bose, S. & McIlgorm, A. 1996. Substitutability among species in the Japanese tuna market: a cointegration analysis. Marine Resource Economics, 11: 143–156.
Cámaras. 2015. Base de datos de comercio exterior. In Cámaras [online]. Madrid, Cámara Oficial de Comercio, Industria, Servicios y Navegación de España. (also available at http://aduanas.camaras.org/)
Cournot, A.A. 1838. Recherches sur les principes mathématiques de la théorie des richesses. Translated as: Cournot, A.A. 1971. Researches into the mathematical principles of the theory of wealth. New York, Augustus M. Kelly Publishers.
Dickey, D.A. & Fuller, W.A. 1981. Likelihood ratio statistics for autoregressive time series with a unit root. Econometrica, 49: 1057–1072.
Engle, R.F. & Granger, C.W.J. 1987. Co-integration and error correction: representation, estimation and testing. Econometrica, 55: 251–276.
Eurostat. 2015. External trade databases. In Eurostat [online]. Brussels. (available at http://ec.europa.eu/eurostat/web/international-trade/data/database)
FAO. 2015. Fishstat Plus databases. In FAO [online]. Rome. (available at www.fao.org/fishery/statistics/software/fishstat/en)
Fernández-Polanco, J. & Llorente, I. 2015. Price transmission in the Spanish fresh wild fish market. Aquaculture Economics & Management, 19(1): 104–124.
Fernández-Polanco, J.M., Llorente, I., Luna, L. & Fernández Sánchez, J.L. 2012. El mercado de productos pesqueros en España: efectos de la crisis en la producción y el consumo. GLOBEFISH Research Programme, Vol. 106. Rome, FAO.
Gordon, D.V. & Hannesson, R. 1996. On prices of fresh and frozen cod fish in European and US markets. Marine Resource Economics, 11: 223–238.
Gordon, D.V. & Ssebisubi, M. 2015. Vertical and horizontal integration in the Uganda fish supply chain: measuring for feedback effects to fishermen. Aquaculture Economics & Management, 19(1): 29–50.
Gordon, D.V., Salvanes, K.G. & Atkins, F. 1993. A fish is a fish is a fish?: testing for market linkages on the Paris fish market. Marine Resource Economics, 8(4): 331–343.
Gudmundsson, E., Asche, F. & Nielsen, M. 2006. Revenue distribution through the seafood value chain. FAO Fisheries Circular No. 1019. Rome, FAO.
Guillotreau, P. 2004. How does the European seafood industry stand after the revolution of salmon farming: an economic analysis of fish prices. Marine Policy, 28(3): 227–233.
34
Guillotreau, P., Le Grel, L. & Simioni, M. 2005. Price-cost margins and structural change: sub-contracting within the salmon marketing chain. Review of Development Economics, 9(4): 581–597.
Instituto Nacional de Estadística (INE). 2015. Encuesta industrial de productos [online]. Madrid. (available at www.ine.es/pls/eip09/p_eip_consulta_normal.consulta?v_opcion=1&v_anno= 2008&v_datos=S04&v_idioma=s)
Jaffry, S. 2005. Asymmetric price transmission: a case study of the French hake value chain. Marine Resource Economics, 19(4): 511–523.
Jiménez-Toribio, R. & García-del-Hoyo, J.J. 2006. Evidence of market price leadership in the Spanish red seabream value chain: implications for fisheries management. Fisheries Research, 81(1): 51–59.
Jiménez-Toribio, R., Guillotreau, P. & Mongruel, R. 2010. Global integration of European tuna markets. Progress in Oceanography, 86(1–2): 166–175.
Johansen, S. 1988. Statistical analysis of cointegration vectors. Journal of Economic Dynamics and Control, 12: 231–254.
Johansen, S. 1991. Estimation and hypothesis testing of cointegration vectors in Gaussian vector autoregressive models. Econometrica, 59: 1551–1580.
Ministry of Agriculture, Food and Environment (MAGRAMA). 2012. Estadísticas pesqueras. In MAGRAMA [online]. Madrid. (available at www.magrama.gob.es/es/estadistica/temas/ estadisticas-pesqueras/)
Ministry of Agriculture, Food and Environment (MAGRAMA). 2015a. Precios origen-destino en alimentación. In MAGRAMA [online]. Madrid. (available at www.magrama.gob.es/ es/estadistica/temas/estadisticas-alimentacion/observatorio-precios/default.aspx)
Ministry of Agriculture, Food and Environment (MAGRAMA). 2015b. Panel de consumo alimentario (Food Consumption Panel). In MAGRAMA [online]. Madrid. (available at www.magrama.gob.es/es/alimentacion/temas/consumo-y-comercializacion-y-distribucion-alimentaria/panel-de-consumo-alimentario/)
Marcos-Pujol, J.M. & Sansa-Brinquis, P. 2007. Comercialización mayorista en España: la posición de la red de Mercas y el resto de canales. Distribución y Consumo, Marzo–Abril: 5–21.
Marshall, A. 1947. Principles of economics. London, Macmillan. Mercasa. 2015. La alimentación en España, 2014: productos de la pesca y la acuicultura [online].
Madrid. (available at www.mercasa-ediciones.es/alimentacion_2014/pdfs/pag_233-249 _producstos_pesca_y_acuicultura.pdf
Nielsen, M. 2004. International market integration and demand: an analysis of the Norwegian and Danish herring market. Food Economics, 1(3): 176–184.
Nielsen, M. 2005. Price formation and market integration on the European first-hand market for whitefish. Marine Resource Economics, 20(2): 185–202.
Nielsen, M., Smit, J. & Guillen, J. 2009. Market integration of fish in Europe. Journal of Agricultural Economics, 60(2): 367–385.
Nielsen, M., Setälä, J., Laitinen, J., Saarni, K., Virtanen, J. & Honkanen, A. 2007. Market integration of farmed trout in Germany. Marine Resource Economics, 22(2): 195–213.
Norman-López, A. 2009. Competition between different farmed and wild species: the US tilapia market. Marine Resource Economics, 24(3): 237–251.
Norman-López, A. & Asche, F. 2008. Competition between imported tilapia and US catfish in the US market. Marine Resource Economics, 23(2): 199–214.
Norman-López, A. & Bjørndal, T. 2009. Is tilapia the same product worldwide or are markets segmented? Aquaculture Economics & Management, 13(2): 138–154.
Norman‐Lόpez, A., Pascoe, S., Thébaud, O., Putten, I., Innes, J., Jennings, S., Green, B. & Plaganyi, E. 2014. Price integration in the Australian rock lobster industry: implications for management and climate change adaptation. Australian Journal of Agricultural and Resource Economics, 58(1): 43–59.
Okunade, E.O. 2007. Causality and price transmission between fish prices: new evidence from Greece and UK. European Journal of Social Sciences, 4(2): 147–159.
Quagrainie, K.K. & Engle, C.R. 2002. Analysis of catfish pricing and market dynamics: the role of imported catfish. Journal of the World Aquaculture Society, 33(4): 389–397.
35
Ravallion, M. 1986. Testing market integration. American Journal of Agricultural Economics, 68(2): 292–307.
Rodríguez, G.R., Bande, R. & Villasante, S. 2013. Origins matter: (no) market integration between cultured and wild gilthead sea bream in the Spanish seafood market. Aquaculture Economics & Management, 17(4): 380–397.
Sakai, Y., Nakajima, T., Matsui, T. & Yagi, N. 2012. Asymmetric price transmission in the Japanese seafood value chain: analyses focusing on six fish species. Workshop in FAO/NORAD value chain in small scale fisheries, 16th IIFET Conference, Dar es Salaam, the United Republic of Tanzania, 16–20 July 2012.
Schrobback, P., Pascoe, S. & Coglan, L. 2014. Impacts of introduced aquaculture species on markets for native marine aquaculture products: the case of edible oysters in Australia. Aquaculture Economics & Management, 18(3): 248–272.
Shirazi, A.H. & Moghaddasi, R. 2011. Price transmission and marketing margin in the Iranian fish markets. World Applied Sciences Journal, 13(8): 1901–1908.
Singh, K., Dey, M.M., Laowapong, A. & Bastola, U. 2015. Price transmission in Thai aquaculture product markets: an analysis along value chain and across species. Aquaculture Economics & Management, 19(1): 51–81.
Vinuya, F.D. 2007. Testing for market integration and the law of one price in world shrimp markets. Aquaculture Economics & Management, 11(3): 243–265.

I5955E/1/07.16