Embed Size (px)
Citation preview

2015/11/13 01
Case Studies of Optimizing Operation for Increased Energy Efficiency
Green Technologies Seminars16 November 2015
K. Nagata, Manager Marine and Industrial Service Department, ClassNK 1

2015/11/13 01
Contents
• Introduction
• ClassNK NAPA GREEN Overview
• Case Studies
• Conclusions
2

2015/11/13 01
Introduction
ECO‐Directions ‐Yes it is Ship Owners choice !
ECO Designs
Retrofitting of Eco Devices
Optimum Operation
How much “ECO” is your ship?You need a strong tool to validate
How you can achieve the optimum operation easily ?A comprehensive tool for awareness and utilization of potential saving areas .
3

2015/11/13 01
Introduction
• ClassNK and NAPA decided to develop new energy efficiency solutions “ClassNK‐NAPA GREEN” in 2012.
• Later ClassNK acquired NAPA, which enhanced the collaboration deal and further development.
• Through developing Dynamic Performance Model, we launched the highest quality and real beneficial software solutions for energy savings.
Our Mission‐For Owners and Operators :To reduce fuel costs and to make efficient operations.
4
2015/11/13 01
Following shipping company decided to adopt K Line Evergreen Wan Hai Lines Stena Line Bore LtdOther companies in the world have adopted.
Some shipyards have adopted for ; Adding green value on their new building ships Feedback to design by utilizing ship performance data in actual
sea conditions
R&D projects are undergoing total 6 ships with shipping companies and shipyards for proof of the solutions
Adoption of ClassNK-NAPA GREEN
5
Introduction

2015/11/13 01
Comprehensive solution using Dynamic Performance Model forsupporting ship operations and decision‐making
SEEMP Cycle
ClassNK NAPA GREEN Overview
6

2015/11/13 01
ClassNK NAPA GREEN OverviewDynamic Performance Model is the key for accuracy
Procedure 1. Data collected every 5
minutes2. Filtering data for analyzing3. Normalizing data by
removing effects of environmental factors such as wind & waves and by adjusting displacement
4. Creating ship performance curves
Speed‐Power‐RPM‐FOCResponse in wind and waves
7
2015/11/13 01
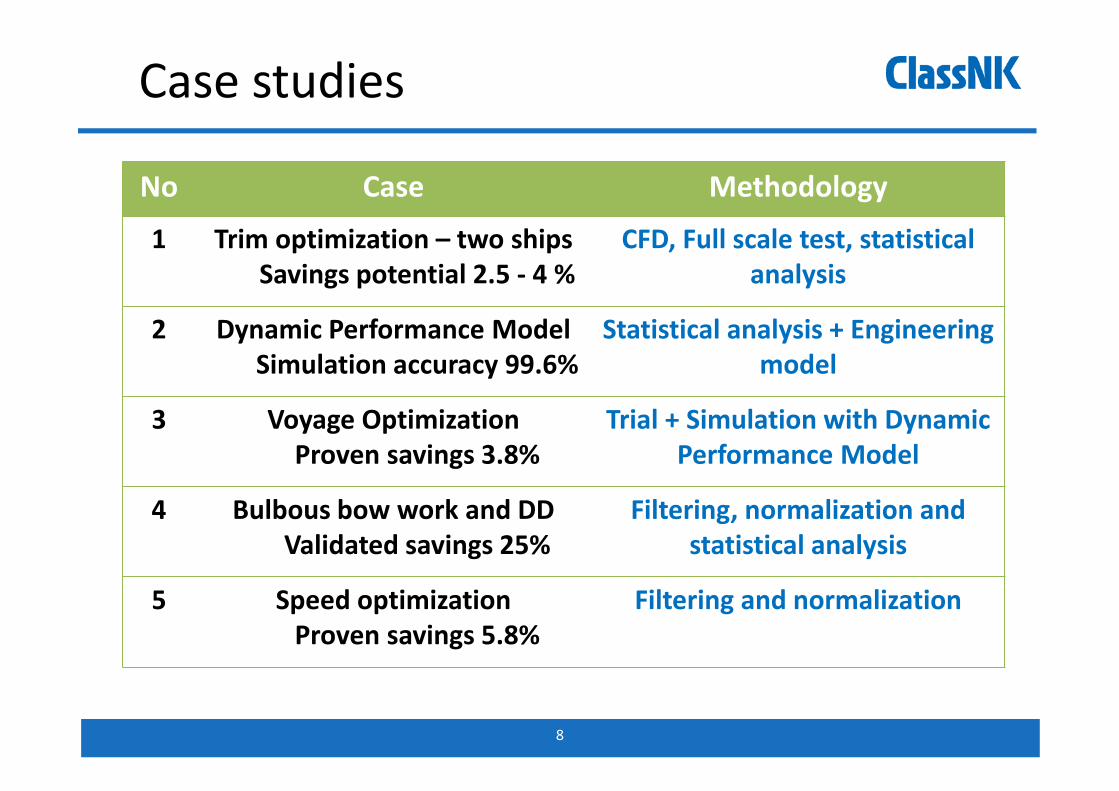
Case studies
No Case Methodology
1 Trim optimization – two shipsSavings potential 2.5 ‐ 4 %
CFD, Full scale test, statistical analysis
2 Dynamic Performance ModelSimulation accuracy 99.6%
Statistical analysis + Engineering model
3 Voyage OptimizationProven savings 3.8%
Trial + Simulation with Dynamic Performance Model
4 Bulbous bow work and DDValidated savings 25%
Filtering, normalization and statistical analysis
5 Speed optimizationProven savings 5.8%
Filtering and normalization
8

2015/11/13 01
1. Trim optimization‐ 2.5 to 4%
• Make CFD analysis for initial trim curves• Make full scale trim test
– statistical analysis of full scale measurements
• Verify trim curves and tune as needed• Do operational profile study and calculate savings potential
• Results are accurate because trim curves are accurate.
Methodology
9

2015/11/13 01
Full scale verification8000+ TEU #1
• CFD done on generic hullform
• 2 x full scale tests done• At 20kn speed, only full
scale show that aft trim is also optimal
8000+ TEU #2• CFD done on actual
hullform• 1 x Full scale verification
done• CFD matches full scale quite
well Aft trim is optimal
Aft trimAft trimFore trimFore trim
CFD scaleFull scale
Aft trimAft trimFore trimFore trim
scaleFull scale
CFDCFD
1. Trim optimization
10
Trim [m]Trim [m]
Power Index
Power Index

2015/11/13 01
Trim optimization potential
8000+ TEU #1
• Trim optimization potential is ~4%.
8000+ TEU #2
• Trim optimization potential is ~2.5%.
Trim distribution last 6 months
Opt
imal
tri
m
Opt
imal
tri
m
Trim distribution last 8 months
1. Trim optimization
11

2015/11/13 01
Statistical analysis of
prediction error
Actual performance of
the ship
Compare
8000+ TEU #18000+ TEU #1Original
engineering model
Original model Optimization AccuracySpeed: 4.5 %FOC: 19.7 %
FOC = Fuel Oil Consumption
Dynamic Performance
Model8000+ TEU #1
DPM Optimization AccuracySpeed: 1.9 %FOC: 0.4 %
Simulation Accuracy is 99.6%2. Dynamic Performance Model
Methodology
12

2015/11/13 01
8000+ TEU full scale results for ~4% proven savings in one voyage
3. Voyage Optimization
13

2015/11/13 01
• Make accurate Dynamic Performance Model– Fuel consumption accuracy 99.6%
• Define reference voyage (Captain’s plan)
• Sail trial voyage with system
• Simulate reference and trial voyage fuel consumption
• Compare results 3.8% reduction in fuel consResults are comparable because Dynamic Performance Model is accurate
3. Voyage OptimizationMethodology
14

2015/11/13 01
Full scale VO trial 8000+ TEU Results• Mediterranean/Europe route
– Speed optimization2.67%– Trim optimization 1.16%
0.219
0.236
0.206
0.210
0.214
0.218
0.222
0.226
0.230
0.234
0.238
Trial voyage Reference voyage+7.19%
mt/nm
Simulated FOC/nm
3. Voyage Optimization
15
3.8% from voyage optimization
3.1% from early departure
3.8%

2015/11/13 01
• Speed optimization means optimal ConstantRPM speed profile and minimum pocket time (proven savings)
• Trim optimization means sailing on more optimum trim (proven savings).
• Weather routing is not included in this specific case
3. Voyage Optimization
Voyage optimization proved effective even when this ship was slow streaming at 16Knots
16
Full scale VO trial 8000+ TEU Results

2015/11/13 01
• Collect data from ship– Before drydock– After drydock
• Filter, normalize, statistical analysis
• Observe effect on power index
• Calculated fuel savings 25%
4. Bow Modification and Drydock
17

2015/11/13 01
Effect of bulb change and dry docking (hull and propeller cleaning)
Power index beforedry dock and bulb
change
Power index AFTERdry dock + bulb change
25% reduction in fuel consumption
4. Bow Modification and Drydock
18

2015/11/13 01
• Install systems– Trim and Displ. Optimization– Voyage Optimization– Voyage Reporting– Real Time Monitoring– Office web portal– Analysis service
• Did reference period 2 months
• Did trial period 3 months
Fuel Savings 5.8%
Source: RoRo Shipping Conference 2013, Copenhagen, Denmark
5. Speed Optimization
0.068 t/nm 0.065 t/nm
19
2015/11/13 01
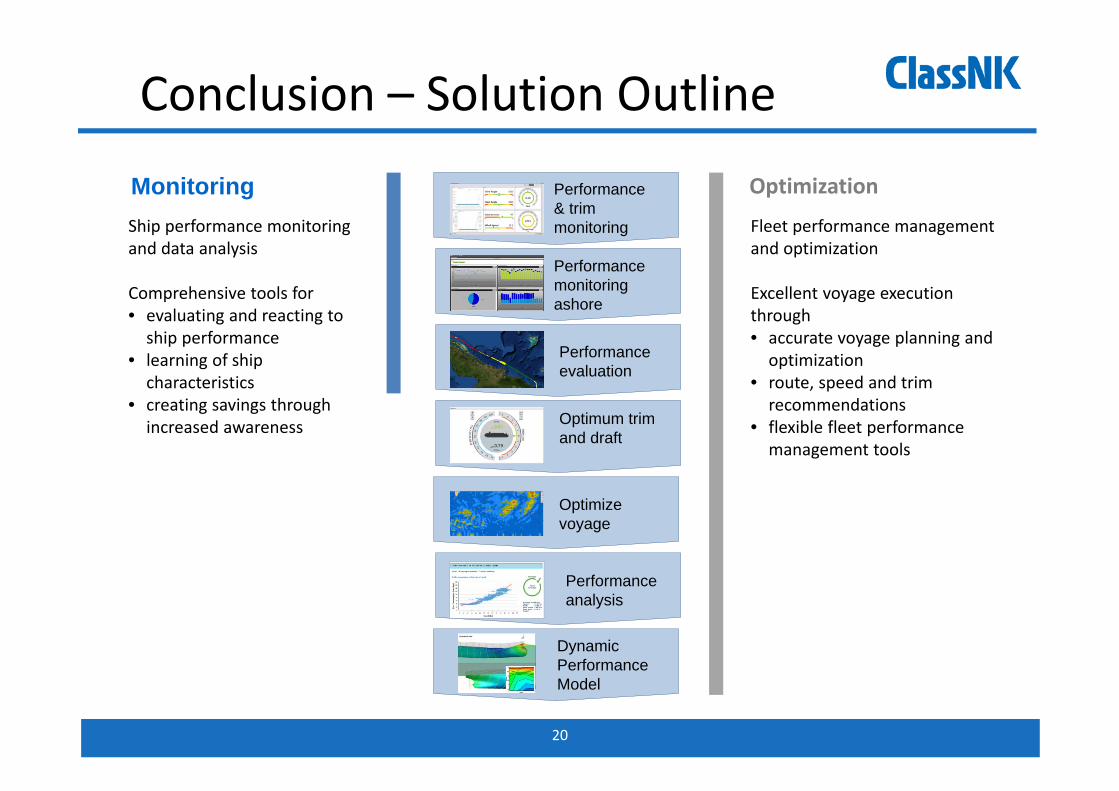
MonitoringShip performance monitoring and data analysis
Comprehensive tools for • evaluating and reacting to ship performance
• learning of ship characteristics
• creating savings through increased awareness
Fleet performance management and optimization
Excellent voyage execution through• accurate voyage planning and optimization
• route, speed and trim recommendations
• flexible fleet performance management tools
OptimizationPerformance & trim monitoring
Performance evaluation
Performance monitoring ashore
Performance analysis
Optimum trim and draft
Optimize voyage
Dynamic Performance Model
Conclusion – Solution Outline
20

2015/11/13 01
CPU (2pcs), Network Switch, UPS
In Bridge Ship’s communication system to be used
21
Conclusion – Image View

2015/11/13 01
Inclino meter
Motion sensor(option)
Junction BoxMidship/Center Line/Upper Deck position
22
Conclusion – Image View

2015/11/13 01
Torque Meter
FO Flow Meter
Interface with VDR & Data Logger
E‐mail communication & ship’s LAN
23
Conclusion – Necessary Equipment

2015/11/13 01
Effective analysis of data is one of the key for energy efficiency in operation and further decision making.
Technology has grown to hold hands with Captain for finding the optimum speed and route with just in time arrival.
Energy Management Awareness for both crew and shore personnel is facilitated by using effective tools.
Still much of the trim saving potential is unutilized by ships which has to be reaped for efficient operations.
Fuel saving software ClassNK NAPA Green case studies showed very good results.
Conclusion
21

2015/11/13 01
For Your Kind Attention
ClassNK Hong KongTEL: +852‐2517‐7023
E‐Mail: [email protected]
ClassNK Consulting Service Co., Ltd.TEL: +81–3–5226–2290
E‐Mail: [email protected]
NAPA Group, FinlandTEL: +358–9–22–813–1E‐Mail: [email protected]
For more information please contact :
25