Embed Size (px)
Citation preview
U.S Departmentof Transportation
Research andSpecial ProgramsAdministration
Case Studies of Market Researchfor Three TransportationCommunication ProductsMarch 1994
Prepared by:
Thomas R. Parish
Arthur D. Little, Inc.Cambridge, Massachusetts
Prepared for:
Economic Analysis DivisionJohn A. Volpe National Transportation Systems CenterCambridge, Massachusettsand
Office of Policy DevelopmentFederal Highways AdministrationWashington, D.C.
The following is one of a series of papers developed or produced by the EconomicAnalysis Division of the John A. Volpe National Transportation Systems Center aspart of its research project looking into issues surrounding user response and marketdevelopment for selected Intelligent Vehicle-Highway Systems (IVHS) products orservices. The project, sponsored by the Federal Highway Administration’s Office ofPolicy Development, was one part of FHWA’s 1992 Institutional Issues Programentitled - “Public Acceptance and Markets for Various Consumer IVHS Services”.John O’Donnell of the Volpe Center and James March of FHWA served as ProjectManagers for their organizations.
The objective of the Volpe Center project was to better understand factors affectingthe development and deployment of selected advanced traveler information productsand services (ATIS). The Center addressed the objective by examining thedevelopment of markets for selected ATIS-related products and services andreviewing factors affecting the public acceptance and user response to existing trafficinformation services.
Deployment of many of the newly emerging and projected M-IS products andservices will depend upon consumers purchasing and otherwise choosing to makeuse of advanced traffic and travel information products and services. Through fourdifferent projects, each with a distinctive approach to understanding consumerresponse and market demand, the Volpe Center explored the question: Given theopportunity to buy a product or subscribe to a service that promises to delivertraveler information, will the consumer perceive that there is sufficient benefit to begained to justify the investment?
The Volpe Center and FHWA jointly conducted a workshop in the Fall of 1992 todiscuss issues involved with assessing the market for IVHS products and services.The objectives of the workshop were to help define a research program which wouldaddress measuring user acceptance and response to ATIS products and services andthe role market research plays in understanding emerging markets for new orunknown products and services.
The results of the workshop are reflected in the four research tasks initiated as part ofthis program and the seven papers which comprise it. The four task areas aresummarized below. Copies of the papers will be provided upon request to the VolpeCenter.
i
TASK 1. Industry Methods for Assessing Consumer Response to NewProducts/Services
The first project was designed to answer the question of how consumer response andmarket demand are measured in the commercial sector, where these market demandquestions are fundamental to the survival and success of the business. This projecthas two parts. The first is a primer on how consumer marketing research is done inthe commercial sector. The second presents three case studies that examine howthree current high-technology communications and travel products applied marketingresearch in preparation for market release.
Report 1A. A Primer on Consumer Marketing Research: Procedures, Methods, andTools
The Volpe Center developed a marketing research primer which provides a guide tothe approach, procedures, and research tools used by private industry in predictingconsumer response. The final two chapters of the primer focus on the challenges ofdoing marketing research on “revolutionary” products, or those products which theconsumer has had no direct experience with, as is the case with most IVHS productsand services. This primer was designed to provide the non-marketing researcherwith a good understanding of how this particular type of human behavior research ispursued.
Report 1B. Case Studies of Market Research for Three TransportationCommunications Products: Electronic Toll Collection, AdvancedVehicle Information and Location, and Cellular Telephones
Three case studies were undertaken to demonstrate the application of marketingresearch to products which are analogous to ATIS products and services, to learnfrom the market experience of these three ATIS-analogous products any lessonswhich might be applicable to future ATIS research, and also to demonstrate theuncertainty - despite good research design and assumptions - of marketing researchpredictions. The case studies were written by Thomas Farish of Arthur D. Little, Inc.
TASK 2. ATIS Market Research: A Survey of Operational Tests and UniversityResearch
The challenge of marketing research is much more difficult where the consumer hasnot had direct personal experience using the proposed product in daily life. Theoperational tests provide an excellent opportunity for gathering consumer responseand market demand information from “experienced” consumers. The Volpe Centerteam surveyed the operational tests that were extant or complete (as of 8/93) to learnwhether any consumer response/market demand information had been collected and
ii
analyzed. The survey was extended to include government-sponsored universityresearch projects so as to provide a more complete overview of the current nationalresearch program in relation to this question.
TASK 3. A Market Analysis of the Commercial Traffic Information Business
What kind of traffic information is available to consumers right now? How doconsumers respond to current offerings? What are the market/economicfundamentals that underlie this market?
The traffic information services business is well-established and a study of its marketfundamentals yields insight into consumer response to ATIS as well as providinguseful information to policy makers who are considering the future role ofgovernment in this arena. This report describes how traffic information is gathered,processed, packaged, wholesaled, and retailed on the variety of platforms which areavailable on the market today.
TASK 4. Laboratory Simulation of ATIS for Testing Drivers’ Response
This project was formulated to explore the feasibility of enhancing existing laboratoryor PC-based driver decision simulators which have the ability to gather revealedpreference data and test drivers’ decisions in the presence of traffic information.Such simulators, it was hypothesized, could supplement operational tests as a sourceof consumer response and market demand data. The work was performed at MITunder the leadership of Professor Moshe Ben-Akiva.
Report 4A. State of the Art of ATIS Driver Simulators
The project was divided into three parts. The first, covered in this report, reviewedall existing driver simulators to learn whether any were sufficiently sophisticated tobe used, as is, to reliably test drivers’ response to traffic information.
Report 4B. A Review of ATIS Operational Tests
The design of any laboratory-based simulator is based upon a model of howindividuals respond to stimulus, in this case ATIS products. To construct a model,one must first study the natural behavior of live subjects in an actual ATIS drivingsituation. Report 4B looks to the existing and completed ATIS operational tests tolearn whether data has been produced that is suitable for the purposes of developingor improving ATIS models.
iii

Report 4C. A Modeling Framework for User Response to ATIS
This report focuses on the information required to support the development of amodeling framework for driver response to ATIS. In it, the author identifies thestages of user response to ATIS, outlines the key factors associated with eachdecision, and discusses the data which would be required to complete the model, andthus construct a reliable, durable driver simulator.
iv
Table of Contents
Introduction
Electronic Toll Collection Case Study
Cellular Communications Case Study
Automatic Vehicle Identification/Location Case Study
Application to ATIS
List of Figures
Figure
1 Survey Research: Illustrative Studies and Pricing Parameters
2 IBTTA ETC Survey Results
3 U.S. Companies Active in ETC
4 Market Research Focus
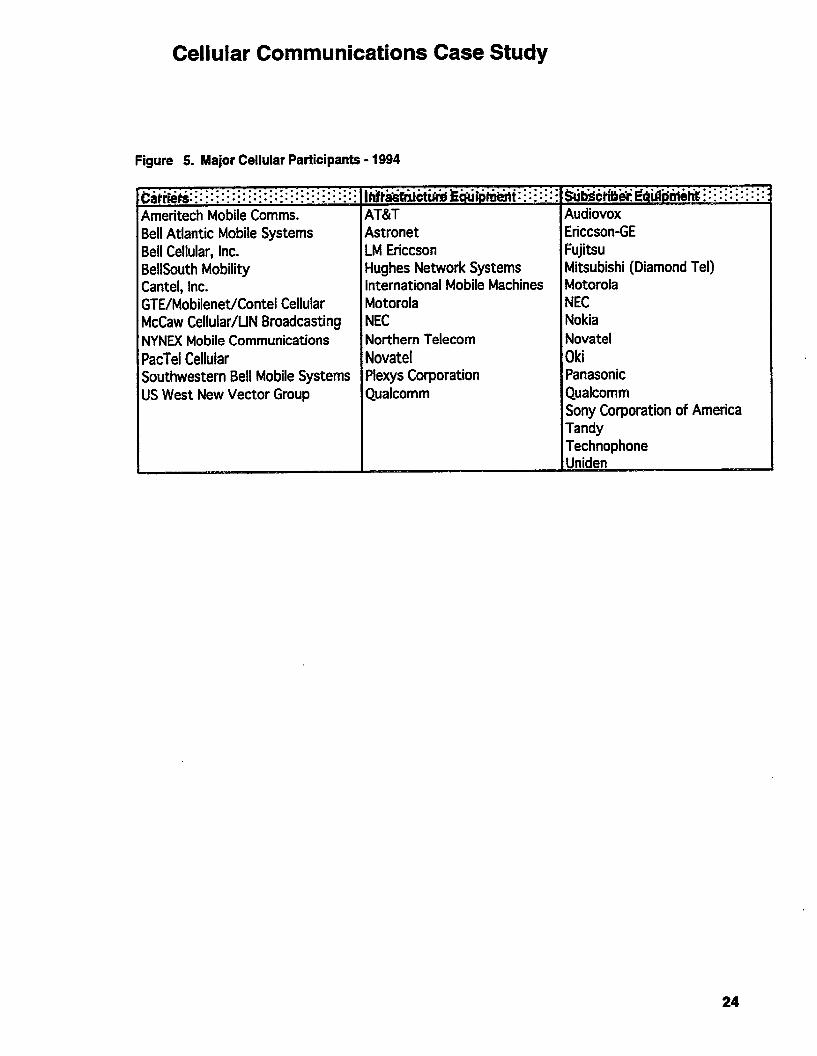
5 Major Cellular Participants 1994
6 Forecast of Cellular Subscribers
7 Occupations of Interest
8 PREDCT Model Impacting Factors
9 Total U.S. Cellular Subscribers
10 AVI/L Service Characteristics
11 Providers of AVI/L Services in the U.S.
12 The Commercial Truck Market for Class 6,7, and 8 Trucks
13 Chains of Customers
14 Categories of Customer Needs
Page
1
6
23
37
52
Page
2
7
8
10
24
25
29
31
33
38
39
45
56
57
Introduction
Background
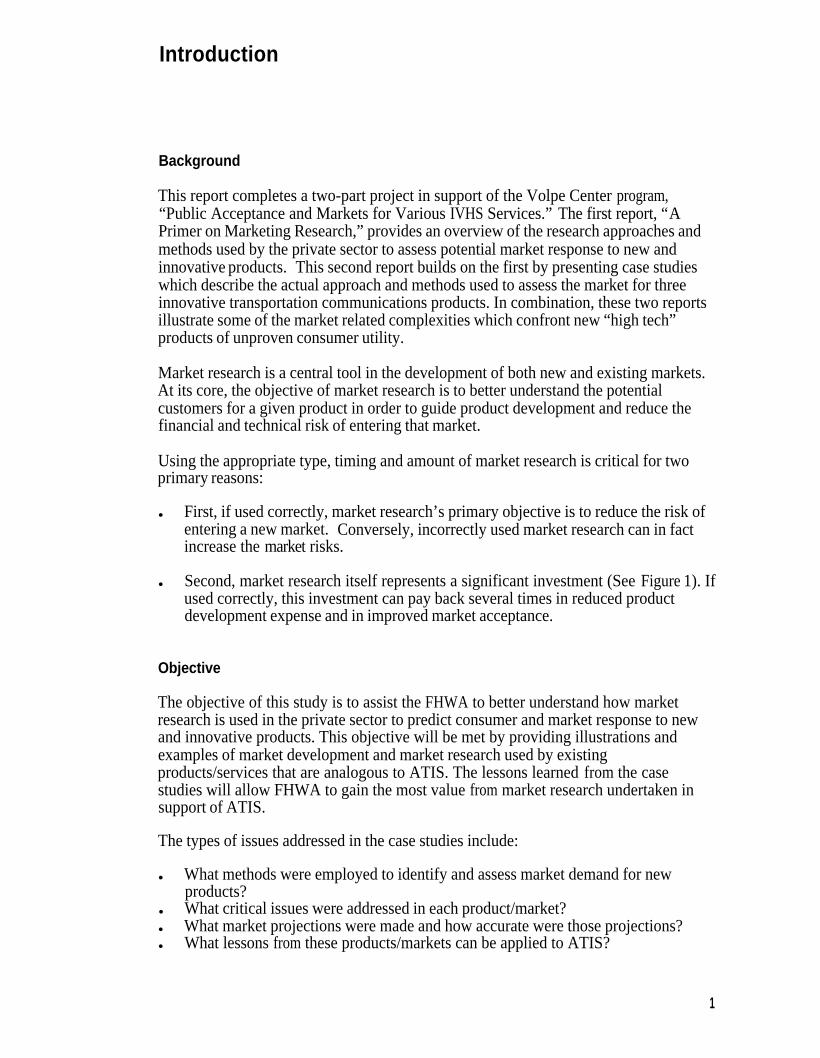
This report completes a two-part project in support of the Volpe Center program,“Public Acceptance and Markets for Various IVHS Services.” The first report, “APrimer on Marketing Research,” provides an overview of the research approaches andmethods used by the private sector to assess potential market response to new andinnovative products. This second report builds on the first by presenting case studieswhich describe the actual approach and methods used to assess the market for threeinnovative transportation communications products. In combination, these two reportsillustrate some of the market related complexities which confront new “high tech”products of unproven consumer utility.
Market research is a central tool in the development of both new and existing markets.At its core, the objective of market research is to better understand the potentialcustomers for a given product in order to guide product development and reduce thefinancial and technical risk of entering that market.
Using the appropriate type, timing and amount of market research is critical for twoprimary reasons:
l First, if used correctly, market research’s primary objective is to reduce the risk ofentering a new market. Conversely, incorrectly used market research can in factincrease the market risks.
l Second, market research itself represents a significant investment (See Figure 1). Ifused correctly, this investment can pay back several times in reduced productdevelopment expense and in improved market acceptance.
Objective
The objective of this study is to assist the FHWA to better understand how marketresearch is used in the private sector to predict consumer and market response to newand innovative products. This objective will be met by providing illustrations andexamples of market development and market research used by existingproducts/services that are analogous to ATIS. The lessons learned from the casestudies will allow FHWA to gain the most value from market research undertaken insupport of ATIS.
The types of issues addressed in the case studies include:
l What methods were employed to identify and assess market demand for newproducts?
l What critical issues were addressed in each product/market?l What market projections were made and how accurate were those projections?l What lessons from these products/markets can be applied to ATIS?
1
Introduction
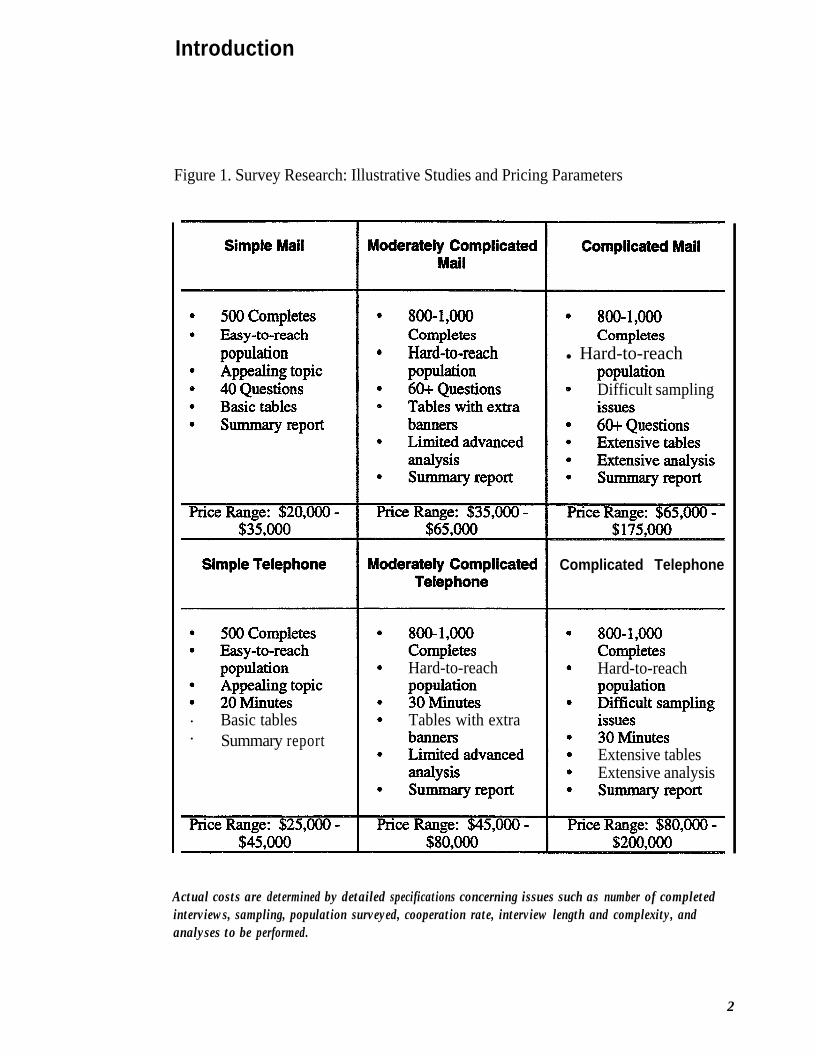
Figure 1. Survey Research: Illustrative Studies and Pricing Parameters
l Hard-to-reach
Difficult sampling
Complicated Telephone
Hard-to-reach Hard-to-reach
. Basic tables Tables with extra
. Summary reportExtensive tablesExtensive analysis
Actual costs are determined by detailed specifications concerning issues such as number of completedinterviews, sampling, population surveyed, cooperation rate, interview length and complexity, andanalyses to be performed.
2
Introduction
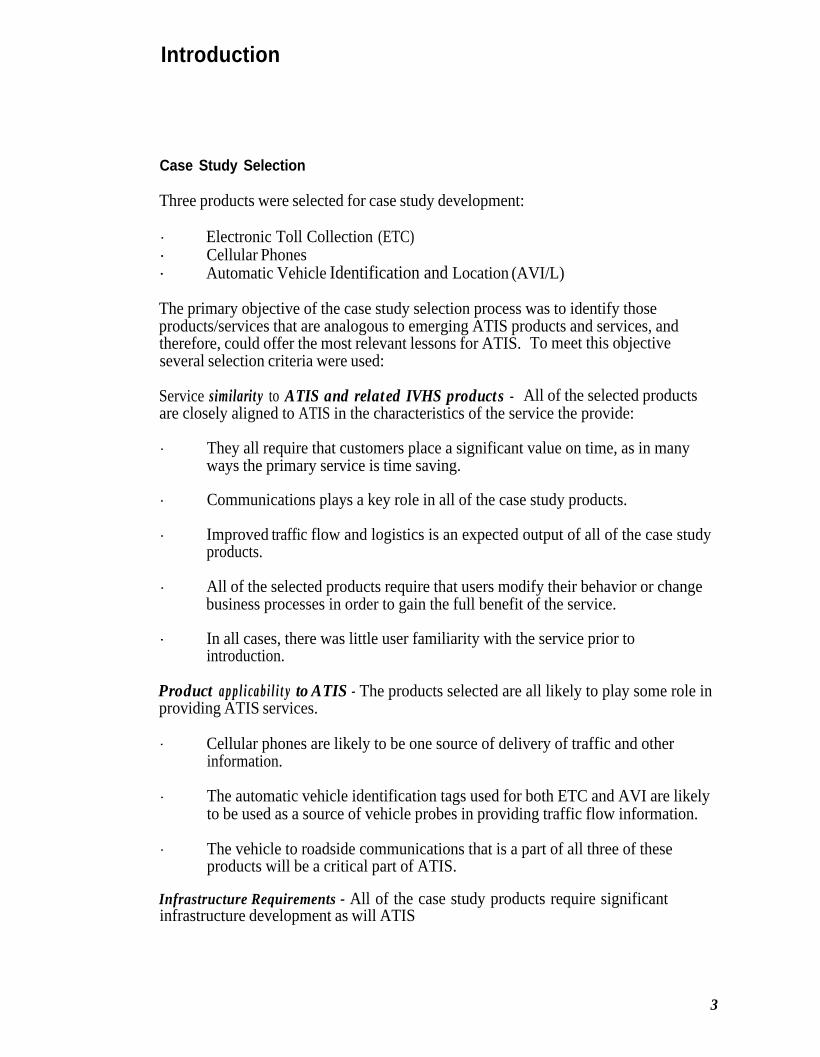
Case Study Selection
Three products were selected for case study development:
. Electronic Toll Collection (ETC)
. Cellular Phones
. Automatic Vehicle Identification and Location (AVI/L)
The primary objective of the case study selection process was to identify thoseproducts/services that are analogous to emerging ATIS products and services, andtherefore, could offer the most relevant lessons for ATIS. To meet this objectiveseveral selection criteria were used:
Service similarity to ATIS and related IVHS products - All of the selected productsare closely aligned to ATIS in the characteristics of the service the provide:
. They all require that customers place a significant value on time, as in manyways the primary service is time saving.
. Communications plays a key role in all of the case study products.
. Improved traffic flow and logistics is an expected output of all of the case studyproducts.
. All of the selected products require that users modify their behavior or changebusiness processes in order to gain the full benefit of the service.
. In all cases, there was little user familiarity with the service prior tointroduction.
Product applicability to ATIS - The products selected are all likely to play some role inproviding ATIS services.
. Cellular phones are likely to be one source of delivery of traffic and otherinformation.
. The automatic vehicle identification tags used for both ETC and AVI are likelyto be used as a source of vehicle probes in providing traffic flow information.
. The vehicle to roadside communications that is a part of all three of theseproducts will be a critical part of ATIS.
Infrastructure Requirements - All of the case study products require significantinfrastructure development as will ATIS
3
In addition to offering direct product insight into the market for ATIS, the case studieswere selected to offer examples of a range of different market characteristics such as:
Range of Customer FOCUS - ATIS services are likely to be aimed at a wide range ofcustomer groups, from purely consumer to purely commercial. In selecting the casestudies a balance was drawn between these basic market types:
. ETC has both consumer market and commercial market characteristics.
. Cellular phones are primarily a consumer market.
. AVI/L is a nearly pure commercial market.
Range of product/market maturity - The selected products represent a range ofproduct/market maturity. This allows insight into what issues/problems might beexpected at different points in the development of ATIS:
. The market for ETC is embryonic, with relatively few full scale applications.As a result this market is characterized by substantial variation in technology,with little standardization and little price competition.
. The market for cellular phones is mature. It is characterized by strong pricecompetition and attempts to differentiate through productenhancements/upgrades.
0 AVI/L is difficult to characterize. It has been in existence for a long time, buthas never reached the level of technical or market success necessary to becharacterized as a mature market.
Range of market success - The case study products were also chosen to provide arange of market success.
. ETC is too early to gage the likely success of the market, but all indications arefavorable.
. Cellular phones represent a clear market success.
. AVI/L would have to be labeled a “limited” success to date. Its future success isstill unclear.
4
Introduction
Report Organization
Following this introduction, the report will consist of two major sections; presentationof the case studies, and a discussion of the applicability to ATIS.
The individual case studies have been organized to be as consistent as possible in theissues addressed and the order in which those issues are addressed. However, due tothe differences in the nature of several of the case study products/markets, there is somedeviation from the common organizational structure.
For each of the products/services, the case study describes:
1) Market Background - This section provides a brief description of the products, ahistory of the market/technology development and the leadiig participants.
2) Market Assessment Methodology - The core of each case study is a descriptionof the approaches used to assess the market. The subsections within this sectionfollow a typical process used in market assessment, including:
. Customer Needs Assessment
. Assessment of Customer Willingness to Pay
. Assessment of Expected Market Size and Penetration Bates
. Evaluation of Market Segmentation Efforts
. Analysis of Expected Profitability
. Analysis of How Market Risks were Assessed.
3) Actual Market Development - This section provides an analysis of the actualpath of market development and the differences from the expected development.
4) Lessons Learned - The lessons that were learned from analysis of theexperiences of that product/service are discussed.
The report concludes with a discussion of how the lessons that were learned in each ofthe case studies can be applied to ATIS. This section will discuss not only the lessonslearned from the three case studies, but also the additional insights that have beengained from the authors work in market research in other markets.
5
Electronic Toll Collection Case Study
Market/Product Background
Electronic Toll Collection (ETC) refers to technologies that allow automatic paymentof tolls through a system consisting of three basic components:
. An electronic vehicle identification tag/transponder,
. A vehicle/roadside communications system (interrogator), and
. Logic/computing capability to calculate and deduct the required toll from a useraccount.
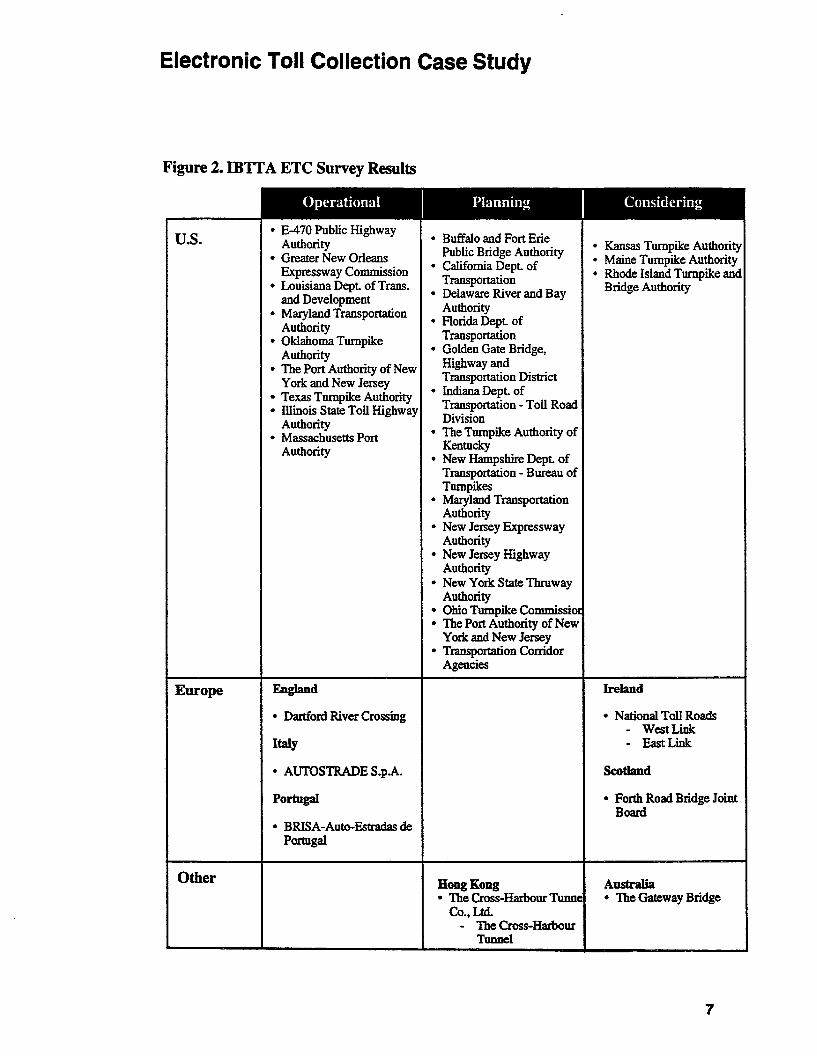
ETC is one of the fastest growing applications of IVHS technologies. According to a1992 International Bridge, Tunnel & Turnpike Association survey at least seven ETCsystems are operational in the U.S., along with three operating in Europe. The samesurvey cites 17 agencies that are planning ETC systems and four others that are“considering” systems (See Figure 2).
In the U.S., the Dallas North Tollway was one of the first applications of ETC, startingin July of 1989. This 17-mile tollway has 60 electronic toll lanes covering 14 tollcollection stations. More than 19,000 “Tolltags” are in active use. Vehicles equippedwith a “Tolltag” represent roughly 20% of vehicles served in peak commuting times.Over 30,000 electronic toll transactions (roughly 28%) are handled per day.
The pioneer developer of ETC applications was Amtech of Dallas, Texas. Amtechinstalled the first U.S. system in Dallas and remains the clear leader in installed base ofETC systems. Amtech was established as a commercial entity in 1983. The companywas formed to commercialize an electronic radio frequency identification technologythat was developed at Los Alamos National Lab from 1971 to 1983. The developmentwork was supported by both the Department of Agriculture (to allow it to track andrecord information from livestock) and the Department of Energy (to provide anautomated method of controlling vehicle access to secure facilities and to track vehicleshauling hazardous waste). The first tests of the auimal tracking system started in 1976.The first application of the vehicle identification system was installed in 1979. By1980, the technology had been proven and successfully tested. At that point, thegovernment began to reduce its funding in anticipation of commercialization, whichoccurred with the establishment of Amtech in 1983.
The first market addressed by Amtech was the transport industry where its technologyis used to identify and track vehicles and containers in rail, shipping, and truckingapplications. Amtech has been particularly successful in the rai l industry, where itstags were selected as an industry standard by the American Association of Railroads.Amtech’s first ETC application was the Dallas North Tollway mentioned above.
Electronic Toll Collection Case Study
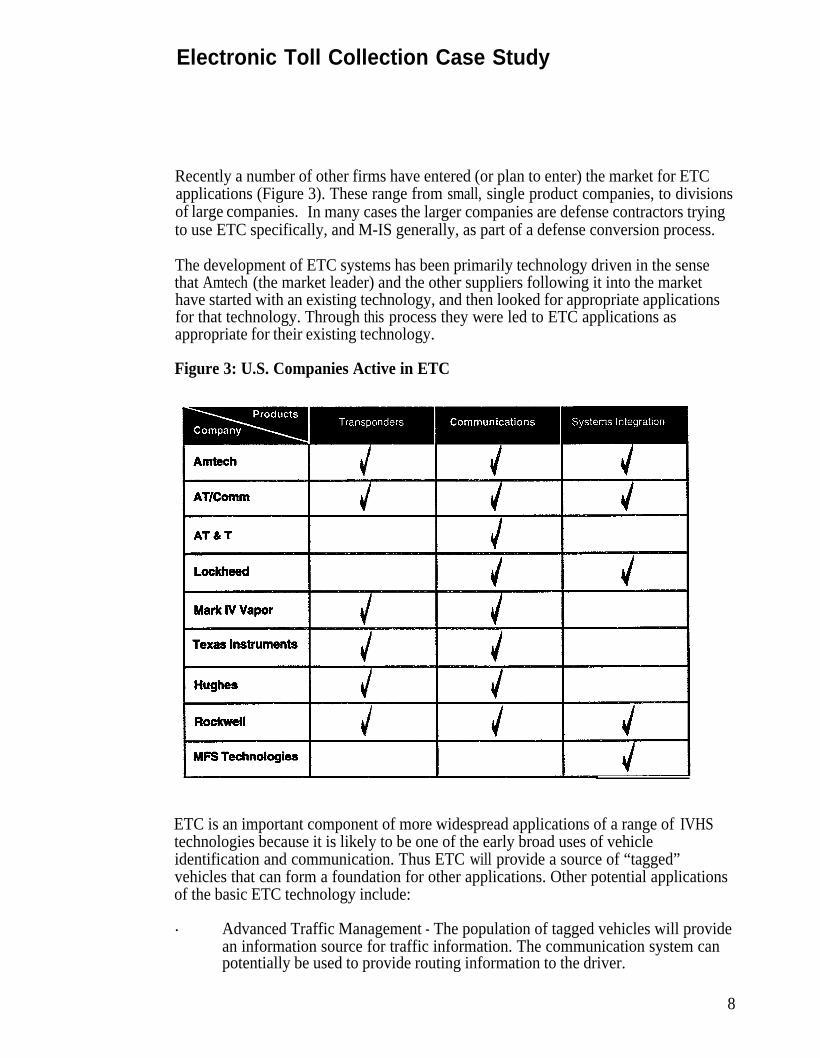
Recently a number of other firms have entered (or plan to enter) the market for ETCapplications (Figure 3). These range from small, single product companies, to divisionsof large companies. In many cases the larger companies are defense contractors tryingto use ETC specifically, and M-IS generally, as part of a defense conversion process.
The development of ETC systems has been primarily technology driven in the sensethat Amtech (the market leader) and the other suppliers following it into the markethave started with an existing technology, and then looked for appropriate applicationsfor that technology. Through this process they were led to ETC applications asappropriate for their existing technology.
Figure 3: U.S. Companies Active in ETC
ETC is an important component of more widespread applications of a range of IVHStechnologies because it is likely to be one of the early broad uses of vehicleidentification and communication. Thus ETC will provide a source of “tagged”vehicles that can form a foundation for other applications. Other potential applicationsof the basic ETC technology include:
. Advanced Traffic Management - The population of tagged vehicles will providean information source for traffic information. The communication system canpotentially be used to provide routing information to the driver.
8
Electronic Toll Collection Case Study
. Automatic payment for parking, gasoline, or other services
. Emergency assistance calls (panic button)
. Enhanced vehicle security/theft prevention and recovery systems
From a market development and market research perspective, ETC provides a uniqueillustration of market structure and the complications that arise from the existence oftwo distinct levels of customer groups. While cellular phones are primarily a consumerproduct and AVI/L is a nearly pure commercial market, ETC has aspects of both. Thisdichotomy can create difficulties in both product development and marketing, as thedifferent customer groups may have unique and in some cases conflicting requirements
. Commercial Aspect of ETC - The toll authorities are the primary customer forthe system in total. They are certainly the customer for elements such as the tollplaza hardware, the communications system, and the accounting intelligence.They may also be the primary customer for the vehicle tags. The companiesdeveloping systems for this market must understand and respond to therequirements of the toll authorities. The requirements of the toll authorities wiIlbe driven primarily by their operational responsibilities and, therefore, will besimilar in nature to the requirements of commercial customers in other markets.
. Consumer Aspect - While the toll authorities are the customer for many aspectsof ETC, the consumer is the customer for the service provided and, in manycases, for the vehicle tag itself. Ensuring that the needs of the consumer aremet is the joint responsibility of the toll authority and the system supplier.Ultimately, it is consumers who will determine the success of ETC through theiracceptance or rejection of the characteristics of the service and equipment that isprovided.
In addition to the toll authorities, which represent primarily commercial requirements,and the end-users which represent the consumer requirements, there is in fact a thirdgroup that must explicitly account for both sets of requirements. These customers arethe future operators of private toll roads, such as the California SR-91 project and asimilar project in Toronto. In this case, the companies that are funding and operatingthese roads must account for both the commercial and the consumer aspects in order toassure themselves that the use of ETC equipment does not inhibit their ability to meettheir required traffic volume levels.
This characteristic of the ETC market makes the lessons learned and approaches takenin ETC particularly applicable to ATIS, as there is likely to be a similar situation ofmultiple levels of customers. The state D.O.T.s are likely to be the customer for theATIS infrastructure and systems, while the consumer will be the customer for theservice/information provided as well as any in-vehicle hardware that may be required.
9
Electronic Toll Collection Case Study
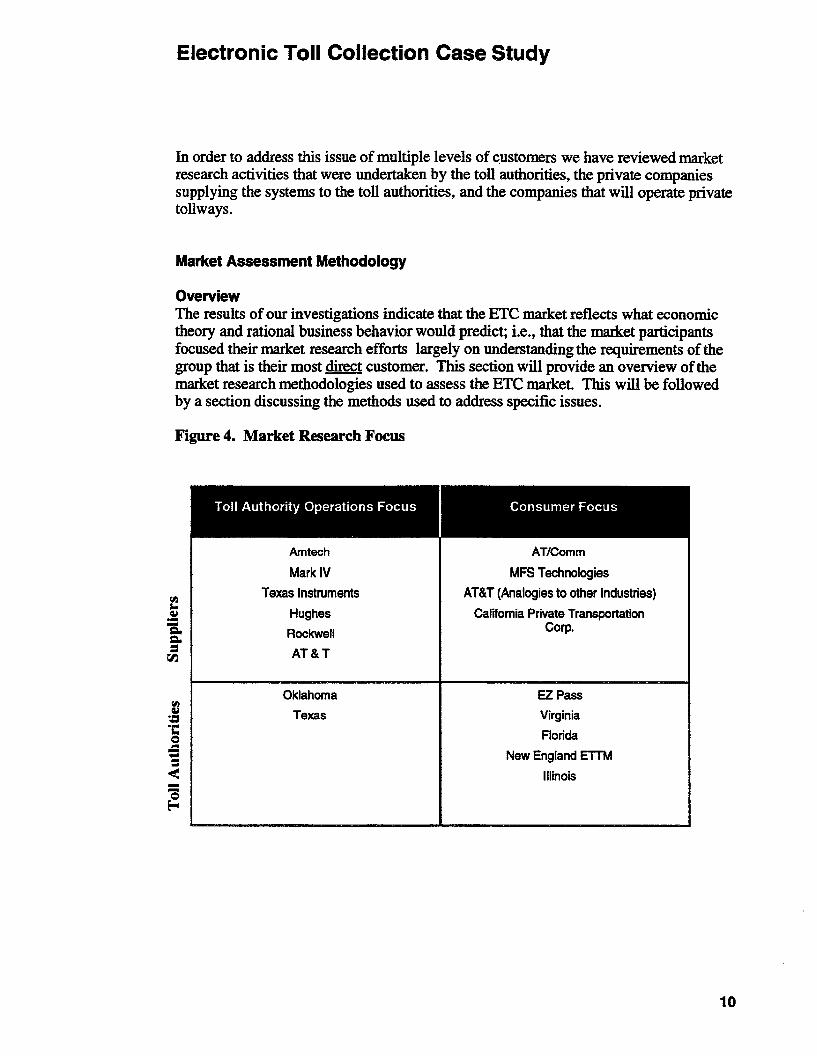
Toll authority focused market research. Most of the hardware suppliers focusedtheir market research on understanding the needs of the toll authorities, in order toallow them to develop and market their systems based on meeting the operationalrequirements of the toll authorities.
. Amtech - As mentioned above, Amtech was the pioneering company in thismarket. ETC was one of several transportation based markets that Amtechpursued as expansion opportunities for its identification technology. Thesearch for other applications started with an in-house market assessment studyto identify the range of markets that might require remote identification ofobjects and direct entry of the information into a computer. This projectsegmented the potential opportunities by assessing the market needs andpotential market size represented by each industry. The result of the project wasto identify shipping, trucking, railroads as the most attractive initialapplications, with ETC identified as a focus for a second “wave” of applications.A key selection criteria was total market size. The target markets were selectedlargely because they were all quite large, thus, the opportunity for substantialvolume existed even if Amtech could achieve only a relatively small marketshare.
As it was one of the first suppliers in the market, Amtech was faced with thetask of selling the concept of ETC as well as the performance of their particularproduct. Therefore it focused its marketing efforts on convincing the tollauthorities of the potential to increase revenue through the use of these products.Amtech also spent a great deal of effort working with standards organizations,in an attempt to have its system established as a de facto standard. This lastfocus was an attempt to repeat a strategy that had been successful in the railindustry. Even today Amtech does no end-user research prior to contractawards, depending on the toll authorities and “peer pressure” to induceconsumers to actually buy and use the tags.
. Texas Instruments/Mark IV Vapor /AT&T/Hughes/Rockwell - With Amtechhaving established the market and to a large degree the concept of ETC, anumber of companies have attempted to enter the ETC market as an extensionof existing products, technologies, or capabilities developed for other markets.In the case of Hughes and Rockwell, the movement into ETC and other IVHStechnologies has been an attempt at diversification out of the defense industry.Few within this group of companies have much consumer product experience,consequently, they have largely addressed the market from the side of the tollauthority. The efforts of Hughes and Rockwell are representative. Rather thanspeaking directly with the toll authorities, Hughes took the “expert” route. Ithired a retired state transportation executive as a consultant to act as a proxy for,and provide input on the needs of the toll authorities. Rockwell took a moredirect route, conducting au in-house telephone and in-person interview surveywith “working level” people at the state D.O.T.s in order to understand theirissues and requirements. MFS Technologies hired a market research firm toconduct a formal telephone survey of toll authorities, bridge authorities, and
11
Electronic Toll Collection Case Study
state D.O.T.s to define their level of understanding of ETC and other IVHStechnologies and directions that were likely to be taken at the various stateD.O.T.‘s.
. Toll Authorities - Two of the toll authorities surveyed looked primarily at theirown internal operational requirements to determine whether they should investin electronic toll collection systems. Both Oklahoma and the Texas TurnpikeAuthority did no significant end-user research. Oklahoma Turnpike Authoritydid run several focus groups to gauge the reception of the general concept ofETC, but did not explore operational details: The rationale was that the ETCsystems would pay back at very low participation rates, therefore additionalresearch was not required. This expectation was borne out in practice.Oklahoma set a goal of issuing 15,000 “PIKEPASSes” in the first year, and theobjective was met even before the system was put into operation. At the end ofthe first year of operation Oklahoma had issued nearly 100,000 “PIKEPASSes.”
The example provided by Oklahoma is a good illustration of a situation when marketresearch is not needed. Market research is not an end in and of itself. The objective ofmarket research is to lower the actual or perceived risk of entering a market byexpanding one’s understanding of the market. If, as in the case of Oklahoma, there islittle or no perceived risk, then market research is unnecessary.
Consumer (end-user) focused market research. In contrast to most of the equipmentsuppliers, the primary focus of the market research done by the toll authorities was ondefining the requirements of the end consumer and the characteristics of a system thatwould meet those needs. Of the toll authorities that we surveyed, EZ-Pass, Virginia,Florida, Mass Pike, and Illinois have all done direct end-user market research. Thosetoll authorities that did market research used a combination of mail surveys, focusgroups, and conjoint analysis to define consumer response to their ETC Projects.
. EZ-Pass --The most comprehensive market research program was that done bythe Port Authority of New York and New Jersey in support of the efforts toimplement a common electronic toll system in the NY/NJ/PA area. Thisprogram consisted of four elements:
1989: InformaI panel discussions with private and commercial users1990: Formal focus groups with private users1990: User survey (12,000 distributed, 900 returned)1991/2: Follow-up focus groups
The user survey done for EZ-Pass included both a written questionnaire and aset of conjoint analysis cards to test consumer reactions to differentcombinations of features. An interesting feature of the EZ-Pass survey was theinclusion of a video tape to illustrate and explain the features of EZ-Pass. Thisis a good example of the need to help market research respondents betterunderstand the product/service they are evaluating. The better the
12
Electronic Toll Collection Case Study
product/service is understood by the respondents, the more reliable the resultsare likely to be.
In addition to the end-user market research work done by the public toll authorities, theprivate tollroad operators and several of the hardware suppliers also focused onunderstanding the end-use or consumer requirements. The two private companies thatdid the most significant end-user research were AT/Comm and the California PrivateTransportation Corporation.
. AT/Comm - AT/Comm is unique in that it is a single product companyestablished solely to address the ETC market. While it plans to developadditional applications, the origins of the company are in ETC. The productconcept was developed out of work performed in other communications areas.It is also unique in that it is the only example we found of a company thatcarried out end-use research prior to market development.
The process used by AT/Comm is a textbook example of how to approach theproduct development and product planning process. Before any productdevelopment work was done, AT/Comm sought to establish the answers to twoquestions:
Does a market opportunity exist based on consumer need? AT/Commfelt that if consumers did not yet see a strong need, the efforts of the tollauthorities to implement ETC would either be unsuccessful, or at leastrequire a lead time that would be too long to meet AT/Comm'srequirements.
Is there a disparity between what the toll authorities want and what theconsumers want? If there was significant disparity between the needs ofthe consumers and the authorities, AT/Comm felt that a long termmarket was unlikely to emerge, as neither side would be satisfied withthe systems.
The first question was addressed using two market research studies. Oneinvolved a mail survey of 22,000 toll road users in the NY/NJ/PA area. Justover 5,000 of the surveys were returned for a 23% response rate. The mailsurveys were then followed up by interviews with 600 randomly selected surveyrespondents. In addition to the NY/NJ/PA survey, AT/Comm conducted a mailsurvey of 10,000 users of several exits on Route 93 in New Hampshire.
To address the second question, AT/Comm conducted a phone survey of tollauthority officials.
The answers to the first two questions provided a basis for developing thefunctional specification for a product that would meet the needs of both endusers and toll authorities, and therefore had the opportunity for market success.AT/Comm used this information to modify its original product concept. The
13
Electronic Toll Collection Case Study
functional specification also provided the basis for conducting an assessment ofAT/Comm's competitive position by comparing the functionality of competitiveproducts to the needs of both end users and toll authorities. The company feltthat its product concept offered significant advantage over competing productsand therefore went ahead with the program.
. California Private Transportation Corporation - CPTC is the organization thatwill build and operate the private tollway that will operate in the median ofSR91 in Orange County California. While they are a private company, forpurposes of this investigation they can be thought of as similar to the tollauthorities as they will have operational responsibilities. The SR91 projectoffers a unique perspective on consumer price sensitivity because of thepresence of a direct competitor (the adjacent freeway) offering the sameservice. This is not true in most circumstances where the toll road is often theonly, or at least only convenient, alternative. Despite the size of this project($125 million), there was relatively little market research supporting it. Asurvey of 400 users of SR91 was the only market research done. Because of thepresence of the freeway, the primary issue that CPTC explored was howconsumers valued time, and therefore how they would be likely to use thetollway and how that use would be impacted by pricing. These issues wereaddressed using a survey of existing users of the freeway. They were asked toselect among a choice of commuting times, cost, and number of passengers,using an interactive, computer-based system that provides a variation ofconjoint analysis.
Assessment of Specific IssuesMost of the market research on ETC has addressed six specific issues. These arecovered individually below and include:. Needs assessment. Willingness to pay. Market size and penetration. Market segmentation. Profitability. Risk assessment
Needs Assessment. ETC addresses several fundamental needs. These needs are wellestablished and (depending on the specific application site) almost universallyrecognized by all of the market participants. The role of market research is to identify,quantify, and rank the needs of the various customer groups. The degree to whichmarket research is needed and the type of market research that is needed depends on theexpected variation in the results -- i.e. how strong is the need and are the specific needsvery different between groups -- and the part of the market that is being addressed.
Toll Authority Needs - The most basic need of the toll authorities that ETC addressesis to increase throughput and reduce congestion. These needs are, however, derivative
14
Electronic Toll Collection Case Study
from more basic requirements that include both strict business/operational elements and“public good” elements. Examples of needs that fall into the first category include:
. Increased Revenue - Via greater throughput and the ability to do congestionpricing
. Operational Improvement - Reduced administrative cost, potentially lower laborcosts, reduced fraud, reduced cash handling
Examples of the public good benefits include:
. Reduced pollution from reduced congestion
. Improved fuel economy
. More efficient use of road infrastructure
. Reduced accident rates
The market research done by the ETC hardware suppliers concentrated on the first setof needs, those that focus on the business/operational issues. This was done for severalreasons, the primary one being that such needs can be quantified and addressed usingstandard methods for evaluating the attractiveness of any commercial investment, suchas analysis of pay back period, internal rate of return and others. Competing productsmay meet these needs to a greater or lesser degree, and the ability to meet those needscan form a bases of competition and selection among competing systems. The publicgood elements of the toll authority needs are more difficult to quantify and are largely“non-competitive” in the sense that they would be provided by most competingsystems.
As a result, the suppliers of ETC systems focused their market research onunderstanding and demonstrating the ability of their systems to meet the operationalneeds of the toll authorities. In this mode, the distinction between market research andsales breaks down somewhat. Market research that is focused on understandingcommercial customer requirements often comes down to activities as fundamental assimply meeting with the decision makers to customize your product to their specificneeds, and demonstrate that your product is cost effective and has superior features forthe price. This is essentially the same as the early stages of a sales campaign. Theinitial phase of this process typically involves determining a set of commonrequirements. Following this, the efforts focus on establishing a few “leading” sales thatwill (in the case of a new product) demonstrate the viability of the overall concept (e.g.,ETC). Once the concept is established, the process is driven to a more traditional salesprocess of demonstrating the superior price/performance characteristics of yourproduct.
Consumer Needs - From the consumer perspective, the most fundamental need beingaddressed by ETC is the need to increase available time. This need is met by reducedwaiting time, increased convenience of not having to have cash available for tolls, andin some instances, time saved in accounting for tolls.
15
Electronic Toll Collection Case Study
The need for time saving was tested by most of the market research, and the resultsoffered no surprises.
* The EZ-Pass survey found that the two primary benefits of electronic tolls were:“Speeds Trip” - 52.1% of respondents; and“Easy to Pay Tolls” - 34.8% of respondents.
. AT/Comm survey of Route 93 users indicated that the “most appealing aspect ofthe proposed ETC system” was:
“Saves Time” - 45.5%; and“No cash/tickets/tokens” - 38.1%.
For this and other markets, the most common approach to generating a list of “other”consumer needs is the use of focus groups. EZ-Pass, Florida, MFS Technologies, andothers used this approach in the case of ETC. Although not statistically significant, theinformal nature of focus groups allows consumer needs and concerns to be stated in anopen, free flowing, unprompted way. The interaction between focus group participantswill often surface needs or issues that may not have emerged otherwise. The needsgenerated by the focus groups are then tested in the broader, statistically significantconsumer surveys to ensure that they are commonly shared needs. In the case of ETC,a number of common issues were found in several of the focus group studies. None ofthese were viewed by consumers as truly fundamental to the expected use or non-use ofETC, but rather “desired” product features:
0 Payment method and amount of prepayment. “Perks” available to ETC users such as dedicated lanes. Availability of other uses such as payment for parking, gasoline, etc.. Transponder safety from theft. Transponder mobility between vehicles. Privacy
The EZ-Pass research used a subset of these “other “issues, together with the pricingissues, to defme the variables for their conjoint analysis.
Willingness to Pay. Assuming that the research to analyze market needs is successfulin identifying at least one unmet need, the core of any market analysis is inunderstanding the price that customers are willing to pay to have those needs met.Almost any product/service will have a certain amount of value -- either to theconsumer or to commercial users -- the issue is whether that value is commensuratewith the cost of providing the product/service.
Toll Authorities - In a pure commercial market, determining willingness to pay isrelatively straight forward. Most commercial decisions are based on rationalassessments of whether the product will increase profitability. Different measures maybe used, payback, return on investment, return on assets, etc. -- but the principle is thesame.
16
Electronic Toll Collection Case Study
In the case of toll authorities the issue is clouded somewhat by the presence of thepotential for consideration of the “public good” elements that were discussed above. Ifconsideration of these elements is included, the authority could choose to invest in anETC system regardless of whether it meets some of the strict financial measures. Inpractice, however, our research determined that the ETC hardware suppliers did nothave to rely on the public good elements -- ETC systems could be shown to be costeffective on a straight financial basis. AT/Comm estimated that toll authorities couldrecover their costs in a maximum of 10-12 months based primarily on higherthroughput and greater road utilization.
End users - Determining consumer willingness to pay is generally much more difficult,particularly with a new product concept. Consumer choices take into account a widerange of variables, and the willingness to pay will differ depending on the variablesconsidered. Estimating the demand for ETC is further complicated by the fact thatthere are two elements -- the price of the transponder (tag) and the price of the tolls.The generally accepted procedure for estimating consumer willingness to pay is sometype of consumer choice analysis, the most familiar of which is conjoint analysis.Conjoint analysis asks consumers to select from a range of scenarios that define optionsfor price and other product features. The relative impact of price and other productfeatures can then be deduced from the rankings that consumers place on the differentscenarios.
Our research indicates that conjoint analysis and its variations were the primary toolsused to estimate consumer willingness to pay for ETC. EZ-Pass, California PrivateTransportation Corporation, and Florida all used this technique.
The primary drawback of conjoint analysis is that it is relatively expensive toadminister, as it is time consuming and labor intensive. AT/Comm used a method that,while less robust, provides a less expensive option. Three groups of survey respondentswere established with similar demographic and other characteristics. Each group wasgiven the same product description, but with different price levels. A demand curvewas then estimated by calculating the percentage of each group that would buy theproduct, knowing the price associated with each group.
Market Segmentation. The objective of market segmentation is to group customersthat have similar needs/wants. The needs and wants can then be translated to productfeatures which are used to guide the product development process. For example, in theauto industry, the most fundamental market segmentation is based on price and vehiclesize. While this gross segmentation will not pick up many subtleties, it is a usefulstarting point.
Toll Authoritv Segments - Commercial market segmentation is typically done alongoperational lines because operational characteristics frequently correlate well withneeds. An example of this was seen in the AVI/L market where the initialsegmentation was along industry lines (trucking, shipping, etc.). Within the truckingsegment, companies were primarily segmented by size (number of trucks) and type ofoperation (Truckload, Less-than-Truckload).
17
Electronic Toll Collection Case Study
The suppliers that we surveyed have segmented the market for ETC similarly, with twoprimary segmentation variables:
. Type of toll system -- either a single toll location and/or price (such as a bridge)or a system with multiple toll locations and/or prices (such as a turnpike).
. Size or volume of the toll system -- The number of vehicles that are served perday, or the total number of toll stations.
The first segmentation impacts functional requirements such as the need for a read-onlysystem or a read/write system. The second segmentation impacts the scale of the ETCsystem required and the ability to capture additional revenue from the ETC system.According to AT/Comm, although size/volume is a relevant segmentation, in fact anysize toll system can profitably use ETC. Therefore, it considers its target market to beall toll authorities.
Several of the ETC suppliers also use “source of congestion” as a segmentationvariable. Those toll authorities where the toll booths themselves are the primary sourceof congestion offer better opportunities for the sale of ETC systems than toll authoritieswhere the source of congestion is downstream of the toll booths. This is because theprimary service of an ETC system is reduction of driving time. If introduction of anETC system does not reduce total driving time due to downstream congestion, then thevalue of the ETC system is significantly reduced.
Consumer Segments - In pure consumer markets, market segmentation is often a ratherinvolved process. Segmentation typically involves some combination of demographicfactors (age, family size, income level) that are relatively easily determined, andpsychographic factors (life styles, interests, mind set) that are more difficult to define.
The research done on ETC indicates that there is one primary segmentation variable:trip frequency on the road or roads covered by the ETC system. Commuters are morelikely to buy ETC services than infrequent users. This result was found in work doneby EZ-Pass, AT/Comm, and Amtech. AT/Comm found a significant break in thelikelihood of participation at four or five trips per week.
The survey done by the Virginia D.O.T. for the Dulles Toll Road investigated possiblesegmentation based on sex, occupation and age. Of these, only age showed any strongdifferentiation; the under 35 group was the most likely to participate, while the over 54group was the least likely.
One interesting market segmentation investigated by EZ-Pass is the difference ininterest in ETC between people that consider themselves to be “innovators” or “opinionleaders.” EZ-Pass found roughly 5% more interest in ETC among both of these groups.
Electronic Toll Collection Case Study
The other segmentation that has some predictive value is commercial versus privateusers. Commercial users are generally more receptive to the use of ETC because:. It is easier to quantify the monetary value of the time saved through the use of
ETC.. Commercial users have a greater need for some of the ETC features such as toll
tracking and accounting.. Commercial users have additional uses for the tags such as fleet management
and tracking.
Market size and expected penetration. The market research on ETC does not resultin any clear general conclusions about the expected penetration rates of the use of ETCat the consumer/end-user level. The forecast penetration rate is dependent on thedetails of how the specific ETC system was described, the present commutingenvironment, and numerous other factors. However, each of the studies for which weobtained detailed results have indicated a very substantial interest in participating in anETC system.
. EZ-Pass respondents were asked to rate their interest in subscribing to EZ-Pass.The number of respondents that gave their interest the highest rating (10) rangedfrom 23% to 30%, depending on location.
. The Dulles Toll Road survey showed 37% of users would “definitely join” withno incentives on the tolls or the tag. 59% would “definitely join” with a $10incentive.
. AT/Comm's survey of Route 93 users found that nearly 50% of users would usean ETC system with a $15 charge for the tag and no discount on the toll.Slightly greater than 80% would buy a tag if it were $15 and had a 25%discount on tolls.
These results must be tempered by the fact that in market research, consumers willoften overstate their willingness to try a new product.
At the toll authority level, because most of the ETC systems are completely modularand can be applied profitably to even a single toll booth, the potential market isessentially the entire universe of toll facilities. In the U.S. this amounts to 55authorities, with a likely minimum of at least 1,000 individual toll booths.
Profitability assessment. The market for ETC systems can still be characterized asembryonic. As a result, the hardware suppliers that we spoke to did not have muchinput on profitability. Amtech and AT/Comm both said that several factors result intoll authorities being relatively price insensitive for ETC systems. Thereforeprofitability is not typically a limiting factor.. Where the objective of installing an ETC system is to increase traffic capacity,
often the only alternative is to build a new or expanded road, which may beimpossible and at a minimum is expensive.
19
Electronic Toll Collection Case Study
. The potential financial and operating gains to the toll authorities is sufficientlyhigh to quickly cover the costs of the ETC systems.
At this point in the development of ETC markets, profitability is less important thanefforts to expand the total market in order to expand the revenue base of the hardwaresuppliers. The hardware suppliers’ primary profit source is on sales of the systems tothe toll authorities rather than on the sale of the tags to the driving public, therefore, thefocus of the hardware and systems suppliers has been on competitive assessment -- i.e.how well does my system meet the bases of competition relative to my competition.The bases of competition are fundamentally the toll authority customer needs discussedabove.
Risk assessment. Based on our research, neither the toll authorities nor the suppliersindicated that there were very significant risk factors associated with the ETC market.
From the toll authority side, the only significant risk element is whether the ETCsystems will perform as expected and be accepted by the public. Both of these riskelements are mitigated by fact that the ETC systems have a positive payback atrelatively low participation rates. The toll authorities have managed the risk of lowusage by the use of the market research and marketing programs that have beendiscussed in this paper.
On the supplier side, two significant risk factors were mentioned frequently.
0 Standards - For each individual supplier, the absence of universal standards isboth a risk and an opportunity. The risk clearly is that if a standard isestablished that is not compatible with the company’s technology, that companymay be effectively shut out of the market. The opportunity, in turn, is that if acompany’s technology is accepted as the standard, it will enjoy a very strongcompetitive position. The suppliers have attempted to manage this riskprimarily through activities that amount to lobbying to have their technologyestablished as the standard. One typical approach is to try to establish a strongmarket position and use a “market share” argument that your technology shouldbe the standard. This appears to be the approach that Amtech has taken.Another potential approach to managing this risk is to develop technology thatis compatible with a range of the competing technologies. This approach hasnot been used to date in the ETC market, as we see a range of competingapproaches that are often mutually exclusive rather than compatible.
. “Over Promise” - A risk element that was mentioned in a number of instanceswas the potential risk of toll authorities “over promising” (i.e. promoting ETCtoo heavily and developing expectations in the buying public that cannot bemet). This can result in a backlash that can potentially slow the marketdevelopment from what it would have been if expectations were set morereasonably. Examples of this risk can be seen in the attempts to introduceAntilock Brakes (ABS) in the truck market in the early 1970s. The technologywas not sufficiently developed, and the resulting failures left truckers with a
Electronic Toll Collection Case Study
bias against ABS that remains today. The primary approach taken to managethis risk has been careful work with the toll authorities to educate them and setreasonable expectations within the buying public.
Actual Market Development
Because the ETC market is in the early development stages, there is little evidence onhow accurately the market research performed to date will predict the path of actualmarket development. However, there are several indicators that the market potential isquite strong for these products:
. For those systems that are in place, the participation rates have generally beenhigh As indicated above, the Oklahoma system sold several times the expectednumber of tags. Participation in the Dallas North Tollway has increasedsteadily.
. There is increasing interest in ETC systems as indicated by the results of theIBTTA survey presented in Figure 2.
. An increasing number of complementary products are being developed andintroduced into the market. These include the use of vehicle tagging andcommunications for parking garage payment, fleet management, vehicle theftrecovery, and private vehicle tracking and location services.
Lessons Learned
Of the numerous potential lessons that can be drawn from ETC market research andmarket development, five are most critical and relevant to the market for ATIS.
1) Multi-level customer base - It is important to understand the market structureand recognize that there are fundamentally different levels of customers withfundamentally different needs. The needs of each level of customer must beunderstood using the appropriate market research methods for that customerlevel. When this type of multi-level customer market structure exists (as it willfor ATIS) the market will not develop fully until the needs of all customerlevels are met. In the case of ATIS, the multiple levels are likely to be at least:. The driving public. State D.O.T.s, and. Private companies that may collect and/or vend the traffic information.
2) When market research is not needed - Market research is needed only to reducethe risk of investing in a new product. Where little or no risk is perceived (aswas the case with Oklahoma) there is no need to conduct market research, anddoing so would be inefficient. It appears unlikely that this would be the case inevaluating ATIS, but the possibility should be kept in mind.
21
Electronic Toll Collection Case Study
3) Importance of accurately representing the product in market research - One ofthe difficulties in conducting market research is to ensure that the product beingtested is as similar as possible to the actual product that wilI be offered. Theenvironment in which market research is conducted is inherently artificial andanything that can be done to improve the accuracy of the product representationshould be considered. Several of the methods seen in the ETC market (the EZ-Pass use of video tapes and California Private Transportation Corporation’s useof computer-generated trade-off analysis) are illustrative of the types ofinnovative solutions to this problem that exist. Because ATIS products arelikely to be quite new to most consumers, this issue is particularly important.
4) Consumer willingness to pay for time savings - The development of a marketfor ATIS products will largely depend on the willingness of consumers to payfor time saved in commuting. Several of the studies done for the ETC marketindicate that consumers will in fact pay for time savings. This should beexplored further but is an optimistic sign for the development of ATIS.
5) Risk of “over promising” - This risk identified by a number of the participantsin the ETC market is particularly applicable to the ATIS market. Consumerexpectations must be carefully managed to ensure that they do not expect moreof ATIS products than can actually be delivered. Products that offer real valuecan may prove unsuccessful if consumers expect them to offer even more valuethan they can deliver.
22
Cellular Communications Case Study
Market Background
The concept for cellular communications was developed by AT&T’s Bell Laboratoriesin 1947, however, it wasn’t until 1962 that the first real tests were conducted to explorecommercial applications. Another eight years passed before the FederalCommunications Commission set aside new radio frequencies for “land mobilecommunications” (824 - 849 MHz frequency range for mobile to base communicationsand the 869 - 894 MHz frequency range for base to mobile communications). Finally,on October 13, 1983, after a lengthy licensing process, the first commercial cellularsystem began operating in Chicago, with the second system activated a short time laterin Washington, D.C.
Licenses to operate cellular services were issued based on Metropolitan StatisticalAreas (MSAs) and Rural Service Areas (RSAs). Each MSA/RSA is divided into anumber of “cells,” usually ranging from 1 to 15 miles in radius. A Mobile TelephoneSwitch Office (MTSO) acts as the interface between the ceil sites and the publicswitched telephone network. Two independent licenses were granted in eachMSA/RSA, one to the wireline company (local RBOC) and one to a non-wirelinecompany. The two operators in each area have independent and separate infrastructure,with each individual operator being responsible for infrastructure investment, serviceoperation, and subscriber acquisition. The average infrastructure investment in a majorcity or MSA averages about $50 million, with about a five-to-seven-year payback.
While the concept of “cellular” phones was new, there were several existing systems forproviding mobile communications. The existing systems provided an indication of thepotential of cellular phones, as technical features that limited the volume of mobilephones that could be served, resulted in long waiting lists three to ten years in somecases.
Cellular service differs from landline telephone service mainly by virtue of its nothaving a tethered line connecting each subscriber to a central office switch. Cellularsubscribers are connected to celI sites via radio frequency over the air waves. The cellsite locations are connected to the MTSO via private microwave, copper, or fiberfacilities. In a traditional landline telephone architecture, each individual subscriber isconnected via a physical line (whether it be twisted pair, copper or fiber) to the closestcentral office location.
By the end of 1984, there were approximately 9 1,600 subscribers in the United States,spread among 26 cellular markets. Most major cellular carriers entered the marketduring this time frame (1984-85). Today the cellular communications industry hasgrown to a total subscriber base of over 13 million, annual revenues of about $10billion, and a total employee base of over 35,000 jobs.
23
Cellular Communications Case Study
Market Assessment Methodology
Overview
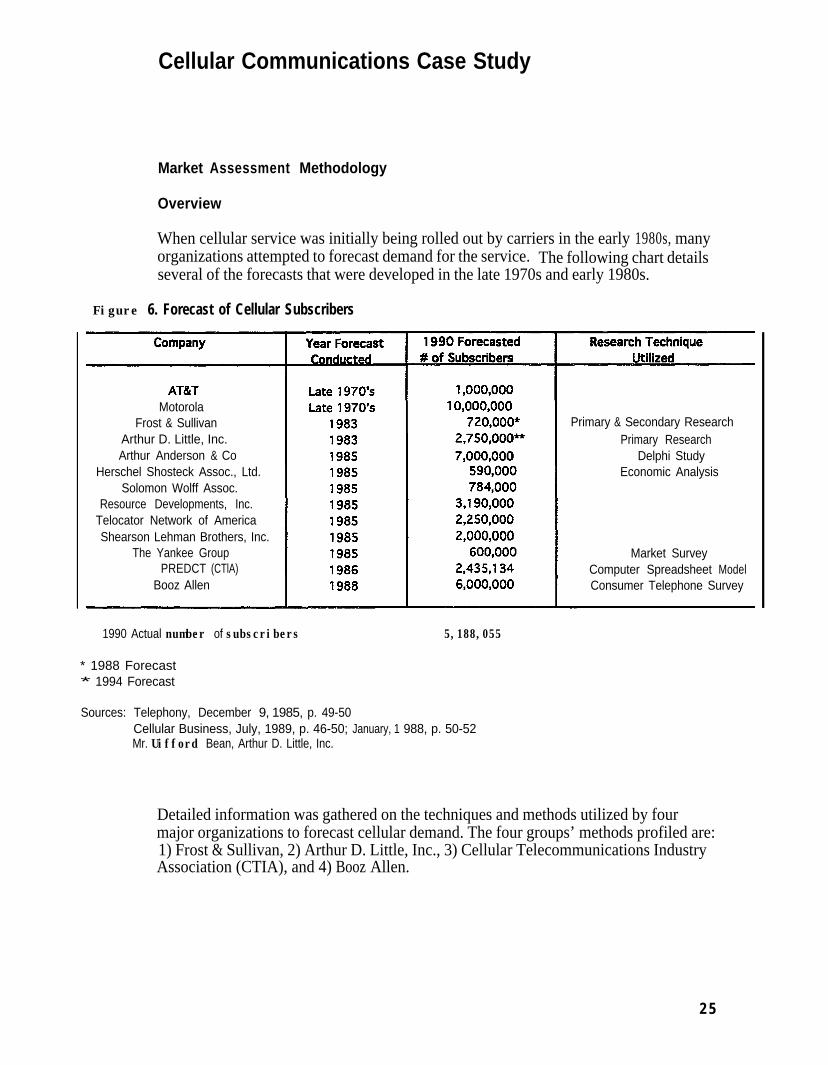
When cellular service was initially being rolled out by carriers in the early 1980s, manyorganizations attempted to forecast demand for the service. The following chart detailsseveral of the forecasts that were developed in the late 1970s and early 1980s.
Figure 6. Forecast of Cellular Subscribers
MotorolaFrost & Sullivan
Arthur D. Little, Inc.Arthur Anderson & Co
Herschel Shosteck Assoc., Ltd.Solomon Wolff Assoc.
Resource Developments, Inc.Telocator Network of AmericaShearson Lehman Brothers, Inc.
The Yankee GroupPREDCT (CTlA)
Booz Allen
Primary & Secondary ResearchPrimary Research
Delphi StudyEconomic Analysis
Market SurveyComputer Spreadsheet ModelConsumer Telephone Survey
1990 Actual number of subscribers 5,188,055
* 1988 Forecast* 1994 Forecast
Sources: Telephony, December 9, 1985, p. 49-50Cellular Business, July, 1989, p. 46-50; January, 1 988, p. 50-52Mr. Uifford Bean, Arthur D. Little, Inc.
Detailed information was gathered on the techniques and methods utilized by fourmajor organizations to forecast cellular demand. The four groups’ methods profiled are:1) Frost & Sullivan, 2) Arthur D. Little, Inc., 3) Cellular Telecommunications IndustryAssociation (CTIA), and 4) Booz Allen.
2 5
Cellular Communications Case Study
1) Frost & Sullivan Methodology. In 1983, Frost & Sullivan developed a cellularindustry forecast. The primary methodology used in the research for this reportincluded extensive interviews with industry executives, suppliers, salespeople, commoncarriers, and potential end users. The interview data was supplemented by an extensivereview and analysis of available literature, including:. Annual reports, l0Ks, and investment house research reports. Company product literature describing services and products appropriate to the
cellular market. Press releases regarding new products and service offerings. Articles from various industry publications
The Frost & Sullivan study only projected out for a five-year period. The forecastednumber of subscribers for 1988 was 720,000.
2) Arthur D. Little, Inc. Methodology. Throughout the early 1980s, a number ofcellular forecasts were conducted by Arthur D. Little. The forecasts were conductedmainly for potential cellular service providers that were submitting license applicationsto the FCC and were attempting to gauge the amount of infrastructure and plant to putin place to serve the expected demand. In fact, at the time, most cellular serviceproviders looked to outside consultants to help them forecast demand. Arthur D. Littleperformed the following activities in developing its cellular demand forecasts:
1) Focus groups2) Detailed consumer surveys3) Analysis of demographic and economic characteristics4) Extrapolation and forecast
ADL determined that this primary, “bottom-up” research methodology would providethe most complete and accurate forecast possible within a reasonable time frame andbudget. The activities undertaken to forecast demand are explained further in thereport.
3) PREDCT Cellular Forecasting Methodology (sponsored by the CTIA). ThePenetration-Related, Econometrically Driven Cellular Telephone (PREDCT)forecasting model is a personal computer-based model developed to forecast thedemand for cellular service in any defined market area or group of areas. The modelwas developed in 1986-1987 by an industry consultant1 for the CellularTelecommunications Industry Association (CTIA). PREDCT was designed to be aquick, easy to use, and simple to understand model that combines existing penetrationrates (no matter how minimal) with the foresight of experts in a variety of fields.
1 Scott Goldman, president of the Goldman Group, a cellular marketing consulting firmin Calabasas, CA.
26
Cellular Communications Case Study
4) Booz Allen Methodology. In May 1988, Booz Allen conducted a cellular telephonedemand survey for the Cellular Telecommunications Industry Association (CTIA). Thesurvey was conducted via telephone among 3,100 randomly selected households. Themethodology employed by Booz Allen is detailed further in the report.
Needs Assessment
In the environment of ten years ago -- prior to the widespread use of mobilecommunications, cordless phones or paging services -- the concept of cellular servicewas new and different from what the general public was familiar with.1 Therefore, oneof the requirements of market research was to provide a detailed explanation of theservice and its benefits to potential users. Because cellular technology had to bedescribed, and did not lend itself to being easily displayed, potential users and surveyrespondents had difficulty in understanding the service and its capabilities.
Arthur D. Little’s approach was to conduct a series of initial focus groups in order tobetter understand the potential needs and characteristics of the cellular market. Thefocus groups provided insight into the occupational and industry segments most likelyto initially subscribe to cellular service. Results of the focus groups were also helpfulin refining the survey questionnaires to be used in each geographic market area.Detailed market research studies were then conducted in several of the top 35 markets.
Willingness to Pay
Cellular service and products were expensive and their prices were unstable. Potentialusers, for the most part, had only traditional, land-line telephone service rates tocompare to cellular rates. As a result, it was difficult to gauge consumer willingness topay.
In its forecasting work, Arthur D. Little tested consumer willingness to pay bydetermining the level of interest in cellular service at various price points. Respondentswere asked how interested or likely they would be to purchase cellular service at aparticular price level and with a particular pricing option.three different price levels were tested in each study.
Two pricing options andStudy participants were asked to
comment on only one of the three different price levels (each third of the participantswere assigned one of the three pricing levels). The pricing options were as follows:
1) Pay one rate for basic service and equipment rental, plus 50 cents per local one-minute call, with toll calls as an extra charge; or
2) Buy the cellular phone and pay only half of the basic monthly charge.
The rates tested were $65, $80, and $100 per month for basic service and equipmentrental as the first pricing option. The rates tested for the second pricing option were
Cellular Communications Case Study
$32.50, $40, and $50 per month for basic service plus $2,200 to purchase the cellularphone.
The survey results varied slightly, but the majority of respondents to “pricing optionone” were price insensitive. In fact, in many of the studies, it was found that the“medium priced” service option received a higher percentage of respondents likely topurchase service than the “lower priced” service option. It is likely that this priceinsensitivity was partially due to the “pent-up” demand for cellular service as well asthe fact that potential consumers were unable to reasonably judge a fair price forcellular service, as they had little with which to compare it.
In its forecasting work, Booz Allen tested cellular service price sensitivity. Pricesensitivity was becoming more of an issue a couple of years after cellular service wasrolled out and companies were curious to get more updated price sensitivity data. Pricesensitivity was tested by randomly exposing potential buyers to one of three pricepoints based on the reasonable range of prices expected over the next five-year timeperiod.
The three price points tested in the Booz Allen survey were:
1.) $15 per month for equipment and service, and 15 cents per minute of usage;
2.) $50 per month for equipment and service, and 50 cents per minute of usage; and
3.) $100 per month for equipment and service, and 95 cents per minute of usage.
The “take” rates varied modestly, but growth slopes over the next two-year time periodwere approximately the same regardless of price. The forecast based its projections ona base of 2 million cellular subscribers. Booz Allen predicted a range of just under 6million to just over 7 million cellular subscribers by 1990, depending upon the pricepoint.
After 1990, Booz Allen’s survey data depicted a flattening of the growth rate at the highand medium price points. However, the study predicted that growth would continueeven if prices remained high. Approximately 10 million subscribers were expected bythe end of 1993 at the high price point. If prices dropped to the low end, the number ofsubscribers was expected to reach as high as 18 million by the end of 1993. Moreoptimistic forecasting was beginning to recognize the growing popularity of cellularservice in the late 1980s.
28
Cellular Communications Case Study
Market Segmentation
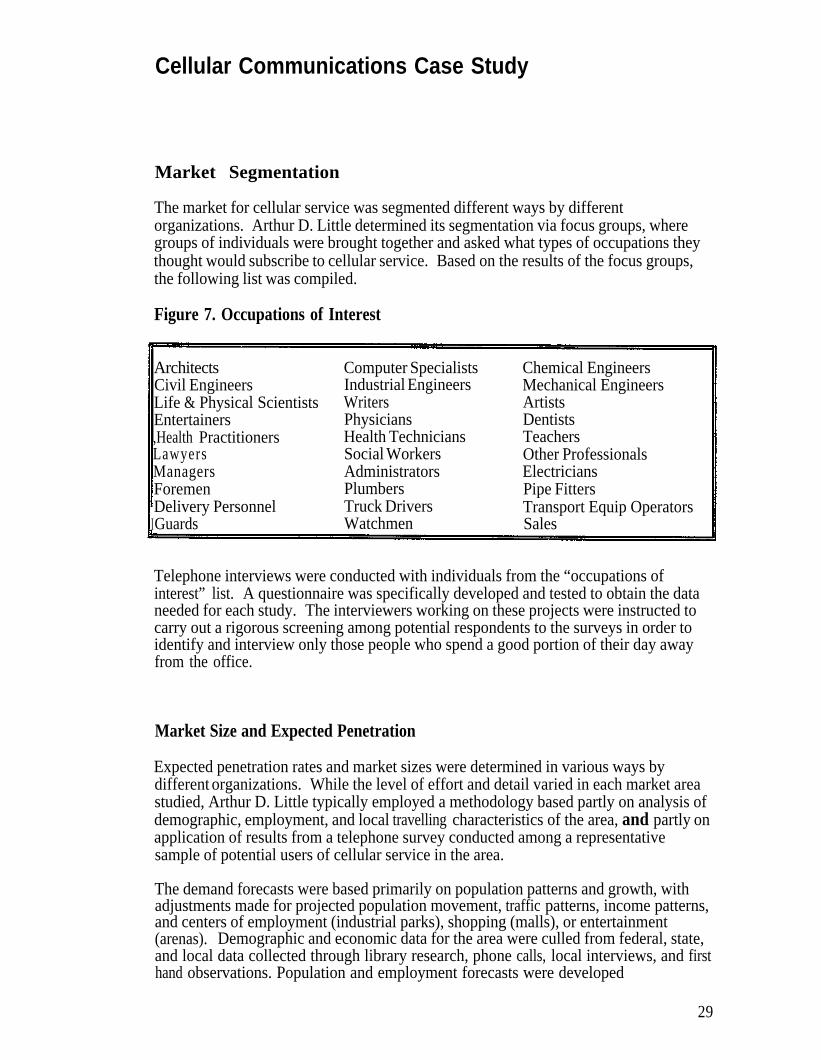
The market for cellular service was segmented different ways by differentorganizations. Arthur D. Little determined its segmentation via focus groups, wheregroups of individuals were brought together and asked what types of occupations theythought would subscribe to cellular service.the following list was compiled.
Based on the results of the focus groups,
Figure 7. Occupations of Interest
ArchitectsCivil EngineersLife & Physical ScientistsEntertainers,Health PractitionersLawyersManagersForemen
IDelivery PersonnelGuards
Computer SpecialistsIndustrial EngineersWritersPhysiciansHealth TechniciansSocial WorkersAdministratorsPlumbersTruck DriversWatchmen
Chemical EngineersMechanical EngineersArtistsDentistsTeachersOther ProfessionalsElectriciansPipe FittersTransport Equip OperatorsSales
Telephone interviews were conducted with individuals from the “occupations ofinterest” list. A questionnaire was specifically developed and tested to obtain the dataneeded for each study. The interviewers working on these projects were instructed tocarry out a rigorous screening among potential respondents to the surveys in order toidentify and interview only those people who spend a good portion of their day awayfrom the office.
Market Size and Expected Penetration
Expected penetration rates and market sizes were determined in various ways bydifferent organizations. While the level of effort and detail varied in each market areastudied, Arthur D. Little typically employed a methodology based partly on analysis ofdemographic, employment, and local travelling characteristics of the area, and partly onapplication of results from a telephone survey conducted among a representativesample of potential users of cellular service in the area.
The demand forecasts were based primarily on population patterns and growth, withadjustments made for projected population movement, traffic patterns, income patterns,and centers of employment (industrial parks), shopping (malls), or entertainment(arenas). Demographic and economic data for the area were culled from federal, state,and local data collected through library research, phone calls, local interviews, and firsthand observations. Population and employment forecasts were developed
29
Cellular Communications Case Study
judgementally based on current information and comparisons with available forecasts,as well as with inputs received from interviews with local government planningoffkials. Demographic and economic conditions were expected to greatly impact thedemand for cellular service. The assumption was that the more affluent, bettereducated and higher employment levels of a particular area, the more likely that thepenetration rates of cellular subscribers would be greater as well.
Arthur D. Little applied likely penetration rates, based on the percentage of surveyrespondents who responded favorably, to projected employment levels of the pre-selected “occupations of interest” from which total demand by year was estimated. A“discount” factor was then applied to the surveyed demand levels to provide a more“realistic” forecast. The discount factor was applied because previous studies carriedout in the telecommunications field involving acceptance and utilization of newproducts and services had indicated that survey results of demand levels do notmaterialize immediately. Not everyone who expresses interest in subscribing to a newservice in fact does so at the outset. The experiences of products such as radio pagers,subscriber terminal equipment, and many forms of business terminals, was that it takesfive years for surveyed demand levels to become reality. Thus the following discountfactors were used:
1) In the first year of availability, a new service will capture and serve 25% ofestimated demand at the price levels indicated.
2) During the second year of availability, the service will capture 33% of potentialdemand.
3) During the third year of availability, capture will reach 50% of potential demand.
4) During the fourth year, capture will reach 75% of potential demand.
5) By the fifth year, capture will reach 100% of potential demand at the stated pricelevel.
6) Thereafter, capture will equal potential demand and will grow as a function ofpopulation and employment growth.
Although the surveys conducted included only individuals in selected occupations ofinterest, allowance was made for additional demand to materialize from other sectors-Since penetration within other sectors is not likely to be initially significant, it wasassumed that at the outset of the service’s availability, approximately one-half of onepercent (.005) of the employment base other than the selected occupations of interestwill be potential subscribers. Thereafter, it was assumed that this penetration wouldincrease each year by one-tenth of one percent (.001) throughout the forecast period.
Overall demand therefore was determined by combining results of the describedcalculations for the two sectors - the discounted employment in the “occupations ofinterest” and employment in industry sectors outside of the “occupations of interest.”
30
Cellular Communications Case Study
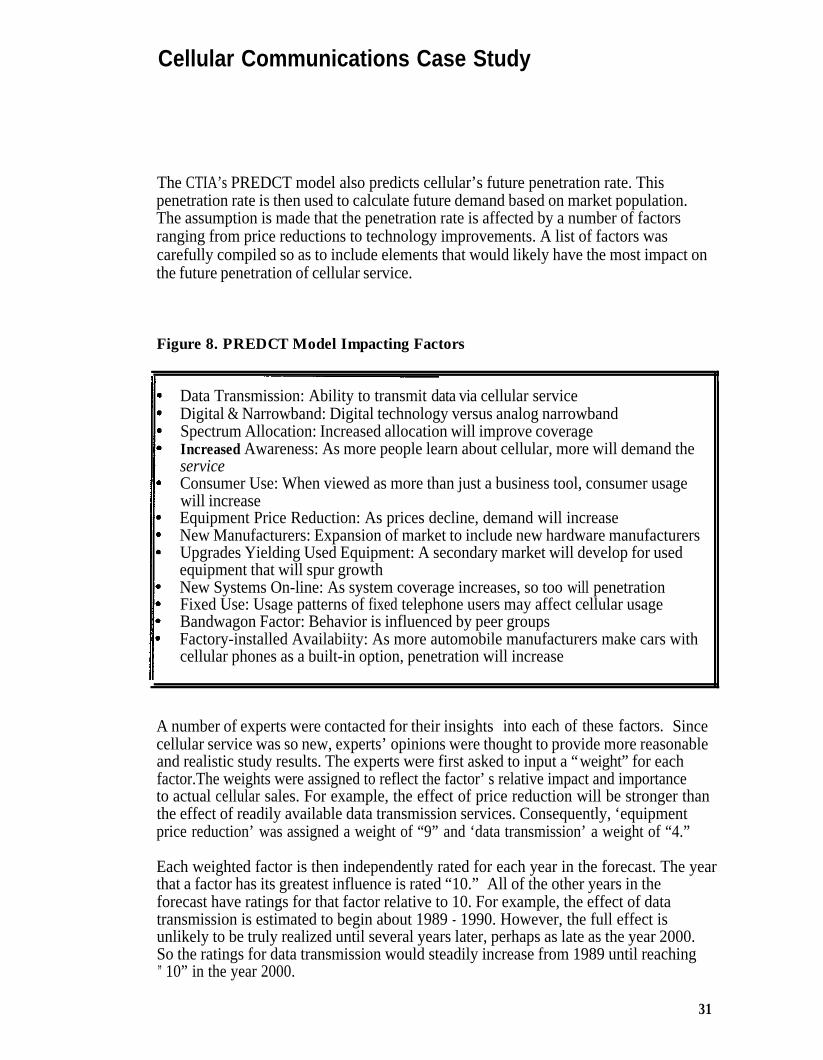
The CTIA’s PREDCT model also predicts cellular’s future penetration rate. Thispenetration rate is then used to calculate future demand based on market population.The assumption is made that the penetration rate is affected by a number of factorsranging from price reductions to technology improvements. A list of factors wascarefully compiled so as to include elements that would likely have the most impact onthe future penetration of cellular service.
Figure 8. PREDCT Model Impacting Factors
Data Transmission: Ability to transmit data via cellular serviceDigital & Narrowband: Digital technology versus analog narrowbandSpectrum Allocation: Increased allocation will improve coverageIncreased Awareness: As more people learn about cellular, more will demand theserviceConsumer Use: When viewed as more than just a business tool, consumer usagewill increaseEquipment Price Reduction: As prices decline, demand will increaseNew Manufacturers: Expansion of market to include new hardware manufacturersUpgrades Yielding Used Equipment: A secondary market will develop for usedequipment that will spur growthNew Systems On-line: As system coverage increases, so too will penetrationFixed Use: Usage patterns of fixed telephone users may affect cellular usageBandwagon Factor: Behavior is influenced by peer groupsFactory-installed Availabiity: As more automobile manufacturers make cars withcellular phones as a built-in option, penetration will increase
A number of experts were contacted for their insights into each of these factors. Sincecellular service was so new, experts’ opinions were thought to provide more reasonableand realistic study results. The experts were first asked to input a “weight” for eachfactor.The weights were assigned to reflect the factor’s relative impact and importanceto actual cellular sales. For example, the effect of price reduction will be stronger thanthe effect of readily available data transmission services. Consequently, ‘equipmentprice reduction’ was assigned a weight of “9” and ‘data transmission’ a weight of “4.”
Each weighted factor is then independently rated for each year in the forecast. The yearthat a factor has its greatest influence is rated “10.” All of the other years in theforecast have ratings for that factor relative to 10. For example, the effect of datatransmission is estimated to begin about 1989 - 1990. However, the full effect isunlikely to be truly realized until several years later, perhaps as late as the year 2000.So the ratings for data transmission would steadily increase from 1989 until reaching” 10” in the year 2000.
31
Cellular Communications Case Study
The model then calculates the number of index points for each factor by multiplying itsweight times the rating for each particular year. An annual penetration rate index isdetermined from the sum of each factor’s index points.
New cellular service penetration rates are calculated by increasing the previous year’srate by the percentage rate increase in the penetration rate index. A sample of themodel is displayed in Appendix B. The PREDCT model forecasted just under 2.5million subscribers nationally for 1990.
Risk Assessment
Cellular infrastructure investment was considered a risk for cellular service carriers, butmuch less so for carriers operating in large cities where greater demand was expected.This was the primary reason for initial roll-out of cellular service in the largest MSAs.
In very large cities, prior to cellular service, IMTS (Improved Mobile TelephoneService) was being offered to a very limited number of subscribers. The service wasplagued with tremendous customer complaints ranging from horrible service qualityand difficulty in getting a free channel, to clumsy and expensive equipment. Even withthe terrible service being provided via IMTS, huge waiting lists existed for the service.Based upon this information, it is likely that carriers in the largest cities felt that theirrisk was somewhat mitigated.
Financial infrastructure risk also existed, but could be managed by the number ofcellular sites initially designed and built into a system. As a system grew in the numberof subscribers, capacity could be increased by splitting cells or adding new cells to thesystem. The cost of building a new cell site or sites could be justified once the demandmaterialized.
Wireline carriers felt less pressure to be successful quickly as they were backed byhuge corporations versus the non-wireline carriers that were usually backed by venturecapitalists and private investors who often demanded quicker returns.
Cellular had a number of technical issues that were still being sorted out and leftquestions in the minds of potential subscribers and survey respondents:
- coverage areas/“black holes”- equipment and service compatibility- billing issues- roaming ability- security and privacy of conversations
32
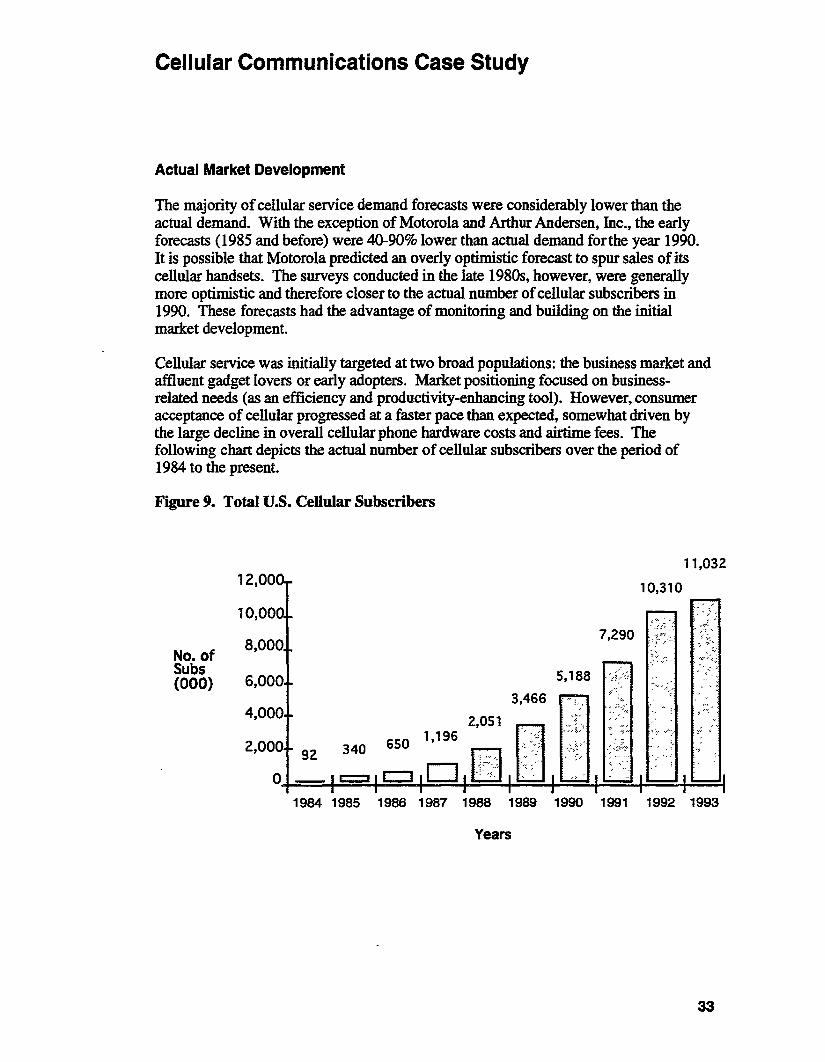
Cellular Communications Case Study
By 1986, many cellular operators were unable to provide service to all the customerswho were demanding cellular service. The systems were based on analog radiotechnology which posed serious limitations to the total number of subscribers that coulduse the system at any one time. By the early 1990s, several operators in large MSAswere converting to or adding digital radio technology to their systems to allow a muchgreater number of subscribers to utilize their systems. Digital radio technology requiresthat subscribers acquire new handsets (either fully digital or dual mode). Thisconversion continues today in smaller MSAs/RSAs.
As cellular service developed and usage became more widespread, several eventsoccurred whereby the market forced the cellular service providers to be moreresponsive:
Usage revenues per subscriber decreased as subscribers became more careful abouttheir cellular phone usage. The high usage costs caused most subscribers tobecome much more efficient with their cellular phone conversations. Many carriersresponded with new pricing plans, options, and pricing packages with peak andnon-peak usage rates as well as lower rates in general
Subscribers began demanding services similar to the landline services to which theyhad become accustomed (e.g., call forwarding, voice mail). Carriers were againforced to respond to the market by providing services and prices comparable tolandline services.
Customer turnover became a big issue. Previously, carriers seemed mostlyconcerned with getting new subscribers signed up for service, with little thoughtgiven to customer retention or development of customer loyalty. Many subscriberswould “hop” back and forth between the wireline and non-wireline carrierdepending upon who was providing the best deal. Only recently have carriersbegun developing strategies to retain customers, including various incentivepackages and improved customer service.
Indeed, a current popular trend among cellular service carriers is to provide enhancedfeatures to the regular service offerings. Call forwarding, Busy/no answer transfer, Callwaiting, Conferencing, Roaming, Voice mail, Paging, and access to informationservices are all offered by cellular service providers in metropolitan and rural areas at aminimal additional cost. Traffic information, weather information, and stock quotesare among the most popular information services provided. In some areas of thecountry, it is possible to obtain live route guidance, sports news, and a menu offinancial services beyond just quotes. It is likely that continued technologicaldevelopments will positively impact the cellular market.
Cellular Communications Case Study
Lessons Learned
Many lessons can be learned from the work that was done when cellular demand wasinitially forecast:
l Major price declines were underestimated. Over the first five-year period aftercellular service was introduced, cellular phone equipment prices droppeddramatically. The average price of a cellular phone in 1984 was around $3,000-to-$3,500. By 1989, the price had dropped to under $500. In the early 1990s, cellularphones were being offered free of charge by some service providers to enticecustomers to sign-up for service. Basically there were three reasons for the pricedeclines:
1) Manufacturing economies and efficiencies were gained as volumes increased,
2) Intense competition ensued as Japan, Korea, and Taiwan jumped into themarket. At least 20 different cellular handset manufacturers competed withproducts in the U.S. in the 1980s; and
3) Getting cellular phones into people’s cars was necessary to stimulate serviceusage.
l Cellular phones and other consumer electronics have demonstrated that huge pricereductions are possible as production volume increases. Future demand forecastingfor consumer electronic equipment (such as ATIS) should test potential demand at awider range of potential prices to account for the possibility of future pricereductions.
l Widespread consumer acceptance across income levels and industry segments wasunderestimated. It was assumed that only affluent, 40-year-old male executiveswould be the primary users of cellular telephone service. A wider range ofoccupations beyond just the “occupations of interest” should also have beenconsidered. As the service evolved, it was found that user profiles were morediverse and heterogenous than initially assumed.
l Forecasting efforts should focus on both the short-term and long-term users of anew service as inclusion or exclusion of the long-term users will greatly impactdemand forecasts.
l The full extent of the benefits provided by cellular phones was underestimated.Cellular service was initially expected to only be used for very important, not to bemissed business issues (late for an appointment, etc.) or emergency situations.However, as cellular service became more widespread, it was found that cellularcould provide a number of time-saving and efficiency producing benefits.
35
Cellular Communications Case Study
Self-reported intentions by survey respondents are not always accurate indicators offuture actions. Therefore, it is usually necessary to apply some type of discountfactor to the forecasted demand to take into account the more realistic “take-up” ofservice and market acceptance. A danger in applying the discount factor is beingoverly conservative, which occurred with the use of discount factors in forecastingdemand for cellular service.
The cellular demand estimates that were made in the early 1980s were only validunder the economic and technological conditions at the time of the survey and didnot reflect changes that occurred in the environment over time. Environmentalchanges occurred in the 1980s that were not anticipated in any of the forecasts. Forexample, users were willing to pay a premium for time savings devices, like cellularphones. When forecasting demand of this type, it is important to consider andincorporate alternative future scenarios that could either positively or negativelyaffect demand.
When performing a consumer survey, it is important to conduct interviews with theindividual that actually make the purchase decision or the primary cellular user whois responsible for the bill. Forecast accuracy is greatly improved if the buyingsource is surveyed.
Attempts should be made to help survey respondents “visualize the technology”(especially with very new concepts) to fully appreciate the capabilities and benefitsof the product or service being tested. The better the understanding of the product,the more accurate will be the responses. This is often accomplished using focusgroups, and concentrating on the benefits that the product provides.
Many of these lessons should be useful in conducting future forecast work, especiallyfor ATIS, whose concept has many similarities to cellular service.
33
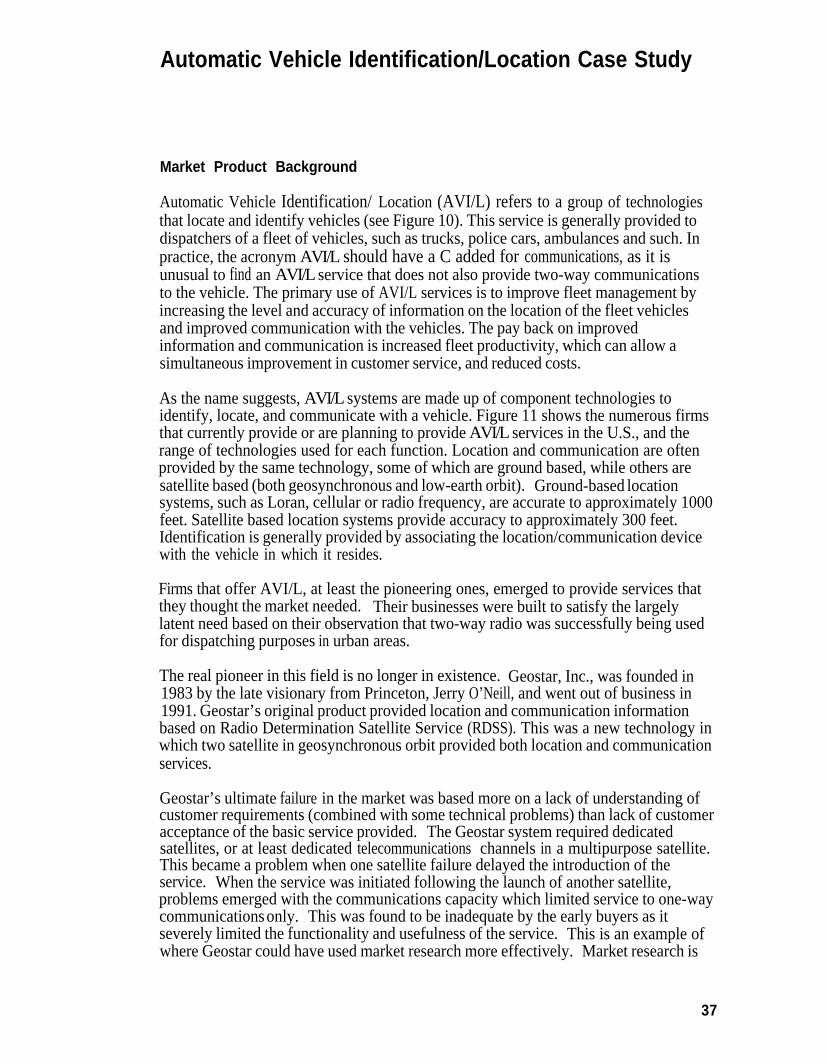
Automatic Vehicle Identification/Location Case Study
Market Product Background
Automatic Vehicle Identification/ Location (AVI/L) refers to a group of technologiesthat locate and identify vehicles (see Figure 10). This service is generally provided todispatchers of a fleet of vehicles, such as trucks, police cars, ambulances and such. Inpractice, the acronym AVI/L should have a C added for communications, as it isunusual to find an AVI/L service that does not also provide two-way communicationsto the vehicle. The primary use of AVI/L services is to improve fleet management byincreasing the level and accuracy of information on the location of the fleet vehiclesand improved communication with the vehicles. The pay back on improvedinformation and communication is increased fleet productivity, which can allow asimultaneous improvement in customer service, and reduced costs.
As the name suggests, AVI/L systems are made up of component technologies toidentify, locate, and communicate with a vehicle. Figure 11 shows the numerous firmsthat currently provide or are planning to provide AVI/L services in the U.S., and therange of technologies used for each function. Location and communication are oftenprovided by the same technology, some of which are ground based, while others aresatellite based (both geosynchronous and low-earth orbit). Ground-based locationsystems, such as Loran, cellular or radio frequency, are accurate to approximately 1000feet. Satellite based location systems provide accuracy to approximately 300 feet.Identification is generally provided by associating the location/communication devicewith the vehicle in which it resides.
Firms that offer AVI/L, at least the pioneering ones, emerged to provide services thatthey thought the market needed. Their businesses were built to satisfy the largelylatent need based on their observation that two-way radio was successfully being usedfor dispatching purposes in urban areas.
The real pioneer in this field is no longer in existence. Geostar, Inc., was founded in1983 by the late visionary from Princeton, Jerry O’Neill, and went out of business in1991. Geostar’s original product provided location and communication informationbased on Radio Determination Satellite Service (RDSS). This was a new technology inwhich two satellite in geosynchronous orbit provided both location and communicationservices.
Geostar’s ultimate failure in the market was based more on a lack of understanding ofcustomer requirements (combined with some technical problems) than lack of customeracceptance of the basic service provided. The Geostar system required dedicatedsatellites, or at least dedicated telecommunications channels in a multipurpose satellite.This became a problem when one satellite failure delayed the introduction of theservice. When the service was initiated following the launch of another satellite,problems emerged with the communications capacity which limited service to one-waycommunications only. This was found to be inadequate by the early buyers as itseverely limited the functionality and usefulness of the service. This is an example ofwhere Geostar could have used market research more effectively. Market research is
37
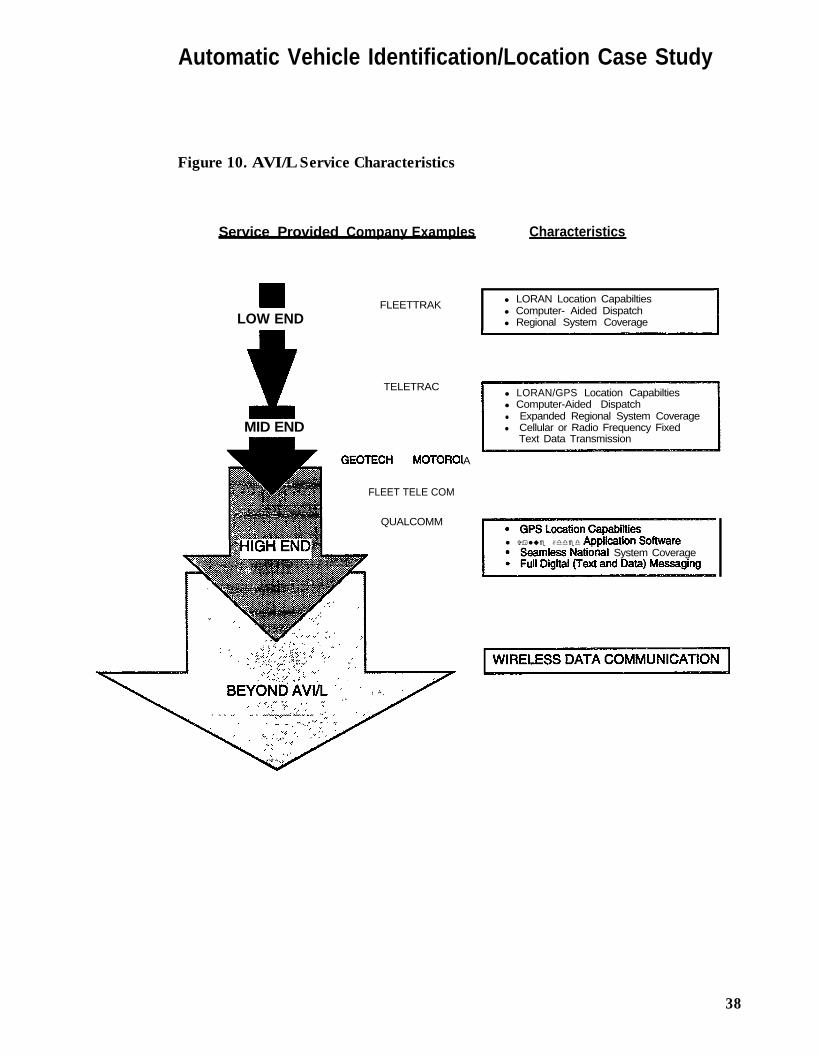
Automatic Vehicle Identification/Location Case Study
Figure 10. AVI/L Service Characteristics
Service Provided Company ExampIes Characteristics
LOW ENDFLEETTRAK l LORAN Location Capabilties
l Computer- Aided Dispatchl Regional System Coverage
TELETRAC
MID END
FLEET TELE COM
QUALCOMM
l LORAN/GPS Location Capabiltiesl Computer-Aided Dispatchl Expanded Regional System Coveragel Cellular or Radio Frequency Fixed
Text Data Transmission
A
l Va lue Added
I System Coverage
38
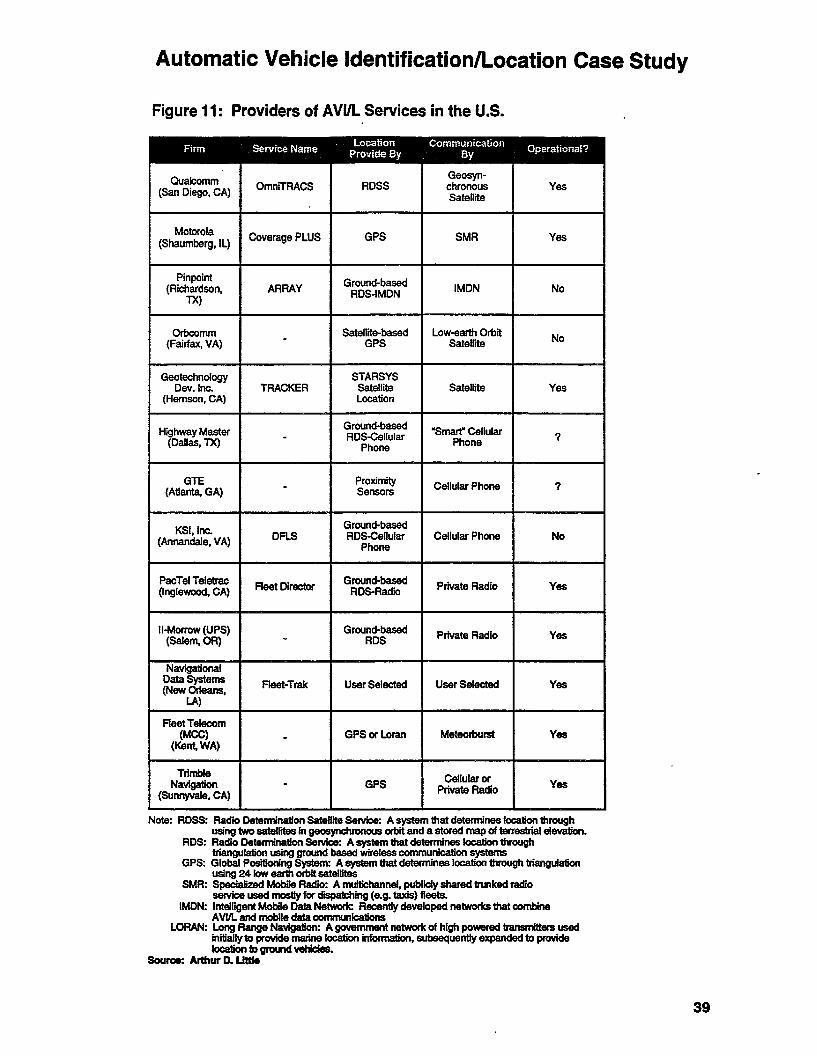
Automatic Vehicle Identification/Location Case Study
particularly appropriate for determining functional requirements and could have easilyrevealed the requirement for two-way communications. Geostar eventuallyoffered a two-way communication service, but not before several competitors hadestablished themselves and put Geostar at a significant competitive disadvantage.Geostar went out of business in 199 1.
Among the competitors that emerged, one was particularly important: Qualcomm,founded in 1986 by Irwin M. Jacobs, exploited the problems Geostar was having.Since the Qualcomm technology used existing satellite-based channels, there were nodelays in providing service. While the accuracy and coverage of Qualcomm’s locationand communications technology was not as high as that offered by Geostar, it wasfound to be acceptable by customers. Qualcomm’s product had two other features thatturned out to be important to customers: it was available and it was reliable. All ofthese issues -- accuracy, coverage, availability, and reliability requirements -- are againall areas that Geostar could have explored effectively through market research.
In establishing a market for new service, it is often necessary to land one key customerthat will act as both a test bed and an indicator to the rest of the industry that theproduct is “real.” Qualcomm used this strategy effectively through a large strategic saIeto Schneider Trucking, recognized as an innovative carrier, in 1988. This one saleestablished Qualcomm and boosted it to the level of a mature service provider. Avariation on this strategy was pursued by another early AVI/L provider, II-Morrow(pronounced as tomorrow). II-Morrow, founded in 1982, was bought in 1986 by UPS,which obviously recognized the potential of the technology.
The primary customer base for AVI/L services are trucking firms that tend to be:. Large - Fleets of more than 100 trucks and revenue of more than $5 million that
can afford the expense of the systems.l National - National carriers have a greater need to be able to locate their vehicles on
long (distance and time) hauls. Local operators tend to run shorter routes with lessvariability in the time required.
. Truckload service providers - Carry loads that are full truckloads, for a singlecustomer, on a point-to-point basis.
. Special commodities haulers - Hazardous, refrigerated, or time sensitive materialsfor which monitoring of position and time to destination is critical.
The reasons most often cited for purchasing AVI/L services are:l Improved customer service - AVI/L allows the trucker to tell the customer where
their load is and provide more accurate forecasts of when it will arrive at thedestination.
l Increased fleet productivity - More precise information on location and time todestination allows the dispatcher to schedule shorter turn-around times and improvethe efficiency of scheduling “backhauls.”
l Creating a barrier to entry - Having AVI/L raises both the capital cost required toenter the trucking market (which helps keep new entrants out) and can create astandard for customer service that must be met by existing competitors.
Automatic Vehicle Identification/Location Case Study
l Reducing communications cost - Prior to the use of AVI/L, long-haul truckers’primary form of communications with their base was telephone. Tbis requireddrivers to stop to call in, which created substantial amounts of downtime for thetruck and added cost and time to each trip.
l Monitoring driver/vehicle performance - Recent AVI/L systems allow thecommunication of a wide range of vehicle performance information (average speed,fuel consumption, etc.) that is useful in ensuring that the driver is adhering tooperating procedures. The communications function can also be used to monitorwhen the driver is out of the vehicle for unauthorized stops.
l Added capability for emergency communications - AVI/L provides quickerresponse time to breakdowns and could be used in the case of medical emergencies.
The development of the AVI/L market provides relevant insights into the potentialmarket for ATIS because it uses similar technologies and provides similar benefits, i.e.information and increased efficiency/timesaving. It provides a lesson in the role ofgovernment, as the government played only a limited role in the market development ofAVI/L services. Little of the risk or reward was shared with the public sector. Besideslicensing for communications purposes, and being an occasional customer, thegovernment in general did not participate in the creation of this segment of IVHS. Thegovernment, in some cases, did support the development of products and services fromwhich the AVI/L offerings were derived.
The following assessments of the market research activities and market developmentpath is based on interviews with several providers of AVI/L services. Six firms fromthe list in Figure 11 were selected to provide a cross section of early and late entrants,and large and small firms.. One of the large firms preferred to remain anonymous andwill be referred to as “Company A” in the text.
Market Assessment Methodology
OverviewOne of the key conclusions of our investigations is that the companies entering theAVI/L market did very little formal market research in terms of conducting surveys,focus groups etc. Because this is strictly a commercial product, the market researchthat was done tended to be informal, primarily through direct contact between companyrepresentatives and customers.
To the degree that formal market research was done, the level and type of marketresearch that firms undertook in assessing the market for AVI/L services wasdetermiued by two factors:
l Whether the firm was an early entrant, when the market was still undefined, orentered after the market had been established. Early entrants typically did a moreextensive job of market research than did the later entrants.
Automatic Vehicle Identification/Location Case Study
l Whether the AVI/L product was the firm’s only product, or was an extension of anexisting product line. Because the risk for single product firms is higher, theytended to do more market research.
One general observation that can be made is that regardless of the level of effort andrigor put into the market assessments, they were almost universally inaccurate. Mostmarket participants overestimated the market size by a wide margin. Some of themarket segments initially considered to be lucrative, did not prove to be so. In addition,the one segment that is providing revenues, the heavy trucking industry, is developingmore slowly than originally thought.
The following sections provide details of our market assessment findings. Thediscussion is divided into six sections:
. Needs assessment,
. Willingness to pay,l Market size and penetration,. Market segmentation,l Profitability, andl Risk assessment.
Needs assessmentNeeds assessment was one area where the research tended to be quite informal.Determination of customer needs was made through contacts and informationexchanged via executive meetings. Private research/consulting firms were also used toconduct interviews with potential customers to defme the range of potential needs.
Company A used its strong sales force and significant customer base in the two-wayradio market to gain access to information on the changing needs of customers. Usingthe information gained, Company A used industry meetings/conferences as a forum forits marketing and sales programs which were designed to address the developingmarket needs.
Fleet Telecom conducted their market needs assessment in a two fold manner. First,prior market assessments by outside consulting groups (such as Watters, Inc., and theGartner Group) were studied to get an initial “read” of the market. The firm then hiredan executive from a transportation company to conduct interviews with industryexecutives to define their needs.
Qualcomm used a similar approach. The company founders themselves conductednumerous interviews with industry leaders to define the needs of their potentialcustomers. The results of these interviews led them to the conclusion that thetechnology they bad previously developed for satellite communications could also beused effectively to address the perceived communication/location needs of thetransportation industry.
42
Automatic Vehicle Identification/Location Case Study
In the early 1980s, when the development of the market for AVI/L products first began,the market could be characterized as “technology pull.” The need for AVI/L wasgenerally latent, meaning customers did not perceive a strong need, and there was noobvious market pull. Some trucking firms did grasp the potential advantages thatcombined tracking and communication systems could offer, but they were rare. Mostpotential customers had to be educated. The efforts of the early suppliers of AVI/Lproducts therefore focused on need development in a sense, rather than needassessment. A central thrust of many of the marketing efforts was development ofcost/benefit analyses that would demonstrate to potential customers the potentialsavings from use of AVI/L.. This gave the sales force a tool to use with customers todemonstrate that they had a need, and concretely show the savings and efficienciesattainable through the use of AVI/L in general, and their product in particular.
The initial successes of AVI/L in the Truckload industry (often a technology leadingsegment) established the potential advantages of AVI/L technology and opened newmarkets in other transportation areas such as the Less-than-truckload business, rail(intermodal), marine, and public transit (bus and taxi). As the market matured and thecustomers came to realize the potential benefits of AVI/L generally, the marketingefforts of the later entrants into the market place focused on the more traditionalmarketing activities of identifying specific needs of the customer and demonstratinghow their product met those needs in a more cost effective manner than theircompetitor’s product.
Willingness to payPricing of AVI/L services varies significantly depending on the level of service andfunctionality provided. As described earlier, these may range from basic two-waylocation and communication, primarily voice with some fixed text messages, tocommunication of significant amounts of vehicle operating data and flexible messagingcapability. The customer willingness to pay depends, not surprisingly, on the perceivedbenefits, particularly the competitive advantages offered by the service. The benefitthat a particular customer will derive from use of AVI/L hinges on a number of uniquefactors of that particular customer’s operations. As a result, the approaches thatsuppliers of AVI/L products used to assess customer willingness to pay basically werean extension of the payback analyses that were used to market the systems in the firstplace. These models were used to derive the expected benefits and then assign a pricethat would be palatable to that customer.
All of the firms that we interviewed settled on using a client-specific approach forpackaging and selling the service. Operational complexities vary from customer tocustomer, therefore, the products are tailored for each saies call. The hardware for eachsystem is the same, but the level of system development and how the tracking softwaremay interact with the client’s pre-existing applications varies. For example, Fleet Trakpurposely designs its product to be transparent of the communication software theclient may have, and Company A’s system is designed to interface with the dispatchsoftware already being used by the potential customers. At the other extreme, there isQualcomm, which sells fully integrated tracking and data communication services. In
43
Automatic Vehicle Identification/Location Case Study
services. In all cases however, post-sale client evaluation and subsequent systemadjustments are the norm.
Market Size and penetrationOur research indicates that many early suppliers of AVI/L products made no explicitattempt to determine what the total potential market for their products would be, nor didthey make any rigorous attempt to segment the market.
For firms that did spend some effort in sizing the market, two methods were used:
l II-Morrow and Motorola - These firms followed a “top down” market assessmentapproach. They considered the size of the entire market, and, by applyingassumptions relating to percent capture and levels of competition, calculated thepotential market size.
l Qualcomm - This company followed a “bottom up” approach. It matched theproduct’s potential benefits to the specific needs of receptive market segments.Adding together the number of potential sales to each market segment yieldedoverall market size.
Using the “bottom up” approach as practiced by Qualcomm, the present day market forAVI/L services in the trucking industry is generally considered to be approximately850,000.
* The trucking industry is the primary end user.
l Within the entire trucking industry, operators of Classes 6, 7 and 8 trucks are theprime target segment. The capabilities offered by AVI/L services are best suited tothis market because these operators tend to run relatively large fleets, with 9 1%being owned and operated as fleets of five or more trucks (See Figure 12 -- Note:The data shown is representative of 1991 data, but industry ownership andoperational characteristics have not varied greatly over time.)
The 2,875,000 class 6, 7 and 8 trucks on the road today are further reduced byeliminating:
l The 40% that are primarily local operators and therefore do not require the widearea location and communication capabilities of AVI/L products.
Of the remaining 60%, or approximately 1,725,000 trucks that operate on a national,regional, and intrastate basis, the final market estimate was derived by eliminating:
l The 50% that are primarily fixed or mixed route operators. These firms have lessvariability in where a vehicle might be, and correspondingly less need for locationand communication.
44
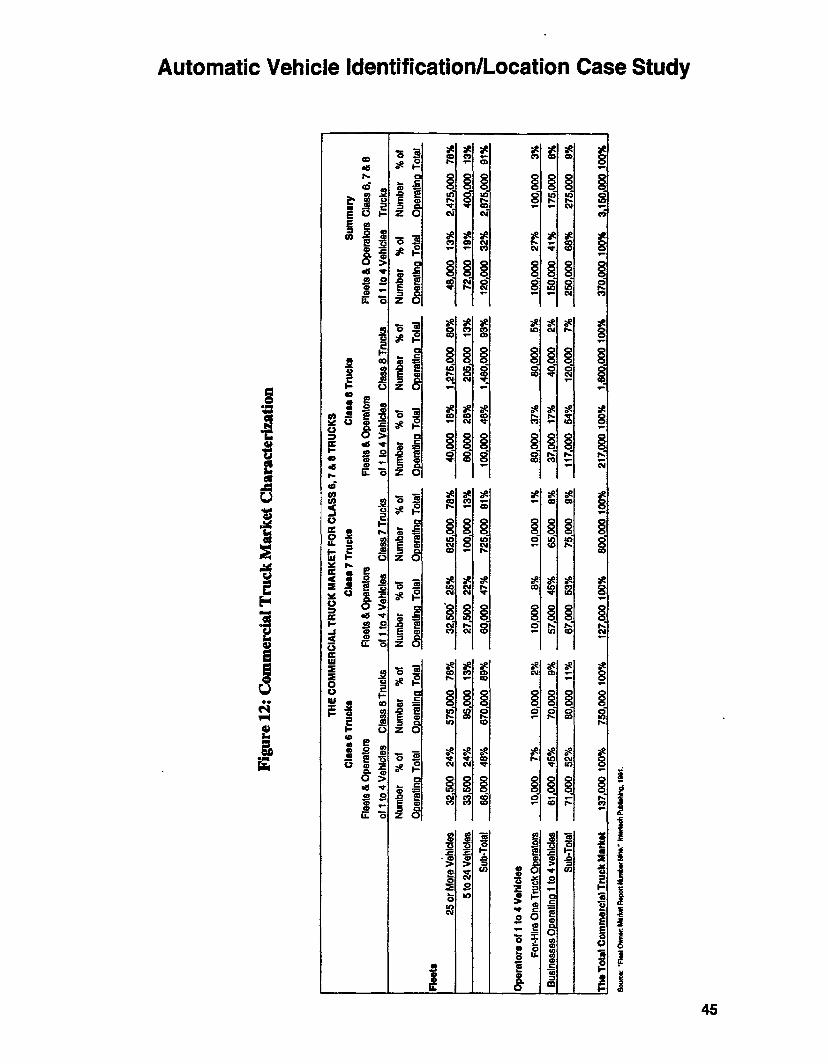
Automatic Vehicle Identification/Location Case Study
The remaining 50% (850,000 trucks) are primarily variable route operators. Theseoperators are the primary target market because they are the least likely to be able topinpoint with any level of accuracy where their trucks are at any given time andtherefore will benefit the most from the use of AVI/L services.
Market segmentationThe above section illustrates the type of market segmentation that most of the firms weinterviewed used in analyzing the market for AVI/L.. The objective of marketsegmentation is to break down the population of potential customers into smallergroups/segments that have similar needs. In the case of the trucking market, the mosteffective way to do this is along operational lines. As illustrated above, thesegmentation variables that are typically used include:
l Fleet Size - Larger fleets are more likely to have a need for, and be able to afford,AVI/L services.
l Range of Operation - Truck fleets that operate on a regional or national basis aremore likely to require AVI/L services. For fleets that operate on a local basis thereare lower cost local communications products available that meet the needs of theseusers.
l Variability of Route - Fleets that operate over variable routes are more likely torequire AVI/L services. Dispatchers for variable route operators can benefit fromthe location part of AVI/L as they are less likely to know at any given time where aparticular truck is.
In addition to this operational segmentation, the early suppliers of AVI/L servicesinvestigated several other possible segmentations:
.
.
.
.
.
.
.
.
.
.
Trailers (e.g., those carrying hazardous materials)Buses (e.g., inter-city, local)Rail (e.g., locomotives, rail cars)Water transportation (e.g., barges, tow boats, fishing boats)Aviation (e.g., commercial, commuter, general aviation)Personal communicationsGovernment agencies (Sate D.O.T.‘s, Police, Fire)Recreation/consumer (e.g., boating, auto clubs)Fixed sitesCar fleets (e.g., business, rental)
These segments generally did not develop, either because there was insufficient needfor this type of service or a more cost effective alternative was available to meet theneed.
Automatic Vehicle Identification/Location Case Study
ProfitabilityThe level of profitability that a supplier can expect depends, obviously, on two factors:l The cost of providing service, andl The revenues that the service generates.
The most critical cost factor is whether the AVI/L product requires a new/dedicatedinfrastructure or uses a preestablished infrastructure. The technology selected byGeostar required a new telecommunications infrastructure using dedicated satellites.The cost of this infrastructure played a large role in the failure of Geostar. Qualcomm,which has been a greater commercial success, based its service on an existinginfrastructure, significantly reducing the cost and allowing higher margins.
The revenue aspects of AVI/L are quite similar to cellular phone services in the sensethat there are two potential revenue streams:l Sale of the initial hardware and installation, andl The subsequent service and network usage fees.
Most of the firms that we interviewed have established a pricing strategy that discountsthe hardware costs so as to generate consistent revenues from service and networkusage. A similar approach has been taken in cellular phones and is typical in caseswhere high fixed costs (such as the infrastructure) must be borne. Examples of AVI/Lsuppliers that have taken this approach include Company A, Qualcomm, and FleetTelecom. The one exception that we found to this rule was Fleet Trak, which prices thehardware at cost.
Actual profitability is difficult to assess as most of the suppliers of AVI/L products areeither relatively small, privately held companies that do not report financial results, orare divisions of large companies where the individual results are not broken out. Thefirms we interviewed were not willing to share the details of their profitability.However, the fact that even a firm offering only this offering (such as Qualcomm) isstill in business indicates that it is a reasonably profitable business, providing importantbenefit to at least some customers.
Risk assessmentThe level of perceived risk and efforts to manage that risk is most directly related to thediversity of a company’s product portfolio and the level of investment required to enterthe AVI/L market. Those companies that had existing applicable technologiesperceived less risk in entering the AVI/L market and thus expended less energy onmarket research and market assessment than did the companies that developed productsspecifically for this application.
For many of the AVI/L suppliers, this market was an expansion from other areas.
l Fleet Trak began product development in the avionics field through a seven yearjoint effort with the FAA. Some public sector work was generated from the successof the initial project. However, it was the contractual arrangements with the FAA
47
Automatic Vehicle Identification/Location Case Study
and the enhancement that the government demanded that provided the initialdriving force in the advancement of the technology that so easily lent itself toterrestrial tracking.
l For Fleet Telecom, the Department of Defense gave $10-$20MM a year from 1983to 1989 for the development of the technology to be used for the securecommunication of classified military information. Three years ago, as defenseconversion became a reality, the company moved toward the private sector with anear fully developed product. Thus, this firm also did not assume a major risk.
l Company A’s perceived risks were in the areas of hardware upgrades and interfacedevelopment. The firm already had a network of Special Mobile Radio transmittersit used for its two-way radio products. However, these had to be upgraded atsignificant cost. As mentioned above, Company A’s product is designed tointegrate the client’s pre-existing dispatching software. This approach mandatedlegal contractual agreements with multiple software providers. The level of effortspent in developing these interface agreements had to be balanced with the size ofthe customer base potentially served.
For companies that embarked on a path of product development specific to the AVI/Lmarket, the risks were perceived to be extremely high and had to be managed.
l Geotech views production and capital costs as risks. It is not able to set pricesbased on recovery of all investment costs, as this could result in prices higher thanthe market would accept.
l Qualcomm is another example of a company managing product development risk.Success has been attained by satisfying the customers explicit and implicit demandsby adding significant value-added applications and systems. But staying ahead ofthe benchmark market offerings means significantly higher costs associated withredesign and marketing.
Actual Market Development
The actual market acceptance of AVI/L services has generally been lower than theprojections of most of the companies that we interviewed. Actual market returnsranged from 95% to 25% below expectations. One firm, II-Morrow, has achievedacceptance that exceeds projections by 10%. But this is best explained by overlyconservative projections than by outstanding levels of sales.
Those companies whose projections were the least accurate followed a “top down”market assessment approach. The companies that followed a “bottom up” marketassessment approach have fared better, with deviations in these cases being attributablemore to unexpected market conditions (i.e., new competitors, latent buyers) and thenational economy than to poor forecasting methods..
48
Automatic Vehicle Identification/Location Case Study
l Qualcomm is by far the most successful in terms of both number of units sold andin generating operational profits.
l Company A has had significant unit sales but has yet to turn a profit.
l Later entrants, such as Fleet Telecom and Geotech, have developmentaltechnologies and are still in the process of obtaining adequate financing.
Most firms are not willing to divulge market projections, with the exception ofGeotech, which expects sales to approach 300,000 units in 1998. Other researchreveals that Qualcomm, the industry leader, has shipped upwards of 40,000 units since1989. This is a relatively small number compared to the potential market size of850,000 trucks..
The poor sales performance relative to the potential market can be at least partiallyexplained by the fact that customers have yet to be fully convinced of the costeffectiveness of AVI/L products. The costs associated with operating one truck over afive-year basis are quite high2:
l $40,000 for a cellular-based system, such as the type offered by Company A,
l $15,000 to $95,000 (based on levels of operational complexity) for a satellite-basedsystem, such as Qualcomm produces,
l Approximately $8,000 for other technologies, such as that offered by FleetTelecom.
Given these prices, customers must realize significant operational savings to justify apurchase.
In addition, customers have concerns regarding AVI/L system capability, longevity andflexibility. These concerns have required suppliers to make wholesale infrastructurechanges and expand application capabilities. Several examples of these issues include:
. Compatibility problems with customer MIS - II-Morrow’s earlier products weredesigned for mainframe application. However, situations developed wheremainframe incompatibility rendered system installation or upgrade impossible. Theresult was a significant product shift toward a personal computer application. ForCompany A, the computer-aided dispatching software interfaces were a stumblingblock. If a potential client made use of a dispatching software with which CompanyA did not have a pre-designed interface, the cost of the system became prohibitive.
2 (Source: Rupert Welsch. “Communications System for Trucks Awaits Approval”New Technology Week. June 1, 1992.)
49
Automatic Vehicle Identification/Location Case Study
l Concern with infrastructure availability - For the satellite service companies such asQualcomm and Geotech, there is still marked concern over satellite networks.Third-party firms are responsible for the development and subsequent launch of thesatellites. Due to the poor track record of the United States satellite industry,satellite availability remains an issue. Similar large scale infrastructure variablesaffect Fleet Telecom. The company is still in the process of coordinating financingto build a nationwide network.
l Requirement for more value-added applications - Potential customers also demandthat the data made available through AVI/L services be suitable for more productiveuse. High-end service providers, such as Qualcomm and Company A, have createdvalue-added system extensions. Qualcomm is looking into OEM agreements thatmay eventually tie in engine, cab, and trailer safety/operational information to thedata network. This will allow for more efficient repair and servicing. Company Ahas upgraded its in-cab computer console to accept multiple peripherals, such as laptops, bar code readers, and fax machines, which is an industry first. These advancesmay allow for immediate invoice delivery. These wireless data advances havespurred Company A to begin marketing an “off-the-shelf” system to low-end usersthrough its preexisting retail network, a move that has met with marginal success.Although Company A is joined by other providers such as Qualcomm and Geotechin the belief that AVI/L has consumer potential, most producers feel the cost is tooprohibitive to justify offering service at a consumer level.
As this substantial product evolution demonstrates, AVI/L without mobile datacommunications offers little value to the market because it cannot address most real-world mobile applications. Furthermore, the continued market latency demonstratesthat the present methods of combining navigational/location applications with separatedata communication links are still considered too expensive. The technologicalresponses to market demands for information richness, efficiency, and costeffectiveness will continue to reshape the industry.
Lessons Learned
The AVI/L market development offers several potentially useful lessons for how toapproach the ATIS market. One unique aspect of this market is that it has not beenparticularly successful, and many of the factors that have contributed to the lack ofsuccess could potentially be present in ATIS as well.
l It is important to get the product “right” the first time out. Geostar, the firstcompany into the market, had significant troubles with its early product. Geostarnever really recovered from those problems. It is also possible that the difficultiesexperienced by Geostar have contributed to the slow development of the market, aspotential customers are wary of similar problems with other suppliers.
l Marketing effort should be proportional to the risk being taken. There is ademonstrated higher level of risk for firms that offer only one product as opposed
50
Automatic Vehicle Identification/Location Case Study
to firms for which the AVI/L product is just one in a larger portfolio of products.Risk is correspondingly high for those firms that are the first to enter the market.
l Marketing messages change as the industry evolves. Strategies changed fromconvincing the buyer to buy the product through a payback analysis, to convincingthe buyer to buy your product through a price-for-feature comparison. This dualityof approach is apparent during the development cycle of a latent market.
Overestimating customer needs and willingness to pay can lead to overestimates ofthe market size. The “bottom up” approach to market estimates produced betterresults as it forced a closer examination of customer benefits. The “top down”approach consistently resulted in overly optimistic forecasts. However, most of theestimates of AVI/L market size were excessive, irrespective of the approachExplanations for the over blown market estimates include the pervasive effects ofexcessive optimism as well as delays in service offerings and/or product roll-outsresulting in time shifts for market projections.
l Pricing seems to be based largely on cost. Generating a reasonable rate of return isthe most significant contributing factor to pricing. Many firms have committed nosignificant capital expense in creating new infrastructure and risks have been low.Therefore sustained profits are expected. Attention, of course, is paid to thecustomers’ willingness to pay as well as competitive factors. The pricing strategymakes a careful distinction in willingness to pay upfront versus on an ongoingbasis. Cost recovery is achieved by balancing low up-front costs for purchasing theunit hardware with a significant service charge.
l To be successful, careful attention to what customers really need is required. Justproviding data (e.g., the truck’s location coordinates) does not help the customers asmuch as giving value-added-information (e.g., status of driver and vehicle, ETA todelivery point) that the client needs to run the business.
51
Application To Advanced Traveler Information Systems
The overall objective of this study is to assist the FHWA in understanding how marketresearch is used in the private sector to predict consumer and market response to newand innovative products. The above sections have provided illustrations and examplesof market development and market research used by existing products/services that areanalogous to ATIS.
The specific objective of this section is to apply the lessons learned in the case studiesto possible future market research activities for ATIS, and identify particular caveatsand opportunities for those activities.
As noted in the introduction to this report, the primary objective of market research isto better understand the potential customers for a given product. Before applying thelessons derived from the case studies, a brief outline of ATIS and some of the expectedcharacteristics and benefits of ATIS will be presented. This will provide the necessarybase to analyze the lessons derived from the case studies and the implications of theselessons for ATIS.
What is ATIS?
The IVHS strategic plans defines ATIS as:
“Advanced Traveller Information Systems (ATIS) acquire, analyze, communicateand present information to assist surface transportation travelers in moving from astarting location (origin) to their desired destination.”
Clearly this leaves a wide range of potential products that could fit into this definition.Before moving into market research on ATIS, the specific products and services mustbe more precisely defined. In order to effectively define customer needs/wants (one ofthe main objectives of market research) the main features of a product must be definedas well as the range that is available in each of those features. This allows the marketresearch to be designed to test relative importance of each features and what level ofeach feature is required.
As an example of this process, ATIS services can be well defined by three key features:
i) Level of “Intelligence” - In order to clarify this feature it is useful to make adistinction between “data” and “information.” “Data” is an item to which no valuehas been added. “Information” is a piece of “data” that has been processed in someway to provide added value. In the context of ATIS, a map (whether displayed onpaper or electronically) is “data,” no value added has been provided to assist thedriver in their task. Route guidance, on the other hand, is " information,” as the datain the map has been processed to assist the driver reach their desired location.
A minimum of three levels of “intelligence” can be defined:l Data Only - This includes maps, most signs, timetables and information on
location of services.
52
Application to Advanced Traveler Information Systems
l Static Information - Route guidance and other types of assistance that does notinclude connection to traffic information.
l Dynamic Information - Route guidance and other types of assistance that iscombined with traffic information.
2) Update Frequency - How often is the data updated. While there is a wide range ofupdate frequencies, three ranges appear reasonable:l Periodic - Several years (Maps) to several months (statistical time-of-day and
day-of-week traffic information).l Frequent - 15 to 45 minute updates similar to the frequency of present traffic
helicopter services.l Real Time - 0 to 15 minute updates.
3) Delivery Point - Where the data/information is provided. Here again, at least threepossibilities are available:l Fixed Point - In home, Kiosk, Signs.l Dedicated In-Vehicle - Navigation and other systems built into the vehicle.l Transportable - The advent of Personal Digital Assistants (PDA’s) is likely to
give rise to a set of products that are fully mobile.
When the product features and ranges are correctly selected, the entire universe ofpotential products cau be defined through combinations of those features. Within eachproduct feature, the options imply increasing levels of complexity and cost.
Benefits of ATIS
Returning again to the definition of ATIS in the strategic plan, an indication of theexpected benefits from ATIS are given by the statement that ATIS systems will:
“provide such assistance in a manner that best satisfies the travelers needs forsafety efficiency and comfort. " "
l Safety can be enhanced by ATIS through allowing the driver to concentrate ondriving rather than navigating, avoidance of congested areas, avoidance of highcrime areas etc.
l Efficiency can be improved by reducing the time required to locate and get to thedesired location, avoiding trips entirely during congested times, etc. This isgenerally believed to be the primary individual benefit provided by ATIS.
l Comfort can be enhanced by reduced anxiety of not being certain of a given route.
In addition to the above individual benefits, ATIS has the potential to provide societalbenefits such as reduced pollution and fuel consumption.
53
Application to Advanced Traveler Information Systems
Lessons Learned and Application to ATIS
This section will present a summary of the “lessons learned” from one or more of thecase studies, and a discussion of how those lessons can be applied to ATIS. This willbe presented in the same categories used in the case studies (Needs Assessment,Willingness to Pay, Market Size, etc.).
The majority of the key “lessons learned” relate to the first two categories, needsassessment and willingness to pay. This is a reflection of the fact that these are the twokey objectives of market research. Most of the other categories can be derived from theassessments of these two issues. For example:
l Market size can be derived from the combination of the needs assessment and thewillingness to pay. Market size will be determined by the number of customerswho indicate sufficient need aud willingness to pay.
l Market segmentation is a derivative of the needs assessment. Market segmentationis simply defining sub-sets of customers that have similar sets of needs.
Needs AssessmentAn accurate assessment of customer needs is arguably the most critical market researchtask. The needs that are uncovered by market research are used to drive the productdevelopment process. They will determine what features are built into the product,which in turn, will play a major role in determining product cost. Cost obviously has amajor impact on the ultimate market success or failure of the product.
For ATIS, there is evidence that travellers have at least a basic need for travelinformation -- they buy maps and guidebooks, they listen to radio traffic reports, etc.The objective of market research into ATIS should be to significantly refine theunderstanding of that need. Before undertaking market research, a set of hypothesesshould be developed about what the expected needs are. In the case of ATIS thehypotheses should be formed around several basis questions:
l What types of traffic intelligence do travellers require?- How do the intelligence requirements vary by customer segment (private versus
commercial, commuter versus infrequent user, etc.).
l What level of intelligence do travellers require?- Dataonly?- Value-added Information?- At what update frequency do travellers require that intelligence?
l Where and how do travellers want to receive that intelligence?
The case studies offer a number of lessons that can be used to guide the market researchdesigned to answer these questions.
54
Application to Advanced Traveler Information Systems
Don’t underestimate the difficulty of accurately assessing customer needs. Two of thethree case study markets were substantially mis-forecast, and in the case of ETC it isstill too early to tell. The cellular phone market was under estimated, in part at leastbecause the range of customer needs and the uses that customers would find for cellularphones was underestimated. The AVI/L market was over estimated in large partbecause the customer needs were over estimated.
Customer needs can be more accurately assessed by presenting realistic representationsof the product/service. This was done in the ETC market through the use of videotapesand computer simulations. Operational tests are often used largely to get a real worldproduct assessment. The difficulty with operational tests is that they are limited to thetechnology that is currently available, which computer simulation is not. The accuracyof assessing customer needs can also be increased by using several different assessmentmethods and “triangulating” (comparing results of several methods) the results to testthe robustness of any one method.
Fiially, it should be recognized that even consumers themselves cannot alwaysaccurately predict what their future needs and potential uses for a product will be. Topredict very long term needs, it is often more effective to use an “expert” approach(either an individual or a Delphi type survey) rather than go directly to the consumer.This approach was taken by several of the participants in the ETC market.
Recognize the existence and importance of multiple customers/stakeholders. In almostall markets there are multiple customers, each of which has an influence on the buyingprocess. The needs of each of those groups must be explicitly recognized andaddressed to enhance the opportunity for market success.
In some cases the multiple customer groups are quite obvious. In the ETC market, thedriving public and the toll authorities make two distinct and obvious customer groups.However, even for a product such as AVI/L, where the primary customer might be theFleet Manager or Dispatcher, the needs of others impacted by the use of AVI/Lproducts -- drivers, maintenance -- should be explored.
This type of customer chain can be defined for most products (see Figure 13), and islikely to be a very strong factor for ATIS. At a minimum, ATIS will have severallevels of customers within the traveling public, as well as other stakeholders at the stateD.O.T.‘s, other government agencies and private firms providing ATIS services.
55
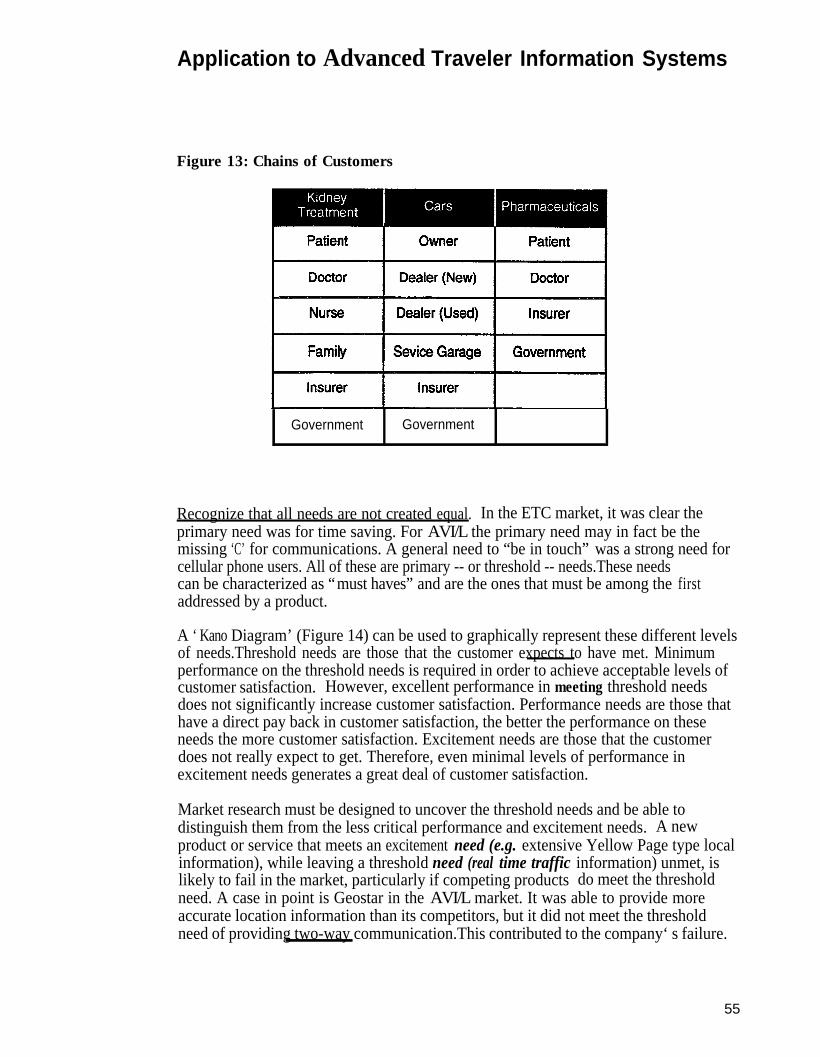
Application to Advanced Traveler Information Systems
Figure 13: Chains of Customers
Government Government
Recognize that all needs are not created equal.. In the ETC market, it was clear theprimary need was for time saving. For AVI/L the primary need may in fact be themissing ‘C’ for communications. A general need to “be in touch” was a strong need forcellular phone users. All of these are primary -- or threshold -- needs.These needscan be characterized as “must haves” and are the ones that must be among the firstaddressed by a product.
A ‘Kano Diagram’ (Figure 14) can be used to graphically represent these different levelsof needs.Threshold needs are those that the customer expects to have met. Minimumperformance on the threshold needs is required in order to achieve acceptable levels ofcustomer satisfaction. However, excellent performance in meeting threshold needsdoes not significantly increase customer satisfaction. Performance needs are those thathave a direct pay back in customer satisfaction, the better the performance on theseneeds the more customer satisfaction. Excitement needs are those that the customerdoes not really expect to get. Therefore, even minimal levels of performance inexcitement needs generates a great deal of customer satisfaction.
Market research must be designed to uncover the threshold needs and be able todistinguish them from the less critical performance and excitement needs. A newproduct or service that meets an excitement need (e.g. extensive Yellow Page type localinformation), while leaving a threshold need (real time traffic information) unmet, islikely to fail in the market, particularly if competing products do meet the thresholdneed. A case in point is Geostar in the AVI/L market. It was able to provide moreaccurate location information than its competitors, but it did not meet the thresholdneed of providing two-way communication.This contributed to the company‘s failure.
55
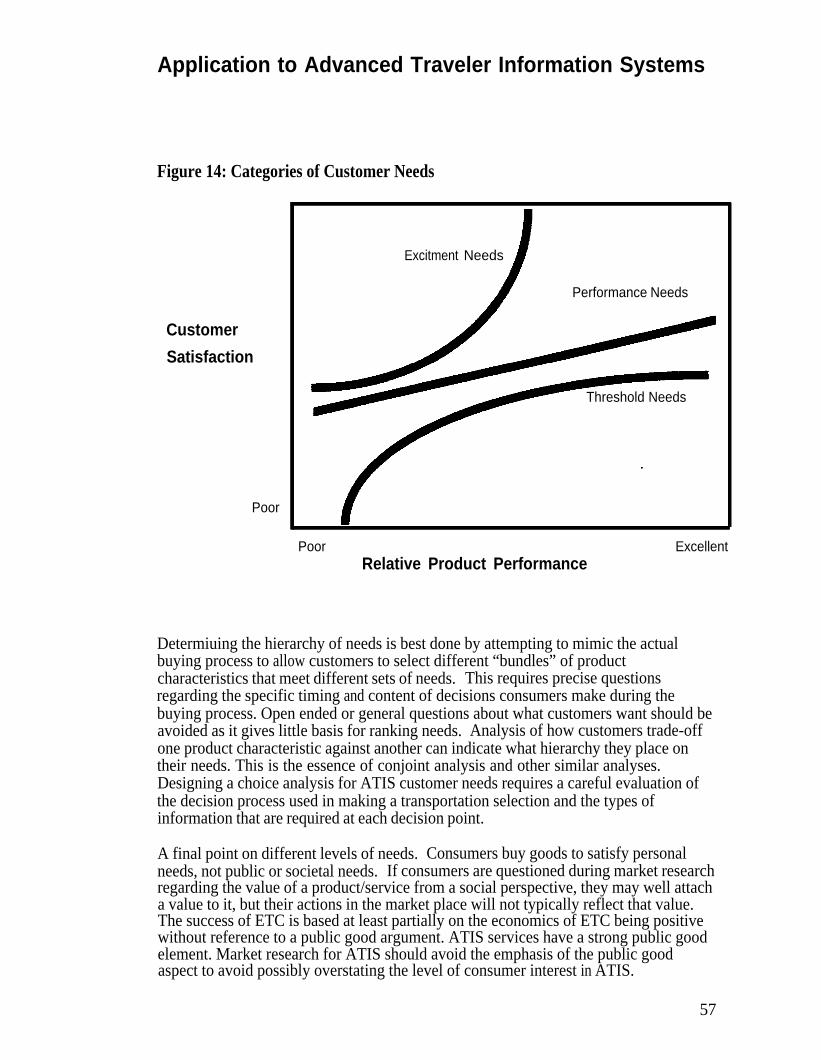
Application to Advanced Traveler Information Systems
Figure 14: Categories of Customer Needs
CustomerSatisfaction
Poor
Excitment Needs
Performance Needs
Threshold Needs
PoorRelative Product Performance
Excellent
Determiuing the hierarchy of needs is best done by attempting to mimic the actualbuying process to allow customers to select different “bundles” of productcharacteristics that meet different sets of needs. This requires precise questionsregarding the specific timing and content of decisions consumers make during thebuying process. Open ended or general questions about what customers want should beavoided as it gives little basis for ranking needs. Analysis of how customers trade-offone product characteristic against another can indicate what hierarchy they place ontheir needs. This is the essence of conjoint analysis and other similar analyses.Designing a choice analysis for ATIS customer needs requires a careful evaluation ofthe decision process used in making a transportation selection and the types ofinformation that are required at each decision point.
A final point on different levels of needs. Consumers buy goods to satisfy personalneeds, not public or societal needs. If consumers are questioned during market researchregarding the value of a product/service from a social perspective, they may well attacha value to it, but their actions in the market place will not typically reflect that value.The success of ETC is based at least partially on the economics of ETC being positivewithout reference to a public good argument. ATIS services have a strong public goodelement. Market research for ATIS should avoid the emphasis of the public goodaspect to avoid possibly overstating the level of consumer interest in ATIS.
57
Application to Advanced Traveler Information Systems
Account for changing needs over time. Long term product planning can be facilitatedby market research that results in a ranking of needs. As markets develop and externalenvironments change, consumer needs also change. A typical progression is for needsto move down and to the right in the Kano diagram (Figure 14). Performance needsquickly become threshold needs as the consumer comes to expect them, excitementneeds evolve into performance needs and new excitement needs are uncovered.Cellular phones provide an excellent example of this as the products moved from large,vehicle based units, to relatively large portable units to the “flip phones” availabletoday.
Efficient long term product cycle planning requires that there be a rational plan to addfeatures and upgrade the product. To do this, market research must provide some inputas to the likely progression of needs. This will be particularly important to effectiveplanning for ATIS, as there are natural extensions to the service that can be added asthe technology becomes available, and as costs are reduced through increased marketvolume. The IVHS Strategic Plan has recognized this progression in the identificationof three stages (information, advisory, and coordination) of development of ATIS.
Take care to avoid over promising. Consumer expectations that are greater than whatcan actually be delivered can depress the market for products that in fact provide realvalue. Those expectations can come from a number of sources, but market research canin some cases inadvertently contribute to unrealistic expectations. If the “products” and“features” tested in market research are not ones that can feasibly be supplied, this canset expectations in the minds of those surveyed. In the ETC market research, the rangesfor potential time savings and speed through the toll booths were generally keptunderstated to avoid this problem.
Willingness to PayAlong with needs assessment, determining consumer willingness to pay is clearly acritical objective of market research. However, even willingness to pay could beconsidered to be derivative from the needs assessment, as it is essentially just a measureof the strength of the need.
Commercial customer willingness to pay is easier to define than consumer willingnessto pay. Market research on products aimed at commercial customers is generally easierand more accurate than consumer market research. Commercial needs are generalIyclearer. Willingness to pay is based on relatively concrete financial assessments. Timehas a clearer translation to money for commercial customers, therefore, products thatoffer time saving (all of the case study products as well as ATIS) are easier to justify inthe commercial sector. Given this, a strategy for early applications of ATIS may be totarget them at commercial customers where the benefits will be more clearlyrecognized.
Application to Advanced Traveler Information Systems
Consumers are willing to pay for time saving. A critical issue in determining consumerwillingness to pay for ATIS is determining their willingness to pay for time saving.Unlike the commercial sector, it is difficult for consumers to quantify how they arewilling to trade off money for time. The case studies are encouraging for the ATISoutlook as they offer several indications that consumers are willing to pay for timesaving.
In the ETC research, time saving was the major benefit perceived by potentialcustomers. Time saving was given as the primary reason they would buy an ETC tag.Work done by the California Private Transportation Corporation also noted thatconsumer’s willingness to pay for time savings depended on the time of day. Peoplewould pay a greater premium to get home from work quicker than they would pay toget to work quicker.
The ETC market illustrated one other important lesson, the willingness to pay for timesavings depends on the certainty of the outcome. The acceptance of ETC was lower inthose areas where there was significant congestion downstream of the toll facility, andtherefore, there was less certainty that buying an ETC tag would actually save drivingtime.
While not explicitly addressed in the market research for cellular phones, time savings(or better use of time spent traveling) is clearly one of the benefits offered by thatproduct. Using a revealed preference argument, the success of cellular phones isfurther indication that consumers will pay for time saving.
Examples of several different methods of detemining willingness to pay were used inthe case studies. The most widely used is conjoint analysis or other choice analyses.
Research into willingness to pay for ATIS should initially focus on defining whatfactors determiue willingness to pay. Is time of day a factor as was found in ETC? Isupdate frequency the most critical factor? Update frequency may be a very significantissue because it addresses the outcome certainty issue discussed above, i.e. people useupdate frequency as a proxy for certainty that the information is correct and that actingon that information will actually save them time.
Accuracy of willingness to pay information is enhanced bv conducting: research withthe primary decision maker. In market research, consumers often overstate theirwillingness to pay for a product/service. This is because the market researchenvironment is inherently artificial, and people are not spending “real ” money. Thecloser market research can get to a “real” transaction, the greater the confidence in theresults. The cellular phone case study provides several relevant examples of methodsused to overcome this problem.
The first method is to ensure that the market research is conducted with the truedecision maker in a given economic unit (household). Researching the willingness topay of someone that is not likely to be the final decision maker moves the processfurther from a “real” transaction and will therefore reduce confidence in the results. For
59
Application to Advanced Traveler Information Systems
ATIS, selecting the correct population to research should be relatively straight forwardas the decision maker is likely to be the vehicle owner.
The second is to apply a discount factor to the willingness to pay and market sizeprojections. The discount factor used would typically be derived from historicalexamples of similar products. The danger in this procedure is clear -- that aninappropriate discount factor will be used. In the case of cellular phones, the discountfactor applied was apparently too high, at least partially explaining the underforecasting of the market size. The difficulty in applying this procedure to ATIS isfinding relevant historical examples on which to base the discount factor.
This issue is also further argument for the value of operational tests. Operational testsallow for testing of “real” transactions and therefore potentially offer the strongestevidence. However, the pricing used in operational tests must be realistic (notdiscounted) to ensure accurate results.
Willingness to pay is influenced bv economic and non-economic factors. The relativeaffluence of the 1980s, and the attitudes toward consumption spending in the 1980s nodoubt had an impact on the success of cellular phones and a number of other consumerproducts. If those products were launched in the “frugal 90s” tbe results may have beenquite different. In evaluating the future success of ATIS, one of the factors to consideris the influence of temporal social and economic values.
One method of dealing with this issue is to carefully “position” the market researchparticipants by creating and describing in detail the expected environment of the timeperiod that you want them to forecast. These efforts to put participants “into” the futureenvironment are another example of the more general requirement that the marketresearch environment should approximate reality as closely as possible. For ATIS thiswill mean carefully crafting the expected congestion levels, economic factors etc.
Customers appear to be comfortable with monthly charges rather than high up frontcosts. Cellular phones are a good example of this. Service companies heavilysubsidize the cost of equipment in order to get people to sign up. A similar tact is takenin AVI/L. Another example outside of the case study industries is cable television.
On the hardware side, experts in automotive electronics see roughly $300 as the pricepoint that is required to allow widespread acceptance. Cellular phone sales expandedrapidly when prices reached this level. Sales of in vehicle CD players have not reachedhigh penetration levels, in part because prices are generally above $300.
The hardware price issue will be most important in the early stages of ATIS, when mostof the products will be self contained route guidance products (as are available today).The monthly service price issue will become more important as ATIS reaches the pointwhere availability and interaction with real time traffic information becomes a centralneed.
60
Application to Advanced Traveler Information Systems
Customers are more likely to attach real value to something that they use frequently.Market research for ETC supports this conclusion. The drivers that were the mostlikely to participate in ETC programs were those that used the toll road frequently.Automotive electronics experts believe this is true in all automotive areas. This factmay limit the acceptance of some advanced electronic equipment such as enhancedvision systems because the usage would be too infrequent. The implication for pricingof ATIS services is that prices should be set so as to encourage frequent usage even ifeach usage is of relatively low value.
Market SizeGiven the level of inaccuracy of market size forecasts that is evident in all of the casestudies it is difficult to draw many firm conclusions in this area The companies thathad greater forecast accuracy tended to use a “bottom up” approach to forecasting. Thismethod defines a profile of those groups that are likely customers and then estimatesthe size of the population that has that profile. An advantage of this approach is that itis a natural extension of market research efforts to define and segment customer needsand requirements.
Risk AssessmentA clear conclusion from the case studies is that the need for market research isproportional to the perceived risk in entering a new market. Where little risk isperceived, there is little need to do market research. The perceived risk is influenced bya numerous factors including:
Size of the required investment - Lower investment implies lower risk. Whereproduct investment requirements are low, the size of the investment in marketresearch will appear relatively higher, which would again discourage the use ofmarket research.
Product portfolio - Single product firms are likely to perceive greater levels of riskthan multi-product firm. In the ETC market, AT/Comm, which was establishedspecifically to produce an ETC product as their only product, conducted the mostextensive market research.
Level of consumer familiarity with the product/service - Market research efforts areoften most extensive and varied where the product is one that is relatively new orunfamiliar to consumers. In this case several different methods are oftenundertaken to investigate the market. This allows “triangulation” to raise theconfidence level in the overall results.
61
Application to Advanced Traveler Information Systems
The perceived risk to entering the market for ATIS products will vary substantiallydepending on the specific product, but several factors will mitigate that risk:
l Investment - The initial public sector investment required for many of the earlyproducts will be relatively modest. These products will be stand-alone products thatdo not require a significant infrastructure, and in many cases will be derived frommodifications of existing products. As ATIS moves from the information stage tothe advisory and coordination stage, the public sector investment requirements willincrease significantly. At this point there will be a strong need for credible, in depthmarket research that can be used to support that investment.
l Product portfolio - The majority of the companies that are likely to play a majorrole in ATIS will be large, diverse companies (AT&T, Hughes, Rockwell etc.).Most of the component technologies required for ATIS products are used in otherproducts (wireless communications, vehicle identification, etc.) and the applicationto ATIS will be an extension of other products rather than an entirely new venture.
l Consumer familiarity - There is likely to be a slow evolution of the introduction ofATIS products. Consumers will be moved relatively slowly from the paper maps oftoday to electronic maps to voice output route guidance, with a similar progressionoccurring in other product areas. Therefore the “leap” that consumers will have tomake to adjust to the use of each new product will be quite small, and the riskaccordingly will be lower as well.
A final point on perceived risk to the ATIS market. Apart from some concerns raisedin the ETC market, the participants in the case study industries did not see governmentinvolvement in their market as an important risk factor. It is unlikely, therefore, thatthe existence of the government as one of the expected stakeholders in ATIS will pose asignificant impediment to companies entering that market.
Conclusion
This report has outlined the market research experiences of three transportationcommunications products that are analogous to ATIS products.
Many of the lessons learned through analysis of these case studies are quite positive forthe outlook for ATIS:
. There are indications that both commercial and consumer customers have bothexplicit and latent needs for ATIS like services.
l Both commercial and consumer customers have indicated a willingness to pay fortime saving products/services. Time saving will be a primary benefit of ATIS.
l There are several factors that may serve to mitigate the perceived risk in enteringthe market for ATIS products/services.
62
Application to Advanced Traveler Information Systems
The caveats indicated by the case studies prelate primarily to one factor that can betaken as the key message for ATIS. That message is that the single most critical issuefor market research is a careful, complete investigation of the true needs, and therelative importance of those needs, of all levels of customers. The focus of marketresearch into ATIS should be in implementing and refining innovative methods ofunderstanding the true customer needs. This will provide the greatest contribution tothe successful development of the market for ATIS and all of the corresponding societalbenefits that are possible from ATIS.
63
Date: January 20, 1994
To:CC:
John O’Donnell
From: Tom ParishLoc: 35/245Ext: 5416
Subject: Case Studies and Briefing Book FilesRe: 42936
Enclosed is the photo ready version of the ATIS Case Studies. We can still makewhatever changes you want also.
I also put in the WordPerfect and Freelance files for Chapter 3 (Product Cycle Plans) ofthe Briefing Book. I know you wanted the Financial Section first, but those files areproving more elusive - but I am confident we will have them for you soon.