Embed Size (px)
Citation preview
Case Studies for Case Studies for UnderstandingUnderstandingGroundwater and Lake Groundwater and Lake IIInteractionsInteractions
Wisconsin Lakes Convention 2008

Case StudiesCase StudiesCase StudiesCase Studies
•• Silver Lake, Barron Co Silver Lake, Barron Co
ddl Gddl G•• Middle Genesee, Middle Genesee, Walworth CoWalworth Co
•• Crystal Lake, Crystal Lake, Sheboygan CoSheboygan CoSheboygan CoSheboygan Co
•• Central sand plainsCentral sand plainspp

The effects of changes in waterThe effects of changes in waterThe effects of changes in water The effects of changes in water level on the water quality of level on the water quality of Sil L k B C tSil L k B C tSilver Lake, Barron County, Silver Lake, Barron County,
WisconsinWisconsin
Dale Robertson and Bill Rose
U.S. Geological Survey, g y,Wisconsin WSC


Average Summer Trophic State of Silver Lake
Eutrophic60
Mesotrophic50
E IN
DEX
40
HIC
STA
T
Oligotrophic30
TRO
PH
TSI - TP
TSI - CHL
201985 1990 1995 2000 2005
TSI - SD
1985 1990 1995 2000 2005

W t B d tWater Budget
Change in Storage = Inputs – OutputsChange in Storage Inputs Outputs
Ground water
ΔS = P + QI + GI – E - Go
Ground water
Precipitation Surface water Evaporation

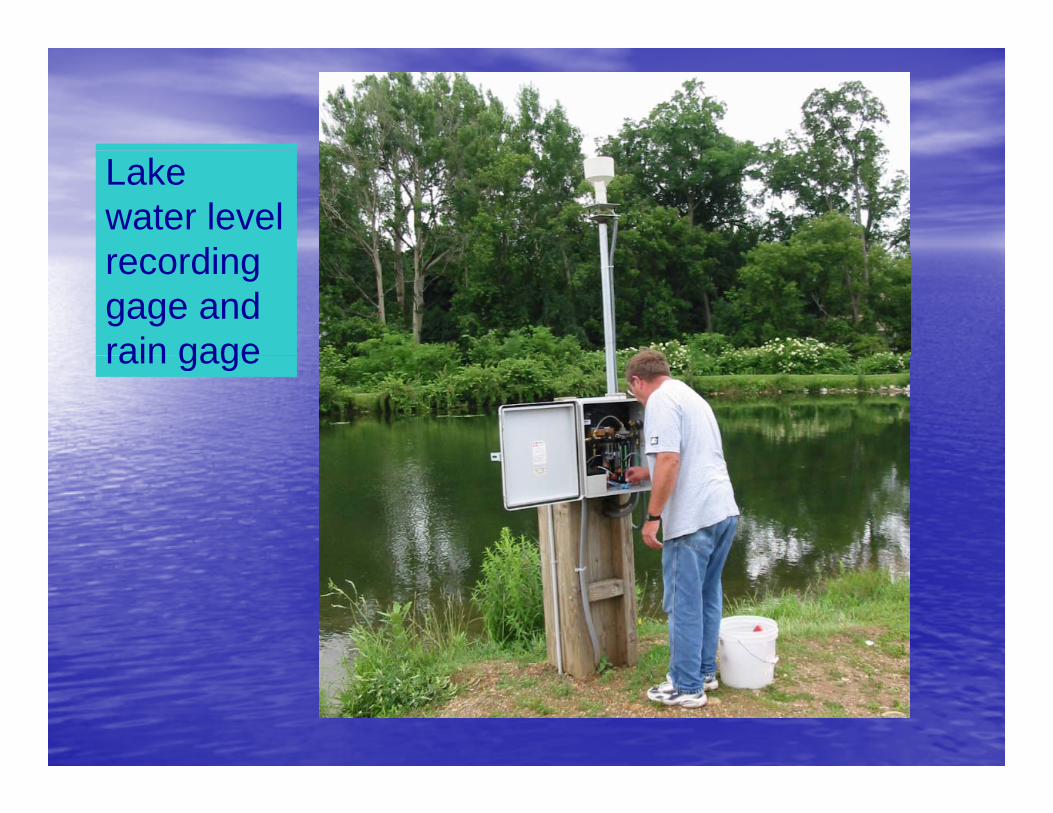
O i i l D i i fOriginal Description of Ground-water Flow


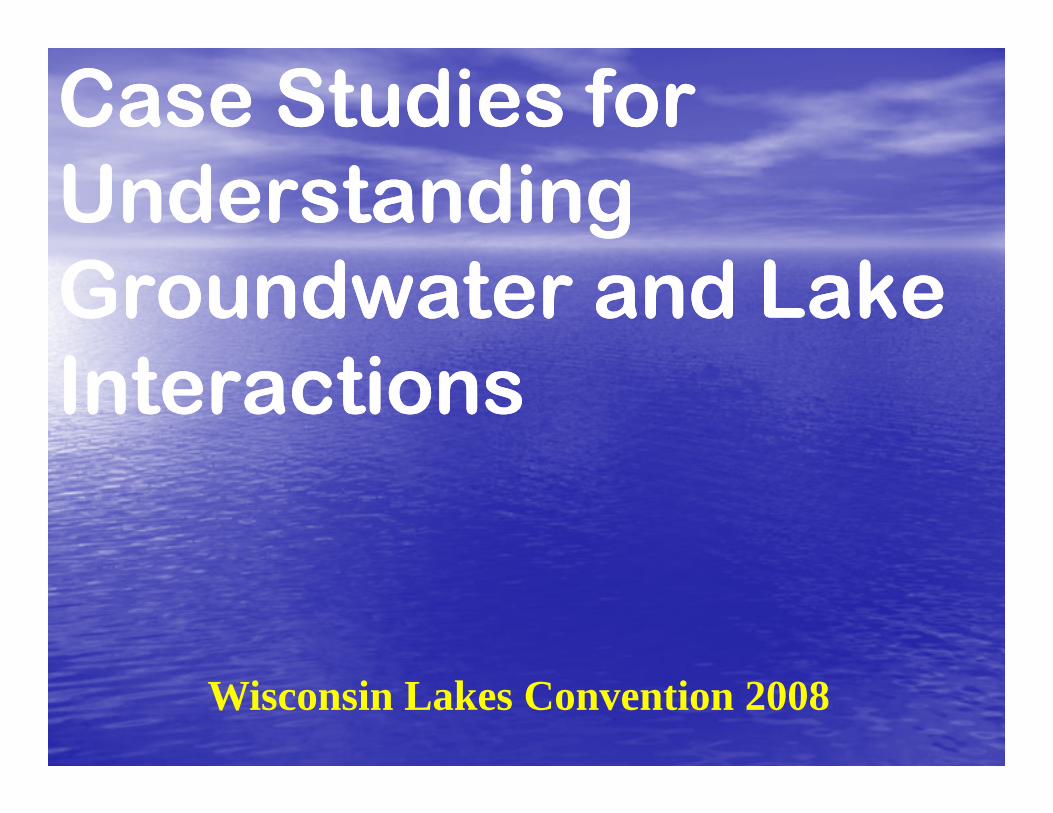
Installation and measurement of piezometerspiezometers
Lake water level
direcording gage and rain gagerain gage
Original DescriptionGround-water flow near Silver Lake
Yellow River
Silver Lake
Original Description
New Description
Yellow River
Silver Lake
Yellow River
Estimated Ground-water Output – 0.1 inches/day
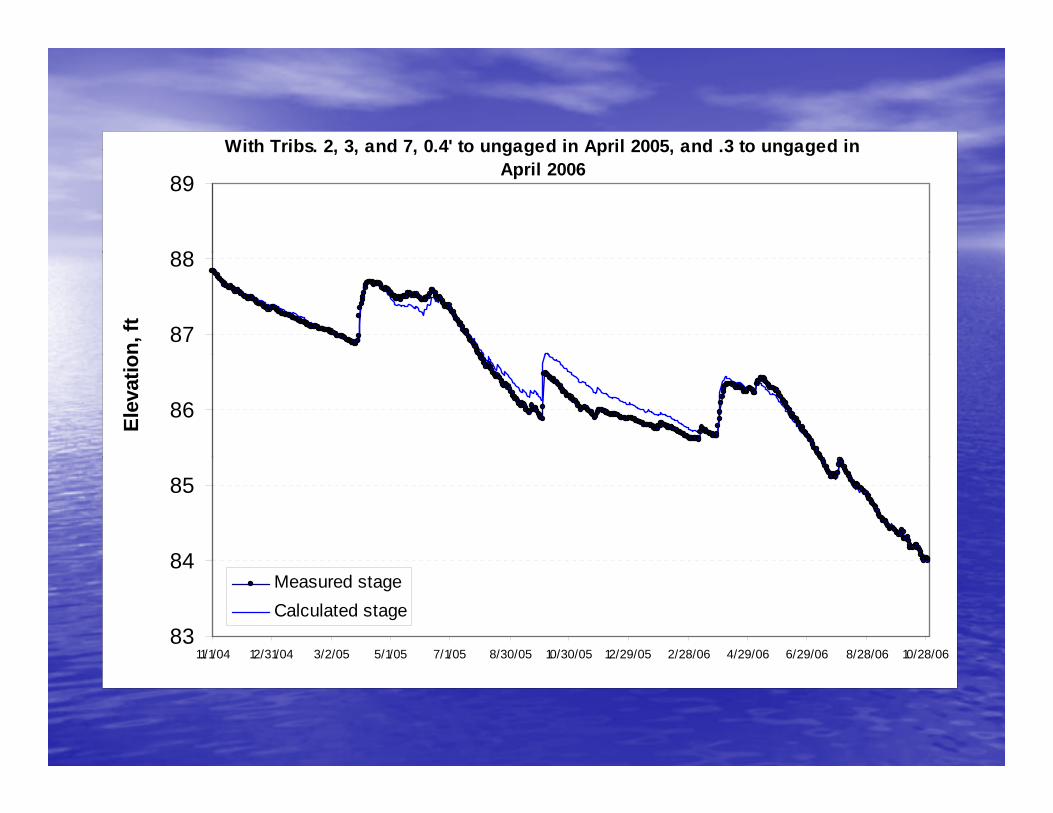
With Tribs. 2, 3, and 7, 0.4' to ungaged in April 2005, and .3 to ungaged inWith Tribs. 2, 3, and 7, 0.4 to ungaged in April 2005, and .3 to ungaged in April 2006
88
89
87
88
n, ft
86
Elev
atio
Preliminary Results84
85
Preliminary Results
83
84
11/1/04 12/31/04 3/2/05 5/1/05 7/1/05 8/30/05 10/30/05 12/29/05 2/28/06 4/29/06 6/29/06 8/28/06 10/28/06
Measured stageCalculated stage

MY2005
Water inputs = 1297 acre-ft
Ungaged
Water outputs = 1777 acre-ft
Ungaged11%
Trib. 711% Evaporati
Precip.68%
Trib. 33%
GW out61%
on39%
68%Trib. 2
7%

Accuracy of the Estimated Water Budget
Monthly water inputs and outputs at Silver Lake300
InputsOutputs +storage change
200
250
cre-
feet
Outputs + storage change
100
150
lum
e, in
ac
0
50
Vo
Nov
. 04
Dec
. 04
Jan.
05
Feb.
05
Mar
. 05
Apr.
05
May
05
June
05
July
05
Aug
. 05
Sep
t. 05
Oct
. 05
Nov
. 05
Dec
. 05
Jan.
06
Feb.
06
Mar
. 06
Apr.
06
May
06
June
06
July
06
Aug
. 06
Sep
t. 06
Oct
. 06

Results Can Now Be Used To:
1. Understand changes in water quality
2. Estimate how the lake should respond to various management alternativesvarious management alternatives
3. Develop a Management Plan for the lake
4. Better able to predict changes in other lakes
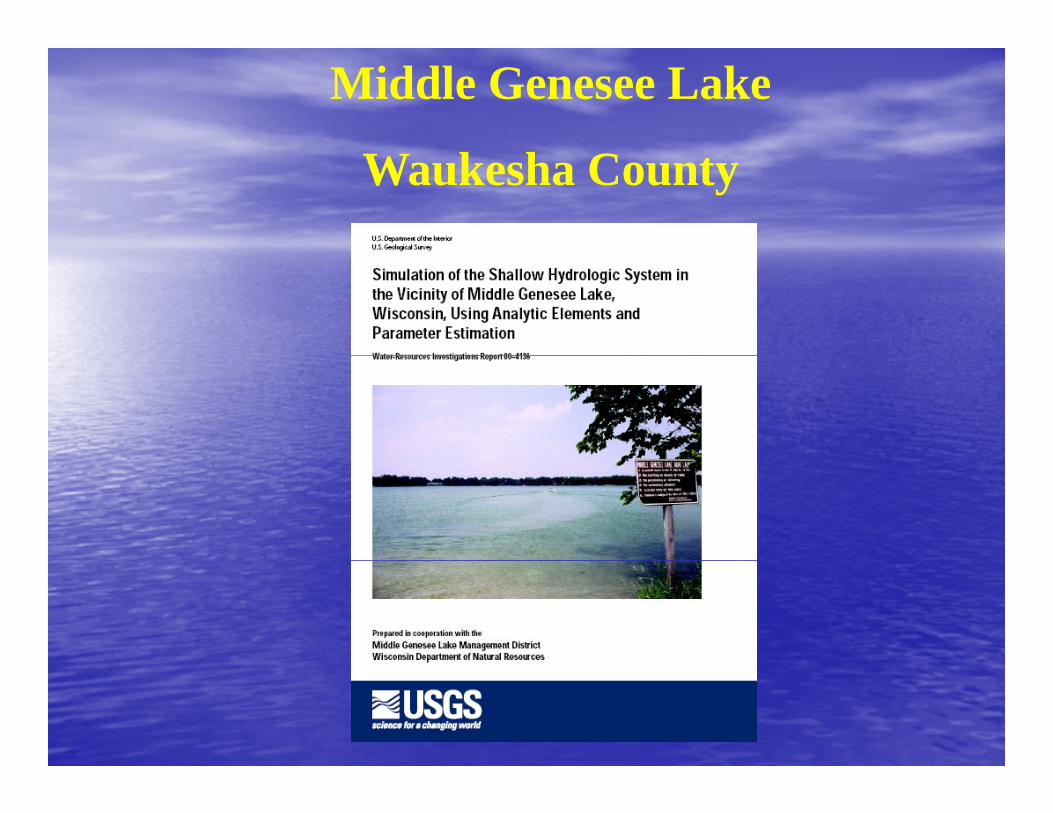
Middle Genesee Lake
Waukesha County

Middle Genesee Study, Waukesha County

Middle Genesee Study, Waukesha County
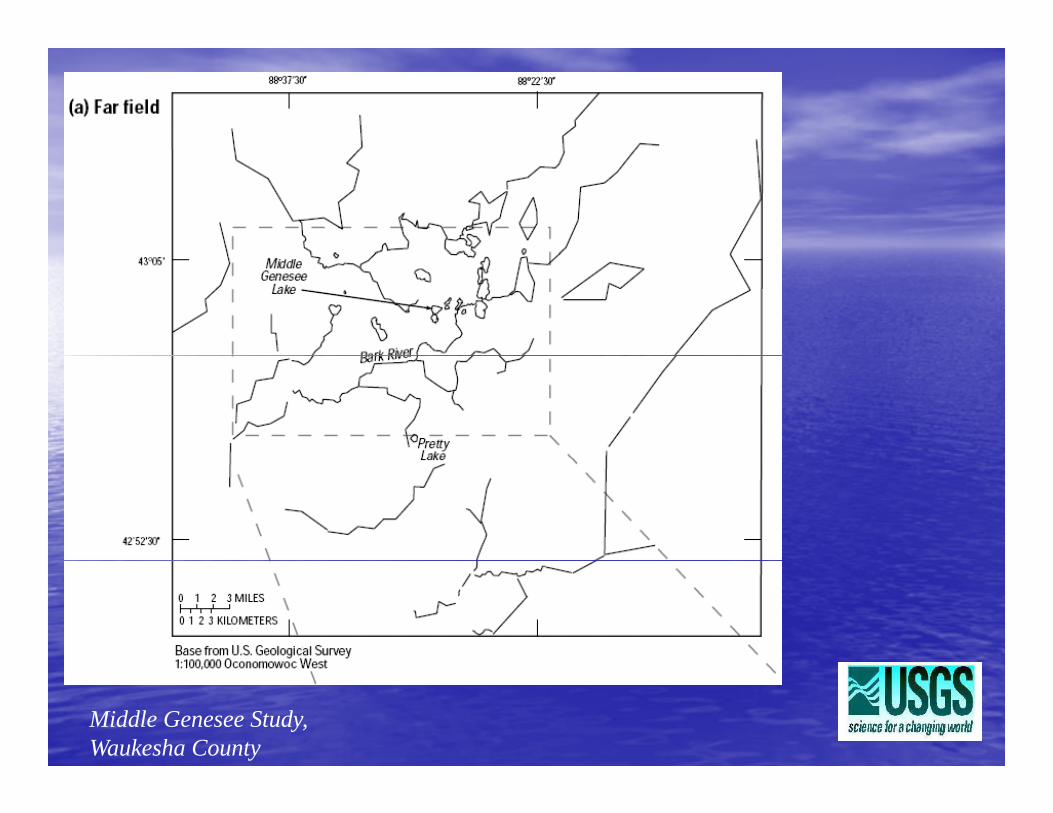
Middle Genesee Study, Waukesha County

Middle Genesee Study, Waukesha County

Middle Genesee Study, Waukesha County

Middle Genesee Study, Waukesha County

The calibrated model can be usedMiddle Genesee Study, Waukesha CountyThe calibrated model can be used
to estimate GWin
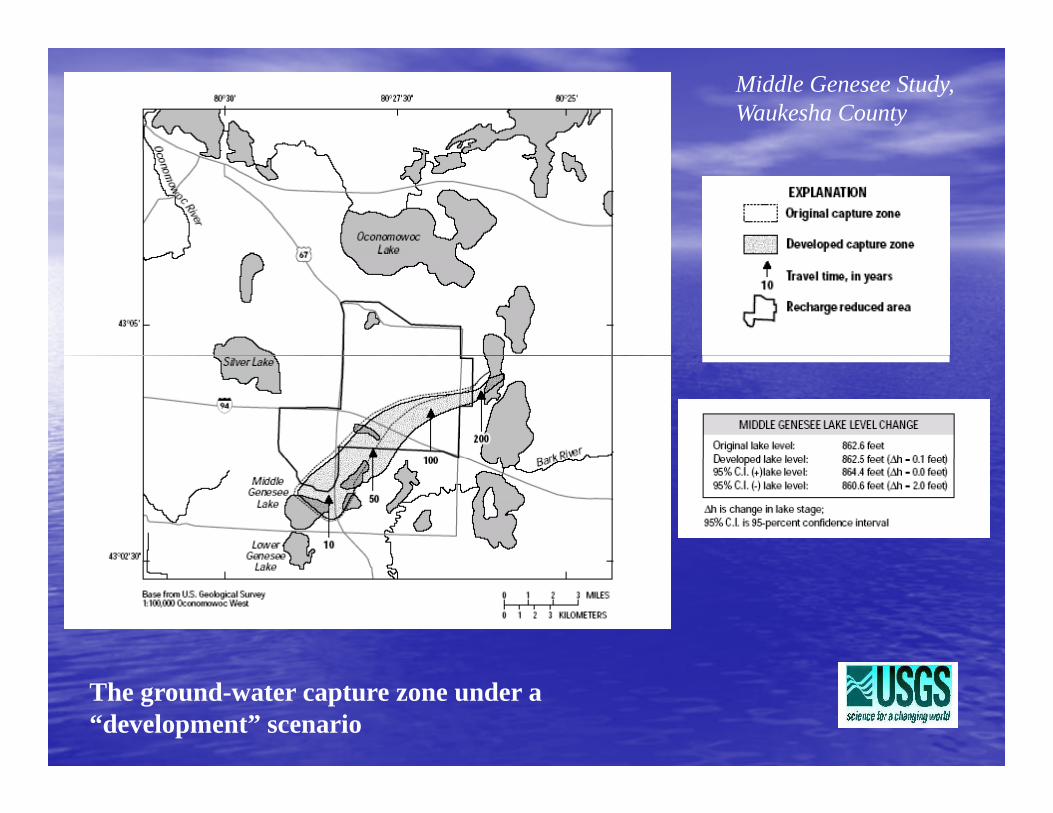
Middle Genesee Study, Waukesha County
The ground-water capture zone under a “development” scenario

CASE STUDIES: CRYSTALCASE STUDIES: CRYSTAL LAKELAKECASE STUDIES: CRYSTAL CASE STUDIES: CRYSTAL LAKELAKEBob Nauta, RSV Engineering

Are the wells affecting Crystal Lake?Are the wells affecting Crystal Lake?Are the wells affecting Crystal Lake?Are the wells affecting Crystal Lake?
Figures from Hey and Associates, 2007

CASE STUDIES: CRYSTAL CASE STUDIES: CRYSTAL LAKELAKE
• STATISTICAL ANALYSES
• WATER CHEMISTRY ANALYSESWATER CHEMISTRY ANALYSES
• GROUNDWATER MONITORING

CASE STUDIES: CRYSTAL CASE STUDIES: CRYSTAL LAKELAKEGROUNDWATER MONITORINGGROUNDWATER MONITORING

CASE STUDIES: CRYSTAL CASE STUDIES: CRYSTAL LAKELAKEGROUNDWATER MONITORINGGROUNDWATER MONITORING
8/7/07 8/14/07 8/21/07 8/28/07 9/4/07 9/11/07 9/18/078/7/07 8/14/07 8/21/07 8/28/07 9/4/07 9/11/07 9/18/078/7/07 8/14/07 8/21/07 8/28/07 9/4/07 9/11/07 9/18/07
8/7/07 8/14/07 8/21/07 8/28/07 9/4/07 9/11/07 9/18/07
8/7/07 8/14/07 8/21/07 8/28/07 9/4/07 9/11/07 9/18/07
CASE STUDIES: CRYSTAL CASE STUDIES: CRYSTAL LAKELAKE
• STATISTICAL ANALYSES
• WATER CHEMISTRY ANALYSESWATER CHEMISTRY ANALYSES
• GROUNDWATER MONITORING
• GROUNDWATER MODELING• GROUNDWATER MODELING

CASE STUDIES: CRYSTAL CASE STUDIES: CRYSTAL LAKELAKEGROUNDWATER MODELINGGROUNDWATER MODELINGGROUNDWATER MODELINGGROUNDWATER MODELING

CASE STUDIES: CRYSTAL CASE STUDIES: CRYSTAL LAKELAKEGROUNDWATER MODELINGGROUNDWATER MODELING
GROUNDWATERDIVIDE
GOLF
LA BUDDECREEK
CR J
CR CJ
1000
CRYSTAL LAKE
COURSEROAD
900
800VATI
ON
(MSL
)
800
700
ELEV
A
0 1000 2000 3000 4000 5000 6000 7000 8000
FEET

CASE STUDIES: CRYSTAL CASE STUDIES: CRYSTAL LAKELAKE
• STATISTICAL ANALYSES
• WATER CHEMISTRY ANALYSESWATER CHEMISTRY ANALYSES
• GROUNDWATER MONITORING
• GROUNDWATER MODELING• GROUNDWATER MODELING
• ORGANIZE REGIONAL STUDY
• GRANT ASSISTANCE

CASE STUDIES: CRYSTAL CASE STUDIES: CRYSTAL LAKELAKEREGIONAL STUDYREGIONAL STUDY
• SANITARY DISTRICT #1 – TOWNS OF RHINE & PLYMOUTH
• TOWN OF RHINE
• LITTLE ELKHART LAKEREHABILITATION DISTRICT
• SHEBOYGAN COUNTY
CASE STUDIES: CRYSTAL CASE STUDIES: CRYSTAL LAKELAKEREGIONAL STUDYREGIONAL STUDY
• CITIZENS ADVISORY COMMITTEE
• TECHNICAL WORKING GROUP

CASE STUDIES: CRYSTAL CASE STUDIES: CRYSTAL LAKELAKE
• STATISTICAL ANALYSES
• WATER CHEMISTRY ANALYSESWATER CHEMISTRY ANALYSES
• GROUNDWATER MONITORING
• GROUNDWATER MODELING• GROUNDWATER MODELING
• ORGANIZE REGIONAL STUDY
• GRANT ASSISTANCE

CASE STUDIES: CRYSTAL CASE STUDIES: CRYSTAL LAKELAKEGRANT ASSISTANCEGRANT ASSISTANCE
• SUBMITTED BY SHEBOYGAN COUNTY
• FIRST STEP IN REGIONAL STUDY – ORGANIZE EXISTING DATA
• PROCEED TO NEXT PHASE

Central Sands LakesCentral Sands LakesCentral Sands Lakes Central Sands Lakes
Tim Asplund, WDNR Tim Asplund, WDNR and George Kraft (UWSP)and George Kraft (UWSP)

NW Waushara County LakesNW Waushara County LakesNW Waushara County LakesNW Waushara County Lakes
•• Landlocked lakes, no Landlocked lakes, no outletoutlet
•• Sandy soilsSandy soilsSandy soilsSandy soils•• Lakes near major regional Lakes near major regional
groundwater dividegroundwater divide•• Recent declines afterRecent declines after•• Recent declines after Recent declines after
unusually high period in unusually high period in the 1990sthe 1990s
•• ShortShort--term drought in term drought in Central WICentral WI
•• Major pumping centerMajor pumping centerajo pu p g ce teajo pu p g ce te

Source: UWSP


Source:UWSP

Source:UWSP

Effects of irrigation1970 –1/4 of the area irrigated
normal summer stream loss:- normal summer stream loss:25-30%
l t d li- normal summer water decline:½ foot
- drought stream loss:70-90%
- drought water decline:2-3 feet

Effects of irrigationIf 50% of area irrigated
-drought stream loss:drought stream loss:100%
drought water decline:- drought water decline:4 - 5 feet
2007:
>75% of area irrigated

Waushara County LakesWaushara County LakesWaushara County LakesWaushara County LakesLong, Huron
Fish, Pine
Source: UWSP

1950s
199499

Spring 2006Spring 2006
July 2006Ju y 006
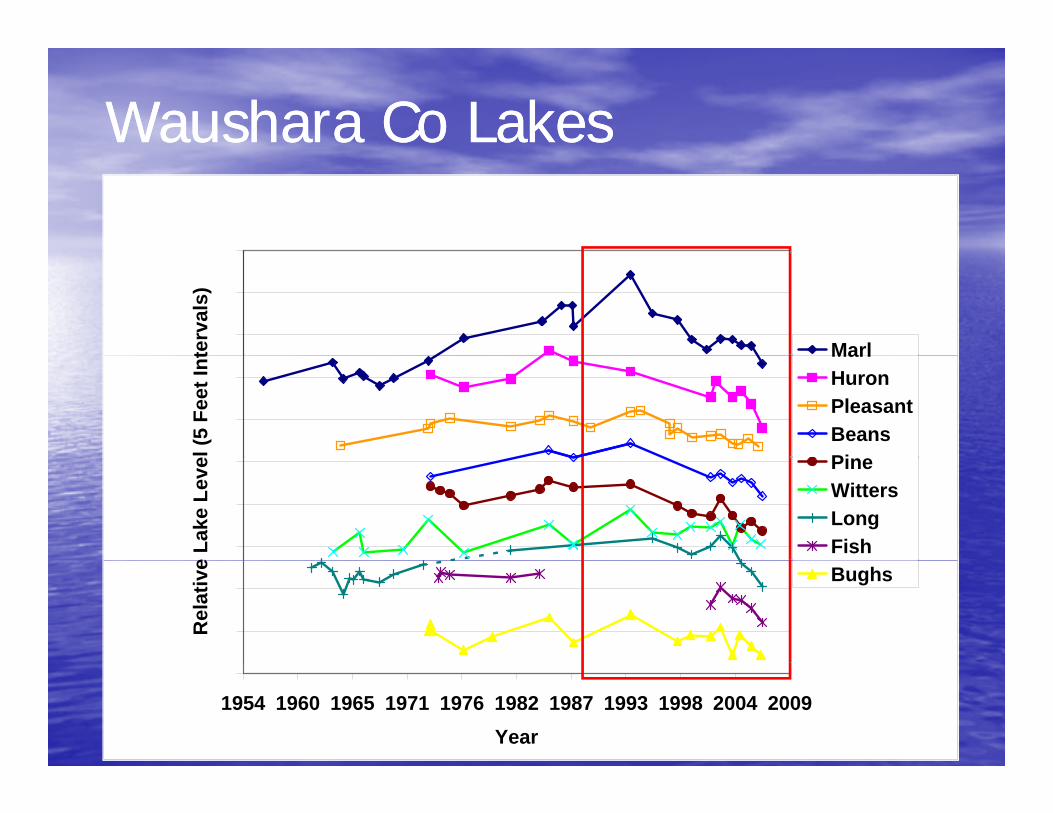
Waushara Co LakesWaushara Co Lakeste
rval
s)
Marl
el (5
Fee
t Int Marl
HuronPleasantBeansPi
e La
ke L
eve Pine
WittersLongFish
Rel
ativ
e Bughs
1954 1960 1965 1971 1976 1982 1987 1993 1998 2004 2009Year

Waushara Co LakesWaushara Co LakesWaushara Co. LakesWaushara Co. LakesAt sub-continental divide, near pumping
1100
1105
l
R2 = 0.0096
R2 = 0 39491085
1090
1095
ve s
ea le
vel
LongHuronPineR = 0.3949
R2 = 0.54181075
1080
Feet
abo
v PineFish
R2 = 0.71181065
1070
Jun-1968
Dec-1973
May-1979
Nov-1984
May-1990
Oct-1995
Apr-2001
Oct-2006
Apr-20121968 1973 1979 1984 1990 1995 2001 2006 2012
Year

Waushara Co LakesWaushara Co LakesWaushara Co. LakesWaushara Co. LakesAway from divide, distant from pumping
890
R2 = 0.0092880
885
890
vel
2865
870
875
ove
sea
lev
GilbertBughs
R2 = 0.0908
855
860
865
Feet
ab Witters
R2 = 0.0006845
850
Jun-1968
Dec-1973
May-1979
Nov-1984
May-1990
Oct-1995
Apr-2001
Oct-2006
Apr-20121968 1973 1979 1984 1990 1995 2001 2006 2012
Year

Water table well near Hancock, WI
source: US Geological Survey -http://groundwaterwatch.usgs.gov
Nelsonville
Amherst Jct.
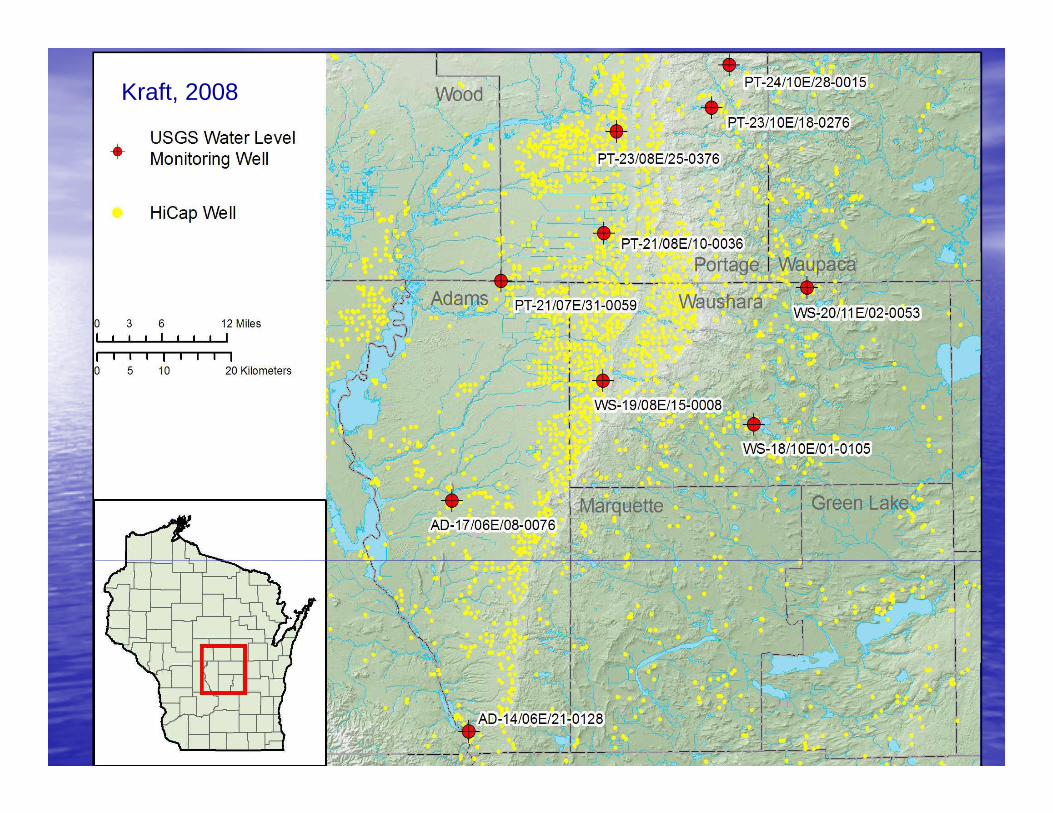
Down 3 ftKraft, 2008
Down 1 ft
Wild RoseDown 1 ft
Wautoma
Down 3 ft

Water levels unaffected by Water levels unaffected by pumpingpumping
1950 1960 1970 1980 1990 2000 2010
Year
pumpingpumping
-10.0
-8.0
1950 1960 1970 1980 1990 2000 2010
renc
e
-6.0
-4.0
m 1
959
refe
-2.0
0.0
ater
(ft)
from
2.0
4.0
6 0Dept
h to
wa
6.0D
PT0015 PT0276 WS0105 Kraft, 2008
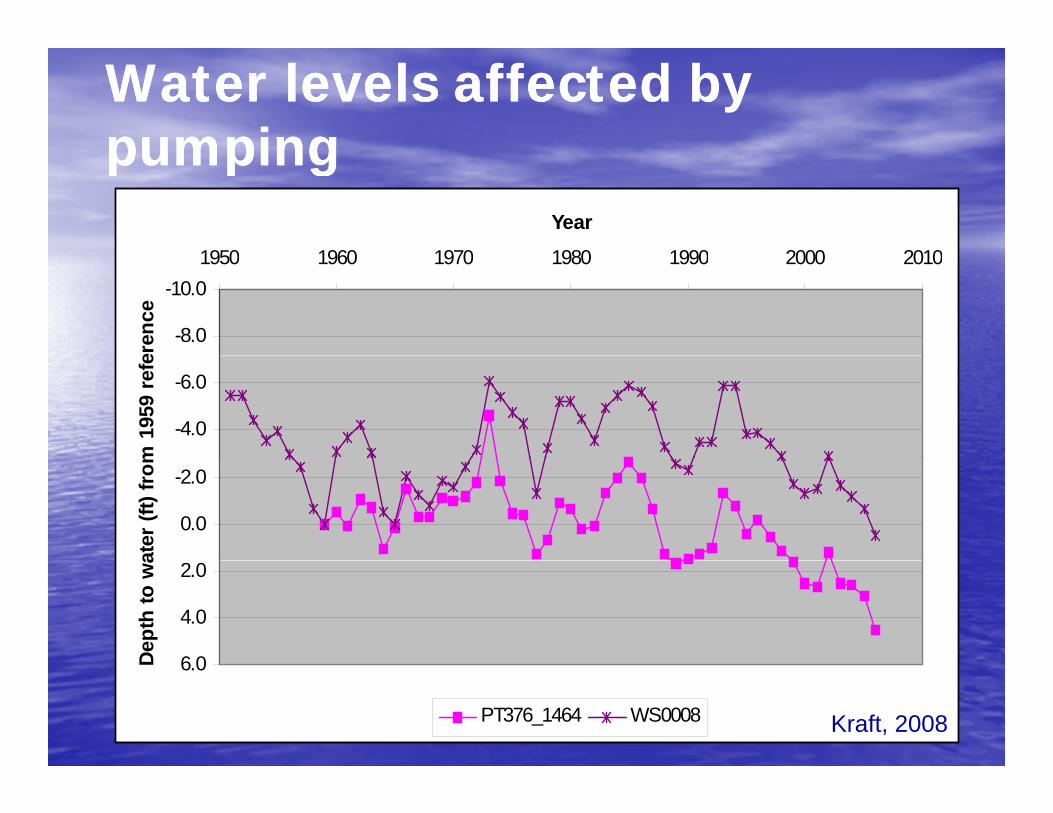
Water levels affected by Water levels affected by pumpingpumpingpumpingpumping
1950 1960 1970 1980 1990 2000 2010
Year
-10.0
-8.0
1950 1960 1970 1980 1990 2000 2010
eren
ce
-6.0
-4.0
m 1
959
refe
-2.0
0.0
ater
(ft)
from
2.0
4.0
6 0Dept
h to
wa
6.0D
PT376_1464 WS0008 Kraft, 2008

Nelsonville
Amherst Jct.
Down 3 ft Nelsonville
Amherst Jct.
Down 3 ftKraft, 2008
Down 1 ftDown 1 ft
Wild RoseDown 1 ft Wild RoseDown 1 ft
Wautoma
Down 3 ft
Wautoma
Down 3 ft