Embed Size (px)
Citation preview
Case 7 • Starbucks Coffee: Expansion in Asia • 655
� � � � � � � � � � � � � � � � � � � � � � � � � � � � � � �
CASE 7
STARBUCKS COFFEE: EXPANSION IN ASIA
HISTORY
Starbucks Coffee Company was founded in 1971 by threecoffee aficionados. Starbucks, named after the coffee-lovingfirst mate in Moby Dick, opened its first store in Seattle’s PikePlace Public Market. During this time, most coffee was pur-chased in a can directly from supermarket shelves. Starbucks’concept of selling fresh-roasted whole beans in a specialtystore was a revolutionary idea.
In 1987, Howard Schultz, a former Starbucks employee,acquired the company. When Schultz first joined Starbucks inthe early 1980s as director of retail operations, Starbucks wasa local, highly respected roaster and retailer of whole beanand ground coffees. A business trip to Milan’s famous coffeeshops in 1983 opened Schultz’s eyes to the rich tradition ofthe espresso beverage. Schultz recalls, ‘‘What I saw was theunique relationship that the Italian people had with the ubiq-uitous coffee bars around Italy. People used the local coffeebar as the third place from home and work. What I wantedto try and do was re-create that in North America.’’ Inspiredby the Italian espresso bars, Schultz convinced executives tohave Starbucks’ stores serve coffee by the cup. And the rest ishistory! The company has seen phenomenal growth from 17coffee outlets in Seattle almost 35 years back to 9000 shops inaround 28 countries worldwide.
Starbucks went public in 1993 and has done extremely wellin turning an everyday beverage into a premium product. Thegreen and white mermaid logo is widely recognized; the brandis defined not only by its products, but also by attitude. Busi-ness Week’s most recent survey (2004) of the top global brandsreported Starbucks as one of the fastest growing brands witha cult following. It is all about the Starbucks experience, theatmosphere, and the place that is a refuge for most people toget away from everyday stresses. The average customer visitsa Starbucks 18 times in a month, and about 10 percent of allcustomers visit twice a day. Starbucks has created an affinitywith customers that is almost cult-like. Today, Starbucks isthe leading roaster and retailer of specialty coffee in NorthAmerica, with more than 1000 retail stores in 35 markets.
MISSION STATEMENT
Starbucks’ corporate mission statement is as follows: ‘‘Estab-lish Starbucks as the premier purveyor of the finest coffeein the world, while maintaining our uncompromising princi-ples as we grow. The following guiding principles will help usmeasure the appropriateness of our decisions:
1. Provide a great work environment and treat each otherwith respect and dignity.
This case was prepared by Valerie Darguste, Ana Su, Ai-Lin Tu, andPeggy Wei of Stern School of Business at New York University andupdated by Sonia Ketkar of the Fox School of Business and Managementat Temple University under the supervision of Professor Masaaki Kotabefor class discussion rather than to illustrate either effective or ineffectivemanagement of a situation described (2006).
2. Apply the highest standards of excellence to the purchasing,roasting, and fresh delivery of our coffee.
3. Develop enthusiastically satisfied customers all of the time.
4. Contribute positively to our communities and our environ-ment.
5. Recognize that profitability is essential to our future suc-cess.
6. Embrace diversity as an essential component in the way wedo business.
Starbucks’ corporate objective to is become the most rec-ognized and respected brand of coffee in the world. To achievethis goal, Starbucks plans to continue to expand its retail oper-ations rapidly in two ways: first, to increase its market share inexisting markets, and second, to open stores in new markets.In 2004 alone, Starbucks opened 4 stores a day on average.Starbucks’ retail objective is to become a leading retailer andcoffee brand in each of its target markets by selling first-qualitycoffees and related products. In addition, Starbucks providesa superior level of customer service, thereby building a highdegree of customer loyalty.
SALES AND PROFITS
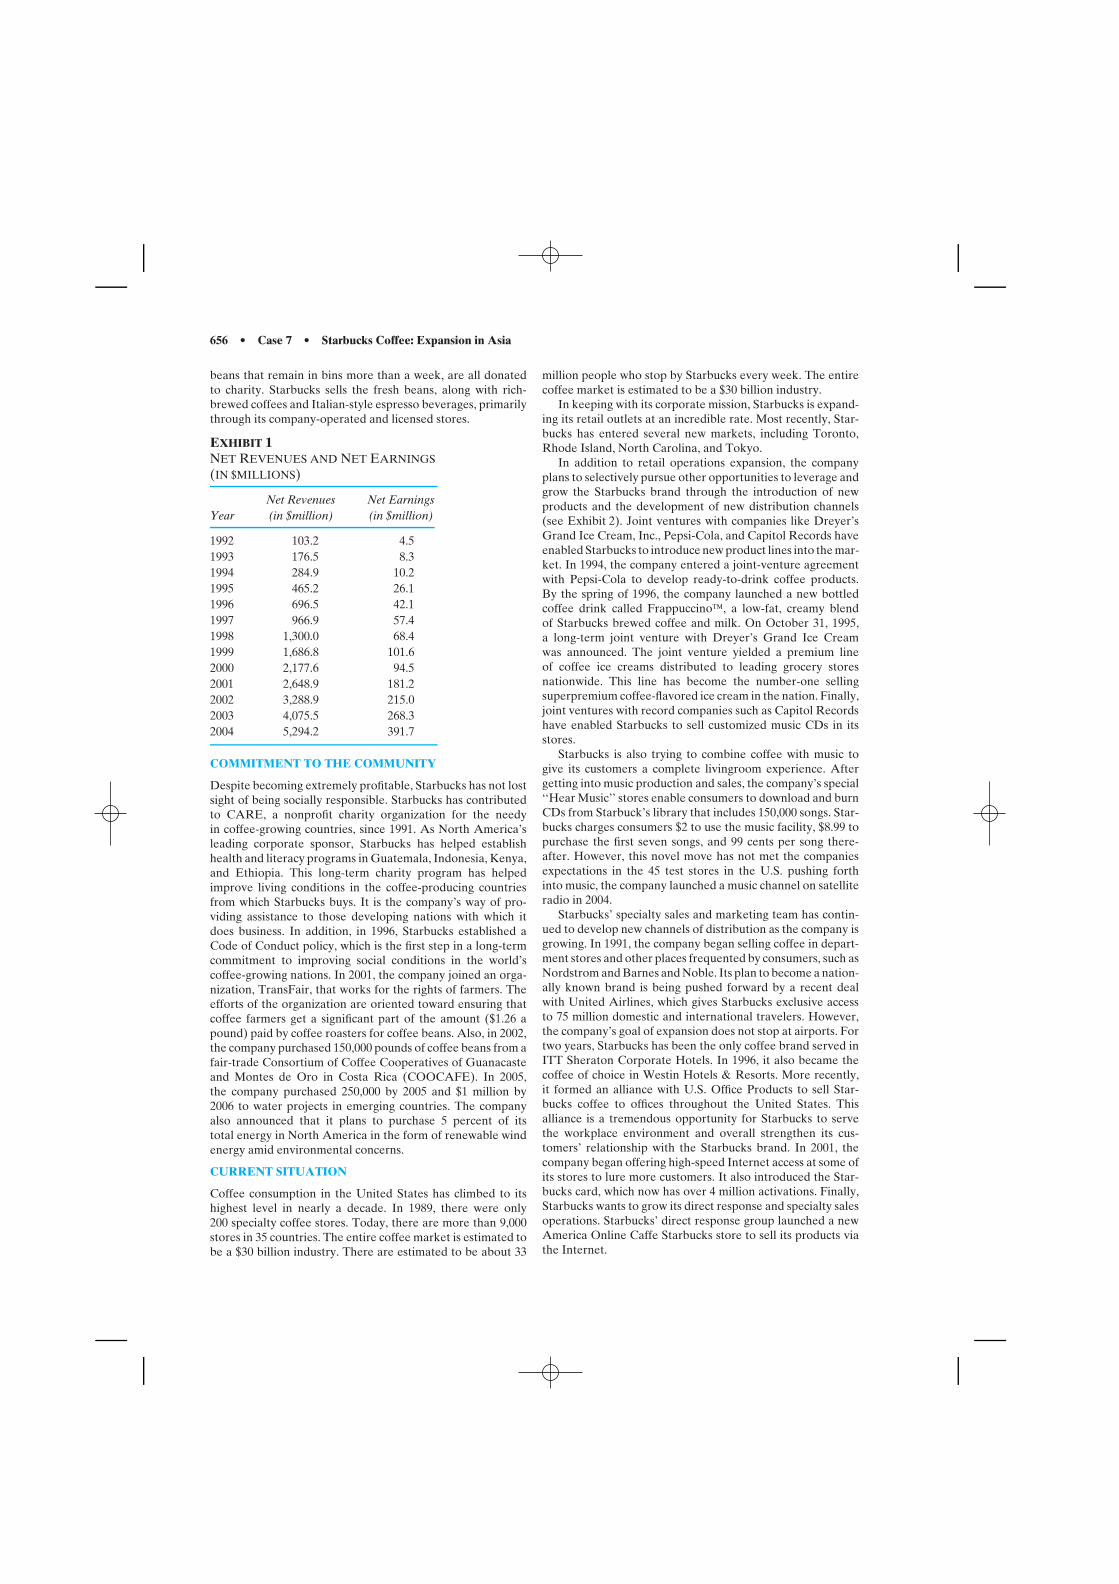
Starbucks’ net earnings in 2004 were $391.7 million, which isa significant increase from the $181.2 million earnings threeyears earlier. Furthermore, its revenues grew more than 12times from $103.2 million in 1992 to $1.3 billion in 1998.The increase in revenues and sales was a direct result of thenumerous new stores that were opened. During this period,Starbucks stores grew 508 percent from 165 stores to over 1400.By the third quarter of the year 2004, sales had increased 30percent over those of the previous year to $5.34 billion. Thecompany’s stock saw a rise of over 2200 percent in the lastdecade (see Exhibit 1).
COMMITMENT TO COFFEE
Starbucks is committed to selling only the finest whole-beancoffees and coffee beverages. Currently the fifth largest pur-chaser of coffee, Starbucks roasts more than 30 varieties ofthe world’s finest Arabica coffee beans; therefore, the com-pany goes to extreme lengths to buy the very finest Arabicacoffee beans available on the world market, regardless ofprice. Arabica beans have a very refined flavor and containabout 1 percent caffeine by weight. These beans account for75 percent of the world production and are sought by specialtyroasters.
To ensure compliance with its rigorous standards, Star-bucks is vertically integrated, controlling its coffee sourcing,roasting, and distribution through its company-operated retailstores. It purchases green coffee beans for its many blends andvarieties from coffee-producing regions throughout the worldand custom roasts them to its exacting standards. Currently,there are three roasting plants in the United States. Roaststhat do not meet the company’s rigorous specifications, or
656 • Case 7 • Starbucks Coffee: Expansion in Asia
beans that remain in bins more than a week, are all donatedto charity. Starbucks sells the fresh beans, along with rich-brewed coffees and Italian-style espresso beverages, primarilythrough its company-operated and licensed stores.
EXHIBIT 1NET REVENUES AND NET EARNINGS(IN $MILLIONS)
Net Revenues Net EarningsYear (in $million) (in $million)
1992 103.2 4.51993 176.5 8.31994 284.9 10.21995 465.2 26.11996 696.5 42.11997 966.9 57.41998 1,300.0 68.41999 1,686.8 101.62000 2,177.6 94.52001 2,648.9 181.22002 3,288.9 215.02003 4,075.5 268.32004 5,294.2 391.7
COMMITMENT TO THE COMMUNITY
Despite becoming extremely profitable, Starbucks has not lostsight of being socially responsible. Starbucks has contributedto CARE, a nonprofit charity organization for the needyin coffee-growing countries, since 1991. As North America’sleading corporate sponsor, Starbucks has helped establishhealth and literacy programs in Guatemala, Indonesia, Kenya,and Ethiopia. This long-term charity program has helpedimprove living conditions in the coffee-producing countriesfrom which Starbucks buys. It is the company’s way of pro-viding assistance to those developing nations with which itdoes business. In addition, in 1996, Starbucks established aCode of Conduct policy, which is the first step in a long-termcommitment to improving social conditions in the world’scoffee-growing nations. In 2001, the company joined an orga-nization, TransFair, that works for the rights of farmers. Theefforts of the organization are oriented toward ensuring thatcoffee farmers get a significant part of the amount ($1.26 apound) paid by coffee roasters for coffee beans. Also, in 2002,the company purchased 150,000 pounds of coffee beans from afair-trade Consortium of Coffee Cooperatives of Guanacasteand Montes de Oro in Costa Rica (COOCAFE). In 2005,the company purchased 250,000 by 2005 and $1 million by2006 to water projects in emerging countries. The companyalso announced that it plans to purchase 5 percent of itstotal energy in North America in the form of renewable windenergy amid environmental concerns.
CURRENT SITUATION
Coffee consumption in the United States has climbed to itshighest level in nearly a decade. In 1989, there were only200 specialty coffee stores. Today, there are more than 9,000stores in 35 countries. The entire coffee market is estimated tobe a $30 billion industry. There are estimated to be about 33
million people who stop by Starbucks every week. The entirecoffee market is estimated to be a $30 billion industry.
In keeping with its corporate mission, Starbucks is expand-ing its retail outlets at an incredible rate. Most recently, Star-bucks has entered several new markets, including Toronto,Rhode Island, North Carolina, and Tokyo.
In addition to retail operations expansion, the companyplans to selectively pursue other opportunities to leverage andgrow the Starbucks brand through the introduction of newproducts and the development of new distribution channels(see Exhibit 2). Joint ventures with companies like Dreyer’sGrand Ice Cream, Inc., Pepsi-Cola, and Capitol Records haveenabled Starbucks to introduce new product lines into the mar-ket. In 1994, the company entered a joint-venture agreementwith Pepsi-Cola to develop ready-to-drink coffee products.By the spring of 1996, the company launched a new bottledcoffee drink called Frappuccino, a low-fat, creamy blendof Starbucks brewed coffee and milk. On October 31, 1995,a long-term joint venture with Dreyer’s Grand Ice Creamwas announced. The joint venture yielded a premium lineof coffee ice creams distributed to leading grocery storesnationwide. This line has become the number-one sellingsuperpremium coffee-flavored ice cream in the nation. Finally,joint ventures with record companies such as Capitol Recordshave enabled Starbucks to sell customized music CDs in itsstores.
Starbucks is also trying to combine coffee with music togive its customers a complete livingroom experience. Aftergetting into music production and sales, the company’s special‘‘Hear Music’’ stores enable consumers to download and burnCDs from Starbuck’s library that includes 150,000 songs. Star-bucks charges consumers $2 to use the music facility, $8.99 topurchase the first seven songs, and 99 cents per song there-after. However, this novel move has not met the companiesexpectations in the 45 test stores in the U.S. pushing forthinto music, the company launched a music channel on satelliteradio in 2004.
Starbucks’ specialty sales and marketing team has contin-ued to develop new channels of distribution as the company isgrowing. In 1991, the company began selling coffee in depart-ment stores and other places frequented by consumers, such asNordstrom and Barnes and Noble. Its plan to become a nation-ally known brand is being pushed forward by a recent dealwith United Airlines, which gives Starbucks exclusive accessto 75 million domestic and international travelers. However,the company’s goal of expansion does not stop at airports. Fortwo years, Starbucks has been the only coffee brand served inITT Sheraton Corporate Hotels. In 1996, it also became thecoffee of choice in Westin Hotels & Resorts. More recently,it formed an alliance with U.S. Office Products to sell Star-bucks coffee to offices throughout the United States. Thisalliance is a tremendous opportunity for Starbucks to servethe workplace environment and overall strengthen its cus-tomers’ relationship with the Starbucks brand. In 2001, thecompany began offering high-speed Internet access at some ofits stores to lure more customers. It also introduced the Star-bucks card, which now has over 4 million activations. Finally,Starbucks wants to grow its direct response and specialty salesoperations. Starbucks’ direct response group launched a newAmerica Online Caffe Starbucks store to sell its products viathe Internet.
Case 7 • Starbucks Coffee: Expansion in Asia • 657
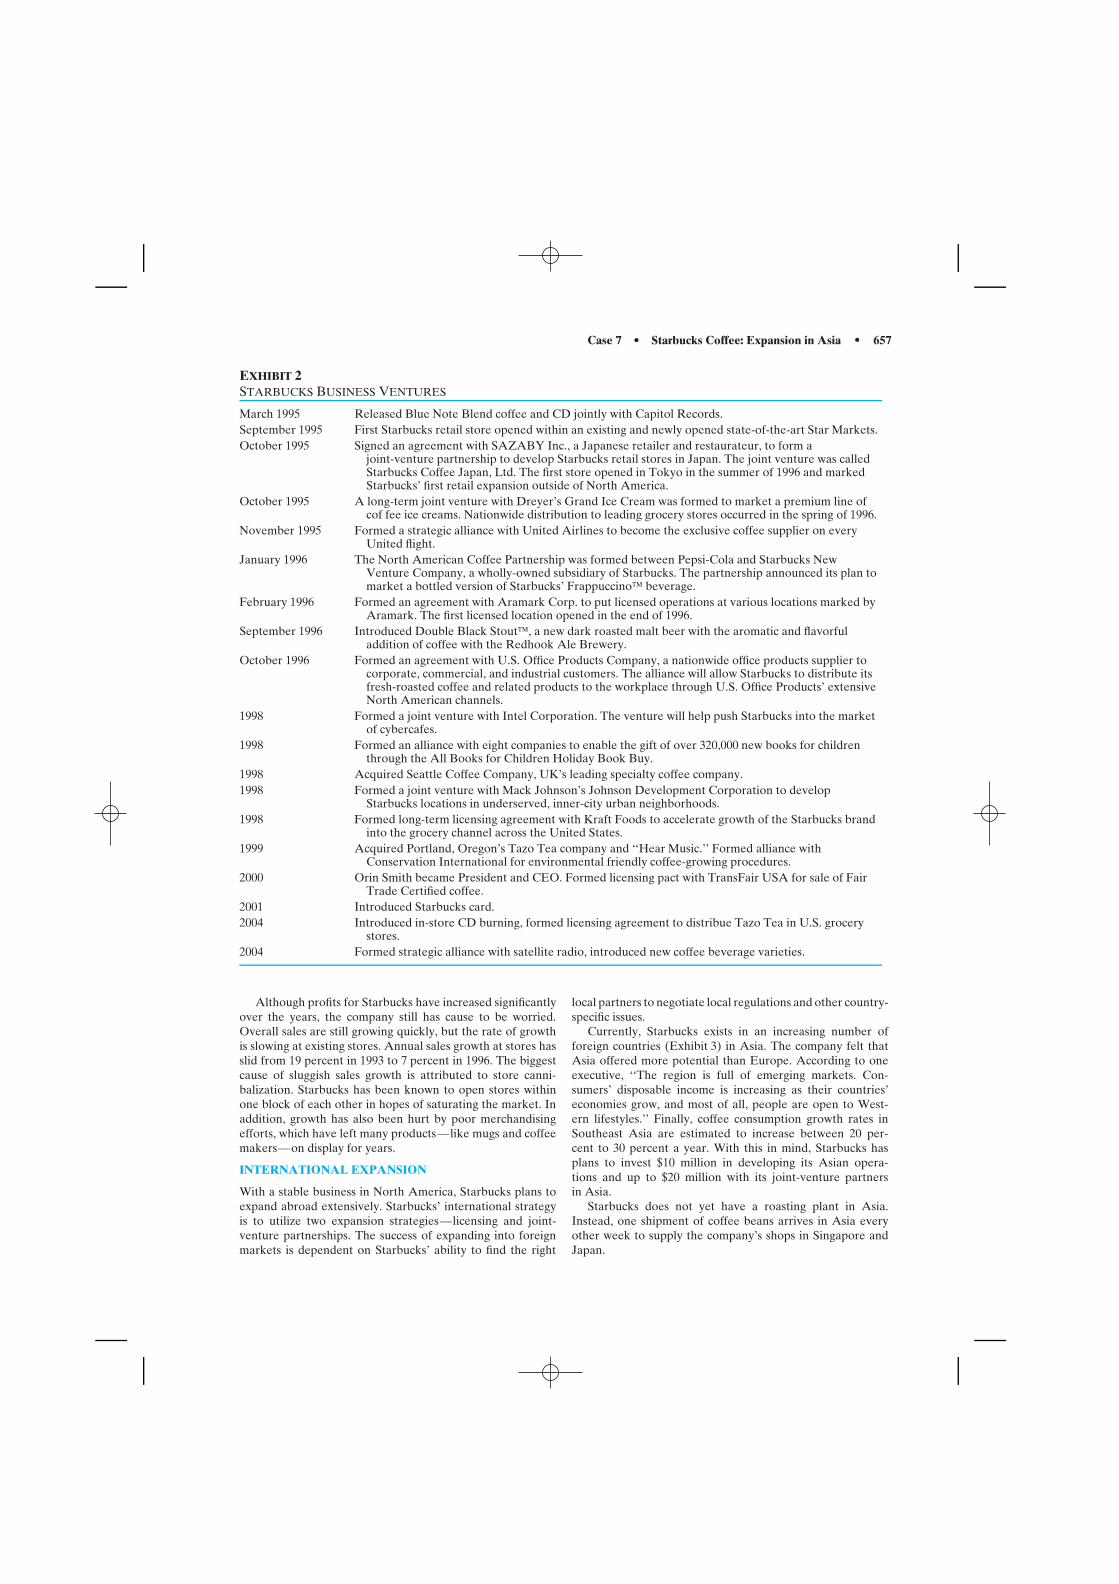
EXHIBIT 2STARBUCKS BUSINESS VENTURES
March 1995 Released Blue Note Blend coffee and CD jointly with Capitol Records.September 1995 First Starbucks retail store opened within an existing and newly opened state-of-the-art Star Markets.October 1995 Signed an agreement with SAZABY Inc., a Japanese retailer and restaurateur, to form a
joint-venture partnership to develop Starbucks retail stores in Japan. The joint venture was calledStarbucks Coffee Japan, Ltd. The first store opened in Tokyo in the summer of 1996 and markedStarbucks’ first retail expansion outside of North America.
October 1995 A long-term joint venture with Dreyer’s Grand Ice Cream was formed to market a premium line ofcof fee ice creams. Nationwide distribution to leading grocery stores occurred in the spring of 1996.
November 1995 Formed a strategic alliance with United Airlines to become the exclusive coffee supplier on everyUnited flight.
January 1996 The North American Coffee Partnership was formed between Pepsi-Cola and Starbucks NewVenture Company, a wholly-owned subsidiary of Starbucks. The partnership announced its plan tomarket a bottled version of Starbucks’ Frappuccino beverage.
February 1996 Formed an agreement with Aramark Corp. to put licensed operations at various locations marked byAramark. The first licensed location opened in the end of 1996.
September 1996 Introduced Double Black Stout, a new dark roasted malt beer with the aromatic and flavorfuladdition of coffee with the Redhook Ale Brewery.
October 1996 Formed an agreement with U.S. Office Products Company, a nationwide office products supplier tocorporate, commercial, and industrial customers. The alliance will allow Starbucks to distribute itsfresh-roasted coffee and related products to the workplace through U.S. Office Products’ extensiveNorth American channels.
1998 Formed a joint venture with Intel Corporation. The venture will help push Starbucks into the marketof cybercafes.
1998 Formed an alliance with eight companies to enable the gift of over 320,000 new books for childrenthrough the All Books for Children Holiday Book Buy.
1998 Acquired Seattle Coffee Company, UK’s leading specialty coffee company.1998 Formed a joint venture with Mack Johnson’s Johnson Development Corporation to develop
Starbucks locations in underserved, inner-city urban neighborhoods.1998 Formed long-term licensing agreement with Kraft Foods to accelerate growth of the Starbucks brand
into the grocery channel across the United States.1999 Acquired Portland, Oregon’s Tazo Tea company and ‘‘Hear Music.’’ Formed alliance with
Conservation International for environmental friendly coffee-growing procedures.2000 Orin Smith became President and CEO. Formed licensing pact with TransFair USA for sale of Fair
Trade Certified coffee.2001 Introduced Starbucks card.2004 Introduced in-store CD burning, formed licensing agreement to distribue Tazo Tea in U.S. grocery
stores.2004 Formed strategic alliance with satellite radio, introduced new coffee beverage varieties.
Although profits for Starbucks have increased significantlyover the years, the company still has cause to be worried.Overall sales are still growing quickly, but the rate of growthis slowing at existing stores. Annual sales growth at stores hasslid from 19 percent in 1993 to 7 percent in 1996. The biggestcause of sluggish sales growth is attributed to store canni-balization. Starbucks has been known to open stores withinone block of each other in hopes of saturating the market. Inaddition, growth has also been hurt by poor merchandisingefforts, which have left many products—like mugs and coffeemakers—on display for years.
INTERNATIONAL EXPANSION
With a stable business in North America, Starbucks plans toexpand abroad extensively. Starbucks’ international strategyis to utilize two expansion strategies—licensing and joint-venture partnerships. The success of expanding into foreignmarkets is dependent on Starbucks’ ability to find the right
local partners to negotiate local regulations and other country-specific issues.
Currently, Starbucks exists in an increasing number offoreign countries (Exhibit 3) in Asia. The company felt thatAsia offered more potential than Europe. According to oneexecutive, ‘‘The region is full of emerging markets. Con-sumers’ disposable income is increasing as their countries’economies grow, and most of all, people are open to West-ern lifestyles.’’ Finally, coffee consumption growth rates inSoutheast Asia are estimated to increase between 20 per-cent to 30 percent a year. With this in mind, Starbucks hasplans to invest $10 million in developing its Asian opera-tions and up to $20 million with its joint-venture partnersin Asia.
Starbucks does not yet have a roasting plant in Asia.Instead, one shipment of coffee beans arrives in Asia everyother week to supply the company’s shops in Singapore andJapan.
658 • Case 7 • Starbucks Coffee: Expansion in Asia
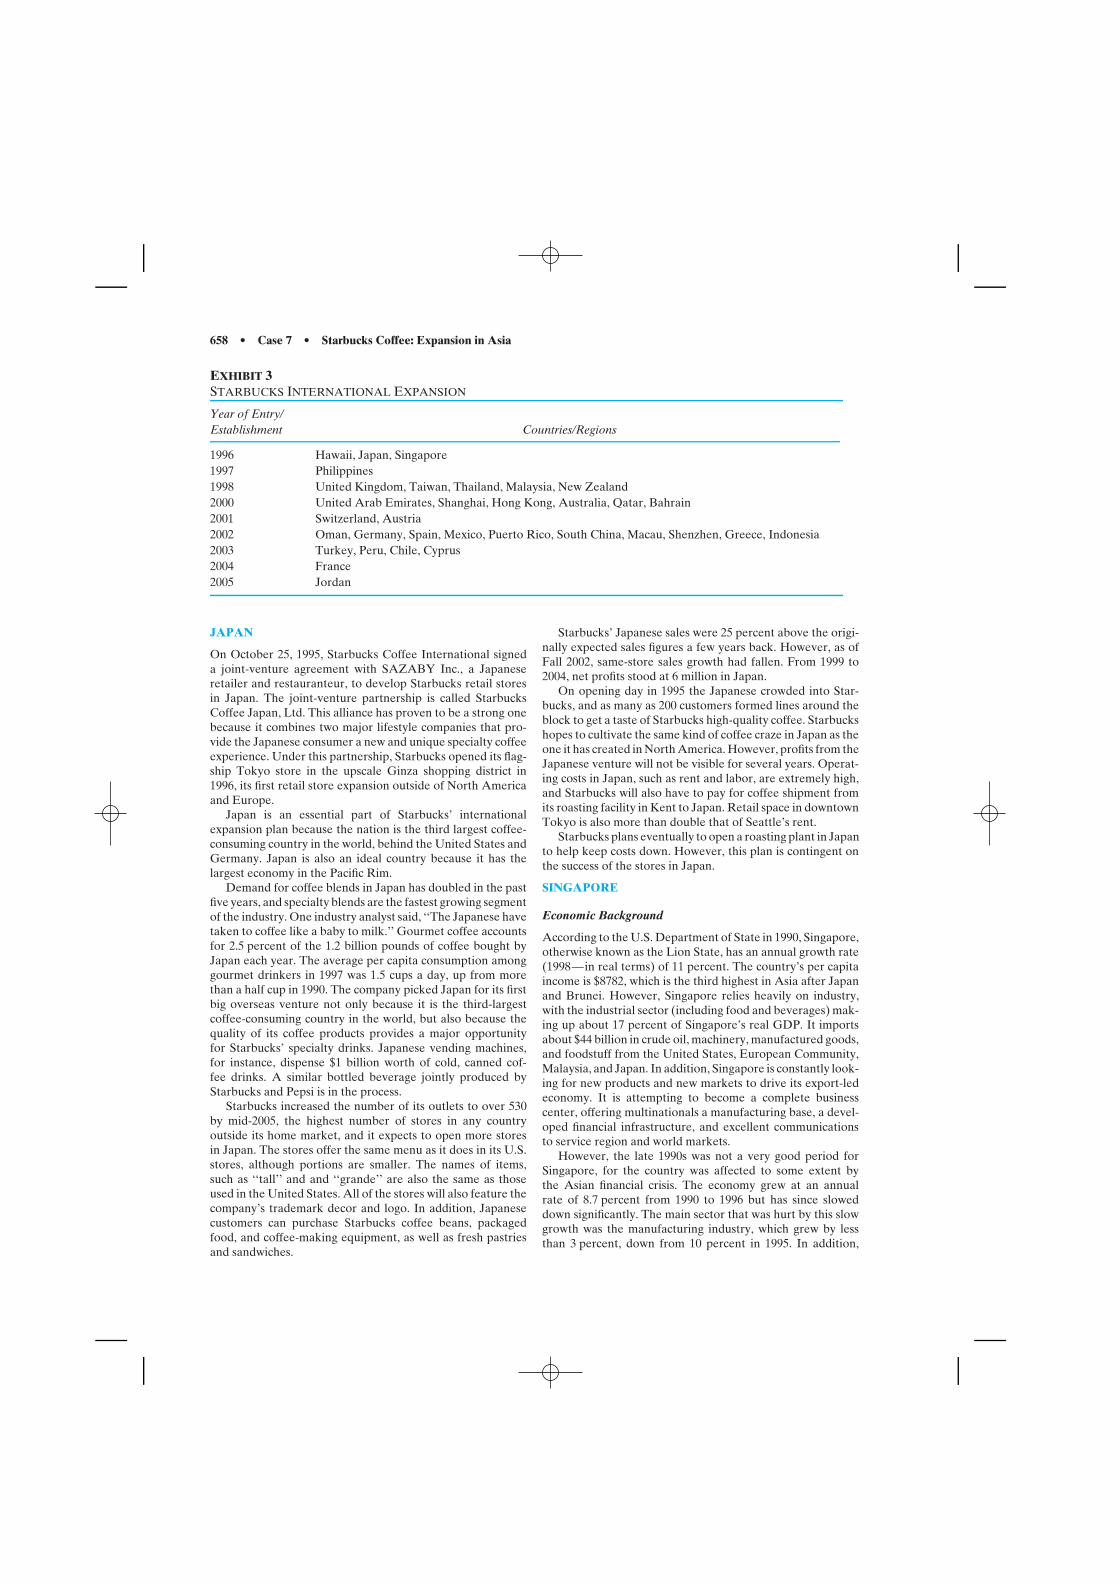
EXHIBIT 3STARBUCKS INTERNATIONAL EXPANSION
Year of Entry/Establishment Countries/Regions
1996 Hawaii, Japan, Singapore1997 Philippines1998 United Kingdom, Taiwan, Thailand, Malaysia, New Zealand2000 United Arab Emirates, Shanghai, Hong Kong, Australia, Qatar, Bahrain2001 Switzerland, Austria2002 Oman, Germany, Spain, Mexico, Puerto Rico, South China, Macau, Shenzhen, Greece, Indonesia2003 Turkey, Peru, Chile, Cyprus2004 France2005 Jordan
JAPAN
On October 25, 1995, Starbucks Coffee International signeda joint-venture agreement with SAZABY Inc., a Japaneseretailer and restauranteur, to develop Starbucks retail storesin Japan. The joint-venture partnership is called StarbucksCoffee Japan, Ltd. This alliance has proven to be a strong onebecause it combines two major lifestyle companies that pro-vide the Japanese consumer a new and unique specialty coffeeexperience. Under this partnership, Starbucks opened its flag-ship Tokyo store in the upscale Ginza shopping district in1996, its first retail store expansion outside of North Americaand Europe.
Japan is an essential part of Starbucks’ internationalexpansion plan because the nation is the third largest coffee-consuming country in the world, behind the United States andGermany. Japan is also an ideal country because it has thelargest economy in the Pacific Rim.
Demand for coffee blends in Japan has doubled in the pastfive years, and specialty blends are the fastest growing segmentof the industry. One industry analyst said, ‘‘The Japanese havetaken to coffee like a baby to milk.’’ Gourmet coffee accountsfor 2.5 percent of the 1.2 billion pounds of coffee bought byJapan each year. The average per capita consumption amonggourmet drinkers in 1997 was 1.5 cups a day, up from morethan a half cup in 1990. The company picked Japan for its firstbig overseas venture not only because it is the third-largestcoffee-consuming country in the world, but also because thequality of its coffee products provides a major opportunityfor Starbucks’ specialty drinks. Japanese vending machines,for instance, dispense $1 billion worth of cold, canned cof-fee drinks. A similar bottled beverage jointly produced byStarbucks and Pepsi is in the process.
Starbucks increased the number of its outlets to over 530by mid-2005, the highest number of stores in any countryoutside its home market, and it expects to open more storesin Japan. The stores offer the same menu as it does in its U.S.stores, although portions are smaller. The names of items,such as ‘‘tall’’ and and ‘‘grande’’ are also the same as thoseused in the United States. All of the stores will also feature thecompany’s trademark decor and logo. In addition, Japanesecustomers can purchase Starbucks coffee beans, packagedfood, and coffee-making equipment, as well as fresh pastriesand sandwiches.
Starbucks’ Japanese sales were 25 percent above the origi-nally expected sales figures a few years back. However, as ofFall 2002, same-store sales growth had fallen. From 1999 to2004, net profits stood at 6 million in Japan.
On opening day in 1995 the Japanese crowded into Star-bucks, and as many as 200 customers formed lines around theblock to get a taste of Starbucks high-quality coffee. Starbuckshopes to cultivate the same kind of coffee craze in Japan as theone it has created in North America. However, profits from theJapanese venture will not be visible for several years. Operat-ing costs in Japan, such as rent and labor, are extremely high,and Starbucks will also have to pay for coffee shipment fromits roasting facility in Kent to Japan. Retail space in downtownTokyo is also more than double that of Seattle’s rent.
Starbucks plans eventually to open a roasting plant in Japanto help keep costs down. However, this plan is contingent onthe success of the stores in Japan.
SINGAPORE
Economic Background
According to the U.S. Department of State in 1990, Singapore,otherwise known as the Lion State, has an annual growth rate(1998—in real terms) of 11 percent. The country’s per capitaincome is $8782, which is the third highest in Asia after Japanand Brunei. However, Singapore relies heavily on industry,with the industrial sector (including food and beverages) mak-ing up about 17 percent of Singapore’s real GDP. It importsabout $44 billion in crude oil, machinery, manufactured goods,and foodstuff from the United States, European Community,Malaysia, and Japan. In addition, Singapore is constantly look-ing for new products and new markets to drive its export-ledeconomy. It is attempting to become a complete businesscenter, offering multinationals a manufacturing base, a devel-oped financial infrastructure, and excellent communicationsto service region and world markets.
However, the late 1990s was not a very good period forSingapore, for the country was affected to some extent bythe Asian financial crisis. The economy grew at an annualrate of 8.7 percent from 1990 to 1996 but has since sloweddown significantly. The main sector that was hurt by this slowgrowth was the manufacturing industry, which grew by lessthan 3 percent, down from 10 percent in 1995. In addition,
Case 7 • Starbucks Coffee: Expansion in Asia • 659
the commerce sector grew by less than 4 percent, down from9 percent in 1995. Analysts claim that weak economic growth,global competition, and a very slow tourist season made Singa-pore’s retail industry very sluggish. The restaurants and hotelsalso recorded weak growth.
LIVING IN SINGAPORE
Singapore has one of the best living conditions in Asia. In 1999,its per capita GNP was US$27,480. Furthermore, Singaporeis known for its diversity. There are 3.4 million Singapore-ans: ethnic Chinese, Malays, and Indians make 77 percent,14 percent, and 7 percent of the population, respectively. Themost practiced religions are Buddhism/Taoism (53.9 percent),Islam (14.9 percent), Christianity (12.9 percent) and Hin-duism (3.3 percent). The main languages are Malay, Chinese(Mandarin), Tamil, and English. English is the language ofadministration, whereas Malay is the national language.
With a moderately high cost of living, Singaporeans areable to indulge in luxury goods. Much of Singapore’s enter-tainment is influenced by Western culture. For instance, manytheaters show Broadway musicals such as Les Miserablesand feature pop concert artists like Michael Jackson. Televi-sion programs are in English, Chinese, Malay, and Tamil. In1992, pay TV channels such as CNN, Movievision, HBO, andChinese Variety were introduced.
Singaporeans are known to indulge themselves with food.‘‘So discriminating have the Singaporeans become on the sub-ject of quality and price that eating has become a nationalobsession.’’ Singapore has an array of restaurants, coffee-houses, fast-food outlets, and food centers that are easilyaccessible and offer a variety of foods at affordable prices.Most of these food places are not air-conditioned exceptfor those located in shopping complexes. However, eating inan air-conditioned restaurant, regardless of income level, isan affordable luxury. ‘‘The average lunch or high tea buffetspread offering a wide variety of dishes is available at manyhotel coffee houses and restaurants, and it costs about $15(Singaporean currency) or more per person. Most restaurantsand coffeehouses impose a 10 percent service charge, buttipping is not encouraged.’’
SINGAPORE’S LOVE AFFAIR WITH COFFEE
According to Singaporean social commentator Francis Yim,‘‘Coffeehouses are a sign that Singaporeans have achieved thestatus of a developed nation and we are breaking new groundin the area of becoming a cultured society.’’ In the past duringthe construction of Singapore, Singaporeans did not have thetime to enjoy their cup of java. Regardless of their religionand beliefs, Singaporeans went to coffeehouses in the eveningsfor their meals and drank coffee in order to keep themselvesawake. Now coffee is viewed as a beverage instead of a drink.People want to take the time to savor their coffee. It is not justa drink but a personality altogether. The various flavors thatcoffeehouses offer reflect the different moods as well as taste.
The first Starbucks coffee outlet in Singapore opened onDecember 14, 1996, in Liat Towers, with the help of BonStarPte. Ltd., a subsidiary of Bonvests Holding Ltd., a Singaporeancompany with food services and real estate interests. The storein Liat Towers is located in Singapore’s main shopping districton Orchard Road, which is a very trendy shopping centerincluding the French department store, Gallery Lafayette,
and Planet Hollywood. There are plans to open 10 to 12 moreStarbucks in Singapore within the next year. Currently, thelicensing agreement with Starbucks only covers Singapore,but Bonvests hopes to expand the franchises into other Asianmarkets. Starbucks’ venture into Singapore is its first expan-sion into Southeast Asia. Bonvests Holdings anticipates thatthe Starbucks retail stores will generate at least $40 million insales over the next five to six years.
Bonvests is an ideal partner for several reasons. Bonvestshas acquired expertise in running food businesses, such as thelocal Burger King chain. They also know and understand thelocal consumer market, government regulations, and the localreal estate market.
Starbucks chose Singapore for its entry in the SoutheastAsian market because of the highly ‘‘Westernized’’ ideas andlifestyles it had adopted. Some have described Starbucks asanother American icon, like McDonald’s. Some even say thatStarbucks has created an American coffee cult. Slowly, butsurely, gourmet coffee bars have been penetrating into thefood scene in Singapore. It is estimated that Singaporeansdrink more than 10,000 gourmet cups a day. In addition,the market in Singapore has tremendous growth potential.According to Bruce Rolph, head of research at SalomanBrothers Singapore Pte. Ltd., ‘‘People should increasinglyfocus on Singapore not as a mature market with low earningsand growth potential, but as a uniquely positioned beachheadto get leverage over what’s happening in Asia.’’ Finally, theSingaporean market still has no clear leader in the specialtycoffee industry. This means that Starbucks still has a goodchance to become one of the top contenders in this market.
Despite the opportunities that exist for Starbucks in Sin-gapore, Starbucks still must overcome certain obstacles tobe successful. Competition is fierce, with 14 players and 38stores between them (see Exhibit 4). With Starbucks entryinto the Asian market, bigger retail stores, like Suntec DomeHoldings, are already gearing up for a coffee battle. However,smaller companies like Burke’s Cafe and Spinelli are welcom-ing Starbucks’ entry. Their strategy is to open an outlet rightnext to Starbucks to attract the customers that overflow fromStarbucks.
One of Starbucks’ biggest competitors, Suntec Dome Hold-ings, has already established itself in Singapore. It already hasgood name recognition with Suntec Walk, Suntec City, DomeCafe, and so on. Suntec is distinctive from the other retailcoffee stores in that it is seen more as a restaurant than as acoffee chain. It targets a broader market segment with a lowerbudget range. They are also backed by major supporters withthe capital to counter Starbucks’ expansion strategy. In addi-tion to Singapore, Suntec Dome Holdings has plans to expandto other markets such as Malaysia, Indonesia, Thailand, HongKong, and China. Spinelli, a smaller competitor, also plansto expand into the region. With these expansion plans havingbeen completed by the year 2000, Spinelli is potentially amajor threat to Starbucks.
More well-known coffee spots to Singaporeans are CoffeeConnection and Coffee Club, which are also direct competitorsof Starbucks. The customers that go to Coffee Connection andCoffee Club like the atmosphere and the service they receivethere. As reflected here, Singapore has seen a proliferationof gourmet coffee outlets in the past few years; therefore, themarket is slowly becoming overcrowded.
660 • Case 7 • Starbucks Coffee: Expansion in Asia
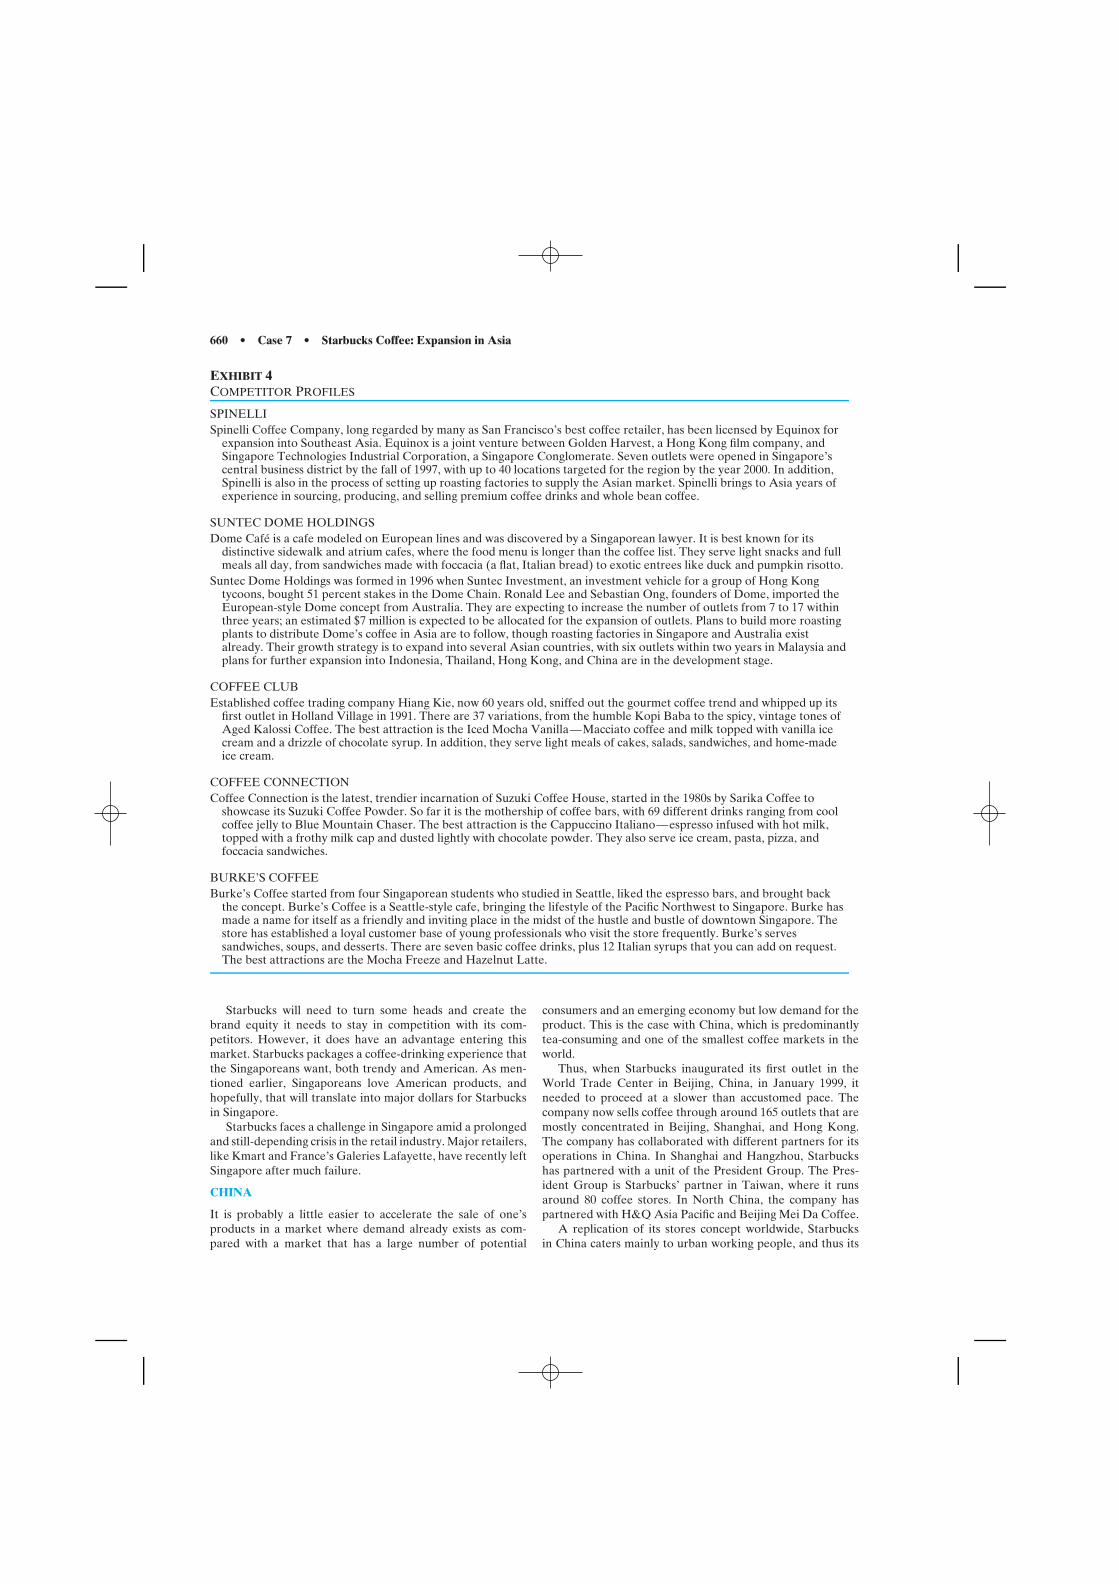
EXHIBIT 4COMPETITOR PROFILES
SPINELLISpinelli Coffee Company, long regarded by many as San Francisco’s best coffee retailer, has been licensed by Equinox for
expansion into Southeast Asia. Equinox is a joint venture between Golden Harvest, a Hong Kong film company, andSingapore Technologies Industrial Corporation, a Singapore Conglomerate. Seven outlets were opened in Singapore’scentral business district by the fall of 1997, with up to 40 locations targeted for the region by the year 2000. In addition,Spinelli is also in the process of setting up roasting factories to supply the Asian market. Spinelli brings to Asia years ofexperience in sourcing, producing, and selling premium coffee drinks and whole bean coffee.
SUNTEC DOME HOLDINGSDome Cafe is a cafe modeled on European lines and was discovered by a Singaporean lawyer. It is best known for its
distinctive sidewalk and atrium cafes, where the food menu is longer than the coffee list. They serve light snacks and fullmeals all day, from sandwiches made with foccacia (a flat, Italian bread) to exotic entrees like duck and pumpkin risotto.
Suntec Dome Holdings was formed in 1996 when Suntec Investment, an investment vehicle for a group of Hong Kongtycoons, bought 51 percent stakes in the Dome Chain. Ronald Lee and Sebastian Ong, founders of Dome, imported theEuropean-style Dome concept from Australia. They are expecting to increase the number of outlets from 7 to 17 withinthree years; an estimated $7 million is expected to be allocated for the expansion of outlets. Plans to build more roastingplants to distribute Dome’s coffee in Asia are to follow, though roasting factories in Singapore and Australia existalready. Their growth strategy is to expand into several Asian countries, with six outlets within two years in Malaysia andplans for further expansion into Indonesia, Thailand, Hong Kong, and China are in the development stage.
COFFEE CLUBEstablished coffee trading company Hiang Kie, now 60 years old, sniffed out the gourmet coffee trend and whipped up its
first outlet in Holland Village in 1991. There are 37 variations, from the humble Kopi Baba to the spicy, vintage tones ofAged Kalossi Coffee. The best attraction is the Iced Mocha Vanilla—Macciato coffee and milk topped with vanilla icecream and a drizzle of chocolate syrup. In addition, they serve light meals of cakes, salads, sandwiches, and home-madeice cream.
COFFEE CONNECTIONCoffee Connection is the latest, trendier incarnation of Suzuki Coffee House, started in the 1980s by Sarika Coffee to
showcase its Suzuki Coffee Powder. So far it is the mothership of coffee bars, with 69 different drinks ranging from coolcoffee jelly to Blue Mountain Chaser. The best attraction is the Cappuccino Italiano—espresso infused with hot milk,topped with a frothy milk cap and dusted lightly with chocolate powder. They also serve ice cream, pasta, pizza, andfoccacia sandwiches.
BURKE’S COFFEEBurke’s Coffee started from four Singaporean students who studied in Seattle, liked the espresso bars, and brought back
the concept. Burke’s Coffee is a Seattle-style cafe, bringing the lifestyle of the Pacific Northwest to Singapore. Burke hasmade a name for itself as a friendly and inviting place in the midst of the hustle and bustle of downtown Singapore. Thestore has established a loyal customer base of young professionals who visit the store frequently. Burke’s servessandwiches, soups, and desserts. There are seven basic coffee drinks, plus 12 Italian syrups that you can add on request.The best attractions are the Mocha Freeze and Hazelnut Latte.
Starbucks will need to turn some heads and create thebrand equity it needs to stay in competition with its com-petitors. However, it does have an advantage entering thismarket. Starbucks packages a coffee-drinking experience thatthe Singaporeans want, both trendy and American. As men-tioned earlier, Singaporeans love American products, andhopefully, that will translate into major dollars for Starbucksin Singapore.
Starbucks faces a challenge in Singapore amid a prolongedand still-depending crisis in the retail industry. Major retailers,like Kmart and France’s Galeries Lafayette, have recently leftSingapore after much failure.
CHINA
It is probably a little easier to accelerate the sale of one’sproducts in a market where demand already exists as com-pared with a market that has a large number of potential
consumers and an emerging economy but low demand for theproduct. This is the case with China, which is predominantlytea-consuming and one of the smallest coffee markets in theworld.
Thus, when Starbucks inaugurated its first outlet in theWorld Trade Center in Beijing, China, in January 1999, itneeded to proceed at a slower than accustomed pace. Thecompany now sells coffee through around 165 outlets that aremostly concentrated in Beijing, Shanghai, and Hong Kong.The company has collaborated with different partners for itsoperations in China. In Shanghai and Hangzhou, Starbuckshas partnered with a unit of the President Group. The Pres-ident Group is Starbucks’ partner in Taiwan, where it runsaround 80 coffee stores. In North China, the company haspartnered with H&Q Asia Pacific and Beijing Mei Da Coffee.
A replication of its stores concept worldwide, Starbucksin China caters mainly to urban working people, and thus its
Case 8 • Gap Inc. • 661
outlets are located in commercial areas. As for advertisingfor the Chinese market, Starbucks depends less on domesticadvertising and more on promotion through coupons and vis-its, which draw first-time consumers. Hence, although it facesa challenging task, the company is determined to carve a nichefor itself in China’s beverage market. In 2005, the companyannounced that in the long term, it expects the Chinese marketto be its second largest in the U.S.
INDONESIA
In 2002, Starbucks launched its first coffee store in Jakarta,Indonesia, after signing a licensing agreement with PT SariCoffee Indonesia. It is housed on the ground floor of the PlazaIndonesia, an upscale fashion shopping center, and boasts ofthe familiar Starbucks atmosphere of coffee, conversation,and more. The company plans to expand its operations inIndonesia based on the response it gets to its first store.
� � � � � � � � � � � � � � � � � � � � � � � � � � � � � � �
CASE 8
GAP INC.
Since it started in 1969, Gap Inc. has been consistently grow-ing and expanding. With more than 3000 stores in the UnitedStates, Canada, the United Kingdom, France, and Japan, GapInc. is currently the second largest-selling brand in the worldand is ranked second among all U.S. retailers in sales.
A HISTORY OF GAP INC.
Gap Inc. was established in August 1969 by Donald G. Fisher,a real estate developer educated at the University of Califor-nia–Berkeley. Fisher conceived the idea when he went to adepartment store to exchange a pair of Levi’s and was unableto because the jeans department was so disorganized. Backedby a $63,000 family investment and a $112,000 bank loanguaranteed by his father-in-law, Donald Fisher introduced thefirst Gap store in San Francisco. His original idea was to focuson the mid-teen market with three types of goods: records,cassette tapes, and Levi’s jeans. Unlike the local departmentstores, which stocked only a limited number of styles and sizesof Levi’s jeans, the Gap store carried every size and styleavailable. Furthermore, they were neatly arranged and easyto find. Donald Fisher and his wife had a discussion about the‘‘generation gap’’ in 1969, and from that discussion came thename Gap Inc., under which the company was incorporated inCalifornia in July 1969. Gap Inc. was reincorporated in 1988under the laws of Delaware.
GROWTH AND EXPANSION
Although the original targeted customers were primarilyyoung people, the convenience of a neatly organized jeansstore with Levi’s products attracted customers of all ages. Inless than one year, Gap’s business took off, and a second Gapwas opened in San Jose. In less than two years, there were sixGap stores in California. By 1972, Gap Inc. had 25 stores in sixstates. In 1973, Gap Inc. ventured into the East Coast market,opening 12 stores in New York, New Jersey, and Pennsylvania.In 1974, Gap expanded into Washington, Minnesota, Missouri,Oklahoma, Maryland, Virginia, Georgia, Arizona, Texas, andIllinois, with a total of 90 stores. In 1976, Gap Inc. wentpublic with its stocks, offering 1.2 million shares on the NewYork and Pacific stock exchanges, selling at 75 cents a share.
This case was prepared by Masaaki Kotabe and updated by Sonia Ketkarfor class discussion rather than to illustrate either effective or ineffectivemanagement of a situation described (2006).
In 1979, Gap Inc. opened a modern distribution facility inDenver, Colorado. By 1981, Gap Inc. had opened 500 storesnationwide. In 1983, Gap Inc. purchased Banana Republic, atravel clothing company that sold mainly through catalogs. By1985, there were 613 Gap stores and 35 Banana Republics.The first GapKids store was introduced in 1987; then in 1988,the Old Navy Clothing Company was first introduced. In thesame year, Gap opened two factory outlets selling merchan-dise at discount prices. In 1990, GapKids formed a separatedepartment for baby clothing called BabyGap. In 1992, Gapstores also formed a separate department called Gap Shoes.The year 1993 was marked by the opening of Gap warehouseor outlet stores as well as an entry into the French market. OldNavy was started in 1994, and the following years witnessedthe introduction of online Gap Maternity and the launch ofthe e-businesses of Gap, Banana Republic, and Old Navy.
As of 2005, the company operated:
• 3,010 stores in the United States, Canada, United Kingdom,and Japan.
• 462 Banana Republic stores, including 18 in Canada.
• 907 Old Navy stores.
• the total number of stores in:
United Kingdom 134Canada 173France 33Japan 84
SELLING PRIVATE STORE BRAND PRODUCT
Within three months of opening the Gap, Fisher realized thatthe real business was in selling Levi’s jeans, so he dropped therecords and cassette tapes from his inventory. Until the end of1973, Gap advertised and carried only Levi’s brand products.In 1974, Gap introduced its first private-label clothing intothe merchandising mix. When price maintenance crumbledbecause of a Federal Trade Commission directive in 1976,Levi’s products began to sell at discount, and Fisher was con-vinced that Gap’s competitive advantage could not rely solelyon the low prices of Levi’s products. Since then, he has focusedon reducing Gap’s reliance on sales of Levi’s products. As aresult, Levi’s products began to decrease as a percentage ofGap’s total sales. By 1987, Levi’s made up less than 50 per-cent of Gap’s total sales. By 1985, Levi’s sales dropped to 21
662 • Case 8 • Gap Inc.
percent of Gap’s total sales, then 14 percent in 1987. Finally, in1990, Gap dropped Levi’s altogether and started selling onlyprivate-labeled products.
GAP INC. OPERATING COMPONENTS
Gap Inc. is a specialty retailer that operates stores sellingcasual apparel, shoes, and other accessories for men, women,and children. It includes the following registered trade names:Gap, GapKids, BabyGap, Gap Shoes, Gap Maternity, BananaRepublic, and Old Navy Clothing Company. In April 2005,Gap Inc. announced the launch of its newest brand, Forth& Towne apparel and accessories for women over 35. Thecompany planned to open four test stores in Chicago and NewYork in Fall 2005. The baby boomer age and the spreadingability of this age group has created an opportunity for thecompany.
The company has continued to focus on developing andgrowing its brands, and it believes that its brands are amongits most important assets. The company is taking action tomaintain and strengthen brand loyalty, including significantlyincreasing its investment in advertising and marketing.
Besides expanding the number of print ads placed in majormetropolitan newspapers and their Sunday magazines, majornews weeklies and lifestyle and fashion magazines, the com-pany’s ads appear in various outdoor venues, such as masstransit posters, exterior bus panels, bus shelters, and giganticbillboards spanning entire buildings. The company continuesto run TV ads for all of its brands and radio ads for OldNavy.
The company continues to add flagship stores and increasetelevision advertising to complement its in-store customerservice focus. The company also continues to invest in storeexpansion as well as development of new distribution channelsto address changing market requirements. Its new channelsof distribution include Gap Online, Old Navy Online, GapMaternity Online, and a catalog for Banana Republic. Thecompany has a limited operating history in these new channelsof distribution and is faced with competition from establishedretailers in these new lines.
The retail apparel business fluctuates according to changesin customer preferences dictated in part by fashion and season.These fluctuations especially affect the inventory owned byapparel retailers, since merchandise usually must be orderedwell in advance of the season and sometimes before fashiontrends are evidenced by customer purchases. Gap is also vul-nerable to changing fashion trends. In addition, the cyclicalnature of the retail business requires the company to carry asignificant amount of inventory, especially prior to peak sell-ing seasons when the company and other retailers generallybuild up their inventory levels. Gap must enter into contractsfor the purchase and manufacture of apparel well in advanceof the applicable selling season. As a result, the company isvulnerable to demand and pricing shifts and to suboptimalselection and timing of merchandise purchases.
RETAIL DIVISIONS
Gap operates under different divisions: Gap, Banana Repub-lic, GapKids, BabyGap, Old Navy, and International Division,among others. The first seven operate domestically, and thelast one operates all of the stores from the first seven divi-sions that open overseas. The company continues to expand
internationally each year. It is faced with competition inEuropean and Japanese markets from established regionaland national chains. If international expansion is not success-ful, the company’s results of operations could be adverselyaffected. The company’s ability to grow successfully in thecontinental European markets will depend in part on deter-mining a sustainable profit formula to build brand loyaltyand gain market share in the especially challenging retailenvironments of France.
Gap Division. This division has by far the most stores—morethan all of the other divisions combined—with 1,291 storesoperating in the United States in 2005. The Gap Shoes sub-division also operates under this division. All stores underthe Gap division are called The Gap. The Gap stores areclassified as clothing retail stores for men and women, withStandard Industrial Code 5651. In the United States, thereare 145 domestic competitors for The Gap; and in 1998 TheGap ranked third in sales. In the beginning, products underthis division consisted of an assortment of unisex basics; butrecently they have evolved to become more gender specific. In2004–2005, the company engaged well-know celebrities likeSarah Jessica Parker and musician Joss Stone to promote theGap brand.
Banana Republic Division. When purchased in February1983, Banana Republic was already famous for its travel andsafari wear, but only two Banana Republic stores existed.After the purchase was completed, the parent company cre-ated a new division to operate all Banana Republic stores. GapInc. also invested capital to create a product development andproduction team for Banana Republic, allowing it to introduceits own new private-label fashions. In addition, there was rapidexpansion into other parts of the country. Products under theBanana Republic division are more upscale, more tailored, andcome in more refined fabrics than those in The Gap stores.Leather goods and jewelry goods have been introduced intothe merchandise mix. Internationally, Banana Republic storesare run only in Canada but in 2005, the company announcedthat it would open two stores in Japan in the shopping districtsof Ginza and Roppongi. The company also offers these prod-ucts online on www.bananarepublic.com. Banana Republichas sales of over $2 billion in the North America. Presently,the company is trying to move toward being a fashion houseby showcasing its designs in fashion shows.
GapKids Division. After this division was formed in 1986,it became the fastest growing division of Gap Inc. All storesunder this division are called GapKids stores. Products in thisdivision are essentially miniature versions of The Gap prod-ucts, but with more focus on color variations. These productshave also switched from unisex to more gender specific. Theformation of the BabyGap subdivision under GapKids isanother reason for the rapid growth of this division.
Old Navy Clothing Company Division. This division oper-ates all Old Navy Stores and Gap Warehouses. There arenow 907 Old Navy stores operating under this division sincethe first introduction in 1994. There is also a Gap Warehouseoperating under this division. The formation of the Old Navydivision came at a time when sales were down, and Gap Inc.
Case 8 • Gap Inc. • 663
needed new ways to attract customers. The strategy was tosell merchandise similar to Gap stores but at lower costs.This division is expected to surpass the GapKids division andbecome the fastest growing division of Gap Inc. Internation-ally, Old Navy stores, too, exist only in Canada. The companyalso offers these products online on www.oldnavy.com. Thecompany plans to open 200 new stores by 2007 and add newlines such as plus sizes, maternity, and personal care.
International Division. All stores located in foreign coun-tries are under the control of the International Division. Thisdivision includes Gap, GapKids, Banana Republic, and OldNavy stores. The first overseas store was established in 1987in London, thus gaining entry into the British apparel market.In 1988 the first store in Canada was established, and in 1993the first store in France was opened. As of 1994, the Inter-national Division operated 40 Gap and GapKids in England,59 in Canada, and 3 in France. International Division alsooperates Banana Republic in Canada and Australia. Interna-tional Division shows strong growth potential and continuesto expand existing markets in Europe and to gain major entryinto new market including Japan.
PRODUCTS AND CUSTOMER BASE
The Gap division sells mainly men’s and women’s casualand active wear. Clothing items, including jeans, sweat suits,sweatshirts, denim wear, and polo-style pocket T-shirts aremarketed. The Gap division has also expanded its market toinclude handbags, shoes, and a higher fashion line of eveningwear. In addition, during the 1990s, the Gap division enteredthe bodycare products and cosmetics market, introducingsoaps, body lotions, shower gels, shampoos, conditioners, aro-matic candles, and other related items. In addition to sellingtravel and safari wear, the Banana Republic division sellsmen’s and women’s casual wear, made of finer fabrics andpriced higher than can be found in Gap stores. Together, theGap stores and the Banana Republic divisions target mainlycustomers 20 years or older. GapKids, which sells miniaturizedversions of Gap store products, originally aimed at childrenaged 2 to 12, but with the introduction of BabyGap, it hasbeen able to add even younger customers to its customer base.The most recently introduced Gap Maternity sells maternitywear only through its Web site. The Old Navy Division, sell-ing cheaper products, targets lower-income shoppers. TheInternational Division targets foreign customers in similar agegroups mentioned earlier.
SOURCING
Gap purchases merchandise from some 700 sources locatedboth in the United States and in around 50 countries overseas.This procurement strategy is designed to reduce each sup-plier’s importance, so that no single supplier can affect Gap’soverall operations significantly. All suppliers account for nomore than 5 percent of the purchase. The suppliers manu-facture the Gap’s private-label merchandise according to thecompany’s specifications. Gap purchases are comprised of 40percent domestic-made merchandise and 60 percent foreign-made merchandise. Of the foreign sources, approximately 23percent are from Hong Kong, and the remaining purchasesare spread across 42 other countries. Hong Kong, Taiwan,South Korea, Singapore, and China constitute over 50 percent
of Gap’s foreign merchandise sources. Sudden political insta-bility in any of these countries could quickly have an adverseeffect on Gap’s sourcing operations, as would any impositionof import restrictions such as tariffs and quotas by the U.S.government on products made in these countries.
Hong Kong is by far the most important foreign sourceof Gap’s merchandise. Hong Kong has a total population of6.019 million, of which 17.8 percent are engaged in manufac-turing and 33.6 percent are in either retail trade or wholesale.Until recently, Hong Kong had an unemployment rate ofonly 2.2 percent, and the Hong Kong government had toimport labor from abroad to counter a shortage in laborsupply. Despite this labor shortage, the well-educated laborforce in Hong Kong is relatively cheap to employ, and withthe increased pressure of manufacturing companies movingacross the border into China, even cheaper labor may result.U.S. retailers, including Gap Inc., have long been the targetof criticism for selling goods imported from Hong Kong andother low-wage countries such as Taiwan and South Korea. Inaddition to its low-wage rate, Hong Kong is a favored apparelsource for many retailers because of the flexible manufac-turing and quick response strategies introduced by the HongKong Productivity Council and adapted by many of HongKong’s apparel producers. Both of these strategies reduceinventory costs for the retailers. Furthermore, the apparelindustry in Hong Kong is now adapting to many new tech-nologies and production methodologies, all aimed at reducingapparel production costs.
Like other Western firms that employ labor at sweat shopsin emerging countries, Gap has often been accused of profitingfrom such practices. Therefore, Gap now has over 85 sup-plier compliance officers who screen prospective and presentsuppliers for acceptable labor practices.
ADVERTISING
Gap Inc. advertises mainly through major newspaper publi-cations, but it also advertises in fashion magazines and onmass transit posters, billboards, and exterior bus panels. Alladvertisements stress the central theme of American design,quality, and moderate pricing, although they are producedseparately in each country to suit local tastes.
DISTRIBUTION
All merchandise is shipped to distribution centers for dis-tribution. These centers are located in California, Kentucky,Maryland, Canada, and the United Kingdom.
MARKETING
The company has a separate marketing team for each brand.The teams are headquartered in San Francisco’s Bay areain California. These headquarters are also responsible foradvertising.
PERFORMANCE
Although Gap Inc. saw increasing earnings until 1999, the nextfew years witnessed a fall in earnings (see Exhibit 1). Indus-try experts cited a variety of reasons for dipping revenues,such as launching too many stores to having no differentiationbetween its brands. Although the company presently has ade-quate cash flow to settle its debts in the immediate future, itwill have to find a way to get back on track to profitability to
664 • Case 8 • Gap Inc.
sustain itself in an economy characterized by fierce competi-tion. In 2002, Gap’s debt was downgraded by analysts to junkbond status. The company fared better in the next couple ofyears. However, profits fell again in the first quarter of 2005,so the company is now looking into bringing about more stylesand designs in women’s clothing to bring it back on track toprofitability.
EXHIBIT 1NET SALES AND EARNINGS COMPARISON
Net Sales Net EarningsYear (in US$ Billion) (in US$ Million)
1993 3.2 258.41994 3.7 320.21995 4.4 354.01996 5.2 452.91997 6.5 533.91998 9.1 824.51999 11.6 1127.12000 13.6 877.52001 13.8 −7.82002 14.4 477.42003 15.8 1030.02004 16.3 1150.0
GAP’S FOREIGN MARKETS
Gap’s foreign markets include Canada, Britain, and France.Following is a detailed analysis of these markets.
CANADIAN MARKET
As store openings increased across the United States dur-ing the 1980s, Gap Inc. began to realize the potential forexpanding into the Canadian market.
General Economy. During the mid-1980s, prior to Gap Inc.’sCanadian involvement, Canada enjoyed a stable and slowlygrowing economy. This brief boom was followed by a recessionin the late 1980s. While other Canadian companies suffered,Gap Inc. sought to gain first-mover advantages by riding a pos-sible rebound in the economy and tried to become a dominantplayer in the Canadian apparel industry. The Canadian gov-ernment imposes few restrictions on foreign direct investment.This was a major decision factor in Gap Inc.’s move to set upstores in Canada with the opening of eight stores in Vancouverin March 1989. The first of these was in Vancouver’s PacificCenter.
Government Regulations. Since it is a good environment forapparel market penetration, Canada subscribes to the Gen-eral Agreement on Tariffs and Trade. This greatly influencedGap’s later decisions to expand into other countries as well.Even though Gap Inc. conducts its sourcing mostly outsideof the United States, it ships those goods back through theUnited States, so that they have to be imported into countrieslike Canada. In addition, Canada’s goal of totally eliminatingtariffs on goods of U.S. origin by 2000 provided Gap Inc. withan advantage on entering the Canadian apparel market. Thistrend has enabled American companies like Gap Inc. to lower
their cost of doing business in Canada by making it cheaperto import their products from the United States. Canada evenassists U.S. companies planning to enter the Canadian marketthrough the United States and FCS Export Assistance Ser-vice. Along with fewer government restrictions, Gap Inc. didnot encounter the traditional barriers of entry such as localcontent requirements, political turmoil, and import quotas.
Market Expansion. In 1992, Gap Inc. made a big expansionmove further into the Canadian apparel market. In a jointventure with John Forsyth Company Inc., Gap Inc. began tocompete on the same level as native Canadian apparel compa-nies such as Hudson Bay Company. With the impending NorthAmerican Free Trade Agreement, Canada’s borders were nowcompletely open to outside competition. This developmentpaved the way for even more store openings for Gap Inc.
Now, Gap Inc. not only has to compete with Canadianapparel companies like Hudson Bay Company for marketshare, but also with new U.S. companies in Canada such asThe Limited. This increased competition has made Gap Inc.look at further Canadian expansion from a different perspec-tive. According to Gap Inc.’s Ken Rapp, ‘‘The holdup is nolonger a free trade issue, but a dearth of good retail space inCanada where there are fewer shopping malls per capita andlower vacancy rates.’’
With ever-increasing success, Gap Inc.’s Canadian storesbegan to branch out with Canadian versions of the U.S. Gap-Kids and BabyGap in the early 1990s. This expansion wasmade possible in part by Canada’s recovering economy andnotable growth in the apparel industry. Turtleneck jerseys, aGap staple, rose in sales 122 percent. Men’s outerwear rose 17percent after a three-year decline.
Growth Projections. Riding on the success of Gap and Gap-Kids stores, Gap Inc. believed its Banana Republic divisionwould not have a difficult time establishing stores in Canada.Thus, Banana Republic, a more upscale, higher-priced ver-sion of The Gap, opened stores in Eaton Center in Torontoand West Edmonton Mall in Alberta. Gap Inc. seeks to stealsome market share from existing Canadian chain stores suchas Roots, River Road, and Eddie Bauer by installing BananaRepublic stores.
Market Characteristics. According to the InternationalTrade Administration’s Canadian Market Overview, the newtrend in the Canadian apparel market is to economize by sav-ing money on clothing. This is because of increases in housingcosts and taxes. Female consumers are becoming more time-pressured, and as a result, they are spending half as muchtime per month shopping as they did 10 years ago. In general,adult consumers are becoming more knowledgeable aboutthe clothing they buy and are more careful in evaluating theirpurchases in terms of value.
UNITED KINGDOM MARKET
According to UK trade journals, American apparel is makinga strong showing in the British market and will continue todo so in the near future. Approximately 60 percent of men’sapparel and 35 percent of women’s apparel are sold throughretail stores. However, Gap stores in the U.K. have not beenable to satisfy the market, and in mid-2003, the company
Case 8 • Gap Inc. • 665
decided to close 13 of its stores in the region. In 2004, lossesat UK stores were at all time high.
Market Size. According to the 2001 International MarketReport, the British market for men’s apparel was about $3.34billion, and the women’s apparel market about $4.59 billion.Both are in decline because of recession.
Market Health. The UK market for apparels is currently in arecession. British retailers are hoping for ‘‘business as usual’’once again in the not too distant future, but according tomarket analysts, recovery is still a long way off. There areoccasional mini-surges in consumer spending, and retailershave devised some strategies to capitalize on these surges.One strategy is to lower price while stressing quality. Anotheris to adopt the ‘‘one-stop-shopping’’ concept, that is, pairingmen’s and women’s merchandise together in one store so bothcan be bought simultaneously. This strategy was in response toan observation that consumers now have a tendency to comein couples. Some retailers even place children’s apparel itemsalong with men’s and women’s apparel items, thus creating atrue ‘‘one-stop-shop.’’
Market Trends. British consumers are highly receptive toU.S.-designed and -manufactured apparel items. Studies showthat the average British consumer thinks of American design-ers as firm believers in making practical clothes for real people,as compared to European designers who make fashion show-style clothing that is unwearable. Outerwear sold by suchretailers as Gap Inc. and Timberland is very popular. Men’sand women’s apparel trends differ in that menswear tends tobe more basic; the changes are usually in color and fabric,not style. Men are moving toward plainer pieces and awayfrom heavily logoed styles. Women’s purchases focus more onfashion designer labels.
Customer Base. The 15- to 25-year-old age group tends tomake purchases in boutiques. Older consumers shop in storesthat are well known for quality, durability, and good value.Most retailers now are focusing on customers who are over25 years old. This is because of increasing youth unemploy-ment and an aging population of baby boomers. A significantpercentage of the customer base is made up of large-sizedcustomers, particularly women.
Competition. American-made apparel faces competitionfrom European designers, Asian-made apparel, and fromeach other. European designers from the European Unioncan ship their goods to the United Kingdom duty-free, andAsian-made items are usually produced by cheap labor.
Government Regulations and Market Access. There are fewtrade barriers for apparel. No special forms of documentationare required for apparel items going to the United Kingdom.No special standards are set. No import licenses are necessary.Textile raw materials enter the United Kingdom with up to15 percent duty, while finished apparel items are charged withup to 14 percent duty and value-added tax of 17.5 percent.No duties have to be paid for goods imported temporarily tothe United Kingdom or located in free ports (UK free-tradezones).
FRENCH MARKET
France is Gap’s new foreign market, and 33 Gap stores operatein France. The following analysis of the French apparel marketincludes size of market, characteristics of growth, growth pro-jection, industry structure, competitors and substitutes, andgovernment regulations.
Market Size. According to the U.S. Department of Com-merce World Apparel Market Research Report publishedrecently, France was the sixth largest market for apparel, withdemand of over $12 billion. It was also the sixth largest marketfor apparel imports from the United States, with total demandof $200 million.
Market Characteristics and Current Growth. The Frenchapparel market can be characterized as a mature, sophisti-cated, slow-growth market rather than an emerging market. Itis experiencing 4 percent average annual growth and 2 percentannual growth in its market for U.S. imports. The UnitedStates does not have a large share of the French market at themoment. However, the French are becoming more receptiveto U.S. fashion, especially U.S. sportswear. French womenare just beginning to buy American-made apparel, and thenatural ‘‘American look,’’ especially Western-wear clothing,is becoming popular in France. The 15- to 25-year-old agegroup is very fashion conscious and strongly influenced byAmerican styles, especially jeans and college or football teamlogo apparel.
Growth Projections. The industry has suffered from theworldwide economic slowdown since 1991, but some salesimprovements have occurred since 1994. Apparel sales areexpected to grow at a rate of 2 percent. In spite of the lowmarket share of U.S. firms, France is very promising forGap Inc. The French have a high level of receptiveness toU.S. goods, and the market for U.S. imports is expected tocontinue to grow at 2 to 3 percent annually. Unfortunately,local and third-party competition is high, but market barri-ers in this area are negligible and do not pose a problem.According to the U.S. Department of Commerce, Interna-tional Trade Administration, currently the two most promisingsubsectors in apparel for U.S. companies are sportswear andjeans.
Business Environment. The French commercial environ-ment is very dynamic and sophisticated, and quickly reflectsconsumer trends. There is a strong market for high-qualityconsumer goods. Independent specialty stores are the mainmeans of distribution in affluent cities.
Business Attitude Toward the United States and Exit/EntryBarriers. In general, the attitude toward American compa-nies is favorable, and the French are quite receptive to U.S.goods and services. However, strong interest groups are pow-erful influences on business judgment and government actionor inaction. These interest groups have been known to stagenoisy demonstrations, but they usually are a problem only forcompanies that pose a major threat to French suppliers.
There are no major entry or exit barriers to doing businessin France for most companies. Tariffs and duties on Americanproducts are discussed later.
666 • Case 8 • Gap Inc.
Competitors and Substitutes. Local and third-party competi-tion is rampant in the French market. It is particularly heavyin the consumer area where buyers are just beginning to lookfor ‘‘value’’ in their product choices, and most product linesthat are available are mature. In this mature and sophisticatedmarket, consumers are well served by suppliers around theworld. Therefore, major business breakthroughs are unlikely,but opportunities can be created in niche markets.
There is a natural tendency now for the French to buyapparel from within the European Union because of theincreasingly free flow of goods since the integration of Europe.Italy is and always has been a significant high-quality clothingcompetitor in France. However, Gap’s main competitors areNorth African and Southeast Asian companies, which havea strong presence in France because of their low productioncosts. At the moment, Asian countries have 31.7 percent ofthe French market for women’s clothing, and this number isexpected to remain constant.
There has also been an increase in imports from Morocco,Tunisia, Portugal, and, recently, Eastern Europe. Again, com-panies from these countries enjoy low production costs andclose proximity to the French market. Morocco and Tunisiaare actually the main suppliers of menswear imports to France,but the U.S. share of the menswear market has been increasingrapidly.
As far as substitutes, there has been a massive growth ofsupermarkets and hypermarkets (huge shopping stores with awide variety of products) in France, not just in food but alsoin apparel. These stores could pose a threat to specialty storessuch as The Gap if people begin doing all of their shopping athypermarkets and stop going to the specialty stores.
Government Regulations and Controls. France has had atradition of highly centralized administrative and governmen-tal control of its essentially market economy. However, theapparel industry has little restrictions other than tariffs andduties on imported products.
As part of the European Union, the TARIC system appliesduties to all imports from non-EU countries. This gives Euro-pean companies a slight cost advantage over U.S. companies.However, this advantage can be negated if production costsfor U.S. companies can be lowered. Duties on manufacturedgoods from the United States are moderate, ranging from5 to 17 percent; they are calculated as a percentage of thevalue of the imported goods. Under the Lome Convention,varying preferential tariff treatment is given to imports fromdeveloping countries in Africa, the Caribbean, and the Pacific,which gives companies an incentive to manufacture in thesecountries.
AUSTRALIAN MARKET
Following the lead of successful U.S. retailer Toys ‘‘ R’’ Us,Gap Inc. has been negotiating possible sites for anotherinternational outlet. Store location, product positioning, andmarketing and advertising decisions depend heavily on howGap executives assess the following conditions.
Economic Health. Consumption expenditures continue toincrease in the face of high unemployment, which rose by2 percent in 1992 and by 7 percent in 1993. A reverse in thistrend in 1994 and 1995 has since been the key to a robust
recovery. The average annual growth rate for the apparelmarket during this period is expected to be between 3 and5 percent.
The downward push against inflation was one of the fewpositive effects of the recent recession. Lower inflation num-bers are a positive sign to potential investors, many of whomhave been discouraged by the sliding Australian dollar. Astrong local currency is helpful for specialty retailers like theGap on two levels. First, its products will become relativelymore price competitive. Second, Gap would benefit from astrong Australian dollar through translation gains, as profitsare repatriated.
Others are wary that the removal of quotas and tariffs willfoster a fiscally unhealthy demand for imports. If past per-formance is any indication, economic expansion would mostlikely lead to a rise in the current account deficit. Officials citethat if the Australian president’s goal of 4 to 5 percent GDPgrowth is realized, the current account deficit will increasefrom 3.75 to 4.25 percent of GDP during the same period.
Market Barriers and Government Regulations. In the recentpast, currency exchange rate levels and hefty import dutiesmade it difficult to sell U.S. apparel products in Australia.Thankfully, import duties are on the decline, and the Aus-tralian government promised that this figure would continueto fall, via the TCF tariff reduction program, by 3 percentannually until the year 2000. The tariff on textiles and apparelwas then expected to level off at 25 percent. Add to thisthe abolition of import quotas in February 1993, and for-eign apparel retailers and their products become increasinglyattractive in the face of domestic competition. This despite therecent ‘‘Buy Australian’’ campaign, which Australian officialsinsist has successfully increased consumers’ preferences forlocally made products.
Gap Inc. executives must also consider the additional costsassociated with the newest clothing standards to be adoptedby Standards Australia, a national regulatory committee. Thenew standard rates clothing according to the protection itoffers from the sun. If adopted, Gap must carefully considerwhich products should be introduced in Australia and possiblyreconsider its own internal manufacturing standards.
Competition. Competitors vying for the US$1.5 billion inapparel revenues include traditional department stores, dis-count retailers, mail-order companies, home shopping clubs,and a growing contingent of specialty shops, including Gap.Industry sources estimate that 15 percent of the market iscaptured by traditional retailers and 85 percent of the marketis sold through other means. Experts also say that, of theexpected 4 percent growth in the apparel market, an increas-ing proportion is expected to be captured by competitivelypriced imports. Competitors in Australia’s apparel marketbreak down as follows:
Department Stores. Department store leaders like ColesMyer, David Jones, and Georges sell to the middle of the mar-ket. These stores tend to sell higher-quality apparel goods,with various departments devoted to discount and specialtyapparel. Coles Myer, for example, has a Myer’s Bargain Base-ment department, and its rival Georges offers a floor devotedexclusively to international apparel. Gap will take businessmainly from David Jones and Coles Myer.
Case 8 • Gap Inc. • 667
Chain Stores and Boutiques. These stores generally sellaccording to the selective tastes of their target markets. Gapstores are somewhat different from these retailers in that theywould sell Gap brand items exclusively. Sportsgirl, catering tofemale teenagers, and Portmans are the largest in this segmentand would compete directly with Gap.
Mail-Order Companies/Home Shopping Clubs. Throughits subsidiary Myer’s Direct, Coles Myer has broadened itsattack on consumers on two fronts: mail-order catalogues anda new home shopping program. The initial response to thehome shopping program was not very enthusiastic; however,its mail-order business, the largest in the country, has beenmore successful, averaging 50 to 60 percent growth since itsinception in 1989.
Positioning. Gap Inc. should continue to take advantage ofits niche appeal as a U.S./California-based apparel company.Although U.S. companies, in general, face heavy competitionin Australia, single-brand stand-alone stores like the Gap willalways find opportunities in niche markets. Gap should avoidcompeting on the basis of price with imports from China andHong Kong. Gap’s greatest initial success will come fromproviding one of Australia’s populous cities, such as Sydneyor Melbourne, fashionable, high-quality ‘‘American’’ apparelproducts.
GERMAN MARKET
Gap operated 20 stores in Germany until the beginning of 2004when it sold all of its unprofitable German stores to Swedishapparel retailer H&M. Gap executives faced the followingchallenges and opportunities that are unique to the Germanapparel market.
Market and Economic Health. In 1998, Germany was rankedat the top of the list of apparel importers at over $30 billion.A closer look shows that the most promising subsectors weresports, leisure and casual wear (US$7 billion), and jeans wear(US$4 billion). Average annual growth for Germany’s apparelindustry through 2000 is estimated to be around 3 percent.
The German clothing industry fared well under the prevail-ing conditions of the late 1980s and early 1990s, which werea result of the ongoing reunification process. The opening ofEast Germany, with a population of 16 million, offers poten-tially large profits and a number of challenges for apparelmanagers seeking new markets. For the most part, apparelretailers are choosing to enter this market through joint ven-tures and partnerships, but others, like Levi Strauss, havechosen to establish their own branches. Still, progress in thisregion is painfully slow as the transition from a commandeconomy to a market economy progresses.
Consumer Attitudes. Consumer spending is an integral partof economic growth in Germany and for Europe as a whole.Lately, however, German consumers have been unwilling toparticipate, and recovery in the region has stalled. Severalfactors have contributed to this cautious consumer attitude:rising unemployment, which was already 10 percent, higherrents, which have increased by 6 percent in the West and by asmuch as 58 percent in the East, and high tax rates—currently34.4 percent for the average worker. Even Germans from theEast, who were hungry for consumer goods from the West,
are becoming finicky shoppers. The bargain shopping attitudethat is prevalent in the United States has found its way to EastGermany. ‘‘They don’t buy so many trendy articles— it’s backto basics like T-shirts, jeans, blazers, and sweaters.’’
Competition. Because of these recent changes in consumerattitudes, low-cost apparel imports now dominate the Germanmarket. Basic items from Eastern Europe, Turkey, and Asiacan be found for one-tenth of the price of comparable U.S.offerings. This is not to say that consumers in Germany arenot willing to pay higher prices for U.S. goods. Items mustnot only be of good quality, but must also carry a well-knownAmerican trademark.
Leading competitors include Hugo Boss, a men’s-wearmanufacturer and retailer that is currently the most profitablein Germany. Boss’s success is mostly a result of repositioningits product lines. It has recently included a lower-end productline under a different label, in addition to its traditional mid-priced and premium-priced offerings. Gap will be in directcompetition with Hugo Boss for casual wear revenues. Adler,a discount fashion chain, has 60 stores in Germany, 10 ofwhich were recently opened in East Germany. Gap shouldavoid competing head to head with Adler on a price per unitbasis.
Positioning. Germans have shown a willingness to pay a pre-mium for highly recognizable American goods and have doneso, paying between $80 and $100 for a pair of Levi’s jeans.Strong, pervasive television and print advertising is the key tocreating this image awareness.
JAPANESE MARKET
Gap currently operates 84 stores in Japan. With a total popu-lation of 125 million people, Japan is an excellent market forGap’s products. The following is an overview of this market.
Market Size. The U.S. Department of Commerce WorldApparel Market Research Report shows Japan as being thelargest total market for apparel with total demand of $70 bil-lion. It is the second largest market for apparel imports fromthe United States with a demand of over $600 million, but thisstatistic is slightly misleading. This is because the DominicanRepublic, which tops Japan in this category, is merely a majorassembly point for U.S. apparel and not a major market. Thegoods are assembled there in a low-cost environment but aretransported abroad and sold in other countries. Thus, Japan isin reality the largest market for U.S.-made apparel products.
Market Characteristics and Current Growth. As a result ofthe economic recession in Japan over the last several years,the average annual growth rate for apparel in Japan has onlybeen a meager 2 to 3 percent, but imports from the UnitedStates have been increasing at an annual rate of 11 percent.This large growth is due to the boom of ‘‘American casualfashion’’ in Japan.
In the past, Japan closely followed European fashions,especially Italian fashions. However, today many Japaneseprefer American fashions, in particular, casual apparel. Sports-related products such as T-shirts, sweat suits, and clothing withprofessional sports team logos are particularly popular, and soare jeans, outdoor wear, and any items with a casual, uniquely
668 • Case 8 • Gap Inc.
American look. Individuals in the 15- to 25-year-old age groupfollow U.S. fashion trends closely. However, women’s wearand children’s clothing wear in the United States are notgaining popularity quickly and are facing difficulties in theJapanese market.
Another trend in the Japanese market, and indeed in allsectors of business, is the growing tendency of consumersto demand ‘‘value.’’ Consumers are noticing that Japaneseprices are much higher than those of comparable industrial-ized countries. (Japanese consumer prices average 40 percenthigher than those in the United States.) Consumers still wanthigh quality but are also demanding lower prices.
Growth Projections. According to the U.S. Department ofCommerce International Trade Administration, apparel wasthe thirteenth best prospect industry sector in Japan for U.S.exporters in 2000. Analysts predict that the overall Japaneseeconomy, which has been in recession until recently, willimprove, but consumers are likely to be more cautious aboutspending money. This is in line with the growing trend toward‘‘value.’’ The apparel market is expected to continue growingat 3 percent, but import growth is expected to increase. Japanhas a very high level of receptivity to U.S. goods, not muchlocal and third-country competition, and almost no marketbarriers to entry. For Gap Inc., this indicates a favorable envi-ronment. However, the distribution system in Japan is themain obstacle to market entry and may pose major problems.
Business Environment. The domestic market is very com-petitive, and consumers are highly brand conscious. Long-standing, close-knit relationships between individuals andfirms are very important in business operations. Local businesspractices are very traditional, and foreign company partici-pation is not considered important. A long-term approach isessential for U.S. companies in Japan to develop the necessarybusiness relationships and show a willingness to contribute tothe local business community.
Business Attitude Toward the U.S. and Exit/Entry Barriers.Japan has a positive attitude toward U.S. suppliers, and manyU.S. companies have established reputations in Japan forhigh-quality, reasonably priced products. However, some U.S.companies are still finding it difficult to overcome traditionalJapanese attitudes toward foreigners as being ‘‘outsiders.’’ Inthe past, Japanese laws and regulations prevented many U.S.-based companies from entering Japan after World War II. Theresult has been little interaction until recently, and Japanesecompanies are hesitant to trust American firms. Officially,Japanese government policy is to promote imports and inter-national business interaction, but traditional business attitudesare making this difficult.
It is also difficult for many U.S. companies to be acceptedas business partners by Japanese companies that are boundby keiretsu ties that prevent them from doing business withnon-keiretsu companies. If a Japanese company that is part ofthe country’s keiretsu is qualified in a particular business area,it will be chosen over a U.S. company. This is a significantbarrier to market entry in Japan.
The most formidable obstacle for U.S. companies to over-come in Japan is the traditional distribution system. Thekeiretsu system controls many of these distribution networks
and long distribution channels in which all participants mustpurchase from and sell to each other. As a result, U.S. compa-nies cannot easily get into a distribution system.
Competitors and Substitutes. Competition in the apparelindustry comes mainly from low-cost Asian companies thatalso have the advantage of easy access to Japanese markets.However, U.S. brand image is very important, and Asianproducts are considered low quality. European companiesprovide some competition, but this is mainly in the area ofhigh-end brand name and designer clothing. Japanese com-panies’ competitiveness is eroded by the high manufacturingcosts resulting from the strong yen.
Substitutes in the form of low-price discount retailers arebecoming increasingly prevalent in Japan. They could pose athreat to higher-priced apparel stores such as The Gap andnow Banana Republic.
Government Regulation and Controls. There is an incredibleamount of government regulation in the Japanese businessenvironment. This is mainly in the form of licenses, permits,and approvals that are required to do business. These licensesoften take a long time to process and are somewhat of a barrierto market entry. In addition, ‘‘administrative guidance’’ papers(informal edicts issued by government officials to companies)are used to control foreign companies and restrict marketentry. Although the Japanese government has removed mostof the legal and administrative restrictions on foreign businessactivities in Japan, anticompetitive and exclusionary businesspractices still exist at lower levels of government. However,the government is actively seeking ways to increase foreigninvestment and imports.
CONCLUSION
As Gap Inc. continues to expand into the foreign markets, itshould consider several options to reduce costs and therebyincrease profit. First, because Gap Inc. does not produceor procure merchandise in any of the foreign markets it iscurrently in, establishing free-trade zones in those countriesmight help increase profits by temporarily reducing duty andVAT costs, and no duties would be paid on extra merchandise.Second, attention should be paid to centralizing advertisingto reduce cost. Third, the problems associated with sourcingfrom so many different regions should be considered andways found to correct them. Finally, Gap Inc. should seekways to take advantage of the many free-trade agreementsthat recently have been signed.
DISCUSSION QUESTIONS
1. Gap, Inc., conducts sourcing from 700 different sourcesboth domestically and abroad. What would be some of theadvantages for this type of sourcing strategy? What wouldbe the disadvantages?
2. How can Gap Inc. benefit from the free ports in the UK?
3. The North American Free Trade Agreement has benefitedmany U.S. companies by reducing tariffs on NAFTA coun-try goods traded between each other. How has this actuallybenefited Gap Inc.? in the future?
4. Now that more U.S. companies are moving into Cana-dian apparel markets, Gap Inc. is facing more and more
Case 9 • Motorola: China Experience • 669
competition from apparel manufacturing companies fromits own country. How can it maintain its Canadian marketshare?
5. In Canada there is a recent trend of consumers abandoningtheir name brands and buying cheaper garments to savemoney. What can Gap Inc. do to take advantage of thisnew development?
6. What steps should Gap Inc. take to combat ‘‘knockoff’’ items?
7. Gap operated around 20 stores in Germany until it soldthem to Swedish H&M in early 2004. Was the move nec-essary, or could the company have considered some otherstrategy?
� � � � � � � � � � � � � � � � � � � � � � � � � � � � � � �
CASE 9
MOTOROLA: CHINA EXPERIENCE
This news was unsettling but expected for Brian Lu, thegeneral manager of Motorola China’s Personal Communi-cation Sector. He had just received a report on the mostupdated market analysis. The report was on intensifying mar-ket competition in the Chinese cellular phone industry andstressed the emerging Chinese brands, among which TCL isthe current leader. TCL is eating shares from all of the inter-national brands, including Motorola. He knew the Chinesegovernment’s policy of promoting local companies over theirinternational counterparts, and this report confirmed a fearthat he had had since he was promoted to his current position.
Brian understood that Motorola, as the number one foreignimport/export company in China, was in a unique situation.Through the creation of complete locally sourced productionand development, Motorola had established a strong infra-structure and developed powerful relationships in China. Henow wondered, what was Motorola’s best strategy to takeadvantage of their company’s previous development? Thecompany needed a plan of action, and he decided to arrangea meeting to discuss how Motorola should react to these localbrands and overall market competitive pressures.
COMPANY BACKGROUND
Motorola was founded by Paul V. Galvin in Chicago, Illinois,in 1928. Under the leadership of Robert W. Galvin, Paul’s son,Motorola expanded into international markets in the 1960sand began to switch its focus from the previously dominantconsumer electronics market it had targeted. The companysold its color television receiver business, which then allowedit to concentrate energies on high-technology endeavors incommercial, industrial, and government fields. By the endto the 1980s, Motorola had become the leading worldwidesupplier of cellular phones. Following a merger with Gen-eral Instrument Corporation, Motorola became a leader incable modems and set-top terminals. This allowed the com-pany to become a leader in chip system–level technology,harnessing the power of wireless, broadband, and the Inter-net. Motorola is the first company to offer wireless always-onaccess to the Internet through its use of General Packet RadioService (GPRS) protocol technology. As an industry leader,
This case was prepared by Eric Berken and Yanhua Dai of the FoxSchool of Business and Management and updated by Sonia Ketkar atTemple University under the supervision of Professor Masaaki Kotabefor class discussion rather than to illustrate either effective or ineffectivemanagement of a situation described (2006).
Motorola has continued to grow, and in 2004 the companyhad worldwide sales of US$31.3 billion.
MOTOROLA CHINA
Motorola entered China in 1987 when it opened its first officein Beijing under the name of Motorola China ElectronicsLtd. In 1992, it set up the Motorola (China) ElectronicsLtd. in Tianjin and began to produce beeper-pagers, mobilephones, two-way radios, wireless communications facilities,semiconductors, automobile electronics, and so on. The prod-ucts not only were sold in China but also were distributed toworld markets. Through its early production of beeper-pagers,mobile phones, and two-way radios, wireless communications,semiconductors, and automobile electronics, the company hasbecome the biggest foreign import/export company in China(according to the Chinese edition of Fortune). Now Motorolais the largest foreign electronic company, the largest Ameri-can company. In 2003, Motorola was recognized as the foreigninvestor of the year by CCTV television network.
Motorola China utilizes local sourcing in a ‘‘win-win or two+ three + three’’ development strategy to make China its localhome and development base in Asia. Motorola’s China opera-tions consist of 1 wholly-owned factory, 1 holding company, 8joint ventures, 18 R&D facilities, and 26 sales offices. MotorolaChina employs a total of 10,000 people 1,400 of whom are inresearch and development (R&D). The company’s integrationand sales goals are driven by R&D centers, management train-ing, and joint-venture partner assistance that have establishedthe company’s ability to develop, enhance, and distributeproducts to local consumers. The overall goodwill createdby Motorola’s efforts to produce completely in China haveensured the company’s continued development in China’scomplex consumer and business markets.
Motorola China’s specific ‘‘two + three + three’’ is thecompany’s clearly defined approach for the future. The ‘‘two’’means to turn China into both a global production base and aR&D base of Motorola. Now, Motorola’s production base inTianjin has two parts: a semiconductor production center andan Asian communications production base. Motorola has alsodecided to build a research and development base in China,taking Beijing as the center. In the five years following 2003,Motorola expected to increase R&D fees by US$1 billion andrecruit 4000 research fellows. By that time, Motorola’s totalR&D investment in China will reach US$1.3 billion. The first‘‘three’’ means three times US$10 billion: by the end of 2006,
670 • Case 9 • Motorola: China Experience
an annual output value of US$10 billion in China; by the endof 2006, a total investment of US$10 billion in China, includinginvestment from strategic business partners like joint-venturepartners and suppliers; and an accumulated US$10 billion pur-chasing of accessories and services from China in the comingfive years. The other ‘‘three’’ means laying great emphasison the development of digital trunking and iDEN, semicon-ductors, and broadband besides wireless communications, andmaking the three operations the new profit-increase points ofMotorola.
Motorola has taken various measures to implement the‘‘two + three + three’’ strategy, including adjustment of thecompany’s worldwide manufacturing capacity, the decision toincrease R&D investment in China, the establishment of asoftware center in Chengdu, and plans of the Energy Sys-tems Group to establish its Asian design and procurementheadquarters in Shanghai.
A major factor in Motorola’s expansion is its utilizationof joint-venture partners to implement the infrastructure todevelop outlets for its products. Joint contracts with ChinaMobile and companies like Cisco and Nortel Networks haveallowed Motorola to expand into the vast Chinese markets.These contracts have given Motorola access to 21 Chineseprovinces of which 14 have contracts to deploy Motorola’ssystems and municipalities including Beijing, Tianjin, Zhe-jiang, Sichuan, Hunan, Jiangxi, and Liaoning. These venturesallow the company to focus on its expertise in developingand distributing cell phone technology and products while thenetwork infrastructures are handled by other companies withexpertise.
Motorola is currently the industry leader in China basedon its first-mover status. Motorola entered China at a primetime when mobile communications was still a novel idea andno one was selling it. As a result, the company enjoyed tenyears of success in selling its pagers as tens of millions ofChinese, at that time, wanted to carry one for convenienceand as a symbol of social status. Riding on that momentumand a strong emphasis on design and marketing, Motorola’shandsets hold the largest market share in China (estimatedat 28.9 percent) as its brand is often associated with best inquality, features, and form factor. China is arguably the mostimportant market in the world for Motorola, as Motorola hasbeen less optimistic about its future in the rest of the world.For these reasons, Motorola has announced plans to increaseinvestment in China to $10 billion (cumulative) by 2006. InChina in 2003, stood at $3.4 billion and sales were $4.67 billion.
MARKET STRUCTURE
The Chinese government regulates and implements itsnational telecommunications infrastructure through ChinaTelecom and the China United Telecommunications Corpora-tion (UNICOM), both of which are state-owned corporations.This duopoly market is still closed to foreign wireless serviceproviders, such as AT&T. Because the government-controlledChina Telecom and UNICOM do not have a large motivationto explore the market, they either charge new subscribershigh initial fees or provide prepaid wireless service to con-sumers. This strategy makes cell phone usage somewhat lessattractive to consumers, even though the initial fee has beendropping from as high as US$1000 ten years ago to the currentrate of US$50. This has caused cell phone manufacturers to
promote their products independently rather than bundle thecell phones with wireless services.
The cellular phone industry in China is going through thegrowth stage of the industry life cycle. As the country’s marketcontinues to grow rapidly, barriers to entry are being lowered,for the government and its people want to assure the advance-ment of the industry. Overall, the market is currently at around350 million subscribers, number one in the world. This is cur-rently only a 13.9-percent penetration rate, which is lowerthan average, as compared with all other major cell phonemarkets. This early industry life cycle stage’s strong growthpotential is what makes China such an attractive market forexpansion.
The geography and buyer power of the market, thoughinitially centered in the east, is expanding throughout China.Wealth plays a key role in the current distribution of sales,as the eastern region accounts for 53.8 percent of China’scurrent sales. However, the central region at 22.5 percent andthe western region at 23.75 percent are rapidly expanding,giving distributors opportunities to enter fresh markets overthe next decade.
Distributors. These are the sources for companies to delivertheir products throughout the market. The primary distribu-tors are the state-funded network and the larger distributornetworks throughout the Asia Pacific. A government net-work sponsored by China Mobile is a key network as itsells and distributes other brands. Another strong channel ismade up of companies like CellStar and Bright Point, whichare the world’s leading global providers of innovative, value-enhancing logistics services to the wireless communicationsindustry. Another channel outlet is the smaller, private, exclu-sive distributorship agreements, on which Motorola does notheavily depend. These partner combinations are importantfor companies that depend on them to get their products tothe ever-expanding market regions.
Wireless Service Providers. The two service providers forwireless access in the Chinese market are China Mobile,which provides 69 percent of service; and China Unicom,which provides the remaining 31 percent of service. ChinaUnited Telecommunications Company, Ltd. was formed in1994 under a government directive to break up the monopolyheld by China Mobile. In May 2002, the government orderedold China Mobile to break up into two operating entities;where China Mobile would retain the original corporate iden-tity and operate in 21 provinces and municipalities in southChina. Despite this apparent attempt by the government tostrengthen competition in the market, both have strong gov-ernment ties. These ties, and the duopoly created by thissituation, have resulted in a lack of competition that has ledto severe price imbalances for consumers. Because of theirdominant positions, it is imperative that cell phone distrib-utors form an alliance with these providers to enhance thedistribution of their products.
Retailers. The retail distribution for the cell phone is severelyfragmented but is consolidating with industry growth andexpansion. As mentioned previously, because of its dominantposition, China Mobile serves as a major distributor for cellphone technology producers. Major department stores and
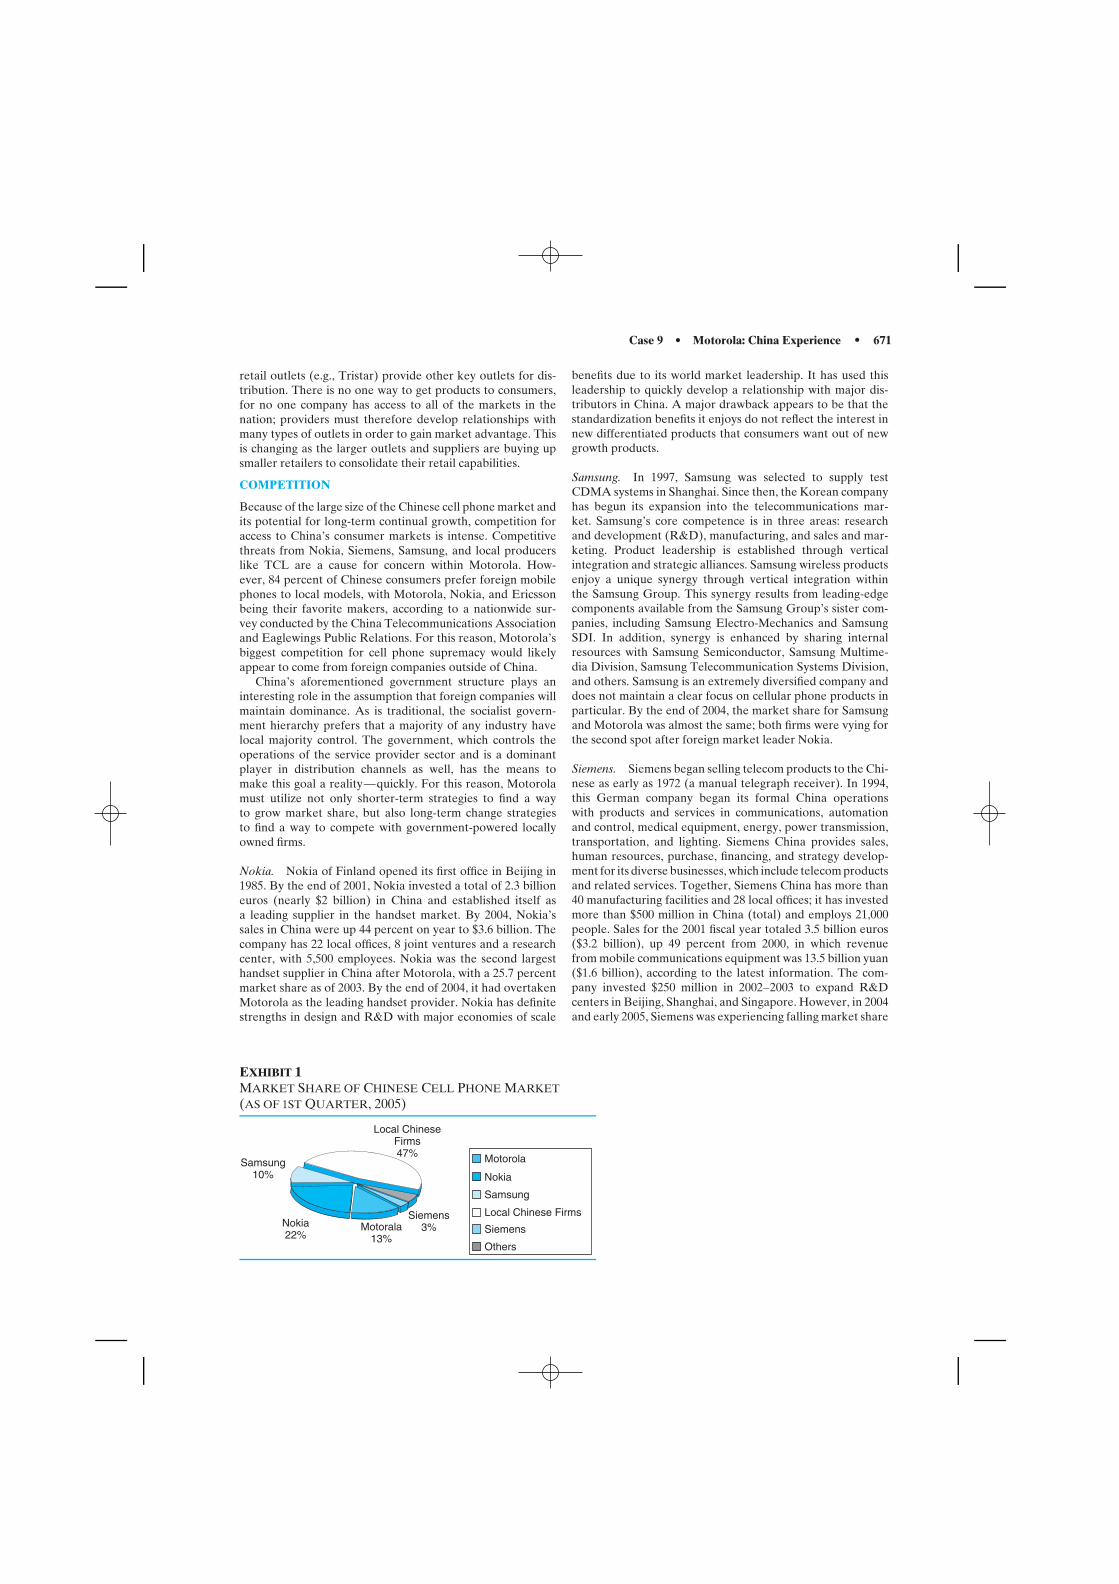
Case 9 • Motorola: China Experience • 671
retail outlets (e.g., Tristar) provide other key outlets for dis-tribution. There is no one way to get products to consumers,for no one company has access to all of the markets in thenation; providers must therefore develop relationships withmany types of outlets in order to gain market advantage. Thisis changing as the larger outlets and suppliers are buying upsmaller retailers to consolidate their retail capabilities.
COMPETITION
Because of the large size of the Chinese cell phone market andits potential for long-term continual growth, competition foraccess to China’s consumer markets is intense. Competitivethreats from Nokia, Siemens, Samsung, and local producerslike TCL are a cause for concern within Motorola. How-ever, 84 percent of Chinese consumers prefer foreign mobilephones to local models, with Motorola, Nokia, and Ericssonbeing their favorite makers, according to a nationwide sur-vey conducted by the China Telecommunications Associationand Eaglewings Public Relations. For this reason, Motorola’sbiggest competition for cell phone supremacy would likelyappear to come from foreign companies outside of China.
China’s aforementioned government structure plays aninteresting role in the assumption that foreign companies willmaintain dominance. As is traditional, the socialist govern-ment hierarchy prefers that a majority of any industry havelocal majority control. The government, which controls theoperations of the service provider sector and is a dominantplayer in distribution channels as well, has the means tomake this goal a reality—quickly. For this reason, Motorolamust utilize not only shorter-term strategies to find a wayto grow market share, but also long-term change strategiesto find a way to compete with government-powered locallyowned firms.
Nokia. Nokia of Finland opened its first office in Beijing in1985. By the end of 2001, Nokia invested a total of 2.3 billioneuros (nearly $2 billion) in China and established itself asa leading supplier in the handset market. By 2004, Nokia’ssales in China were up 44 percent on year to $3.6 billion. Thecompany has 22 local offices, 8 joint ventures and a researchcenter, with 5,500 employees. Nokia was the second largesthandset supplier in China after Motorola, with a 25.7 percentmarket share as of 2003. By the end of 2004, it had overtakenMotorola as the leading handset provider. Nokia has definitestrengths in design and R&D with major economies of scale
benefits due to its world market leadership. It has used thisleadership to quickly develop a relationship with major dis-tributors in China. A major drawback appears to be that thestandardization benefits it enjoys do not reflect the interest innew differentiated products that consumers want out of newgrowth products.
Samsung. In 1997, Samsung was selected to supply testCDMA systems in Shanghai. Since then, the Korean companyhas begun its expansion into the telecommunications mar-ket. Samsung’s core competence is in three areas: researchand development (R&D), manufacturing, and sales and mar-keting. Product leadership is established through verticalintegration and strategic alliances. Samsung wireless productsenjoy a unique synergy through vertical integration withinthe Samsung Group. This synergy results from leading-edgecomponents available from the Samsung Group’s sister com-panies, including Samsung Electro-Mechanics and SamsungSDI. In addition, synergy is enhanced by sharing internalresources with Samsung Semiconductor, Samsung Multime-dia Division, Samsung Telecommunication Systems Division,and others. Samsung is an extremely diversified company anddoes not maintain a clear focus on cellular phone products inparticular. By the end of 2004, the market share for Samsungand Motorola was almost the same; both firms were vying forthe second spot after foreign market leader Nokia.
Siemens. Siemens began selling telecom products to the Chi-nese as early as 1972 (a manual telegraph receiver). In 1994,this German company began its formal China operationswith products and services in communications, automationand control, medical equipment, energy, power transmission,transportation, and lighting. Siemens China provides sales,human resources, purchase, financing, and strategy develop-ment for its diverse businesses, which include telecom productsand related services. Together, Siemens China has more than40 manufacturing facilities and 28 local offices; it has investedmore than $500 million in China (total) and employs 21,000people. Sales for the 2001 fiscal year totaled 3.5 billion euros($3.2 billion), up 49 percent from 2000, in which revenuefrom mobile communications equipment was 13.5 billion yuan($1.6 billion), according to the latest information. The com-pany invested $250 million in 2002–2003 to expand R&Dcenters in Beijing, Shanghai, and Singapore. However, in 2004and early 2005, Siemens was experiencing falling market share
EXHIBIT 1MARKET SHARE OF CHINESE CELL PHONE MARKET(AS OF 1ST QUARTER, 2005)
Local ChineseFirms47% Motorola
Siemens3%Motorala
13%
Nokia22%
Samsung10%
Others
Siemens
Local Chinese Firms
Samsung
Nokia
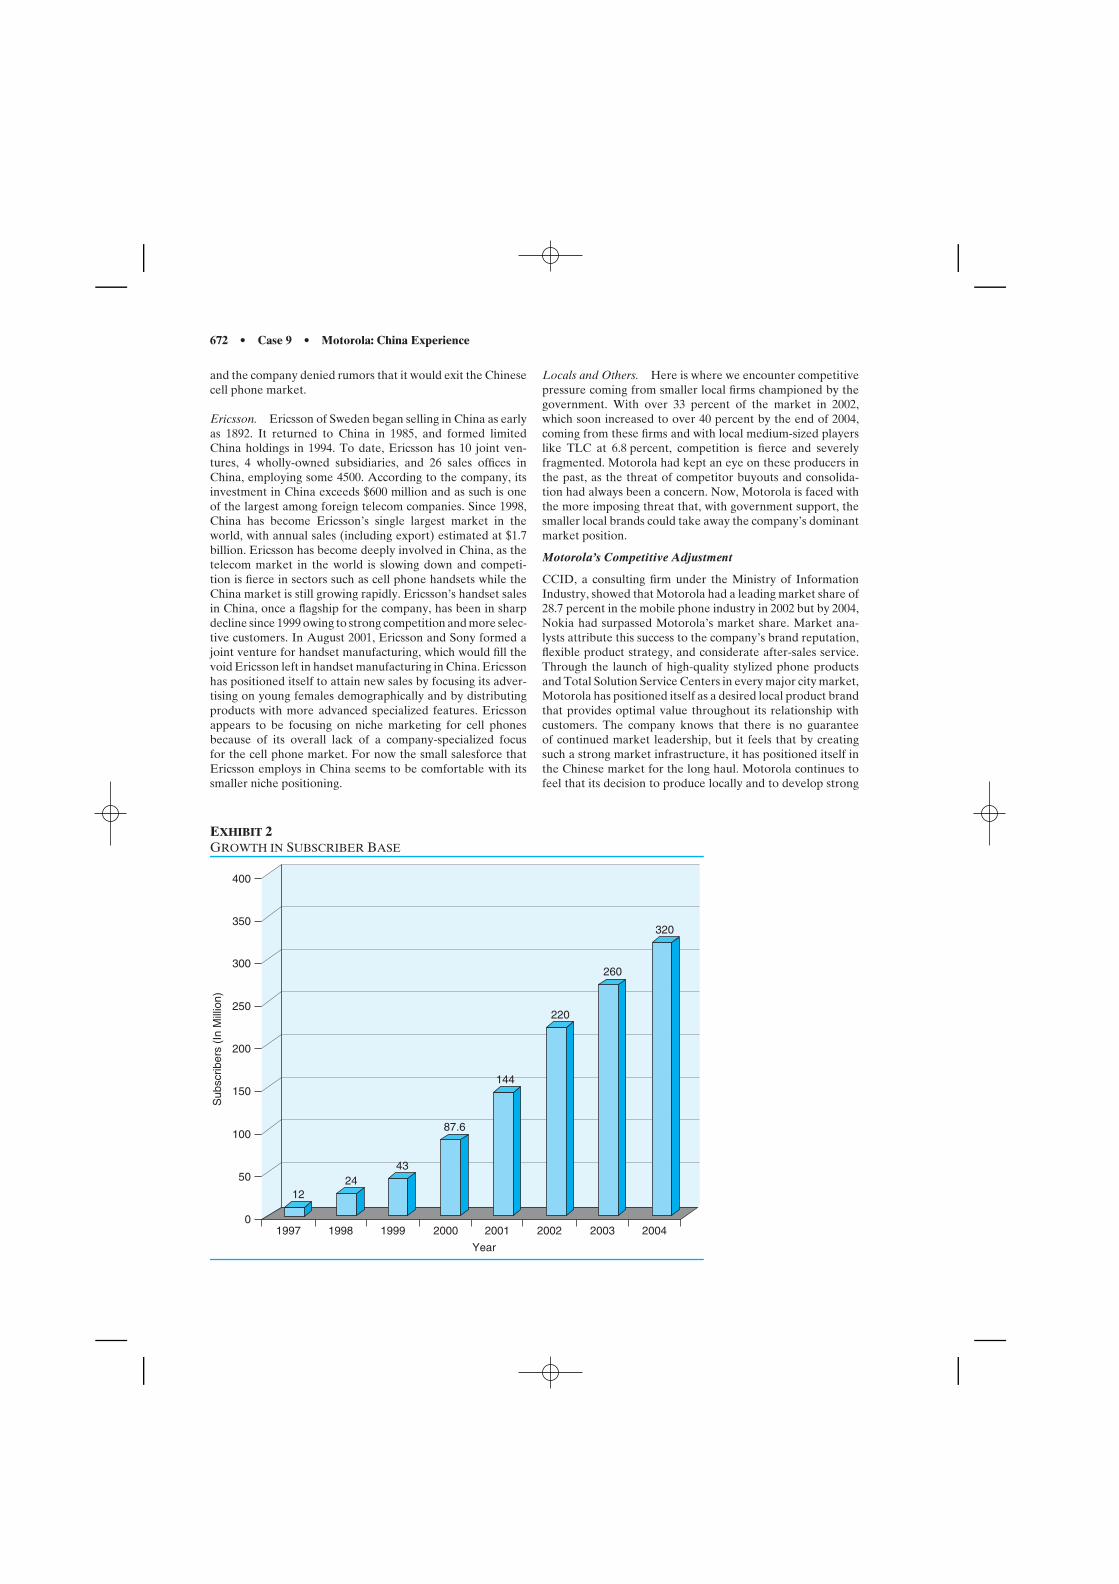
672 • Case 9 • Motorola: China Experience
and the company denied rumors that it would exit the Chinesecell phone market.
Ericsson. Ericsson of Sweden began selling in China as earlyas 1892. It returned to China in 1985, and formed limitedChina holdings in 1994. To date, Ericsson has 10 joint ven-tures, 4 wholly-owned subsidiaries, and 26 sales offices inChina, employing some 4500. According to the company, itsinvestment in China exceeds $600 million and as such is oneof the largest among foreign telecom companies. Since 1998,China has become Ericsson’s single largest market in theworld, with annual sales (including export) estimated at $1.7billion. Ericsson has become deeply involved in China, as thetelecom market in the world is slowing down and competi-tion is fierce in sectors such as cell phone handsets while theChina market is still growing rapidly. Ericsson’s handset salesin China, once a flagship for the company, has been in sharpdecline since 1999 owing to strong competition and more selec-tive customers. In August 2001, Ericsson and Sony formed ajoint venture for handset manufacturing, which would fill thevoid Ericsson left in handset manufacturing in China. Ericssonhas positioned itself to attain new sales by focusing its adver-tising on young females demographically and by distributingproducts with more advanced specialized features. Ericssonappears to be focusing on niche marketing for cell phonesbecause of its overall lack of a company-specialized focusfor the cell phone market. For now the small salesforce thatEricsson employs in China seems to be comfortable with itssmaller niche positioning.
Locals and Others. Here is where we encounter competitivepressure coming from smaller local firms championed by thegovernment. With over 33 percent of the market in 2002,which soon increased to over 40 percent by the end of 2004,coming from these firms and with local medium-sized playerslike TLC at 6.8 percent, competition is fierce and severelyfragmented. Motorola had kept an eye on these producers inthe past, as the threat of competitor buyouts and consolida-tion had always been a concern. Now, Motorola is faced withthe more imposing threat that, with government support, thesmaller local brands could take away the company’s dominantmarket position.
Motorola’s Competitive Adjustment
CCID, a consulting firm under the Ministry of InformationIndustry, showed that Motorola had a leading market share of28.7 percent in the mobile phone industry in 2002 but by 2004,Nokia had surpassed Motorola’s market share. Market ana-lysts attribute this success to the company’s brand reputation,flexible product strategy, and considerate after-sales service.Through the launch of high-quality stylized phone productsand Total Solution Service Centers in every major city market,Motorola has positioned itself as a desired local product brandthat provides optimal value throughout its relationship withcustomers. The company knows that there is no guaranteeof continued market leadership, but it feels that by creatingsuch a strong market infrastructure, it has positioned itself inthe Chinese market for the long haul. Motorola continues tofeel that its decision to produce locally and to develop strong
EXHIBIT 2GROWTH IN SUBSCRIBER BASE
01997 1998
1224
43
87.6
144
220
260
320
1999 2000 2001
Year
2002 2003 2004
50
100
200
300
400
Sub
scrib
ers
(In
Mill
ion)
150
250
350
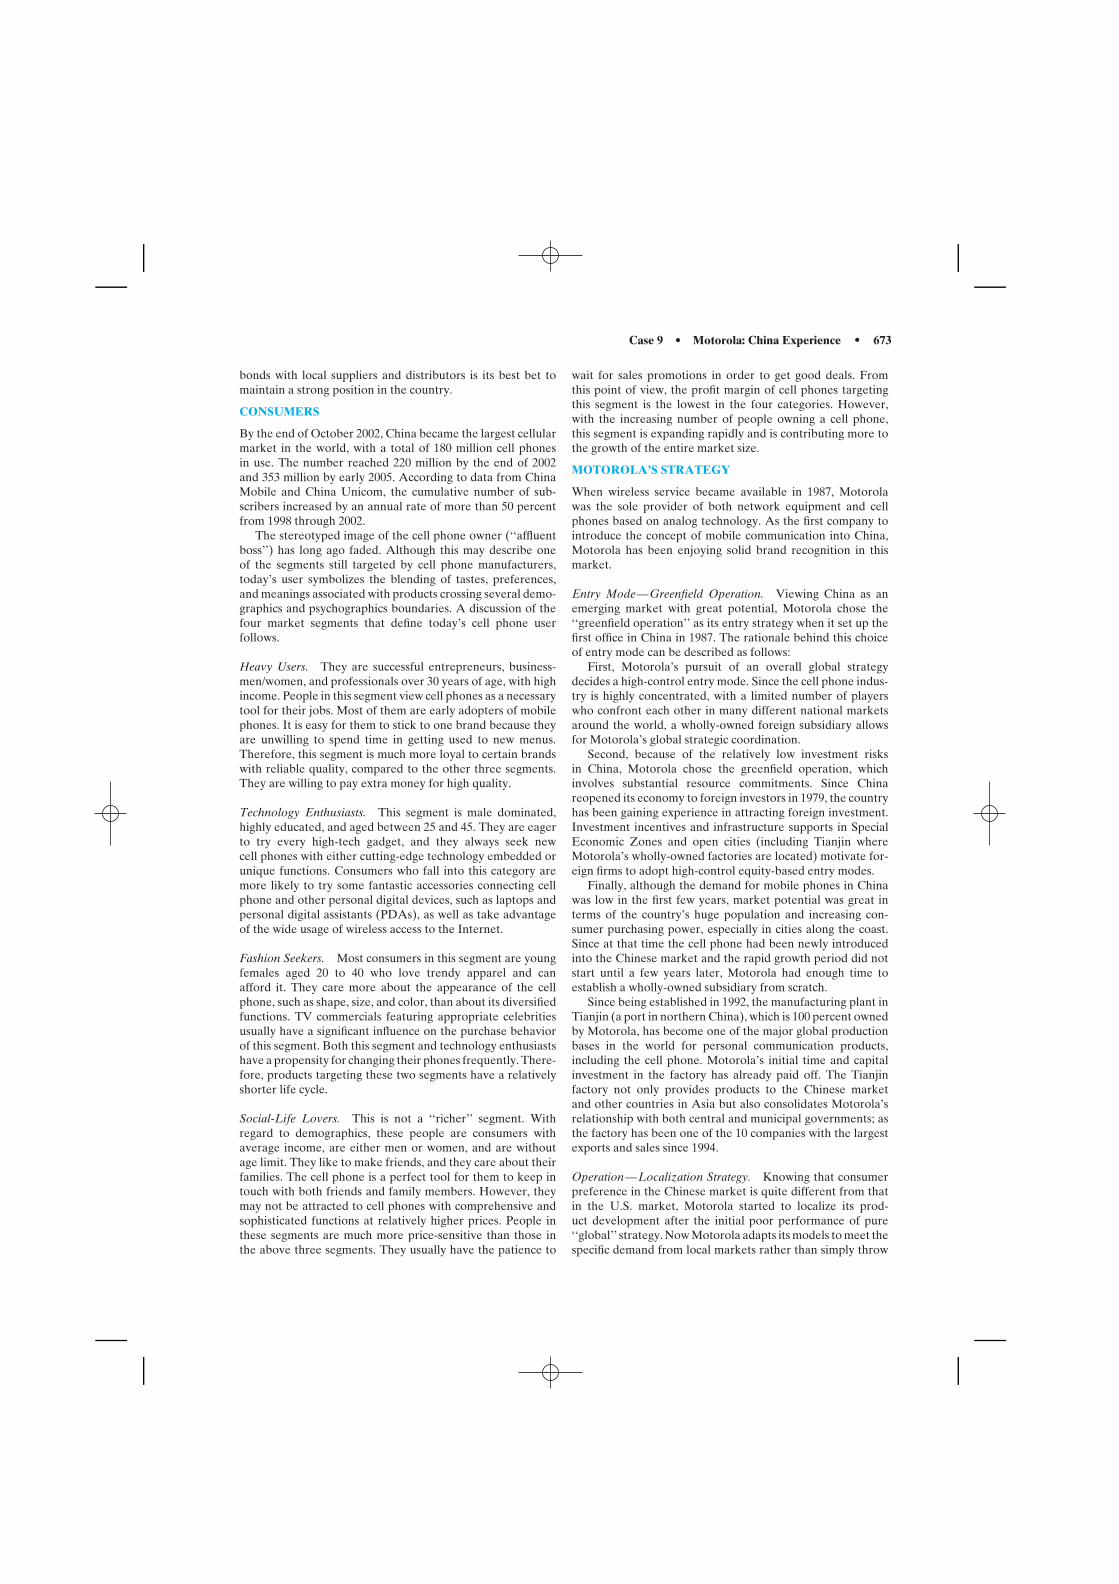
Case 9 • Motorola: China Experience • 673
bonds with local suppliers and distributors is its best bet tomaintain a strong position in the country.
CONSUMERS
By the end of October 2002, China became the largest cellularmarket in the world, with a total of 180 million cell phonesin use. The number reached 220 million by the end of 2002and 353 million by early 2005. According to data from ChinaMobile and China Unicom, the cumulative number of sub-scribers increased by an annual rate of more than 50 percentfrom 1998 through 2002.
The stereotyped image of the cell phone owner (‘‘affluentboss’’) has long ago faded. Although this may describe oneof the segments still targeted by cell phone manufacturers,today’s user symbolizes the blending of tastes, preferences,and meanings associated with products crossing several demo-graphics and psychographics boundaries. A discussion of thefour market segments that define today’s cell phone userfollows.
Heavy Users. They are successful entrepreneurs, business-men/women, and professionals over 30 years of age, with highincome. People in this segment view cell phones as a necessarytool for their jobs. Most of them are early adopters of mobilephones. It is easy for them to stick to one brand because theyare unwilling to spend time in getting used to new menus.Therefore, this segment is much more loyal to certain brandswith reliable quality, compared to the other three segments.They are willing to pay extra money for high quality.
Technology Enthusiasts. This segment is male dominated,highly educated, and aged between 25 and 45. They are eagerto try every high-tech gadget, and they always seek newcell phones with either cutting-edge technology embedded orunique functions. Consumers who fall into this category aremore likely to try some fantastic accessories connecting cellphone and other personal digital devices, such as laptops andpersonal digital assistants (PDAs), as well as take advantageof the wide usage of wireless access to the Internet.
Fashion Seekers. Most consumers in this segment are youngfemales aged 20 to 40 who love trendy apparel and canafford it. They care more about the appearance of the cellphone, such as shape, size, and color, than about its diversifiedfunctions. TV commercials featuring appropriate celebritiesusually have a significant influence on the purchase behaviorof this segment. Both this segment and technology enthusiastshave a propensity for changing their phones frequently. There-fore, products targeting these two segments have a relativelyshorter life cycle.
Social-Life Lovers. This is not a ‘‘richer’’ segment. Withregard to demographics, these people are consumers withaverage income, are either men or women, and are withoutage limit. They like to make friends, and they care about theirfamilies. The cell phone is a perfect tool for them to keep intouch with both friends and family members. However, theymay not be attracted to cell phones with comprehensive andsophisticated functions at relatively higher prices. People inthese segments are much more price-sensitive than those inthe above three segments. They usually have the patience to
wait for sales promotions in order to get good deals. Fromthis point of view, the profit margin of cell phones targetingthis segment is the lowest in the four categories. However,with the increasing number of people owning a cell phone,this segment is expanding rapidly and is contributing more tothe growth of the entire market size.
MOTOROLA’S STRATEGY
When wireless service became available in 1987, Motorolawas the sole provider of both network equipment and cellphones based on analog technology. As the first company tointroduce the concept of mobile communication into China,Motorola has been enjoying solid brand recognition in thismarket.
Entry Mode—Greenfield Operation. Viewing China as anemerging market with great potential, Motorola chose the‘‘greenfield operation’’ as its entry strategy when it set up thefirst office in China in 1987. The rationale behind this choiceof entry mode can be described as follows:
First, Motorola’s pursuit of an overall global strategydecides a high-control entry mode. Since the cell phone indus-try is highly concentrated, with a limited number of playerswho confront each other in many different national marketsaround the world, a wholly-owned foreign subsidiary allowsfor Motorola’s global strategic coordination.
Second, because of the relatively low investment risksin China, Motorola chose the greenfield operation, whichinvolves substantial resource commitments. Since Chinareopened its economy to foreign investors in 1979, the countryhas been gaining experience in attracting foreign investment.Investment incentives and infrastructure supports in SpecialEconomic Zones and open cities (including Tianjin whereMotorola’s wholly-owned factories are located) motivate for-eign firms to adopt high-control equity-based entry modes.
Finally, although the demand for mobile phones in Chinawas low in the first few years, market potential was great interms of the country’s huge population and increasing con-sumer purchasing power, especially in cities along the coast.Since at that time the cell phone had been newly introducedinto the Chinese market and the rapid growth period did notstart until a few years later, Motorola had enough time toestablish a wholly-owned subsidiary from scratch.
Since being established in 1992, the manufacturing plant inTianjin (a port in northern China), which is 100 percent ownedby Motorola, has become one of the major global productionbases in the world for personal communication products,including the cell phone. Motorola’s initial time and capitalinvestment in the factory has already paid off. The Tianjinfactory not only provides products to the Chinese marketand other countries in Asia but also consolidates Motorola’srelationship with both central and municipal governments; asthe factory has been one of the 10 companies with the largestexports and sales since 1994.
Operation—Localization Strategy. Knowing that consumerpreference in the Chinese market is quite different from thatin the U.S. market, Motorola started to localize its prod-uct development after the initial poor performance of pure‘‘global’’ strategy. Now Motorola adapts its models to meet thespecific demand from local markets rather than simply throw
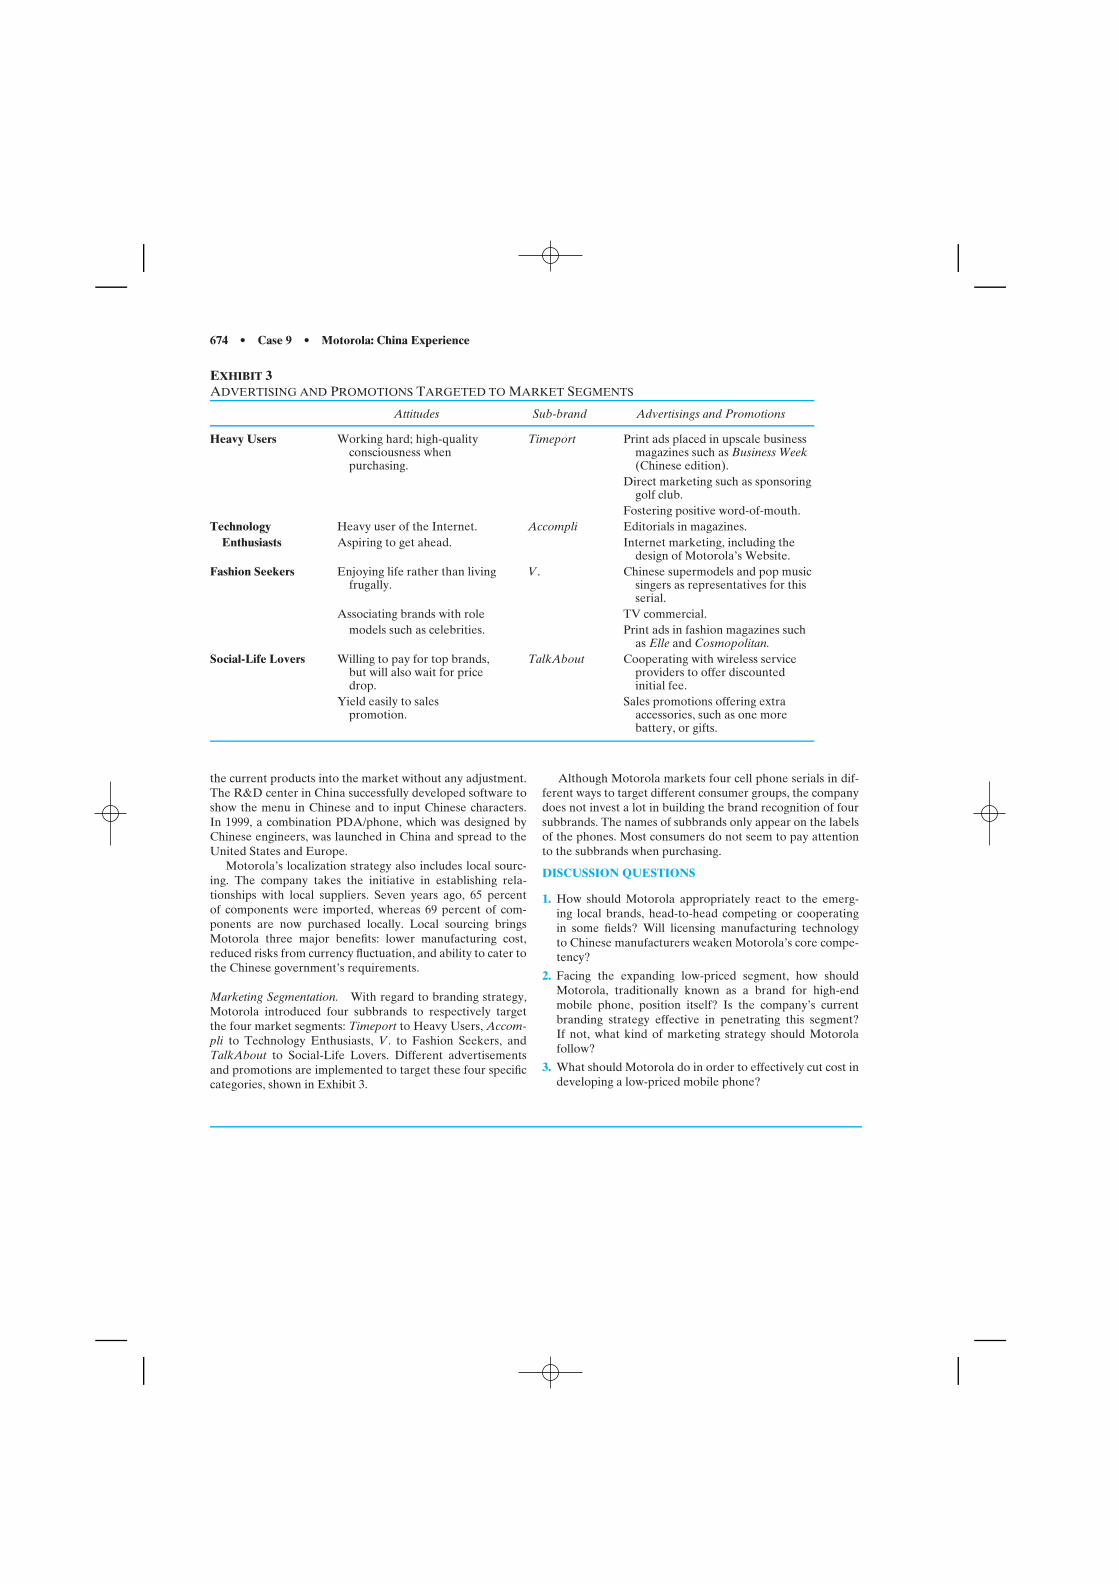
674 • Case 9 • Motorola: China Experience
EXHIBIT 3ADVERTISING AND PROMOTIONS TARGETED TO MARKET SEGMENTS
Attitudes Sub-brand Advertisings and Promotions
Heavy Users Working hard; high-qualityconsciousness whenpurchasing.
Timeport Print ads placed in upscale businessmagazines such as Business Week(Chinese edition).
Direct marketing such as sponsoringgolf club.
Fostering positive word-of-mouth.Technology Heavy user of the Internet. Accompli Editorials in magazines.
Enthusiasts Aspiring to get ahead. Internet marketing, including thedesign of Motorola’s Website.
Fashion Seekers Enjoying life rather than livingfrugally.
V. Chinese supermodels and pop musicsingers as representatives for thisserial.
Associating brands with role TV commercial.models such as celebrities. Print ads in fashion magazines such
as Elle and Cosmopolitan.Social-Life Lovers Willing to pay for top brands,
but will also wait for pricedrop.
TalkAbout Cooperating with wireless serviceproviders to offer discountedinitial fee.
Yield easily to salespromotion.
Sales promotions offering extraaccessories, such as one morebattery, or gifts.
the current products into the market without any adjustment.The R&D center in China successfully developed software toshow the menu in Chinese and to input Chinese characters.In 1999, a combination PDA/phone, which was designed byChinese engineers, was launched in China and spread to theUnited States and Europe.
Motorola’s localization strategy also includes local sourc-ing. The company takes the initiative in establishing rela-tionships with local suppliers. Seven years ago, 65 percentof components were imported, whereas 69 percent of com-ponents are now purchased locally. Local sourcing bringsMotorola three major benefits: lower manufacturing cost,reduced risks from currency fluctuation, and ability to cater tothe Chinese government’s requirements.
Marketing Segmentation. With regard to branding strategy,Motorola introduced four subbrands to respectively targetthe four market segments: Timeport to Heavy Users, Accom-pli to Technology Enthusiasts, V. to Fashion Seekers, andTalkAbout to Social-Life Lovers. Different advertisementsand promotions are implemented to target these four specificcategories, shown in Exhibit 3.
Although Motorola markets four cell phone serials in dif-ferent ways to target different consumer groups, the companydoes not invest a lot in building the brand recognition of foursubbrands. The names of subbrands only appear on the labelsof the phones. Most consumers do not seem to pay attentionto the subbrands when purchasing.
DISCUSSION QUESTIONS
1. How should Motorola appropriately react to the emerg-ing local brands, head-to-head competing or cooperatingin some fields? Will licensing manufacturing technologyto Chinese manufacturers weaken Motorola’s core compe-tency?
2. Facing the expanding low-priced segment, how shouldMotorola, traditionally known as a brand for high-endmobile phone, position itself? Is the company’s currentbranding strategy effective in penetrating this segment?If not, what kind of marketing strategy should Motorolafollow?
3. What should Motorola do in order to effectively cut cost indeveloping a low-priced mobile phone?
Case 10 • iPod in Japan Can Apple Sustain Japan’s iPod Craze? • 675
� � � � � � � � � � � � � � � � � � � � � � � � � � � � � � �
CASE 10
iPOD IN JAPAN CAN APPLE SUSTAIN JAPAN’S iPOD CRAZE?
INTRODUCTION
On January 12, 2005, Apple Computer, Inc. announced rev-enue of $3.49 billion and a net profit of $295 million for itsfiscal first quarter that ended December 25, 2004. This was thehighest quarterly revenue and net income in Apple’s history.
These were surprising and serendipitous results for Applegiven that as late as 2002, critics wondered if Apple could turnwaning market share and losses back around again. From itsApple IIe glory days of the 1980s to its crippling loss of PCmarket share in the 1990’s, Apple has certainly experiencedits share of ups and downs.
Enter iPod.During the last quarter of 2004, while Mac unit growth rose
26 percent, iPod experienced 525 percent unit growth. Duringthe same quarter, Apple shipped out over 4.5 million iPods.As of Apple’s press conference in January 2005, Apple hadsold over 10 million iPods. iPod has single-handedly revital-ized Apple’s business, totaling $1.21 billion in sales, or a thirdof its total revenue, in the first quarter of 2005.
Apple has completely reversed its fate and revived itsglobal brand equity with the introduction and smashing suc-cess of its iPod family of products, namely iPod and iPod mini,but not excluding iPod Shuffle, iPod Photo, and a myriad ofiPod accessories. In the process, Apple has taken the musicelectronics industry by surprise by creating a stylish standardin music players that speaks to the savvy music consumers whodesire to make a fashion statement while digitally organizingtheir tunes.
In Japan, iPod has enjoyed record sales and its ‘‘halo effect’’has even boosted revenues on other Apple products, such asiMacs and iBooks. With its small, cute shape and trendy col-ors, the iPod mini has rocked the portable music player scenewith an average of 5,000 visitors to Apple’s Tokyo Ginza storeeach day. Apple’s global brand equity has skyrocketed, asiPod has become a high-end fashion statement able to holdits own with the likes of Prada, Coach, and Louis Vuitton.More importantly, iPod has become the product that definesthe digital music player.
Apple currently sits atop the peak of its iPod success inboth the U.S. and Japan. But in the fast-moving industry ofelectronic gadgets, can Apple sustain its success? Next gener-ation, music-minded cell phones, new MP3 players, and othermultimedia devices, such as the Sony PSP, are hot on iPod’strail. Can Apple keep the lead? More importantly, is the suc-cess of iPod and iPod mini in Japan just a fad? Is the iPodcraze in Japan sustainable?
Laura Samartin, Heather Vespestad, and Tony Wu from the Japan-focusedMBA Program at University of Hawaii at Manoa prepared this case underthe supervision of Professor Masaaki Kotabe, solely as the basis for classdiscussion (2005). The case is not intended to serve as endorsement, sourcesof primary data, or illustration of effective or ineffective management.
HISTORY OF APPLE
The United States
Like the legend of Microsoft, most people are familiar with thestory of the founding of Apple Computer. High school buddiesSteve Wozniak and the now infamous Steve Jobs sparked thepersonal computer revolution in 1976 that would later usherin formidable competitors, like IBM and Bill Gates. By themid-1980s, Apple had 20 percent of the PC market share inthe U.S. But while Apple and Jobs refused to allow Apple-compatible computers, IBM(PC)-compatibles and MicrosoftOS flooded the ever-expanding PC market and gobbled up 75percent of Apple’s market share throughout the 1990s. By theend of the decade, Apple had a mere 5 percent of the total PCmarket share.
In 1998, after a brief hiatus, Jobs returned to Apple andfocused on a new generation of Macintosh and creating the‘‘i’’ concept. The fruits of Jobs’ labor brought Apple backon the map when the trendy design and technological easeof the iMac and iBook won consumers over both at homeand abroad. The rebound was temporary, however, as Appleexperienced slow sales in 2000, both due to an industry-wideslowdown, as well as the unexpected failure of the iCube,Apple’s latest hardware innovation at the time.
In 2001, Apple opened its first retail store in the UnitedStates and soon stores popped up all over the country.Although Apple released new versions of iMac and iBookin 2002, sales still remained stagnant and limited to existingApple users. It was not until the recent iPod craze that Applewas able to explore uncharted markets and reach a broaderrange of customers on a different common ground—music.Once again, Apple miraculously skirted defeat with this boldmaneuver.
Japan
Due to its domestic success in the late 1970s, Apple wasinterested in expanding its sales of the Apple IIe to inter-national markets, notably Europe and Japan. Apple enteredthe Japanese market through an arrangement with a Japanesedistributor who was an acquaintance of Steve Jobs. Due toinadequate distribution of non-localized Apple products atextremely high prices, few Japanese consumers had access toor could afford Apple’s products. A high level of corporatearrogance also contaminated Apple’s entry in Japan. As aresult, Apple’s first attempt to enter Japan’s market failedmiserably and was even used by the U.S. Department ofCommerce as a case study to illustrate how not to enter theJapanese market.
By the 1980s, however, Apple committed to its presencein Japan and stepped up its efforts to localize its productswith Apple Technologies, a joint R&D operation with AppleJapan. The distributor network was also expanded and Applemade considerable efforts to develop brand awareness. By1999, largely due to the success of the new iMac and iBookin Japan, Apple was able to capture 23 percent of overall
676 • Case 10 • iPod in Japan Can Apple Sustain Japan’s iPod Craze?
PC market share in Japan. Furthermore, 9 out of the top tendesktop sales were Apple computers and 3 out of the topten laptop sales were Apple laptops. Apple did not open itsfirst retail outlet in Japan until it unveiled the iPod mini at itsGinza store in 2003.
iPOD MANIA
Domestic craze
In 2001, Apple introduced a departure from its PC productsthat ventured into the music industry: iPod. The largest hard-drive music player in the U.S. at the time, the first iPod had a5 GB hard drive and sold for $399. It was an instant hit in themarketplace, especially with loyal Apple users. In July 2002,Apple introduced Windows-compatible software for the iPodand its market immediately multiplied ten-fold. By that time, athird-generation 20 GB iPod had been revealed for $499, andthe previous generations were discounted by $100. New pro-motional campaigns, including iPod’s trademark commercialfeaturing dancing silhouettes with white earbuds, transformedthe need for a digital music storage device into a genuine desirefor a trendy, fashionable portable music player. In April 2003,iTunes Music Store (iTMS), Apple’s online (and legal) musicdownload site, was opened. Since then, Apple has sold morethan 300 million song downloads through iTunes Music Store.
By the time iPod mini was introduced in January 2004,iPod and iPod accessories were already all the rage. The 4 GB‘‘mini’’ iPod came in eye-catching, metallic colors of silver,blue, pink, green, and gold and was smaller than most cellphones in the U.S. Selling for only $249, it was also a muchmore economical purchase than its big brother, though mostiPod-addicted users scoffed at the small memory size. Thesecond generation of iPod mini, which debuted in February2005, sells for the same price, but has a 6 GB capacity; 2 GBmore than its first generation predecessor (which now sells for$199). Again, the iPod mini helped Apple access a broaderrange of customers in terms of budgets and tastes.
By 2004, iPods and iPod minis held a virtual monopoly inmass-storage music players, capturing 87 percent of the HDDmusic player market in the U.S.
To date, iPod and iTunes are improving Apple’s brandrecognition at home and abroad, as well as its overall positionin the home computing market. According to financial servicesfirm Piper Jaffray & Co., 6 percent of Windows users in theU.S. who own iPods have switched to iMacs, and 7 percentmore plan to make the switch.
Not so ‘‘mini’’ success in Japan
Approximately 1,500 people in Tokyo, and over 2,500 peoplein Osaka lined up outside the Apple Store in Japan on August28, 2004, the release date of the iPod mini. Demand for themini has far surpassed its supply, with some customers waitingup to six weeks for their iPod mini.
Some have described the iPod mini as an ideal productfor the Japanese market. ‘‘It is a product that does somethinguseful, does it really well, and looks terrific too.’’ Its slickdesign, limited-supply marketing, carefully designed stores,and its award-winning advertising campaign are the reasonsbehind iPod mini’s incredible success in Japan.
Apple has launched a marketing campaign in Japan withcatchy TV ads and billboards painted on Tokyo trains. Apple’s
award-winning TV ads feature silhouettes dancing to up beatmusic; music that has caught just as much attention in Japanas iPod mini itself; music that has prompted many consumersto ask just who are those artists. Before and after the grandopening of Apple’s store in Tokyo, poster ads could be seenplastered all over train stations, train tunnels, and the actualstructure of the trains. In Tokyo, the Yamanote Line trainbecame a giant iPod bee-bopping around the busy heart ofthe metropolis.
JAPAN’S APPLE STORES
A major part of iPod’s success in Japan is its Apple Stores.The Ginza store, Apple’s first retail location outside of the US,is situated near such high-end stores as Louis Vuitton, Coach,and Chanel, a location that is very different from the tradi-tional electronics center in Akihabara. Placing its stores in thehigh profile retail locations of Japan is a part of Apple’s newcampaign toward the young and the trendy. Apple’s secondJapanese store is located in Osaka’s fashionable Shinsaibashiarea, its new London store is on Regent Street, and its NewYork store is in the trendy SoHo district. At its grand openingin 2003, the Ginza store attracted a long line of over 5,000people that wound around the glittery stores and streets of theGinza district with the end of the line located several blocksfrom the actual store. The Ginza store made 100 million yenin sales in its first week of business, and is currently averaging5,000 visitors per weekday. Apple opened a third store inNagoya this year and industry sources claim that Apple plansto open 27 more stores in Japan in areas such as Shibuya(western Tokyo), Kyoto and Umeda (Osaka).
Steve Cano, regional director for Apple Japan retail andmanager of the Ginza store, often visits the neighboring shopsto benchmark the Apple Store and its customer service. ‘‘I likethe (Apple) employees and how friendly and approachablethey are,’’ he boasts. ‘‘We don’t benchmark against computerretailers, we benchmark against service leaders.’’
Key to Apple Store’s success is ongoing promotional activ-ity held at its Japan stores. The program includes weekly,evening performances by artists from local labels, and elec-tronic musicians demonstrating how they use Macs to creategroovy music. Another crucial component is the popular‘‘Genius Bar,’’ located on the first floor of the Ginza and Shin-saibashi Apple Stores. The Genius Bar offers open forums thatprovide Mac and iPod operating techniques and purchasingadvice from the Apple staff directly to customers completelyfree of charge. The Genius Bar has proven to be a great suc-cess. Many Mac fans wait hours to use the Genius Bar whilesome even go so far as to make appointments for the servicesat Apple’s Japanese web site ahead of time in order to avoidthe wait.
iPOD MINI SOARS, iPOD DOMINATES IN JAPAN
At the release of the iPod mini in 2003, the iPod family’sshare of the hard drive based music player market was over72 percent. Independent reports also revealed that six of theeight top selling music players in the overall Japanese marketwere iPods. Buyers of the new iPod mini are not limited tothe traditionally gadget-obsessed Japanese male with a loveof music. Its customer base ranges from teenagers to busi-nessmen in their 50s, and surprisingly, female customers. TheiPod mini comes in five stylish colors, pink, green, blue, silver,
Case 10 • iPod in Japan Can Apple Sustain Japan’s iPod Craze? • 677
and gold, and is clad in sleek aluminum casing. The new casecolor and material transformed the digital music player into afashion accessory for the Japanese consumer. Famous brands,such as Fendi and Coach, are already offering iPod mini carry-ing cases at couture prices. The iPod’s white earbuds are alsocatching on as a fashion statement. Other MP3 player brandsand mobile phone manufacturers have already caught windof the trend, coming up with their own copy of the signaturewhite earbuds.
COMPETITIVE ENVIRONMENT
iPod’s direct competitors include the Sony Network Walk-mans, the SONICblue Rio digital players, and iRiver digitalplayers. Sony, with its dominance in the walkman businessand reputation in Japan, is iPod’s biggest competitor despiteits late mover disadvantage for portable digital players. Sony’slate entrance was further doomed after Sony only offered pro-prietary Atrac3 software instead of the popular mp3 format.Initially, Sony Music, which also owns Columbia Music, triedto discourage Sony from promoting the Network Walkman, aproduct that seemed to condone and encourage illegal down-loading. In the fiscal year ending March 31, 2005, Sony experi-enced a 30 percent decrease in its forecasted operating profits.
Both iRiver and Rio offer similar products to the iPodline at a competitive price. Some of the variations of theseproducts are listed in Exhibit 1 below. Currently, iPod holdsover 50 percent of the market share.
DOWNLOADING SITES
The same companies competing for electronics sales are alsocompeting for digital music sales of downloaded songs to theirplayers.
iTunes Music Store is the online music downloading storeApple officially unveiled in 2003 to complement its successfuliPod family of products. iTunes is predicted to reach 2 millionunits sold by this summer, and is scheduled to launch in Japan
this spring. iTunes currently charges $.99 per downloadedsong.
Sony Connect, like its Network Walkman, is struggling asit utilizes only its proprietary Atra3 software. The prices arecompetitive, but higher than iTunes at around $2.00 or 250yen per song.
Yahoo Music Unlimited is predicted to blow both Appleand Sony away with their new subscription service. For only$6.99 a month, subscribers can download unlimited music(although some newer songs may cost extra). Currently,Yahoo Music Unlimited in Japan offers downloads rangingfrom 150 yen to 360 yen depending on the song. It has yet to beannounced whether they plan to offer the same subscriptionservice in Japan in the future.
There are several illegal file-sharing websites that Japanesedigital music aficionados use to obtain transfer free tunes ontotheir mp3 players. Winny and WinMX are examples of twosites used in Japan. Furthermore, Japan’s video rental storesalso rent the latest Japanese and American pop music CDsto store customers, which are then usually copied by therenting customer. These methods of obtaining free music ina seemingly ‘‘legal’’ way in Japan are obstacles to the fur-ther expansion and popularity of iTunes and other such sitesrecognized as ‘‘legal’’ downloading sites.
NEXT GENERATION CELL PHONE THREATENSIPOD DOMINANCE
All portable mp3 players, including iPod, are going to facechallenges as new, integrated gadgets and next-generation cellphones are released in the next few years. Items like Sony’sPSP player have video, game and music capabilities.
But industry big wigs like Bill Gates predict that musicplayers integrated with cell phones are going to be the down-fall of iPod and its mp3 competitors. Approximately 1.4 billionpeople in the world already own cell phones, which translatesto a huge, borderless distribution channel.
EXHIBIT 1
512 MB∼1.5 GB 2 GB∼6 GB 3 GB∼20 GB ABOVE 20 GB
IPOD SHUFFLE IPOD MINI IPOD IPOD PHOTO1 GB 4–6 GB 20 GB 60 GB$99–$149 $199–$249 $299 $349+Sony SonyNW-E105PS NW-HD3512 MB 20 GB$99.95 $299.95
Iriver IRiver iRiveriFP-899 H10 H101 GB 5–6 GB 20 GB$189.99 $249.99–$299.99 $399.99
SONICblue SONICblue SONICblueRio Nitrus Rio Carbon Rio Karma1.5 GB 5 GB 20 GB$169.99 $199.99 $220.00
678 • Case 11 • NTT DoCoMo: Can i-Mode go Global?
Currently, phones with mp3 functions are still in the testingphase, but insiders say that the next generation of digital musicplayer hybrid phones could be out by 2008. Apple is awareof the trend and trying to capitalize on iPod popularity byteaming up with Motorola to develop an iPod phone. How-ever, Verizon Wireless and Sprint, as well as many Japanesecarriers, are not willing to carry the phone. As Graeme Fer-guson, director for global content development at VodafoneGroup PLC, points out, ‘‘It’s hard for people in any industry tosupport something that cuts them out of potential future rev-enue streams.’’ This may prove to be a major obstacle to thesuccess of an iPod phone. Especially in a cell phone saturatedmarket such as Japan, iPod will have to work even harder tokeep its dominance in the future digital music player market.KDDI and NNT DoCoMo are both working on developingphones that have hardware capable of significant music filestorage. In addition, many phones in Japan can now downloadentire songs, as opposed to the traditional ‘‘chaku melo’’ thatcontained only the first 30 seconds of a song.
FUTURE OF IPOD IN JAPAN
While iPod is selling by the millions, Apple’s global PC mar-ket share actually shrank to less than 2 percent (1.87) in 2004,largely due to large global competitors like Dell (18 per-cent) and HP (16 percent). Apple has become increasinglydependent on iPod’s continuing success both in the U.S. andabroad.
Although iPod and iPod mini are currently dominatingJapan’s music player market, it remains to be seen whetherthis ‘‘little white hope’’ can sustain its popularity continue tohave a true ‘‘halo effect’’ in Japan. While iPod has become thestandard for digital music players in Japan, it could prove tobe just another fleeting, consumer fad. Particularly troublingis the uncertainty of iTunes in Japan as well as the forebodingpossibility of high-tech music-enhanced cell phones that couldrender the iPod obsolete in the Japanese market.
One of the main reasons Apple has been successful inJapan is its ability to constantly evaluate its products from theJapanese consumer point-of-view and continuously launchnew and improved versions of its products while keepinga half step ahead of the trend as well as its competition.Clearly, Apple must continue to do just this in order to pro-long its iPod honeymoon. Ultimately, whether or not iPodcan sustain its success in Japan and keep Japan as a majorprofit center for Apple is as unpredictable as the iPod crazeitself.
QUESTIONS
1. How has iPod’s marketing strategy played a key role in itssuccess in Japan?
2. Is iPod’s distribution channel strategy effective?
3. What challenges will the integrated cell phone/mp3 playerpresent for iPod?
� � � � � � � � � � � � � � � � � � � � � � � � � � � � � � �
CASE 11
NTT DOCOMO: CAN I-MODE GO GLOBAL?
INTRODUCTION
What’s next for i-mode? After its huge success with i-mode inJapan, DoCoMo tried to bring the i-mode model to the U.S.and European markets, but could not succeed. Although ithas over a quarter of the Japanese population as subscribers,it is once again facing tough price competition in the domesticmarket. Recently, it has formed new alliances with cell phonecompanies in the U.S. and Europe. Can it succeed this time?
In May 2005, NTT DoCoMo announced that its annual netprofit in FY2004 rose 15 percent year-on-year to 747.56 billionyen resulting from sales of its stake in AT&T Wireless, whilerevenue fell 4 percent year-on-year. This implies that the mainbusiness operation of the company is at risk and net profitreported in FY2004 is non-recurring and not sustainable.Some critics think DoCoMo is too technology-oriented andallows too much time for new services to become profitable.In 2005, DoCoMo unveiled a number of discounts, includingfamily plans and flat-rate data communications charge for 3G
Amornrat Cheevavichawalkul, Christina Okumura, and Amit Kanaskarof the University of Hawaii at Manoa prepared this case under the super-vision of Professor Masaaki Kotabe, solely as the basis for class discussion.The case is not intended to serve as endorsement, sources of primary data,or illustration of effective or ineffective management (2005).
services in order to maintain a customer base. This resultedin a reduction in profit margin. Also, it was revealed thatearnings will drop 33 percent due to increased competition.Moreover, the Japanese government plans to grant licensesfor mobile networks to at least two new companies in 2005and will introduce a rule in 2006 that will make it easier forusers to switch service providers. The company has also facedadditional risk factors such as measures to open up Internetplatforms and segment platform functions such as authenti-cation and payment collection where dominant carriers areassumed to have market power. These factors also includerules that require it to open i-mode service to all contentproviders and Internet service providers. All these factorsindicate that DoCoMo has to rethink its strategy for globalexpansion of i-mode and 3G services.
COMPANY OVERVIEW
In the late 1980s, after much pressure from the Ministry ofInternational Trade and Industry (MITI) and U.S. govern-ment, Japan reformed its telecom regulatory structure to allowthe entry of foreign players into Japan’s market. Until then,Nippon Telegraph and Telephone (NTT) ran a monopoly inthe telecom sector. In order to reduce its monopoly power, inJuly 1992, NTT’s mobile communications business was spun-off to create NTT Mobile Communications Network Inc. The
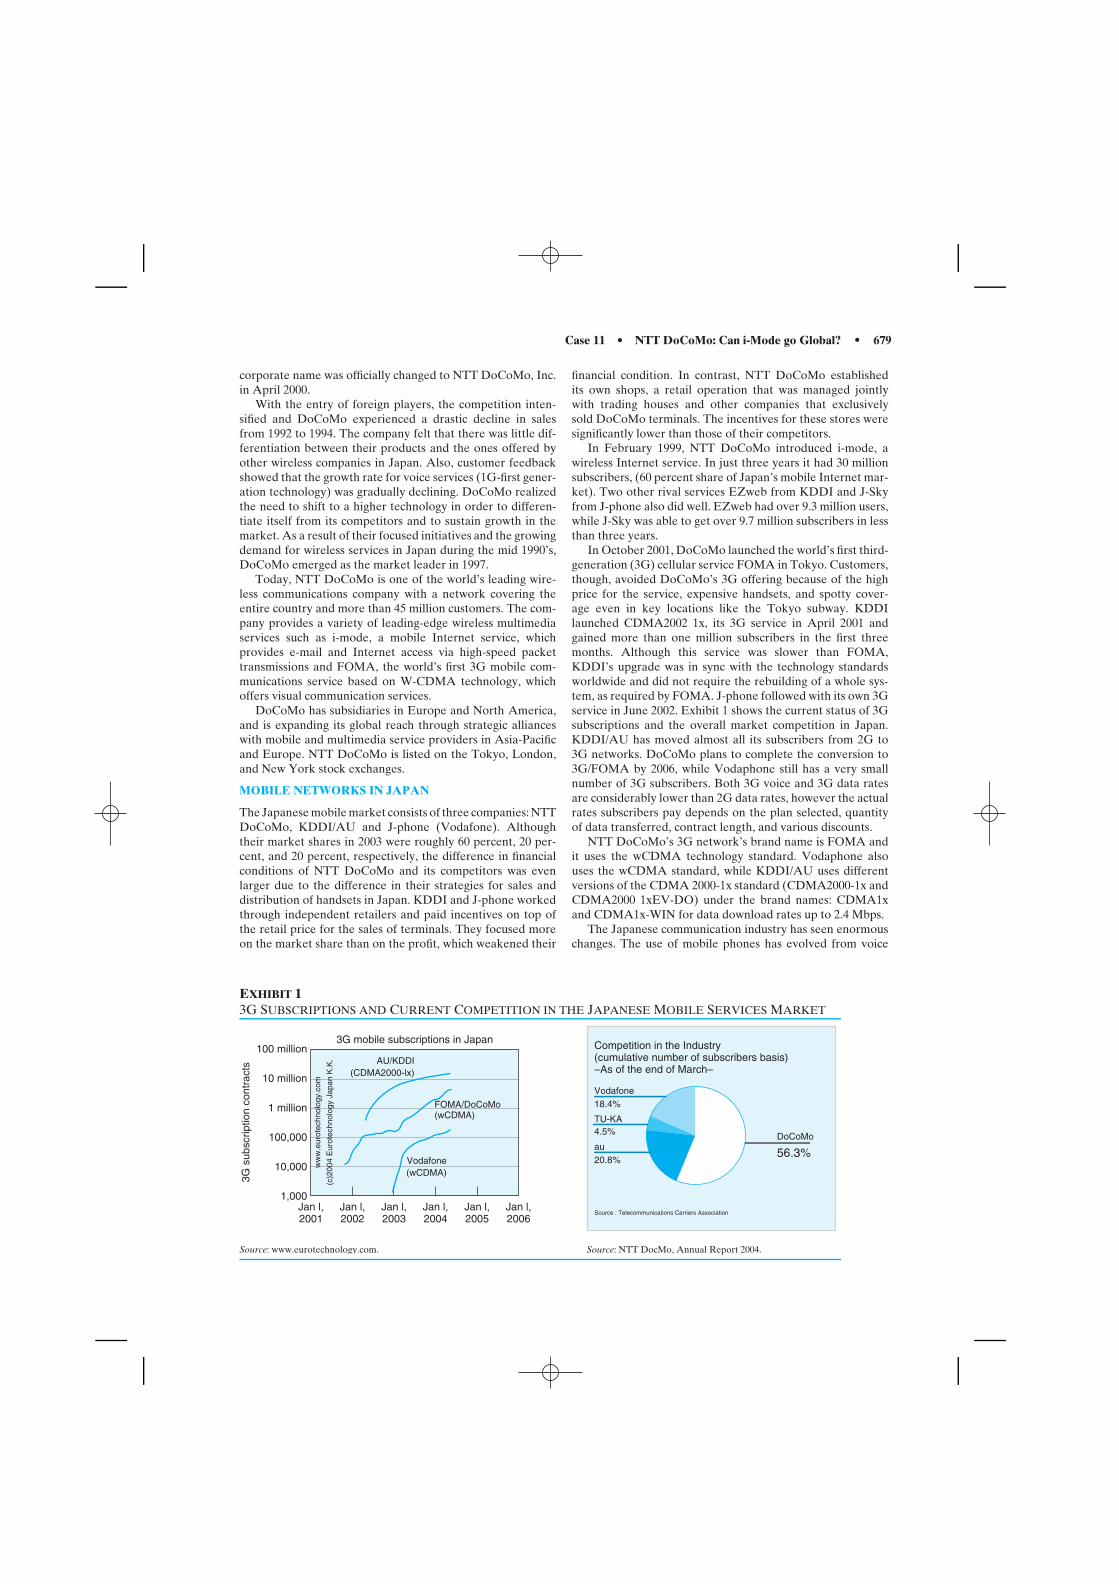
Case 11 • NTT DoCoMo: Can i-Mode go Global? • 679
corporate name was officially changed to NTT DoCoMo, Inc.in April 2000.
With the entry of foreign players, the competition inten-sified and DoCoMo experienced a drastic decline in salesfrom 1992 to 1994. The company felt that there was little dif-ferentiation between their products and the ones offered byother wireless companies in Japan. Also, customer feedbackshowed that the growth rate for voice services (1G-first gener-ation technology) was gradually declining. DoCoMo realizedthe need to shift to a higher technology in order to differen-tiate itself from its competitors and to sustain growth in themarket. As a result of their focused initiatives and the growingdemand for wireless services in Japan during the mid 1990’s,DoCoMo emerged as the market leader in 1997.
Today, NTT DoCoMo is one of the world’s leading wire-less communications company with a network covering theentire country and more than 45 million customers. The com-pany provides a variety of leading-edge wireless multimediaservices such as i-mode, a mobile Internet service, whichprovides e-mail and Internet access via high-speed packettransmissions and FOMA, the world’s first 3G mobile com-munications service based on W-CDMA technology, whichoffers visual communication services.
DoCoMo has subsidiaries in Europe and North America,and is expanding its global reach through strategic allianceswith mobile and multimedia service providers in Asia-Pacificand Europe. NTT DoCoMo is listed on the Tokyo, London,and New York stock exchanges.
MOBILE NETWORKS IN JAPAN
The Japanese mobile market consists of three companies: NTTDoCoMo, KDDI/AU and J-phone (Vodafone). Althoughtheir market shares in 2003 were roughly 60 percent, 20 per-cent, and 20 percent, respectively, the difference in financialconditions of NTT DoCoMo and its competitors was evenlarger due to the difference in their strategies for sales anddistribution of handsets in Japan. KDDI and J-phone workedthrough independent retailers and paid incentives on top ofthe retail price for the sales of terminals. They focused moreon the market share than on the profit, which weakened their
financial condition. In contrast, NTT DoCoMo establishedits own shops, a retail operation that was managed jointlywith trading houses and other companies that exclusivelysold DoCoMo terminals. The incentives for these stores weresignificantly lower than those of their competitors.
In February 1999, NTT DoCoMo introduced i-mode, awireless Internet service. In just three years it had 30 millionsubscribers, (60 percent share of Japan’s mobile Internet mar-ket). Two other rival services EZweb from KDDI and J-Skyfrom J-phone also did well. EZweb had over 9.3 million users,while J-Sky was able to get over 9.7 million subscribers in lessthan three years.
In October 2001, DoCoMo launched the world’s first third-generation (3G) cellular service FOMA in Tokyo. Customers,though, avoided DoCoMo’s 3G offering because of the highprice for the service, expensive handsets, and spotty cover-age even in key locations like the Tokyo subway. KDDIlaunched CDMA2002 1x, its 3G service in April 2001 andgained more than one million subscribers in the first threemonths. Although this service was slower than FOMA,KDDI’s upgrade was in sync with the technology standardsworldwide and did not require the rebuilding of a whole sys-tem, as required by FOMA. J-phone followed with its own 3Gservice in June 2002. Exhibit 1 shows the current status of 3Gsubscriptions and the overall market competition in Japan.KDDI/AU has moved almost all its subscribers from 2G to3G networks. DoCoMo plans to complete the conversion to3G/FOMA by 2006, while Vodaphone still has a very smallnumber of 3G subscribers. Both 3G voice and 3G data ratesare considerably lower than 2G data rates, however the actualrates subscribers pay depends on the plan selected, quantityof data transferred, contract length, and various discounts.
NTT DoCoMo’s 3G network’s brand name is FOMA andit uses the wCDMA technology standard. Vodaphone alsouses the wCDMA standard, while KDDI/AU uses differentversions of the CDMA 2000-1x standard (CDMA2000-1x andCDMA2000 1xEV-DO) under the brand names: CDMA1xand CDMA1x-WIN for data download rates up to 2.4 Mbps.
The Japanese communication industry has seen enormouschanges. The use of mobile phones has evolved from voice
EXHIBIT 13G SUBSCRIPTIONS AND CURRENT COMPETITION IN THE JAPANESE MOBILE SERVICES MARKET
100 million
3G s
ubsc
riptio
n co
ntra
cts
ww
w.e
urot
echn
olog
y.co
m(c
)200
4 E
urot
echn
olog
y Ja
pan
K.K
.
3G mobile subscriptions in Japan Competition in the Industry(cumulative number of subscribers basis)–As of the end of March–
Vodafone18.4%
DoCoMo
56.3%
Source : Telecommunications Carriers Association
TU-KA4.5%
au20.8%
10 million
1 million
100,000
10,000
1,000Jan l,2001
Jan l,2002
Jan l,2003
Jan l,2004
Jan l,2005
Jan l,2006
ww
w.e
urot
echn
olog
y.co
m
(c)2
004
Eur
otec
hnol
ogy
Japa
n K
.K.
Vodafone(wCDMA)
FOMA/DoCoMo(wCDMA)
AU/KDDI(CDMA2000-lx)
Source: www.eurotechnology.com. Source: NTT DocMo, Annual Report 2004.
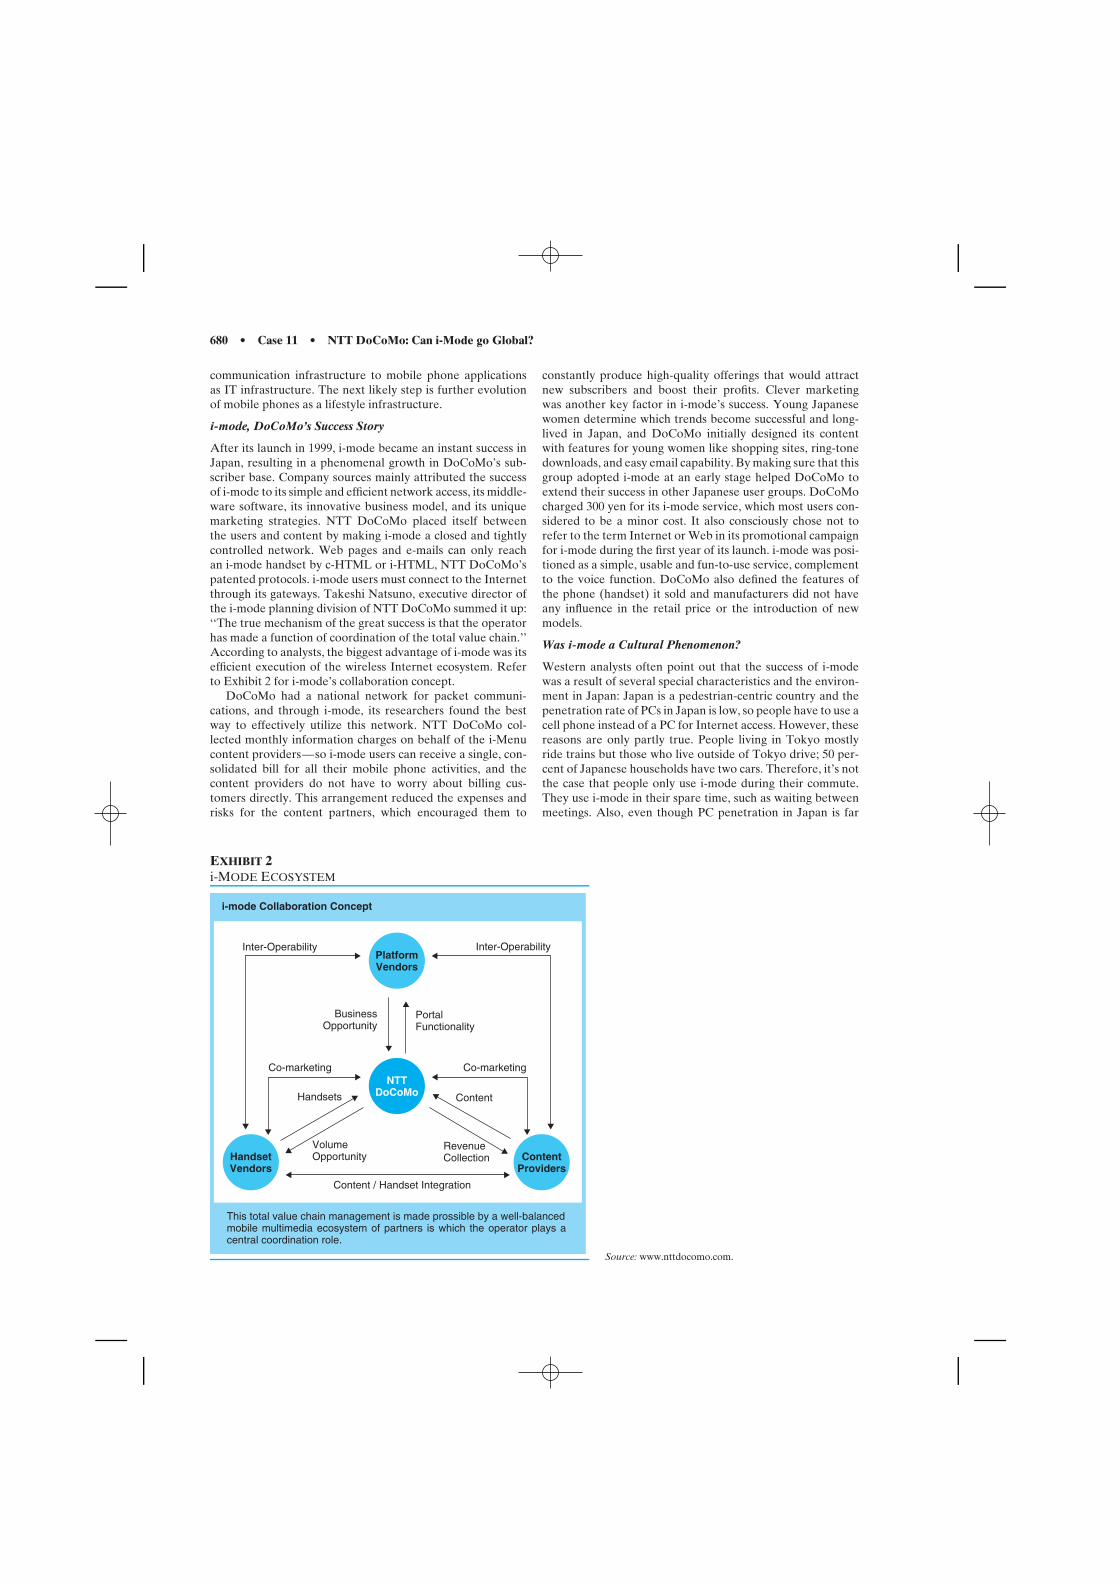
680 • Case 11 • NTT DoCoMo: Can i-Mode go Global?
communication infrastructure to mobile phone applicationsas IT infrastructure. The next likely step is further evolutionof mobile phones as a lifestyle infrastructure.
i-mode, DoCoMo’s Success Story
After its launch in 1999, i-mode became an instant success inJapan, resulting in a phenomenal growth in DoCoMo’s sub-scriber base. Company sources mainly attributed the successof i-mode to its simple and efficient network access, its middle-ware software, its innovative business model, and its uniquemarketing strategies. NTT DoCoMo placed itself betweenthe users and content by making i-mode a closed and tightlycontrolled network. Web pages and e-mails can only reachan i-mode handset by c-HTML or i-HTML, NTT DoCoMo’spatented protocols. i-mode users must connect to the Internetthrough its gateways. Takeshi Natsuno, executive director ofthe i-mode planning division of NTT DoCoMo summed it up:‘‘The true mechanism of the great success is that the operatorhas made a function of coordination of the total value chain.’’According to analysts, the biggest advantage of i-mode was itsefficient execution of the wireless Internet ecosystem. Referto Exhibit 2 for i-mode’s collaboration concept.
DoCoMo had a national network for packet communi-cations, and through i-mode, its researchers found the bestway to effectively utilize this network. NTT DoCoMo col-lected monthly information charges on behalf of the i-Menucontent providers—so i-mode users can receive a single, con-solidated bill for all their mobile phone activities, and thecontent providers do not have to worry about billing cus-tomers directly. This arrangement reduced the expenses andrisks for the content partners, which encouraged them to
constantly produce high-quality offerings that would attractnew subscribers and boost their profits. Clever marketingwas another key factor in i-mode’s success. Young Japanesewomen determine which trends become successful and long-lived in Japan, and DoCoMo initially designed its contentwith features for young women like shopping sites, ring-tonedownloads, and easy email capability. By making sure that thisgroup adopted i-mode at an early stage helped DoCoMo toextend their success in other Japanese user groups. DoCoMocharged 300 yen for its i-mode service, which most users con-sidered to be a minor cost. It also consciously chose not torefer to the term Internet or Web in its promotional campaignfor i-mode during the first year of its launch. i-mode was posi-tioned as a simple, usable and fun-to-use service, complementto the voice function. DoCoMo also defined the features ofthe phone (handset) it sold and manufacturers did not haveany influence in the retail price or the introduction of newmodels.
Was i-mode a Cultural Phenomenon?
Western analysts often point out that the success of i-modewas a result of several special characteristics and the environ-ment in Japan: Japan is a pedestrian-centric country and thepenetration rate of PCs in Japan is low, so people have to use acell phone instead of a PC for Internet access. However, thesereasons are only partly true. People living in Tokyo mostlyride trains but those who live outside of Tokyo drive; 50 per-cent of Japanese households have two cars. Therefore, it’s notthe case that people only use i-mode during their commute.They use i-mode in their spare time, such as waiting betweenmeetings. Also, even though PC penetration in Japan is far
EXHIBIT 2i-MODE ECOSYSTEM
Inter-Operability
BusinessOpportunity
Co-marketing
Handsets
VolumeOpportunity
Content / Handset Integration
RevenueCollection
Co-marketing
Content
PortalFunctionality
Inter-Operability
i-mode Collaboration Concept
PlatformVendors
HandsetVendors
ContentProviders
NTTDoCoMo
This total value chain management is made prossible by a well-balancedmobile multimedia ecosystem of partners is which the operator plays acentral coordination role.
Source: www.nttdocomo.com.
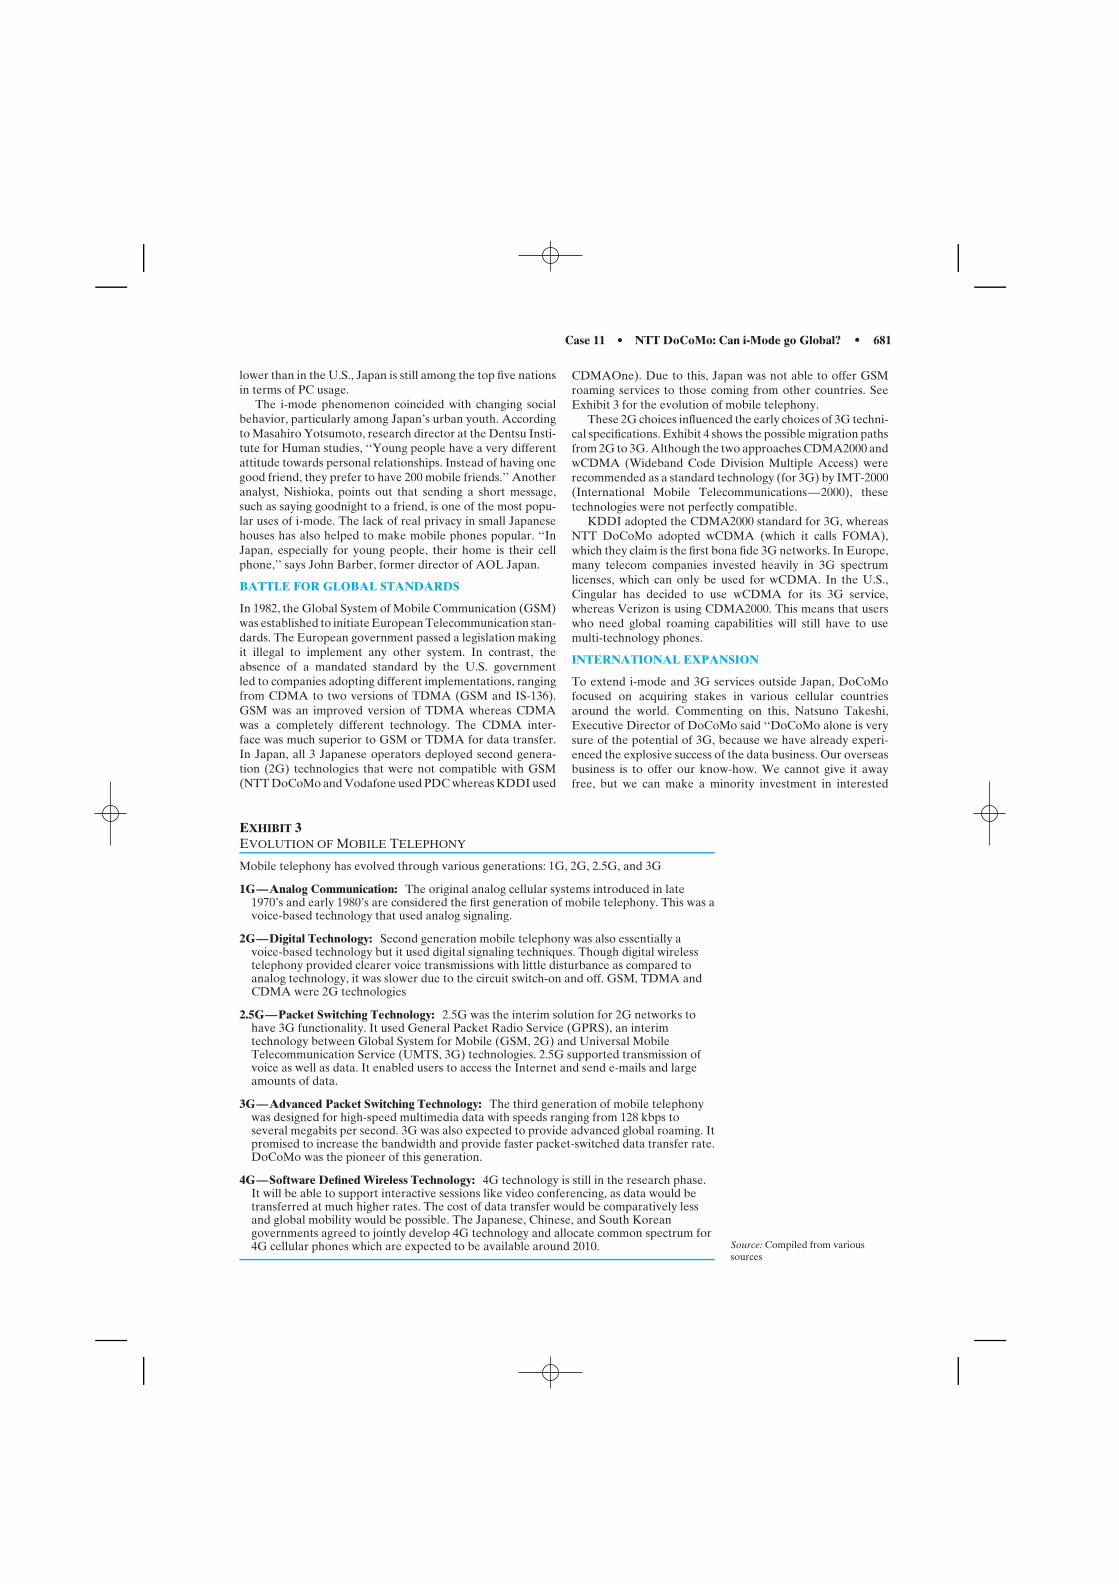
Case 11 • NTT DoCoMo: Can i-Mode go Global? • 681
lower than in the U.S., Japan is still among the top five nationsin terms of PC usage.
The i-mode phenomenon coincided with changing socialbehavior, particularly among Japan’s urban youth. Accordingto Masahiro Yotsumoto, research director at the Dentsu Insti-tute for Human studies, ‘‘Young people have a very differentattitude towards personal relationships. Instead of having onegood friend, they prefer to have 200 mobile friends.’’ Anotheranalyst, Nishioka, points out that sending a short message,such as saying goodnight to a friend, is one of the most popu-lar uses of i-mode. The lack of real privacy in small Japanesehouses has also helped to make mobile phones popular. ‘‘InJapan, especially for young people, their home is their cellphone,’’ says John Barber, former director of AOL Japan.
BATTLE FOR GLOBAL STANDARDS
In 1982, the Global System of Mobile Communication (GSM)was established to initiate European Telecommunication stan-dards. The European government passed a legislation makingit illegal to implement any other system. In contrast, theabsence of a mandated standard by the U.S. governmentled to companies adopting different implementations, rangingfrom CDMA to two versions of TDMA (GSM and IS-136).GSM was an improved version of TDMA whereas CDMAwas a completely different technology. The CDMA inter-face was much superior to GSM or TDMA for data transfer.In Japan, all 3 Japanese operators deployed second genera-tion (2G) technologies that were not compatible with GSM(NTT DoCoMo and Vodafone used PDC whereas KDDI used
CDMAOne). Due to this, Japan was not able to offer GSMroaming services to those coming from other countries. SeeExhibit 3 for the evolution of mobile telephony.
These 2G choices influenced the early choices of 3G techni-cal specifications. Exhibit 4 shows the possible migration pathsfrom 2G to 3G. Although the two approaches CDMA2000 andwCDMA (Wideband Code Division Multiple Access) wererecommended as a standard technology (for 3G) by IMT-2000(International Mobile Telecommunications—2000), thesetechnologies were not perfectly compatible.
KDDI adopted the CDMA2000 standard for 3G, whereasNTT DoCoMo adopted wCDMA (which it calls FOMA),which they claim is the first bona fide 3G networks. In Europe,many telecom companies invested heavily in 3G spectrumlicenses, which can only be used for wCDMA. In the U.S.,Cingular has decided to use wCDMA for its 3G service,whereas Verizon is using CDMA2000. This means that userswho need global roaming capabilities will still have to usemulti-technology phones.
INTERNATIONAL EXPANSION
To extend i-mode and 3G services outside Japan, DoCoMofocused on acquiring stakes in various cellular countriesaround the world. Commenting on this, Natsuno Takeshi,Executive Director of DoCoMo said ‘‘DoCoMo alone is verysure of the potential of 3G, because we have already experi-enced the explosive success of the data business. Our overseasbusiness is to offer our know-how. We cannot give it awayfree, but we can make a minority investment in interested
EXHIBIT 3EVOLUTION OF MOBILE TELEPHONY
Mobile telephony has evolved through various generations: 1G, 2G, 2.5G, and 3G
1G—Analog Communication: The original analog cellular systems introduced in late1970’s and early 1980’s are considered the first generation of mobile telephony. This was avoice-based technology that used analog signaling.
2G—Digital Technology: Second generation mobile telephony was also essentially avoice-based technology but it used digital signaling techniques. Though digital wirelesstelephony provided clearer voice transmissions with little disturbance as compared toanalog technology, it was slower due to the circuit switch-on and off. GSM, TDMA andCDMA were 2G technologies
2.5G—Packet Switching Technology: 2.5G was the interim solution for 2G networks tohave 3G functionality. It used General Packet Radio Service (GPRS), an interimtechnology between Global System for Mobile (GSM, 2G) and Universal MobileTelecommunication Service (UMTS, 3G) technologies. 2.5G supported transmission ofvoice as well as data. It enabled users to access the Internet and send e-mails and largeamounts of data.
3G—Advanced Packet Switching Technology: The third generation of mobile telephonywas designed for high-speed multimedia data with speeds ranging from 128 kbps toseveral megabits per second. 3G was also expected to provide advanced global roaming. Itpromised to increase the bandwidth and provide faster packet-switched data transfer rate.DoCoMo was the pioneer of this generation.
4G—Software Defined Wireless Technology: 4G technology is still in the research phase.It will be able to support interactive sessions like video conferencing, as data would betransferred at much higher rates. The cost of data transfer would be comparatively lessand global mobility would be possible. The Japanese, Chinese, and South Koreangovernments agreed to jointly develop 4G technology and allocate common spectrum for4G cellular phones which are expected to be available around 2010. Source: Compiled from various
sources
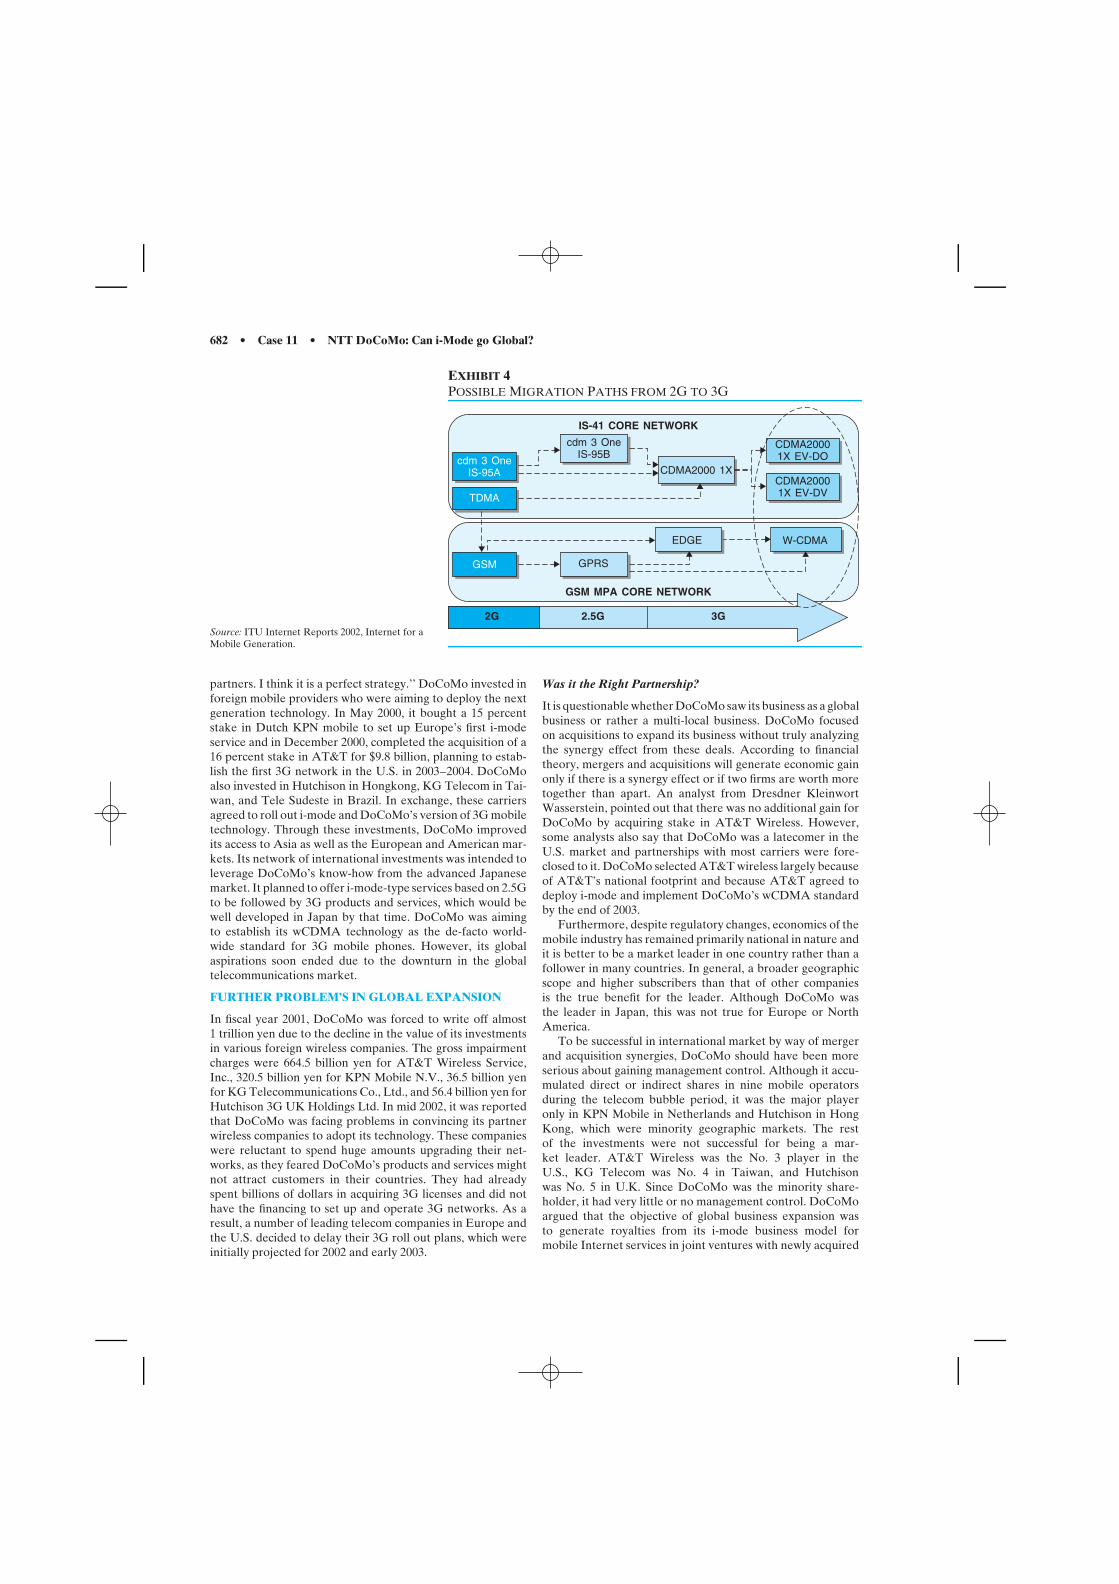
682 • Case 11 • NTT DoCoMo: Can i-Mode go Global?
Source: ITU Internet Reports 2002, Internet for aMobile Generation.
EXHIBIT 4POSSIBLE MIGRATION PATHS FROM 2G TO 3G
2.5G
GPRSGSM
cdm 3 OneIS-95B
CDMA2000 1X
CDMA20001X EV-DO
CDMA20001X EV-DV
EDGE W-CDMA
IS-41 CORE NETWORK
GSM MPA CORE NETWORK
3G
TDMA
cdm 3 OneIS-95A
2G
partners. I think it is a perfect strategy.’’ DoCoMo invested inforeign mobile providers who were aiming to deploy the nextgeneration technology. In May 2000, it bought a 15 percentstake in Dutch KPN mobile to set up Europe’s first i-modeservice and in December 2000, completed the acquisition of a16 percent stake in AT&T for $9.8 billion, planning to estab-lish the first 3G network in the U.S. in 2003–2004. DoCoMoalso invested in Hutchison in Hongkong, KG Telecom in Tai-wan, and Tele Sudeste in Brazil. In exchange, these carriersagreed to roll out i-mode and DoCoMo’s version of 3G mobiletechnology. Through these investments, DoCoMo improvedits access to Asia as well as the European and American mar-kets. Its network of international investments was intended toleverage DoCoMo’s know-how from the advanced Japanesemarket. It planned to offer i-mode-type services based on 2.5Gto be followed by 3G products and services, which would bewell developed in Japan by that time. DoCoMo was aimingto establish its wCDMA technology as the de-facto world-wide standard for 3G mobile phones. However, its globalaspirations soon ended due to the downturn in the globaltelecommunications market.
FURTHER PROBLEM’S IN GLOBAL EXPANSION
In fiscal year 2001, DoCoMo was forced to write off almost1 trillion yen due to the decline in the value of its investmentsin various foreign wireless companies. The gross impairmentcharges were 664.5 billion yen for AT&T Wireless Service,Inc., 320.5 billion yen for KPN Mobile N.V., 36.5 billion yenfor KG Telecommunications Co., Ltd., and 56.4 billion yen forHutchison 3G UK Holdings Ltd. In mid 2002, it was reportedthat DoCoMo was facing problems in convincing its partnerwireless companies to adopt its technology. These companieswere reluctant to spend huge amounts upgrading their net-works, as they feared DoCoMo’s products and services mightnot attract customers in their countries. They had alreadyspent billions of dollars in acquiring 3G licenses and did nothave the financing to set up and operate 3G networks. As aresult, a number of leading telecom companies in Europe andthe U.S. decided to delay their 3G roll out plans, which wereinitially projected for 2002 and early 2003.
Was it the Right Partnership?
It is questionable whether DoCoMo saw its business as a globalbusiness or rather a multi-local business. DoCoMo focusedon acquisitions to expand its business without truly analyzingthe synergy effect from these deals. According to financialtheory, mergers and acquisitions will generate economic gainonly if there is a synergy effect or if two firms are worth moretogether than apart. An analyst from Dresdner KleinwortWasserstein, pointed out that there was no additional gain forDoCoMo by acquiring stake in AT&T Wireless. However,some analysts also say that DoCoMo was a latecomer in theU.S. market and partnerships with most carriers were fore-closed to it. DoCoMo selected AT&T wireless largely becauseof AT&T’s national footprint and because AT&T agreed todeploy i-mode and implement DoCoMo’s wCDMA standardby the end of 2003.
Furthermore, despite regulatory changes, economics of themobile industry has remained primarily national in nature andit is better to be a market leader in one country rather than afollower in many countries. In general, a broader geographicscope and higher subscribers than that of other companiesis the true benefit for the leader. Although DoCoMo wasthe leader in Japan, this was not true for Europe or NorthAmerica.
To be successful in international market by way of mergerand acquisition synergies, DoCoMo should have been moreserious about gaining management control. Although it accu-mulated direct or indirect shares in nine mobile operatorsduring the telecom bubble period, it was the major playeronly in KPN Mobile in Netherlands and Hutchison in HongKong, which were minority geographic markets. The restof the investments were not successful for being a mar-ket leader. AT&T Wireless was the No. 3 player in theU.S., KG Telecom was No. 4 in Taiwan, and Hutchisonwas No. 5 in U.K. Since DoCoMo was the minority share-holder, it had very little or no management control. DoCoMoargued that the objective of global business expansion wasto generate royalties from its i-mode business model formobile Internet services in joint ventures with newly acquired
Case 11 • NTT DoCoMo: Can i-Mode go Global? • 683
partners and to increase the adoption of DoCoMo’s 3Gmobile technology standard. In Japan, DoCoMo was ableto dominate the entire value chain by specifying standardsfor handset manufacturers and regulating the content fromcontent providers. Did it evaluate all the success factors forits i-mode service in Japan before expanding to overseasmarkets?
Was the U.S. Ready for i-mode?
At the time of the acquisition of AT&T, Japan and Europehad already begun migrating to the 3G networks whereas inthe U.S. there were many full second-generation network cov-erages and some 2.5G providers. Although the limited 2.5Gdata transmission speed did not support advanced multimediaservices, it provided the basic content that satisfied customers.This was, however, not sufficient to be marketed as i-modeunder DoCoMo’s standards.
The preferred protocol for mobile information services inthe U.S. was wireless application protocol (WAP), whichallowed users to connect to the Internet and advancedtelephony services. It required the use of wireless markuplanguage (WML) to create content (Internet sites). WAP isan open standard, not controlled by a single vendor. Butits widespread adoption was uncertain due to its technicallimitations. In contrast, DoCoMo used its own protocol fori-mode in combination with its proprietary c-HTML language.Switching to i-mode would thus be more expensive.
Although most carriers had introduced mobile Inter-net access based on the WAP protocol, similar capabilitieswere also offered by providers of mobile e-mail services,such as Blackberry, and of wireless personal digital assis-tants (PDA’s). The distinction between cellular phones andPDA’s were beginning to blur as new cellular handsets incor-porated PDA functionality and wireless PDA’s were voiceenabled.
Furthermore, the U.S. market was different from theJapanese market in terms of fragmentation and a widelydispersed population. The intense competition in the U.S.market had led to flat rate calling plans, so there was littleincentive for mobile carriers to increase network usage. Inaddition, U.S. prices were often set too high to encouragefrequent use of additional services.
What Happened in the UK?
Although DoCoMo’s technology was far superior to WAP,which European operators had been successfully marketingto their customers, very few users signed up for i-mode.Mobile Internet services were not as popular in Europe asthey were in Asia and after studying the UK market, 3UKdecided against deploying i-mode. The local operators inEurope were also facing problems in launching i-mode com-patible technology in place of the standard WAP technology.In May 2004, DoCoMo announced that it had terminatedits investment in Hutchison 3G UK holdings, which oper-ates 3UK. Some other reasons that contributed to the failurewere the launching of i-mode service during a recession, poorquality of i-mode enabled handsets, and the opportunity forWAP to bounce back. Many consumers considered i-modeas an interim technology that would soon be supersededby 3G. As John Tysoe, mobile-industry analyst at WestLBPanmure in London pointed out, ‘‘It will be tough to persuade
people to get an i-mode handset when so much has been saidabout 3G.’’
Investors wanted DoCoMo to rethink its overseas adven-tures.
FINANCIAL HIGHLIGHTS: DoCoMo
Overall Operating Result
In fiscal year 2003, total operating revenue of the companyincreased by 4.97 percent to 5,048 billion yen while operat-ing income increased by 4.36 percent. Net income increasedfrom 212.49 billion yen in FY2002 to 650.01 billion yen inFY2003, representing a 206 percent increase. This surge innet income was attributable to the reduction in write-downsof investment in affiliates and equity in net losses of affiliates,and the gain from sales of AT&T securities. The percentage ofoperating expenses to sales reduced slightly from 78.5 percentin FY2002 to 78 percent in FY2003 as a result of a decreasein sales commissions. In FY2003, the cost of providing ser-vices increased by 0.8 percent YOY. However, cost/revenuepercentage decreased from 16.32 percent to 15.97 percent inFY2003 as a result of economies of scale from the increase incellular traffic volume. DoCoMo reported an operating lossin FY2001 of 116 billion yen despite an increase in operat-ing revenue from FY2000. This was attributable to the lossin equity of affiliates, which reflected the poor performanceof international investments. AT&T reported operating lossand impairment of goodwill totaling 664.5 billion yen. At thesame time, there were impairment charges of 320.5 billion yento the investment in KPN Mobile N.V., 36.5 billion yen forKG Telecommunications Co., Ltd, and 56.4 billion yen forHutchison 3G UK holdings Ltd.
Financial Position
In FY2003, the company’s assets increased by 3.67 percentto 6,262 million yen. DoCoMo has invested more in wirelesstelecommunication expenses, building a structure to supportthe increase in subscribers, R&D for fourth generation (4G)services and for servers for Internet-related services, and 3GFOMA infrastructure. While cash for business expansion isstill needed, DoCoMo depended less on debt. Debt to assetratio decreased gradually every year from 45.74 percent inFY2001 to 40.84 percent in FY2003. Decrease in the depen-dence on debt will enable DoCoMo to sustain its businessgrowth in the long run.
Return on Equity
DoCoMo’s ROE increased from 6.11 percent in FY2002 to17.84 percent in FY2003 because of the increase in net profitmargin and higher asset turnover ratio (to measure how thecompany efficiently generates sales from its asset). As statedabove, the increase in net profit margin in FY2003 camefrom the reduction in loss and impairment of investmentsin affiliates. Operating margin, which represented the per-formance of its main business, however, decrease from 22.0percent to 21.8 percent. Asset turnover increased slightly from0.79 times to 0.82 times in FY2003. In sum, the increase inROE did not result from increase in profit margin of its mainbusiness but from the decrease in the loss of investment inaffiliates and higher efficiency in generating sales from itsassets.
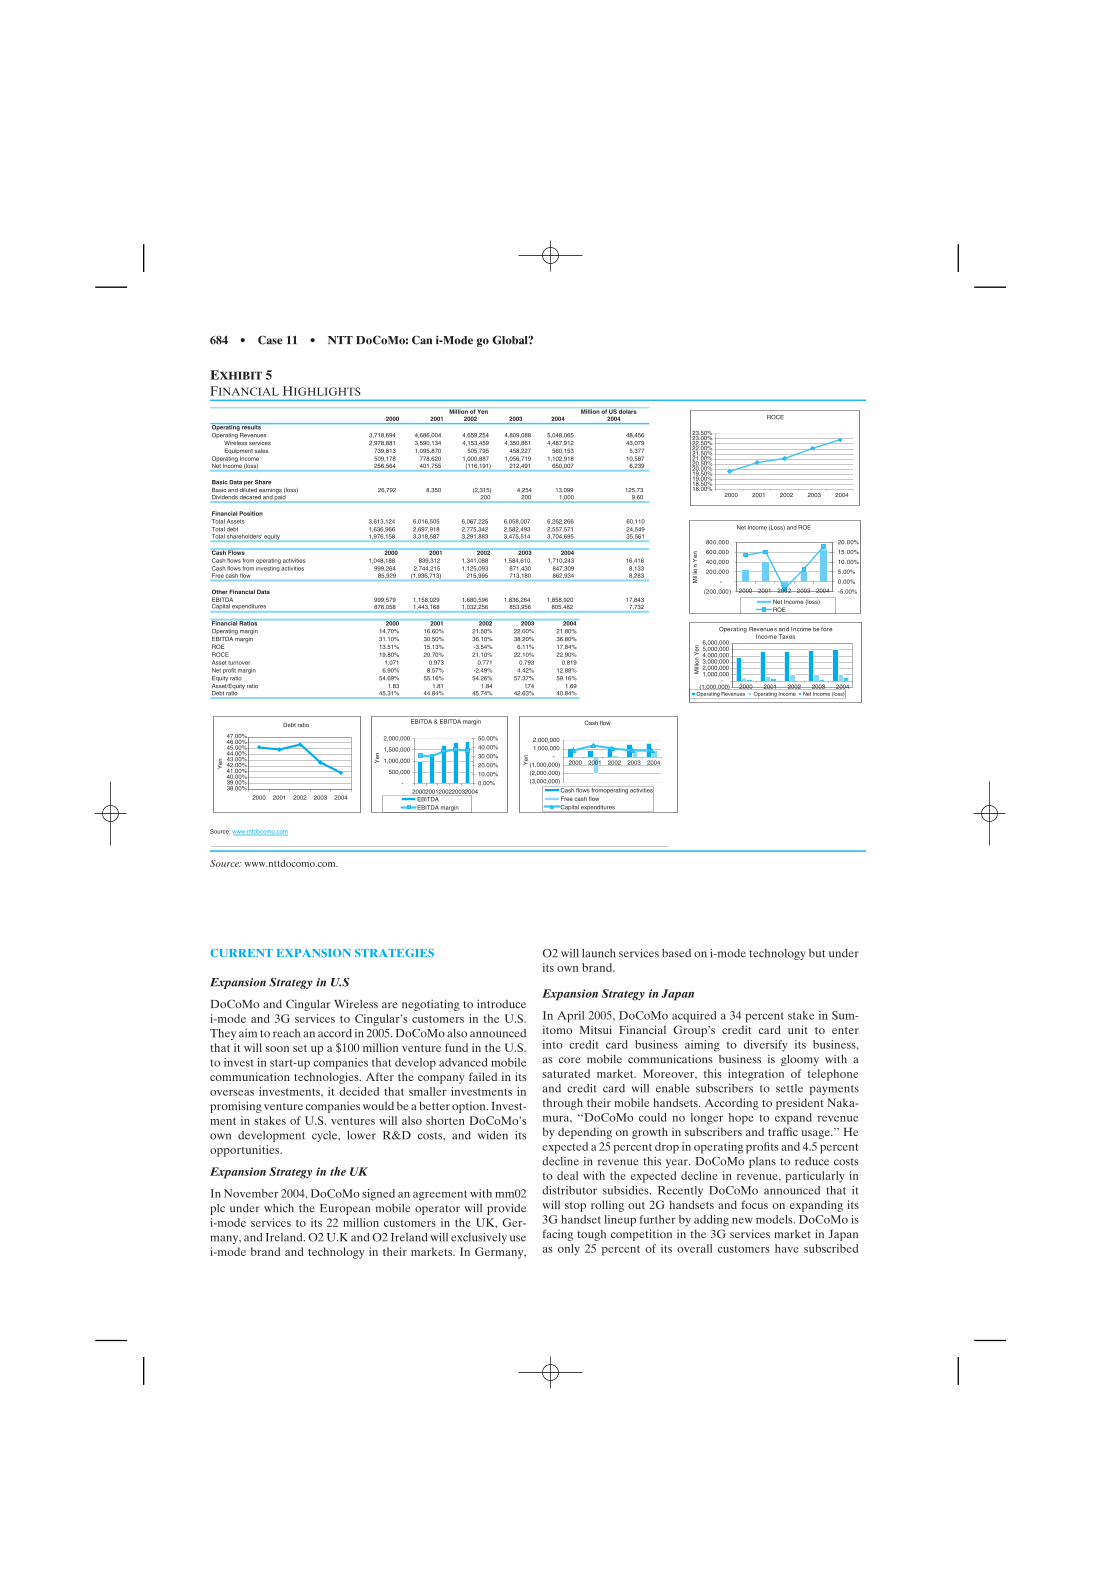
684 • Case 11 • NTT DoCoMo: Can i-Mode go Global?
EXHIBIT 5FINANCIAL HIGHLIGHTS
Million of Yen Million of US dolars2000 2001 2002 2003 2004 2004
Operating resultsOperating Revenues 3,718,694 4,686,004 4,659,254 4,809,088 48,456
Wireless services 2,978,881 3,590,134 4,153,459 4,350,861 4,487,912 43,079Equipment sales 739,813 1,095,870 505,795 458,227 560,153 5,377
Operating Income 509,178 778,620 1,000,887(116,191)
1,056,719 1,102,918 10,587Net Income (loss) 256,564 401,755 212,491 650,007 6,239
Basic Data per ShareBasic and diluted earnings (loss) 26,792 8,350 (2,315) 4,254 13,099 125.73Dividends decared and paid 200 200 1,000 9.60
Financial PositionTotal Assets 3,613,124 6,016,505 6,067,225 6,058,007 6,262,266 60,110Total debt 1,636,966 2,697,918 2,775,342 2,582,493 2,557,571 24,549Total shareholders' equity 1,976,158 3,318,587 3,291,883 3,475,514 3,704,695 35,561
Cash Flows 2000 2001 2002 2003 2004Cash flows from operating activities 1,048,188 839,312 1,341,088 1,584,610 1,710,243 16,416Cash flows from investing activities 999,264 2,744,215 1,125,093 871,430 847,309 8,133Free cash flow
Capital expenditures
85,929 (1,936,713) 215,995 713,180 862,934 8,283
Other Financial DataEBITDA 999,579 1,158,029 1,680,596 1,836,264 1,858,920 17,843
876,058 1,443,168 1,032,256 853,956 805,482 7,732
Financial Ratios 2000 2001 2002 2003 2004Operating margin 14.70% 16.60% 21.50% 22.00% 21.80%EBITDA margin 31.10% 30.50% 36.10% 38.20% 36.80%ROE 13.51% 15.13% -3.54% 6.11% 17.84%ROCE 19.80% 20.70% 21.10% 22.10% 22.90%Asset turnover 1.071 0.973 0.771 0.793 0.819Net profit margin 6.90% 8.57% -2.49% 4.42% 12.88%Equity ratio 54.69% 55.16% 54.26% 57.37% 59.16%Asset/Equity ratio 1.83 1.81 1.84 174. 1.69Debt ratio 45.31% 44.84% 45.74% 42.63% 40.84%
Operating Revenues and Income be foreIncome Taxes
(1,000,000)-
1,000,0002,000,0003,000,0004,000,0005,000,0006,000,000
2000 2001 2002 2003 2004
Mill
ion
Yen
Operating Revenues Operating Income Net Income (loss)
Net Income (Loss) and ROE
(200,000)
-
200,000
400,000
600,000
800,000
2000 2001 2002 2003 2004
Mil
lion
Yen
-5.00%
0.00%
5.00%
10.00%
15.00%
20.00%
Net Income (loss)ROE
ROCE
18.00%18.50%19.00%19.50%20.00%20.50%21.00%21.50%22.00%22.50%23.00%23.50%
2000 2001 2002 2003 2004
EBITDA & EBITDA margin
-
500,000
1,000,000
1,500,000
2,000,000
20002001200220032004
Yen
0.00%
10.00%
20.00%
30.00%
40.00%
50.00%
EBITDAEBITDA margin
Debt ratio
38.00%39.00%40.00%41.00%42.00%43.00%44.00%45.00%46.00%47.00%
2000 2001 2002 2003 2004
Yen
Cash flow
(3,000,000)(2,000,000)(1,000,000)
-1,000,0002,000,000
2000 2001 2002 2003 2004Yen
Cash flows fromoperating activitiesFree cash flowCapital expenditures
Source: www.nttdocomo.com
5,048,065
Source: www.nttdocomo.com.
CURRENT EXPANSION STRATEGIES
Expansion Strategy in U.S
DoCoMo and Cingular Wireless are negotiating to introducei-mode and 3G services to Cingular’s customers in the U.S.They aim to reach an accord in 2005. DoCoMo also announcedthat it will soon set up a $100 million venture fund in the U.S.to invest in start-up companies that develop advanced mobilecommunication technologies. After the company failed in itsoverseas investments, it decided that smaller investments inpromising venture companies would be a better option. Invest-ment in stakes of U.S. ventures will also shorten DoCoMo’sown development cycle, lower R&D costs, and widen itsopportunities.
Expansion Strategy in the UK
In November 2004, DoCoMo signed an agreement with mm02plc under which the European mobile operator will providei-mode services to its 22 million customers in the UK, Ger-many, and Ireland. O2 U.K and O2 Ireland will exclusively usei-mode brand and technology in their markets. In Germany,
O2 will launch services based on i-mode technology but underits own brand.
Expansion Strategy in Japan
In April 2005, DoCoMo acquired a 34 percent stake in Sum-itomo Mitsui Financial Group’s credit card unit to enterinto credit card business aiming to diversify its business,as core mobile communications business is gloomy with asaturated market. Moreover, this integration of telephoneand credit card will enable subscribers to settle paymentsthrough their mobile handsets. According to president Naka-mura, ‘‘DoCoMo could no longer hope to expand revenueby depending on growth in subscribers and traffic usage.’’ Heexpected a 25 percent drop in operating profits and 4.5 percentdecline in revenue this year. DoCoMo plans to reduce coststo deal with the expected decline in revenue, particularly indistributor subsidies. Recently DoCoMo announced that itwill stop rolling out 2G handsets and focus on expanding its3G handset lineup further by adding new models. DoCoMo isfacing tough competition in the 3G services market in Japanas only 25 percent of its overall customers have subscribed
Case 12 • The Future of Nokia • 685
to FOMA. In contrast, KDDI, its nearest rival provides 3Gservices to 92 percent of its customers.
DoCoMo’s i-mode Clone Grows Quietly in France
Meanwhile, France’s Bouygues Telecom successfully dupli-cated DoCoMo’s development and marketing strategies. Itseems that the availability of better handsets like those inJapan, a well-defined and controlled portal strategy, and amarketing focus that led to i-mode’s success in Japan, ifproperly cloned, could be successful. Bouygues achieved amilestone of 500,000 customers within 12 months of launchingthe i-mode service in France. As of April 2005, it had 1.1million i-mode subscribers.
DISCUSSION QUESTIONS
1. What were the major factors that led to the success ofi-mode in Japan?
2. Do you support DoCoMo’s global strategies in 2001?Why/Why not?
3. Why are there signs of success in the Europe?
4. Given the current scenario, do you think DoCoMo shouldfocus on Asia or continue with its global expansion in U.S.and Europe?
5. DoCoMo is diversifying into credit card business. Howeffective do you think is this strategy?
� � � � � � � � � � � � � � � � � � � � � � � � � � � � � � �
CASE 12
THE FUTURE OF NOKIA
Jorma Ollila sat at his desk looking out over the skyline ofKeilalahti in Espoo, Finland. As Chief Executive Officer, heheld a fond sense of security when he was here at the globalheadquarters of Nokia, Inc. But recently, that feeling hadslowly begun to change, as more and more of Jorma’s timewas focused on developing elements of Nokia’s global plan.For years, that plan had been simple—utilize company facil-ities to manufacture large quantities of Nokia phones thatwere known for their style and quality. But suddenly, thingsweren’t so simple anymore. Competitors had begun usinglow-cost manufacturers and the tastes of the global cell phonemarket both shifted and split. From a design and function per-spective, global consumption had increasingly moved towardsthe new ‘‘clamshell’’ design and converging features, while atthe same time, clear purchase distinctions could now be madebetween new and existing markets.
It was obvious that Nokia’s business model is in need ofan overhaul. What is not clear to Jorma is just how much ofan overhaul would be needed and how he would go aboutaccomplishing it.
HISTORY OF NOKIA
Nokia’s history can be traced back to 1865, with the foundingof a forest industry enterprise in southwestern Finland. Engi-neer Fredrik Idestam established a mill to manufacture pulpand paper on the Nokia River. A little more than a centuryafter Nokia was founded, in 1967, Nokia merged with FinnishRubber Works (established in 1898) and Finnish Cable Works(established in 1912) to the form what is now known as theNokia Corporation.
Nokia made several acquisitions in the 1980s to increaseits position in the telecommunications and consumer elec-tronics markets. Among other companies, Nokia acquiredScandinavia’s largest maker of color televisions, Salora, and
This case was prepared by Katja Fischer, Charlie Huynh, Marisa Kos-sakowski, and Thomas R. Schuler of the Fox School of Business andManagement at Temple University under the supervision of ProfessorMasaaki Kotabe for class discussion rather than to illustrate either effectiveor ineffective management of a situation described (2004).
the Swedish electronics and computer company, Luxor, in1984. Four years later, Nokia bought the data systems divisionof Sweden’s Ericsson, which made it the largest informationtechnology company in Scandinavia. This was the first step inbecoming a major player in the European market for infor-mation technology. Over time, Nokia has expanded into tires,power transmissions, radio, telecom, electronics and computertechnology.
In 1998, Nokia bought a number of small companies thatdevelop e-commerce and telephony technologies to expandits drive into mobile Internet capability. Nokia also madeseveral acquisitions to reinforce its Internet protocol networkbusiness. In 2001, Nokia added Internet security appliancesto its product line-up with the acquisition of Ramp Net-works.
NOKIA’S MOVE TO MOBILITY
Kari Kairamo, who became CEO in 1977, saw Nokia’s futurein technology, even though he came from the forestry sideof the business. Under him, the company launched its firstmobile phones in the 1980s and introduced its first NMTportable phone in 1987. (NMT was the network that precededGSM.) The current CEO of Nokia, Jorma Ollila, took over themobile phone business in 1990, and in 1992, Nokia introducedits first GSM hand-portable phone. In 1994, he decided tofocus on mobile phones and telecommunications as the coreof the business and divested its non-core operations.
Mobile phones at that time were considered very expensivebusiness tools. However, Ollila predicted that as they becamecheaper and lighter, they might become a must-have itemamong consumers. In 1996, Nokia introduced the world’s firstall-in-one communications device, the Nokia 9000 Commu-nicator. Since 1997, Nokia has been focusing on the mobileInternet as it moves towards a ‘‘mobile information society.’’In 2001, Nokia began working with other phone makers andservice providers to develop a global standard for 3G soft-ware, so named because it is the third generation of mobiletechnology. In 2002, Nokia announced its first phone with abuilt-in camera.
686 • Case 12 • The Future of Nokia
According to sales figures of 2003, Mobile Phones gener-ated 80 percent of Nokia’s net sales, networks 19 percent, andventures 1 percent of net sales. (See Exhibit 1.) It is obviousthat Nokia’s primary business is mobile phones.
NOKIA’S MOBILE PERFORMANCE
Nokia sold over 40 million mobile phones in 1998, surpassingMotorola and making it the world’s number one mobile phonecompany. The fast growth of the mobile industry in terms ofthe speed of mobile phone sales astonished even Nokia. In1992, the company predicted that no more than 50 millionhandsets would be sold worldwide in 1999. The actual figurewas more than 250 million. The exceptional growth in demandfor mobile phone technology meant that from 1995 to 1999,sales figures tripled, profits rose by nearly three times andthe share prices rose rapidly. From 1996 to 2000, worldwidesales of mobile handsets grew by an unbelievable 60 percentannually, but the year 2000 was a turning point as the marketmatured.
Currently, Nokia is struggling to sustain its lead in theglobal handset market. When the company was poised toreach its goal of 40 percent market share, major competi-tors such as Motorola began to fight back. (See Exhibit 2.)Nokia’s net sales for Q2 2004 were $8.1 billion, a decrease of5 percent compared to the same quarter in 2003. Operatingprofit for the company was $1.1 billion, with operating marginat 13.7 percent, up from 11.7 percent in the 2nd quarter of2003. According to the second quarter results of 2004, bothNokia’s unit sales and margins have come under attack. Muchof Nokia’s own growth in Q2 appeared in Brazil, India, andRussia instead of its customary, wealthier European market.For the 2nd quarter 2004, Nokia’s European handset marketmade up 44 percent of total sales, with the Asian marketaccounting for 28 percent.
ORGANIZATIONAL SETUP
Nokia has been called possibly the least hierarchical largecompany in the world. One of Jorma Ollila’s goals is forNokia to seem like a small, intimate organization despite thefact that it has more than 50,000 employees spread aroundthe world. To better position itself for the future, Nokiareorganized itself into four primary business groups at thebeginning of 2004. These include Mobile Phones, Multime-dia, Networks and Enterprise solutions. Its focus remains onmobile phones and networks. The new structure also includes
three horizontal groups: Customer and Market Operations,Technology Platforms and Research, and Venturing and Busi-ness Infrastructure. (See Exhibit 3.) Responsibilities for thesegroups are global; Nokia does not further segment at this levelby region.
The control and management of Nokia is divided amongthe shareholders, the Board of Directors and the Group Exec-utive Board. In addition to being CEO, Jorma Ollila is alsoChairman of the Board. Paul J. Collins is the Vice Chairman.There are eight members of the Board of Directors; all of thecurrent members were re-elected from last year. Members ofthe Board of Directors take an active role in the company, andare responsible for regularly evaluating the strategic directionof the company.
THE NOKIA WAY
Simply stated, the mission of Nokia is ‘‘Connecting People’’and the company does this through a program called ‘‘TheNokia Way.’’ In achieving this, its strategy focuses on threeactivities used to expand mobile communication in terms ofvolume and value. They include:
1.) Expand mobile voice.
2.) Drive consumer multimedia.
3.) Bring extended mobility to enterprises.
The Nokia Way brings together talented individuals whoshare the right values. Customer satisfaction, respect, achieve-ment, and renewal are the values that make up the NokiaWay. The overall organizational setup of Nokia is flat andnetwork-organized, and Nokia believes that the speed andflexibility it achieves in decision-making is a product of theNokia Way.
Nokia has a strong system for internal communications;they measure internal communication performance throughthe annual employee opinion survey. Nokia uses Nokia PeopleMagazine as a channel for communicating with its employees,as well as Nokia News Service, the daily online news servicefor employees worldwide.
For its consumers, Nokia has created Club Nokia, a clubthat offers a direct help line for Nokia phone owners, invitesto all Nokia events and a Nokia newsletter. The only prerequi-sites are that you own a Nokia cell phone. The club gives usersexclusive benefits and priority customer support. Currentlyavailable in 33 countries, Club Nokia is a good way for Nokia
Source: Retrieved from:http://www.nokia.com/nokia/0,8764,64355,00.html.
EXHIBIT 1NOKIA 2003 SALES BY BUSINESS GROUP
1%
80%
19%
Nokia Mobile Phones
Net sales by businessgroup 2003
Nokia Networks
Nokia Ventures Organization
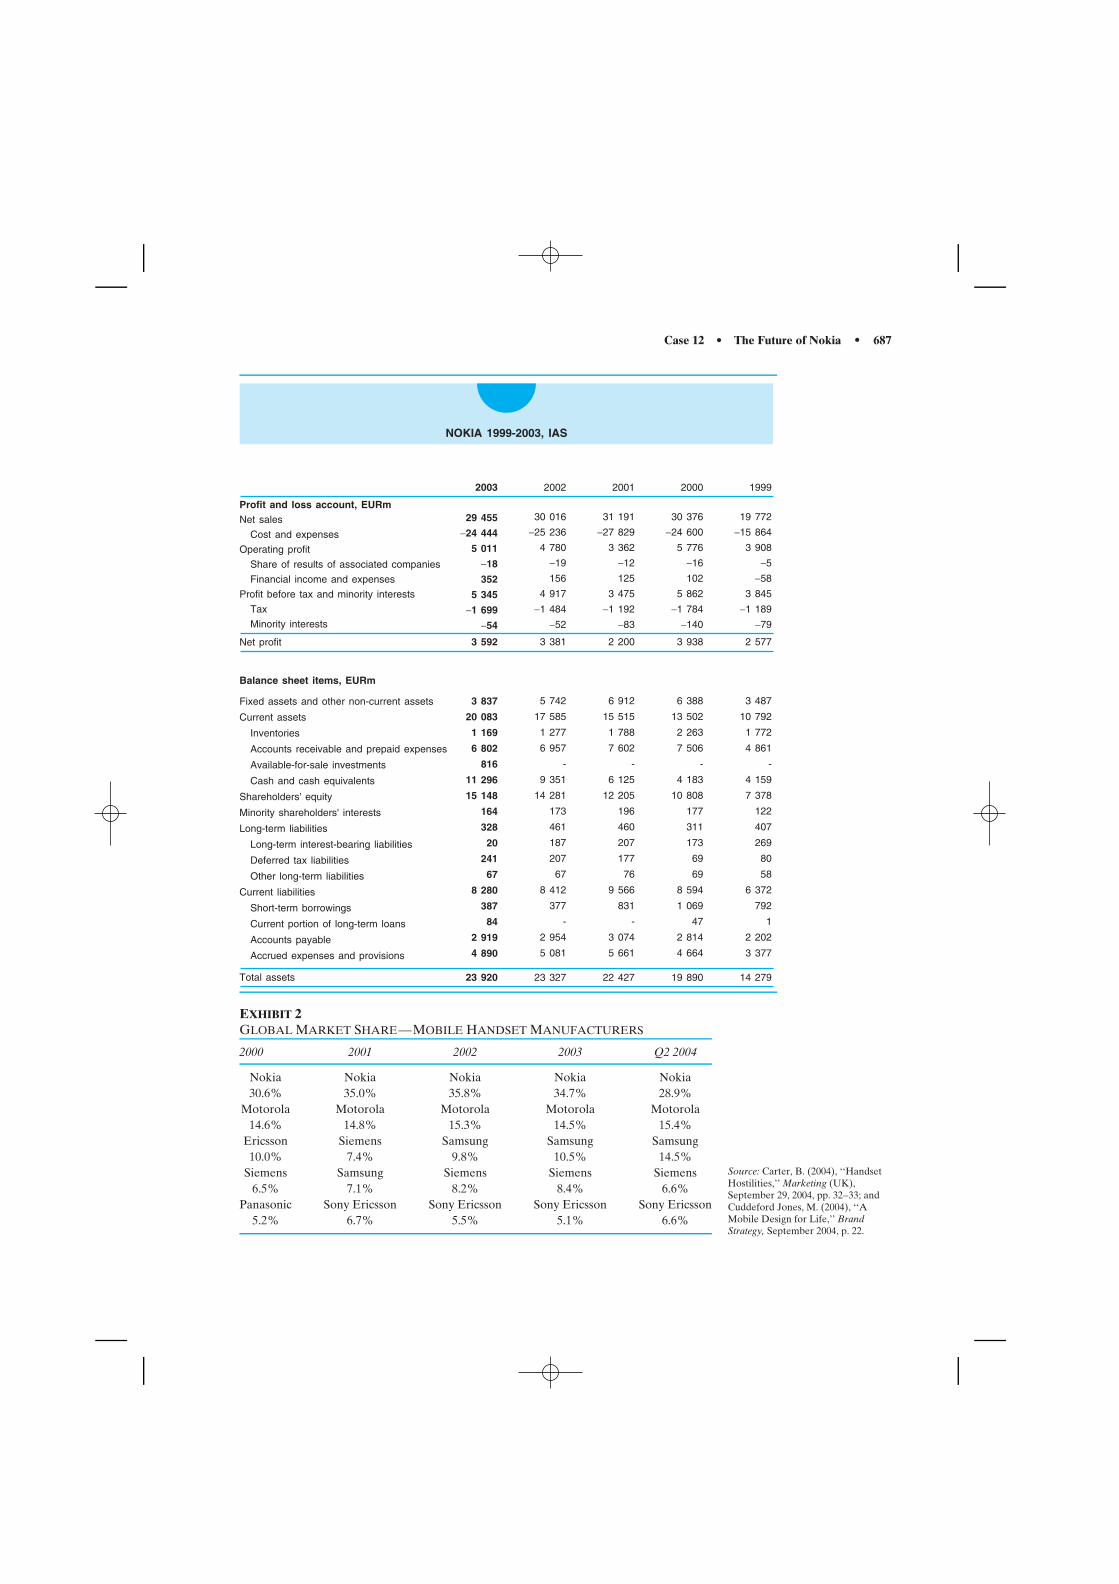
Case 12 • The Future of Nokia • 687
2003
3 592
23 920
29 455
−24 444
5 011
−18
352
5 345
−1 699
−54
3 837
20 083
1 169
6 802
816
11 296
15 148
164
328
20
241
67
8 280
387
84
2 919
4 890
23 327
2002
3 381
30 016
−25 236
4 780
−19
156
4 917
−1 484
−52
5 742
17 585
1 277
6 957
-
9 351
14 281
173
461
187
207
67
8 412
377
-
2 954
5 081
22 427
2001
2 200
31 191
−27 829
3 362
−12
125
3 475
−1 192
−83
6 912
15 515
1 788
7 602
-
6 125
12 205
196
460
207
177
76
9 566
831
-
3 074
5 661
19 890
2000
3 938
30 376
−24 600
5 776
−16
102
5 862
−1 784
−140
6 388
13 502
2 263
7 506
-
4 183
10 808
177
311
173
69
69
8 594
1 069
47
2 814
4 664
14 279
1999
2 577
3 487
10 792
1 772
4 861
-
4 159
7 378
122
407
269
80
58
6 372
792
1
2 202
3 377
19 772
−15 864
3 908
−5
−58
3 845
−1 189
−79
Net sales
Cost and expenses
Share of results of associated companies
Financial income and expenses
Tax
Minority interests
Fixed assets and other non-current assets
Current assets
Inventories
Accounts receivable and prepaid expenses
Available-for-sale investments
Cash and cash equivalents
Shareholders' equity
Minority shareholders' interests
Long-term liabilities
Long-term interest-bearing liabilities
Deferred tax liabilities
Other long-term liabilities
Current liabilities
Short-term borrowings
Current portion of long-term loans
Accounts payable
Accrued expenses and provisions
Total assets
Net profit
Operating profit
Profit before tax and minority interests
Profit and loss account, EURm
Balance sheet items, EURm
NOKIA 1999-2003, IAS
EXHIBIT 2GLOBAL MARKET SHARE—MOBILE HANDSET MANUFACTURERS
2000 2001 2002 2003 Q2 2004
Nokia Nokia Nokia Nokia Nokia30.6% 35.0% 35.8% 34.7% 28.9%
Motorola Motorola Motorola Motorola Motorola14.6% 14.8% 15.3% 14.5% 15.4%
Ericsson Siemens Samsung Samsung Samsung10.0% 7.4% 9.8% 10.5% 14.5%
Siemens Samsung Siemens Siemens Siemens6.5% 7.1% 8.2% 8.4% 6.6%
Panasonic Sony Ericsson Sony Ericsson Sony Ericsson Sony Ericsson5.2% 6.7% 5.5% 5.1% 6.6%
Source: Carter, B. (2004), ‘‘HandsetHostilities,’’ Marketing (UK),September 29, 2004, pp. 32–33; andCuddeford Jones, M. (2004), ‘‘AMobile Design for Life,’’ BrandStrategy, September 2004, p. 22.
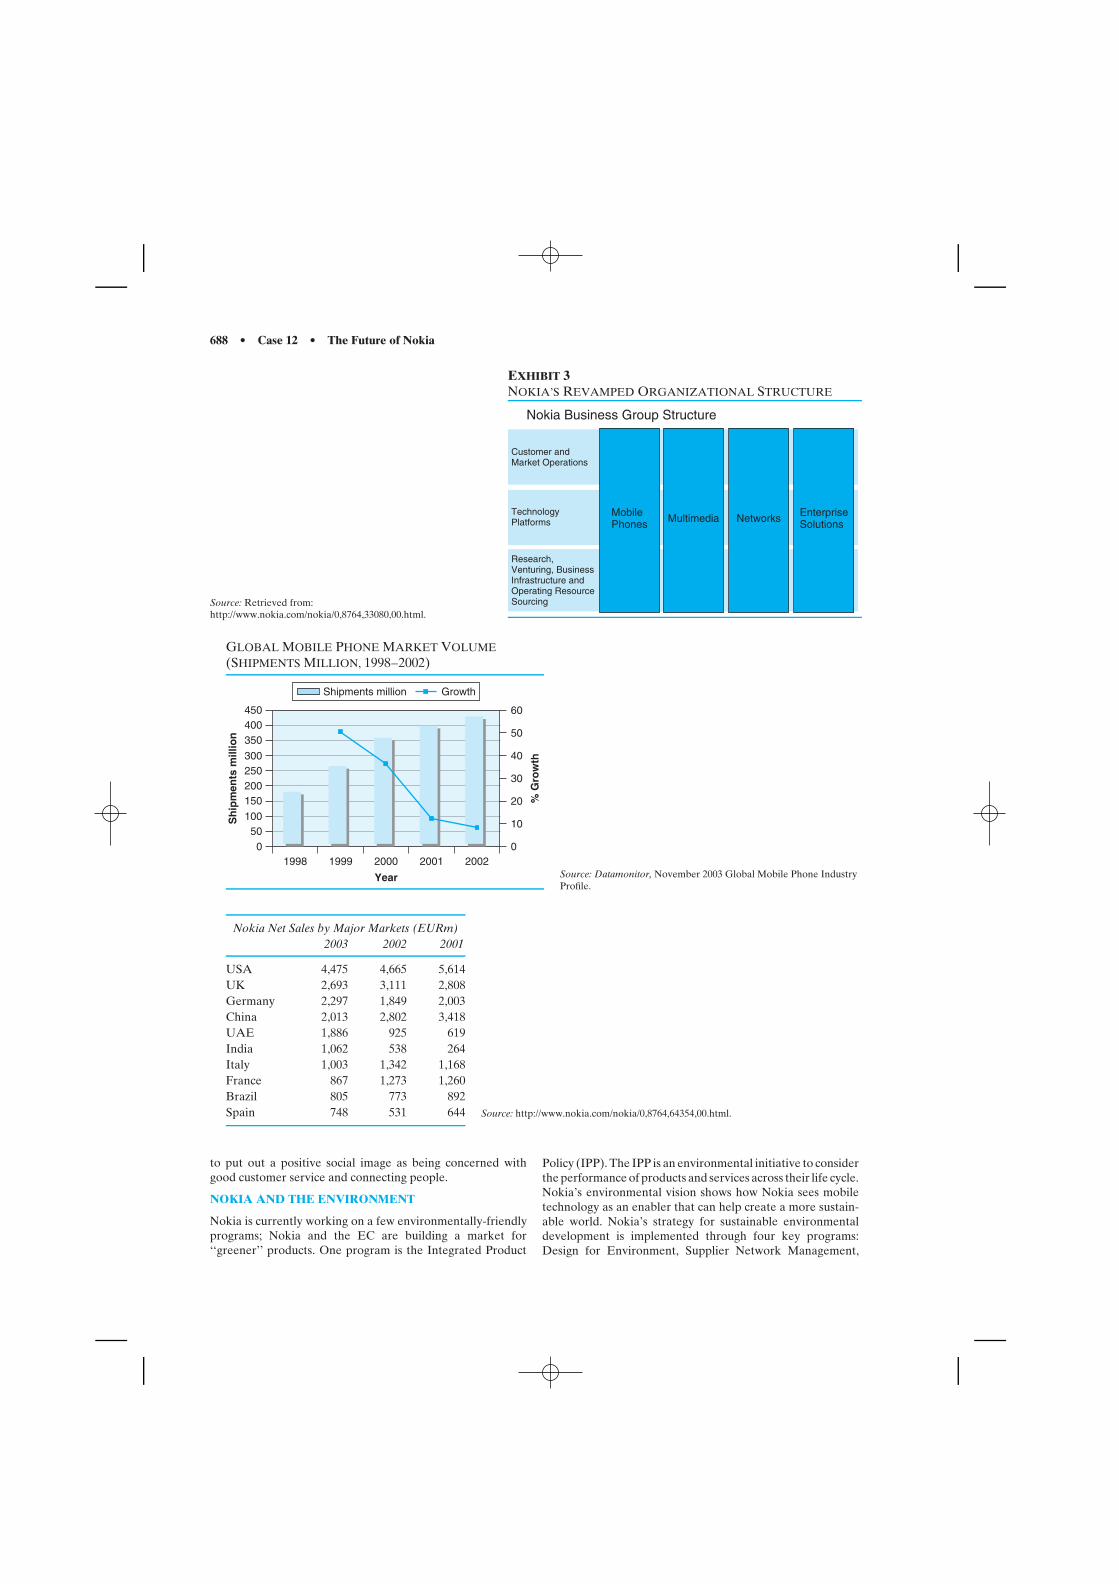
688 • Case 12 • The Future of Nokia
Source: Retrieved from:http://www.nokia.com/nokia/0,8764,33080,00.html.
EXHIBIT 3NOKIA’S REVAMPED ORGANIZATIONAL STRUCTURE
MobilePhones
Nokia Business Group Structure
Customer andMarket Operations
TechnologyPlatforms
Research,Venturing, BusinessInfrastructure andOperating ResourceSourcing
NetworksMultimedia EnterpriseSolutions
GLOBAL MOBILE PHONE MARKET VOLUME(SHIPMENTS MILLION, 1998–2002)
450
350
250
150
500
1998 1999 2000
Year
Sh
ipm
ents
mill
ion
% G
row
th
2001 2002
400
300
200
100
40
10
0
50
60
20
30
Shipments million Growth
Source: Datamonitor, November 2003 Global Mobile Phone IndustryProfile.
Nokia Net Sales by Major Markets (EURm)2003 2002 2001
USA 4,475 4,665 5,614UK 2,693 3,111 2,808Germany 2,297 1,849 2,003China 2,013 2,802 3,418UAE 1,886 925 619India 1,062 538 264Italy 1,003 1,342 1,168France 867 1,273 1,260Brazil 805 773 892Spain 748 531 644 Source: http://www.nokia.com/nokia/0,8764,64354,00.html.
to put out a positive social image as being concerned withgood customer service and connecting people.
NOKIA AND THE ENVIRONMENT
Nokia is currently working on a few environmentally-friendlyprograms; Nokia and the EC are building a market for‘‘greener’’ products. One program is the Integrated Product
Policy (IPP). The IPP is an environmental initiative to considerthe performance of products and services across their life cycle.Nokia’s environmental vision shows how Nokia sees mobiletechnology as an enabler that can help create a more sustain-able world. Nokia’s strategy for sustainable environmentaldevelopment is implemented through four key programs:Design for Environment, Supplier Network Management,
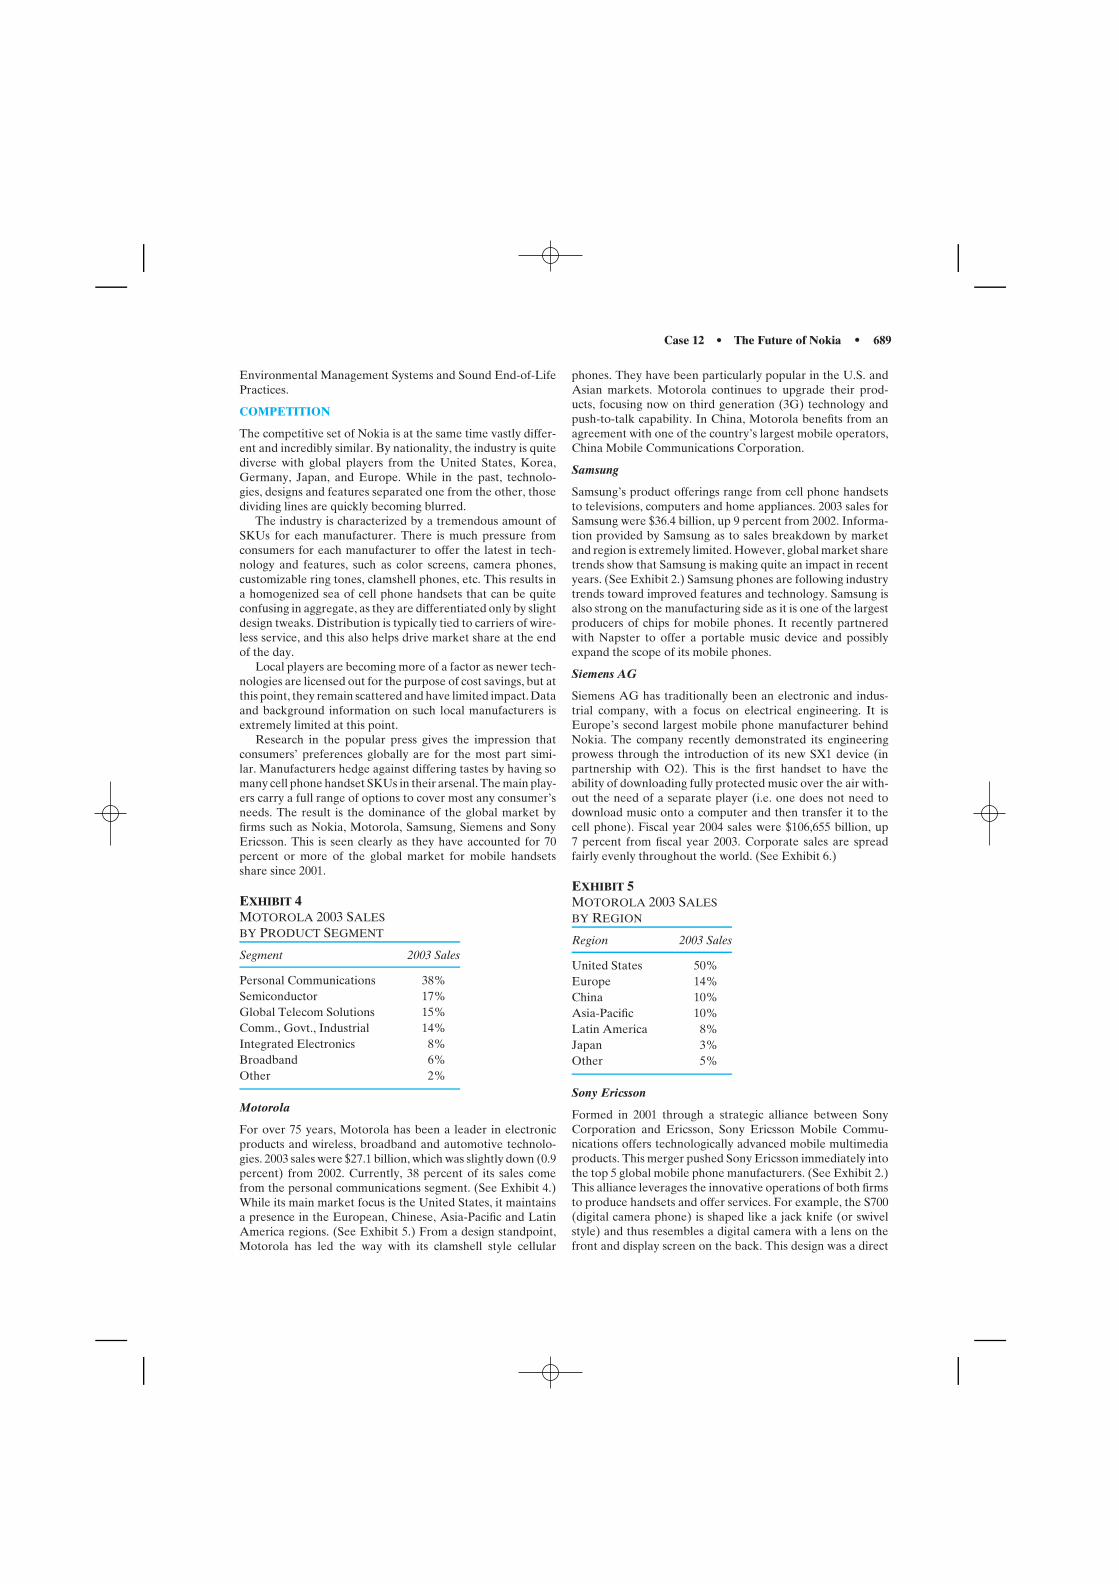
Case 12 • The Future of Nokia • 689
Environmental Management Systems and Sound End-of-LifePractices.
COMPETITION
The competitive set of Nokia is at the same time vastly differ-ent and incredibly similar. By nationality, the industry is quitediverse with global players from the United States, Korea,Germany, Japan, and Europe. While in the past, technolo-gies, designs and features separated one from the other, thosedividing lines are quickly becoming blurred.
The industry is characterized by a tremendous amount ofSKUs for each manufacturer. There is much pressure fromconsumers for each manufacturer to offer the latest in tech-nology and features, such as color screens, camera phones,customizable ring tones, clamshell phones, etc. This results ina homogenized sea of cell phone handsets that can be quiteconfusing in aggregate, as they are differentiated only by slightdesign tweaks. Distribution is typically tied to carriers of wire-less service, and this also helps drive market share at the endof the day.
Local players are becoming more of a factor as newer tech-nologies are licensed out for the purpose of cost savings, but atthis point, they remain scattered and have limited impact. Dataand background information on such local manufacturers isextremely limited at this point.
Research in the popular press gives the impression thatconsumers’ preferences globally are for the most part simi-lar. Manufacturers hedge against differing tastes by having somany cell phone handset SKUs in their arsenal. The main play-ers carry a full range of options to cover most any consumer’sneeds. The result is the dominance of the global market byfirms such as Nokia, Motorola, Samsung, Siemens and SonyEricsson. This is seen clearly as they have accounted for 70percent or more of the global market for mobile handsetsshare since 2001.
EXHIBIT 4MOTOROLA 2003 SALESBY PRODUCT SEGMENT
Segment 2003 Sales
Personal Communications 38%Semiconductor 17%Global Telecom Solutions 15%Comm., Govt., Industrial 14%Integrated Electronics 8%Broadband 6%Other 2%
Motorola
For over 75 years, Motorola has been a leader in electronicproducts and wireless, broadband and automotive technolo-gies. 2003 sales were $27.1 billion, which was slightly down (0.9percent) from 2002. Currently, 38 percent of its sales comefrom the personal communications segment. (See Exhibit 4.)While its main market focus is the United States, it maintainsa presence in the European, Chinese, Asia-Pacific and LatinAmerica regions. (See Exhibit 5.) From a design standpoint,Motorola has led the way with its clamshell style cellular
phones. They have been particularly popular in the U.S. andAsian markets. Motorola continues to upgrade their prod-ucts, focusing now on third generation (3G) technology andpush-to-talk capability. In China, Motorola benefits from anagreement with one of the country’s largest mobile operators,China Mobile Communications Corporation.
Samsung
Samsung’s product offerings range from cell phone handsetsto televisions, computers and home appliances. 2003 sales forSamsung were $36.4 billion, up 9 percent from 2002. Informa-tion provided by Samsung as to sales breakdown by marketand region is extremely limited. However, global market sharetrends show that Samsung is making quite an impact in recentyears. (See Exhibit 2.) Samsung phones are following industrytrends toward improved features and technology. Samsung isalso strong on the manufacturing side as it is one of the largestproducers of chips for mobile phones. It recently partneredwith Napster to offer a portable music device and possiblyexpand the scope of its mobile phones.
Siemens AG
Siemens AG has traditionally been an electronic and indus-trial company, with a focus on electrical engineering. It isEurope’s second largest mobile phone manufacturer behindNokia. The company recently demonstrated its engineeringprowess through the introduction of its new SX1 device (inpartnership with O2). This is the first handset to have theability of downloading fully protected music over the air with-out the need of a separate player (i.e. one does not need todownload music onto a computer and then transfer it to thecell phone). Fiscal year 2004 sales were $106,655 billion, up7 percent from fiscal year 2003. Corporate sales are spreadfairly evenly throughout the world. (See Exhibit 6.)
EXHIBIT 5MOTOROLA 2003 SALESBY REGION
Region 2003 Sales
United States 50%Europe 14%China 10%Asia-Pacific 10%Latin America 8%Japan 3%Other 5%
Sony Ericsson
Formed in 2001 through a strategic alliance between SonyCorporation and Ericsson, Sony Ericsson Mobile Commu-nications offers technologically advanced mobile multimediaproducts. This merger pushed Sony Ericsson immediately intothe top 5 global mobile phone manufacturers. (See Exhibit 2.)This alliance leverages the innovative operations of both firmsto produce handsets and offer services. For example, the S700(digital camera phone) is shaped like a jack knife (or swivelstyle) and thus resembles a digital camera with a lens on thefront and display screen on the back. This design was a direct
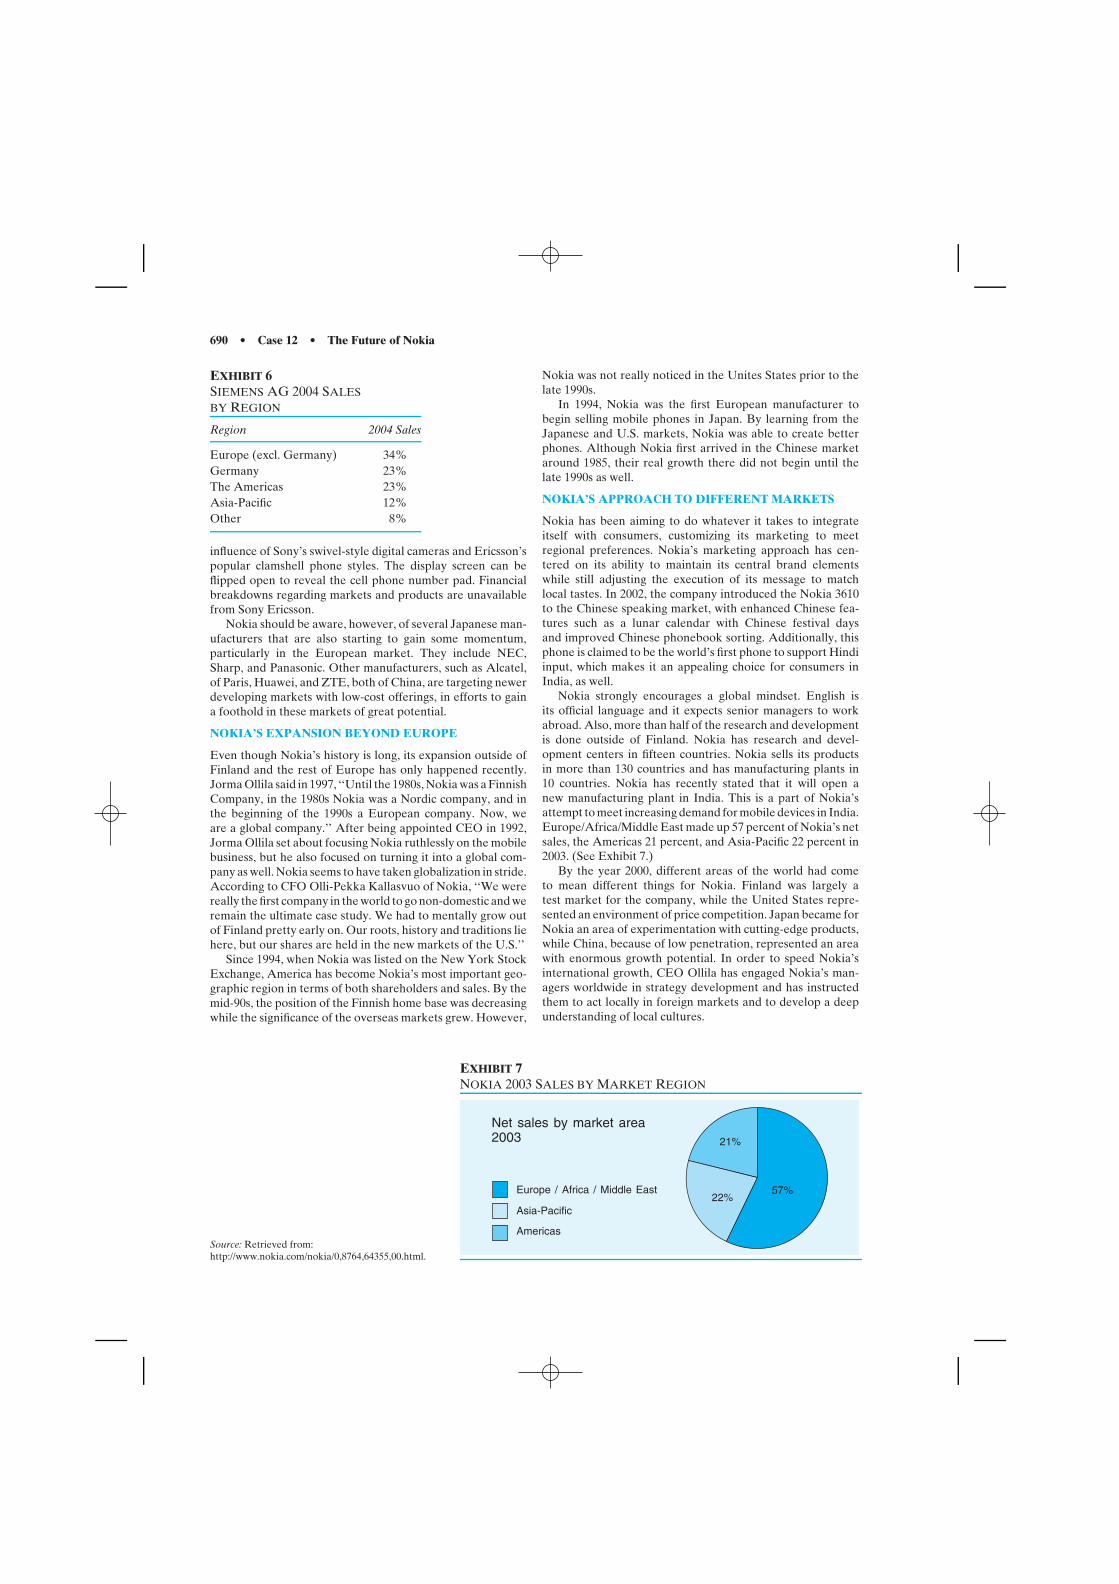
690 • Case 12 • The Future of Nokia
EXHIBIT 6SIEMENS AG 2004 SALESBY REGION
Region 2004 Sales
Europe (excl. Germany) 34%Germany 23%The Americas 23%Asia-Pacific 12%Other 8%
influence of Sony’s swivel-style digital cameras and Ericsson’spopular clamshell phone styles. The display screen can beflipped open to reveal the cell phone number pad. Financialbreakdowns regarding markets and products are unavailablefrom Sony Ericsson.
Nokia should be aware, however, of several Japanese man-ufacturers that are also starting to gain some momentum,particularly in the European market. They include NEC,Sharp, and Panasonic. Other manufacturers, such as Alcatel,of Paris, Huawei, and ZTE, both of China, are targeting newerdeveloping markets with low-cost offerings, in efforts to gaina foothold in these markets of great potential.
NOKIA’S EXPANSION BEYOND EUROPE
Even though Nokia’s history is long, its expansion outside ofFinland and the rest of Europe has only happened recently.Jorma Ollila said in 1997, ‘‘Until the 1980s, Nokia was a FinnishCompany, in the 1980s Nokia was a Nordic company, and inthe beginning of the 1990s a European company. Now, weare a global company.’’ After being appointed CEO in 1992,Jorma Ollila set about focusing Nokia ruthlessly on the mobilebusiness, but he also focused on turning it into a global com-pany as well. Nokia seems to have taken globalization in stride.According to CFO Olli-Pekka Kallasvuo of Nokia, ‘‘We werereally the first company in the world to go non-domestic and weremain the ultimate case study. We had to mentally grow outof Finland pretty early on. Our roots, history and traditions liehere, but our shares are held in the new markets of the U.S.’’
Since 1994, when Nokia was listed on the New York StockExchange, America has become Nokia’s most important geo-graphic region in terms of both shareholders and sales. By themid-90s, the position of the Finnish home base was decreasingwhile the significance of the overseas markets grew. However,
Nokia was not really noticed in the Unites States prior to thelate 1990s.
In 1994, Nokia was the first European manufacturer tobegin selling mobile phones in Japan. By learning from theJapanese and U.S. markets, Nokia was able to create betterphones. Although Nokia first arrived in the Chinese marketaround 1985, their real growth there did not begin until thelate 1990s as well.
NOKIA’S APPROACH TO DIFFERENT MARKETS
Nokia has been aiming to do whatever it takes to integrateitself with consumers, customizing its marketing to meetregional preferences. Nokia’s marketing approach has cen-tered on its ability to maintain its central brand elementswhile still adjusting the execution of its message to matchlocal tastes. In 2002, the company introduced the Nokia 3610to the Chinese speaking market, with enhanced Chinese fea-tures such as a lunar calendar with Chinese festival daysand improved Chinese phonebook sorting. Additionally, thisphone is claimed to be the world’s first phone to support Hindiinput, which makes it an appealing choice for consumers inIndia, as well.
Nokia strongly encourages a global mindset. English isits official language and it expects senior managers to workabroad. Also, more than half of the research and developmentis done outside of Finland. Nokia has research and devel-opment centers in fifteen countries. Nokia sells its productsin more than 130 countries and has manufacturing plants in10 countries. Nokia has recently stated that it will open anew manufacturing plant in India. This is a part of Nokia’sattempt to meet increasing demand for mobile devices in India.Europe/Africa/Middle East made up 57 percent of Nokia’s netsales, the Americas 21 percent, and Asia-Pacific 22 percent in2003. (See Exhibit 7.)
By the year 2000, different areas of the world had cometo mean different things for Nokia. Finland was largely atest market for the company, while the United States repre-sented an environment of price competition. Japan became forNokia an area of experimentation with cutting-edge products,while China, because of low penetration, represented an areawith enormous growth potential. In order to speed Nokia’sinternational growth, CEO Ollila has engaged Nokia’s man-agers worldwide in strategy development and has instructedthem to act locally in foreign markets and to develop a deepunderstanding of local cultures.
Source: Retrieved from:http://www.nokia.com/nokia/0,8764,64355,00.html.
EXHIBIT 7NOKIA 2003 SALES BY MARKET REGION
22%
21%
Europe / Africa / Middle East
Net sales by market area2003
Asia-Pacific
Americas
57%
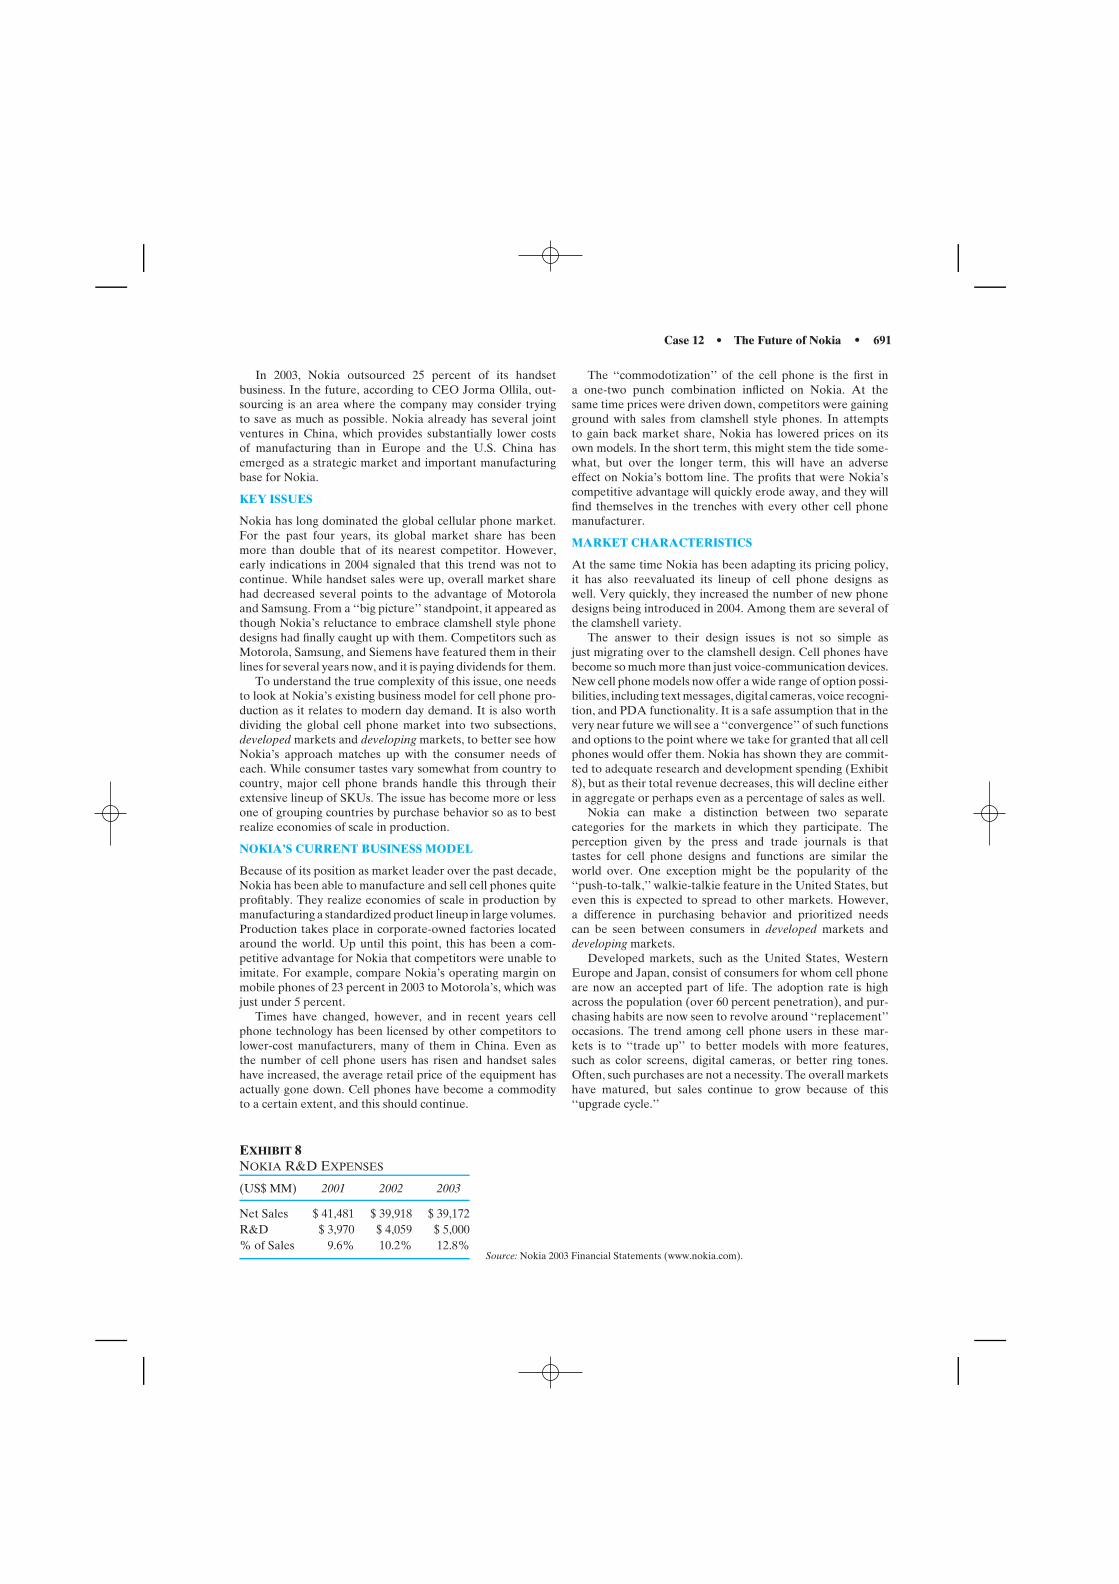
Case 12 • The Future of Nokia • 691
In 2003, Nokia outsourced 25 percent of its handsetbusiness. In the future, according to CEO Jorma Ollila, out-sourcing is an area where the company may consider tryingto save as much as possible. Nokia already has several jointventures in China, which provides substantially lower costsof manufacturing than in Europe and the U.S. China hasemerged as a strategic market and important manufacturingbase for Nokia.
KEY ISSUES
Nokia has long dominated the global cellular phone market.For the past four years, its global market share has beenmore than double that of its nearest competitor. However,early indications in 2004 signaled that this trend was not tocontinue. While handset sales were up, overall market sharehad decreased several points to the advantage of Motorolaand Samsung. From a ‘‘big picture’’ standpoint, it appeared asthough Nokia’s reluctance to embrace clamshell style phonedesigns had finally caught up with them. Competitors such asMotorola, Samsung, and Siemens have featured them in theirlines for several years now, and it is paying dividends for them.
To understand the true complexity of this issue, one needsto look at Nokia’s existing business model for cell phone pro-duction as it relates to modern day demand. It is also worthdividing the global cell phone market into two subsections,developed markets and developing markets, to better see howNokia’s approach matches up with the consumer needs ofeach. While consumer tastes vary somewhat from country tocountry, major cell phone brands handle this through theirextensive lineup of SKUs. The issue has become more or lessone of grouping countries by purchase behavior so as to bestrealize economies of scale in production.
NOKIA’S CURRENT BUSINESS MODEL
Because of its position as market leader over the past decade,Nokia has been able to manufacture and sell cell phones quiteprofitably. They realize economies of scale in production bymanufacturing a standardized product lineup in large volumes.Production takes place in corporate-owned factories locatedaround the world. Up until this point, this has been a com-petitive advantage for Nokia that competitors were unable toimitate. For example, compare Nokia’s operating margin onmobile phones of 23 percent in 2003 to Motorola’s, which wasjust under 5 percent.
Times have changed, however, and in recent years cellphone technology has been licensed by other competitors tolower-cost manufacturers, many of them in China. Even asthe number of cell phone users has risen and handset saleshave increased, the average retail price of the equipment hasactually gone down. Cell phones have become a commodityto a certain extent, and this should continue.
The ‘‘commodotization’’ of the cell phone is the first ina one-two punch combination inflicted on Nokia. At thesame time prices were driven down, competitors were gainingground with sales from clamshell style phones. In attemptsto gain back market share, Nokia has lowered prices on itsown models. In the short term, this might stem the tide some-what, but over the longer term, this will have an adverseeffect on Nokia’s bottom line. The profits that were Nokia’scompetitive advantage will quickly erode away, and they willfind themselves in the trenches with every other cell phonemanufacturer.
MARKET CHARACTERISTICS
At the same time Nokia has been adapting its pricing policy,it has also reevaluated its lineup of cell phone designs aswell. Very quickly, they increased the number of new phonedesigns being introduced in 2004. Among them are several ofthe clamshell variety.
The answer to their design issues is not so simple asjust migrating over to the clamshell design. Cell phones havebecome so much more than just voice-communication devices.New cell phone models now offer a wide range of option possi-bilities, including text messages, digital cameras, voice recogni-tion, and PDA functionality. It is a safe assumption that in thevery near future we will see a ‘‘convergence’’ of such functionsand options to the point where we take for granted that all cellphones would offer them. Nokia has shown they are commit-ted to adequate research and development spending (Exhibit8), but as their total revenue decreases, this will decline eitherin aggregate or perhaps even as a percentage of sales as well.
Nokia can make a distinction between two separatecategories for the markets in which they participate. Theperception given by the press and trade journals is thattastes for cell phone designs and functions are similar theworld over. One exception might be the popularity of the‘‘push-to-talk,’’ walkie-talkie feature in the United States, buteven this is expected to spread to other markets. However,a difference in purchasing behavior and prioritized needscan be seen between consumers in developed markets anddeveloping markets.
Developed markets, such as the United States, WesternEurope and Japan, consist of consumers for whom cell phoneare now an accepted part of life. The adoption rate is highacross the population (over 60 percent penetration), and pur-chasing habits are now seen to revolve around ‘‘replacement’’occasions. The trend among cell phone users in these mar-kets is to ‘‘trade up’’ to better models with more features,such as color screens, digital cameras, or better ring tones.Often, such purchases are not a necessity. The overall marketshave matured, but sales continue to grow because of this‘‘upgrade cycle.’’
EXHIBIT 8NOKIA R&D EXPENSES
(US$ MM) 2001 2002 2003
Net Sales $ 41,481 $ 39,918 $ 39,172R&D $ 3,970 $ 4,059 $ 5,000% of Sales 9.6% 10.2% 12.8%
Source: Nokia 2003 Financial Statements (www.nokia.com).
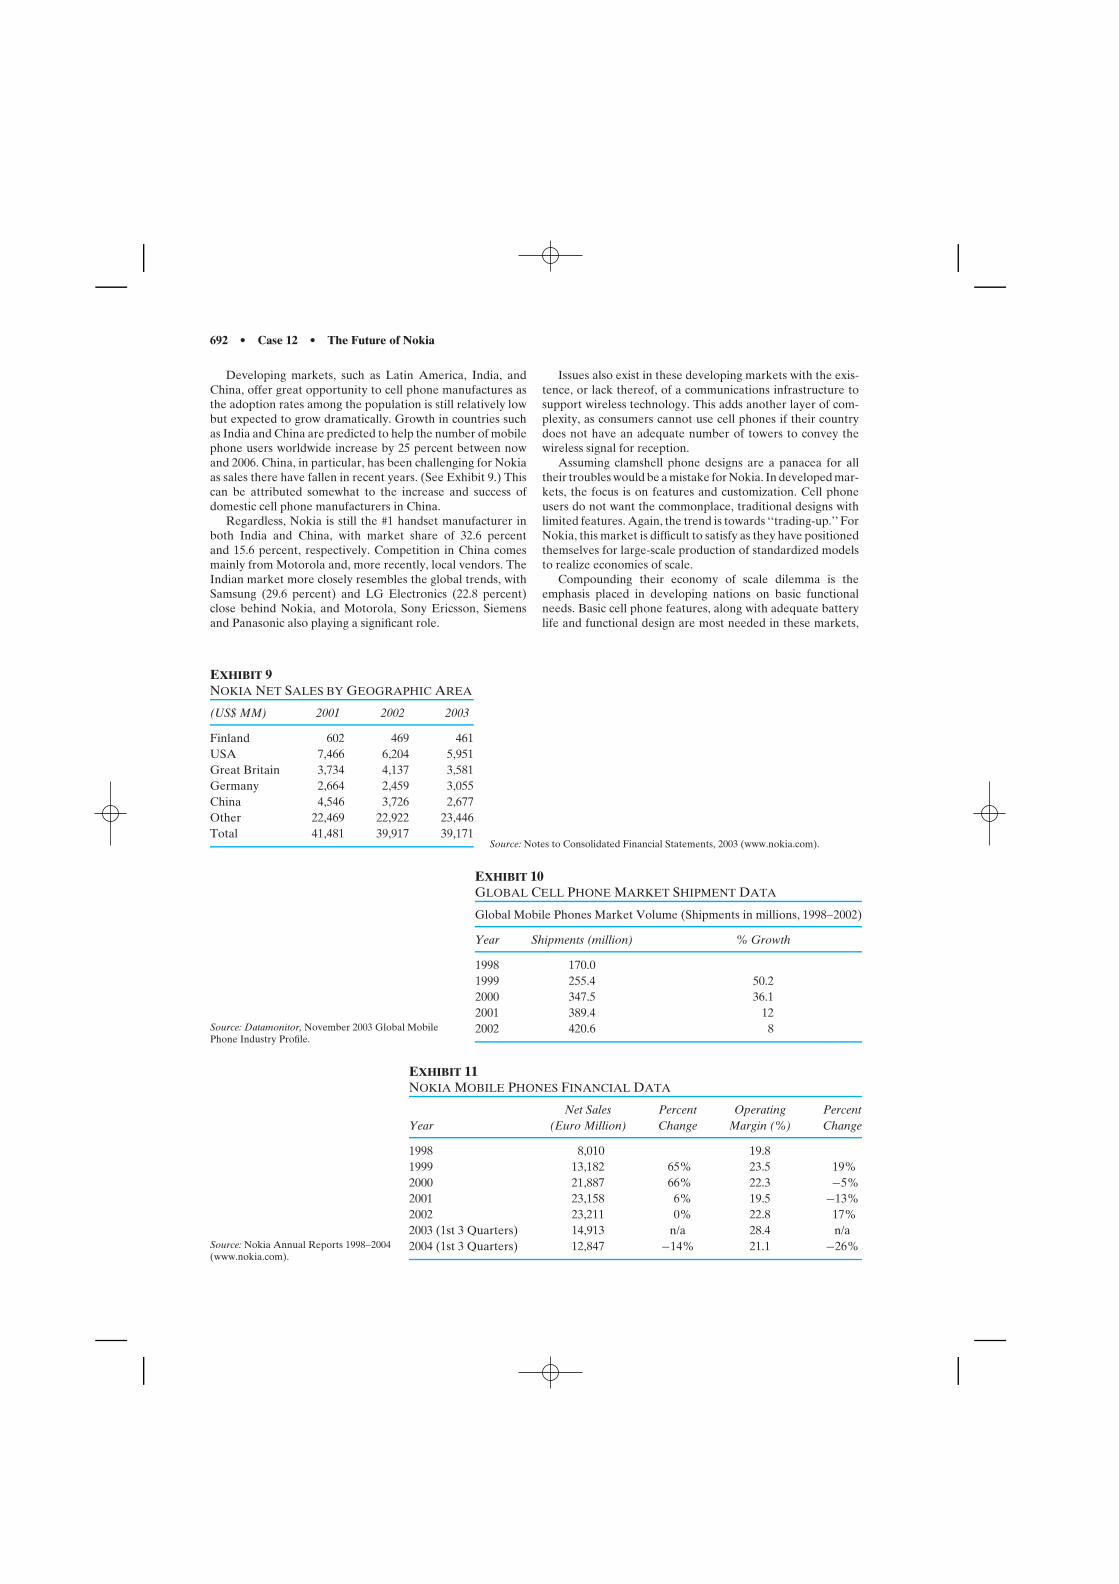
692 • Case 12 • The Future of Nokia
Developing markets, such as Latin America, India, andChina, offer great opportunity to cell phone manufactures asthe adoption rates among the population is still relatively lowbut expected to grow dramatically. Growth in countries suchas India and China are predicted to help the number of mobilephone users worldwide increase by 25 percent between nowand 2006. China, in particular, has been challenging for Nokiaas sales there have fallen in recent years. (See Exhibit 9.) Thiscan be attributed somewhat to the increase and success ofdomestic cell phone manufacturers in China.
Regardless, Nokia is still the #1 handset manufacturer inboth India and China, with market share of 32.6 percentand 15.6 percent, respectively. Competition in China comesmainly from Motorola and, more recently, local vendors. TheIndian market more closely resembles the global trends, withSamsung (29.6 percent) and LG Electronics (22.8 percent)close behind Nokia, and Motorola, Sony Ericsson, Siemensand Panasonic also playing a significant role.
Issues also exist in these developing markets with the exis-tence, or lack thereof, of a communications infrastructure tosupport wireless technology. This adds another layer of com-plexity, as consumers cannot use cell phones if their countrydoes not have an adequate number of towers to convey thewireless signal for reception.
Assuming clamshell phone designs are a panacea for alltheir troubles would be a mistake for Nokia. In developed mar-kets, the focus is on features and customization. Cell phoneusers do not want the commonplace, traditional designs withlimited features. Again, the trend is towards ‘‘trading-up.’’ ForNokia, this market is difficult to satisfy as they have positionedthemselves for large-scale production of standardized modelsto realize economies of scale.
Compounding their economy of scale dilemma is theemphasis placed in developing nations on basic functionalneeds. Basic cell phone features, along with adequate batterylife and functional design are most needed in these markets,
EXHIBIT 9NOKIA NET SALES BY GEOGRAPHIC AREA
(US$ MM) 2001 2002 2003
Finland 602 469 461USA 7,466 6,204 5,951Great Britain 3,734 4,137 3,581Germany 2,664 2,459 3,055China 4,546 3,726 2,677Other 22,469 22,922 23,446Total 41,481 39,917 39,171
Source: Notes to Consolidated Financial Statements, 2003 (www.nokia.com).
Source: Datamonitor, November 2003 Global MobilePhone Industry Profile.
EXHIBIT 10GLOBAL CELL PHONE MARKET SHIPMENT DATA
Global Mobile Phones Market Volume (Shipments in millions, 1998–2002)
Year Shipments (million) % Growth
1998 170.01999 255.4 50.22000 347.5 36.12001 389.4 122002 420.6 8
Source: Nokia Annual Reports 1998–2004(www.nokia.com).
EXHIBIT 11NOKIA MOBILE PHONES FINANCIAL DATA
Net Sales Percent Operating PercentYear (Euro Million) Change Margin (%) Change
1998 8,010 19.81999 13,182 65% 23.5 19%2000 21,887 66% 22.3 −5%2001 23,158 6% 19.5 −13%2002 23,211 0% 22.8 17%2003 (1st 3 Quarters) 14,913 n/a 28.4 n/a2004 (1st 3 Quarters) 12,847 −14% 21.1 −26%
Case 13 • Maybelline’s Entry into India • 693
but users do not want to sacrifice style and looks either. Inaddition to having to produce numerous models and featurecombinations for developed markets, Nokia also has to havean appropriate range of models for its developing markets,as well, keeping in mind, throughout, the need to maintainNokia’s reputation for quality and stylish design.
MANUFACTURING COMPLEXITIES
Nokia has benefited from its business model of large-scaleproduction at its own global factories to achieve economies ofscale and high profit margins. However, there will be increas-ing pressure to manufacture smaller lots of customized andadapted models as well as pressure to lower production costs.The overhead involved with Nokia’s factory infrastructure willmake such cost goals difficult to achieve. The trend for com-petitors has been to outsource production to low cost factories,many of which are in China. This is compounded by the licens-ing of cell phone technologies that allow such manufacturersto product handsets under their own brand name.
WHAT IS NOKIA TO DO?
Nokia managed to unveil 27 new phones in 2004, 8 short oftheir goal of 35 new models for the year. Jorma Ollila was notthrilled with this, but at least it provided some fresh designs,
and more importantly, several clamshell models for the buyingpublic. Jorma was not happy to see his market share continueto erode away throughout the year, but he knew he would notbe able to turn things around immediately.
The promise of emerging markets such as China and Indialoom large, but does Nokia have what it takes to maintain theirfoothold and manage their costs competitively? For years, thestrength of Nokia had been in the ownership of its factoriesand the expertise of its workers. Would Nokia be able totransfer that knowledge to lower-cost manufacturers in timeto stay on top? Jorma felt confident that they could, but won-dered if that confidence was truly justified (see Exhibits 10and 11).
DISCUSSION QUESTIONS
1. How can Nokia position itself in developing markets tocapture future market share (while maintaining economiesof scale)?
2. What must Nokia do to better position their mobile phonebusiness in developed markets?
3. Can Nokia maintain economies of scale in the developedmarkets? Should it use outsourcing as part of its newstrategy?
� � � � � � � � � � � � � � � � � � � � � � � � � � � � � � �
CASE 13
MAYBELLINE’S ENTRY INTO INDIA
THE COSMETIC INDUSTRY OVERVIEW
India, with a population of over a billion people, is a countryof contrasts. This population can be divided into two majorsubgroups: Urban and Rural. India’s urban population is themain engine that fuels the demand for various cosmetic prod-ucts. Although Indians are strongly attached and committedto their traditions, and culture, the media penetration and theawareness of the western world is changing the tastes andcustoms of India. The ‘morphing’ of India is subtle and thechanges are not visible for the first-time visitor. However,the market liberalization process that began in 1991, alongwith the crowning of three Indians as Miss World and MissUniverse during the preceding four years, have made Indianwomen conscious of their appearance. Consequently, the cos-metic consumption patterns of Indian women have changed,and this trend is fuelling growth in the cosmetic sector.
The Indian cosmetics and toiletries market grew by8.7 percent in current value terms in 2001, with value salesamounting to $2.8 billion. In 1999 the Indian cosmetics andtoiletries market grew 8 percent over 1998. Total value since1995 was 54 percent in current terms, equating to 25 percent inconstant terms. Also, it may be imperative to understand the
This case was prepared by Heather Cipolone, Atul Patil, RengasamyRaja, and Brian Scanlon and updated by Sonia Ketkar of the Fox Schoolof Business and Management at Temple University under the supervisionof Professor Masaaki Kotabe for class discussion rather than to illustrateeither effective or ineffective management of a situation described (2004).
fact that, the current deceleration of the double-digit growthduring the last decade signaled a significant shakeout. Thiswas also a reflection of a difficult year for the Indian econ-omy, beset by an earthquake on January 26 in the state ofGujarat, the slowdown of exports to the US after September11,2001 and the decline of growth in industrial output to wellbelow 5 percent. The decline is also due to the extremely highexcise duty levels, which have remained at 32 percent the pasttwo years, as against a duty of 16 percent attracted by othermass consumption items like soaps, detergents, hair oils, andtoothpastes. The growth in Nail enamels was seven percent in2000-01, while that in lip color was 10 percent.
The increasing size of the middle-class population in India,representing a growth in disposable incomes, has led to moreconsumers for the cosmetics and toiletries market. Such con-sumers are more inclined to purchase higher-priced products.Due to the sluggish economy, at the onset it was very impor-tant to increase sales volume by focusing on every mannerof promotional persuasion, from 2-for-1 deals, through give-aways and fabulous holidays to massive discounts. This cutacross almost every major category and was endemic in themass market. A wry remark from an industry source summedit up well: ‘‘The market has been spoilt by a series of schemesand buyer loyalty is at rock bottom. Customers just wait forthe best bargain on any given day.’’
Most multinationals that entered the market have howeverrevised their estimates of the number of consumers able tobuy their products. Optimism has been tempered by a gradual
694 • Case 13 • Maybelline’s Entry into India
dawning of the fact that middle-class India is not as big or asactive as many marketers had believed.
INTRODUCTION
November 2, 1998 was a rewarding day for Geoff Skingsley.Mr. Skingsley, the managing director of L’Oreal’s Indelorunit, had worked tirelessly to bring L’Oreal’s wholly ownedsubsidiary,—Maybelline to India. Mr. Skingsley said ‘‘Indiais the last major piece in the Asian jigsaw for us because theMaybelline brand has been in virtually every Asian countryand India was the big gap in that puzzle.’’ Furthermore, Mr.Skingsley recalled the long, hard road to get to this point,acknowledging, ‘‘Maybelline was a long development pro-cess.’’ Maybelline faced a difficult situation upon its entry intoIndia, a country already endowed with an established leader inthe cosmetics field, Lakme Lever (a subsidiary of the Unilevercorporation).
COSMETICS CONSUMER CLIMATE OF INDIA
A market research company, Datamonitor, suggests that in theperiod 1994 through 1998 all major categories of the Indiancosmetics and toiletries market have been showing healthygrowth. Consumer expenditure on cosmetics and toiletries isincreasing following a surge in disposable income; this trend,in turn, has led to volume growth. With greater frequency,cosmetics are seen as a necessity rather than a luxury, andthe consumer age profile is changing, with approximately 45percent of the population below 25 years of age. Conversely,India’s population is diverse in terms of lifestyle and spend-ing power—a point requiring careful consideration. Overall,though, despite reports that a third of the population is toopoor to afford an adequate diet, modern industries steadilygained strength.
Finally, another encouraging sign was the view of the IndianSoap and Toiletries Makers Association. They felt that theIndian market had a promising future. It was at a threshold,facing phenomenal opportunities to increase the low levels ofproduct penetration. With such low penetration levels acrosscosmetics and toiletries, it was clear that there was roomfor many brands and manufacturers to profit as consumptionincreases and the market itself grows.
TRADE TARIFFS AND BARRIERS
The climate for international expansion into India was a dif-ficult one in the years from 1947 to 1991. During this time,India’s import and export policies were such that a vast major-ity of goods had to be imported under license. In 1991, Indiainitiated economic reforms to tide over the budget deficit,balance of payments problems and structural imbalances inseveral industry sectors of the economy. Despite these mea-sures, India still imposed high tariffs as well as quantitativerestrictions on imports.
Gradually, these tariffs were reduced in the years follow-ing 1991. Also, in 1994, India decided to allow non-Indiancompanies to import flavor and fragrance compounds andconcentrates into the country for the first time. Prior to 1994,companies could sell individual components (both natural andsynthetic) to India, but the compounding had to be done inthe country. Obviously, this was a favorable event in the eyes
of cosmetics companies as they could now import essentialcompounds directly into the India.
Unfortunately for Maybelline, this ‘‘liberalization’’ becamesluggish in the late 1990s. In 1998, the excise duty for cosmeticsand toiletries was 30 percent and later rose to 32 percent in1999. Also, for cosmetics and toiletries, the effective totalimport tariff worked out to be about 90 percent. Sales taxbecame an issue. Currently, in some Indian states, it is as highas 15 percent. In addition, although peak customs duty ratesand quantitative restrictions on imports of consumer goodshad been reduced to conform to World Trade Organizationrequirements, import duties on raw materials and interme-diaries remained unchanged due to governmental revenuedeficits.
Other restrictions on cosmetics are brought forth by variousgovernmental agencies. The country’s Drugs and CosmeticsAct govern the manufacture and sale of cosmetics and toi-letries, while the Bureau of Indian Standards regulates thequality of products. Packaging of products must feature theprice of the item and legislation exists concerning variousstatutory markings to be made on packs.
POLITICAL CLIMATE
The political climate of India also plays a role in Maybelline’sentry into the country. India is a democracy with a large num-ber of political parties. India’s political system has for severalyears been in transition from one-party dominance to a moresplintered picture (in which regional and caste-based partiescontrol most states) alongside a still unclear political pat-tern at the center. Against this backdrop, a foreign companyhas to navigate the many levels and factions of government.Many times corruption ensues. The greatest immediate threatto India’s governance is not tottering coalition governmentsbut corruption. The combination of a state-run economy andweak political institutions created all too many opportunitiesfor crooked politicos and bureaucrats.
FINANCIAL MARKETS AND INFRASTRUCTURE
In 1998 the financial markets of India were not encouragingfor multinational expansion. In that timeframe, India’s finan-cial sector still could not effectively mobilize and mediatecapital to respond to economic changes. Also, although muchimproved since 1991, India’s equity markets are excessivelythin and volatile, and did little to inspire confidence on the partof domestic or foreign investors. Bond markets are practicallynonexistent. Liberalization of the insurance industry, whichwould greatly improve the investing of India’s substantial sav-ings, has been stymied. Finally, India’s banking system wasflawed, with the dominant state-owned banks still carryingbad loans amounting to 15 to 25 percent of their total.
Another constraint on growth was India’s poor infrastruc-ture. Financing was been difficult. Ambitious plans to improvepower generation, telecommunications, ports, and roads werethwarted by poor policies, indecision, and corruption. Ofeight ‘fast-track’ power projects initiated in 1992, only twowere producing (or close to producing) power. Telecommuni-cations reforms was mired first in massive graft, and then inbattles over regulation; not surprisingly, many major foreigncompanies retreated.
Case 13 • Maybelline’s Entry into India • 695
COMPETITIVE LANDSCAPE
The size of India’s color cosmetics market was $3 billion.While lipsticks accounted for nearly a third of the color cos-metics market at $ 1 billion, the market for nail enamels isestimated at around $1.1 billion. The remainder consists ofproducts such as mascara, eyeliners.
The growth in the $3 billion color cosmetics industry hasdipped to single-digit levels of about eight percent in 2000-2001, from 15 to 20 percent in the previous year. The growth ofindividual brands, however, showed a different trend: Whilebrands like Revlon and Maybelline grew at strong double-digit levels, Lakme has grown at a staid pace. Fired with thezeal of changing the complexion of the cosmetics market, theywere fuelling the change using satellite television, women’smagazines and beauty pageants.
Revlon, as per ORG (value) urban only market for lipsand nails, grew at 57 percent, and Maybelline at 31 percent.Lakme and Elle 18 registered growths of eight percent andone percent, respectively. The growths have been higher inthe case of Revlon and Maybelline, as these were taken on asmaller base, feel industry analysts. In the urban lips and nailsmarket, ORG reported a growth of over 10 percent in 2000,two points behind the 12 percent growth witnessed in 1999.
Brands such as Revlon and Maybelline are seen to beoutperforming market growth by five times and three times,respectively, as per ORG figures: urban plus rural (lips andnails only). However, a case of downtrading was witnessedwith the local unorganized sector bringing the growth ratesdown. The market share of Lakme in lip color stands at 42 per-cent in value, as per ORG. Revlon share was at 10.6 percent,and that of L’Oreal 7.4 percent. In nail color, Lakme share wasat 30.5 percent, while that of Revlon was 5.7 percent. L’Orealshare stands at 3 percent.
The growth, feel industry observers, can be fuelled by moreand more performance based technological innovations. May-belline, for instance, launched Shine Free Liquid Foundation(Face Make-Up). There had also been many initiatives withmini sizes in the market, especially in the nail category. Theseprovided successful short-term initiatives but did not appear asuccessful strategy for longer-term value growth in the marketplace, felt industry observers. Maybelline as a group commit-ted to introducing initiatives, which were new, different, andbetter than what on offer in the Indian cosmetic market. Theseinitiatives represented the latest technology in lips, nails, faceand eyes and are supported by strong media. This strategyrepresented the best way forward for both consumer choiceand value growth in the urban market.
Industry analysts expects the urban market (lips and nails)to grow at over 10 percent this year (2003), and the overallurban market for lips, nails, face and eye products at over 12percent growth. The market for cosmetics in India is charac-terized by high volume sales of low-end products, while at thesame time the legendary emerging middle-class has generallybeen fuelling demand for premium cosmetics. Most majorcosmetic companies profess the need to tap the upper marketsegment and create exclusive products, but market studiesreveal that most cosmetic users are unwilling to cough upmore to buy these exclusive products. According to a recentsurvey by Maybelline’s strongest competitor ‘‘Lakme,’’ only
40 percent of Lakme’s customers expressed their willingnessto pay more in anticipation of superior quality.
Despite a lukewarm growth over the past few years, theindustry continues to sustain a healthy growth rate of around20 to 25 percent. The organized sector accounts for more than50 percent share of the Indian color cosmetics market. Themarket is dominated by large domestic players and leadinginternational brands that are fiercely competing against eachother to gain market share. Lakme, a domestic cosmetic brand,currently dominates the Indian cosmetics scene. The indus-try is witnessing a clash between the market leader Lakmeand an array of leading multi-national companies like May-belline, Revlon, Avon, and Oriflame who have established asignificant presence through the launch of their internationalproduct lines and a growing popularity for their brands.
Consumer trends have indicated that the growth in theIndian cosmetic industry has been largely contributed by thelow-to-medium priced categories rather than the premiumcategory. Industry experts note that although both the pre-mium and mass-market segments have registered considerablegrowth, the growth opportunities in the premium segmenthave not been as promising as the mass market segments.Being a niche market the premium segment constitutes asmall portion of the market base and offers less scope forhigher volume. The growth in the segment has been mainly aresult of consumers upgrading from mass to premium productsrather than an increase in consumption per se.
The mass-market segment on the other hand presentsbetter prospects and a higher scope for increasing volumes.The segment constitutes a much higher market base. Becauseof the low price, products in these categories are more likelyto be tried by consumers than products in the premium seg-ment. The market as a whole remains largely untapped andrepresents huge growth opportunities for companies. Whilesome top players like Lakme have major presence in both themass and premium market segments others like Maybellinehave focused on the mass-premium end. Most companies relyon conventional channels of distribution like retail markets.However players like Avon and Oriflame through their net-work of well-trained representatives have concentrated ondirect marketing.
Retail Marketing
Lakme is well established in the Indian cosmetics marketand has been a popular brand with three generations ofwomen. The brand has been around for more than half acentury now and has led the market over the years. Ownedby the Indian subsidiary of Unilever—Hindustan Lever Lim-ited (HLL)—Lakme Lever currently dominates the Indiancolor cosmetics scene with over 50 percent in market share. Inthe color cosmetics market Lakme offers a variety of productsranging from the popularly priced mass range under the ‘‘Elle-18’’ brand name to the mid-priced to premium products under‘‘Ultra,’’ ‘‘On Top Of The World,’’ and ‘‘Orchid’’ ranges.
Priced at a premium to the Ultra and Elle 18 ranges, Topof the World, has been Lakme’s response in taking on Inter-national players like Maybelline while supplementing andproviding synergy to the Lakme portfolio. The range consistsof products with new formulations and additional features like
696 • Case 13 • Maybelline’s Entry into India
the vitamin-enriched lipstick and long-stay nail enamel thatenhance the Lakme brand and promote a superior image withtangible consumer benefits in tune with international players.
Elle 18, Lakme’s mass brand, dominates the Indian masscolor cosmetics market with its affordable pricing and easyavailability. The range targets the young and trendy teenagesegment. Positioned as an economically priced ‘‘rebel’’ brandfor the youth, Elle 18 is the only organized brand in thissegment. Elle 18 accounts for about 30 percent of Lakme’scolor cosmetic sales and enjoys a strong market share ofover 25 percent. Elle 18 products are sold in the eye, lip andnail category. The brand has registered a huge growth andaccounts for over 45 percent share of the nail enamel category.
As one retail consultant notes, with the launch of manynew products and several international brands, the Indiancosmetics market is approaching product quality parity and toa certain extent price parity. Therefore it has become essentialfor companies to look into the service element to differentiatetheir brands. Lakme has leveraged its brand name by estab-lishing a chain of beauty salons across India through whichthe company makes the brand interact with its customers andprovide them with expert service using well-trained beauti-cians. The salons help Lakme strengthen its brand and acquirenew customers. The company also hopes to develop customerrelationships and brand loyalty while allowing it to exper-iment with new products. Apart from print and televisionmedia, Lakme uses major fashion events like the Lakme IndiaFashion Week to actively promote its products. It organizes aseries of workshops and fully equipped Lakme salons at thevenue and comes out with a special range of cosmetics for thefashion week. Over the years, Lakme Lever has established astrong presence in the retail front. Both Lakme and Elle-18brands enjoy a combined distribution strength that spans over65,000 outlets throughout the country.
Revlon holds the second largest share of the Indian colorcosmetics market. Launched as a joint venture between ModiMundi Pharma and Revlon, USA, Modi Revlon accountsfor over 20 percent share of the domestic color cosmeticsmarket. The company has registered a strong growth rateof about 50 percent in the past few years. This has been aresult of Modi Revlon’s efforts to restructure and revampits operations through a plan that calls for achieving highercost efficiencies, emphasizes indigenized production and anenhanced distribution network. While it continues to importchemicals and certain packaging material, three-fourths of itsproduction is localized allowing it to reduce costs and saveon duties. It restructured its sales teams to focus on specificproduct categories and tap unit sales in smaller towns. Revloncurrently accounts for 19 percent of the domestic lipstick mar-ket and 12 percent of the nail enamel market. Lipsticks havebeen the best selling product line with Revlon’s color cos-metics portfolio. Modi Revlon intends to consolidate its retailstrength in the premium segment and increase the numberof Beauty Advisors. It aims to drive growth in the premiumsegment through its ColorStay brand, which includes severalnew launches.
In December 2002, Revlon entered the mass color cosmet-ics market with its StreetWear cosmetics brand. The brandtargets the fashion seeking teenage population between theages of 17 to 22. StreetWear is also globally positioned at theyoung and trendy shoppers and includes several products in
the face, eye, lip and nail color categories. Modi Revlon hascarefully positioned the brand to avoid any cannibalizationof sales from its flagship Revlon brand and has affordablypriced the products to gain market access. The company’sdecision to enter the teenage segment with an internationalbrand has been to directly compete with the mass marketleader Lakme’s Elle 18 brand. The StreetWear range consistsof eight products, which include categories that Elle 18 doesnot have a presence, like face makeup, and eye shadow.
Revlon also introduced mini ranges of its color cosmeticsto drive volumes in the mass segment. The company’s strategyto launch relatively lower priced smaller packs of its lip andnail products has been seen as a setback to Lakme’s unbeat-able price advantage. This has been a strategy that very fewplayers could afford to circumvent. With retail presence in10,000 stores Revlon is beefing up its distribution networkto be able to compete against Lakme and Elle 18 productscurrently stocked in 65,000 outlets. Modi Revlon has set outto undertake a market driven and well-researched approachto introduce almost all Revlon products in the Indian marketwithin the next five years. Depending on the market needs, italso plans to increase its current level of investments in thedomestic market.
Direct Marketing
The Indian color cosmetics scene has also witnessed con-siderable presence and aggressive marketing efforts by ahost of direct to consumer and network marketers. The seg-ment includes international players like Avon, Amway, andOriflame and domestic players like Lakme Lever and Modi-Care. When compared to the retail market, the direct sellingaccounts for a relatively smaller segment of the domesticcolor cosmetics market. Industry reports have ranked thedirect selling segment among the highest in term of growthrate. The segment has registered an astonishing growth rateof 54 percent. Driven by consumer needs, companies likeOriflame have invested in world-class technical centers andmanufacturing facilities to meet stringent international stan-dards for the development and manufacture of cosmetics.Currently Amway leads the direct marketing category withannual sales of Rs 6.25 billion. While top players like ModiRevlon are still contemplating entry into the direct sellingmarket, industry giant HLL markets its color cosmetics rangeunder the Aviance brand. The thrust for HLL has been toeducate consumers and offer them with customized solutions.While the range of customized beauty solutions are developedat the Unilever Beauty and Skin Innovation Center in U.S.the products are locally manufactured. Aviance currently hasa base of 75,000 specially trained consultants. Adopting apricing based on value HLL aims to go down the populationstrata reaching a larger target audience.
MAYBELLINE’S GLOBAL STRATEGYAND POSITIONING
Maybelline Inc. markets a variety of products across fourbroad categories, the eye make-up products, facial make-upproducts, lip products and Nail products. The company oper-ates under the global cosmetic and toiletries industry of whichthe U.S. segment has the world’s largest market share. Theindustry is characterized as being very mature and highlycompetitive with the top players fiercely competing against
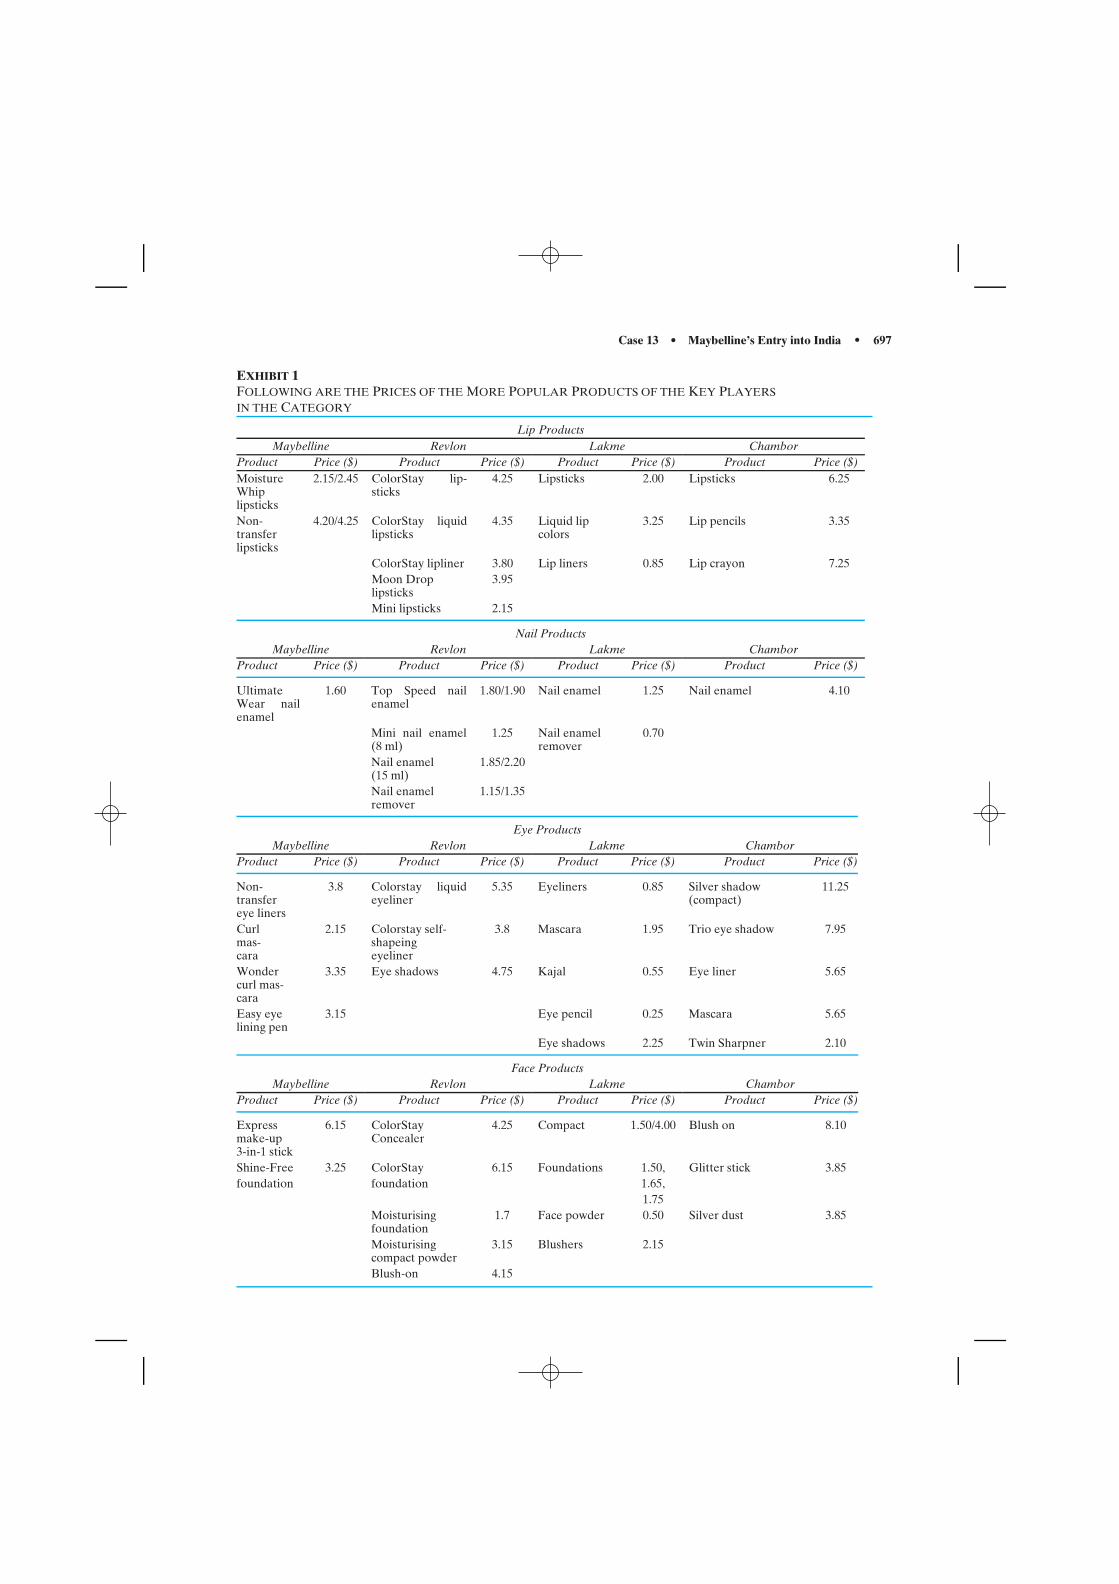
Case 13 • Maybelline’s Entry into India • 697
EXHIBIT 1FOLLOWING ARE THE PRICES OF THE MORE POPULAR PRODUCTS OF THE KEY PLAYERSIN THE CATEGORY
Lip ProductsMaybelline Revlon Lakme Chambor
Product Price ($) Product Price ($) Product Price ($) Product Price ($)MoistureWhiplipsticks
2.15/2.45 ColorStay lip-sticks
4.25 Lipsticks 2.00 Lipsticks 6.25
Non-transferlipsticks
4.20/4.25 ColorStay liquidlipsticks
4.35 Liquid lipcolors
3.25 Lip pencils 3.35
ColorStay lipliner 3.80 Lip liners 0.85 Lip crayon 7.25Moon Droplipsticks
3.95
Mini lipsticks 2.15
Nail ProductsMaybelline Revlon Lakme Chambor
Product Price ($) Product Price ($) Product Price ($) Product Price ($)
UltimateWear nailenamel
1.60 Top Speed nailenamel
1.80/1.90 Nail enamel 1.25 Nail enamel 4.10
Mini nail enamel(8 ml)
1.25 Nail enamelremover
0.70
Nail enamel(15 ml)
1.85/2.20
Nail enamelremover
1.15/1.35
Eye ProductsMaybelline Revlon Lakme Chambor
Product Price ($) Product Price ($) Product Price ($) Product Price ($)
Non-transfereye liners
3.8 Colorstay liquideyeliner
5.35 Eyeliners 0.85 Silver shadow(compact)
11.25
Curlmas-cara
2.15 Colorstay self-shapeingeyeliner
3.8 Mascara 1.95 Trio eye shadow 7.95
Wondercurl mas-cara
3.35 Eye shadows 4.75 Kajal 0.55 Eye liner 5.65
Easy eyelining pen
3.15 Eye pencil 0.25 Mascara 5.65
Eye shadows 2.25 Twin Sharpner 2.10
Face ProductsMaybelline Revlon Lakme Chambor
Product Price ($) Product Price ($) Product Price ($) Product Price ($)
Expressmake-up3-in-1 stick
6.15 ColorStayConcealer
4.25 Compact 1.50/4.00 Blush on 8.10
Shine-Free 3.25 ColorStay 6.15 Foundations 1.50, Glitter stick 3.85foundation foundation 1.65,
1.75Moisturisingfoundation
1.7 Face powder 0.50 Silver dust 3.85
Moisturisingcompact powder
3.15 Blushers 2.15
Blush-on 4.15
698 • Case 13 • Maybelline’s Entry into India
each other to increase their market share. Maybelline line ofproducts is primarily mass marketed in the several product cat-egories it serves. The company is a leader in the mass-marketcolor cosmetics business.
The global cosmetic business is about $23.4 billion in sales.L’Oreal Corporation owns 23 percent in 1999. Maybellineis the number one mass-market brand globally, holdingabout 18.9 percent of a $3 billion market. Marketers con-tinue to strive hard to develop a culture that matches thepersonality of the target audience who tend to evaluatethe brand based upon their personal image. In order tostrengthen brand equity in a highly competitive market place,adopting the right culture has become an important fac-tor in present-day marketing strategies. Creating a cultureof constant need to enhance natural appearance and desirean improved self, cosmetic companies struggle against eachother to encourage women to work miracles adapting theirbrands.
L’Oreal’s Goal was to make Maybelline a leading globalmass-market brand. Its international business contributes toover 45 percent of total sales represented in about 90 coun-tries worldwide. Maybelline is positioned as the leader ofmass-market cosmetics targeted at women between the agesof 15–49 at a reasonable price. It is globally branded withthe ‘‘Urban American Chic Image.’’ Maybelline has sinceachieved a third position in the India market with this posi-tion. Lakme Lever commands a 45 percent market share andModi Revlon is third with about 10 percent.
Maybelline’s leadership position is significantly attributedto its global branding approach, allowing it to speed mar-ket growth in the mature consumer products industry. It hasmade every effort to position and promote its product linesunder trendy ‘‘New York’’ Maybelline brand image. Glob-ally, Maybelline has been heavily promoting its trendy NewYork image. The company has effectively aligned its strategywith that of its parent L’Oreal in conveying the appeal ofdifferent cultures through its products. Instead of taking ahomogenous brand approach to making the products accept-able across international markets, the company has stressedthe importance of embodying their country of origin. WithMaybelline, upon its acquisition, L’Oreal began a completemakeover including moving the headquarters from Memphis,TN. to New York City in an effort to stamp the ‘‘urban Ameri-can chic’’ image all over Maybelline products to promote theirU.S. origins. Maybelline has been making efforts to reach abigger target audience across a broader range of income andcultures.
Maybelline’s international strategy emphasizes its Ameri-can heritage. It continues to promote its ‘‘Trendy New York’’image in all countries. This global strategy promotes a uniformimage and strong brand recognition worldwide. In India, May-belline is following the international strategy with a New Yorkattitude. The American image in India was found to have apositive effect. Maybelline has continued with the same globalbranding in India using supermodel Christy Turlington andSarah Michelle Gellar to promote its products. Ads wereprinted in Indian editions of Elle, Cosmopolitan, and Feminaand TV spots were conducted on Star Plus.
This approach has proven to work by placing Maybellinein second position. However, in order to succeed in this mar-ket, Maybelline needs to be able to be price competitive with
other local products. Pricing is critical in India. Currently,India has positioned Maybelline as an aspirational productwith a premium price.
PRICING
Maybelline, a subsidiary of L’Oreal, prices its products basedon the country in which it is selling them. In the United States,Maybelline is priced mid-range of the cosmetics market withits main competitor being Revlon. It is sold everywhere fromdrug stores to discount cosmetics stores to boutiques. Pricesfor various products range from $3.50 to $7.00. However, inemerging markets such as India, Korea, and Russia, May-belline is viewed as a premium brand. Maybelline competeswith Lakme, an Indian company, and Revlon, another UScompetitor. Lakme leads the market mainly due to the largerprice differentiation.
One of the key components to Maybelline’s success forIndia is to have the right distribution and the right pricing-value relationship. Although the Indian cosmetic market isgrowing at a rate of 15 to 20 percent per year, pricing dynam-ics are very complex. India still has widespread poverty andan extremely low per capita equating to extreme price con-scious individuals. Maybelline is having a difficult time beingconsistent with the pricing strategy that they maintain in othermarkets as being affordable. A couple of issues are influ-encing this: high import tariffs and high taxes of about 15percent on consumer products. Tariff rates were about 450percent in the 1990’s, which then declined to about 32 per-cent in 2001 for skin care and cosmetics toward the end ofthe 1990’s. Tariffs are expected to go down again since Indiais now a member of the World Trade Organization (WTO)to about 15 percent, which will then make Maybelline moreaffordable and therefore, more competitive with the currentmarket.
Competitive Pricing
Exhibit 1 displays a pictorial view of the competitive pric-ing in this market. The mass market for lipsticks (pricerange: $2 to $4.50) is 43 percent of the total lipsticks mar-ket. The prices that range below $2 represent roughly 48percent of the market. The mass premium segment (pricerange $5 and higher) is just 9 percent of the total lipsticksmarket. Maybelline has a market share of 80 percent, accord-ing to ORG, with the balance held by Revlon, Chambor, andLakme’s Orchid.
Lakme’s product range consists of the Elle-18 line (priced ataround $1) and the medium-priced Ultra line (at around $1.75)to the premium Orchid range of color cosmetics (priced in therange of $3.5 to $5.5). French multinational L’Oreal Indiaprices range from $6.5 to $32. By the end of 2001, it expectsnearly 50 cities to be selling the products. Maybelline recentlyintroduced an Express Make-Up priced at $6.5. L’Oreal’sproduct of makeup currently available in the market is pricedat the premium end at $12.5. The brand is currently availablein 4,000 outlets. Maybelline New York globally has 900 SKUsin colour cosmetics. In competition with L’Oreal’s Maybellinerange of ‘transfer-resistant’ lipsticks, Revlon has rolled out‘ColorStay’ lipsticks priced at $6. The lipsticks are thus at ahigh premium to the Maybelline range priced at $4.5. The nailenamel market, one of the fastest growing segments in thecosmetic industry, is segmented into three groups:
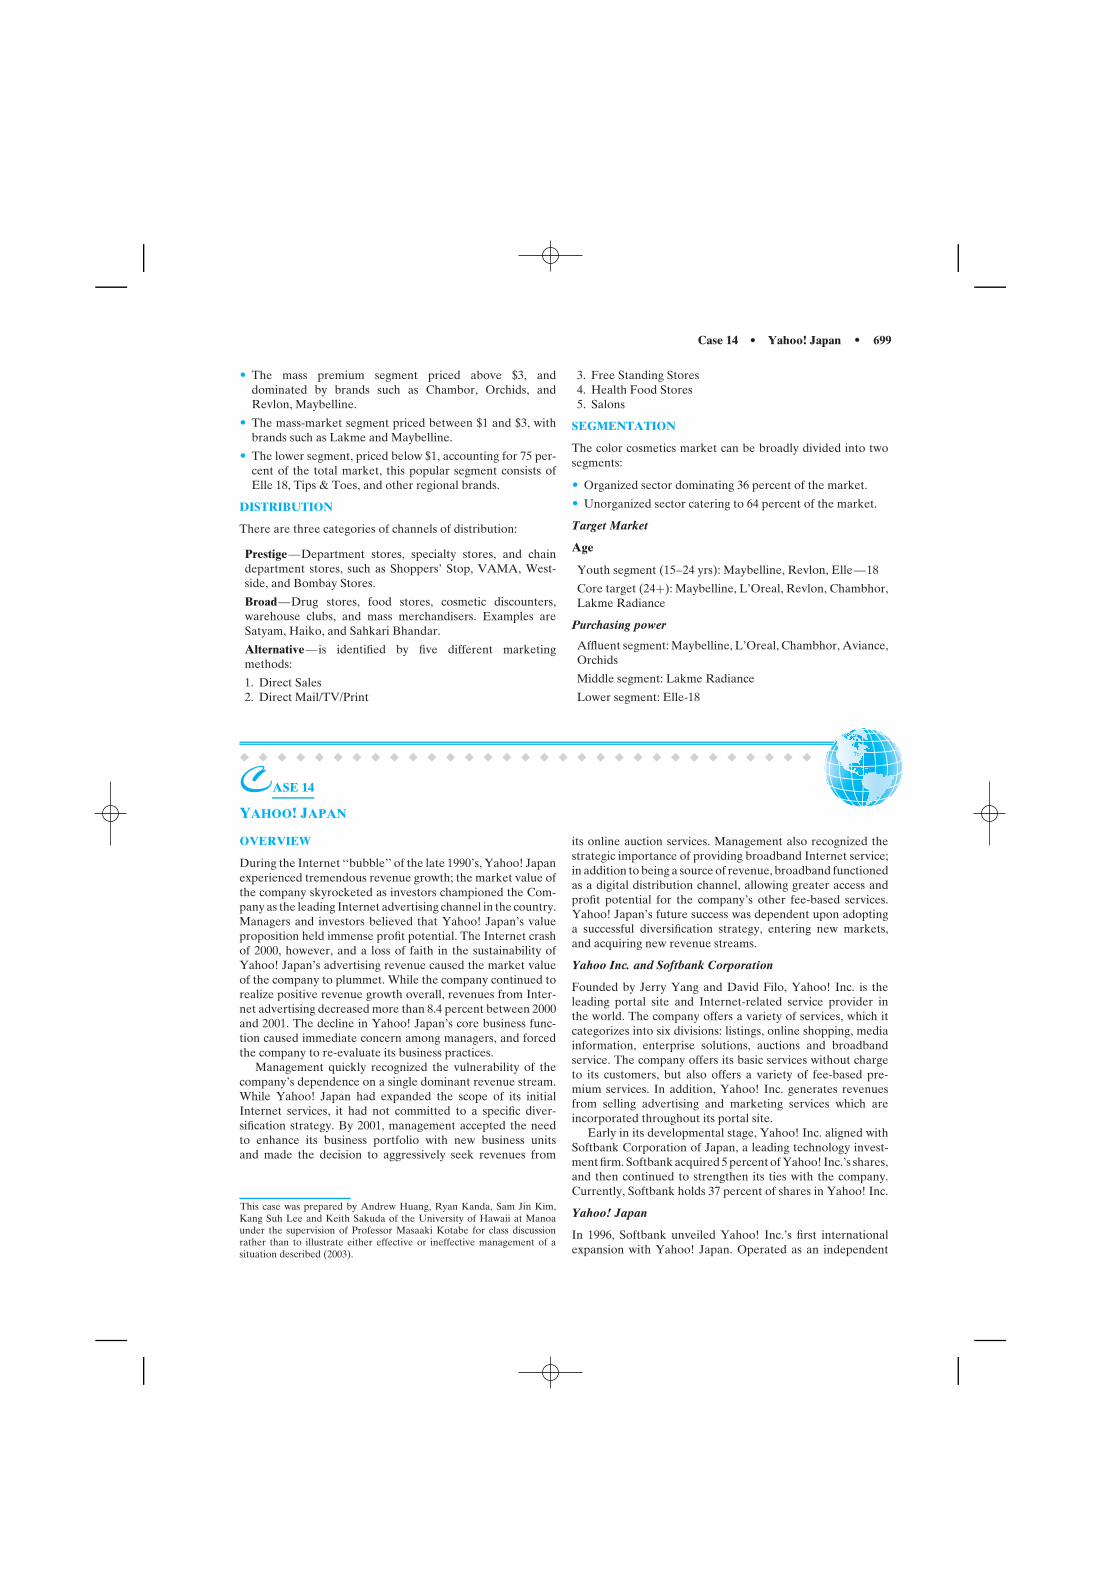
Case 14 • Yahoo! Japan • 699
• The mass premium segment priced above $3, anddominated by brands such as Chambor, Orchids, andRevlon, Maybelline.
• The mass-market segment priced between $1 and $3, withbrands such as Lakme and Maybelline.
• The lower segment, priced below $1, accounting for 75 per-cent of the total market, this popular segment consists ofElle 18, Tips & Toes, and other regional brands.
DISTRIBUTION
There are three categories of channels of distribution:
Prestige—Department stores, specialty stores, and chaindepartment stores, such as Shoppers’ Stop, VAMA, West-side, and Bombay Stores.
Broad—Drug stores, food stores, cosmetic discounters,warehouse clubs, and mass merchandisers. Examples areSatyam, Haiko, and Sahkari Bhandar.
Alternative— is identified by five different marketingmethods:
1. Direct Sales2. Direct Mail/TV/Print
3. Free Standing Stores4. Health Food Stores5. Salons
SEGMENTATION
The color cosmetics market can be broadly divided into twosegments:
• Organized sector dominating 36 percent of the market.
• Unorganized sector catering to 64 percent of the market.
Target Market
Age
Youth segment (15–24 yrs): Maybelline, Revlon, Elle—18
Core target (24+): Maybelline, L’Oreal, Revlon, Chambhor,Lakme Radiance
Purchasing power
Affluent segment: Maybelline, L’Oreal, Chambhor, Aviance,Orchids
Middle segment: Lakme Radiance
Lower segment: Elle-18
� � � � � � � � � � � � � � � � � � � � � � � � � � � � � � �
CASE 14
YAHOO! JAPAN
OVERVIEW
During the Internet ‘‘bubble’’ of the late 1990’s, Yahoo! Japanexperienced tremendous revenue growth; the market value ofthe company skyrocketed as investors championed the Com-pany as the leading Internet advertising channel in the country.Managers and investors believed that Yahoo! Japan’s valueproposition held immense profit potential. The Internet crashof 2000, however, and a loss of faith in the sustainability ofYahoo! Japan’s advertising revenue caused the market valueof the company to plummet. While the company continued torealize positive revenue growth overall, revenues from Inter-net advertising decreased more than 8.4 percent between 2000and 2001. The decline in Yahoo! Japan’s core business func-tion caused immediate concern among managers, and forcedthe company to re-evaluate its business practices.
Management quickly recognized the vulnerability of thecompany’s dependence on a single dominant revenue stream.While Yahoo! Japan had expanded the scope of its initialInternet services, it had not committed to a specific diver-sification strategy. By 2001, management accepted the needto enhance its business portfolio with new business unitsand made the decision to aggressively seek revenues from
This case was prepared by Andrew Huang, Ryan Kanda, Sam Jin Kim,Kang Suh Lee and Keith Sakuda of the University of Hawaii at Manoaunder the supervision of Professor Masaaki Kotabe for class discussionrather than to illustrate either effective or ineffective management of asituation described (2003).
its online auction services. Management also recognized thestrategic importance of providing broadband Internet service;in addition to being a source of revenue, broadband functionedas a digital distribution channel, allowing greater access andprofit potential for the company’s other fee-based services.Yahoo! Japan’s future success was dependent upon adoptinga successful diversification strategy, entering new markets,and acquiring new revenue streams.
Yahoo Inc. and Softbank Corporation
Founded by Jerry Yang and David Filo, Yahoo! Inc. is theleading portal site and Internet-related service provider inthe world. The company offers a variety of services, which itcategorizes into six divisions: listings, online shopping, mediainformation, enterprise solutions, auctions and broadbandservice. The company offers its basic services without chargeto its customers, but also offers a variety of fee-based pre-mium services. In addition, Yahoo! Inc. generates revenuesfrom selling advertising and marketing services which areincorporated throughout its portal site.
Early in its developmental stage, Yahoo! Inc. aligned withSoftbank Corporation of Japan, a leading technology invest-ment firm. Softbank acquired 5 percent of Yahoo! Inc.’s shares,and then continued to strengthen its ties with the company.Currently, Softbank holds 37 percent of shares in Yahoo! Inc.
Yahoo! Japan
In 1996, Softbank unveiled Yahoo! Inc.’s first internationalexpansion with Yahoo! Japan. Operated as an independent
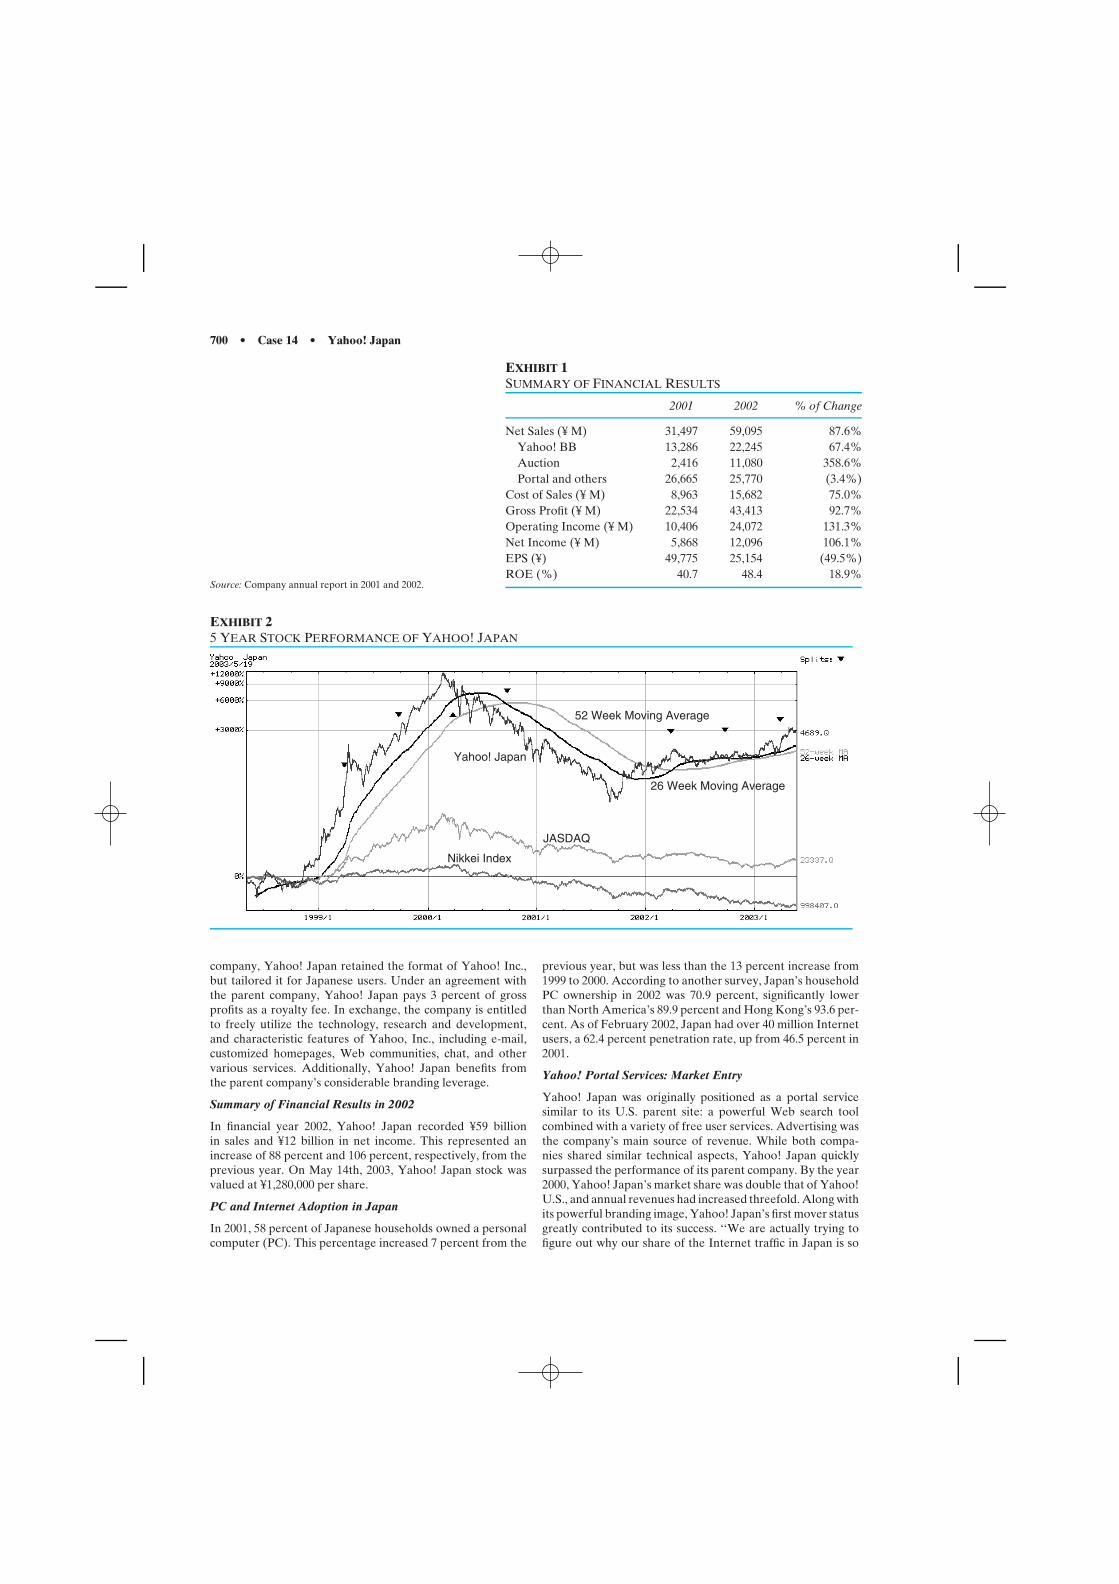
700 • Case 14 • Yahoo! Japan
Source: Company annual report in 2001 and 2002.
EXHIBIT 1SUMMARY OF FINANCIAL RESULTS
2001 2002 % of Change
Net Sales (¥ M) 31,497 59,095 87.6%Yahoo! BB 13,286 22,245 67.4%Auction 2,416 11,080 358.6%Portal and others 26,665 25,770 (3.4%)
Cost of Sales (¥ M) 8,963 15,682 75.0%Gross Profit (¥ M) 22,534 43,413 92.7%Operating Income (¥ M) 10,406 24,072 131.3%Net Income (¥ M) 5,868 12,096 106.1%EPS (¥) 49,775 25,154 (49.5%)ROE (%) 40.7 48.4 18.9%
EXHIBIT 25 YEAR STOCK PERFORMANCE OF YAHOO! JAPAN
Yahoo! Japan
JASDAQ
Nikkei Index
52 Week Moving Average
26 Week Moving Average
company, Yahoo! Japan retained the format of Yahoo! Inc.,but tailored it for Japanese users. Under an agreement withthe parent company, Yahoo! Japan pays 3 percent of grossprofits as a royalty fee. In exchange, the company is entitledto freely utilize the technology, research and development,and characteristic features of Yahoo, Inc., including e-mail,customized homepages, Web communities, chat, and othervarious services. Additionally, Yahoo! Japan benefits fromthe parent company’s considerable branding leverage.
Summary of Financial Results in 2002
In financial year 2002, Yahoo! Japan recorded ¥59 billionin sales and ¥12 billion in net income. This represented anincrease of 88 percent and 106 percent, respectively, from theprevious year. On May 14th, 2003, Yahoo! Japan stock wasvalued at ¥1,280,000 per share.
PC and Internet Adoption in Japan
In 2001, 58 percent of Japanese households owned a personalcomputer (PC). This percentage increased 7 percent from the
previous year, but was less than the 13 percent increase from1999 to 2000. According to another survey, Japan’s householdPC ownership in 2002 was 70.9 percent, significantly lowerthan North America’s 89.9 percent and Hong Kong’s 93.6 per-cent. As of February 2002, Japan had over 40 million Internetusers, a 62.4 percent penetration rate, up from 46.5 percent in2001.
Yahoo! Portal Services: Market Entry
Yahoo! Japan was originally positioned as a portal servicesimilar to its U.S. parent site: a powerful Web search toolcombined with a variety of free user services. Advertising wasthe company’s main source of revenue. While both compa-nies shared similar technical aspects, Yahoo! Japan quicklysurpassed the performance of its parent company. By the year2000, Yahoo! Japan’s market share was double that of Yahoo!U.S., and annual revenues had increased threefold. Along withits powerful branding image, Yahoo! Japan’s first mover statusgreatly contributed to its success. ‘‘We are actually trying tofigure out why our share of the Internet traffic in Japan is so
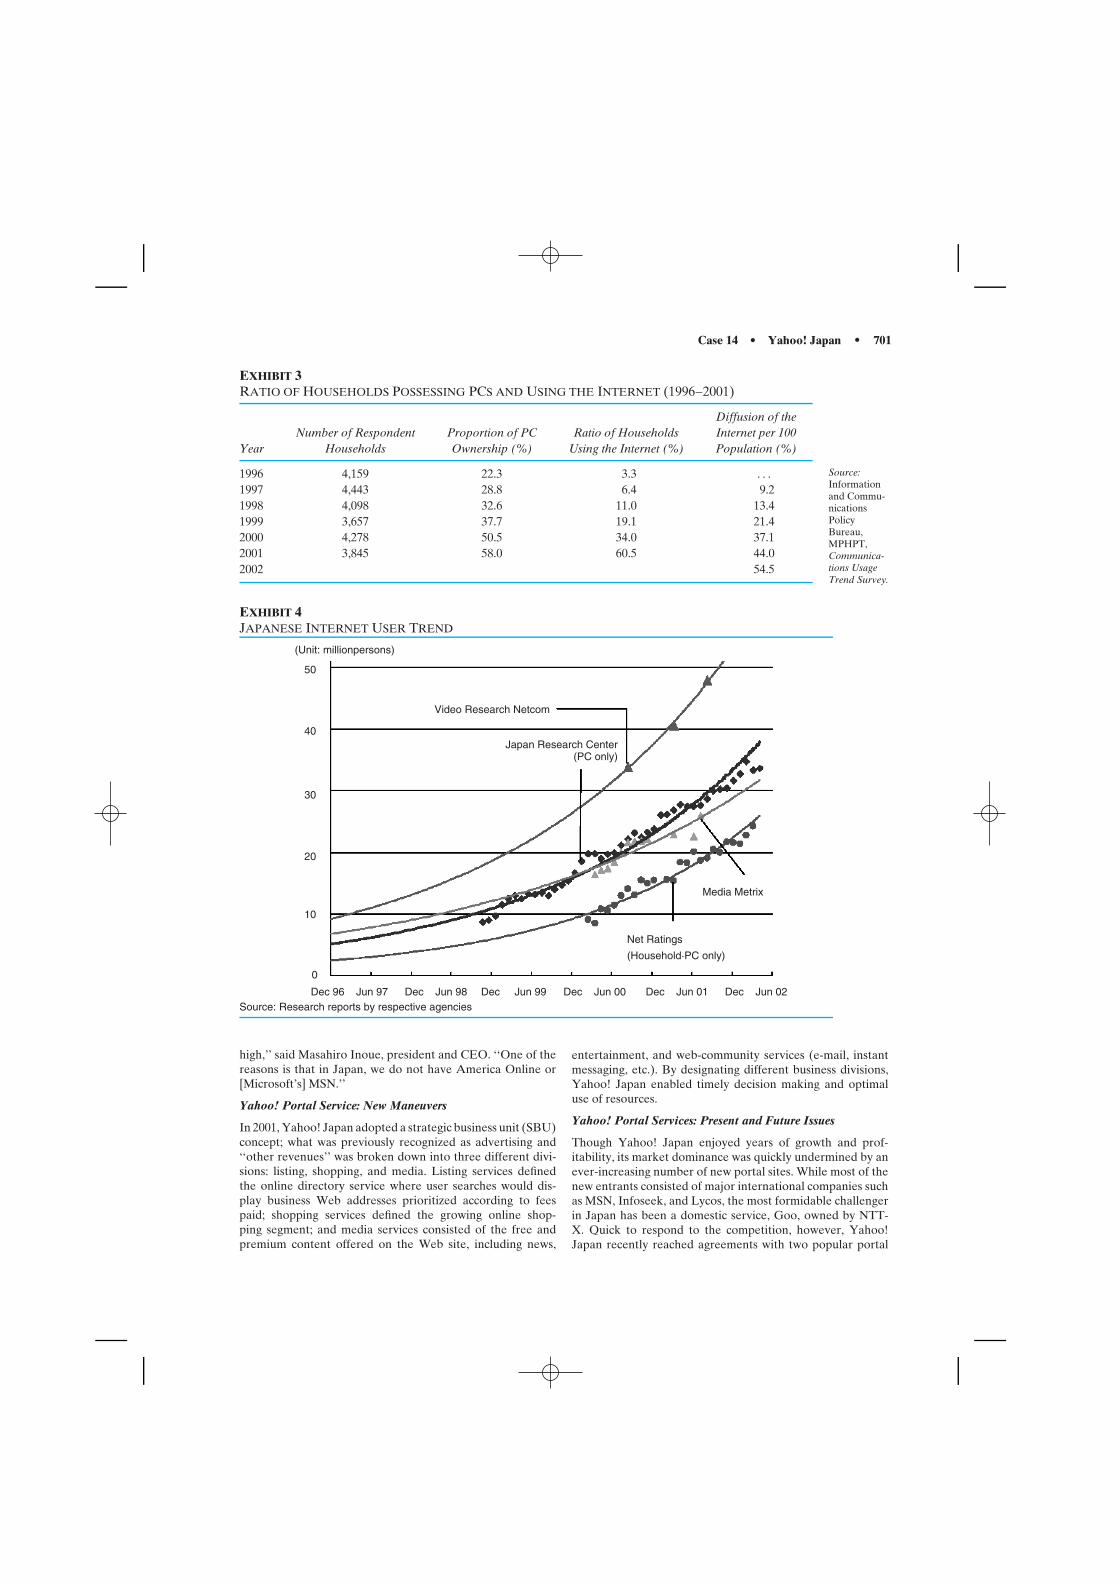
Case 14 • Yahoo! Japan • 701
EXHIBIT 3RATIO OF HOUSEHOLDS POSSESSING PCS AND USING THE INTERNET (1996–2001)
Diffusion of theNumber of Respondent Proportion of PC Ratio of Households Internet per 100
Year Households Ownership (%) Using the Internet (%) Population (%)
1996 4,159 22.3 3.3 . . .
1997 4,443 28.8 6.4 9.21998 4,098 32.6 11.0 13.41999 3,657 37.7 19.1 21.42000 4,278 50.5 34.0 37.12001 3,845 58.0 60.5 44.02002 54.5
Source:Informationand Commu-nicationsPolicyBureau,MPHPT,Communica-tions UsageTrend Survey.
EXHIBIT 4JAPANESE INTERNET USER TREND
Source: Research reports by respective agencies
(Unit: millionpersons)
Video Research Netcom
Japan Research Center (PC only)
Media Metrix
Net Ratings
(Household·PC only)
Dec 96 Jun 97 Dec Jun 98 Dec Jun 99 Dec Jun 00 Dec Jun 01 Dec Jun 02
50
40
30
20
10
0
high,’’ said Masahiro Inoue, president and CEO. ‘‘One of thereasons is that in Japan, we do not have America Online or[Microsoft’s] MSN.’’
Yahoo! Portal Service: New Maneuvers
In 2001, Yahoo! Japan adopted a strategic business unit (SBU)concept; what was previously recognized as advertising and‘‘other revenues’’ was broken down into three different divi-sions: listing, shopping, and media. Listing services definedthe online directory service where user searches would dis-play business Web addresses prioritized according to feespaid; shopping services defined the growing online shop-ping segment; and media services consisted of the free andpremium content offered on the Web site, including news,
entertainment, and web-community services (e-mail, instantmessaging, etc.). By designating different business divisions,Yahoo! Japan enabled timely decision making and optimaluse of resources.
Yahoo! Portal Services: Present and Future Issues
Though Yahoo! Japan enjoyed years of growth and prof-itability, its market dominance was quickly undermined by anever-increasing number of new portal sites. While most of thenew entrants consisted of major international companies suchas MSN, Infoseek, and Lycos, the most formidable challengerin Japan has been a domestic service, Goo, owned by NTT-X. Quick to respond to the competition, however, Yahoo!Japan recently reached agreements with two popular portal
702 • Case 14 • Yahoo! Japan
companies, Google and Overture. Under the agreement, bothpaid-search engines would provide Yahoo! Japan with pre-mium listings, with revenues generated to be divided betweenthe partners.
As a result of heightened competition and diluted marketpower, Yahoo! Japan’s online advertising revenues dropped.While the shopping division was not strongly affected by thedecrease in revenue, listing and media division earnings fellprecipitously: 80 percent to 90 percent of their revenues weredirectly linked to advertising. Such circumstances continuedto raise concern over the long-term sustainability of Yahoo!Japan’s portal services.
Another concern for Yahoo! Japan is the growing marketin mobile Internet access. Led by NTT DoCoMo’s i-mode ser-vice, Japan was one of the first countries to offer viable Internetaccess over mobile phones. Major portals like MSN and AOLare now providing search engines and content services, withYahoo! Japan also vying for space in the mobile realm. Asthe contest for the market intensifies, Yahoo! Japan is likelyto develop more innovative services that are compatible withmobile systems.
Yahoo! Japan may also come under pressure from inter-nal sources. Its major shareholder, Softbank, is aggressivelyexpanding its investments in a number of Asia- region Internetventures. Many of these ventures are Yahoo! Japan’s directcompetitors. This may create future conflicts of interest asthe companies begin to cannibalize each other’s revenues andmarket share.
Yahoo! Auctions: Market Entry
In September of 1999, Yahoo! Japan entered the online auc-tion market in Japan. An online auction is a virtual forumwhere individuals and businesses interact, and goods and ser-vices can be bid upon, bought, and sold. For this service,the Internet ‘‘marketplace’’ provider generally receives a per-centage fee of sales as commission. Historically, this type oftransaction had been eschewed by the Japanese consumer;second-hand goods and the lack of a branded store identitywould have condemned this service to failure. Therefore, forYahoo! Japan’s online auction venture to be a success, a fun-damental cultural shift had to occur. This shift occurred inJapan for a number of reasons, including: Japan’s prolongedeconomic slump; the emergence of environmental awarenessand the growing popularity of ‘‘recycle’’ second-hand shops;and the strong, enduring collectibles market.
Yahoo! Japan began its online auction service at the insis-tence of Jerry Yang, the co-founder of Yahoo! Inc. Yangrealized that the auctions niche had yet to be filled there. TheCompany’s goal was to be the first mover into the Japanesemarket—a key strategic move as Yahoo! Japan was soon todiscover.
Yahoo! Auctions: Competition and the Case of eBay
In February 2000, eBay entered the Japanese online auctionmarket, five months after Yahoo! Japan. eBay is the worldonline auctions provider leader, controlling the number onemarket share in the eighteen countries it operates in. Severalother smaller-market Japanese companies also operated inthe online auctions arena, namely Rakuten Ichiba online malland Bidders online auctions site. eBay immediately struggledwith its Japan auction venture, and could attain no higher than
a fourth place market position; Yahoo! Japan auctions werenumber one. By March 2002, barely two years after its entry,eBay pulled out of the Japanese market, citing its continuedlosses and Yahoo! Japan’s market dominance as reasons forits departure.
While a great deal of Yahoo! Japan’s success can beattributed to its first mover status and the leveraging of itscompany branding and integrated networks, the company’spricing strategy was a key element. In contrast to eBay, whichopened its services with a percentage fee charge (between 1.25percent and 5 percent of the transaction value); Yahoo! Japanbegan in September 1999 by offering its services for free.Only in May 2001, twenty months after its introduction, didYahoo! Japan implement a ¥280 membership fee for users ofits auction services. This was followed by a ¥10 per item listingcharge beginning in April 2002, and a 3 percent transaction feein May 2002. Each fee imposed resulted in a short-term dropin users; shortly thereafter, however, the company regainedits users and continued its dominant position in the Japanmarket. Currently, Yahoo! Japan controls over 80 percent ofthe online auctions market in Japan.
Yahoo! Auctions: Future Issues
As of March 2003, there are 10.34 million unique users thatbrowse Yahoo! Japan auction sites, and 2.6 million registeredusers that buy and sell items. The site averages over 3.35million items listed at the end of each month, and cyclesthrough 11.09 million items during that time. Over ¥35.8 bil-lion (approx. $303 million) in transactions volume occurs eachmonth, with a successful list-to-sell rate between 42 percentand 53 percent. Additionally, 1,174 online merchants havesigned with Yahoo! Japan to take advantage of its onlineauction services.
Yahoo! Japan online auctions segment must be concernedwith possible moves made by its competitors. A mergerbetween the number two and three market share holders,Rakuten and Bidders, has been rumored for some time. Fur-thermore, the re-entry of eBay into the Japanese marketremains a strong concern: eBay is the largest online auctioncompany in the world and Japan is the second-largest Internetmarket in Asia. Before its departure, eBay had also consid-ered acquiring Rakuten or Bidders, and may do so upon itsreentry.
Another concern is the potential increase in illegal orfraudulent buying and selling practices over online trans-actions. Such practices would erode consumer faith in theonline forum and drive down demand. In November 2002, theJapanese legislature passed law reforms intended to preventInternet auction crimes. Independently, Yahoo! Japan alsoimposed a strict registering system which confirms identitiesof participants and maintains all auction records. Further-more, Yahoo! Payment was created, which acts as an escrowservice to protect both buyers and sellers.
Yahoo! BB: Market Entry
Prior to Yahoo! BB’s entry into the broadband market, DSLpenetration in Japan was relatively low. At the time of thedivision’s entry, there were approximately 500,000 users ofDSL nationwide, according to the Japanese Ministry of PublicManagement, Home Affairs, Posts, and Telecommunications.At that time, the average monthly fee for DSL service was
Case 14 • Yahoo! Japan • 703
around ¥6,000, a cost great enough to discourage high rates ofsubscription.
Upon entering the market, however, Yahoo! BB offeredan introductory rate of ¥2,280 a month. The company’s servicewas cheaper and faster than the market share leader’s 64 kbpsISDN service. In January 2002, three months after its entry,Yahoo! BB claimed 500,000 out of approximately 2 millionnational subscribers. Note that there was a 1.5 million sub-scriber increase during that time due to competitor responseto Yahoo!’s initial price offering. Other DSL services, such asAsahi Net, eAccess, Sony’s So-Net, and NTT, halved averagerates to approximately ¥3,000 a month, and increased theirservice speeds in order to remain competitive. This madeADSL a more promising technology for many users, and theresult was a rapid aggregate increase in subscriptions.
ADSL has supplanted cable as the dominant broadbandtechnology in Japan, largely due to Yahoo! BB’s pricing strat-egy and resultant market responses. As of the first quarter of2003, there were 5.5 million ADSL users out of the total 9.4million broadband users in Japan. Of the 5.5 million, Yahoo!BB has 2.36 million users, making it the leader in ADSL mar-ket share. NTT’s ADSL service has 1.43 million subscribers,making it second in market share with just over half of Yahoo!BB’s base. The remaining 1.7 million users are spread over alarge number of other providers.
Yahoo! BB: Motivations
The broadband division has become a large segment of Yahoo!Japan’s overall sales revenue. During the three-month periodafter market entry, the BB division generated ¥4.6 billion,or about 52 percent of the company’s total sale, and almostdoubled the ¥2.7 billion raised by Yahoo! Japan’s traditionalcore online advertising business segment.
Impressive revenue figures, however, are not the mainreason for the Company’s entry into broadband service. Bystimulating aggregate broadband penetration and enhancingthe digital distribution network of Internet-enabled comput-ers, Yahoo! Japan is increasing demand for its other services(listing, portals, auctions), and making access to these servicesmuch easier and faster.
In addition to current Yahoo! Japan services, the Companyhas great hope for Voice-over-IP (VoIP) service as a futurerevenue stream. VoIP utilizes Internet connections to conductvoice conversations, providing tremendous savings from exist-ing phone charges. For VoIP to work, however, broadbandconnections capable of handling real-time voice transmissionsand encoding and decoding are required. Yahoo! Japan seeksto increase broadband penetration until services such as VoIPbecome viable options for the company.
Yahoo! BB: Present and Future Issues
While the Yahoo! BB division has performed well, the valuederived from the division’s high revenues are offset by itslow profit margins. Unlike the auctions and listing divisions,broadband has considerable marginal costs, since Yahoo!BB must lease its telephone lines from NTT. The companyhas also been subsidizing its own costs in order to offerlow subscription rates. Moreover, Softbank has aggressivelymarketed Yahoo!’s ADSL service, saddling the companywith significant financial losses. It has been estimated thatattracting a single, new ADSL subscriber costs the Yahoo!Japan and Softbank ¥37,000.
It also appears that the competition is beginning to catchup with the Yahoo! BB: For the first time, in April 2003, NTTADSL signed more new users than Yahoo! BB, with 196,000and 184,000 users, respectively. Meanwhile, the growth rateof ADSL subscribers is projected to slow as soon as late 2003,so the phenomenal expansion of broadband is not expectedto continue.
Inaddition, theviabilityof futureservicesofferedbyYahoo!Japan is still in doubt: VoIP service, for instance, is contingenton a high adoption rate of broadband and a shift from conven-tional telephone service to VoIP. While the company hopesthat broadband will provide additional revenue streams in thefuture, only time will tell if its strategy will succeed.
OVERALL EVALUATION
Yahoo! Japan’s diversification strategy was highly successful.Between 2001 and 2002, total revenues for the companyincreased 87.6 percent. Equally impressive has been thetremendous revenue growth for both Yahoo! Auctions (362.7percent) and Yahoo! BB (67.4 percent). Revenue growth inYahoo! Japan’s other services (62.5 percent) also suggest thatthe strategic digital distribution channel of broadband mayhave had synergistic effects for all of Yahoo! Japan’s businessunits. Although the company’s initial success in diversificationoffers no guarantees for the future, Yahoo! Japan has placeditself in an excellent position for sustainable growth into thefuture.
DISCUSSION QUESTIONS
1. What future concerns should Yahoo! Japan have as thecompany’s diversification strategy continues to grow?
2. Will Yahoo! Japan be able to continue its extraordinaryrevenue growth into the future?
3. How essential is Yahoo! BB to the future of the company?
4. How should Yahoo! Japan manage the relationships withSoftbank and Yahoo! Inc. in the future?
704 • Case 15 • AOL Goes Far East
� � � � � � � � � � � � � � � � � � � � � � � � � � � � � � �
CASE 15
AOL GOES FAR EAST
On an uncharacteristically warm day in Tokyo in December1999, John Barber, a managing director of AOL Japan, absent-mindedly glanced out the widow focusing on the sunlightgleaming off a nearby skyscraper. This was his third market-ing meeting today, and he had the same sinking feeling aboutthis one that he had had about the other two and the hundredsbefore them. Like 90 percent of the other material that camefrom the marketing department, this one would flop. The localmarketing staff was just not up to speed, and a great deal ofresources were being wasted on this exercise in futility.
John had been in his current position since AOL Japan wasestablished in 1997, and he was starting to get impatient. Thecompany was not too far off on its subscription targets, andthe company was inching toward profitability. However, Johnwas not satisfied. John felt that the company was not livingup to the potential that one would expect of a joint venturebetween the largest Internet provider in the world and one ofJapan’s largest companies.
Some critics complained that AOL entered the Japanesemarket too late. When AOL Japan started service in Aprilof 1997, Niftyserve and BigGlobe already had a large stableof dedicated users. However, John dismissed this as a majorfactor in the current difficulties. After all, when AOL Inc.registered its first online subscriber, CompuServe had been inbusiness for more than 18 years. Whatever the case, John wasdetermined to find a way to catapult the company into theleading Internet service provider (ISP) position in Japan.
THE PARENT: AMERICA ONLINE INC.
America Online Inc. had a modest beginning. Founded in 1985as Quantum computers, the company began by offering onlineservices for Commodore Business Machines. By the time theWorld Wide Web came along almost 12 years later, AOL waswell positioned to take advantage of it. The company grewat a steady pace for most of its history, but within the pasttwo years, its revenue shot skyward as if gravity had suddenlydissolved. The company grew internally as well as acquir-ing many promising businesses. Exhibit 1 shows some of themajor units of AOL Inc. in 1999. The company also acquiredMapQuest in 2000, an online provider of travel informationand road directions.
In January 2001, the parent company finalized the acqui-sition of a large portion of the assets of Time Warner, onwhat was touted to be one of the most significant mergersof the decade. However, almost two years later, the mergedcompany is facing several problems and declining earnings.
Finances
In 1999, the last year before AOL began its merger withTime Warner, 69 percent of total revenue came from the
This case was prepared by Bill Baker, Steven Engen, and Trevor Nelson ofTemple University Japan and revised by Sonia Ketkar of Temple Univer-sity under the supervision of Professor Masaaki Kotabe for class discussionrather than to illustrate either effective or ineffective management of asituation described (2003).
20 million paying subscribers to the AOL and CompuServeservices. Due to the dangers of relying heavily on subscriptionfees in such a competitive market, the company had clearlystated that it intended to move away from subscriptions andrely more heavily on advertising. Therefore, it was not asurprise that the fastest growing segment of revenue camefrom the ‘‘advertising, commerce, and other’’ category. Thiscategory included online advertising fees, sales of merchan-dise, as well as other revenues. In 1999, the ‘‘advertising,commerce, and other’’ segment accounted for 21 percent oftotal revenue as compared to 14 percent of total revenue in1997. The Enterprise Solutions generated revenue from licens-ing fees, technical support, consulting, and training services.This segment continued to decrease in importance. In 1997,this segment provided 16.9 percent of total revenue, and thisfigure declined to 10 percent in 1999. The financial informationshows that 1999 was AOL’s best year ever. Exhibit 2 presentsoperating income and net income from 1997 to date as wellas the cash held in 1999 (before the merger). Since then, thecompany has merged with Time Warner, and after repeatedlyrevising its financial outlook in the lower direction, in 2002reported that its earnings would not be as high as expected.
International Expansion
AOL’s 1999 Annual Report stated: ‘‘The Company’s interna-tional strategy is to provide consumers with local services inkey international markets featuring local language, content,marketing, and community.’’ AOL started its internationalexpansion in Germany almost five years ago. Since that time,the company has expanded into Australia, Brazil, Canada,France, Japan, the UK, Sweden, and Hong Kong. Jack Davies,vice president of international operations, led the expansion.
All the joint ventures have been undertaken with a partnerin the local market. In Germany, AOL chose BertelsmannAG (multimedia company) and in Latin America, they joinedwith Cisneros (media, entertainment and telecommunicationscompany). However, in Japan, AOL chose Mitsui & Company,one of Japan’s largest and oldest general trading companies.
Mitsui & Company
Mitsui & Company was founded in 1941. It was originallypart of the Mitsui Zaibatsu that was broken up after the endof World War II. Mitsui has more than 11,000 employees in60 countries and in 1998 had capital of US$1.9B. Mitsui isknown as one of the most traditional trading companies inJapan. Exhibit 3 shows a list of the company’s most familiarproducts. Like most ‘‘general’’ trading companies in Japan,Mitsui’s real strength is in facilitating large transactions forcommodity-type products. Their core competency, if any, is inimport, export, and financing.
Mitsui has all the connections and money required to suc-ceed in the Japanese ‘‘general products’’ market, but it hadvery little experience with the Internet, especially in 1995when the discussions with AOL began.
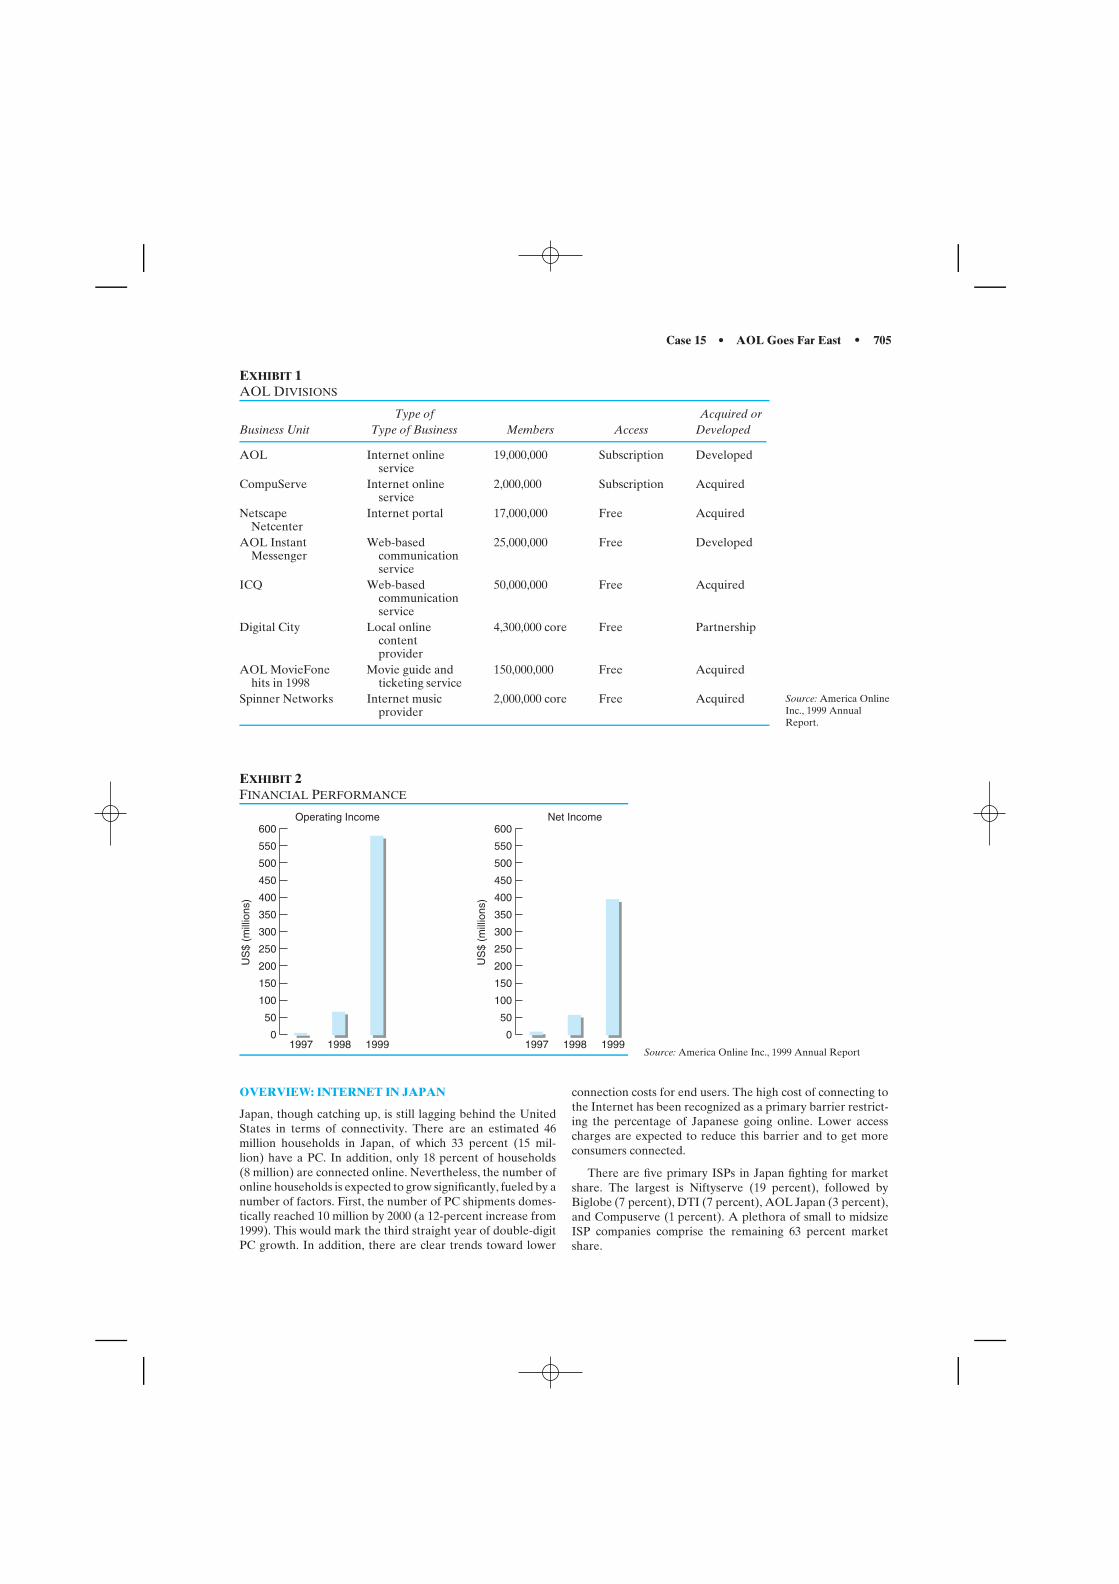
Case 15 • AOL Goes Far East • 705
EXHIBIT 1AOL DIVISIONS
Type of Acquired orBusiness Unit Type of Business Members Access Developed
AOL Internet onlineservice
19,000,000 Subscription Developed
CompuServe Internet onlineservice
2,000,000 Subscription Acquired
NetscapeNetcenter
Internet portal 17,000,000 Free Acquired
AOL InstantMessenger
Web-basedcommunicationservice
25,000,000 Free Developed
ICQ Web-basedcommunicationservice
50,000,000 Free Acquired
Digital City Local onlinecontentprovider
4,300,000 core Free Partnership
AOL MovieFonehits in 1998
Movie guide andticketing service
150,000,000 Free Acquired
Spinner Networks Internet musicprovider
2,000,000 core Free Acquired Source: America OnlineInc., 1999 AnnualReport.
EXHIBIT 2FINANCIAL PERFORMANCE
1997
US
$ (m
illio
ns)
1998 1999
Operating Income Net Income
0
50
100
150
200
250
300
350
400
450
500
550
600
1997
US
$ (m
illio
ns)
1998 19990
50
100
150
200
250
300
350
400
450
500
550
600
Source: America Online Inc., 1999 Annual Report
OVERVIEW: INTERNET IN JAPAN
Japan, though catching up, is still lagging behind the UnitedStates in terms of connectivity. There are an estimated 46million households in Japan, of which 33 percent (15 mil-lion) have a PC. In addition, only 18 percent of households(8 million) are connected online. Nevertheless, the number ofonline households is expected to grow significantly, fueled by anumber of factors. First, the number of PC shipments domes-tically reached 10 million by 2000 (a 12-percent increase from1999). This would mark the third straight year of double-digitPC growth. In addition, there are clear trends toward lower
connection costs for end users. The high cost of connecting tothe Internet has been recognized as a primary barrier restrict-ing the percentage of Japanese going online. Lower accesscharges are expected to reduce this barrier and to get moreconsumers connected.
There are five primary ISPs in Japan fighting for marketshare. The largest is Niftyserve (19 percent), followed byBiglobe (7 percent), DTI (7 percent), AOL Japan (3 percent),and Compuserve (1 percent). A plethora of small to midsizeISP companies comprise the remaining 63 percent marketshare.
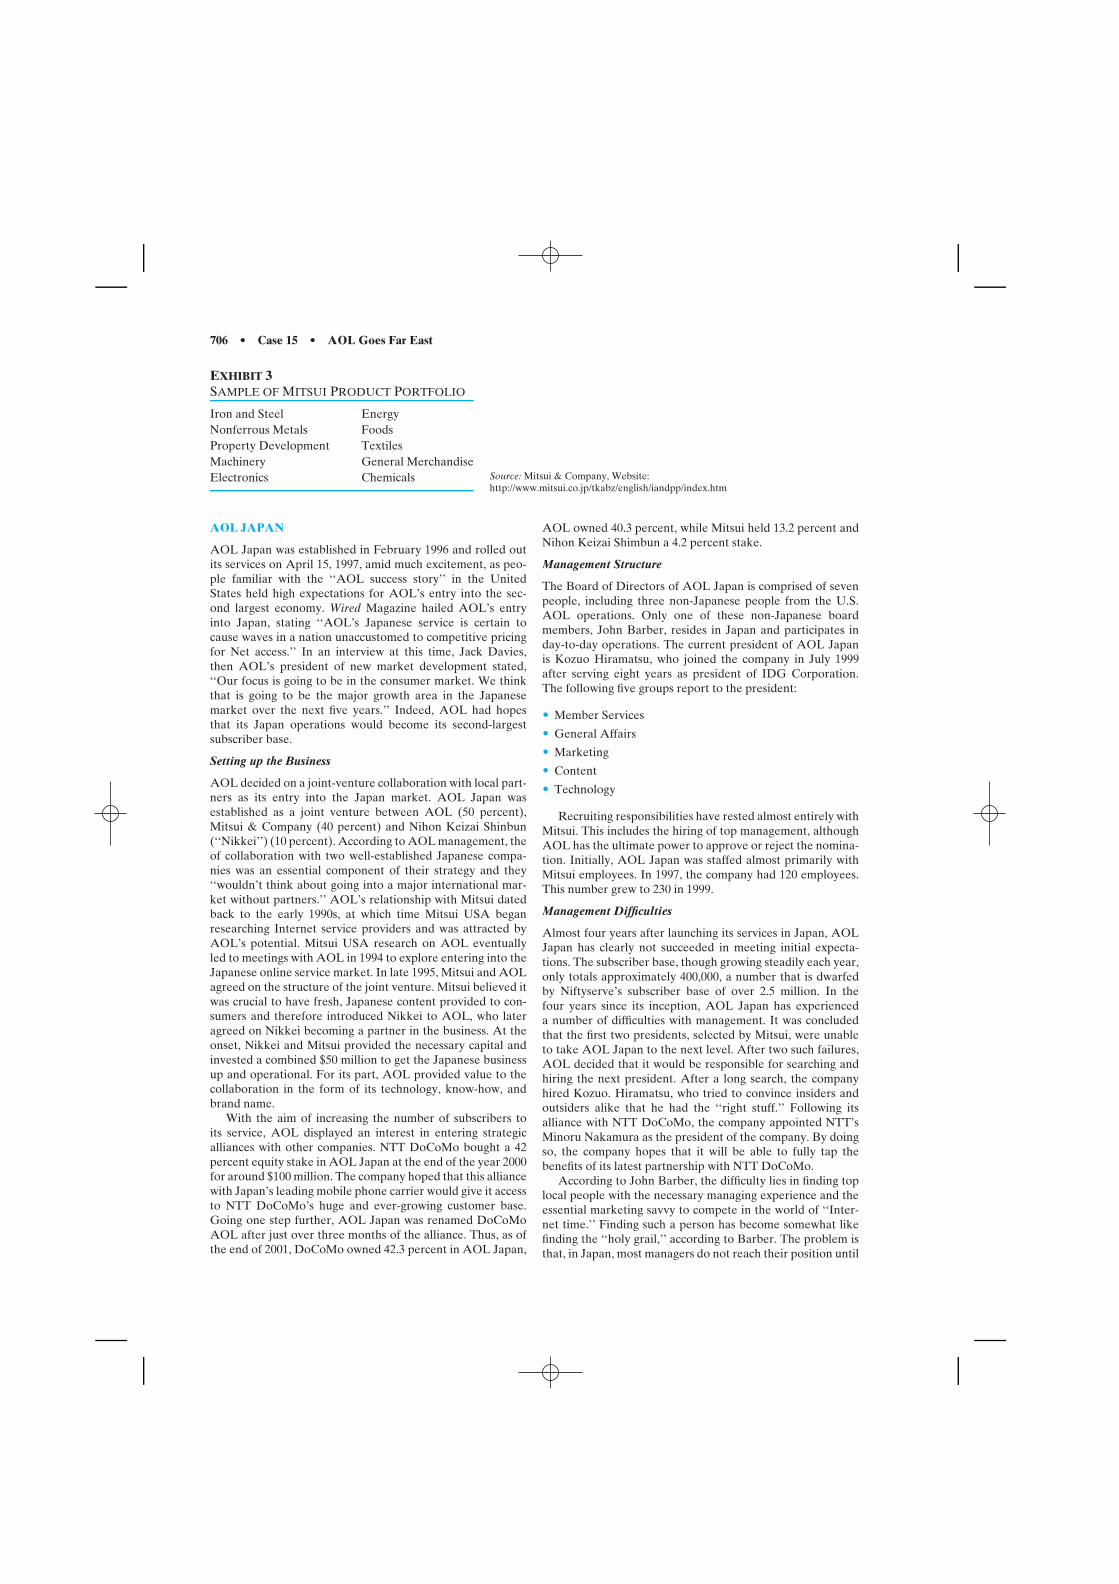
706 • Case 15 • AOL Goes Far East
EXHIBIT 3SAMPLE OF MITSUI PRODUCT PORTFOLIO
Iron and Steel EnergyNonferrous Metals FoodsProperty Development TextilesMachinery General MerchandiseElectronics Chemicals Source: Mitsui & Company, Website:
http://www.mitsui.co.jp/tkabz/english/iandpp/index.htm
AOL JAPAN
AOL Japan was established in February 1996 and rolled outits services on April 15, 1997, amid much excitement, as peo-ple familiar with the ‘‘AOL success story’’ in the UnitedStates held high expectations for AOL’s entry into the sec-ond largest economy. Wired Magazine hailed AOL’s entryinto Japan, stating ‘‘AOL’s Japanese service is certain tocause waves in a nation unaccustomed to competitive pricingfor Net access.’’ In an interview at this time, Jack Davies,then AOL’s president of new market development stated,‘‘Our focus is going to be in the consumer market. We thinkthat is going to be the major growth area in the Japanesemarket over the next five years.’’ Indeed, AOL had hopesthat its Japan operations would become its second-largestsubscriber base.
Setting up the Business
AOL decided on a joint-venture collaboration with local part-ners as its entry into the Japan market. AOL Japan wasestablished as a joint venture between AOL (50 percent),Mitsui & Company (40 percent) and Nihon Keizai Shinbun(‘‘Nikkei’’) (10 percent). According to AOL management, theof collaboration with two well-established Japanese compa-nies was an essential component of their strategy and they‘‘wouldn’t think about going into a major international mar-ket without partners.’’ AOL’s relationship with Mitsui datedback to the early 1990s, at which time Mitsui USA beganresearching Internet service providers and was attracted byAOL’s potential. Mitsui USA research on AOL eventuallyled to meetings with AOL in 1994 to explore entering into theJapanese online service market. In late 1995, Mitsui and AOLagreed on the structure of the joint venture. Mitsui believed itwas crucial to have fresh, Japanese content provided to con-sumers and therefore introduced Nikkei to AOL, who lateragreed on Nikkei becoming a partner in the business. At theonset, Nikkei and Mitsui provided the necessary capital andinvested a combined $50 million to get the Japanese businessup and operational. For its part, AOL provided value to thecollaboration in the form of its technology, know-how, andbrand name.
With the aim of increasing the number of subscribers toits service, AOL displayed an interest in entering strategicalliances with other companies. NTT DoCoMo bought a 42percent equity stake in AOL Japan at the end of the year 2000for around $100 million. The company hoped that this alliancewith Japan’s leading mobile phone carrier would give it accessto NTT DoCoMo’s huge and ever-growing customer base.Going one step further, AOL Japan was renamed DoCoMoAOL after just over three months of the alliance. Thus, as ofthe end of 2001, DoCoMo owned 42.3 percent in AOL Japan,
AOL owned 40.3 percent, while Mitsui held 13.2 percent andNihon Keizai Shimbun a 4.2 percent stake.
Management Structure
The Board of Directors of AOL Japan is comprised of sevenpeople, including three non-Japanese people from the U.S.AOL operations. Only one of these non-Japanese boardmembers, John Barber, resides in Japan and participates inday-to-day operations. The current president of AOL Japanis Kozuo Hiramatsu, who joined the company in July 1999after serving eight years as president of IDG Corporation.The following five groups report to the president:
• Member Services
• General Affairs
• Marketing
• Content
• Technology
Recruiting responsibilities have rested almost entirely withMitsui. This includes the hiring of top management, althoughAOL has the ultimate power to approve or reject the nomina-tion. Initially, AOL Japan was staffed almost primarily withMitsui employees. In 1997, the company had 120 employees.This number grew to 230 in 1999.
Management Difficulties
Almost four years after launching its services in Japan, AOLJapan has clearly not succeeded in meeting initial expecta-tions. The subscriber base, though growing steadily each year,only totals approximately 400,000, a number that is dwarfedby Niftyserve’s subscriber base of over 2.5 million. In thefour years since its inception, AOL Japan has experienceda number of difficulties with management. It was concludedthat the first two presidents, selected by Mitsui, were unableto take AOL Japan to the next level. After two such failures,AOL decided that it would be responsible for searching andhiring the next president. After a long search, the companyhired Kozuo. Hiramatsu, who tried to convince insiders andoutsiders alike that he had the ‘‘right stuff.’’ Following itsalliance with NTT DoCoMo, the company appointed NTT’sMinoru Nakamura as the president of the company. By doingso, the company hopes that it will be able to fully tap thebenefits of its latest partnership with NTT DoCoMo.
According to John Barber, the difficulty lies in finding toplocal people with the necessary managing experience and theessential marketing savvy to compete in the world of ‘‘Inter-net time.’’ Finding such a person has become somewhat likefinding the ‘‘holy grail,’’ according to Barber. The problem isthat, in Japan, most managers do not reach their position until
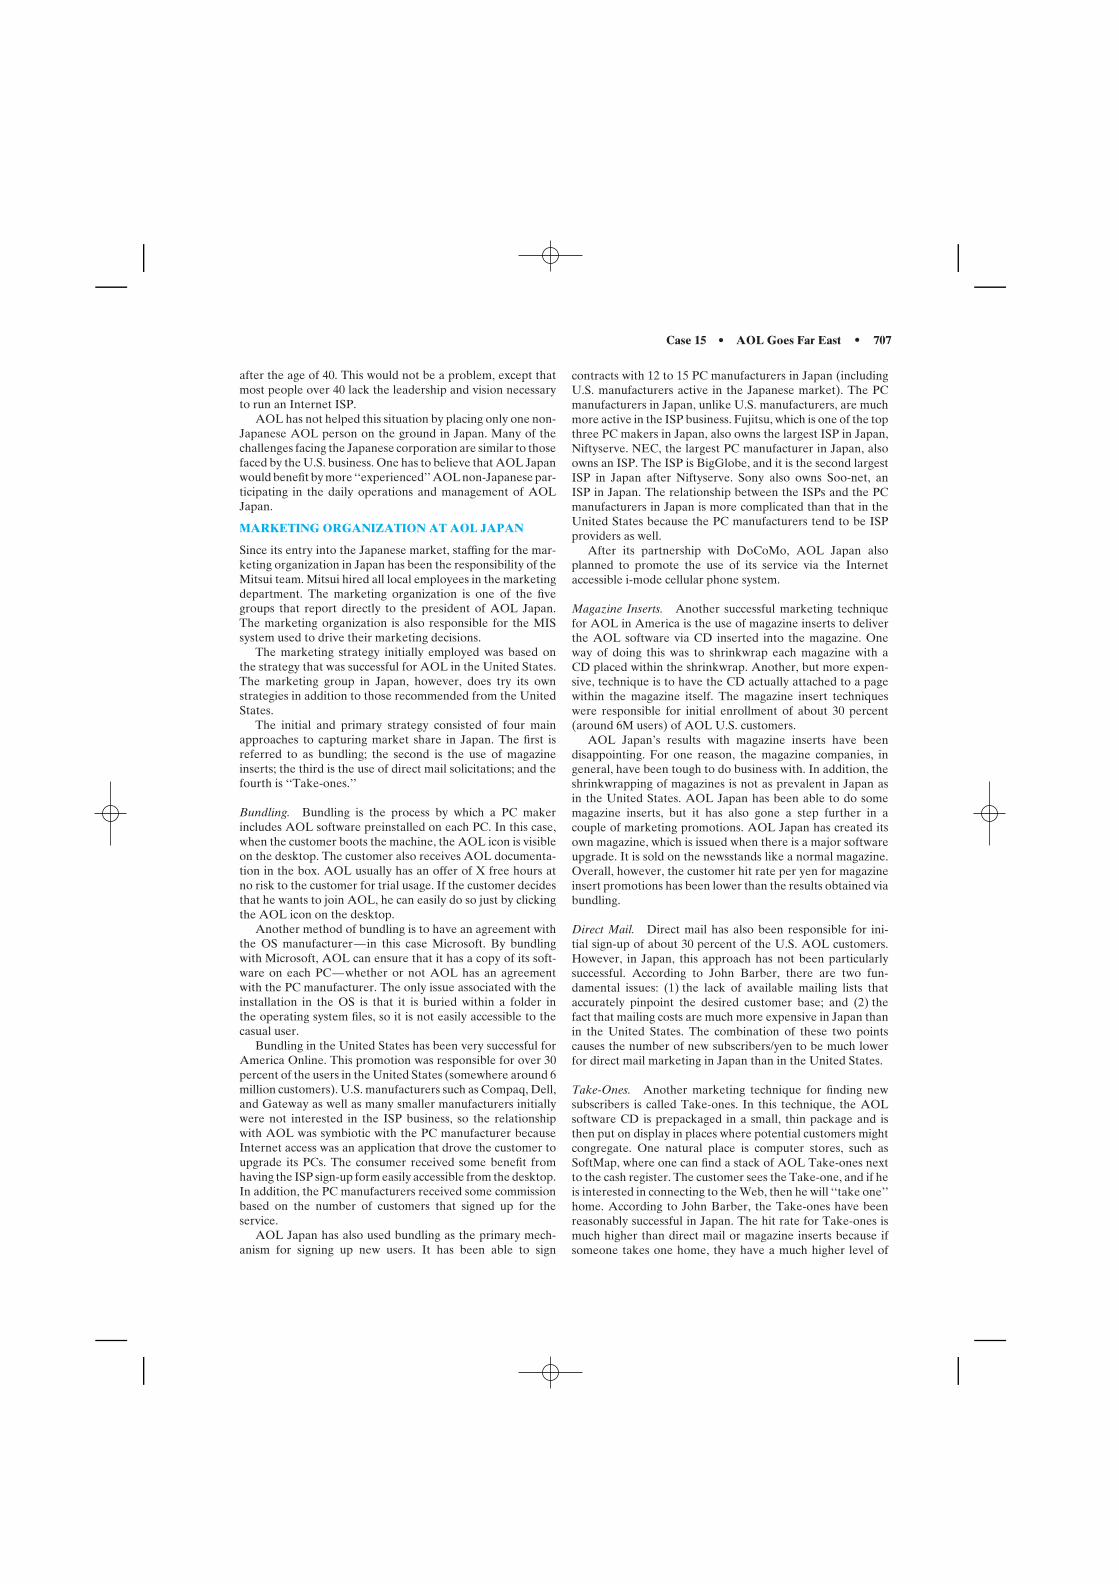
Case 15 • AOL Goes Far East • 707
after the age of 40. This would not be a problem, except thatmost people over 40 lack the leadership and vision necessaryto run an Internet ISP.
AOL has not helped this situation by placing only one non-Japanese AOL person on the ground in Japan. Many of thechallenges facing the Japanese corporation are similar to thosefaced by the U.S. business. One has to believe that AOL Japanwould benefit by more ‘‘experienced’’ AOL non-Japanese par-ticipating in the daily operations and management of AOLJapan.
MARKETING ORGANIZATION AT AOL JAPAN
Since its entry into the Japanese market, staffing for the mar-keting organization in Japan has been the responsibility of theMitsui team. Mitsui hired all local employees in the marketingdepartment. The marketing organization is one of the fivegroups that report directly to the president of AOL Japan.The marketing organization is also responsible for the MISsystem used to drive their marketing decisions.
The marketing strategy initially employed was based onthe strategy that was successful for AOL in the United States.The marketing group in Japan, however, does try its ownstrategies in addition to those recommended from the UnitedStates.
The initial and primary strategy consisted of four mainapproaches to capturing market share in Japan. The first isreferred to as bundling; the second is the use of magazineinserts; the third is the use of direct mail solicitations; and thefourth is ‘‘Take-ones.’’
Bundling. Bundling is the process by which a PC makerincludes AOL software preinstalled on each PC. In this case,when the customer boots the machine, the AOL icon is visibleon the desktop. The customer also receives AOL documenta-tion in the box. AOL usually has an offer of X free hours atno risk to the customer for trial usage. If the customer decidesthat he wants to join AOL, he can easily do so just by clickingthe AOL icon on the desktop.
Another method of bundling is to have an agreement withthe OS manufacturer— in this case Microsoft. By bundlingwith Microsoft, AOL can ensure that it has a copy of its soft-ware on each PC—whether or not AOL has an agreementwith the PC manufacturer. The only issue associated with theinstallation in the OS is that it is buried within a folder inthe operating system files, so it is not easily accessible to thecasual user.
Bundling in the United States has been very successful forAmerica Online. This promotion was responsible for over 30percent of the users in the United States (somewhere around 6million customers). U.S. manufacturers such as Compaq, Dell,and Gateway as well as many smaller manufacturers initiallywere not interested in the ISP business, so the relationshipwith AOL was symbiotic with the PC manufacturer becauseInternet access was an application that drove the customer toupgrade its PCs. The consumer received some benefit fromhaving the ISP sign-up form easily accessible from the desktop.In addition, the PC manufacturers received some commissionbased on the number of customers that signed up for theservice.
AOL Japan has also used bundling as the primary mech-anism for signing up new users. It has been able to sign
contracts with 12 to 15 PC manufacturers in Japan (includingU.S. manufacturers active in the Japanese market). The PCmanufacturers in Japan, unlike U.S. manufacturers, are muchmore active in the ISP business. Fujitsu, which is one of the topthree PC makers in Japan, also owns the largest ISP in Japan,Niftyserve. NEC, the largest PC manufacturer in Japan, alsoowns an ISP. The ISP is BigGlobe, and it is the second largestISP in Japan after Niftyserve. Sony also owns Soo-net, anISP in Japan. The relationship between the ISPs and the PCmanufacturers in Japan is more complicated than that in theUnited States because the PC manufacturers tend to be ISPproviders as well.
After its partnership with DoCoMo, AOL Japan alsoplanned to promote the use of its service via the Internetaccessible i-mode cellular phone system.
Magazine Inserts. Another successful marketing techniquefor AOL in America is the use of magazine inserts to deliverthe AOL software via CD inserted into the magazine. Oneway of doing this was to shrinkwrap each magazine with aCD placed within the shrinkwrap. Another, but more expen-sive, technique is to have the CD actually attached to a pagewithin the magazine itself. The magazine insert techniqueswere responsible for initial enrollment of about 30 percent(around 6M users) of AOL U.S. customers.
AOL Japan’s results with magazine inserts have beendisappointing. For one reason, the magazine companies, ingeneral, have been tough to do business with. In addition, theshrinkwrapping of magazines is not as prevalent in Japan asin the United States. AOL Japan has been able to do somemagazine inserts, but it has also gone a step further in acouple of marketing promotions. AOL Japan has created itsown magazine, which is issued when there is a major softwareupgrade. It is sold on the newsstands like a normal magazine.Overall, however, the customer hit rate per yen for magazineinsert promotions has been lower than the results obtained viabundling.
Direct Mail. Direct mail has also been responsible for ini-tial sign-up of about 30 percent of the U.S. AOL customers.However, in Japan, this approach has not been particularlysuccessful. According to John Barber, there are two fun-damental issues: (1) the lack of available mailing lists thataccurately pinpoint the desired customer base; and (2) thefact that mailing costs are much more expensive in Japan thanin the United States. The combination of these two pointscauses the number of new subscribers/yen to be much lowerfor direct mail marketing in Japan than in the United States.
Take-Ones. Another marketing technique for finding newsubscribers is called Take-ones. In this technique, the AOLsoftware CD is prepackaged in a small, thin package and isthen put on display in places where potential customers mightcongregate. One natural place is computer stores, such asSoftMap, where one can find a stack of AOL Take-ones nextto the cash register. The customer sees the Take-one, and if heis interested in connecting to the Web, then he will ‘‘take one’’home. According to John Barber, the Take-ones have beenreasonably successful in Japan. The hit rate for Take-ones ismuch higher than direct mail or magazine inserts because ifsomeone takes one home, they have a much higher level of
708 • Case 16 • Danone: Marketing the Glacier the United States
interest in signing up to an ISP than the reader of a magazine orsomeone who receives an unsolicited mail offer. In addition,AOL Japan usually combines the Take-ones with anotherpromotion—such as Pokemon or a movie, like Tarzan—toincrease the hit rate of the Take-ones. The cross promotionwith Pokemon had one unexpected drawback: parents of thechildren swamped the AOL User Support Line with ordersfor Pokemon cards!
Moving Forward
AOL Japan’s share of the Japan market is now about3 percent. It has grown over the past three years from 0to the current 3 percent, while other ISPs have been relativelyflat. In addition, AOL Japan has been capturing between 10and 15 percent of the new subscribers to the Internet in Japanover the past two years. Although other ISPs might be satisfiedwith this progress, AOL has about a 50 percent market sharein the United States and will not be happy with such a smallshare of the market in Japan.
According to John Barber, AOL Japan looks at threedifferent ways to grow their market share:
• Increase marketing efficiency— if AOL Japan can lower theamount of yen it takes to capture a subscriber, then it cancapture a higher percentage of new users to the Internet.
• Take advantage of watershed events—as technologychanges the nature of the Internet or creates new waysto the Internet, opportunities will arise to capture new users
through support of these technologies. If AOL anticipatesthese changes better than other ISPs, then it will have theopportunity to capture more market share. One exampleis Internet access via mobile phones. In less then one year,NTT DoCoMo, with its T-Mode Internet access service viathe displays on portable phones, went from 0 to 3 millionsubscribers, despite the fact that the services via the portablephone are very limited.
• Buy other ISPs—there are many thousands of ISPs inJapan. Many of them are very small and are potentialtakeover candidates.
DISCUSSION QUESTIONS
1. Was Mitsui the best partner for AOL to enter the Japanesemarket? If so, why? If not, who (or what kind of company)would make a better partner? Why?
2. Do you think the current joint-venture structure shouldcontinue into the foreseeable future?
3. What structural impediments did AOL face in the Japanesemarket that did not exist in the U.S. market? What actionsshould AOL take to overcome these obstacles?
4. Make specific recommendations as to what you think AOLshould do to capture additional market share in each of thethree areas mentioned: lower the cost of ¥/new subscriber;capitalize on watershed events; buy other ISPs.
5. Now that AOL has partnered with NTT DoCoMo, will itbe successful in Japan, or is it too late?
� � � � � � � � � � � � � � � � � � � � � � � � � � � � � � �
CASE 16
DANONE: MARKETING THE GLACIER IN THE UNITED STATES
INTRODUCTION
As a former windsurfing champion and current CEO ofFrance’s Group Danone (Danone), Franck Riboud has lit-erally and figuratively ‘‘ridden the waves’’ to success. HisGroup Danone, which he has led as CEO since 1996, is thenumber seven food and beverage company in the world. Witha refocus on its core businesses, dairy products, beverages,and biscuits, as well as a divestiture of its sprawling nonrelatedentities, the company’s stock price nearly doubled during hisfive-year tenure ($16.1 in December 1997 to $26.2 in Decem-ber 2002, with the high of $31.0 in January 2001). Much of thissuccess is attributed to Riboud, whose casual, laid-back stylehas transformed into a forward-thinking, profit-focused strat-egy for Danone. With $14.5 billion in net sales and $1.5 billionin after-tax profits, the company has experienced positive salesgrowth rates under his leadership.
Delivering 27 percent of the firm’s global sales, Danone’swater products, led by the well-known glacier-source Evian
This case was prepared by Michael Pendleton and Aaron Tennant of theFox School of Business and Management at Temple University underthe supervision of Professor Masaaki Kotabe for class discussion ratherthan to illustrate either effective or ineffective management of a situationdescribed (2003).
brand, is number two worldwide in packaged water sales.Although declining in recent years (see Exhibit 1), salesgrowth from Danone’s Water Division in the last five yearshas been positive.
With all of Danone’s success, Riboud still faced the chal-lenge of achieving a more even geographic distribution of itscustomer base, particularly in the United States. The questionsposed to him by investors and his board were—How could agiant like Danone only derive 11 percent of its sales from theUnited States? What opportunities is Danone missing by notbeing the major bottle water player in the United States?
‘‘DIVERSIFICATION: Reduce Danone’s dependence onEurope, which accounts for 76 percent of sales. Derive 33 per-cent of sales outside the Continent by 2000.’’ This was one of thethree major strategic plans that Riboud wanted to implementduring his tenure—and it would prove to be the most difficult.On the whole, a whopping 57 percent of the company’s salesderived from Europe, and only 11 percent came from theUnited States (see Exhibit 2).
After taking away the successful Dannon yogurt line andfocusing on water sales in the United States, it was clearthat Danone’s presence was even more of a failure. By theend of 2001, Pepsi’s Aquafina and Coke’s Dasani had over-taken Danone in volume of water sold in the United States
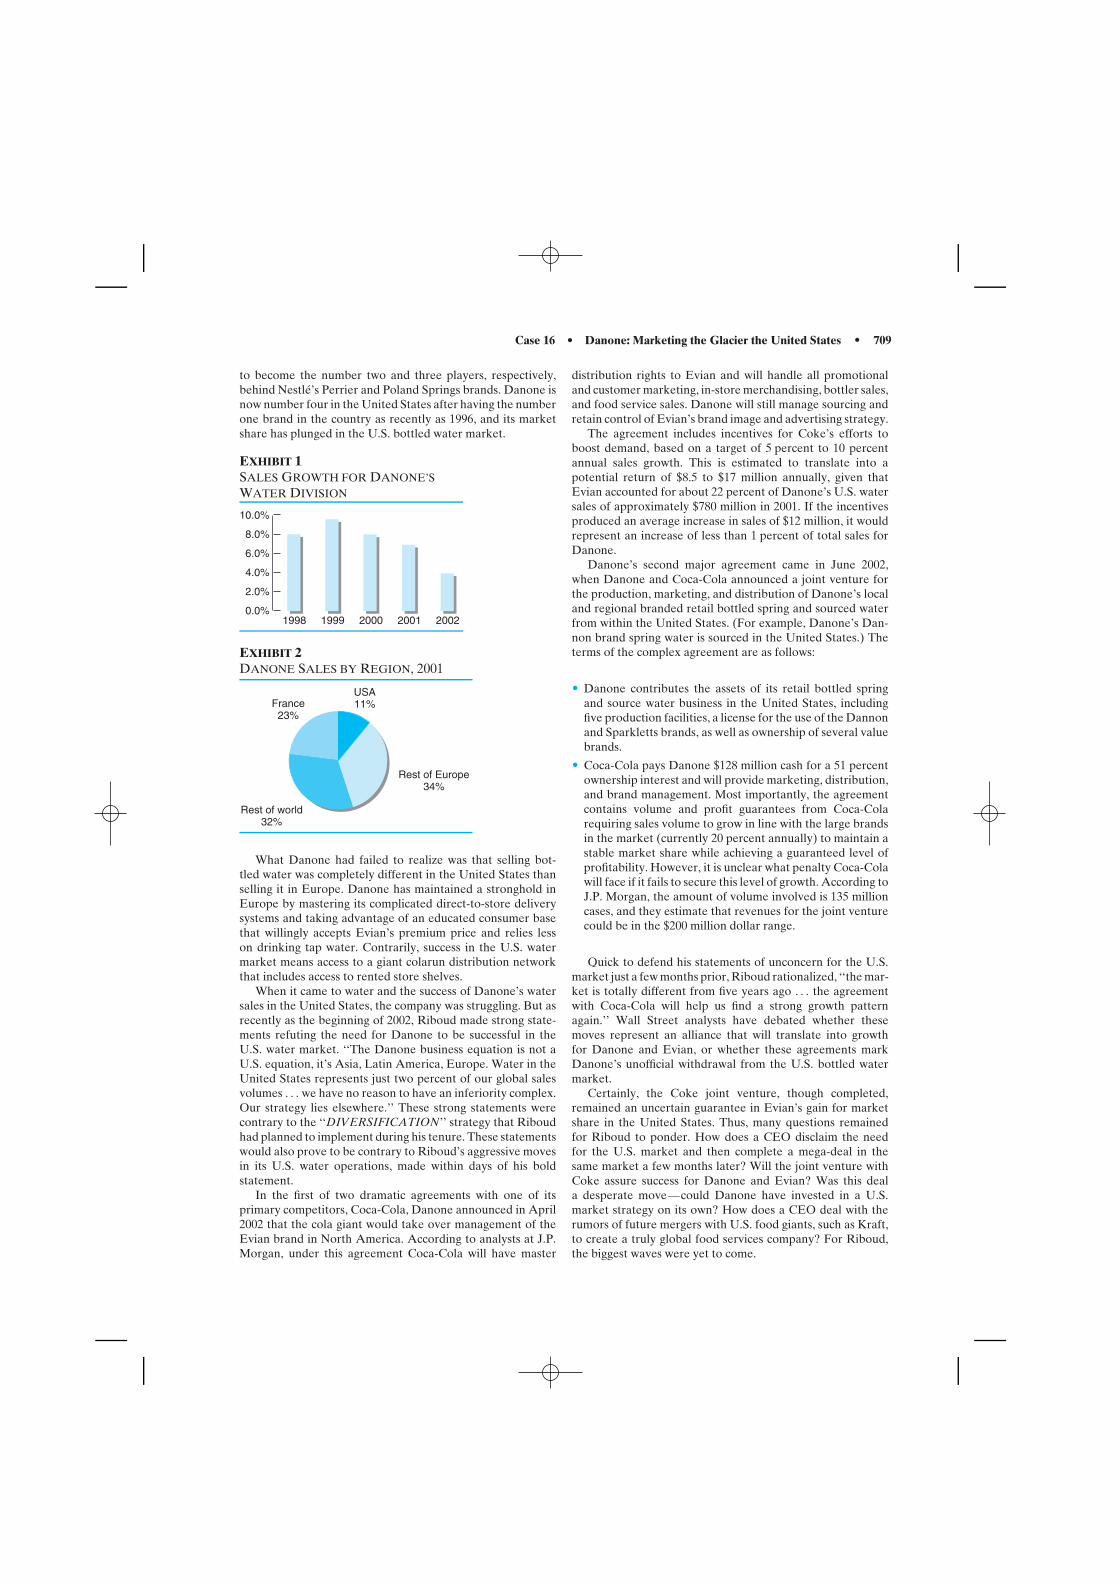
Case 16 • Danone: Marketing the Glacier the United States • 709
to become the number two and three players, respectively,behind Nestle’s Perrier and Poland Springs brands. Danone isnow number four in the United States after having the numberone brand in the country as recently as 1996, and its marketshare has plunged in the U.S. bottled water market.
EXHIBIT 1SALES GROWTH FOR DANONE’SWATER DIVISION
1998 1999 2000 2001 20020.0%
2.0%
4.0%
6.0%
8.0%
10.0%
EXHIBIT 2DANONE SALES BY REGION, 2001
Rest of world32%
France23%
USA11%
Rest of Europe34%
What Danone had failed to realize was that selling bot-tled water was completely different in the United States thanselling it in Europe. Danone has maintained a stronghold inEurope by mastering its complicated direct-to-store deliverysystems and taking advantage of an educated consumer basethat willingly accepts Evian’s premium price and relies lesson drinking tap water. Contrarily, success in the U.S. watermarket means access to a giant colarun distribution networkthat includes access to rented store shelves.
When it came to water and the success of Danone’s watersales in the United States, the company was struggling. But asrecently as the beginning of 2002, Riboud made strong state-ments refuting the need for Danone to be successful in theU.S. water market. ‘‘The Danone business equation is not aU.S. equation, it’s Asia, Latin America, Europe. Water in theUnited States represents just two percent of our global salesvolumes . . . we have no reason to have an inferiority complex.Our strategy lies elsewhere.’’ These strong statements werecontrary to the ‘‘DIVERSIFICATION’’ strategy that Riboudhad planned to implement during his tenure. These statementswould also prove to be contrary to Riboud’s aggressive movesin its U.S. water operations, made within days of his boldstatement.
In the first of two dramatic agreements with one of itsprimary competitors, Coca-Cola, Danone announced in April2002 that the cola giant would take over management of theEvian brand in North America. According to analysts at J.P.Morgan, under this agreement Coca-Cola will have master
distribution rights to Evian and will handle all promotionaland customer marketing, in-store merchandising, bottler sales,and food service sales. Danone will still manage sourcing andretain control of Evian’s brand image and advertising strategy.
The agreement includes incentives for Coke’s efforts toboost demand, based on a target of 5 percent to 10 percentannual sales growth. This is estimated to translate into apotential return of $8.5 to $17 million annually, given thatEvian accounted for about 22 percent of Danone’s U.S. watersales of approximately $780 million in 2001. If the incentivesproduced an average increase in sales of $12 million, it wouldrepresent an increase of less than 1 percent of total sales forDanone.
Danone’s second major agreement came in June 2002,when Danone and Coca-Cola announced a joint venture forthe production, marketing, and distribution of Danone’s localand regional branded retail bottled spring and sourced waterfrom within the United States. (For example, Danone’s Dan-non brand spring water is sourced in the United States.) Theterms of the complex agreement are as follows:
• Danone contributes the assets of its retail bottled springand source water business in the United States, includingfive production facilities, a license for the use of the Dannonand Sparkletts brands, as well as ownership of several valuebrands.
• Coca-Cola pays Danone $128 million cash for a 51 percentownership interest and will provide marketing, distribution,and brand management. Most importantly, the agreementcontains volume and profit guarantees from Coca-Colarequiring sales volume to grow in line with the large brandsin the market (currently 20 percent annually) to maintain astable market share while achieving a guaranteed level ofprofitability. However, it is unclear what penalty Coca-Colawill face if it fails to secure this level of growth. According toJ.P. Morgan, the amount of volume involved is 135 millioncases, and they estimate that revenues for the joint venturecould be in the $200 million dollar range.
Quick to defend his statements of unconcern for the U.S.market just a few months prior, Riboud rationalized, ‘‘the mar-ket is totally different from five years ago . . . the agreementwith Coca-Cola will help us find a strong growth patternagain.’’ Wall Street analysts have debated whether thesemoves represent an alliance that will translate into growthfor Danone and Evian, or whether these agreements markDanone’s unofficial withdrawal from the U.S. bottled watermarket.
Certainly, the Coke joint venture, though completed,remained an uncertain guarantee in Evian’s gain for marketshare in the United States. Thus, many questions remainedfor Riboud to ponder. How does a CEO disclaim the needfor the U.S. market and then complete a mega-deal in thesame market a few months later? Will the joint venture withCoke assure success for Danone and Evian? Was this deala desperate move—could Danone have invested in a U.S.market strategy on its own? How does a CEO deal with therumors of future mergers with U.S. food giants, such as Kraft,to create a truly global food services company? For Riboud,the biggest waves were yet to come.
710 • Case 16 • Danone: Marketing the Glacier the United States
DANONE: A BRIEF HISTORY
Group Danone today has very little in common with its orig-inal operations, except that the Riboud family has been incharge for over four decades. Danone’s humble beginningscan be traced back to Lyon, France, where the original firmwas a glass container manufacturer named Souchon-Neuvesel.Danone’s history reflects three common themes: the companyachievement of a leadership position in its markets, the firm’s(or the Riboud family’s) willingness to exit successful busi-nesses in order to redefine itself in the pursuit of growth,and the company’s successful use of strategic mergers andacquisitions to perpetuate growth.
• 1965: Antoine Riboud replaced his uncle as chairman ofthe family-run Souchon-Neuvesel, a maker of glass bottlesbased in Lyon, France.
• 1966: Souchon-Neuvesel merged with Glaces de Boussois, amajor French plate glass manufacturer (windows for build-ings and autos), creating BSN. The companies came totogether for two primary goals: (1) to cope with the changingmarket trend toward ‘‘no-deposit, no-return’’ bottles, and(2) to create a company that would be large and competitiveenough for the expanding European Common Market.
• End of 1960s: Using acquisitions, by the end of the 1960sBSN had become one of the largest glass manufacturers inall of Europe. However, the container industry was chang-ing as the demand for paper and plastic containers wasspelling doom for glass bottle makers. BSN recognized thisthreat and because it did not have operations or ties inthe petrochemicals, forestry, or steel industries, the com-pany believed a good solution would be to start making thecontents for its containers. This strategy marked anotherredefining moment for the company, and once again itwould use acquisitions to create scale and generate growth.
• 1970: BSN took control of Evian, Kronenbourg, and theEuropean Breweries Company and became the leadingFrench manufacturer of beer and mineral waters.
• 1973: BSN and Gervais Danone merged companies andcreated the biggest food group in France. For BSN, themerger represented a major opportunity to move forwardand enter new markets, with a decisive shift toward foodproducts.
• 1980: With escalating energy costs hitting the glass-makingbusiness hard and convinced growth would not return tothis business for some time, BSN Gervais Danone began toexit from plate glass manufacturing, which did not fit in withthe food side of its business. It pulled out of the plate glasssector completely in 1981, selling off Boussois and focusedfirmly on food from then on.
• 1980s: In a series of acquisitions, BSN began a conquestof Europe by taking over many local companies in vari-ous food categories to become Europe’s third-biggest foodgroup.
• 1982: BSN purchased Dannon, the leading U.S. yogurtmaker (co-founded by Gervais Danone’s Daniel Carasso).
• 1986: BSN entered the biscuit industry by buying GeneralBiscuit.
• 1989: BSN added to its portfolio of biscuit brands by acquir-ing Nabisco’s European subsidiaries.
• 1988: BSN began an aggressive push into the global marketwith over 40 acquisitions in Asia, Latin America, CentralEurope, Africa, and the Middle East.
• 1994: The company changed its name to Group Danone,symbolized by a little boy gazing up at a star, to take advan-tage of the success of its leading brand, which was famousthe world over.
• 1996: Franck Riboud succeeded his father as chairman andrestructured the company to focus on three core businesses:dairy, beverages (specifically water), and biscuits.
• 1999: Group Danone sold off its container business andbreweries.
DANONE’S BOTTLED WATER BUSINESS
In 2001, Danone’s water division became number one in theworld water market based on volume sales, with 12.5 percentof the global market. As a portion of total firm revenues, bot-tled water comprised 27 percent, or approximately $3.4 billionof total revenues for Danone in 2001. Danone has accom-plished its leadership position by using a two-tier strategy:first by extending Evian as a global brand and then by usingacquisitions to acquire top regional and local brands. Danonereports its company financials using the broad segment clas-sifications of France, Rest of Europe, and Rest of the World.A look at Danone’s water sales by region for 2001 was: 64percent Rest of the World, 19 percent Rest of Europe, and 17percent France.
Clearly, Danone is a favorite in its home country and inEurope, where Danone has enjoyed continued growth throughinnovation. The firm has experienced high growth in Europewith flavored waters and has even introduced diet waters inFrance and Italy. European growth has even been derivedfrom offering certain sized containers and enviro-friendlycontainers that easily collapse to encourage popular recyclingcampaigns. Danone has not introduced these innovative prod-ucts in the U.S. water market. However, the company has builta very strong presence globally, where it is typically rankedamong the top three companies in the countries in which itoperates. Danone’s leadership position in water sales in var-ious countries is illustrated in Exhibit 3. Although the datafrom the table show how successful Danone’s water opera-tions are globally, the U.S. market clearly stands out as one ofdisappointing performance.
Evian: Danone’s Glacier Brand
Driving Danone’s global water sales is the successful exten-sion of Evian as a global brand. Evian is the number twowater brand in the world by volume, and it is shipped to over120 countries on five continents each day. Evian distinguishesitself as pristine, natural spring water, bottled at one source,Cachat Spring in Evian-Les-Bains, France. The magnificentFrench and Swiss Alps converge around the Mont Blanc,which towers above the lakeside town of Evian-Les-Bains.The spring waters from Cachat Springs are world renowned,and Evian-Les-Bain is famous in Europe for its spa resorts.
Untouched by Man. Perfect by Nature is a trademark ofEvian Natural Spring Water, and it is used to imply unique
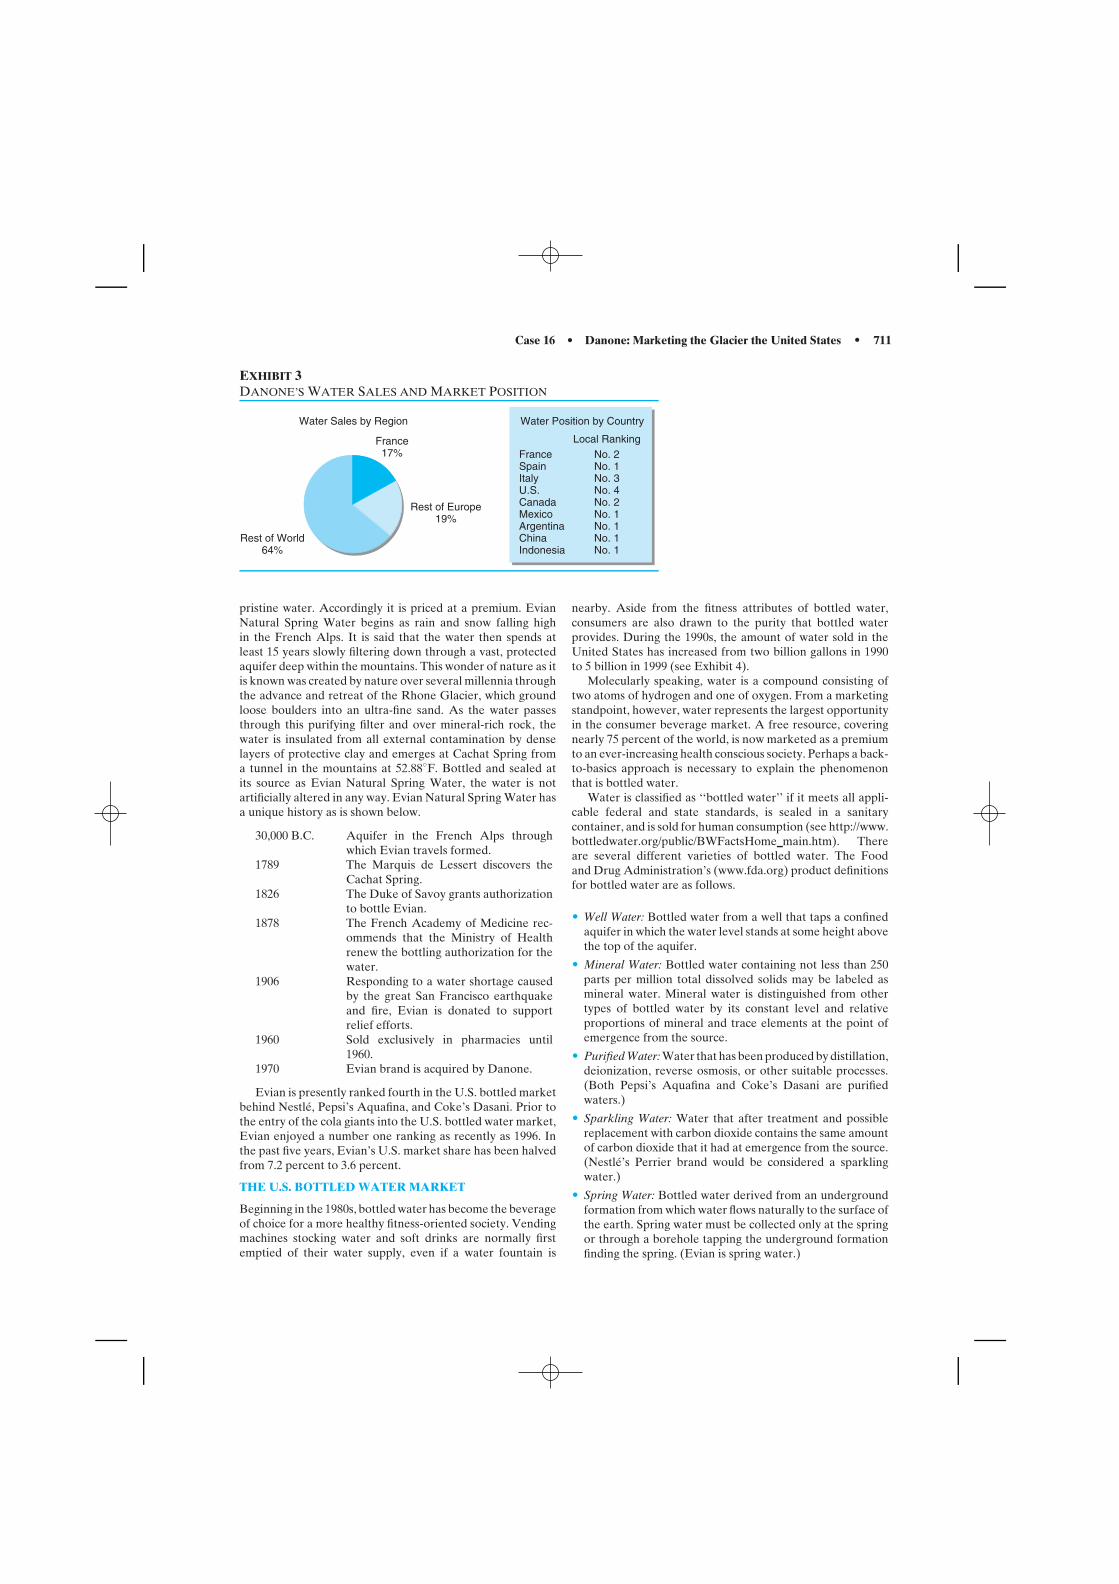
Case 16 • Danone: Marketing the Glacier the United States • 711
EXHIBIT 3DANONE’S WATER SALES AND MARKET POSITION
Rest of World64%
France17%
Rest of Europe19%
Water Position by CountryWater Sales by Region
Local RankingNo. 2No. 1No. 3No. 4No. 2No. 1No. 1No. 1No. 1
FranceSpainItalyU.S.CanadaMexicoArgentinaChinaIndonesia
pristine water. Accordingly it is priced at a premium. EvianNatural Spring Water begins as rain and snow falling highin the French Alps. It is said that the water then spends atleast 15 years slowly filtering down through a vast, protectedaquifer deep within the mountains. This wonder of nature as itis known was created by nature over several millennia throughthe advance and retreat of the Rhone Glacier, which groundloose boulders into an ultra-fine sand. As the water passesthrough this purifying filter and over mineral-rich rock, thewater is insulated from all external contamination by denselayers of protective clay and emerges at Cachat Spring froma tunnel in the mountains at 52.88◦F. Bottled and sealed atits source as Evian Natural Spring Water, the water is notartificially altered in any way. Evian Natural Spring Water hasa unique history as is shown below.
30,000 B.C. Aquifer in the French Alps throughwhich Evian travels formed.
1789 The Marquis de Lessert discovers theCachat Spring.
1826 The Duke of Savoy grants authorizationto bottle Evian.
1878 The French Academy of Medicine rec-ommends that the Ministry of Healthrenew the bottling authorization for thewater.
1906 Responding to a water shortage causedby the great San Francisco earthquakeand fire, Evian is donated to supportrelief efforts.
1960 Sold exclusively in pharmacies until1960.
1970 Evian brand is acquired by Danone.
Evian is presently ranked fourth in the U.S. bottled marketbehind Nestle, Pepsi’s Aquafina, and Coke’s Dasani. Prior tothe entry of the cola giants into the U.S. bottled water market,Evian enjoyed a number one ranking as recently as 1996. Inthe past five years, Evian’s U.S. market share has been halvedfrom 7.2 percent to 3.6 percent.
THE U.S. BOTTLED WATER MARKET
Beginning in the 1980s, bottled water has become the beverageof choice for a more healthy fitness-oriented society. Vendingmachines stocking water and soft drinks are normally firstemptied of their water supply, even if a water fountain is
nearby. Aside from the fitness attributes of bottled water,consumers are also drawn to the purity that bottled waterprovides. During the 1990s, the amount of water sold in theUnited States has increased from two billion gallons in 1990to 5 billion in 1999 (see Exhibit 4).
Molecularly speaking, water is a compound consisting oftwo atoms of hydrogen and one of oxygen. From a marketingstandpoint, however, water represents the largest opportunityin the consumer beverage market. A free resource, coveringnearly 75 percent of the world, is now marketed as a premiumto an ever-increasing health conscious society. Perhaps a back-to-basics approach is necessary to explain the phenomenonthat is bottled water.
Water is classified as ‘‘bottled water’’ if it meets all appli-cable federal and state standards, is sealed in a sanitarycontainer, and is sold for human consumption (see http://www.bottledwater.org/public/BWFactsHome main.htm). Thereare several different varieties of bottled water. The Foodand Drug Administration’s (www.fda.org) product definitionsfor bottled water are as follows.
• Well Water: Bottled water from a well that taps a confinedaquifer in which the water level stands at some height abovethe top of the aquifer.
• Mineral Water: Bottled water containing not less than 250parts per million total dissolved solids may be labeled asmineral water. Mineral water is distinguished from othertypes of bottled water by its constant level and relativeproportions of mineral and trace elements at the point ofemergence from the source.
• Purified Water: Water that has been produced by distillation,deionization, reverse osmosis, or other suitable processes.(Both Pepsi’s Aquafina and Coke’s Dasani are purifiedwaters.)
• Sparkling Water: Water that after treatment and possiblereplacement with carbon dioxide contains the same amountof carbon dioxide that it had at emergence from the source.(Nestle’s Perrier brand would be considered a sparklingwater.)
• Spring Water: Bottled water derived from an undergroundformation from which water flows naturally to the surface ofthe earth. Spring water must be collected only at the springor through a borehole tapping the underground formationfinding the spring. (Evian is spring water.)
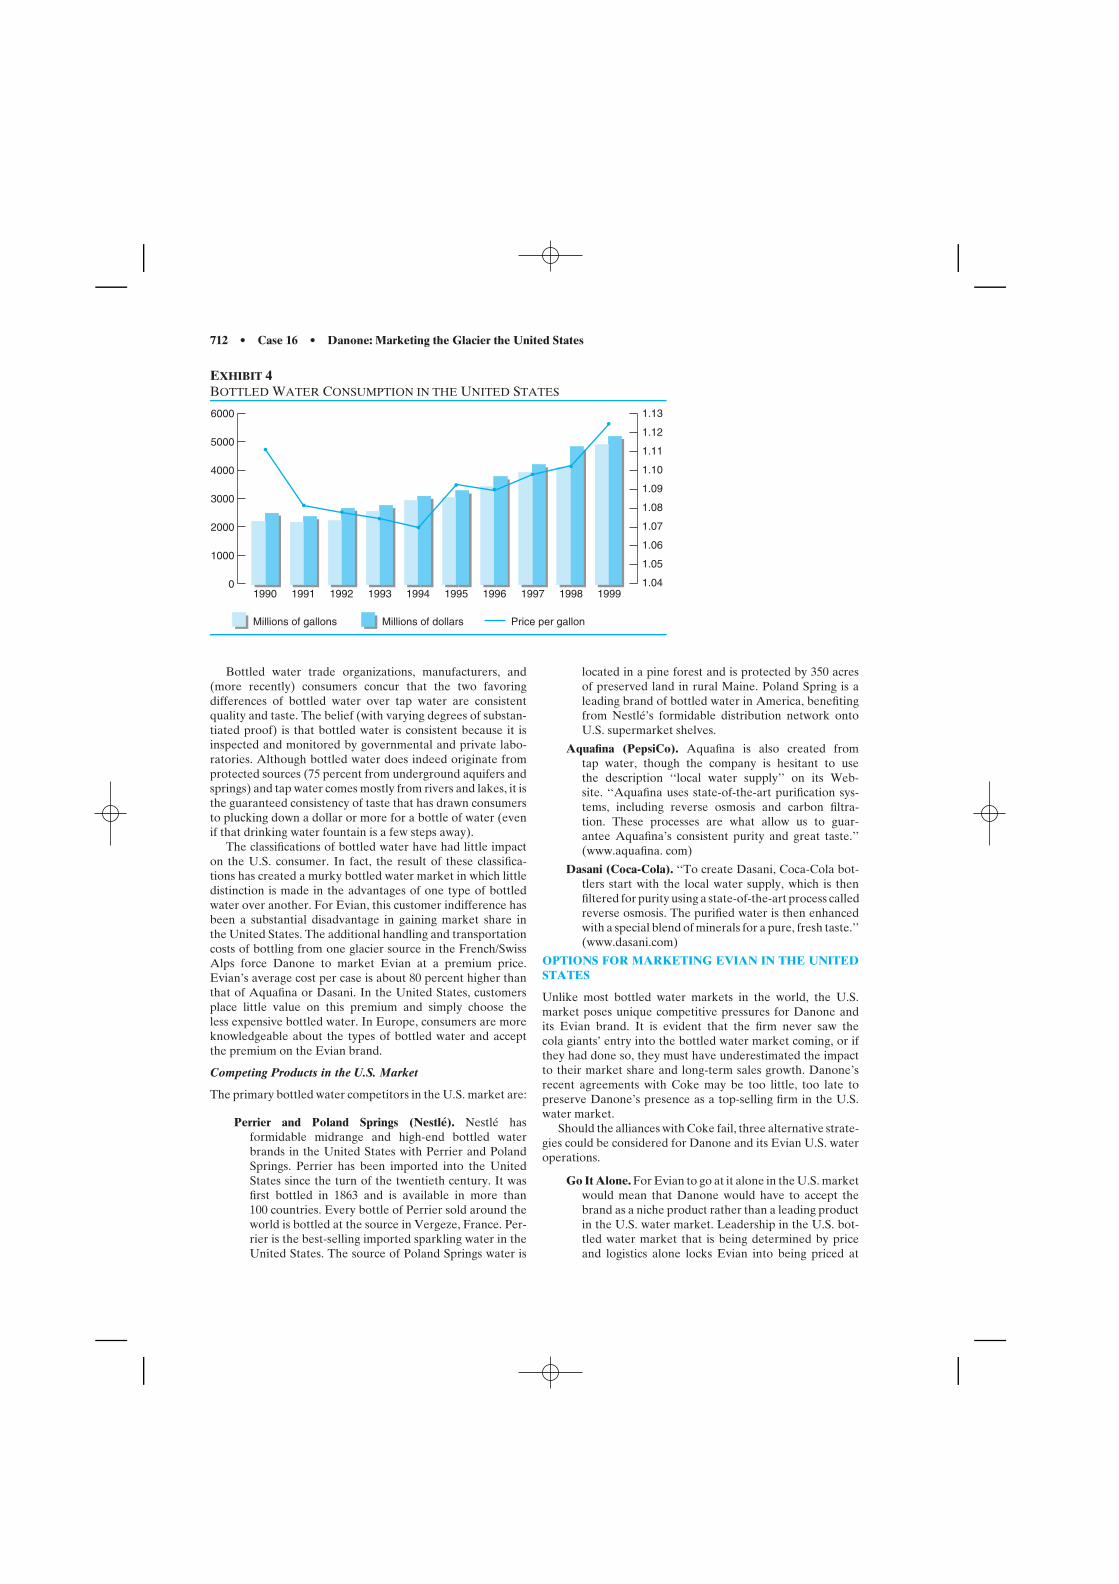
712 • Case 16 • Danone: Marketing the Glacier the United States
EXHIBIT 4BOTTLED WATER CONSUMPTION IN THE UNITED STATES
1990
Millions of gallons
1991 1992 1993 1994 1995 1996 1997 1998 19991.04
1.05
1.06
1.07
1.08
1.09
1.10
1.11
1.12
1.13
0
1000
2000
3000
4000
5000
6000
Millions of dollars Price per gallon
Bottled water trade organizations, manufacturers, and(more recently) consumers concur that the two favoringdifferences of bottled water over tap water are consistentquality and taste. The belief (with varying degrees of substan-tiated proof) is that bottled water is consistent because it isinspected and monitored by governmental and private labo-ratories. Although bottled water does indeed originate fromprotected sources (75 percent from underground aquifers andsprings) and tap water comes mostly from rivers and lakes, it isthe guaranteed consistency of taste that has drawn consumersto plucking down a dollar or more for a bottle of water (evenif that drinking water fountain is a few steps away).
The classifications of bottled water have had little impacton the U.S. consumer. In fact, the result of these classifica-tions has created a murky bottled water market in which littledistinction is made in the advantages of one type of bottledwater over another. For Evian, this customer indifference hasbeen a substantial disadvantage in gaining market share inthe United States. The additional handling and transportationcosts of bottling from one glacier source in the French/SwissAlps force Danone to market Evian at a premium price.Evian’s average cost per case is about 80 percent higher thanthat of Aquafina or Dasani. In the United States, customersplace little value on this premium and simply choose theless expensive bottled water. In Europe, consumers are moreknowledgeable about the types of bottled water and acceptthe premium on the Evian brand.
Competing Products in the U.S. Market
The primary bottled water competitors in the U.S. market are:
Perrier and Poland Springs (Nestle). Nestle hasformidable midrange and high-end bottled waterbrands in the United States with Perrier and PolandSprings. Perrier has been imported into the UnitedStates since the turn of the twentieth century. It wasfirst bottled in 1863 and is available in more than100 countries. Every bottle of Perrier sold around theworld is bottled at the source in Vergeze, France. Per-rier is the best-selling imported sparkling water in theUnited States. The source of Poland Springs water is
located in a pine forest and is protected by 350 acresof preserved land in rural Maine. Poland Spring is aleading brand of bottled water in America, benefitingfrom Nestle’s formidable distribution network ontoU.S. supermarket shelves.
Aquafina (PepsiCo). Aquafina is also created fromtap water, though the company is hesitant to usethe description ‘‘local water supply’’ on its Web-site. ‘‘Aquafina uses state-of-the-art purification sys-tems, including reverse osmosis and carbon filtra-tion. These processes are what allow us to guar-antee Aquafina’s consistent purity and great taste.’’(www.aquafina. com)
Dasani (Coca-Cola). ‘‘To create Dasani, Coca-Cola bot-tlers start with the local water supply, which is thenfiltered for purity using a state-of-the-art process calledreverse osmosis. The purified water is then enhancedwith a special blend of minerals for a pure, fresh taste.’’(www.dasani.com)
OPTIONS FOR MARKETING EVIAN IN THE UNITEDSTATES
Unlike most bottled water markets in the world, the U.S.market poses unique competitive pressures for Danone andits Evian brand. It is evident that the firm never saw thecola giants’ entry into the bottled water market coming, or ifthey had done so, they must have underestimated the impactto their market share and long-term sales growth. Danone’srecent agreements with Coke may be too little, too late topreserve Danone’s presence as a top-selling firm in the U.S.water market.
Should the alliances with Coke fail, three alternative strate-gies could be considered for Danone and its Evian U.S. wateroperations.
Go It Alone. For Evian to go at it alone in the U.S. marketwould mean that Danone would have to accept thebrand as a niche product rather than a leading productin the U.S. water market. Leadership in the U.S. bot-tled water market that is being determined by priceand logistics alone locks Evian into being priced at
Case 17 • BMW Marketing Innovation • 713
a premium and therefore not competitive for marketshare. By marketing Evian’s unique pristine quali-ties, and positioning the brand as a niche, high-endpremium beverage with a ‘healthy’ edge, Evian maybe able to provide Danone a higher-margin product,albeit with smaller volumes.
A second part to Danone’s U.S. water market strat-egy would be to position its Dannon spring water, alocally sourced spring water, to compete against Nestleand the colas for market share in the high-volume,price-driven retail market. However, the Dannonline’s production and distribution would have to bebuilt out with acquisitions. The strategy to go it alonewould require high investment from Danone, andthe return on that investment would be very long incoming.
Get out of the U.S. Market. Another option presentedto Franck Riboud is to leave the United States alto-gether, keeping the Evian brand in the United Statesonly as a niche player. Perhaps management needsto realize that water drinkers in the United Stateswith their lack of differentiation among bottled watervarieties, are not within the scope of Danone’s globalmarketing strategies. Because the marketing successesthat Evian has experienced in other countries cannottranslate to the U.S. market, a no-entry strategy wouldeliminate costly entry expenditures and allow Danoneto shift focus to gaining share in countries where the‘‘glacier premium’’ is recognized. This option couldbe referred to as the ‘‘LU Biscuit strategy’’—whileDanone’s biscuit brand is number two in the world, itis nonexistent in the United States.
Merger/Acquisition. Among the possible acquisition suit-ors for Danone, including Nestle, Unilever, and eventhe cola giants, Kraft Foods appears to be the companybest positioned to capitalize on the merged syner-gies. Kraft is the largest branded food and beveragecompany in North America and the second largestworldwide, based on 2001 revenues (Nestle is num-ber one). Kraft’s brands are sold in more than 145countries. According to AC Nielsen statistics, they
are found in more than 99 percent of all householdsin the United States. Nearly three times the size ofDanone, Kraft derives 70 percent of its revenues fromNorth America and has an extensive brand portfo-lio that includes a variety of food products exceptfor bottled water. Acquiring Danone would allow forentry into the growing bottled water market, as wellas increase the consumer base into Europe and Asia.One of Kraft’s core strategic goals is to increase itsglobal economies of scale and expand its brands geo-graphically. Acquiring Danone would be in alignmentwith this strategy— its 90 percent revenue base out-side of the United States and owner of the number twowater brand in the world could make a Kraft/Danonecombination a true synergy fit.
Perhaps one of the most important factors stopping anacquisition of Danone is company’s nationalistic, historical,and family pride. Franck Riboud’s family, his allegiance tohis French culture, and his sense of individual ownership ofthe Danone brands are formidable blockades to allowing thecompany to be acquired.
Riboud contemplates Danone’s U.S. bottled water marketstrategy as he windsurfs the calm waters of Lake Geneva. Hemuses, ‘‘Five years from now, could the decision I will makebe the subject of numerous business school case studies asthe correct way to maintain market presence in the U.S. or awrong way?’’ Of course, only time will tell.
DISCUSSION QUESTIONS
1. Why has Evian’s U.S. market share continually decreasedsince the emergence of the cola giants’ bottled water brandsin the late 1990s?
2. In evaluating Danone’s strategy for gaining U.S. marketshare, present the positives and negatives for remaining asingle-enterprise entity and ‘‘going it alone.’’
3. Given Evian’s lack of success in the U.S. market, whatwould be the ramifications of Danone’s’ existing the U.S.bottled water market altogether?
4. Are the joint ventures with Coca-Cola the right decision?Why or why not?
� � � � � � � � � � � � � � � � � � � � � � � � � � � � � � �
CASE 17
BMW MARKETING INNOVATION
Since the competition started to imitate BMW’s advertisingmessages of outstanding quality, BMW decided to come upwith a unique way of reaching its target audience. The com-pany did so by hiring Fallon Worldwide, an advertisementagency based in Minneapolis, Minnesota, to come up with anew campaign. Fallon developed the concept of ‘‘The Hire’’
This case was prepared by Martin Hellhake, Fabian Henault, and JoshJacob of Temple University under the supervision of Professor MasaakiKotabe for class discussion rather than to illustrate either effective orineffective management of a situation described (2002).
series. Fallon’s responsibility also included the way in whichthese movies were to be delivered to BMW’s target audience.It was also questionable whether the campaign should be thesame throughout the world, or if it should be localized toadapt to language and consumer taste differences. In orderto attract highly recognized directors, as well as actors, BMWwas willing to spend a large amount of money.
In addition to coming up with a unique advertising cam-paign, BMW also wanted to change its image. One of the goalswas to make BMW look not only cool, but likeable, which
714 • Case 17 • BMW Marketing Innovation
the brand needs to do to combat negative perceptions somepeople have based on old associations with the 1980s styleyuppie arrogance.
COMPANY PROFILE
BMW (Bayerische Motoren Werke Aktiengesellschaft) wasfounded in 1916 and has been publicly traded since 1969. Thecompany produces, and markets, a varied range of higher endsporty cars and motorcycles. BMW has also manufactured thefirst passenger car running on hydrogen ready for commonuse, although the production figures are limited by the lack ofa respective filling station net. In addition to cars and motor-cycles, BMW operates an aircraft engine division under thebrand name of Rolls Royce.
The company has worldwide subsidiaries and manufactur-ing plants in Germany, Austria, the UK, the United States,Mexico, Brazil, South Africa, Egypt, Thailand, Malaysia,Indonesia, the Philippines, and Vietnam. The company alsooperates its own financing company, which offers financingfor vehicles. Automobiles accounted for 78 percent of 2000revenues; vehicle finance leasing, 18 percent; motorcycles,3 percent; and other, 1 percent (see Exhibit 1).
EXHIBIT 1BMW’S REVENUE SOURCES
Auto Motor-cycles
Financeleasing
2000 Revenue
Other0%
10%
20%
30%
40%
50%
60%
70%
80%
MARKETING OVERVIEW
The majority of BMW’s success is attributed to the devel-opment of a consistent marketing policy, the market nichestrategy. The company has built its brand on four core values:
• Technology
• Quality
• Performance
• Exclusivity
BMW has maintained these core values since the com-pany’s inception. Coupled with WCRS (BMW’s advertisingagency since 1979), the company has adopted a consistentadvertising strategy. In addition to the message of these val-ues being portrayed in advertising campaigns, the companyexplicitly expresses one or more of these values in all BMWadvertisements. However, it is important to point out thatBMW also relies on its sensitivity to the environment, whichis clearly seen by how the company’s advertisements evolved
in response to economic, environmental, and competitivechanges.
This design philosophy, which runs through every BMW,has been communicated through a number of TV and printads. The brand image has been built up by using over 300color press advertisements and, more recently, through a totalof 64 different television commercials. Throughout this cam-paign, BMW has remained true to its beliefs in focusing onthe substance of the cars themselves.
In addition to the high-profile national color press andtelevision advertising, individual dealers are encouraged torun their own local campaigns. Local press, radio, and busadvertisements are all available from BMW dealer marketing.In addition, brochures, price lists, and dealership point-of-salematerials are made accessible through the corporate office.BMW encourages its dealers to make use of these services.Providing the dealers with a central source for advertising,BMW ensures that all communications remain standardizedas well as maintaining BMW’s brand values.
BMW has embarked on a global advertising campaign.What differentiates this promotion is the fact that it remainsconsistent throughout the company’s international campaignacross the European, U.S., Asian, South African, and MiddleEastern markets. In over 15 countries there will be:
• TV spots
• Print advertisements
• Mega-posters
• Radio spots
• Events
In all three James Bond films, BMW, MGM, and EON Pro-ductions Ltd. worked together on a cross-promotion project.This was accomplished worldwide with TV commercials andprint ads, as well as displays in BMW dealer showrooms.
BMW FILM
The best new film series, by the most cutting-edge directors,are not playing at the local theater. Instead, these films areaccessible through your home computer as well as your localBMW dealership.
Since its launch at BMWFilms.com, ‘‘The Hire’’ (a filmseries consisting of five different short films) has been singledout as the first high-profile, big-budget, celebrity-laden Inter-net marriage of advertising and entertainment. It has beenreviewed, scrutinized, deconstructed, and cited as evidenceof the perilous future for traditional advertising. New YorkTimes film critic Elvis Mitchell called the series ‘‘a marriageof commerce and creativity, straddling the ever-dwindling linebetween arts and merchandising.’’ BMWFilms is simply thelatest and possibly the hippest Website to make use of stream-ing video in order to lure prospective customers. Fast cars,mysterious passengers, Buddhist monks, rock superstars, andsinister enemies are all part of the film series, which are pre-sented in installments by some of Hollywood’s top directors.These films are being advertised on television the same waythat movie trailers are advertised; the difference is that insteadof the catch-phrase ‘‘Coming soon to a theater near you,’’ thiscatch phrase reads ‘‘See it only on BMWFilms.com.’’
Actor Clive Owen (star of the acclaimed British filmCroupier and, in the opinion of his growing legion of fans,
Case 17 • BMW Marketing Innovation • 715
the next James Bond) is ‘‘The Hire’’ in the series title, askilled mercenary driver who seems to specialize in riskyassignments. While he is certainly a smooth operator behindthe wheel (very ‘‘James Bond’’ like), it is always the UltimateDriving Machine that saves the day. The car is definitely thestar of the show.
Each episode features a ‘‘driver’’ (in a BMW, naturally)who is on a mysterious nighttime mission along with a mysteri-ous passenger. Examples include one incident where the driveris on the run with a small Buddhist boy and another episodethat has an arrogant superstar diva (played by Madonna)desperately wanting to escape the swarm of the paparazzi.
Filmgoers, thrill seekers, and potential customers have theoption of watching the video using Real Video or Quick-Time video players. Another option is to download the BMWFilm Player, a fairly simple process offered through the BMWWebsite, which turns the computer screen into a miniaturepersonal theater complete with ‘‘DVD quality’’ pictures andsound. Installing this player allows the user to download andview the video on the full computer screen while offline. Inaddition to the full-length videos, BMW also offers trailersfor those customers with slower modem connections. Thesetrailers allow viewers to have a ‘‘quick peek’’ at the films.
The numbers of viewers to the site are soaring each week.One week following the advertising blitz of the Website films,traffic to the site was up 55 percent to 214,000 unique visitorscompared to only 138,000 the previous week (according to theWeb measurement firm Nielsen/Net Ratings). This tremen-dous leap made BMWFilms one of the Internet’s fastestgrowing sites.
The films all have differentiating styles, but they all holdone thing in common: the majority of the action takes place ina BMW while the participants are in the middle of a car chase.There is no limit to the actual number of BMWs that you willsee; one, two, three, even more Beemers are seen speedingdown alleyways and streets, screeching around corners.
BMW did not randomly decide to initiate a Web-basedadvertising campaign. The company clearly did its homework.It is well known among advertising firms that over 85 per-cent of potential car buyers will conduct most (if not all) oftheir initial research on the Internet before they make a finaldecision on a purchase. Therefore, BMW has made it con-venient for shoppers by adding a link to their film site fromBMWUSA.com. This site gives consumers basic informationabout the car(s) as well as the location and phone number ofthe local dealerships.
Given that the average BMW automobile starts at approx-imately $30,000, the company’s decision to design a classyfilm series, which can be viewed on a high-speed Internetconnection by an upscale, mostly male audience, is clearlytargeted.
The simple concept of these films—BMW wants to sellcars!
Film Concept
In the spring of 2000, two factors were on the table at BMW.The first was concern over TV effectiveness, and the sec-ond was how to exploit the popularity of the Internet. BMWwanted to come up with an entirely new branding campaign;too many competitors were copying the ‘‘look and feel’’ of theBMW, and the company needed to do something different to
distinguish itself. On a more basic level, BMW was growingmore concerned about its ability to reach its core market viatraditional methods such as network TV.
The creative team of writer David Carter and art directorJoe Sweet had recently completed a project for Timex withdirector Tim Burton. This marketing campaign incorporatedan Internet portion that featured short videos specifically shotfor the Web.
The executives at BMW saw this as a way to differenti-ate the company from other manufacturers. BMW wantedsomething done exclusively for the Internet, something notonly entertaining but also cinematic. A concept was born—alonger film that would be shot in segments and distributedvia the Internet as a series. This series would combine prod-uct placement with entertainment. Most importantly, it wouldallow BMW to push the envelope when it came to scripting theseries. The Internet would allow the company to show what aBMW can do when pushed to the limits, under extreme con-ditions and circumstances. BMW would not be able to conveythis type of advertising through traditional TV ads, without afew hundred disclaimers.
BMWFilms has accomplished several objectives; the mostimportant being the tremendous buzz in both the enter-tainment and business press. This was important to BMW,since one of its goals was to make the BMW look cool,without the old association with the 1980s style of yuppiearrogance.
A fact that was not prominently mentioned in much of thecoverage of ‘‘The Hire’’ was that the core creative concept,along with key strategic thinking, Web development, and sev-eral scripts, all came from one source: Publicis Troupe’s FallonWorldwide in Minneapolis. ‘‘I think we’re reinventing adver-tising,’’ said David Lubars, Fallon president and executivecreative director. Lubars added: ‘‘We’re not looking to makethis a template, as though this is what advertising is [going tobe]. I think what technology affords you is that every clientcan get their own customized media approach, and this wasreally right for this client.’’
‘‘BMWFilms.com is a good example of blurring thelines between entertainment and advertising,’’ said JarvisMak, senior Internet analyst at NetRatings. ‘‘The site com-bines Hollywood’s intense car chase scenes and Internetvideo to deliver a new spin on product showcasing,’’ addedMak.
‘‘We think that a lot of the time when people view tradi-tional advertising they view it through a filter of disbelief,’’said Jim McDowell, vice president of marketing for BMWof North America. ‘‘When people watch entertainment or amovie, then they’re watching in an entirely different way wherethey enjoy the fantasy, and hopefully remember it and share itwith others.’’ ‘‘We thought maybe instead of doing advertisingwe should be doing entertainment and doing something funand interesting on the Web,’’ McDowell said.
What if you do not have a computer, or if your computer isnot hooked to a T1 connection? Never fear, BMW has alreadybegun buying infomercial time on the Bravo and Speedvisionchannels to showcase their ‘‘Hire’’ series.
Target Audience
Initially, BMW had no real idea as to whom the films wouldappeal. BMW executives knew they would have everyone
716 • Case 17 • BMW Marketing Innovation
from high school students to 7-Series owners as viewers.BMW’s guess was that their central tendency would be25-year-olds with a median income of $100,000. BMW andFallon research indicated that many were tech-savvy and hadfast, reliable access to the Web. Most important, 85 percent ofbuyers had researched the vehicle on the Web before steppinginto a showroom.
Characteristics of the Typical BMW Target Audience
Societal values are changing rapidly. Society will increasinglytake its cue from Generation X’ers and dot.comers rather thanthe baby boomers who have dominated its thinking for mostof four decades. Associated with that demographic shift willbe a return to the appreciation of self-reliance and cooper-ation—self-reliance because the traditional safety platformssuch as Social Security and pensions will no longer exist, andcooperation because it involves group action that, in turn, isthe optimal strategy for the use of scarce resources. Familyissues such as long-term health care, day care, and antidrugcampaigns will remain dominant issues until the end of thedecade.
Generation X and dot.com will have major effects in thefuture. This 30-something Generation X cohort will be rec-ognized for its entrepreneurial instinct since its members arestarting businesses at unprecedented rates. They are econom-ically conservative, begin saving at an earlier age, and seekthe shallow information skimmed from CNN or USA Todayrather than absorb in-depth reporting.
Members of the dot.com generation, now entering their20s, are proving to be even more business-oriented. Twiceas many say they would prefer to own a business ratherthan be a top executive. By a factor of 5 to 1, they wouldrather own a business than hold a key position in politics orgovernment.
In summary, the corporate and business culture of thebaby boomers is a mismatch for these advancing generationsthat thrive on challenge and opportunity. It is more thancash that they want. They understand the need for lifelonglearning because that is the way life has always been forthem. In addition, as both customers and employees, theywill demand even more advanced telecommunications andnet-based transactions. Consumerism is still growing rapidly.Because consumers will increasingly have access to and infor-mation about pricing, services, delivery time, and customersatisfaction through the Internet, the consumer marketingbattle will see a halt in the decline of prices and a counterpre-vailing shift to service improvement and salesmanship.
In the end, however, fixed pricing will fall out of favor asgoods and services are sold through online auctioning. Theproponents of the need for improved customer service willbe proved right. To quote the report, ‘‘As prices fall to com-modity levels and online stores can list virtually every productand brand in their industry without significant overhead, ser-vice is the only field left in which marketers can competeeffectively.’’
Lorraine Ketch, the director of planning in charge of Levi’strendy Silvertab line explained, ‘‘This audience hates market-ing that’s in your face. It eyeballs it a mile away, chews it up,and spits it out.’’
As expected, branded items with dominant reputations willremain powerful and in demand.
MARKETING CHANNELS
Internet
Auto manufacturers have taken some innovative approachesto draw Internet users to their Websites. However, it is sur-prising how quickly innovative becomes ordinary. Slide shows,flash animation, and surround video are now commonplace onmost manufacturer’s sites. In addition, contests have becomeso common that the possibility of winning a free car may notbe enough to hold a viewer for more than a few minutes.
Ad banners 468 × 60 in size are sold on a run-of-site (ROS)basis, meaning that they will appear on every search resultspage and on an equal rotating basis with other advertisers’banners. Advertising rates for 468 × 60 ad banners are com-puted on a cost-per-thousand (CPM) impression basis and arecurrently priced at US$10 to $15 CPM. Flashing banners andother methods cost slightly more based on the Website andtechnology involved.
For online ads, each advertiser is given password-protectedaccess to real-time advertising statistics, including how manyimpressions were served, how many click-throughs wereachieved, and what click-through rate was achieved. Theindustry standard for the click-through rate is anywhere from0.25 percent to 2 percent, for sites like CNN, ZDNet, orYahoo. Your actual click-through rate will depend on theappearance of your ad and on what it offers in terms of amarketing message and call to action. Just like running a tele-vision commercial during prime time, or placing a full-pagead in Time magazine, these ads do not necessarily cause peo-ple to pick up the phone and order a product at that verymoment, whereas a Web-based process that guides the con-sumer through a systematic process makes a purchase morelikely. Specifically, these types of ads build name recognitionfor the company and establish it as a major force in the indus-try. Then, when consumers are ready to buy, your companywill come to mind.
Television
The 1999 American Association of Advertising AgenciesCommercial Production Costs Survey revealed that the aver-age cost of a 30-second national commercial for an automobilewas a whopping $389,000. The percentages of viewers ofMSNBC and Bravo who are in BMW’s target income bracketconstitute 20.5 percent. The percentage of viewers in BMW’starget age group (25–34) is 26.5 percent.
The advertising rates in a periodical like Time magazine rangefrom $250,000 for a full-page mono to $360,000 for a full-pagecolor ad. The average age of a Time magazine subscriber is 45,and readers have a median income of $69,000. This audienceis twice the age and has half the income of BMW’s intendedtarget market. Time magazine is one of the premier periodicalson the market at this time.
DVD Promotions/Freebies
The cost of producing a DVD master is between $50,000 and$100,000—plus the cost of producing any bonus materials.DVD player penetration in the United States today is approx-imately at 25,600,000 units. This trend is supposed to increase,and the DVD is projected to become the next VHS.
Case 18 • Herman Miller, Inc. vs. ASAL GmbH • 717
COMPETITIVE ANALYSIS
In 1997, BMW was in danger of losing its long-standing leadin the import luxury car segment. Mercedes, Lexus, and Audiwere coming on strong, with great new products and new mar-keting campaigns designed to dethrone BMW. Nearly half ofthose considering a luxury car rank ‘‘fun to drive’’ as theirnumber one reason for purchasing the car. However, for thefirst time since BMW had been tracking its image, consumersranked BMW at virtually the same level as Mercedes or Lexuson attributes like ‘‘fun to drive’’ and ‘‘responsive handling.’’
BMW’s three biggest competitors had launched new adver-tising campaigns that highlighted what traditionally had beenBMW’s greatest strength: performance. Therefore, BMW wasnot able to distinguish itself anymore as the only companythat boasted the unparalleled standard of quality as before.
Mercedes
The range of cars from the giant company DaimlerChryslertraditionally rival BMW’s. In 2000, DaimlerChrysler sold1,155,000 units and had revenues of 43.7 billion euro. Mer-cedes’ strengths would be its global presence, strong brandpresence, product range, and technology leadership. Mer-cedes’ marketing campaigns have always been subdued andlow key. It allocates 25 percent of its annual marketing bud-get to innovative Internet strategies, recognizing the powerof the Internet for delivering effective and precise market-ing campaigns. When the car manufacturer launched the newMercedes C Class Sports Coupe, it positioned the onlinecampaign right at the top of its marketing mix. Joining ina winning partnership with MSN, another global brand withsimilar values, Mercedes sponsored A-Ha’s eagerly awaitedhomecoming concert.
Lexus
Sparked by a decision from Toyota chairman Eiji Toyoda in1983 to challenge the best luxury vehicles, Lexus has sincegrown into one of the world’s most inspiring automobile com-panies. Lexus is a division of Toyota Motor Sales, U.S.A., Inc.It is trying to leverage the Japanese technology to add brandvalue to its vehicle. Lexus is America’s top-selling luxury mar-quee. The tough task for Lexus is to lose the ‘‘Cheap ButReliable’’ Toyota image. The annual sales of Toyota vehiclesin the United States have been on the order of $90 to $93million in recent years.
According to Chris Conrad, Lexus’ national advertisingmanager, Lexus is targeting its youngest buyers ever with the
IS 300, roughly 75 percent male, between the ages of 35 and 40,married, highly educated, with annual household incomes of$100,000. The current average age of a Lexus owner is 50, withthe median age of the brand’s hottest selling vehicle, the RX300 sport-utility, at 48. The estimated $32 million campaignfor the car broke recently on national TV and will continuefor the next six months. Team One, El Segundo, California,created the two national TV commercials as well as five TVspots for regional dealer ad groups and two magazine ads. Theagency also created billboards and six commercials that willbe projected on buildings in three cities.
Their online presence even for this campaign is limited,though Lexus is one of the advertisers launching a rich-mediacampaign on the Excite Network, which includes WebCrawlerand Classifieds 2000.
Audi
Audi is an international developer and manufacturer of high-quality cars. In 2000, the company sold more than 650,000Audi models. The sales revenues of the Audi Group totaled39 billion Deutsche marks. The Audi Group has slowly butsurely been encroaching on the BMW and Mercedes markets.It has been trying to promote the exclusivity of its cars.
Recently, Audi of America has embarked on its most ambi-tious online marketing effort ever. The European car importerkicked off the ‘‘Double Take’’ ‘‘advertainment’’ online sweep-stakes as part of its $25 million launch of the redesigned 2002A4 sedan. Visitors to the site can try to solve mysteries afterviewing clues from three short episodes involving the A4.They can also register to win prizes while learning about thecar and its features. The grand prize is a three-day trip for twoto the Audi Driving Experience at the Panoz Driving Schoolin Atlanta, Georgia. The sweepstakes, run by Don JagodaAssociates, Melville, New York, allows prospects to enter upto eight times. ‘‘The main thing is to educate and entice usersto go to dealerships,’’ said Steve Glauberman, president-CEOof Enlighten, the privately held Ann Arbor, Michigan, creatorof the site and sweepstakes.
DISCUSSION QUESTIONS
1. Should BMW be using a uniform global promotion strat-egy?
2. Should BMW show its new marketing campaign on theInternet exclusively, or should it be part of the media mix?
3. What are the implications of marketing for dot.comers andGeneration X’ers?
� � � � � � � � � � � � � � � � � � � � � � � � � � � � � � �
CASE 18
HERMAN MILLER, INC. VS. ASAL GMBH
In early May 1999, Vreni Sahli, international sales man-ager for office furniture manufacturer Herman Miller, Inc.(www.hermanmiller.com), received a call from John PaulFournier, manager of Herman Miller Ltd.’s German oper-ation. According to Ms. Sahli, Mr. Fournier ‘‘informed me
that they had become aware of a company by the name ofASAL showing and selling chairs, Aeron chairs, in the Ger-man market.’’ The Aeron chair, one of Herman Miller’smost successful new product lines with ‘‘a patent list aslong as your arm’’ (www.hermanmillered.com/catalog/), is
718 • Case 18 • Herman Miller, Inc. vs. ASAL GmbH
a unique, trademarked product nominated ‘‘Design of theDecade’’ by Business Week magazine. Fournier’s concernstemmed from complaints from Herman Miller’s authorizeddealers/distributors who were surprised to find an establishedGerman firm, ASAL GmbH, selling Herman Miller Aeronchairs and keyboard trays at the INTERZUN InternationalTrade Fair in Koln, Germany. Herman Miller had an estab-lished distribution system in Europe consisting of 100 orso authorized dealers/distributors with exclusive territories.ASAL GmbH was not one of them. Authorized HermanMiller dealers/distributors complained that ASAL GmbH wasselling Aeron chairs for less money than they could buy themfor! Keiro, a Herman Miller, Ltd. dealer in Europe calledHerman Miller to ‘‘say they have exclusive rights; (ASAL)can only sell chairs at list price as per HMI.’’
Despite Herman Miller’s corporate policies that prohibitauthorized dealers/distributors from selling directly to over-seas clients outside their assigned territory, Fournier toldVreni Sahli that ASAL GmbH was acquiring the chairsthrough a Florida company. As international sales manager,Sahli reported directly to the VP of International Sales andDistribution. She did not typically get involved with exclu-sively U.S. dealers. However, within days, she was on thephone with Jack Howard, general manager of Herman MillerFlorida, Inc. and president of Office Pavilion South Florida,Inc. Herman Miller Florida was Herman Miller’s subsidiaryin Florida, and Office Pavilion South Florida was a company-owned dealer. ‘‘Jack did confirm for me that there was adocument that had been signed by Office Pavilion in Miamiwith ASAL [Products Inc., a Florida corporation] with theintent to distribute keyboard trays for particular manufactur-ing environments in the German market through a companyover there.’’
Vreni Sahli faced one of the toughest decisions of her17-year career at Herman Miller. By entering into a contractwith Florida-based ASAL Products to sell Aeron chairs andkeyboard trays for export to Germany, Herman Miller’s sub-sidiary in Florida had created a parallel channel of distribution.What could or should she do about this ‘‘gray marketing’’ thatwas disrupting Herman Miller’s authorized channels of dis-tribution? She immediately called the corporate counsel, JimChristiansen, for advice.
BACKGROUND INFORMATION
Herman Miller, Inc. Herman Miller, Inc. is an office furnituremanufacturer headquartered in Zeeland, Michigan. Its officefurniture products include chairs, keyboard trays, desks, draft-ing tables, and stools. Herman Miller had sales of $1.7 billionin 1998, $1.8 billion in 1999, and $1.9 billion in 2000. Exhibit 1provides three years of consolidated operating results forHerman Miller.
Herman Miller has an international distribution systemconsisting of ‘‘wholly-owned subsidiaries and they in turn,
This case was developed by Michael R. Mullen, C. M. Sashi, and PatriciaM. Doney of Florida Atlantic University as a basis for evaluating theoryversus practice and to facilitate classroom discussion rather than to illus-trate the effective or ineffective handling of an administrative situation(2003). It was adapted from their ‘‘Gray Markets: Threats or Opportunity?:The Case of Herman Miller vs. Asal GMBH,’’ in Tiger Li and Tamer S.Cavusgil, eds., Advances in International Marketing (Greenwich, CT: JAIPress, 2003) with permission from Tiger Li & Tamer S. Cavusgil.
either sell on a direct basis or through distribution in specificgeographies.’’ Herman Miller’s European subsidiary, Her-man Miller Ltd., is headquartered in Bath, England. In 1999,Herman Miller Ltd. had contracts with about 100 distribu-tors in Europe. In the U.S. market, Herman Miller also usessubsidiaries (e.g., Herman Miller Florida, Inc.) and company-owned distributorships (e.g., Office Pavilion South Florida,Inc). In addition, there are independent distributors and deal-ers in Florida and elsewhere in the United States. Accordingto Sahli, ‘‘A distributor is basically a retailer who covers aparticular area from a sales standpoint and from a servicestandpoint. Very different from what we do as a corporation,which is at corporate level.’’
ASAL GmbH and ASAL Products, Inc. ASAL GmbH isa 60-year-old German firm in the office furniture business,among others. ASAL GmbH had more than 100 employees atthree locations in the EU and was owned 99 percent by its pres-ident, Barnard Stier. ASAL GmbH had sales of DM35,000,000in 19961 and has current sales of DM37,000,000.
In 1996, an ambitious young German named Oliver Aseltook a job with ASAL GmbH (no relation; hereinafterreferred to as Oliver for simplicity). After two years, Oliverdecided to seek greener pastures in America. In the UnitedStates Oliver took a job with office furniture distributor, OfficePavilion South Florida, Inc. At Office Pavilion he becameknowledgeable about Herman Miller’s line of office furniture,including pricing for products such as the Aeron chair andkeyboard trays.
In 1998, Oliver moved back to Germany for personal rea-sons, returning to work for ASAL GmbH as sales manager.At that time, the EU was implementing new harmonizedoffice health standards covering issues such as distance to thecomputer monitor and appropriate seating. Oliver believedthat Herman Miller keyboard trays combined with the Aeronchairs were an excellent solution to the new EU health stan-dards. According to www.hmeurope.com, ‘‘The Aeron chairsets new standards for comfortable and health-promotingoffice seating . . . [it] meets and exceeds major internationalstandards.’’ Oliver convinced Stier that ASAL GmbH shouldpursue these product lines.
In September 1998, Oliver contacted Jean-Paul Fournier,German manager for Herman Miller Ltd. on behalf of ASALGmbH. He was quoted DM229.5 for delivery of 1000 key-board trays. On September 30, 1998, the exchange rate was1.6696 DM/$, so the quote was $137.46/tray. According tocommercial Websites, Aeron Chairs were being sold in theEU in small quantities for approximately DM1800 to DM2000during May 1999. Using a May 12, 1999, exchange rate of1.8359 DM/$, the prices were $960 to $1200/chair.2 However,
1On June 10, 1999, Jean-Paul Fournier received a report on the financialstrength of ASAL GmbH. The D&B report showed that ASAL GmbHhad 1996 sales of DM 35,000,000 or about US$20 million. It also showedthat the company financial resources were from 4 to 20 million DM (thebasis is the total wealth), or between $2.2 million and $11.1 million. Thosesales and wealth numbers indicate that ASLA GmbH, while hardly astart-up company, was still very small relative to Herman Miller.
2For instance, a price quote in April from Norman Stadler GmbH listedthe chairs at DM1,970 for 5 to 10 units and DM1,760 in lots of 40 to 80, andKeiro’s Website listed the Aeron chair at DM2,170 each. The exchangerate at that time was 1.8359 DM/$.
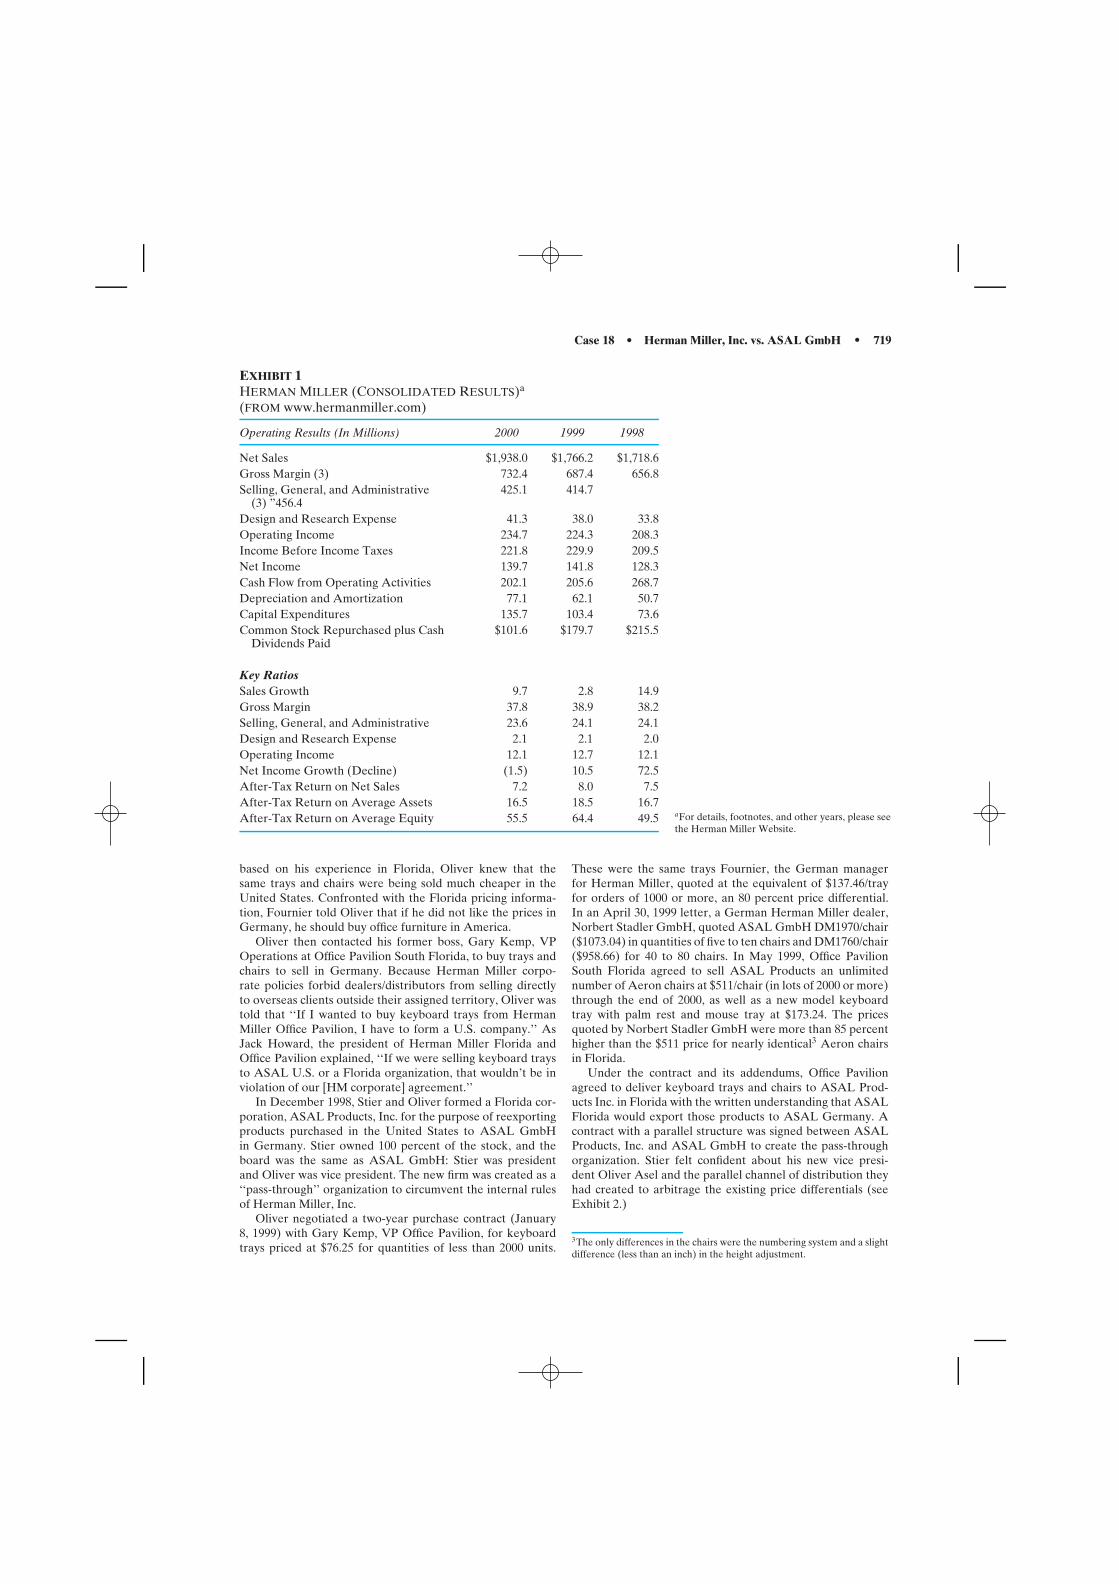
Case 18 • Herman Miller, Inc. vs. ASAL GmbH • 719
EXHIBIT 1HERMAN MILLER (CONSOLIDATED RESULTS)a
(FROM www.hermanmiller.com)
Operating Results (In Millions) 2000 1999 1998
Net Sales $1,938.0 $1,766.2 $1,718.6Gross Margin (3) 732.4 687.4 656.8Selling, General, and Administrative
(3) ”456.4425.1 414.7
Design and Research Expense 41.3 38.0 33.8Operating Income 234.7 224.3 208.3Income Before Income Taxes 221.8 229.9 209.5Net Income 139.7 141.8 128.3Cash Flow from Operating Activities 202.1 205.6 268.7Depreciation and Amortization 77.1 62.1 50.7Capital Expenditures 135.7 103.4 73.6Common Stock Repurchased plus Cash
Dividends Paid$101.6 $179.7 $215.5
Key RatiosSales Growth 9.7 2.8 14.9Gross Margin 37.8 38.9 38.2Selling, General, and Administrative 23.6 24.1 24.1Design and Research Expense 2.1 2.1 2.0Operating Income 12.1 12.7 12.1Net Income Growth (Decline) (1.5) 10.5 72.5After-Tax Return on Net Sales 7.2 8.0 7.5After-Tax Return on Average Assets 16.5 18.5 16.7After-Tax Return on Average Equity 55.5 64.4 49.5 aFor details, footnotes, and other years, please see
the Herman Miller Website.
based on his experience in Florida, Oliver knew that thesame trays and chairs were being sold much cheaper in theUnited States. Confronted with the Florida pricing informa-tion, Fournier told Oliver that if he did not like the prices inGermany, he should buy office furniture in America.
Oliver then contacted his former boss, Gary Kemp, VPOperations at Office Pavilion South Florida, to buy trays andchairs to sell in Germany. Because Herman Miller corpo-rate policies forbid dealers/distributors from selling directlyto overseas clients outside their assigned territory, Oliver wastold that ‘‘If I wanted to buy keyboard trays from HermanMiller Office Pavilion, I have to form a U.S. company.’’ AsJack Howard, the president of Herman Miller Florida andOffice Pavilion explained, ‘‘If we were selling keyboard traysto ASAL U.S. or a Florida organization, that wouldn’t be inviolation of our [HM corporate] agreement.’’
In December 1998, Stier and Oliver formed a Florida cor-poration, ASAL Products, Inc. for the purpose of reexportingproducts purchased in the United States to ASAL GmbHin Germany. Stier owned 100 percent of the stock, and theboard was the same as ASAL GmbH: Stier was presidentand Oliver was vice president. The new firm was created as a‘‘pass-through’’ organization to circumvent the internal rulesof Herman Miller, Inc.
Oliver negotiated a two-year purchase contract (January8, 1999) with Gary Kemp, VP Office Pavilion, for keyboardtrays priced at $76.25 for quantities of less than 2000 units.
These were the same trays Fournier, the German managerfor Herman Miller, quoted at the equivalent of $137.46/trayfor orders of 1000 or more, an 80 percent price differential.In an April 30, 1999 letter, a German Herman Miller dealer,Norbert Stadler GmbH, quoted ASAL GmbH DM1970/chair($1073.04) in quantities of five to ten chairs and DM1760/chair($958.66) for 40 to 80 chairs. In May 1999, Office PavilionSouth Florida agreed to sell ASAL Products an unlimitednumber of Aeron chairs at $511/chair (in lots of 2000 or more)through the end of 2000, as well as a new model keyboardtray with palm rest and mouse tray at $173.24. The pricesquoted by Norbert Stadler GmbH were more than 85 percenthigher than the $511 price for nearly identical3 Aeron chairsin Florida.
Under the contract and its addendums, Office Pavilionagreed to deliver keyboard trays and chairs to ASAL Prod-ucts Inc. in Florida with the written understanding that ASALFlorida would export those products to ASAL Germany. Acontract with a parallel structure was signed between ASALProducts, Inc. and ASAL GmbH to create the pass-throughorganization. Stier felt confident about his new vice presi-dent Oliver Asel and the parallel channel of distribution theyhad created to arbitrage the existing price differentials (seeExhibit 2.)
3The only differences in the chairs were the numbering system and a slightdifference (less than an inch) in the height adjustment.
720 • Case 18 • Herman Miller, Inc. vs. ASAL GmbH
EXHIBIT 2PARALLEL CHANNELS OF DISTRIBUTION
Herman Miller, Inc.
Michigan
Herman MillerFactory
UK
Headquarters and Factory
Office Pavilion
Asal Products, Inc.
Florida
Hermann Asal, GmbH
Dealers
Customers
Pricesinflated60–80%
EUROPE
Germany
Herman MillerDistributors
$$
$$
$$
$$$
Florida
In 1999, Oliver returned to the United States and openedan office for ASAL Products in Fort Lauderdale, Florida.Three or four small orders for trays and chairs were placedfrom ASAL GmbH through ASAL Products to Office Pavil-ion. The orders were paid for, shipped to ASAL Product,Inc.’s freight forwarder, and exported to ASAL GmbH inGermany for resale. Everything transpired as agreed upon,so ASAL GmbH, with Office Pavilion’s knowledge, madearrangements to attend the INTERZUN, an internationaltrade fair in Germany, to market these products.
Oliver had already given Office Pavilion a short-term salesforecast of 5000 to 7000 Aeron chairs and thousands of key-board trays. With the trade show coming up, Office Pavilionwas abuzz. Everyone from warehouse workers to front officestaff to top executives were discussing the large potential salesto Oliver and the big impact such sales could have on theirbonuses. At Office Pavilion, salespeople received commis-sions, and the staff received EVA (Economic Value Added)bonuses based on year-end performance. Therefore, everyoneat Office Pavilion had personal motivation to increase salesand profit.
INTERZUN INTERNATIONAL TRADE FAIR, KOLN,GERMANY, MAY 7–11, 1999
International trade fairs are far more important in EU mar-keting in general and in Germany in particular. In preparationfor the show, ASAL mailed letters and postcards to existingcustomers, as well as prospective new customers in Germany
and throughout Europe. Office Pavilion employees expeditedsample Aeron chairs and the new keyboard trays for exhi-bition at the INTERZUN. At the fair, ASAL had a goodlocation, and Oliver served as the technical representative.Their reception was much greater than expected. As Oliversaid, ‘‘Chairs were flying out the door—unbelievable.’’ Healso noted that ‘‘I met some gentleman from Herman MillerInternational at the trade show.’’
Because of the importance of EU trade fairs, attendanceis audited in a manner analogous to America’s Nielsen rat-ings. The Audited Trade Fair and Exhibition Figures for theMay 1999 INTERZUN (FKM 2000—see Exhibit 3) showedaudited numbers of 59,343 paid visitors. Eighty-three percentof those visitors were owners, directors, managers, or staffwith decisive or collective responsibility for purchasing deci-sions. Although most were primarily small firms with less than500 employees, 5934 firms had 500 or more employees, andthere were 1187 firms larger than 10,000 employees. Giventhe product market (chairs and keyboard trays), number ofemployees was a good proxy for potential demand.
On May 12, 1999, immediately after the INTERZUMtrade show, ASAL GmbH sent a written forecast and ordersto ASAL Products, Inc. for 32,320 Aeron chairs and 16,300keyboard trays valued at over $21.8 million for delivery bySeptember 1999. The same day, ASAL Products submittedtheir first order to Office Pavilion for 2480 Aeron chairs,accompanied by a check for $633,840 (50 percent deposit).Office Pavilion VP of Operations Gary Kemp and General
Case 18 • Herman Miller, Inc. vs. ASAL GmbH • 721
EXHIBIT 3AUDITED TRADE FAIR AND EXHIBITION FIGURES, REPORT 1999
Total Number of visitors 59,343 Position in the company/organization %Proportion of trade visitors 98% Entrepreneur, partner, self-employed 36Region of Residence % Managing director, board members, head 18Over 100 km away 86 of an authority, etc.
Senior department head, other employee 8Total Germany 55 with managerial responsibilityBaden-Wurttemberg 14 Department head, group head 12Bavaria 12 Other salaried staff 16Berlin 1 Skilled worker 2Brandenburg — Lecturer, teacher, scientific assistant 1Bremen 1 Trainee, student 5Hamburg 2 Other 3Hesse 7Mecklenburg-West Pommerania 1 Area of Responsibility %Lower Saxony 5 Management 48North Rhine-Westphalia 43 Research/development/design 9Rhineland-Palatinate 7 Planning/work preparation 6Saarland 2 Manufacture/production 13Saxony 2 Buying/procurement 9Saxuny-Anhalt 1 Administration/organization/personnel/social 2Schleswig-Holstein 1 welfare/trainingThuringia 1 Marketing/sales/advertising/PR 9
Other 4
Total Foreign 45 Frequency of visits to trade fair %EU 59 1997 50Rest of Europe 13 1995 36Africa 3 1993 27Central & South America 5 First visit 42North America 5Middle East 7 Size of company/organizationEast Asia 4 Number of employees %:Australia 4 1–9 . . . . . . . . . 30 200–499 . . . . . . . . . 12
10–49 . . . . . . . . . 28 500–999 . . . . . . . . . 450–99 . . . . . . . . . 11 1000–9999 . . . . . . . . . 4
100–199 . . . . . . . . . 10 0000-and more . . . . . . . . . 2
Economic Sector % Length of StayIndustry 45 1. Length of Stay (days) %:Skilled trades 25 one . . . . . . . . . 57 four . . . . . . . . . 5Trade 20 two. . . . . . . . . 21 five . . . . . . . . . 5Self-employed 6 three . . . . . . . . . 12Other 4 2. Average length of stay = 1.8 days
Share of visitors on the event’s days %:Influence on purchasing/ % 1st day . . . . . . . . . 30 4th day . . . . . . . . . 40
procurement decisions 2nd day . . . . . . . . . 39 5th day . . . . . . . . . 31Decisively 56 3rd day . . . . . . . . .40Collectively 27In an advisory capacity 10No 7
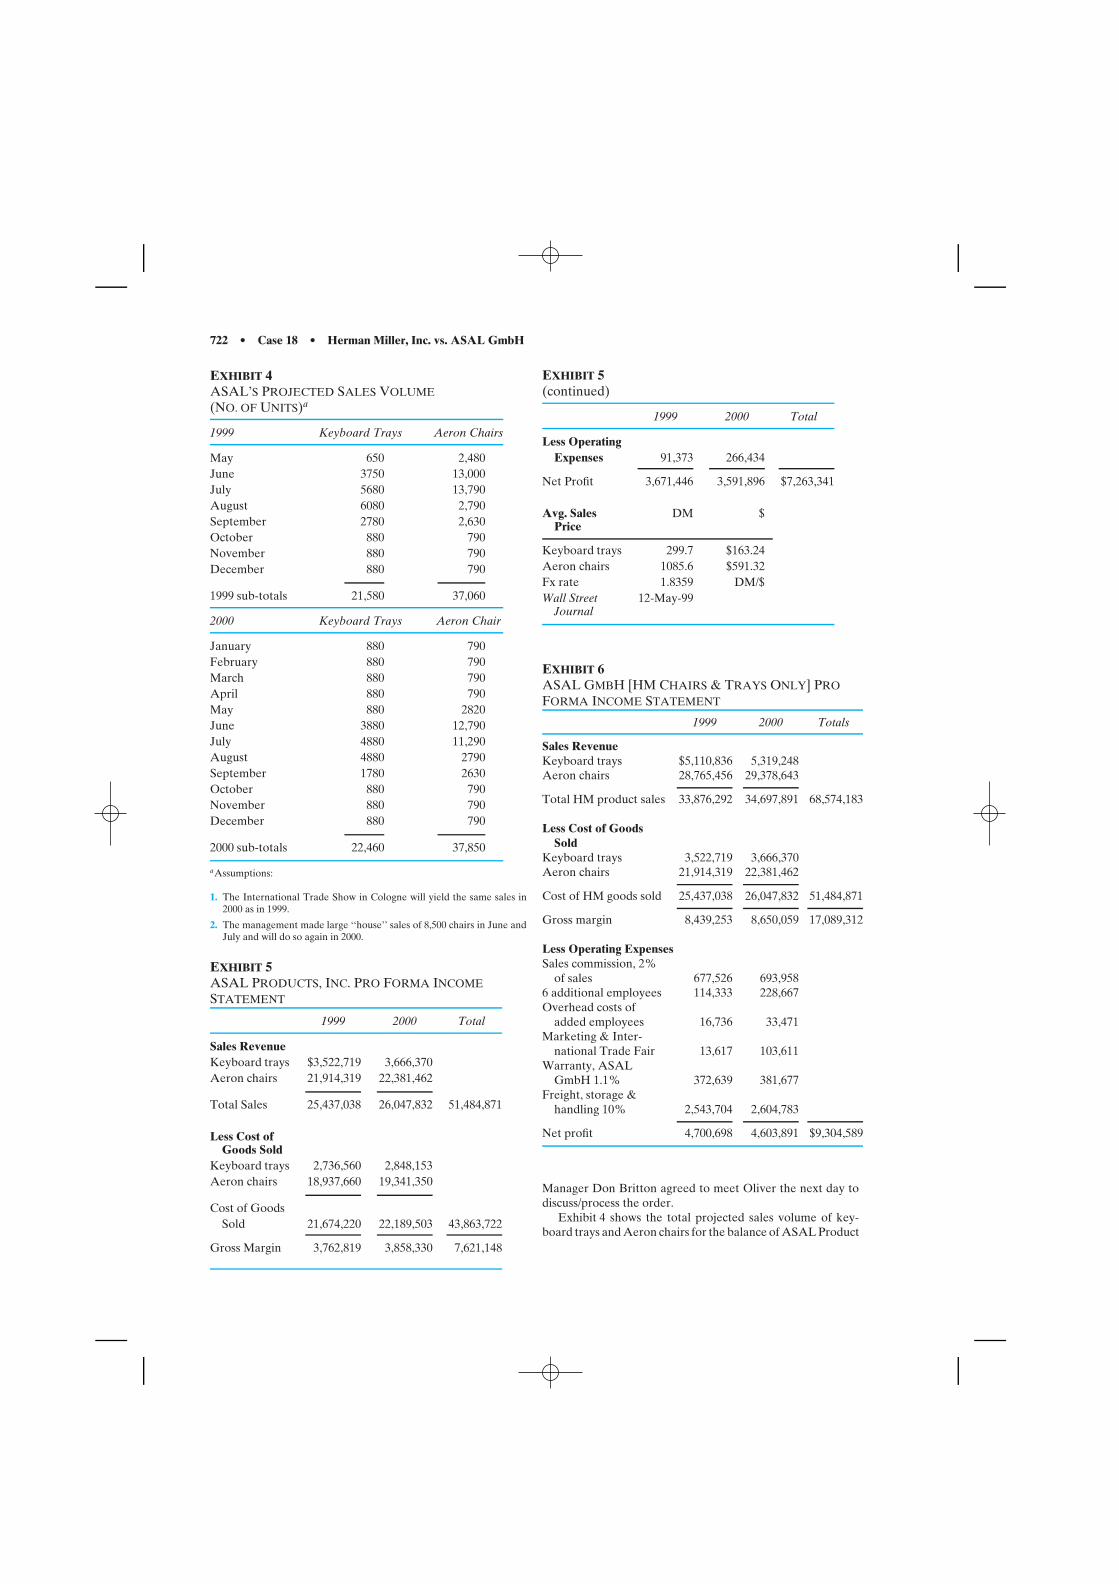
722 • Case 18 • Herman Miller, Inc. vs. ASAL GmbH
EXHIBIT 4ASAL’S PROJECTED SALES VOLUME(NO. OF UNITS)a
1999 Keyboard Trays Aeron Chairs
May 650 2,480June 3750 13,000July 5680 13,790August 6080 2,790September 2780 2,630October 880 790November 880 790December 880 790
1999 sub-totals 21,580 37,060
2000 Keyboard Trays Aeron Chair
January 880 790February 880 790March 880 790April 880 790May 880 2820June 3880 12,790July 4880 11,290August 4880 2790September 1780 2630October 880 790November 880 790December 880 790
2000 sub-totals 22,460 37,850
aAssumptions:
1. The International Trade Show in Cologne will yield the same sales in2000 as in 1999.
2. The management made large ‘‘house’’ sales of 8,500 chairs in June andJuly and will do so again in 2000.
EXHIBIT 5ASAL PRODUCTS, INC. PRO FORMA INCOMESTATEMENT
1999 2000 Total
Sales RevenueKeyboard trays $3,522,719 3,666,370Aeron chairs 21,914,319 22,381,462
Total Sales 25,437,038 26,047,832 51,484,871
Less Cost ofGoods Sold
Keyboard trays 2,736,560 2,848,153Aeron chairs 18,937,660 19,341,350
Cost of GoodsSold 21,674,220 22,189,503 43,863,722
Gross Margin 3,762,819 3,858,330 7,621,148
EXHIBIT 5(continued)
1999 2000 Total
Less OperatingExpenses 91,373 266,434
Net Profit 3,671,446 3,591,896 $7,263,341
Avg. SalesPrice
DM $
Keyboard trays 299.7 $163.24Aeron chairs 1085.6 $591.32Fx rate 1.8359 DM/$Wall Street
Journal12-May-99
EXHIBIT 6ASAL GMBH [HM CHAIRS & TRAYS ONLY] PROFORMA INCOME STATEMENT
1999 2000 Totals
Sales RevenueKeyboard trays $5,110,836 5,319,248Aeron chairs 28,765,456 29,378,643
Total HM product sales 33,876,292 34,697,891 68,574,183
Less Cost of GoodsSold
Keyboard trays 3,522,719 3,666,370Aeron chairs 21,914,319 22,381,462
Cost of HM goods sold 25,437,038 26,047,832 51,484,871
Gross margin 8,439,253 8,650,059 17,089,312
Less Operating ExpensesSales commission, 2%
of sales 677,526 693,9586 additional employees 114,333 228,667Overhead costs of
added employees 16,736 33,471Marketing & Inter-
national Trade Fair 13,617 103,611Warranty, ASAL
GmbH 1.1% 372,639 381,677Freight, storage &
handling 10% 2,543,704 2,604,783
Net profit 4,700,698 4,603,891 $9,304,589
Manager Don Britton agreed to meet Oliver the next day todiscuss/process the order.
Exhibit 4 shows the total projected sales volume of key-board trays and Aeron chairs for the balance of ASAL Product
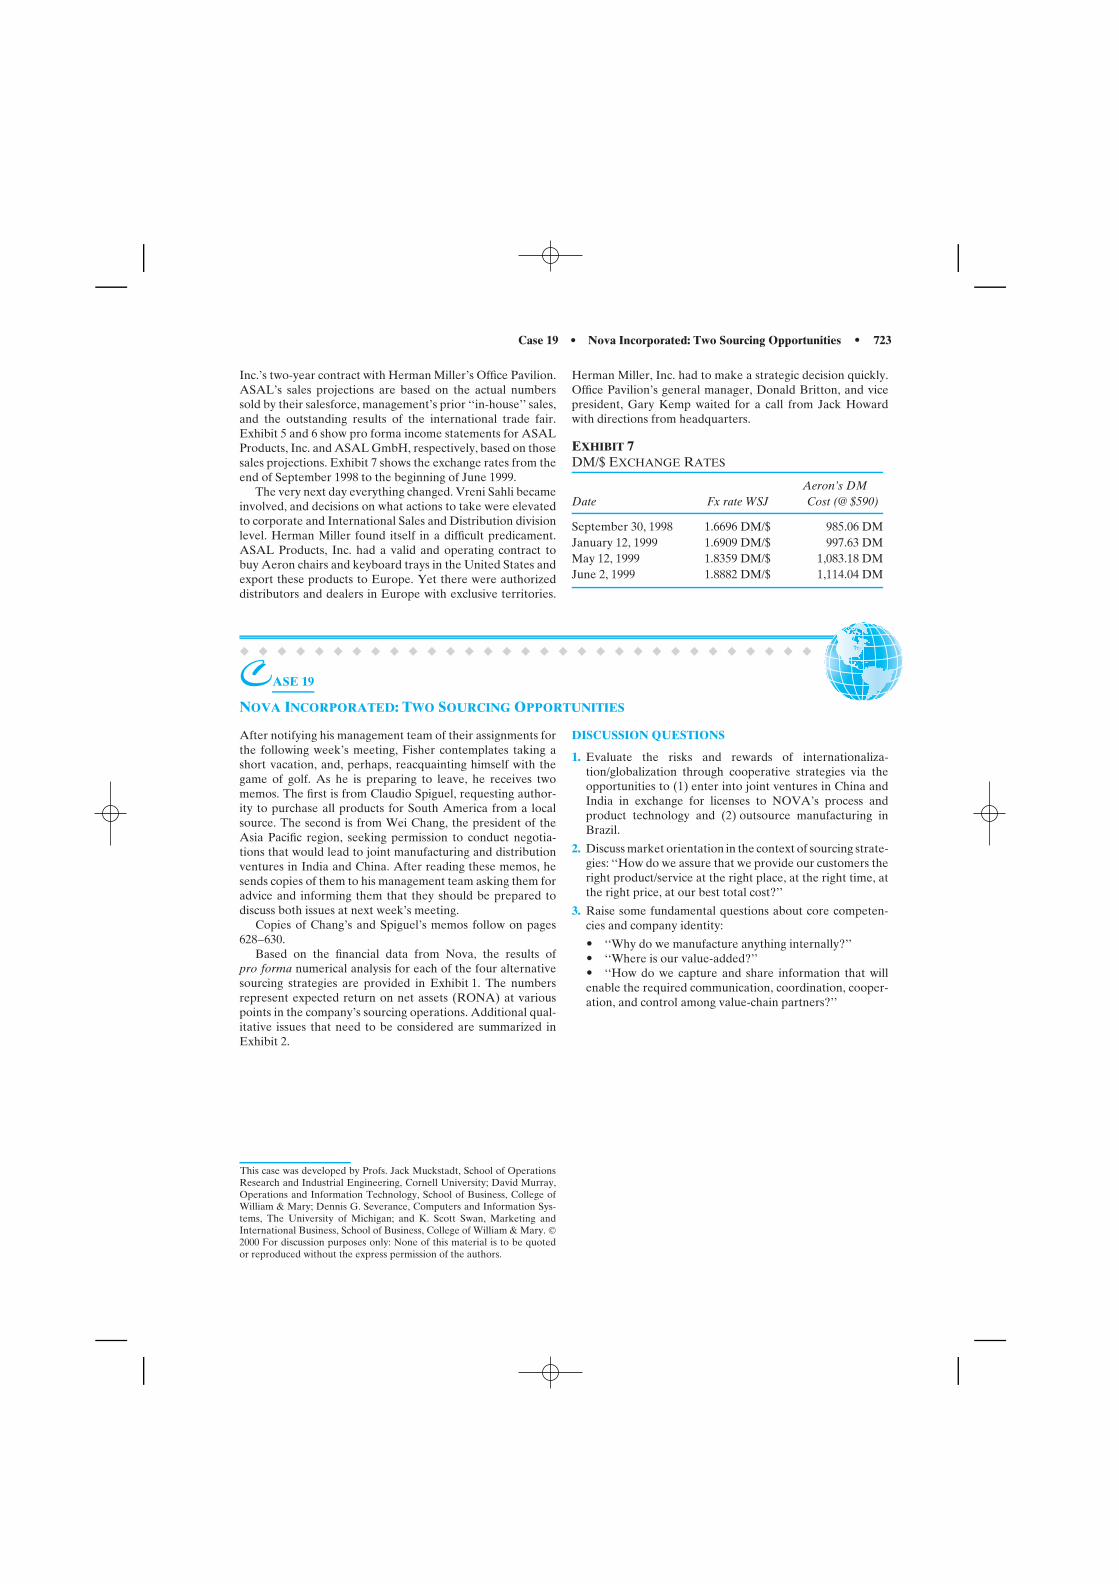
Case 19 • Nova Incorporated: Two Sourcing Opportunities • 723
Inc.’s two-year contract with Herman Miller’s Office Pavilion.ASAL’s sales projections are based on the actual numberssold by their salesforce, management’s prior ‘‘in-house’’ sales,and the outstanding results of the international trade fair.Exhibit 5 and 6 show pro forma income statements for ASALProducts, Inc. and ASAL GmbH, respectively, based on thosesales projections. Exhibit 7 shows the exchange rates from theend of September 1998 to the beginning of June 1999.
The very next day everything changed. Vreni Sahli becameinvolved, and decisions on what actions to take were elevatedto corporate and International Sales and Distribution divisionlevel. Herman Miller found itself in a difficult predicament.ASAL Products, Inc. had a valid and operating contract tobuy Aeron chairs and keyboard trays in the United States andexport these products to Europe. Yet there were authorizeddistributors and dealers in Europe with exclusive territories.
Herman Miller, Inc. had to make a strategic decision quickly.Office Pavilion’s general manager, Donald Britton, and vicepresident, Gary Kemp waited for a call from Jack Howardwith directions from headquarters.
EXHIBIT 7DM/$ EXCHANGE RATES
Aeron’s DMDate Fx rate WSJ Cost (@ $590)
September 30, 1998 1.6696 DM/$ 985.06 DMJanuary 12, 1999 1.6909 DM/$ 997.63 DMMay 12, 1999 1.8359 DM/$ 1,083.18 DMJune 2, 1999 1.8882 DM/$ 1,114.04 DM
� � � � � � � � � � � � � � � � � � � � � � � � � � � � � � �
CASE 19
NOVA INCORPORATED: TWO SOURCING OPPORTUNITIES
After notifying his management team of their assignments forthe following week’s meeting, Fisher contemplates taking ashort vacation, and, perhaps, reacquainting himself with thegame of golf. As he is preparing to leave, he receives twomemos. The first is from Claudio Spiguel, requesting author-ity to purchase all products for South America from a localsource. The second is from Wei Chang, the president of theAsia Pacific region, seeking permission to conduct negotia-tions that would lead to joint manufacturing and distributionventures in India and China. After reading these memos, hesends copies of them to his management team asking them foradvice and informing them that they should be prepared todiscuss both issues at next week’s meeting.
Copies of Chang’s and Spiguel’s memos follow on pages628–630.
Based on the financial data from Nova, the results ofpro forma numerical analysis for each of the four alternativesourcing strategies are provided in Exhibit 1. The numbersrepresent expected return on net assets (RONA) at variouspoints in the company’s sourcing operations. Additional qual-itative issues that need to be considered are summarized inExhibit 2.
This case was developed by Profs. Jack Muckstadt, School of OperationsResearch and Industrial Engineering, Cornell University; David Murray,Operations and Information Technology, School of Business, College ofWilliam & Mary; Dennis G. Severance, Computers and Information Sys-tems, The University of Michigan; and K. Scott Swan, Marketing andInternational Business, School of Business, College of William & Mary. 2000 For discussion purposes only: None of this material is to be quotedor reproduced without the express permission of the authors.
DISCUSSION QUESTIONS
1. Evaluate the risks and rewards of internationaliza-tion/globalization through cooperative strategies via theopportunities to (1) enter into joint ventures in China andIndia in exchange for licenses to NOVA’s process andproduct technology and (2) outsource manufacturing inBrazil.
2. Discuss market orientation in the context of sourcing strate-gies: ‘‘How do we assure that we provide our customers theright product/service at the right place, at the right time, atthe right price, at our best total cost?’’
3. Raise some fundamental questions about core competen-cies and company identity:
• ‘‘Why do we manufacture anything internally?’’• ‘‘Where is our value-added?’’• ‘‘How do we capture and share information that willenable the required communication, coordination, cooper-ation, and control among value-chain partners?’’
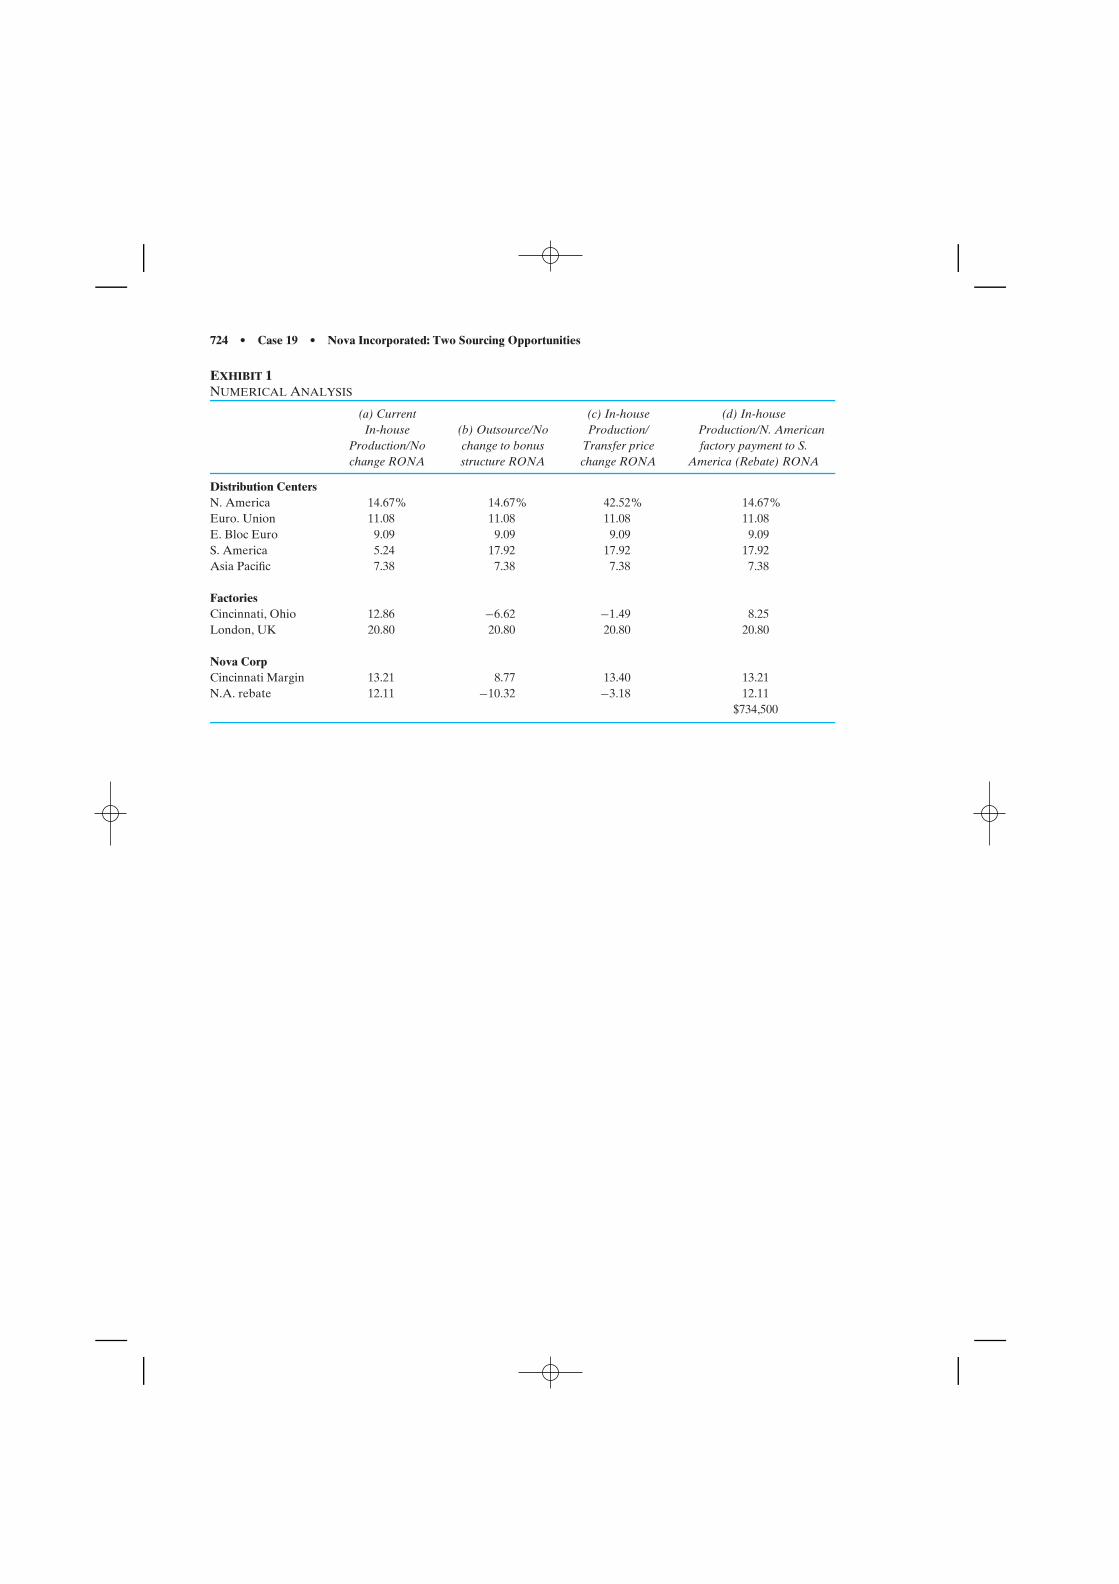
724 • Case 19 • Nova Incorporated: Two Sourcing Opportunities
EXHIBIT 1NUMERICAL ANALYSIS
(a) Current (c) In-house (d) In-houseIn-house (b) Outsource/No Production/ Production/N. American
Production/No change to bonus Transfer price factory payment to S.change RONA structure RONA change RONA America (Rebate) RONA
Distribution CentersN. America 14.67% 14.67% 42.52% 14.67%Euro. Union 11.08 11.08 11.08 11.08E. Bloc Euro 9.09 9.09 9.09 9.09S. America 5.24 17.92 17.92 17.92Asia Pacific 7.38 7.38 7.38 7.38
FactoriesCincinnati, Ohio 12.86 −6.62 −1.49 8.25London, UK 20.80 20.80 20.80 20.80
Nova CorpCincinnati Margin 13.21 8.77 13.40 13.21N.A. rebate 12.11 −10.32 −3.18 12.11
$734,500
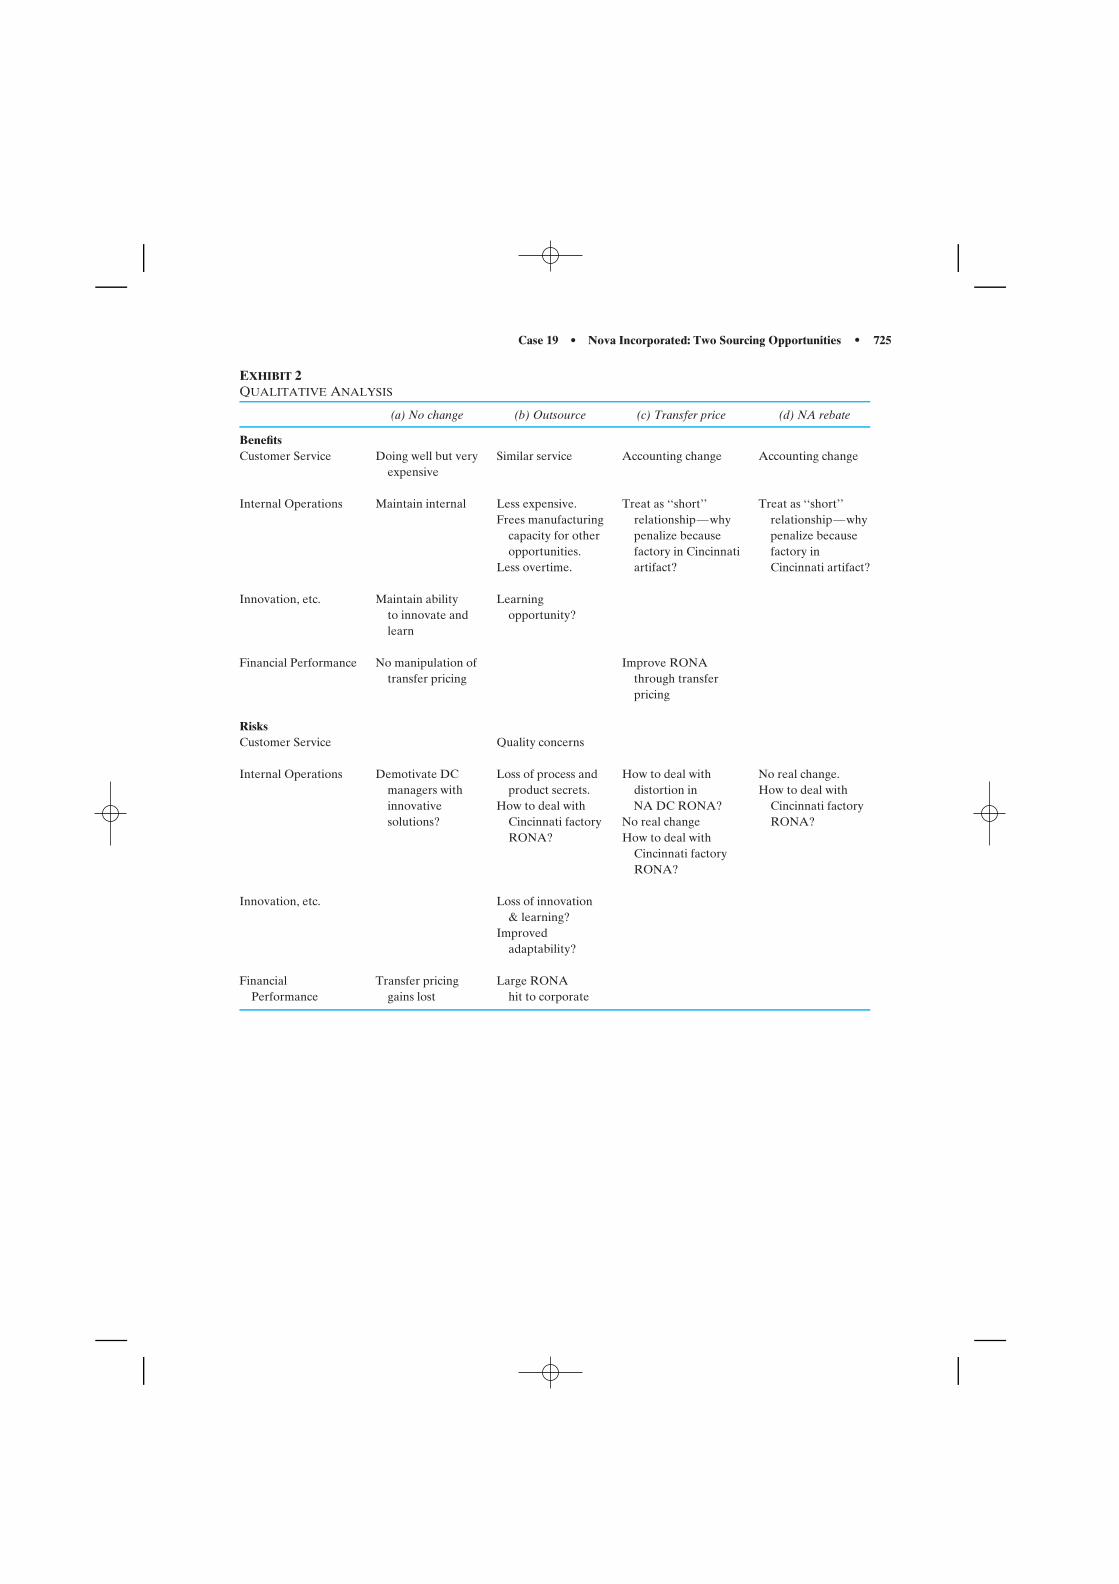
Case 19 • Nova Incorporated: Two Sourcing Opportunities • 725
EXHIBIT 2QUALITATIVE ANALYSIS
(a) No change (b) Outsource (c) Transfer price (d) NA rebate
BenefitsCustomer Service Doing well but very Similar service Accounting change Accounting change
expensive
Internal Operations Maintain internal Less expensive. Treat as ‘‘short’’ Treat as ‘‘short’’Frees manufacturing relationship—why relationship—why
capacity for other penalize because penalize becauseopportunities. factory in Cincinnati factory in
Less overtime. artifact? Cincinnati artifact?
Innovation, etc. Maintain ability Learningto innovate and opportunity?learn
Financial Performance No manipulation of Improve RONAtransfer pricing through transfer
pricing
RisksCustomer Service Quality concerns
Internal Operations Demotivate DC Loss of process and How to deal with No real change.managers with product secrets. distortion in How to deal withinnovative How to deal with NA DC RONA? Cincinnati factorysolutions? Cincinnati factory No real change RONA?
RONA? How to deal withCincinnati factoryRONA?
Innovation, etc. Loss of innovation& learning?
Improvedadaptability?
Financial Transfer pricing Large RONAPerformance gains lost hit to corporate
726 • Case 19 • Nova Incorporated: Two Sourcing Opportunities
Nova Manufacturing, Inc.‘‘Your Global Assembly Supplier’’
MEMORANDUM
To: John Fisher, CEO
From: Wei Chang, President, Nova Asia Pacific
Date: June 17, 2000
Subject: Implications for Market Growth Opportunities in the Asia Pacific Region
For the past year you have encouraged me to grow my business substantially. After careful analysis of the opportu-nities in this region I have concluded that it is possible to dramatically increase sales over the next five years. In fact, Ibelieve it is likely that we can increase business by a factor of ten. While this may sound optimistic, I am confident thatwe can achieve this level of growth.
I have spent several months making contacts in both India and China and have succeeded in establishing appropriategovernment and industry ties in both countries. As I toured these countries, I found that there is an enormous requirementfor our products driven by the explosive growth in construction in both countries.
Two reasons make it possible for us to penetrate these markets. First, the local production of widget equivalents islimited, since the technology for modern widget manufacturing is not known in these places. The outdated productionmethods, which are both capital and labor intensive, have made growth in domestic production capacity appear unprof-itable. Thus, the governments are eager for us to provide our products to them. Second, the quality of the current localsupply is very poor. Where the domestically produced widgets are used, their reliability and durability are a source ofgreat concern to their users. In fact, numerous accidents have resulted from the poor product design and manufacturingprocesses. Our reputation for high quality is therefore a major source of competitive advantage for us.
To date, our major competitors have not succeeded in penetrating these markets, in spite of several concertedattempts to do so. I suspect that their lack of success so far is due to their failure to appreciate the distinctive culturesof these countries, and how business must be transacted within them. Nonetheless, our competitors are active and theirproducts are also well regarded.
For us to compete successfully in these markets, we must have technical support, low prices (much lower than ourcurrent ones), and high quality and reliable supply. Furthermore, it is important to understand the limitations of thelogistics infrastructure in these countries. The major consumers of widgets are not located in places that can be reliablyresupplied from port cities or by air.
I believe that for us to compete, we must undertake joint ventures for manufacturing and distribution in bothcountries. The reason for this is twofold: first, to be price competitive we must take advantage of the low labor coststhat are available in both India and China, and we must avoid the tariffs and overheads associated with transporting andimporting products from London or Cincinnati. The second reason that we must have a manufacturing presence is togain access to distribution channels. Both governments are looking for technology transfer, and have made it clear thatwithout licensing our product and process technologies to a locally owned partner, they will be of little help in providingmarket access. It would, of course, be folly for us to attempt to build a marketing, sales, and distribution infrastructurefrom scratch, and totally on our own. Accordingly, I have begun preliminary discussions with the appropriate governmentand industry officials and have identified potential joint venture partners.
I have also gathered preliminary cost data, and estimate that we can produce and sell products with a 40 percentmargin at a cost basis equal to 60 percent of the current transfer price. I have taken the cost of capital, labor, transportationfacilities and land into account when making these calculations. I estimate that our return on net assets (RONA) will beapproximately 55 percent.
This is an opportunity that we cannot ignore. We must act soon or others will seize it. I would like permission to pursuedetailed negotiations so that we can begin production within a year. Of course, I will submit a Capital AppropriationsRequest for formal approval once you agree in principle with the project. I will also need technical support from bothJulie Anderson and Jerry Jackson to set up the manufacturing and technical information system, and assistance from ourlegal department in working out the licensing agreements.
I look forward to seeing you at our next meeting, and to discussing my idea with you in greater detail at that time.
Case 19 • Nova Incorporated: Two Sourcing Opportunities • 727
Nova Manufacturing, Inc.‘‘Your Global Assembly Supplier’’
MEMORANDUM
To: John Fisher, CEO
From: Claudio Spiguel, President, Nova South America
Date: June 18, 2000
Subject: Maintaining Customer Service and Improving Nova Profitability
Attached is a copy of your recent memo on Customer Service and Cost as well as a copy of Larry Judge’s memo onLean Production. Sometimes it takes a combination of reminders like this to shake us loose from old habits and to drivehome the point that we can’t make marginal changes if we seek major improvements. Let me explain.
First, I am sure that my South America operations were a significant contributor to your memo. Recently we havebeen maintaining generous amounts of inventory of finished goods in an attempt to provide superior service to ourcustomers. In addition, we have found that deliveries from Cincinnati and London have been more reliable. As a result,we have succeeded in providing excellent service, which has led to a substantial growth in our business. While I knew atthe time I decided to increase my cycle stock and safety stock levels that costs would rise, I believed that it was the rightthing to do for our customers.
Then later, Larry Judge’s memo on RONA arrived. It reminded me that customer service was not the only goal forNova mangers. Making a ‘‘fair profit’’ for our shareholders on the assets they had provided us with was also important.Since inventories are the greatest of the assets under my local control and their holding costs contribute heavily to ouroperating expense, inventory reduction is my key lever for RONA improvement. I am torn between the goals of reducinginventory and maintaining a high level of customer service. When I improve one the other gets worse.
When I shared this dilemma with a cousin who runs a manufacturing firm here in Sao Paulo, he asked for a sampleof each of the products that Nova sells in South America. After reverse engineering our ten products, he designed amanufacturing process to build each and lined up a set of local suppliers. He has now offered me the following contract.If I guarantee to purchase all Nova products sold in South America during the next five years from him, he will makethe capital investment required to manufacture them. He will sell them to us at our current Nova transfer price, quotedin dollars to eliminate Nova’s exposure to Brazilian currency fluctuation, and he will guarantee the price for three years(which Cincinnati will not do for me). Moreover, he will require no minimum order size and he will guarantee one daydelivery of any order quantity up to 2 percent of annual demand. Finally, he will pay all transportation costs and willguarantee that product quality will meet or exceed Nova’s existing standards.
This is the answer to a prayer. He will own the pipeline stock, and I will need only two days of safety stock andabout a day of cycle stock. My fill rates will remain very high and my transportation costs will be negligible. From yourperspective, the risk of profit erosion from the wild currency fluctuations that we have experienced in recent years will beeliminated. I estimate that my RONA bonus will exceed 40 percent and he feels that he will make an acceptable profit.This is a win-win-win situation.
Do I have your approval to sign the contract and proceed with this new alliance?
728 • Case 19 • Nova Incorporated: Two Sourcing Opportunities
Nova Manufacturing, Inc.‘‘Your Global Assembly Supplier’’
MEMORANDUM
To: All Nova Distribution Center Managers
From: John Fisher, CEO
Date: June 1, 2000
Subject: Customer Service and Cost
In the last two weeks I ran into a board member and then a college classmate, who each informed me that during thepast 6 months their companies had increased their purchases of our products. They were amazed at the increase in ourability to serve them given that in the past we always were late and erratic in our shipping performance. Without havingdetails on products, regions, and dates, they assured me that what was a problem is now a real strategic advantage for us.They wondered how we moved from last to first as a supplier in their industry.
While you all should be commended for following my instructions to improve customer service, recognize that ourcosts have risen to the point where the increased demand and service reduces profitability. Let me be blunt. Unless we canmaintain the improved service levels at substantially lower operating costs, we will be out of business. You must reduceyour expenses—transportation, holding, and other overhead costs. Our ‘‘success’’ at increased customer service hascaused the additional problem of consistent overtime at factories that degrades factory performance through increasedscrap rates, increased setup times, and expedited transportation. At the management committee meeting this month, wewill review your plans and progress.
Nova Manufacturing, Inc.‘‘Your Global Assembly Supplier’’
MEMORANDUM
To: All Nova Distribution Center Managers
From: Larry Judge, CFO
Date: June 8, 2000
Subject: Lean Production
To survive in our increasingly competitive business environment, it is imperative that we all strive continuously toimprove financial performance. Return on net assets, RONA, is a traditional and important measure of the effectivenesswith which productive assets are deployed by a company’s management. I have therefore decided to establish last year’sRONA numbers as a benchmark for company performance. Hereafter, monthly RONA numbers at each location willbe used as a barometer to measure performance improvement as we move forward during the year.
I have calculated your 1999 RONA and will tie your compensation to your ability to improve it in 2000. The companyimprovement goal of 10 percent must be met by all locations. Managers who exceed this goal will receive a salary bonuspercentage equal to twice their percentage improvement beyond 4 percent. I know you will each do the right thing.

Case 20 • Ceras Deserticas and Mitsuba Trading Company • 729
� � � � � � � � � � � � � � � � � � � � � � � � � � � � � � �
CASE 20
CERAS DESERTICAS AND MITSUBA TRADING COMPANY
In October 1997, Mr. Juan Perez, CEO of Ceras Deserticas,S.A. de C.V., was reviewing the current situation of his com-pany. Consolidation was the word in the industry, so therewere fewer competitors as time went by. Mr. Perez was con-sidering several alternatives for the future of Ceras Deserticas:(a) use vertical forward integration, adding steps to his pro-duction process, (b) sell the company to a Japanese customer,who was aiming vertical backward integration, or (c) establisha joint venture with the Japanese counterpart.
COMPANY BACKGROUND
Ceras Deserticas was established in 1995 as a producer ofcandelilla wax. The manufacturing facility is located in CuatroCienegas, Coahuila, Mexico, while the company’s headquar-ters is located in Saltillo, Coahuila. Additionally, there is asales office in Mexico City. The company’s mission has beento provide the highest quality product and to maintain strongcustomer relationships. Ceras Deserticas has internationalpresence, exporting the candelilla wax to the United States,Japan, Europe, and South America.
Ceras Deserticas has been growing, reflected by its salesvolume increase throughout the period (see Exhibit 1). It hasbeen able to get more customers around the world by assuringa stable supply, and by offering a competitive price and anexcellent delivery service of its candelilla wax.
Environmental issues, such as reforestation and ensuringthe safety of its employees and neighbors, are concerns towhich Ceras Deserticas regularly devotes its attention. Thecompany is aware that in order to obtain candelilla wax, it musthave as a priority the conservation of the natural resource thatproduces the wax. For that reason, the company has startedsowing candelilla shrubs as part of a reforestation plan.
Product
The candelilla is a natural wax found as a coating on can-delilla shrubs. It is extracted from the surface of the stemsof candelilla plants, belonging to the family of the Euphor-biaceas. The candelilla is mainly obtained from the Euphorbiaantysyphilitica or Euphorbia cerifera.
The candelilla plant grows in the deserts of northeasternMexico (see Exhibit 2). The plants that produce the candelillawax are wild; they grow in the hills and plains of the extensivesemidesert regions in the states of Coahuila, Durango, Chi-huahua, Nuevo Leon, and Zacatecas. The plants thrive in thissavage climate by producing a wax-type coating to protect itfrom the fierce sun and brutal winds.
The candelilla plant is mainly found at 900 to 1800 metersabove sea level. Historically, the largest wax content has beenobserved in those plants growing in the warmest and driestlands.
This case was prepared by Raul E. Puente and Ryuichi Matsuo of theGraduate School of Business at the University of Texas at Austin under thesupervision of Masaaki Kotable of Temple University for class discussionrather than to illustrate either effective or ineffective management of asituation described (January 1999).
EXHIBIT 1HISTORICAL SALES FORCERAS DESERTICASTONS PER QUARTER
1995
158
1996
311
1997
500
0
100
200
300
400
500
600
EXHIBIT 2THE CANDELILLA PLANT GROWS IN THEDESERTS OF NORTHEASTERN MEXICO.THE STATES THAT ARE PRESENT IN THISAREA ARE COAHUILA, DURANGO,CHIHUAHUA, NUEVO LEON, ANDZACATECAS
Candelilla plants grow only in Mexico. This product has anadvantage over other natural or synthetic waxes because thereare special applications in which candelilla wax is the onlyalternative for a particular product or process. The wide vari-ety of uses makes it one of the most versatile waxes around. Itis not a commonly known product because it is not used alone.It is used as an extender in formulas containing carnauba,paraffin, and other waxes, but it also has hundreds of otheruses (see Exhibit 3). For example, it is used in candies such aschewing gums and breath savers, in cosmetics like lipsticks andblushes, and in pharmaceuticals. For industrial products, it isused in oils and lubricants, electrical conductors, explosives,paint removers, and so on. It is used in matches, wax paper,and car polish. See Exhibit 4 for an exhaustive list of uses.
730 • Case 20 • Ceras Deserticas and Mitsuba Trading Company
As seen in the table, the candelilla wax has a very importantquality. Having a low expansion and contraction coefficient,candelilla can be used in precision applications, and has theability not to crack. On the other hand, carnauba, eventhough it is the hardest of the natural waxes, is still brittle.
EXHIBIT 3COMPARISON OF CANDELILLA WAX WITH CARNAUBA WAX
Properties Candelilla wax Carnauba wax
Growth area Mexico Brazil
Main uses
Physicalproperties
Used in precision castingwaxes, perfect for lipsticks,dental waxes, waterproofingagents and fabric finishes.
Low expansion andcontraction coefficient,durable, will not crack.Hard, glossy wax that
retains oils, emulsifiableand has excellent gellingproperties. Melting point
of 156 degrees Fahrenheit.
Cosmetics, particularly instick applications, food
coatings, pharmaceuticals,electronics and polishes.
Hardest of natural waxes.Brittle, non-tacky andlustrous composition.
Retains oil, emulsifiableand has excellent gellingproperties. Pale yellow;highest melting point at
181 degrees Fahrenheit.
Production Process
The production of the candelilla wax consists of two differentrefinement processes. The first is done right in the field itself,while the second refinement process is carried out in CerasDeserticas’ facilities (see Exhibit 5).
EXHIBIT 4USES OF CANDELILLA WAX
Candles, cosmeticsShoe polish, dentistryCrayons and pencils
Insect repellentsTypewriter ribbonsPharmaceuticalsEmulsoidal wax
OintmentsInks
PaintsCandles
Car polishCarbon diaper
MatchesWax paper
Floor & furniture polishTextiles and plastics
Oils and lubricantsElectrical conductors
ExplosivesLinoleum
WaterproofingPaint removersLeather-tanningColor varnishes
Adhesive productsCement
Celluloid compoundsSealant waxes
PackagingPaper gumming
Rubber compoundsProjectile propulsor
Hardener for soft waxesMolding compounds
During the first refinement process, the harvested can-delilla is transported to the extraction facility in the field. Atthis point, the harvested candelilla is added to an earthencaldron, which is built into the ground. This caldron already isfilled with boiling water and a dilute amount of sulfuric acidto help extract the wax. The wax ‘‘boils’’ out of the candelillaplant and floats to the top of the caldron. At this point thefarmers skim off the crude candelilla wax, called cerote, andplace the hot wax into a large drum to cool. After no morewax is left in the plants, they are shoveled out of the solutionwith pitchforks and allowed to dry in the hot sun; they will beused as fuel to heat the acid solution for the next extraction
of the wax. In this manner, everything is recycled and nothinggoes to waste. After the wax has cooled down, it is broken intosmaller pieces to be fed into the second refinement process.
Once the cerote is brought to the facility, it is submitted to asecond refinement process with the main purpose of removingall the impurities that the crude wax could still have, assuringuniformity in the quality of the final product. Basically, theprocess is very similar to the one performed in the fields. Thewax is fed into a heated caldron where it boils for severalhours; it is then left to cool down and broken into smallerpieces in order to be packed as a final product.
The end candelilla wax that is sold to customers is packedin 50 kilogram polypropylene sacks. These sacks help preserveand protect the wax from humidity and extreme temperaturevariations that can be present during transportation. The plantproduction capacity is 1,200 tons per year. Additionally, it isimportant to mention there is an output 4 kilogram of wax per100 kilogram of plant.
INDUSTRY
The candelilla wax industry has been very complex since itsformation in Mexico. It has been present in the MexicanRepublic since the late 1930s, when it was considered a verypopular product, especially for the weapons and arms industry.During this period candelilla wax was used in bullets, insidecanyons, on ship building, etc., and its consumption severelydecreased after World War II ended. Later, the most knownapplications of the wax today were starting to be developed,and the wax regained its popularity for other industries otherthan weapons and arms.
For the past 50 years, the Mexican government had tightregulations on the production and sale of the candelilla wax.In the past, it was traded freely, but when the governmentrealized the importance of this product it was taken over andcontrolled. The government decided how much to produce,at what price to sell, and to whom the campesinos or farmersshould sell. Later, as NAFTA was adopted (1993), the govern-ment started to ease regulations; the candelilla wax industrywas deregulated and it ended up in private hands. It was at thistime when Ceras Deserticas was formed together with many
Case 20 • Ceras Deserticas and Mitsuba Trading Company • 731
EXHIBIT 5PRODUCTION PROCESS
Shrubs ofcandelilla plant First refinement
process
Delivery of"cerote" to facility
Manufacturingfacility
Second refinementprocess
Bulk ofcandelilla wax
Breaking ofcandelilla waxPackaging of
candelilla wax
other companies that wanted to take advantage of this veryunique and peculiar product.
Now, looking into the supply chain inside the candelillawax industry, it is important to mention the following. Thechain starts from the ejidatarios or landowners, who privatelyown the land on which they grow the candelilla plant. They arein charge of handling the growing, harvesting, and deliveringthe plant to the primary refiners. During this process, theyare also in charge of the reforestation of their own land—theprocess that is usually aided by the primary refiners as well.
The next step in the process is the primary refiners, such asCeras Deserticas, who buy from the ejidatarios. Interestingly,this step is always troublesome. The ejidatarios are not well-educated people, and they usually work only to satisfy theirbasic needs—to get food, clothing, and shelter. Therefore,they limit their work to get only what they consider enough.For example, if the pay for each kilogram of harvest is 2 pesos,they will work to collect 1 ton per day. If the pay goes upto 4 pesos, they would only work to collect 1/2 ton, whichwould give them the same pay. Therefore, it is very difficultto have a steady and secure supply of product. Furthermore,the government backs the ejidatarios for their social welfare.Total output is expected to be around 1,000 metric tons thisyear. Last year, the production output was 1,500 tons, but theprevious year it was around 750 tons. So as portrayed by thesenumbers, it is clear that there are many factors that are notcontrolled by the grower and are even less controlled by theprimary refiner, such as Ceras Deserticas.
Secondary refiners buy the candelilla wax in sacks from theprevious refinement process. They remove impurities fromthe wax and put in additives that will make the wax performaccording to the requirements of the final customer. They alsobreak the candelilla from the stone-like form that is deliveredfrom the primary refiners, and deliver it in flakes, powder,lump, or any form and shape required by the end customer.
Finally, the end customers buy from the secondary refinersto utilize the candelilla wax in a wide variety of ways, asmentioned earlier. These end customers are present all overthe world.
Competition
Since the start of the deregulation process, the number ofplayers in the candelilla wax industry has been reduced eitherthrough takeovers, mergers, or bankruptcy. There are aroundfourteen different companies that would be regarded as com-petition for Ceras Deserticas. They all have close connectionsto their own suppliers, or the ejidatarios. On a size basis, thelargest supplier of candelilla wax is Ceras Deserticas followedby Ceras Naturales de Mexico and Multiceras (see Exhibit 6);the rest have a smaller market share. Both Ceras Deserticasand Ceras Naturales de Mexico specialize in candelilla waxand offer better customer service by focusing on one productinstead of a wide assortment of products. The rest of the com-panies usually carry many other chemical products and othernatural and synthetic waxes, having a much wider assortmentof products to offer to the end customers.
EXHIBIT 6MARKET SHARE
CerasDeserticas
50%CerasNaturalesde Mexico
20%
Multiceras20%
Rest 10%
'
'
The barriers to enter into the candelilla market are veryhigh. Considering the close and key relationship that the firstrefiners need in order to start a business with the primarysuppliers, the ejidatarios, the entrance into the market cannotbe accomplished overnight. There is a time constraint as wellas a relationship constraint that is not built fast or obtainedeasily. On the other hand, there are some government issues
732 • Case 20 • Ceras Deserticas and Mitsuba Trading Company
that need to be considered, because as was mentioned before,there is government backup for the ejidatarios. Therefore,people approaching this kind of business need to be aware ofthe way the ejidatarios work.
In addition to this, considering the potential substitutealternatives that can be developed for the uses of the candelillawax, there is always a constant threat for the development ofan exact substitute that will make candelilla wax vulnerable tothe synthetic wax market. It is clear that a synthetic substitutewill always be more cost competitive than a natural product,especially if the weather and other factors that are out of thefarmer’s control are taken into consideration. Additionally,the research in this field is well advanced especially in theUnited States.
Ceras Deserticas International Trading
Ceras Deserticas has all its customers outside the MexicanRepublic. As was mentioned before, all the main customersare based in the United States, Japan, and Europe, havingmarginal exports to other places around the world. How-ever, this doesn’t mean that there are no Mexican consumersof candelilla wax. The main industries that consume can-delilla wax in Mexico are the candy industry (specificallythe gum manufacturers, the paint industry, and the polishindustry).
The U.S. market is the main customer for this company,taking around 70 percent of the total sales volume. Japan, onthe other hand, accounts for 15 percent, while Europe has 10percent (see Exhibit 7). In the United States, the main cus-tomer is a company called Strahl & Pitsch. On the Japanesemarket, Mitsuba Trading Company and Chiyoda Corporationare the main customers. Hermann Ter Hel Company, locatedin Germany, is also a customer.
Looking at trading, Ceras Deserticas exports candelilla waxto Japan through the port of Manzanillo on the Pacific Ocean.
Exports going to Europe and South America go through theport of Veracruz, while to the United States the exports aresent though Laredo, Texas. The exports that go overseas aresent by ship, while the product going to the United States issent by truck.
Price is another important issue. It is usually handled inUS$/ton, varying according to the destination of the product.The product is usually sold FOB Mexican port (Manzanillo orVeracruz) or FOB border, in the case of ground transporta-tion. The current price for the candelilla wax is the following:for the U.S. market, the price is US $2,650/ton, while for therest of the world, the price is US $2,700/ton. With these num-bers, the 1997 figures for the export sales of candelilla waxaccount for US $1,026,000. This number is the result of con-sidering the percentage sales by destination and the currentprices.
Several Mexican companies have carried out joint ventureswith American companies in order to become sole suppliersto the U.S. market, and the Mexican competition for CerasDeserticas is assuring a steady sales volume. Ceras Deserticashas been approached on several occasions by different com-panies—not from the United States, but from Japan. WithStrahl & Pitsch there is a strategic alliance for the supply ofcandelilla wax. This company has, to date, the most advancedresearch and development site in the world.
The possibility of selling the company, making a jointventure, or vertical forward integration has gone throughthe minds of Ceras Deserticas executives. They are will-ing to look into the different alternatives to pick what bestsuits the company and its future in the candelilla businessmarket.
Taking a step back into production, it was mentionedthat Ceras Deserticas had a manufacturing capacity of 1,200tons, while the actual output for 1997 will be only 500 tons.There is a real lack of capacity utilization, and improving the
EXHIBIT 7CERAS DESERTICAS EXPORTS
Exports of candelillawax by destination:
U.S.A. 70%Europe 10%Japan 15%Rest of World 5%
Case 20 • Ceras Deserticas and Mitsuba Trading Company • 733
EXHIBIT 8MITSUBA’S LOCATIONS IN JAPAN
Nagoya branch officeSuzuka branch officeOsaka branch office
Mizushima branch officeHiroshima branch office
Fukuoka branch office
Sapporo branch office
Head branch officeUtsunomiya branch officeTokyo branch officeAtsugi branch officeHamamatsu branch office
export market, especially to those areas that are low (Japan,Europe and the rest of the world), is a primary concern for itsexecutives. This is the main reason why Ceras Deserticas exec-utives are looking carefully at the option of partnering with aJapanese company. Mitsuba Trading Company is a very largetrading company. The advantage of a Japanese joint venture,rather than with an U.S. company, is that Americans are notinterested in bringing research to Mexico, just assuring thesupply of the wax. On the other hand, the Japanese are willingto invest in research and development, as well as educatingthe labor force of Ceras Deserticas.
MITSUBA CORPORATION
Since Mitsuba was founded in 1946, it has provided gener-ator lamps for bicycles and electrical components for motorvehicles, all the while maintaining and developing cooperativerelationship with the local community of Kiryu City, lying 120km north of Tokyo (see Exhibit 8). In 1997, its capital became9.86 billion Japanese yen (US$ 79 million) and its annual saleswere 81.12 billion Japanese yen (US$ 649 million) in 1996 (seeExhibit 9).
It is expanding markets of motorization and globalizationof automotive electronics. This has enabled its products toreach every part of the world. Recently, it has ambitiouslyundertaken new businesses and has expanded its enterpriseto automobile, chemicals, industrial equipment, and medi-cal equipment. Mitsuba’s affiliated companies extend insideand outside of Japan covering production, sales, physicaldistribution, and system integration.
Since 1971, Mitsuba has promoted the establishment ofoperations in every part of the world through technicalcooperation with manufacturers. Additionally, it has begunproduction in North America, including two plants in theUnited States and one plant in Mexico. It has plants in South-east Asia and China. According to a recent announcement,Mitsuba will positively develop and expand all functions,including marketing, research and development, production,and local sourcing, to form a ‘‘Tri-Axial’’ organization (see
Exhibit 10). Mitsuba plans to grow as a global firm of the newage by making all functions international.
EXHIBIT 9MITSUBA’S COMPANY OUTLINE
Established March 8, 1946Capital 9,860,000,000 Japanese yenAnnual Sales 81,116,000,000 Japanese yen (actual
1996 sales)Employees 2,774 (2,064 men and 710 women)Average Age 36.0 years old (36.7 for men and 33.7 for
women)Operations Production and Sales of
Automotive Electronic Components
Mitsuba Trading Company
Mitsuba Trading Co., Ltd. is located in Nitta Country, closeto Kiryu City, Gunma Prefecture. In the distribution indus-try, Japanese general trading companies have been providingcomprehensive distribution functions to their suppliers andbuyers by utilizing affiliated companies and related compa-nies. These functions include founding warehouses, processinggoods, distributing processed goods to buyers, and operatinginformation systems to support distribution. Like the generaltrading company, Mitsuba Trading Company has been playingan important role within Mitsuba group.
Mitsuba Trading Company started business with CerasDeserticas in 1996. It imports the candelilla wax from Mexicoand hand it over to the affiliated companies to process it.The affiliated companies produce more nearly finished waxthen the secondary refiner does. In addition, these companiestransform the pebble-like candellila wax into flakes, powder,or any form required by the final customers. Mitsuba TradingCompany distributes this more highly processed candellilawax to the end customers.
734 • Case 20 • Ceras Deserticas and Mitsuba Trading Company
EXHIBIT 10MITSUBA’S TRI-AXIAL PLAN
AmericaLocalized production 2
Sales 1Technical cooperation 1
AsiaLocalized production 5
Sales 1Technical cooperation 9
EuropeTechnical cooperation 4
Candelilla Wax Market in Japan
Mitsuba actually dominates the domestic trading of candelillawax. It had been importing the candelilla wax from Mexicosince the 1950s as an exclusive agent in the Japanese marketand Southeast Asian market up until the deregulation by theMexican government.
The candelilla wax is used for various purposes in Japan.For example, it is used for shoe polish, auto wax, insulatingtape, lipstick, chewing gum, candy, crayon, waterproofedcloth, and dyestuffs. Recently, candelilla wax use grew into three industry areas: cosmetics, foods, and informationrecording devices (i.e., ink for printer and copy machines).In the foods industry and the cosmetics industry, demandfor the candelilla wax is growing remarkably. Both industrieshave recognized that candelilla wax is a necessary ingredientfor their products. A food company, for example, is thinkingof expanding tablet gum in the Japanese market, which isdominated by Warner Lambert, a U.S. food company, andLotte, a Korean owned company.
The food industry has the lowest requirement for qualitycandelilla wax. On the other hand, the cosmetics and the infor-mation recording device industry have higher requirementsfor quality. Consequently, price of secondary refinement can-delilla wax in Japan is according to the user’s requirement. Forexample, the price of first refinement candelilla wax is US$2.7per kilogram in Japan. The price of the second refinementcandelilla wax for foods industry is US$6 per kilogram. Forthe cosmetics industry, the price rises to US$100 per kilogrambecause the finest refinement is required.
Several years ago, one of the big primary refiners in Mexicoprocessed the second refinement in Mexico utilizing Ger-man equipment with German engineers’ assistance. Mitsuba
imported the second refinement candelilla wax at US$3.4 perkilogram from the company. However, the quality of the sec-ond refinement wax could not meet any Japanese end-users’requirements. Deodorization and the alien substances are themain problems.
Distribution channels of candelilla wax in Japan are com-plex. Mitsuba, for example, cannot sell the wax directly to oneof the biggest food companies. It has a huge demand for can-delilla wax because the food company is supplied all of ingre-dients from limited numbers of exclusive trading companies,such as Marubeni and Mitsubishi. Similar situations exist forother companies that have historical relationships with bigJapanese trading companies.
Japanese Regulation
Ceras Deserticas has faced regulation by the Japanese gov-ernment regarding the export of candelilla wax as importedby the Japanese second refiners. The Japanese Ministry ofWelfare is responsible for products going into Japan that maybe hazardous or dangerous.
This government agency requires that candelilla wax com-ing from primary refiners, such as Ceras Deserticas, must gothrough a second refinement process in order to meet therequirements set by the Ministry of Welfare.
This has been a hidden trade barrier that has prohibitedMexican companies from selling directly to the end consumersin Japan, having to go through the trading companies in orderto reach its customers. It is important to mention that refinedcandelilla, such as that produced by secondary refiners, is notsubject to this requirement from the Ministry of Welfare.
Mitsuba Trading Company comes into the trade chain bytaking the first refined candelilla wax, treating it in order to
Case 21 • The Headaches of GlaxoWellcome • 735
comply with regulations, and selling it to the end users whilemaking a profit. In addition, there is a tariff for the import ofcandelilla wax into Japan of 3.8 percent; this is for either firstor second refined candelilla wax.
FUTURE OF THE CANDELILLA WAX INDUSTRY
According to executives of Ceras Deserticas, the future ofthis market is promising. They expect growth in the future,although they they have not made public the actual estimatedgrowth for the market. They are worried about the best pathto take advantage of this growing and competitive market.
The industry is consolidating and if Ceras Deserticas doesnothing, it will either die or be taken over. As mentionedbefore, there are several joint ventures in which U.S. com-panies are investing in Mexico to guarantee a steady supplyof candelilla wax. Both Ceras Nacionales de Mexico and
Multiceras have established joint ventures with Americancompanies. They are pursuing research and development totry to create a synthetic wax that can replicate the char-acteristics of candelilla wax and meet the requirements ofend-users.
DISCUSSION QUESTIONS
1. Of the three options options presented at the beginning ofthe case, what should Ceras Deserticas do?
2. Why would Mitsuba Trading Co. be interested in a jointventure with Ceras Deserticas?
3. What would be the advantages and disadvantages for CerasDeserticas of a joint venture?
4. What strategy must Ceras Deserticas follow in approachingjoint venture?
� � � � � � � � � � � � � � � � � � � � � � � � � � � � � � �
CASE 21
THE HEADACHES OF GLAXOWELLCOME
Migraine medicine is a key growth area for Glaxo WellcomeInc. (Glaxo); a Britain-based pharmaceutical company withglobal operations.1 Glaxo’s primary business is to marketprescription products to physicians and healthcare providers.Glaxo was the first pharmaceutical company to manufactureand market a revolutionary new class of prescription migrainemedications called ‘‘triptans’’. Triptans, which Glaxo launchedin 1993, are a class of medications that work specifically onthe 5HT-1 receptor sites, which are believed by doctors to bethe primary cause of migraine headaches.
In mid May of 1997, Sir Benjamin Palmer, the general man-ager of Glaxo’s CNS/GI Metabolic division, sat at the headof the conference table in room G-1 of the Glaxo Wellcomeglobal headquarters in Stockley Park West, England. A groupof 6 marketers (3 from the ‘‘Professional’’ team and 3 from the‘‘Commercial’’ team) were staged in front of Palmer and twovice presidents of sales (East and West). The three officerslistened attentively to the final marketing presentation thatmore than 60 marketing team members had worked on for thepast 19 months. The issue: How to launch Naramig, Glaxo’snew (second generation) prescription migraine medicine, inthe U.K. In the back of Palmer’s mind were the followingconsiderations:
• How would U.K. hospitals and doctors react to Glaxo’spromotion of Naramig?
• What was the best product positioning of Naramig withrespect to Imigran?
This case was prepared by Jared Fontaine, Aaron C. Lennon, and RobertMoscato of the Fox School of Business and Management at Temple Univer-sity under the supervision of Professor Masaaki Kotabe for class discussionrather than to illustrate either effective or ineffective management of asituation described (2001).1Today the company is known as GlaxoSmithKline, which was formedin January 2001 as the result of a merger between GlaxoWellcome andSmithKline Beecham.
– Although Naramig was considered by Glaxo to be a bettertriptan than Imigran, in reality, there were some attributesof Naramig that were inferior to those of Imigran.
– It was not as if Imigran had not been successful: Glaxohad captured 91 percent of the prescription medicationmarket share (in £s) for migraines in the U.K.
– Glaxo expected the approval and launch of its competitor,Zeneca’s first triptan medication (Zomig) prior to that ofNaramig, and likewise, expected Zeneca to market Zomigas a 2nd generation triptan.
8 12 Months Later
Early in February of 1998, a similar scene to that of 8 12 months
ago, in room G-1 of the U.K. headquarters, was taking place ina conference room located at the U.S. home office in ResearchTriangle Park, North Carolina. Mark Glackin, U.S. GeneralManager of Glaxo’s CNS/GI Metabolic Division, consideredseveral marketing options presented by the team for the U.S.launch of Amerge, Glaxo’s second-generation triptan that hadbeen marketed in the U.K. as Naramig.2 Although Glackinhad several considerations to keep in mind, various factorsand events gave Glackin a much different perspective thanthat of Palmer 8 1
2 months earlier:
• Glaxo was apprised of the marketing strategy chosen by theU.K. for Naramig and its short-term results.
• Zeneca’s Zomig had in fact been approved and launchedin the U.K. prior to that of Naramig. The effects of Zomigon the success of Naramig and Imigran were thereforeavailable for analysis by Glackin.
• Just as in the U.K., Glaxo U.S. expected the approvaland launch of Zomig in the U.S. prior to that ofAmerge.
2Like Amerge/Naramig, Glaxo’s research indicated that the name Imitrexwould fare better than Imigran in the U.S. market.
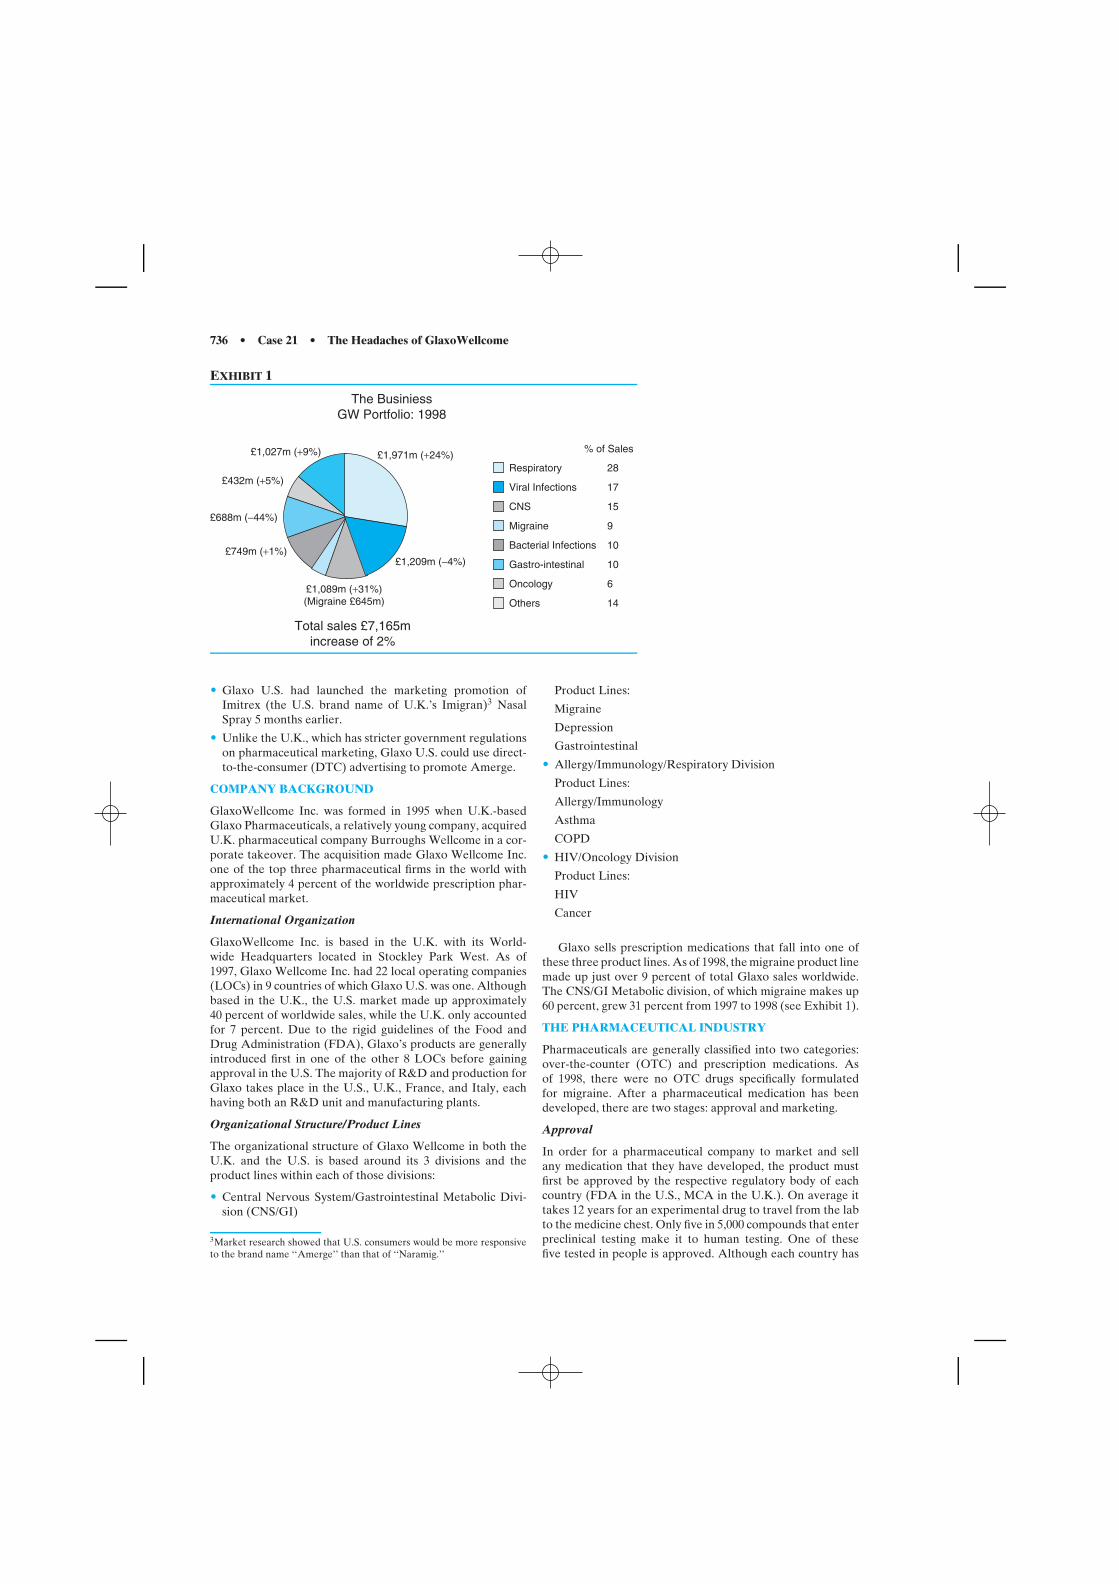
736 • Case 21 • The Headaches of GlaxoWellcome
EXHIBIT 1
£1,209m (−4%)
Respiratory 28
% of Sales
17
9
15
10
10
6
14
Viral Infections
CNS
Migraine
Bacterial Infections
Gastro-intestinal
Oncology
Others
£1,971m (+24%)
The BusiniessGW Portfolio: 1998
£1,089m (+31%)(Migraine £645m)
Total sales £7,165m increase of 2%
£749m (+1%)
£688m (−44%)
£432m (+5%)
£1,027m (+9%)
• Glaxo U.S. had launched the marketing promotion ofImitrex (the U.S. brand name of U.K.’s Imigran)3 NasalSpray 5 months earlier.
• Unlike the U.K., which has stricter government regulationson pharmaceutical marketing, Glaxo U.S. could use direct-to-the-consumer (DTC) advertising to promote Amerge.
COMPANY BACKGROUND
GlaxoWellcome Inc. was formed in 1995 when U.K.-basedGlaxo Pharmaceuticals, a relatively young company, acquiredU.K. pharmaceutical company Burroughs Wellcome in a cor-porate takeover. The acquisition made Glaxo Wellcome Inc.one of the top three pharmaceutical firms in the world withapproximately 4 percent of the worldwide prescription phar-maceutical market.
International Organization
GlaxoWellcome Inc. is based in the U.K. with its World-wide Headquarters located in Stockley Park West. As of1997, Glaxo Wellcome Inc. had 22 local operating companies(LOCs) in 9 countries of which Glaxo U.S. was one. Althoughbased in the U.K., the U.S. market made up approximately40 percent of worldwide sales, while the U.K. only accountedfor 7 percent. Due to the rigid guidelines of the Food andDrug Administration (FDA), Glaxo’s products are generallyintroduced first in one of the other 8 LOCs before gainingapproval in the U.S. The majority of R&D and production forGlaxo takes place in the U.S., U.K., France, and Italy, eachhaving both an R&D unit and manufacturing plants.
Organizational Structure/Product Lines
The organizational structure of Glaxo Wellcome in both theU.K. and the U.S. is based around its 3 divisions and theproduct lines within each of those divisions:
• Central Nervous System/Gastrointestinal Metabolic Divi-sion (CNS/GI)
3Market research showed that U.S. consumers would be more responsiveto the brand name ‘‘Amerge’’ than that of ‘‘Naramig.’’
Product Lines:
Migraine
Depression
Gastrointestinal
• Allergy/Immunology/Respiratory Division
Product Lines:
Allergy/Immunology
Asthma
COPD
• HIV/Oncology Division
Product Lines:
HIV
Cancer
Glaxo sells prescription medications that fall into one ofthese three product lines. As of 1998, the migraine product linemade up just over 9 percent of total Glaxo sales worldwide.The CNS/GI Metabolic division, of which migraine makes up60 percent, grew 31 percent from 1997 to 1998 (see Exhibit 1).
THE PHARMACEUTICAL INDUSTRY
Pharmaceuticals are generally classified into two categories:over-the-counter (OTC) and prescription medications. Asof 1998, there were no OTC drugs specifically formulatedfor migraine. After a pharmaceutical medication has beendeveloped, there are two stages: approval and marketing.
Approval
In order for a pharmaceutical company to market and sellany medication that they have developed, the product mustfirst be approved by the respective regulatory body of eachcountry (FDA in the U.S., MCA in the U.K.). On average ittakes 12 years for an experimental drug to travel from the labto the medicine chest. Only five in 5,000 compounds that enterpreclinical testing make it to human testing. One of thesefive tested in people is approved. Although each country has
Case 21 • The Headaches of GlaxoWellcome • 737
its own particular set of guidelines and specific proceduresfor approval, new medicines are generally developed andapproved as follows:
1. Preclinical Testing—This is the exploratory process wherea pharmaceutical company identifies compounds throughin vitro (test tube) testing. The deliverable at the end ofthis process are compounds that can enter Phase One ofClinical Testing.
2. Clinical Trials, Phases—There are three mandatory phasesof clinical trials. These clinical trials study the medicine’ssafety profile, how it is absorbed and distributed, the dura-tion of its action, its efficacy, and side effects.
3. Application—Following the completion of all three phasesof clinical trials, the company analyzes all of the dataand applies for approval in the respective country if thedata successfully demonstrate safety and effectiveness. Theapplication contains all of the scientific information that thecompany has gathered. At this point, the regulatory bodymay request further information.
4. Approval/Refusal—Once the regulatory body completesthe professional assessment of all relevant information,it either approves the application and the new medicinebecomes available for physicians to prescribe, or, if unsat-isfied, refuses to grant approval.
There is one important distinction between the U.S. andthe U.K. in the approval stage of pharmaceuticals. In the U.S.,every medication must be approved by the FDA before it canbe marketed and sold. However, because of the existence ofthe European Union (EU), it is possible that a medicationmay be approved in member nations without being profes-sionally assessed and analyzed by each country’s respectiveregulatory body. This means that if one member nation’s(e.g. Sweden’s) regulatory body approves a medication, theapplying pharmaceutical company can either ask the otherEU member nations to ‘‘recognize’’ Sweden’s approval orapply to each member nation separately. If one membernation approves a medication, then all of the countries in the‘‘Mutual Recognition’’ procedure have the same prescribinginformation. However, if a medication receives independentapprovals, then the prescribing information will be unique ineach country. The difference can have an effect if applyingin each country separately produces slightly different resultsin the trial phases (e.g., perhaps the trials show that a med-ication is more effective for its desired indication duringtrials in the U.K. as compared to similar trials performed inSweden).
Marketing
In general, products are marketed and advertised solelytoward the final consumer. This makes sense since it is the finalconsumer that ordinarily has the final say as to whether he/shewill actually purchase the product. However, pharmaceuticalsare marketed to physicians and hospitals that in turn decide ifthey will prescribe the medication to their patients.
U.S. vs. U.K
Although it is illegal for pharmaceutical companies to adver-tise their products directly to patient/consumers in the U.K.,
in the U.S. (as of 1997) direct-to-consumer (DTC) advertis-ing is permitted. Research has shown that DTC advertisingin the U.S. has a large impact on sales. The research showsthat patient’s requests for specific medications marketed byspecific pharmaceutical companies affect the companies’ salesto physicians and hospitals.
The other major difference in the pharmaceutical industrybetween the U.S. and the U.K. is the extent of governmentalcoverage. In the U.K., the health care system is socialized.Doctors are paid by the government with an additional pay-ment per patient. Everyone is entitled to free medical careunder the plan, which is funded by the National Treasury andHealth Insurance Tax.
The U.S., on the other hand, has not employed socializedmedicine, although Medicare and Medicaid cover a significantpart of the population. Instead, the U.S. health care systemfollows an insurance-based coverage scheme whereby individ-uals buy insurance from a company, which in turn pays fortheir medical costs.
HEADACHES AND MIGRAINES
Doctors classify headaches into three main types:
• cluster headaches
• tension-type headaches
• migraines
Cluster headaches are the most painful type but also quiterare and hence have not offered pharmaceutical compa-nies a sufficient market potential to profitably develop andmarket a medication specifically focused on curing theseheadaches. Tension-type headaches, while the most prevalent,are generally capable of being combated with over-the-countermedications such as aspirin and ibuprofen and hence, likewisedo not offer Glaxo a profitable market for which to developa prescription product. Migraines, on the other hand, aresuffered by an estimated 26.3 million people in the U.S.,5 million people in the U.K., and at the time of Glaxo’slaunch of Imigran/Imitrex, were not effectively treatable withover-the-counter medications.
Migraines are complicated combinations of intense pain(usually on one side of the head) and neurological symptomslike visual problems, nausea, vomiting, and sensitivity to lightand sound, which often reduce the sufferer’s productivity andconcentration and in some cases render the sufferer bedrid-den. In the U.K. about 18 million working days are lost tomigraine sufferers a year. In the U.S. approximately 10 mil-lion migraine sufferers were bedridden for more than 3 milliondays per month and experienced 74.2 million restricted activ-ity days per year (as of 1989). Such statistics translate to lostworkplace productivity ranging from $5.6 billion to $17 billionannually in the U.S. and sick pay and replacement person-nel costs of £750 million in the U.K. annually. Hence, in theearly 1990s, Glaxo took advantage of the market potential formigraine-specific prescription drugs.4
4At the time of Glaxo Wellcome Inc.’s entrance into the market for pre-scription migraine medicines, although doctors were prescribing drugs formigraines, these drugs were not migraine-specific but rather were drugsthat were developed for general pain relief.
738 • Case 21 • The Headaches of GlaxoWellcome
IMIGRAN/IMITREX
In 1993, Glaxo Pharmaceuticals introduced Imitrex/Imigran5
in the U.K. and the U.S., the first medication (triptan)specifically formulated for the acute treatment of migraine.6
Imitrex/Imigran when initially launched in March of 1993 wasproduced in injection form. In 1995 and 1997, Glaxo followedup the marketing of Imitrex/Imigran by introducing line exten-sions in the forms of tablets and nasal spray, respectively (seeExhibit 2).
EXHIBIT 2
Line Extension U.K. U.S.
Injection 3/1993 3/1993Tablet 5/1995 7/1995Nasal Spray 5/1997 8/1997
These line extensions were spurred by the fact that onlya small percentage of the total 26.3 million migraine suffer-ers had ever tried Imitrex/Imigran in injection form. Hence,Glaxo, even 2 years after the introduction of Imitrex/Imigraninjections, viewed the potential market as wide open.
The injection formulation of the product provides thefastest relief—as early as 10 minutes; the nasal spray—asearly as 15 minutes; and the tablet—as early as 30 minutes.Hence, Glaxo has been successful marketing the injectionform of Imitrex/Imigran using a strategy of ‘‘quick-relief’’ (anaspect that is very important to severe migraine sufferers) andsuccessful marketing the tablet and nasal spray forms of thedrug using a strategy of ‘‘easy and painless administration’’(an aspect that is important to migraine sufferers who are
5The launch of Imigran/Imitrex came prior to the Glaxo Pharmaceuticals’acquisition of Burroughs Wellcome, Inc.6Glaxo used the brand name Imitrex in the U.S. and the brand nameImigran in the U.K. for the same product. Market research showed thatthe name Imitrex would fare better with U.S. physicians and hospitals.
uncomfortable injecting themselves). Sales of Imitrex/Imigranworldwide grew from less than $350 million in the year of itsintroduction to more than $1 billion in 1997.
Imigran/Imitrex SWOT
Glaxo considered the strengths, weaknesses, opportunities,and threats of Imigran/Imitrex to be the following:
Strengths—Imigran/Imitrex was the first medication mar-keted toward specific migraine relief. Hence, Imigran/Imitrexhad a strong brand image as the market leader, and in factplayed a significant role in the development of the migrainemarket. Imigran/Imitrex was also a potent medication with aproven efficacy; it was in fact very successful in relieving thepain of migraine headaches. Although there were some sideeffects associated with the medication, Imigran/Imitrex has aproven safety profile. The fact that Imigran/Imitrex is offeredin 3 different line extensions offers Glaxo a ‘‘portfolio’’ ofrelief to offer to various patients.
Weaknesses—The fact that Imigran/Imitrex is a potentmedication has its downside as well. The medication proves tobe too powerful for some patients, which therefore limits itsuse. Moreover, Imigran/Imitrex is expensive relative to OTCproducts that were used to fight headaches. This weakness ofbeing expensive is exacerbated by the fact that the medicationhas a high rate of recurrence (a patient may need to takethe drug more than once during a migraine). Although Imi-gran/Imitrex is proven to be safe, because of the side effects(e.g., tightening of the chest), there is a perception by somethat the medication is not safe.
Opportunities—Glaxo felt that having 3 product lineextensions opened up the opportunity to perhaps exploitImigran/Imitrex as a medication that is right for every kindof migraine sufferer. The biggest opportunity for Glaxo andImigran/Imitrex is the fact that the migraine market wascompletely underdeveloped.
EXHIBIT 3
$m1,200
1,000
800
600
400
200
01993
GlaxoWellcome WorldwideMigraine Franchise
Injection Tabs Nasal Spray
1994 1995 1996 1997 1998
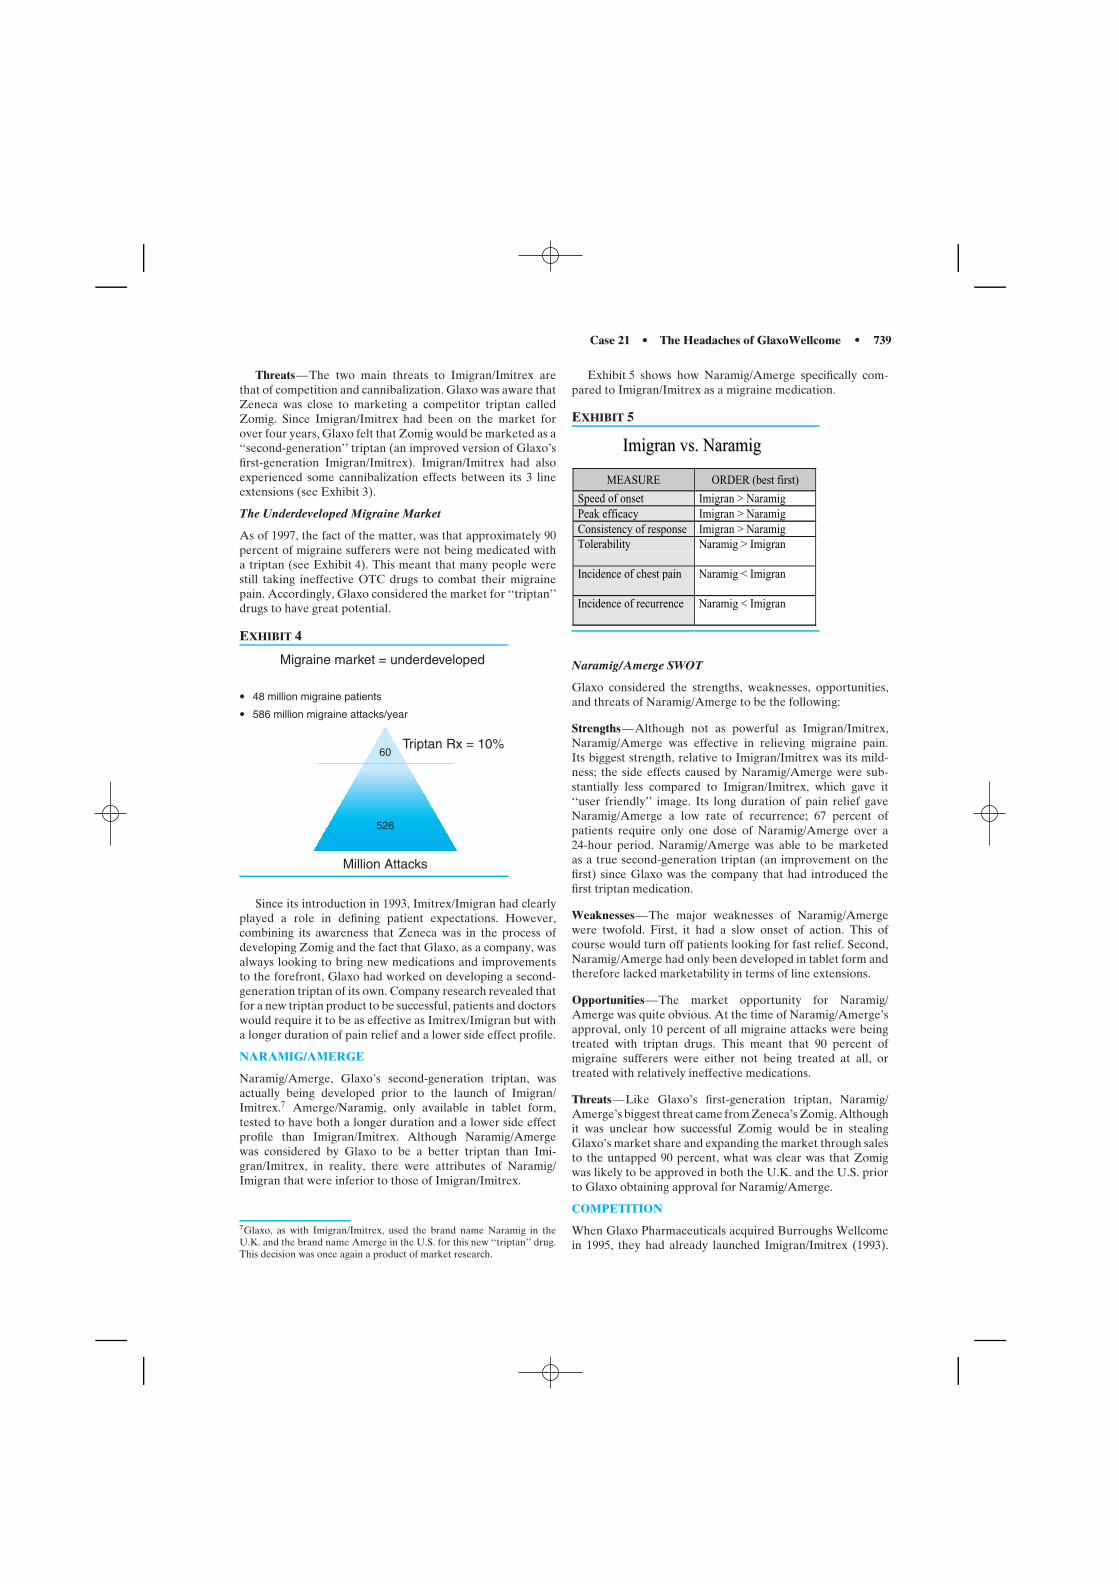
Case 21 • The Headaches of GlaxoWellcome • 739
Threats—The two main threats to Imigran/Imitrex arethat of competition and cannibalization. Glaxo was aware thatZeneca was close to marketing a competitor triptan calledZomig. Since Imigran/Imitrex had been on the market forover four years, Glaxo felt that Zomig would be marketed as a‘‘second-generation’’ triptan (an improved version of Glaxo’sfirst-generation Imigran/Imitrex). Imigran/Imitrex had alsoexperienced some cannibalization effects between its 3 lineextensions (see Exhibit 3).
The Underdeveloped Migraine Market
As of 1997, the fact of the matter, was that approximately 90percent of migraine sufferers were not being medicated witha triptan (see Exhibit 4). This meant that many people werestill taking ineffective OTC drugs to combat their migrainepain. Accordingly, Glaxo considered the market for ‘‘triptan’’drugs to have great potential.
EXHIBIT 4
Migraine market = underdeveloped
Triptan Rx = 10%
Million Attacks
48 million migraine patients
586 million migraine attacks/year
60
526
Since its introduction in 1993, Imitrex/Imigran had clearlyplayed a role in defining patient expectations. However,combining its awareness that Zeneca was in the process ofdeveloping Zomig and the fact that Glaxo, as a company, wasalways looking to bring new medications and improvementsto the forefront, Glaxo had worked on developing a second-generation triptan of its own. Company research revealed thatfor a new triptan product to be successful, patients and doctorswould require it to be as effective as Imitrex/Imigran but witha longer duration of pain relief and a lower side effect profile.
NARAMIG/AMERGE
Naramig/Amerge, Glaxo’s second-generation triptan, wasactually being developed prior to the launch of Imigran/Imitrex.7 Amerge/Naramig, only available in tablet form,tested to have both a longer duration and a lower side effectprofile than Imigran/Imitrex. Although Naramig/Amergewas considered by Glaxo to be a better triptan than Imi-gran/Imitrex, in reality, there were attributes of Naramig/Imigran that were inferior to those of Imigran/Imitrex.
7Glaxo, as with Imigran/Imitrex, used the brand name Naramig in theU.K. and the brand name Amerge in the U.S. for this new ‘‘triptan’’ drug.This decision was once again a product of market research.
Exhibit 5 shows how Naramig/Amerge specifically com-pared to Imigran/Imitrex as a migraine medication.
EXHIBIT 5
MEASURE ORDER (best first)
Speed of onset Imigran > NaramigPeak efficacy Imigran > NaramigConsistency of response Imigran > NaramigTolerability Naramig > Imigran
Incidence of chest pain Naramig < Imigran
Incidence of recurrence Naramig < Imigran
Imigran vs. NaramigImigran vs. Naramig
Naramig/Amerge SWOT
Glaxo considered the strengths, weaknesses, opportunities,and threats of Naramig/Amerge to be the following:
Strengths—Although not as powerful as Imigran/Imitrex,Naramig/Amerge was effective in relieving migraine pain.Its biggest strength, relative to Imigran/Imitrex was its mild-ness; the side effects caused by Naramig/Amerge were sub-stantially less compared to Imigran/Imitrex, which gave it‘‘user friendly’’ image. Its long duration of pain relief gaveNaramig/Amerge a low rate of recurrence; 67 percent ofpatients require only one dose of Naramig/Amerge over a24-hour period. Naramig/Amerge was able to be marketedas a true second-generation triptan (an improvement on thefirst) since Glaxo was the company that had introduced thefirst triptan medication.
Weaknesses—The major weaknesses of Naramig/Amergewere twofold. First, it had a slow onset of action. This ofcourse would turn off patients looking for fast relief. Second,Naramig/Amerge had only been developed in tablet form andtherefore lacked marketability in terms of line extensions.
Opportunities—The market opportunity for Naramig/Amerge was quite obvious. At the time of Naramig/Amerge’sapproval, only 10 percent of all migraine attacks were beingtreated with triptan drugs. This meant that 90 percent ofmigraine sufferers were either not being treated at all, ortreated with relatively ineffective medications.
Threats—Like Glaxo’s first-generation triptan, Naramig/Amerge’s biggest threat came from Zeneca’s Zomig. Althoughit was unclear how successful Zomig would be in stealingGlaxo’s market share and expanding the market through salesto the untapped 90 percent, what was clear was that Zomigwas likely to be approved in both the U.K. and the U.S. priorto Glaxo obtaining approval for Naramig/Amerge.
COMPETITION
When Glaxo Pharmaceuticals acquired Burroughs Wellcomein 1995, they had already launched Imigran/Imitrex (1993).
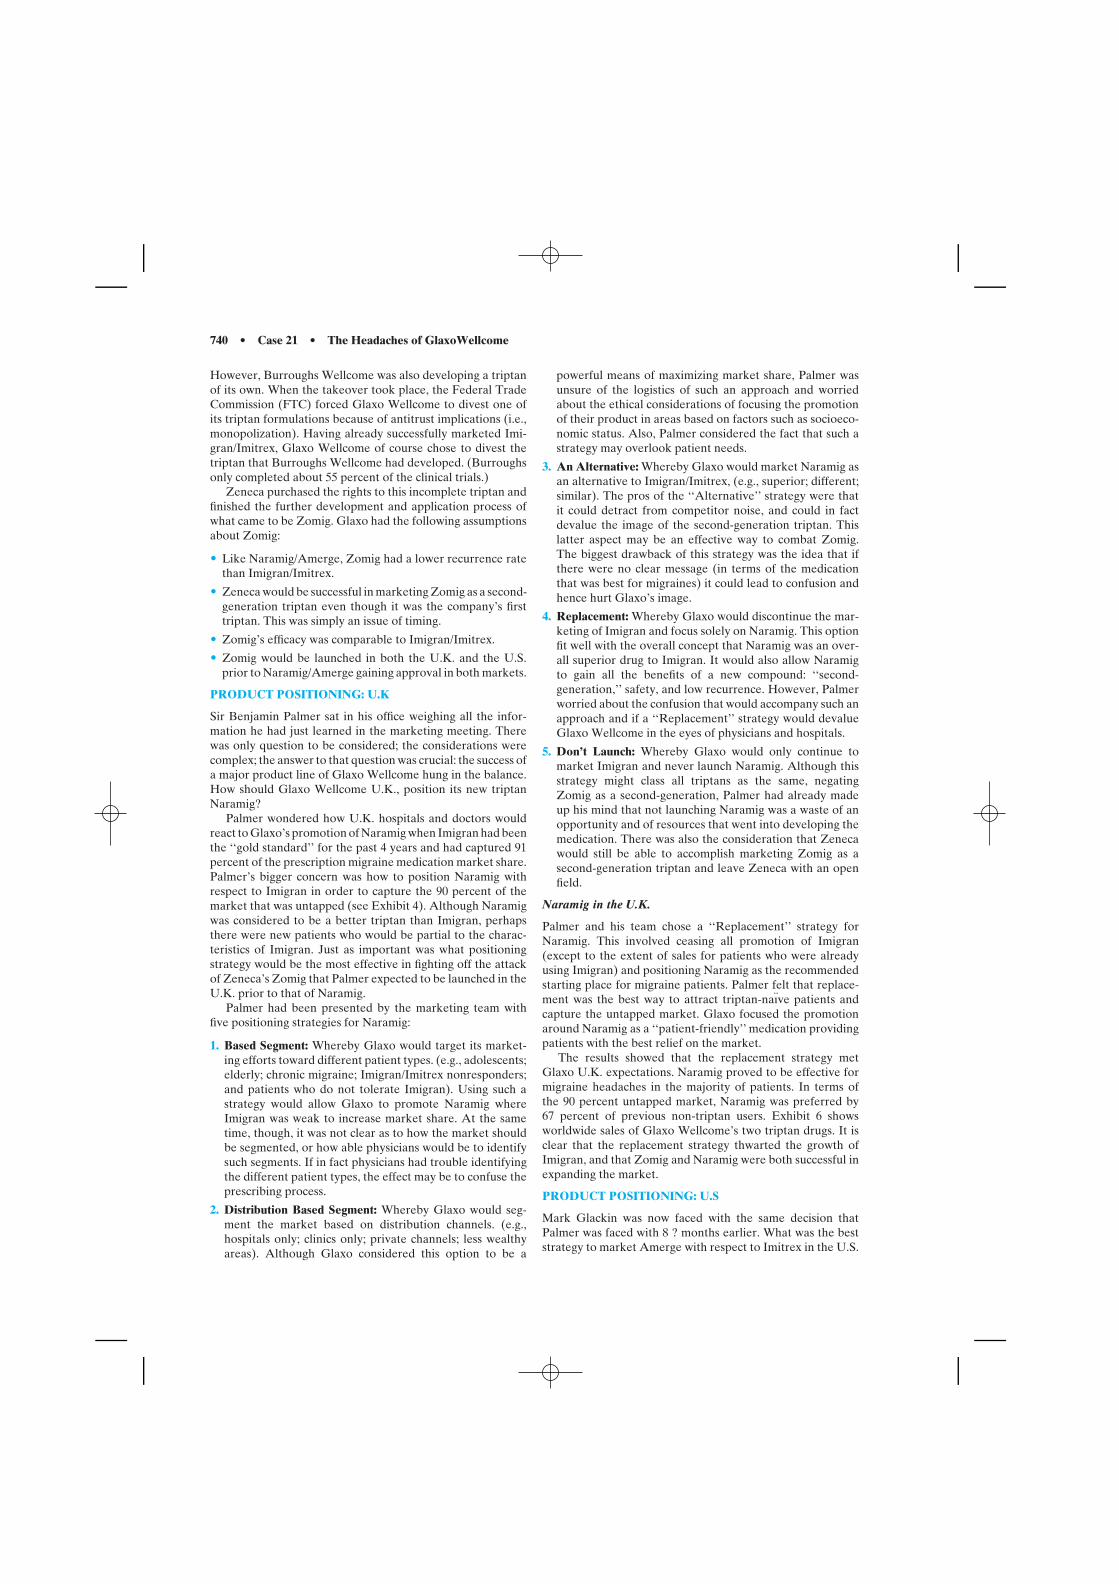
740 • Case 21 • The Headaches of GlaxoWellcome
However, Burroughs Wellcome was also developing a triptanof its own. When the takeover took place, the Federal TradeCommission (FTC) forced Glaxo Wellcome to divest one ofits triptan formulations because of antitrust implications (i.e.,monopolization). Having already successfully marketed Imi-gran/Imitrex, Glaxo Wellcome of course chose to divest thetriptan that Burroughs Wellcome had developed. (Burroughsonly completed about 55 percent of the clinical trials.)
Zeneca purchased the rights to this incomplete triptan andfinished the further development and application process ofwhat came to be Zomig. Glaxo had the following assumptionsabout Zomig:
• Like Naramig/Amerge, Zomig had a lower recurrence ratethan Imigran/Imitrex.
• Zeneca would be successful in marketing Zomig as a second-generation triptan even though it was the company’s firsttriptan. This was simply an issue of timing.
• Zomig’s efficacy was comparable to Imigran/Imitrex.
• Zomig would be launched in both the U.K. and the U.S.prior to Naramig/Amerge gaining approval in both markets.
PRODUCT POSITIONING: U.K
Sir Benjamin Palmer sat in his office weighing all the infor-mation he had just learned in the marketing meeting. Therewas only question to be considered; the considerations werecomplex; the answer to that question was crucial: the success ofa major product line of Glaxo Wellcome hung in the balance.How should Glaxo Wellcome U.K., position its new triptanNaramig?
Palmer wondered how U.K. hospitals and doctors wouldreact to Glaxo’s promotion of Naramig when Imigran had beenthe ‘‘gold standard’’ for the past 4 years and had captured 91percent of the prescription migraine medication market share.Palmer’s bigger concern was how to position Naramig withrespect to Imigran in order to capture the 90 percent of themarket that was untapped (see Exhibit 4). Although Naramigwas considered to be a better triptan than Imigran, perhapsthere were new patients who would be partial to the charac-teristics of Imigran. Just as important was what positioningstrategy would be the most effective in fighting off the attackof Zeneca’s Zomig that Palmer expected to be launched in theU.K. prior to that of Naramig.
Palmer had been presented by the marketing team withfive positioning strategies for Naramig:
1. Based Segment: Whereby Glaxo would target its market-ing efforts toward different patient types. (e.g., adolescents;elderly; chronic migraine; Imigran/Imitrex nonresponders;and patients who do not tolerate Imigran). Using such astrategy would allow Glaxo to promote Naramig whereImigran was weak to increase market share. At the sametime, though, it was not clear as to how the market shouldbe segmented, or how able physicians would be to identifysuch segments. If in fact physicians had trouble identifyingthe different patient types, the effect may be to confuse theprescribing process.
2. Distribution Based Segment: Whereby Glaxo would seg-ment the market based on distribution channels. (e.g.,hospitals only; clinics only; private channels; less wealthyareas). Although Glaxo considered this option to be a
powerful means of maximizing market share, Palmer wasunsure of the logistics of such an approach and worriedabout the ethical considerations of focusing the promotionof their product in areas based on factors such as socioeco-nomic status. Also, Palmer considered the fact that such astrategy may overlook patient needs.
3. An Alternative: Whereby Glaxo would market Naramig asan alternative to Imigran/Imitrex, (e.g., superior; different;similar). The pros of the ‘‘Alternative’’ strategy were thatit could detract from competitor noise, and could in factdevalue the image of the second-generation triptan. Thislatter aspect may be an effective way to combat Zomig.The biggest drawback of this strategy was the idea that ifthere were no clear message (in terms of the medicationthat was best for migraines) it could lead to confusion andhence hurt Glaxo’s image.
4. Replacement: Whereby Glaxo would discontinue the mar-keting of Imigran and focus solely on Naramig. This optionfit well with the overall concept that Naramig was an over-all superior drug to Imigran. It would also allow Naramigto gain all the benefits of a new compound: ‘‘second-generation,’’ safety, and low recurrence. However, Palmerworried about the confusion that would accompany such anapproach and if a ‘‘Replacement’’ strategy would devalueGlaxo Wellcome in the eyes of physicians and hospitals.
5. Don’t Launch: Whereby Glaxo would only continue tomarket Imigran and never launch Naramig. Although thisstrategy might class all triptans as the same, negatingZomig as a second-generation, Palmer had already madeup his mind that not launching Naramig was a waste of anopportunity and of resources that went into developing themedication. There was also the consideration that Zenecawould still be able to accomplish marketing Zomig as asecond-generation triptan and leave Zeneca with an openfield.
Naramig in the U.K.
Palmer and his team chose a ‘‘Replacement’’ strategy forNaramig. This involved ceasing all promotion of Imigran(except to the extent of sales for patients who were alreadyusing Imigran) and positioning Naramig as the recommendedstarting place for migraine patients. Palmer felt that replace-ment was the best way to attract triptan-naıve patients andcapture the untapped market. Glaxo focused the promotionaround Naramig as a ‘‘patient-friendly’’ medication providingpatients with the best relief on the market.
The results showed that the replacement strategy metGlaxo U.K. expectations. Naramig proved to be effective formigraine headaches in the majority of patients. In terms ofthe 90 percent untapped market, Naramig was preferred by67 percent of previous non-triptan users. Exhibit 6 showsworldwide sales of Glaxo Wellcome’s two triptan drugs. It isclear that the replacement strategy thwarted the growth ofImigran, and that Zomig and Naramig were both successful inexpanding the market.
PRODUCT POSITIONING: U.S
Mark Glackin was now faced with the same decision thatPalmer was faced with 8 ? months earlier. What was the beststrategy to market Amerge with respect to Imitrex in the U.S.
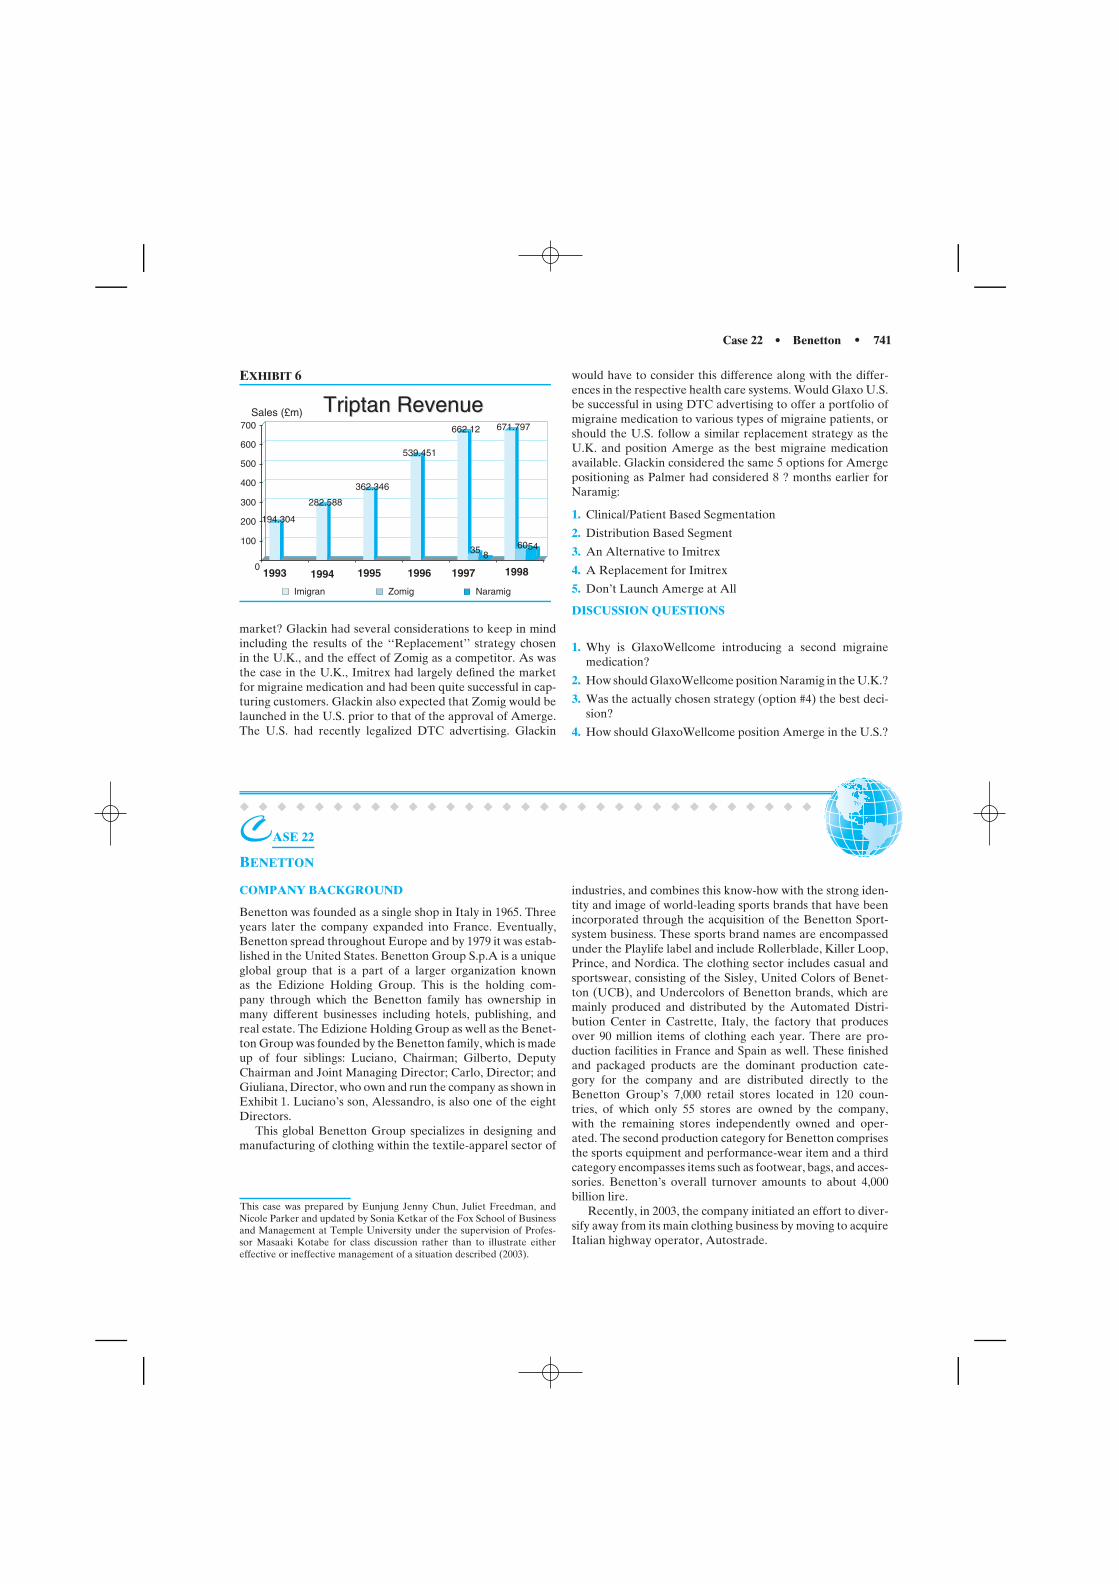
Case 22 • Benetton • 741
EXHIBIT 6
194.304
282.588
362.346
539.451
662.12
35 8
671.797
6054100
200
300
400
500
600
700
Imigran Zomig Naramig
Triptan RevenueTriptan Revenue
1993 1994 1995 1996 1997 1998
Sales (£m)
0
market? Glackin had several considerations to keep in mindincluding the results of the ‘‘Replacement’’ strategy chosenin the U.K., and the effect of Zomig as a competitor. As wasthe case in the U.K., Imitrex had largely defined the marketfor migraine medication and had been quite successful in cap-turing customers. Glackin also expected that Zomig would belaunched in the U.S. prior to that of the approval of Amerge.The U.S. had recently legalized DTC advertising. Glackin
would have to consider this difference along with the differ-ences in the respective health care systems. Would Glaxo U.S.be successful in using DTC advertising to offer a portfolio ofmigraine medication to various types of migraine patients, orshould the U.S. follow a similar replacement strategy as theU.K. and position Amerge as the best migraine medicationavailable. Glackin considered the same 5 options for Amergepositioning as Palmer had considered 8 ? months earlier forNaramig:
1. Clinical/Patient Based Segmentation
2. Distribution Based Segment
3. An Alternative to Imitrex
4. A Replacement for Imitrex
5. Don’t Launch Amerge at All
DISCUSSION QUESTIONS
1. Why is GlaxoWellcome introducing a second migrainemedication?
2. How should GlaxoWellcome position Naramig in the U.K.?
3. Was the actually chosen strategy (option #4) the best deci-sion?
4. How should GlaxoWellcome position Amerge in the U.S.?
� � � � � � � � � � � � � � � � � � � � � � � � � � � � � � �
CASE 22
BENETTON
COMPANY BACKGROUND
Benetton was founded as a single shop in Italy in 1965. Threeyears later the company expanded into France. Eventually,Benetton spread throughout Europe and by 1979 it was estab-lished in the United States. Benetton Group S.p.A is a uniqueglobal group that is a part of a larger organization knownas the Edizione Holding Group. This is the holding com-pany through which the Benetton family has ownership inmany different businesses including hotels, publishing, andreal estate. The Edizione Holding Group as well as the Benet-ton Group was founded by the Benetton family, which is madeup of four siblings: Luciano, Chairman; Gilberto, DeputyChairman and Joint Managing Director; Carlo, Director; andGiuliana, Director, who own and run the company as shown inExhibit 1. Luciano’s son, Alessandro, is also one of the eightDirectors.
This global Benetton Group specializes in designing andmanufacturing of clothing within the textile-apparel sector of
This case was prepared by Eunjung Jenny Chun, Juliet Freedman, andNicole Parker and updated by Sonia Ketkar of the Fox School of Businessand Management at Temple University under the supervision of Profes-sor Masaaki Kotabe for class discussion rather than to illustrate eithereffective or ineffective management of a situation described (2003).
industries, and combines this know-how with the strong iden-tity and image of world-leading sports brands that have beenincorporated through the acquisition of the Benetton Sport-system business. These sports brand names are encompassedunder the Playlife label and include Rollerblade, Killer Loop,Prince, and Nordica. The clothing sector includes casual andsportswear, consisting of the Sisley, United Colors of Benet-ton (UCB), and Undercolors of Benetton brands, which aremainly produced and distributed by the Automated Distri-bution Center in Castrette, Italy, the factory that producesover 90 million items of clothing each year. There are pro-duction facilities in France and Spain as well. These finishedand packaged products are the dominant production cate-gory for the company and are distributed directly to theBenetton Group’s 7,000 retail stores located in 120 coun-tries, of which only 55 stores are owned by the company,with the remaining stores independently owned and oper-ated. The second production category for Benetton comprisesthe sports equipment and performance-wear item and a thirdcategory encompasses items such as footwear, bags, and acces-sories. Benetton’s overall turnover amounts to about 4,000billion lire.
Recently, in 2003, the company initiated an effort to diver-sify away from its main clothing business by moving to acquireItalian highway operator, Autostrade.
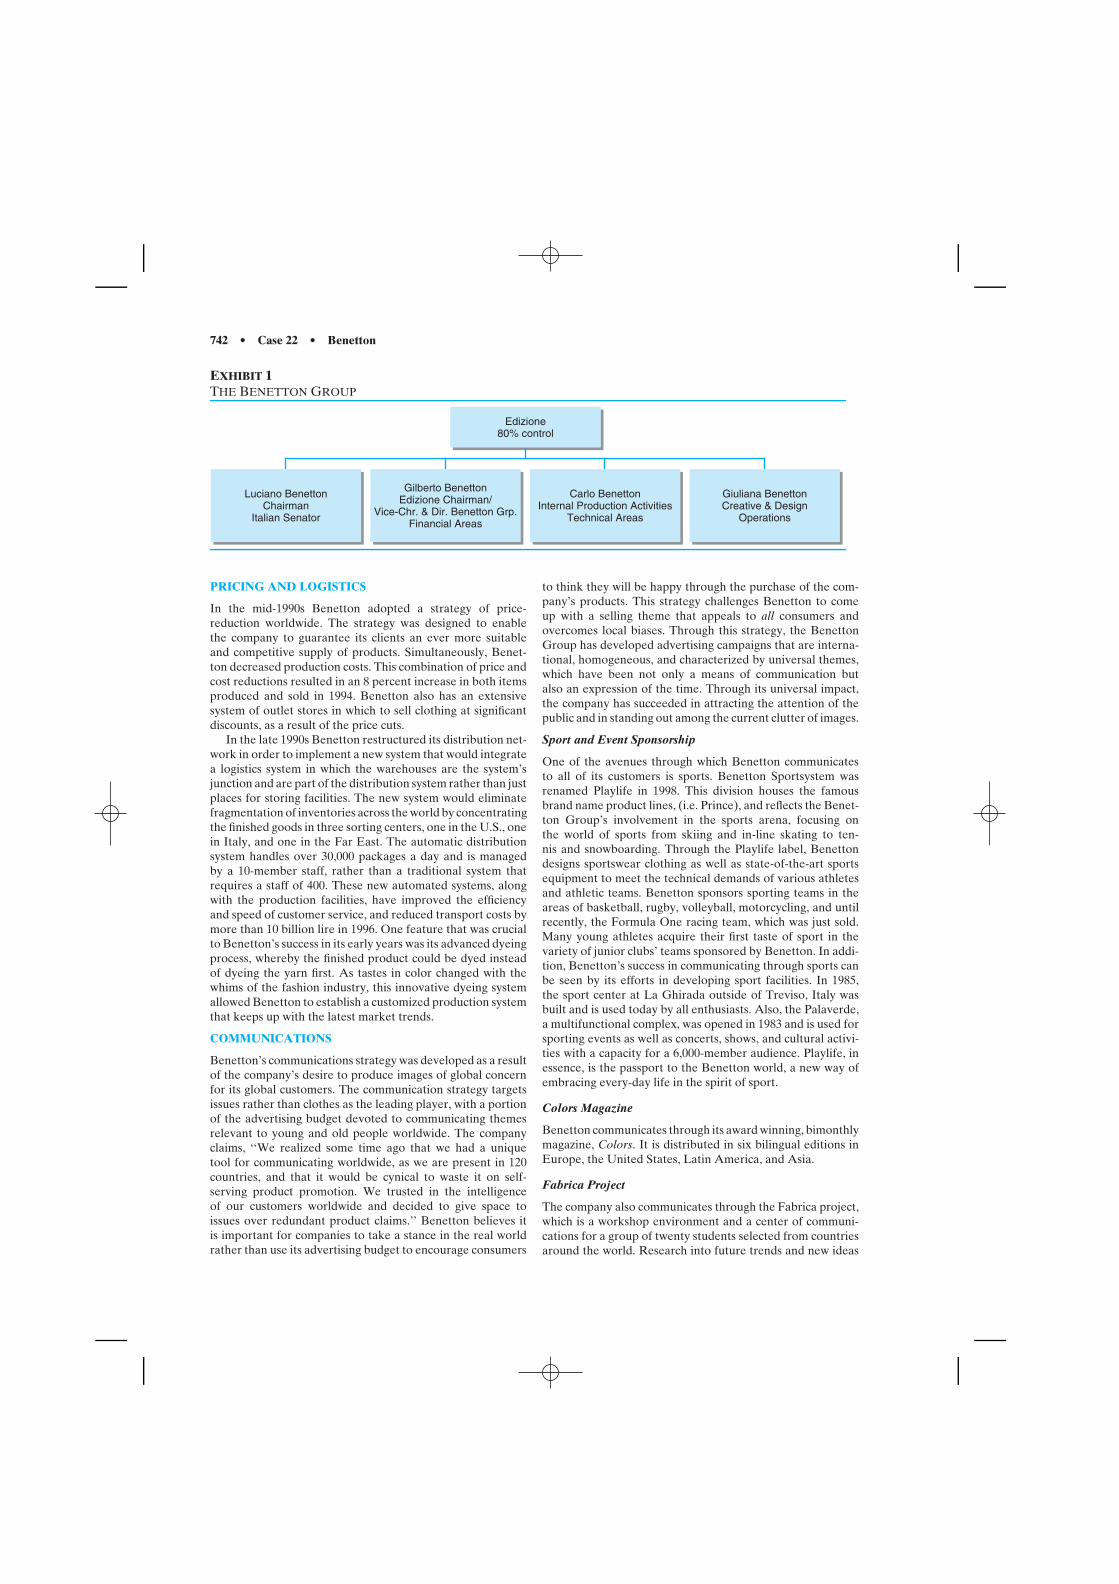
742 • Case 22 • Benetton
EXHIBIT 1THE BENETTON GROUP
Luciano BenettonChairman
Italian Senator
Gilberto BenettonEdizione Chairman/
Vice-Chr. & Dir. Benetton Grp.Financial Areas
Carlo BenettonInternal Production Activities
Technical Areas
Giuliana BenettonCreative & Design
Operations
Edizione80% control
PRICING AND LOGISTICS
In the mid-1990s Benetton adopted a strategy of price-reduction worldwide. The strategy was designed to enablethe company to guarantee its clients an ever more suitableand competitive supply of products. Simultaneously, Benet-ton decreased production costs. This combination of price andcost reductions resulted in an 8 percent increase in both itemsproduced and sold in 1994. Benetton also has an extensivesystem of outlet stores in which to sell clothing at significantdiscounts, as a result of the price cuts.
In the late 1990s Benetton restructured its distribution net-work in order to implement a new system that would integratea logistics system in which the warehouses are the system’sjunction and are part of the distribution system rather than justplaces for storing facilities. The new system would eliminatefragmentation of inventories across the world by concentratingthe finished goods in three sorting centers, one in the U.S., onein Italy, and one in the Far East. The automatic distributionsystem handles over 30,000 packages a day and is managedby a 10-member staff, rather than a traditional system thatrequires a staff of 400. These new automated systems, alongwith the production facilities, have improved the efficiencyand speed of customer service, and reduced transport costs bymore than 10 billion lire in 1996. One feature that was crucialto Benetton’s success in its early years was its advanced dyeingprocess, whereby the finished product could be dyed insteadof dyeing the yarn first. As tastes in color changed with thewhims of the fashion industry, this innovative dyeing systemallowed Benetton to establish a customized production systemthat keeps up with the latest market trends.
COMMUNICATIONS
Benetton’s communications strategy was developed as a resultof the company’s desire to produce images of global concernfor its global customers. The communication strategy targetsissues rather than clothes as the leading player, with a portionof the advertising budget devoted to communicating themesrelevant to young and old people worldwide. The companyclaims, ‘‘We realized some time ago that we had a uniquetool for communicating worldwide, as we are present in 120countries, and that it would be cynical to waste it on self-serving product promotion. We trusted in the intelligenceof our customers worldwide and decided to give space toissues over redundant product claims.’’ Benetton believes itis important for companies to take a stance in the real worldrather than use its advertising budget to encourage consumers
to think they will be happy through the purchase of the com-pany’s products. This strategy challenges Benetton to comeup with a selling theme that appeals to all consumers andovercomes local biases. Through this strategy, the BenettonGroup has developed advertising campaigns that are interna-tional, homogeneous, and characterized by universal themes,which have been not only a means of communication butalso an expression of the time. Through its universal impact,the company has succeeded in attracting the attention of thepublic and in standing out among the current clutter of images.
Sport and Event Sponsorship
One of the avenues through which Benetton communicatesto all of its customers is sports. Benetton Sportsystem wasrenamed Playlife in 1998. This division houses the famousbrand name product lines, (i.e. Prince), and reflects the Benet-ton Group’s involvement in the sports arena, focusing onthe world of sports from skiing and in-line skating to ten-nis and snowboarding. Through the Playlife label, Benettondesigns sportswear clothing as well as state-of-the-art sportsequipment to meet the technical demands of various athletesand athletic teams. Benetton sponsors sporting teams in theareas of basketball, rugby, volleyball, motorcycling, and untilrecently, the Formula One racing team, which was just sold.Many young athletes acquire their first taste of sport in thevariety of junior clubs’ teams sponsored by Benetton. In addi-tion, Benetton’s success in communicating through sports canbe seen by its efforts in developing sport facilities. In 1985,the sport center at La Ghirada outside of Treviso, Italy wasbuilt and is used today by all enthusiasts. Also, the Palaverde,a multifunctional complex, was opened in 1983 and is used forsporting events as well as concerts, shows, and cultural activi-ties with a capacity for a 6,000-member audience. Playlife, inessence, is the passport to the Benetton world, a new way ofembracing every-day life in the spirit of sport.
Colors Magazine
Benetton communicates through its award winning, bimonthlymagazine, Colors. It is distributed in six bilingual editions inEurope, the United States, Latin America, and Asia.
Fabrica Project
The company also communicates through the Fabrica project,which is a workshop environment and a center of communi-cations for a group of twenty students selected from countriesaround the world. Research into future trends and new ideas
Case 22 • Benetton • 743
is conducted among the students, who actively research thefield of communications.
Image Advertising
Unlike the traditional advertising for most companies, Benet-ton’s images do not have a copy or a product, only thecompany’s logo. The ads do not tell an individual to buy Benet-ton clothing or even imply this! Their ads simply attempt topromote a discussion and create awareness about global issuesthat might be overlooked if conveyed through other channels.However, as far as their products are concerned, the companyadvertises through its many strategically placed stores, its cat-alogues, and fashion editorials that display them directly tothe consumer. Also, there are public relations offices in all ofthe countries that have a liaison with fashion editors. Theseoffices utilize traditional marketing techniques to ensure theproducts receive the necessary exposure or sales personnel,among other criteria.
What is image advertising? Image advertising has evolvedinto a form of lifestyle marketing. The fashion industry targetsits image-oriented advertising into a brand that can matchevery type of lifestyle, such as Calvin Klein is hip, RalphLauren is rich, and Benetton is highly controversial. Adver-tising industry experts claim that image advertising is part ofa master plan to get customers to ‘‘buy-in’’ to a lifestyle, firstconnecting through a psychological/aspirational level and thenon a product level. Similarly, this has been achieved throughadvertising in the automobile industry.
Within the realm of image advertising falls the concept ofemotional branding. Emotional branding, sometimes referredto as shockvertising, is a form of image advertising intended tosell images rather than the products themselves, by appealingto a customer’s emotions. This targets other dimensions forattracting consumers, not through the functional aspects ofproducts, but through the emotional aspects, which is whatbranding is all about.
Campaigns
Benetton’s advertising campaigns have centered on socialissues and current worldwide issues such as AIDS, peace,war, and death. Many of their communications initiatives sup-port international humanitarian associations. For example,Benetton was part of the first global project to redistributeclothing to people in need in 1993; it was called the ‘‘clothingredistribution project’’ and was assisted by the InternationalFederation of the Red Cross, as well as other groups. Thiscampaign also utilized the shock value of imaging, as LucianoBenetton appeared nude in these advertisements. As part oftheir AIDS campaign, the 1994 ads showing the words ‘‘HIVPositive’’ tattooed on a person’s arm, abdomen, and backsideare additional examples of the shockvertising conducted byBenetton (see Exhibit 2).
Those ads were used as metaphors for the more exten-sive branding practiced throughout society toward those whoare different. With those images, Benetton wished to high-light not only the main channels through which HIV canbe transmitted, but also the dangers of stigmatizing certainsocial groups and their lifestyles. In 1998, a human rightscampaign was initiated as a result of a United Nations pro-posal to launch a world communications exercise to mark
the fiftieth anniversary of the Declaration of Human Rights,which was approved by the United Nations General Assemblyon December 10, 1948.
EXHIBIT 2HIV POSITIVE
One of the ads for this campaign showed images of chil-dren of all colors and ages to emphasize that ‘‘every child shallbe entitled from his birth to a name and a nationality’’ (seeExhibit 3). In addition, Benetton’s recent campaign during2000 addresses capital punishment by showing images of someof America’s death row inmates. This campaign aims to showthe public the reality of capital punishment, so that no onearound the world will consider the death penalty as just adistant problem or as news that occasionally appears in themedia.
EXHIBIT 3UNITED NATIONS
The campaigns have won numerous awards, prizes, andacclaim in all of the countries in which the company is present;however, they also have aroused various strong reactions.Benetton is aware of the controversy that surrounds the imagesof these campaigns. However, they believe that all worthwhilestances will have critics and supporters. Benetton hopes thatpeople will move away from the discussion of whether or nota company is entitled to show its point of view in its advertis-ing campaigns, to a discussion of the issues themselves. Thishas occurred in some countries already, which supports thecompany’s goal of becoming the vehicle for discussion ratherthan its focus.
744 • Case 22 • Benetton
MARKET SHARE
Americas
During the 1980s Benetton expanded aggressively into theUnited States, opening some 500 stores and outlets. Thisrapid expansion caused numerous management catastrophesresulting in unhappy retailers and declining revenues. Specifi-cally, Benetton encouraged retailers to open stores that werelocated too close to one another which subsequently led toself-cannibalization. Additionally, advertisements such as theone showing the U.S. President with AIDS lesions causedmany loyal American customers to boycott Benetton stores.In addition to operational blunders, Benetton was also guiltyof making fashion errors as well. In the mid 1980s, their largestselling items in Europe were their brightly colored sweaters.When the sweaters were introduced into the United Statesas the company’s signature product, it was a disaster. Subse-quently, Benetton had to readjust their shipments and designsto fit North American tastes. A combination of this issuealong with overexpansion led many retailers in the late 1980sto take legal action against Benetton, charging that they hadencouraged too many stores to be built too close together andfailed to supply them adequately.
By the early 1990s sales in the United States had decreasedsharply. Benetton was producing clothing targeted to ayounger generation of 18- to 23-year-olds in the U.S.; how-ever, they were not accustomed to paying the higher pricescharged by Benetton. This was a generation that was broughtup on GAP pricing strategies, which were lower and moreaffordable than Benetton, and therefore, found Benetton’sprices too high for their budget, while others were unawarethat Benetton also sold designer dresses and suits.
After having 350 of its 500 stores closed by 1995, Benettongrew increasingly aware that they were targeting the wrongmarket in the U.S. To combat the negative sales growth,Benetton began offering a more diverse clothing line andinstalled a point-of-sale system, which allowed the stores tofeed information on sales back to the Italian headquarters. Inaddition, in 1998 Benetton began offering its first intraseasonalcollections to increase its ability to respond more quickly tochanging market trends. By 1999, the point-of-sale system hadproven to be such a success that they had begun to test anupgraded system that would report not only the item sold butalso its size and color.
In 1997, Benetton made a strategic move by acquiring 57percent of the Sportsystem division from Edizione, and laterpurchased the remaining shares in 1998. This acquisition pro-duced a large boost for U.S. sales due to its large marketfor sporting goods equipment. To support this latest acqui-sition, they launched a $27 million marketing campaign (seeExhibit 4 for sales figures).
An attempt to gain a larger share of the U.S. marketwas made in 1998 when Benetton signed a deal to form ajoint venture with Sears Roebuck and Company to design aline of less expensive clothing that would be sold in Sears’department stores. The joint venture was part of a largerstrategy to expand in the United States without having toopen new Benetton stores. Sears and Benetton introducedlast summer a new line of junior’s, children’s, and men’sapparel, called Benetton USA, in 450 Sears stores; the linewas expected to generate $100 million in sales in its first year
and draw in younger, more cost-conscious customers. The dealfell through however, when Sears pulled the clothes off theshelves due to consumer complaints and boycotts regardingBenetton’s anti–death penalty campaign in February 2000.Overall, Benetton’s strategy in the United States has not beenvery successful. Sales in North America fell by 17 percentby the end of the third quarter of 2002 as compared to thatin 2000.
EXHIBIT 4SALES BY BRAND, 2001
2001
United Colors of BenettonSisleyRollerbladePrinceNordicaKiller LoopPlaylifeOther(intimate, sleepwear, swimwear, etc.)
In addition to North America, Benetton also began toestablish a presence in South America and the Dutch Antilles(Saint Maarten) during the mid-1980s. This move was a strate-gic success, for a number of reasons. Much of South Americastill held strong bonds with Europe, such as consumers’ tastesin fashion. Countries such as Brazil, Argentina, and Colombiaembraced the Italian label and therefore, Benetton had founda market full of loyal customers. However, Latin America washit severely by an economic recession during the late 1990s,which reflected negatively on both clothing as well as sportinggoods sales in most of South America.
Europe
During the 1980s Benetton flourished throughout Europe.Sales had increased at a double-digit growth rate and duringsome years even reached 25 percent. However, much of thatchanged during the 1990s when sales growth began to decreasedown into the single digits. The decline in sales, specificallyin 1995, can be attributed to a number of factors, includingthe European recession, which caused sales growth to declinesharply in certain markets (see Exhibit 5).
Germany, the market, that suffered the most during themid-1990s, was also Benetton’s largest market. In 1994, Benet-ton released two of its most controversial campaigns, the‘‘Croatian Soldier’’ and ‘‘HIV Positive.’’ Both campaigns fol-lowed Benetton’s mission to support social causes and increaseawareness on global issues but both also managed to provokestrong ill-will feelings toward the company, whose reputa-tion was already faltering due to the recent store closingsin Germany. By late 1994, retailers in Germany began tonotice a decline in sales and profits. Claiming the decrease inoperating profit was due to self-cannibalization, extreme price
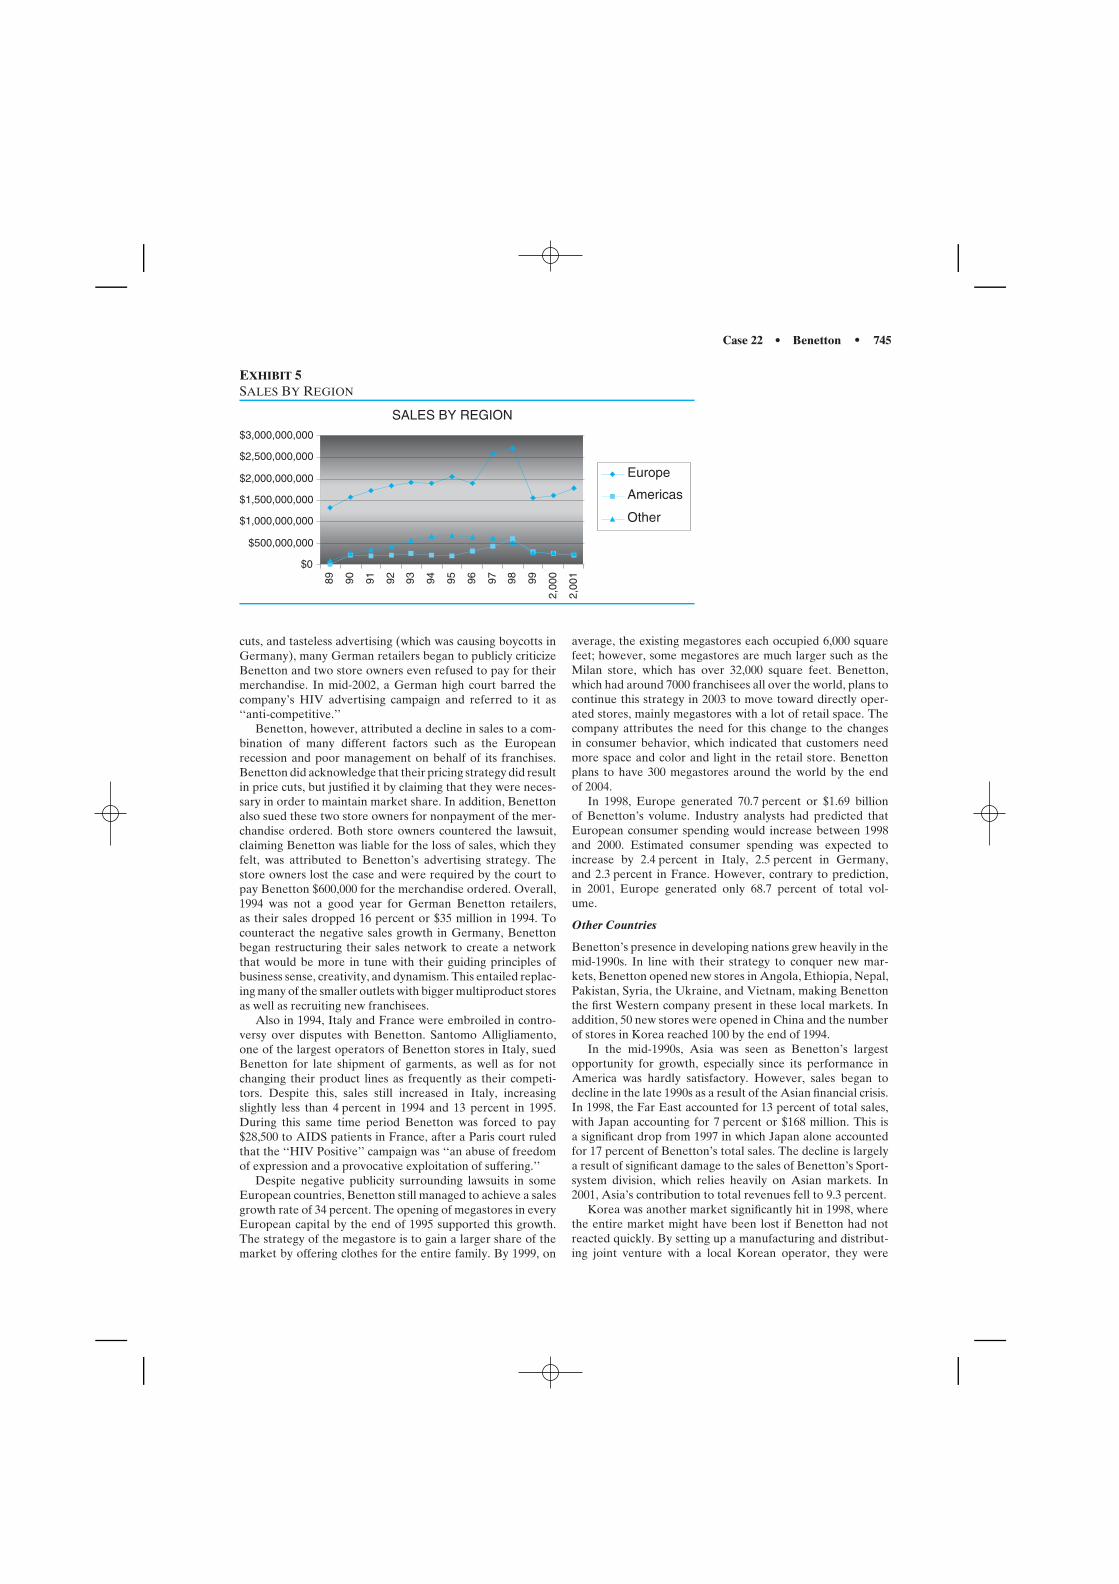
Case 22 • Benetton • 745
EXHIBIT 5SALES BY REGION
SALES BY REGION
$0
$500,000,000
$1,000,000,000
$1,500,000,000
$2,000,000,000
$2,500,000,000
$3,000,000,000
89 90 91 92 93 94 95 96 97 98 99
2,00
0
2,00
1
Europe
Americas
Other
cuts, and tasteless advertising (which was causing boycotts inGermany), many German retailers began to publicly criticizeBenetton and two store owners even refused to pay for theirmerchandise. In mid-2002, a German high court barred thecompany’s HIV advertising campaign and referred to it as‘‘anti-competitive.’’
Benetton, however, attributed a decline in sales to a com-bination of many different factors such as the Europeanrecession and poor management on behalf of its franchises.Benetton did acknowledge that their pricing strategy did resultin price cuts, but justified it by claiming that they were neces-sary in order to maintain market share. In addition, Benettonalso sued these two store owners for nonpayment of the mer-chandise ordered. Both store owners countered the lawsuit,claiming Benetton was liable for the loss of sales, which theyfelt, was attributed to Benetton’s advertising strategy. Thestore owners lost the case and were required by the court topay Benetton $600,000 for the merchandise ordered. Overall,1994 was not a good year for German Benetton retailers,as their sales dropped 16 percent or $35 million in 1994. Tocounteract the negative sales growth in Germany, Benettonbegan restructuring their sales network to create a networkthat would be more in tune with their guiding principles ofbusiness sense, creativity, and dynamism. This entailed replac-ing many of the smaller outlets with bigger multiproduct storesas well as recruiting new franchisees.
Also in 1994, Italy and France were embroiled in contro-versy over disputes with Benetton. Santomo Alligliamento,one of the largest operators of Benetton stores in Italy, suedBenetton for late shipment of garments, as well as for notchanging their product lines as frequently as their competi-tors. Despite this, sales still increased in Italy, increasingslightly less than 4 percent in 1994 and 13 percent in 1995.During this same time period Benetton was forced to pay$28,500 to AIDS patients in France, after a Paris court ruledthat the ‘‘HIV Positive’’ campaign was ‘‘an abuse of freedomof expression and a provocative exploitation of suffering.’’
Despite negative publicity surrounding lawsuits in someEuropean countries, Benetton still managed to achieve a salesgrowth rate of 34 percent. The opening of megastores in everyEuropean capital by the end of 1995 supported this growth.The strategy of the megastore is to gain a larger share of themarket by offering clothes for the entire family. By 1999, on
average, the existing megastores each occupied 6,000 squarefeet; however, some megastores are much larger such as theMilan store, which has over 32,000 square feet. Benetton,which had around 7000 franchisees all over the world, plans tocontinue this strategy in 2003 to move toward directly oper-ated stores, mainly megastores with a lot of retail space. Thecompany attributes the need for this change to the changesin consumer behavior, which indicated that customers needmore space and color and light in the retail store. Benettonplans to have 300 megastores around the world by the endof 2004.
In 1998, Europe generated 70.7 percent or $1.69 billionof Benetton’s volume. Industry analysts had predicted thatEuropean consumer spending would increase between 1998and 2000. Estimated consumer spending was expected toincrease by 2.4 percent in Italy, 2.5 percent in Germany,and 2.3 percent in France. However, contrary to prediction,in 2001, Europe generated only 68.7 percent of total vol-ume.
Other Countries
Benetton’s presence in developing nations grew heavily in themid-1990s. In line with their strategy to conquer new mar-kets, Benetton opened new stores in Angola, Ethiopia, Nepal,Pakistan, Syria, the Ukraine, and Vietnam, making Benettonthe first Western company present in these local markets. Inaddition, 50 new stores were opened in China and the numberof stores in Korea reached 100 by the end of 1994.
In the mid-1990s, Asia was seen as Benetton’s largestopportunity for growth, especially since its performance inAmerica was hardly satisfactory. However, sales began todecline in the late 1990s as a result of the Asian financial crisis.In 1998, the Far East accounted for 13 percent of total sales,with Japan accounting for 7 percent or $168 million. This isa significant drop from 1997 in which Japan alone accountedfor 17 percent of Benetton’s total sales. The decline is largelya result of significant damage to the sales of Benetton’s Sport-system division, which relies heavily on Asian markets. In2001, Asia’s contribution to total revenues fell to 9.3 percent.
Korea was another market significantly hit in 1998, wherethe entire market might have been lost if Benetton had notreacted quickly. By setting up a manufacturing and distribut-ing joint venture with a local Korean operator, they were
746 • Case 22 • Benetton
able to circumvent a complete loss of their Korean market.However, the decrease in Asian clothing sales had little impacton the company’s overall clothing sales, mainly attributableto the fact that Asia accounted for only 15 to 17 percent ofBenetton’s global clothing sales. Profits would have risen 33percent rather than the actual 18 percent if Sportsystem hadnot suffered such a loss from the Asian financial crisis.
However, in spite of the financial crisis that occurred in thelate 1990s, Benetton announced in 1998 its plans to open threenew megastores in Japan beginning in the spring of 2000. Thestrategy was based on a dip in property prices, which wouldallow Benetton to buy property in Japan relatively cheaperthan in the past.
OPPORTUNITIES
Communication Sources
Europe’s Internet commerce industry is starting to pick up,following the lead by the United States, where over 70 per-cent of the world’s e-commerce business took place over thepast year, according to market research company InternationalData Corporation. The research firm Jupiter Communicationsreported online retail sales in Europe would reach $3.3 billionin 2002, up from $165 million in 1998. In December 1999,when Benetton announced it would begin selling products onthe Internet, its share surged nearly 13 percent, resulting inits largest one-day rise in more than one year. Online saleswill allow the company to access markets where it has lowpenetration and where e-commerce is more developed, suchas in the U.S.
In India, Benetton’s advertising is concentrated on arenewed focus of communication. Benetton’s image in Indiawas considered a discounted brand, since they usually limitedtheir advertising to only two end-of-season sales. However,recent television commercials were received positively by bothfranchisees and consumers. This kind of positive feedbackcould result in a new opportunity for Benetton by focusingmore on media channels such as television and radio, ratherthan billboards or magazines.
In addition, Benetton had great success with their two-tiered approach, specifically with the launch of their Sportsys-tem division. This approach was taken in order to gain a largershare of the U.S. market without having to abandon theirtraditional image campaigns. By allowing their U.S. retailersmore flexibility when choosing which advertisements to usefor a selected campaign, they were able to circumvent anypotential loss of market share and also retailer dissatisfac-tion. Benetton could use this strategy when developing futurecampaigns.
Japan
To increase sales in the future, the U.S. and Japan should leadthe way as an opportunity for increasing Benetton’s total rev-enues, even though the company expects Italy and Germanyto remain its top two markets. Japan is currently recoveringfrom a financial crisis, which should lead to increased oppor-tunities for future growth in Benetton’s sales and profits. TheAsian financial crisis dramatically affected sales of Benetton’ssporting goods line in Japan, causing a 10 percent drop in salesin 1998, and 17 percent in 1997. This required Benetton toacquire more sportswear revenues in the U.S., which produced
only 16 percent, or $384 million, of Benetton sales in 1998 and15.6 percent in 2001.
The total Japanese market for apparel was estimated atapproximately $35 billion as of 1999. The apparel market inJapan was growing at 10 to 15 percent annually until 1996,despite a slow economy and a stagnant domestic apparelmarket since the early 1990s. In particular, Japan’s apparelimports enjoyed a remarkable increase of a 15 to 20 per-cent annual growth until 1996. Japan’s gross domestic product(GDP) registered a real growth rate of 0.9 percent in 1997.This was the first time in three years for the figure to fall belowone percent and was the lowest level among major devel-oped nations. According to 1997 statistics compiled by theMinistry of Finance, the major countries from which apparelis imported and their respective percentages of the importmarket are: China, 69.4 percent; Italy, 8.2 percent; Vietnam,3.6 percent; Indonesia, 2.5 percent; and the United States,2.4 percent. The high market share from China and Viet-nam is due to Japanese manufacturers’ increasing use of theirjoint-venture sewing mills in these countries, where lower-costlabor is available. Imports from Italy were stable over timedue to the deeply implanted good brand image of Italianfashion among Japanese consumers. Italian apparel compa-nies are currently trying to regain their 1980’s position in theJapanese market through the creation of classic-casual typesof women’s wear at reasonable prices. Benetton, looking tocapitalize on its Japanese customers, has targeted this marketas an opportunity for future growth based on economic andcultural aspects such as their loyalty to Italian brands andthe country’s growing economic status. Since Japan is a highcontext country, Benetton should see this as an opportunityto extend on their already strong relationship as Japan movesinto a period of economic growth.
France
There appear to be numerous opportunities for companies tosuccessfully penetrate the French market to gain market share.The size of the apparel market in France has been growingover the last three years, as well as increasing amounts of thetotal exports and imports. Benetton could capitalize on thisgrowing demand for apparel among the French population.
APPAREL MARKET IN FRANCE(MILLIONS U.S. DOLLARS)
1997 1998 1999
Total market size 37,739 37,850 38,228Total local production 15,130 14,800 14,948Total exports 22,260 22,295 22,740Total imports 29,043 30,164 31,068Total imports from U.S. 1,452 1,206 1,218Exchange rate: USD 1.00 FF 5.75 FF 6.00 FF 6.10
Belgium
Consumer spending in Belgium is picking up after over fiveyears of flat, and even depressed, consumer demand levels.Consumption grew 3.6 percent in 1998, due to increases in realincome per household and consumer confidence. Economicforecasts are pointing to steady growth of about 3 percent for
Case 23 • Two Dogs Bites into the World Market: Focus on Japan • 747
APPAREL MARKET IN BELGIUM(MILLIONS U.S. DOLLARS)
1997 1998 1999
Total market size 2,890 2,952 3,098Total local production 1,824 1,863 1,956Total exports 986 1,008 2,200Total imports 2,052 2,097 1,058Total imports from U.S. 81 82 85Exchange rate: $ = BEF 35.7 36.3 37
1999 and 2000. There is a continued strong market interestfor American sporting and leisure apparel, as American stylesare popular and designer and branded products are less pricesensitive in Belgium. Major competitors of the local Belgianmarkets come from manufacturers and designers in France,Germany, and Italy. For low-budget clothing and mass dis-tribution items, low-cost producers in the Far East, such asChina, Thailand, and Indonesia continue to provide the bulkof imports. Benetton has the opportunity to gain market sharein this country by promoting their sportswear and leisureapparel that appeal to this market’s consumers. As you cansee by the following table, Belgium’s market size is growing,as is its local production figures. Although, the total importsdeclined in 1999, Benetton still has the capacity to formalize ajoint venture with local retailers and set up their distributionsystem to begin reaping profits.
DISCUSSION QUESTIONS
1. How has Benetton’s uniform communications strategytranslated into sales and profit in different parts of theworld?
2. Does its pricing strategy reflect positively on Benetton’snet profit?
3. Should Benetton restructure its distribution and man-ufacturing network in order to hedge foreign currencyfluctuations?
4. Should Benetton continue to focus on increasing marketshare in the U.S. by focusing on department store growth, orincreasing store expansion? In addition, should it be focus-ing more on ‘‘crisis management’’ rather than expansion inthe aftermath of the death penalty campaign?
5. Should Benetton restructure the communications strategyto incorporate both the two-tiered approach and a morecountry-tailored positioning strategy?
6. Benetton’s advertising budget is only 4 percent of theirsales. This is a rather low number, especially consider-ing that most of this budget has been spent on developingtheir image advertisements. Should Benetton increase theiradvertising budget, and if so, should more go to traditionalclothing and sports equipment advertisements?
� � � � � � � � � � � � � � � � � � � � � � � � � � � � � � �
CASE 23
TWO DOGS BITES INTO THE WORLD MARKET: FOCUS ON JAPAN
CREATION OF ‘‘TWO DOGS’’
On a cool winter day in Adelaide, South Australia, a city with apopulation of 1.1 million, Duncan MacGillivray found himselfin a conversation with his neighbor who had too many lemonsfor which he was trying to find a use. MacGillivray, who owneda pub in the city, decided to brew the lemons into an alcoholicdrink to serve as a refreshing alternative to draught beer. Thuswas born the world’s first commercial brewed alcoholic lemondrink. The brew, which became known as TWO DOGSafter a joke, became a highly popular drink and was soonmade available on tap (draught) in pubs all around Adelaide,as shown in Exhibit 1.
The popularity of the drink quickly spread by word ofmouth. In response to the dramatic increase in sales, thecompany commenced bottling the drinks in 1994 to increaseits product availability in the distribution channel. To meetthe demand, TWO DOGS was produced under contractby a local brewery in Adelaide. This enabled the com-pany to focus its resources on marketing and brand-building
This case was prepared by Professor Amal Karunaratna of the Universityof Adelaide, Australia for class discussion rather than to illustrate eithereffective or ineffective management of a situation described (2003).
activities, instead of investing in a costly commercial brewingand bottling facility.
TWO DOGS quickly gained market acceptance, firstlybecause consumers loved the new taste sensation of ‘‘brewedalcoholic lemonade,’’ but also because it filled a real marketniche for a ready-made beverage similar to beer but with aneasy flavor profile. TWO DOGS exceeded initial expecta-tions when it reached domestic sales of over 400,000 casesin the first twelve months, and extended its presence to thewhole of Australia within one year of launch.
The success of TWO DOGS attracted competitors, whosought to emulate TWO DOGS and capitalize on the newlycreated and rapidly growing consumer niche. The first com-petitor came in late 1994 from Australia’s largest brewer(Fosters); the product ‘‘Sub Zero’’ was a sweetened alcoholicsoda targeted at young adults. By 1995, there were dozens ofdifferent sweet alcoholic drinks, all brightly colored, exoticallyflavored with catchy names including ‘‘Z’’, ‘‘KGB’’, ‘‘Cactus’’,‘‘Ruski’’, ‘‘DNA’’, shown below in Exhibit 2.
INTERNATIONAL EXPANSION
In the face of fierce domestic competition, the company TwoDogs International (‘‘TDI’’) commenced an international
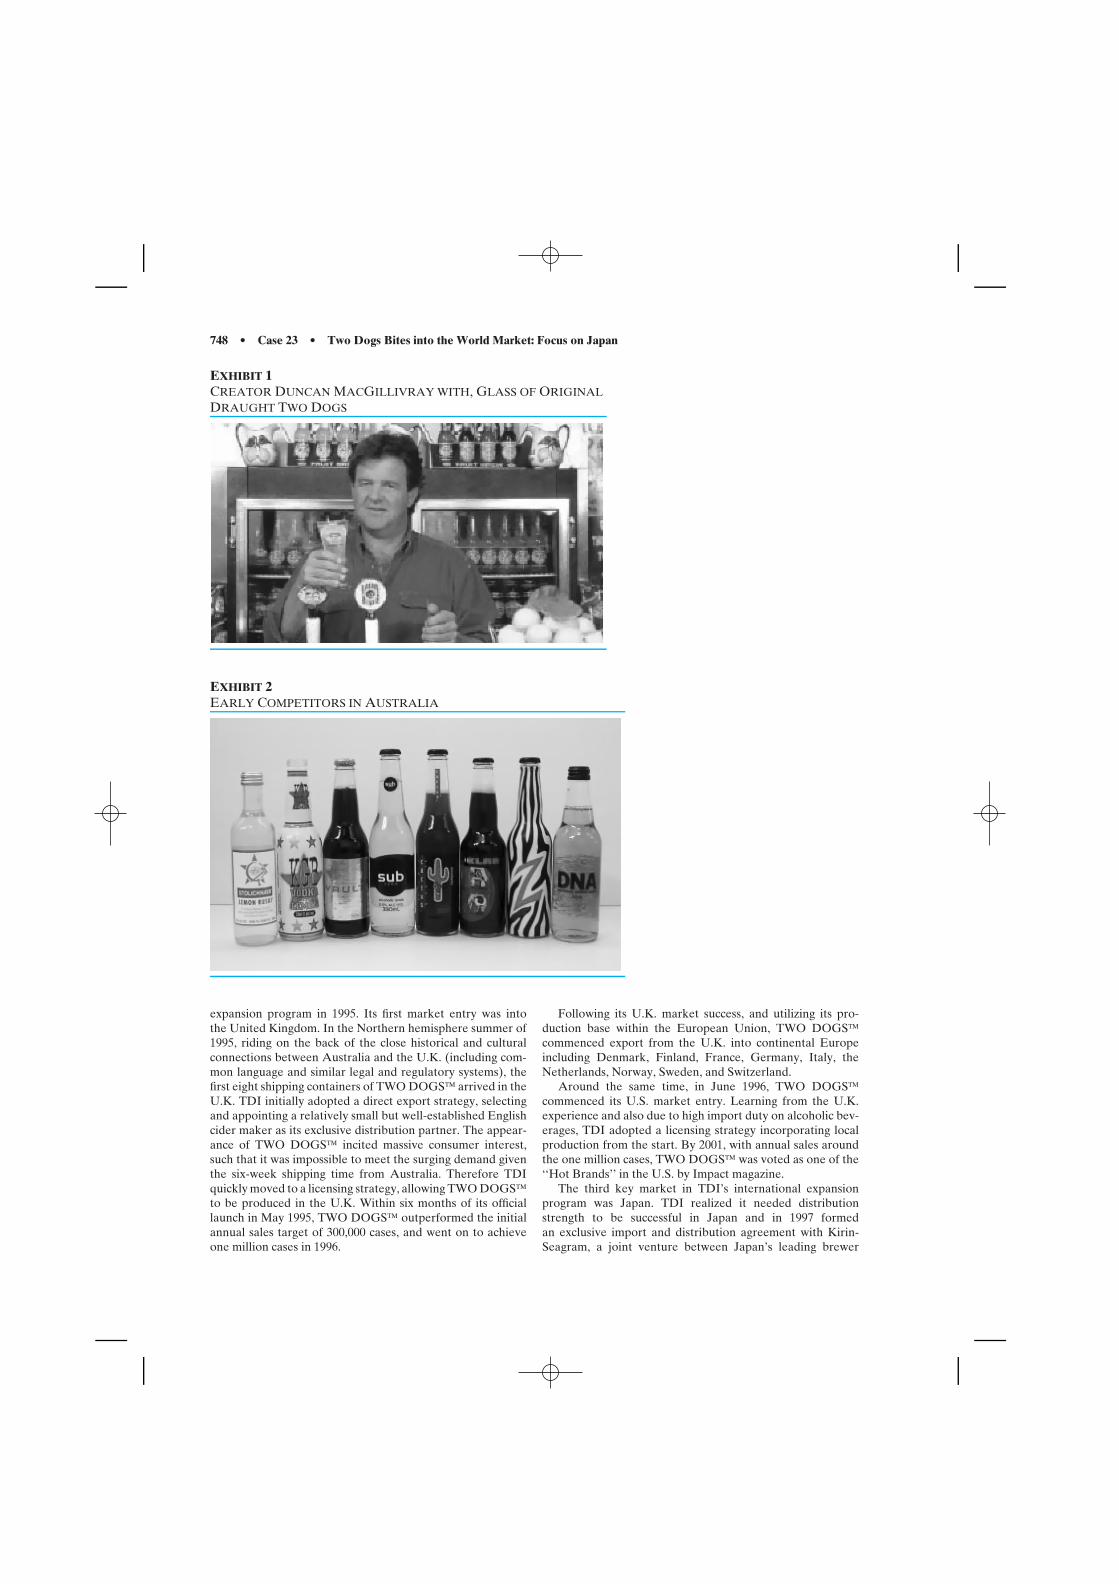
748 • Case 23 • Two Dogs Bites into the World Market: Focus on Japan
EXHIBIT 1CREATOR DUNCAN MACGILLIVRAY WITH, GLASS OF ORIGINALDRAUGHT TWO DOGS
EXHIBIT 2EARLY COMPETITORS IN AUSTRALIA
expansion program in 1995. Its first market entry was intothe United Kingdom. In the Northern hemisphere summer of1995, riding on the back of the close historical and culturalconnections between Australia and the U.K. (including com-mon language and similar legal and regulatory systems), thefirst eight shipping containers of TWO DOGS arrived in theU.K. TDI initially adopted a direct export strategy, selectingand appointing a relatively small but well-established Englishcider maker as its exclusive distribution partner. The appear-ance of TWO DOGS incited massive consumer interest,such that it was impossible to meet the surging demand giventhe six-week shipping time from Australia. Therefore TDIquickly moved to a licensing strategy, allowing TWO DOGSto be produced in the U.K. Within six months of its officiallaunch in May 1995, TWO DOGS outperformed the initialannual sales target of 300,000 cases, and went on to achieveone million cases in 1996.
Following its U.K. market success, and utilizing its pro-duction base within the European Union, TWO DOGScommenced export from the U.K. into continental Europeincluding Denmark, Finland, France, Germany, Italy, theNetherlands, Norway, Sweden, and Switzerland.
Around the same time, in June 1996, TWO DOGScommenced its U.S. market entry. Learning from the U.K.experience and also due to high import duty on alcoholic bev-erages, TDI adopted a licensing strategy incorporating localproduction from the start. By 2001, with annual sales aroundthe one million cases, TWO DOGS was voted as one of the‘‘Hot Brands’’ in the U.S. by Impact magazine.
The third key market in TDI’s international expansionprogram was Japan. TDI realized it needed distributionstrength to be successful in Japan and in 1997 formedan exclusive import and distribution agreement with Kirin-Seagram, a joint venture between Japan’s leading brewer
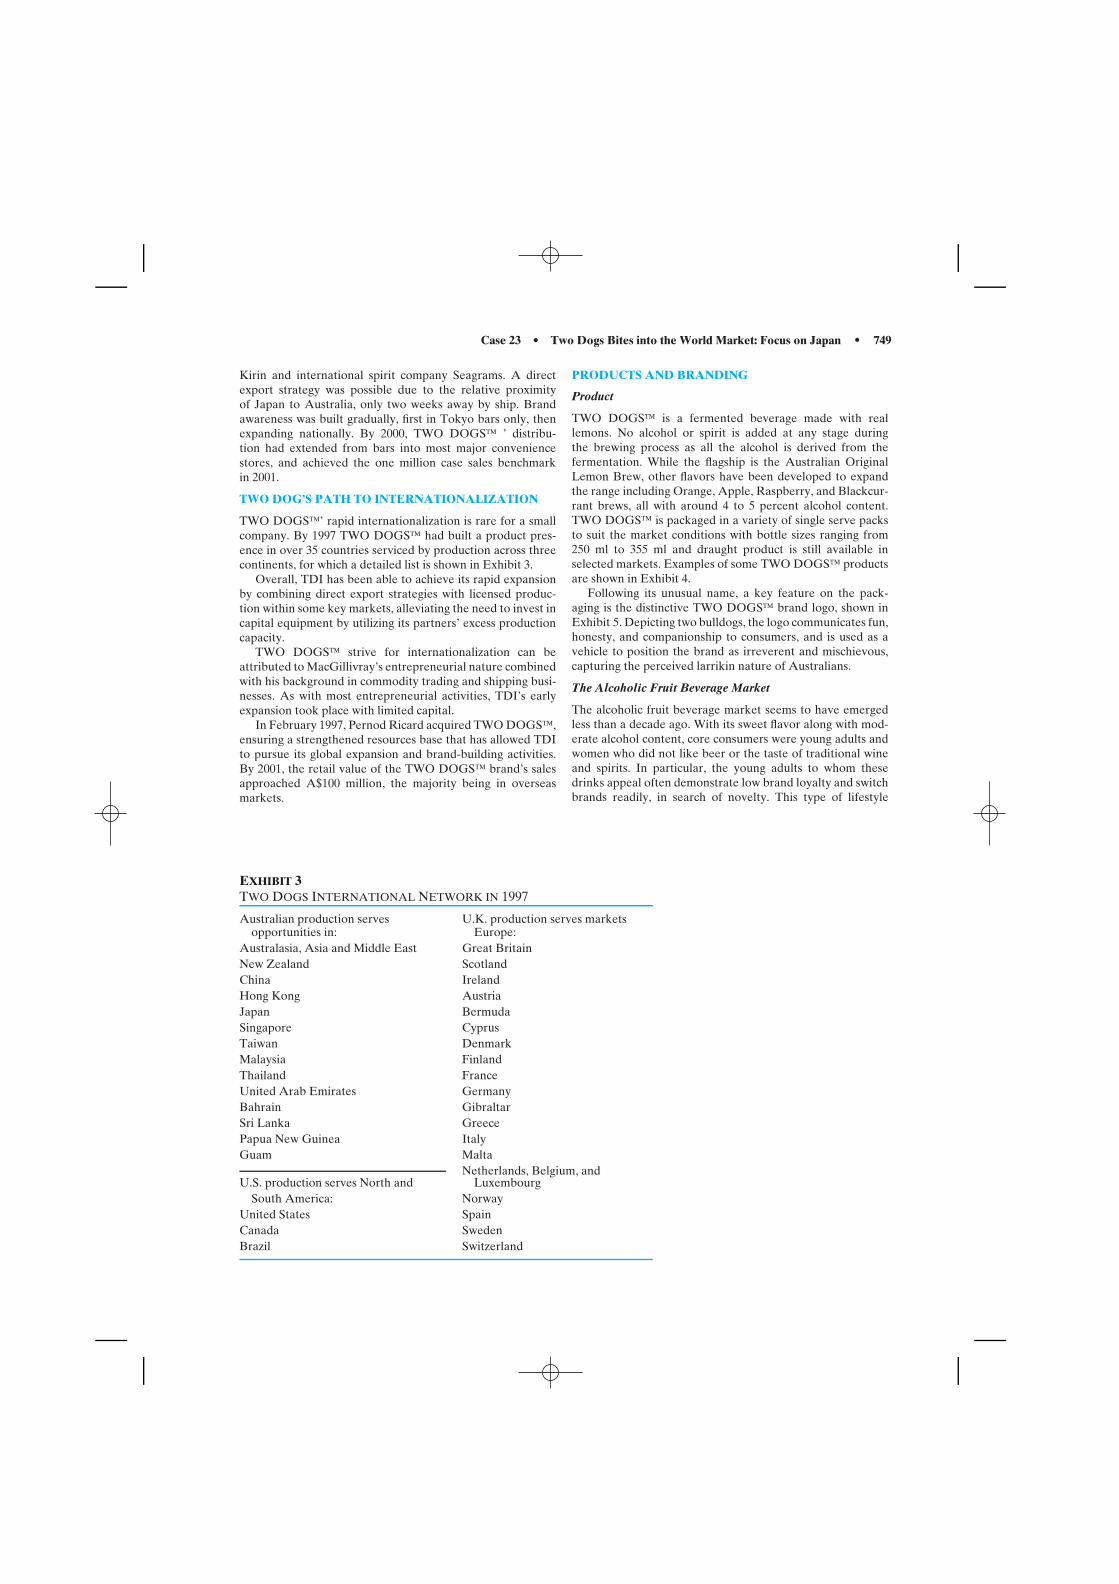
Case 23 • Two Dogs Bites into the World Market: Focus on Japan • 749
Kirin and international spirit company Seagrams. A directexport strategy was possible due to the relative proximityof Japan to Australia, only two weeks away by ship. Brandawareness was built gradually, first in Tokyo bars only, thenexpanding nationally. By 2000, TWO DOGS ’ distribu-tion had extended from bars into most major conveniencestores, and achieved the one million case sales benchmarkin 2001.
TWO DOG’S PATH TO INTERNATIONALIZATION
TWO DOGS’ rapid internationalization is rare for a smallcompany. By 1997 TWO DOGS had built a product pres-ence in over 35 countries serviced by production across threecontinents, for which a detailed list is shown in Exhibit 3.
Overall, TDI has been able to achieve its rapid expansionby combining direct export strategies with licensed produc-tion within some key markets, alleviating the need to invest incapital equipment by utilizing its partners’ excess productioncapacity.
TWO DOGS strive for internationalization can beattributed to MacGillivray’s entrepreneurial nature combinedwith his background in commodity trading and shipping busi-nesses. As with most entrepreneurial activities, TDI’s earlyexpansion took place with limited capital.
In February 1997, Pernod Ricard acquired TWO DOGS,ensuring a strengthened resources base that has allowed TDIto pursue its global expansion and brand-building activities.By 2001, the retail value of the TWO DOGS brand’s salesapproached A$100 million, the majority being in overseasmarkets.
PRODUCTS AND BRANDING
Product
TWO DOGS is a fermented beverage made with reallemons. No alcohol or spirit is added at any stage duringthe brewing process as all the alcohol is derived from thefermentation. While the flagship is the Australian OriginalLemon Brew, other flavors have been developed to expandthe range including Orange, Apple, Raspberry, and Blackcur-rant brews, all with around 4 to 5 percent alcohol content.TWO DOGS is packaged in a variety of single serve packsto suit the market conditions with bottle sizes ranging from250 ml to 355 ml and draught product is still available inselected markets. Examples of some TWO DOGS productsare shown in Exhibit 4.
Following its unusual name, a key feature on the pack-aging is the distinctive TWO DOGS brand logo, shown inExhibit 5. Depicting two bulldogs, the logo communicates fun,honesty, and companionship to consumers, and is used as avehicle to position the brand as irreverent and mischievous,capturing the perceived larrikin nature of Australians.
The Alcoholic Fruit Beverage Market
The alcoholic fruit beverage market seems to have emergedless than a decade ago. With its sweet flavor along with mod-erate alcohol content, core consumers were young adults andwomen who did not like beer or the taste of traditional wineand spirits. In particular, the young adults to whom thesedrinks appeal often demonstrate low brand loyalty and switchbrands readily, in search of novelty. This type of lifestyle
EXHIBIT 3TWO DOGS INTERNATIONAL NETWORK IN 1997
Australian production servesopportunities in:
U.K. production serves marketsEurope:
Australasia, Asia and Middle East Great BritainNew Zealand ScotlandChina IrelandHong Kong AustriaJapan BermudaSingapore CyprusTaiwan DenmarkMalaysia FinlandThailand FranceUnited Arab Emirates GermanyBahrain GibraltarSri Lanka GreecePapua New Guinea ItalyGuam Malta
Netherlands, Belgium, andU.S. production serves North and Luxembourg
South America: NorwayUnited States SpainCanada SwedenBrazil Switzerland
750 • Case 23 • Two Dogs Bites into the World Market: Focus on Japan
EXHIBIT 4EXAMPLES OF TWO DOGS PRODUCT RANGE, IN 330 MLAND 250 ML BOTTLES
product is highly sensitive to trends and aspirations, andtherefore the marketing mix needs to be adapted to suit localmarket conditions. Consumer preference is based on percep-tions; hence, branding is critical to product differentiation.
The intensity of global competition is high. Barriers to entryare low, switching costs are low, and consumer preferencesfluctuate within trends, so there is good reason to believe thatindividual product life cycles within this category are likelyto be short. For example, wine coolers were highly popularin the 1980s but are now relegated to a niche market in theearly 2000s. The threat of substitutes for any single brand orproduct is extremely high.
ENTRY TO THE JAPANESE MARKET
Pre-Entry Research
TDI’s market selection decision in the UK and the USAwas based on perceived cultural similarity to Australia, allbeing modern western English-speaking countries, so appro-priate market positioning was readily understood. Expansioninto Japan, however, was a different proposition in terms ofunknown culture, laws, trends, lifestyle, and beverage choicesand therefore all activities needed to be based on considerableformal market analysis. Prior to market entry in Japan, TDIspent more than eighteen months conducting market research.
Preliminary Market Research
In order to evaluate the initial feasibility of entering theJapanese market and assess the market potential, TWODOGS first conducted a preliminary assessment thatwas based on gathering data on the macro- and micro-environment including general economic outlook, politicalstability, population size, age of the population and wealthdistribution, and industry trends.
EXHIBIT 5THE DISTINCTIVE TWO DOGS BRAND LOGO
People and Culture
Japan has a highly urbanized population of approximately127 million. Over 44 percent of the population lives in majorcities such as Tokyo, Osaka, and Nagoya. Japan is a homoge-neous, affluent society, with an aging population and one ofthe longest life expectancy rates in the world (83.99 years forwomen and 77.1 years for men).
Japanese people respect long-term relationships, polite-ness, and collectivity whereas Australians tend toward indi-vidualism. On the other hand, modern Japanese are greattravellers and the young adult consumers in particular haveembraced western culture and influences such as fast food,fashion, and music entertainment1 and lifestyle aspirations.
TDI used these data to estimate the size of its potentialmarket in Japan. By segmenting its target market predomi-nantly on the basis of consumer age, the target market size
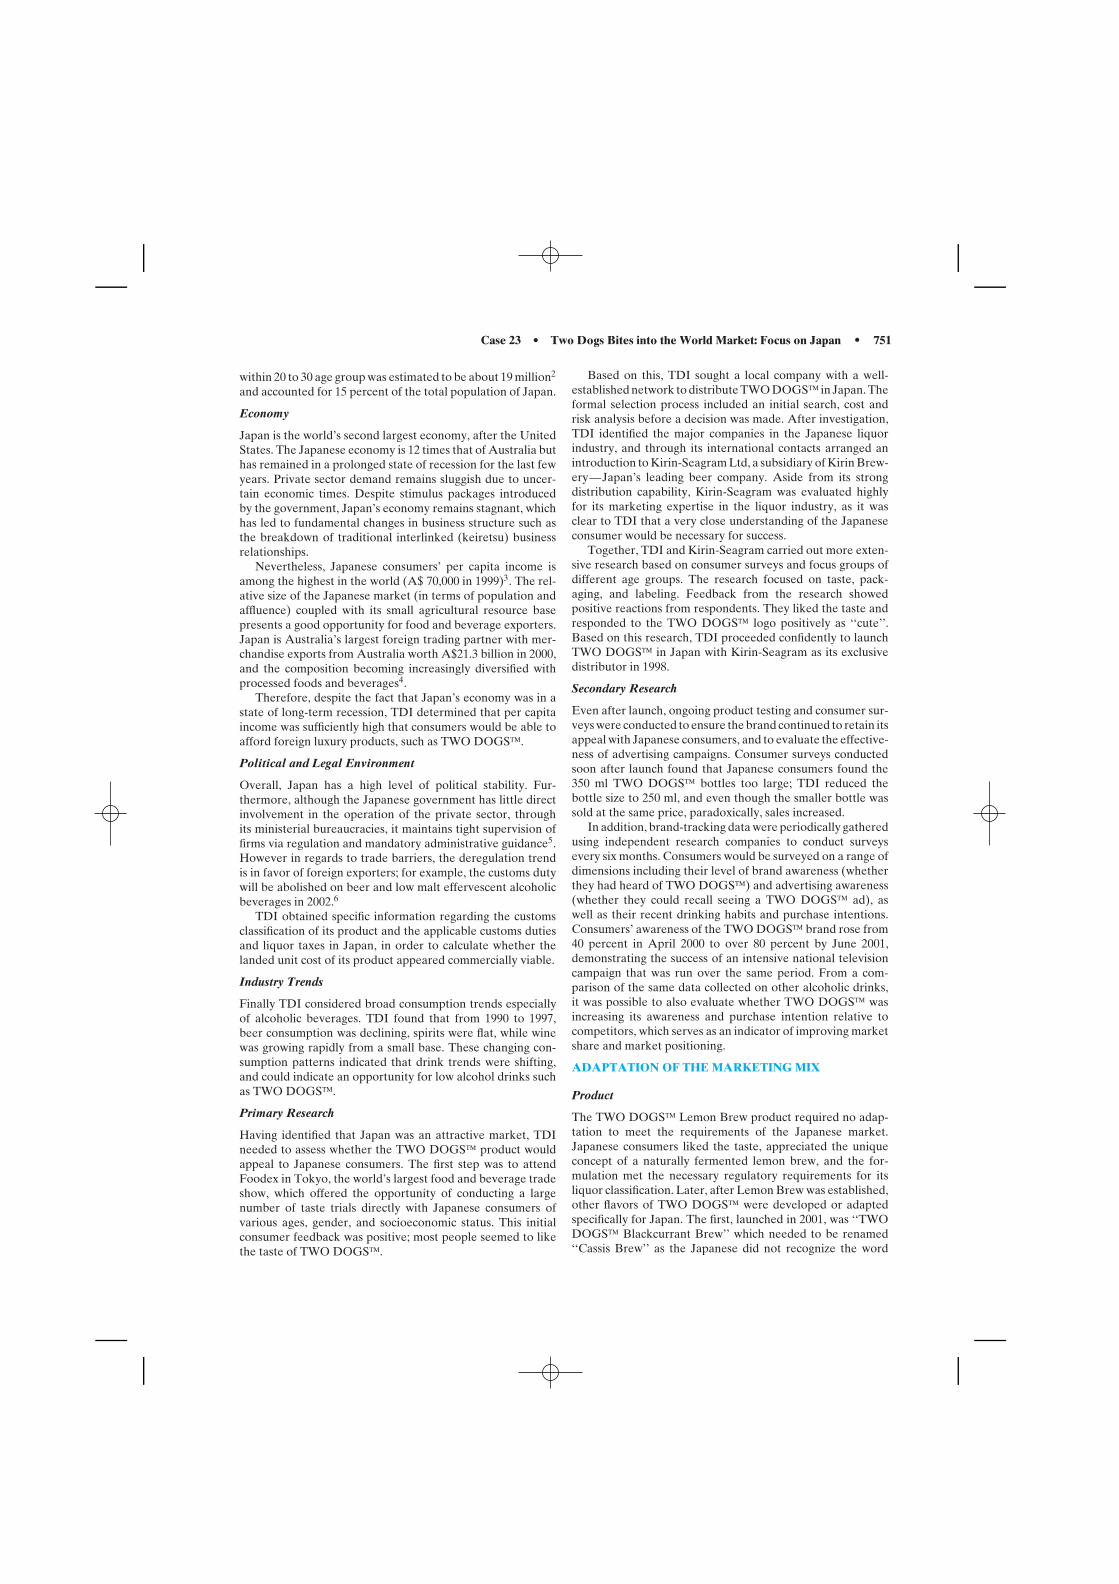
Case 23 • Two Dogs Bites into the World Market: Focus on Japan • 751
within 20 to 30 age group was estimated to be about 19 million2
and accounted for 15 percent of the total population of Japan.
Economy
Japan is the world’s second largest economy, after the UnitedStates. The Japanese economy is 12 times that of Australia buthas remained in a prolonged state of recession for the last fewyears. Private sector demand remains sluggish due to uncer-tain economic times. Despite stimulus packages introducedby the government, Japan’s economy remains stagnant, whichhas led to fundamental changes in business structure such asthe breakdown of traditional interlinked (keiretsu) businessrelationships.
Nevertheless, Japanese consumers’ per capita income isamong the highest in the world (A$ 70,000 in 1999)3. The rel-ative size of the Japanese market (in terms of population andaffluence) coupled with its small agricultural resource basepresents a good opportunity for food and beverage exporters.Japan is Australia’s largest foreign trading partner with mer-chandise exports from Australia worth A$21.3 billion in 2000,and the composition becoming increasingly diversified withprocessed foods and beverages4.
Therefore, despite the fact that Japan’s economy was in astate of long-term recession, TDI determined that per capitaincome was sufficiently high that consumers would be able toafford foreign luxury products, such as TWO DOGS.
Political and Legal Environment
Overall, Japan has a high level of political stability. Fur-thermore, although the Japanese government has little directinvolvement in the operation of the private sector, throughits ministerial bureaucracies, it maintains tight supervision offirms via regulation and mandatory administrative guidance5.However in regards to trade barriers, the deregulation trendis in favor of foreign exporters; for example, the customs dutywill be abolished on beer and low malt effervescent alcoholicbeverages in 2002.6
TDI obtained specific information regarding the customsclassification of its product and the applicable customs dutiesand liquor taxes in Japan, in order to calculate whether thelanded unit cost of its product appeared commercially viable.
Industry Trends
Finally TDI considered broad consumption trends especiallyof alcoholic beverages. TDI found that from 1990 to 1997,beer consumption was declining, spirits were flat, while winewas growing rapidly from a small base. These changing con-sumption patterns indicated that drink trends were shifting,and could indicate an opportunity for low alcohol drinks suchas TWO DOGS.
Primary Research
Having identified that Japan was an attractive market, TDIneeded to assess whether the TWO DOGS product wouldappeal to Japanese consumers. The first step was to attendFoodex in Tokyo, the world’s largest food and beverage tradeshow, which offered the opportunity of conducting a largenumber of taste trials directly with Japanese consumers ofvarious ages, gender, and socioeconomic status. This initialconsumer feedback was positive; most people seemed to likethe taste of TWO DOGS.
Based on this, TDI sought a local company with a well-established network to distribute TWO DOGS in Japan. Theformal selection process included an initial search, cost andrisk analysis before a decision was made. After investigation,TDI identified the major companies in the Japanese liquorindustry, and through its international contacts arranged anintroduction to Kirin-Seagram Ltd, a subsidiary of Kirin Brew-ery—Japan’s leading beer company. Aside from its strongdistribution capability, Kirin-Seagram was evaluated highlyfor its marketing expertise in the liquor industry, as it wasclear to TDI that a very close understanding of the Japaneseconsumer would be necessary for success.
Together, TDI and Kirin-Seagram carried out more exten-sive research based on consumer surveys and focus groups ofdifferent age groups. The research focused on taste, pack-aging, and labeling. Feedback from the research showedpositive reactions from respondents. They liked the taste andresponded to the TWO DOGS logo positively as ‘‘cute’’.Based on this research, TDI proceeded confidently to launchTWO DOGS in Japan with Kirin-Seagram as its exclusivedistributor in 1998.
Secondary Research
Even after launch, ongoing product testing and consumer sur-veys were conducted to ensure the brand continued to retain itsappeal with Japanese consumers, and to evaluate the effective-ness of advertising campaigns. Consumer surveys conductedsoon after launch found that Japanese consumers found the350 ml TWO DOGS bottles too large; TDI reduced thebottle size to 250 ml, and even though the smaller bottle wassold at the same price, paradoxically, sales increased.
In addition, brand-tracking data were periodically gatheredusing independent research companies to conduct surveysevery six months. Consumers would be surveyed on a range ofdimensions including their level of brand awareness (whetherthey had heard of TWO DOGS) and advertising awareness(whether they could recall seeing a TWO DOGS ad), aswell as their recent drinking habits and purchase intentions.Consumers’ awareness of the TWO DOGS brand rose from40 percent in April 2000 to over 80 percent by June 2001,demonstrating the success of an intensive national televisioncampaign that was run over the same period. From a com-parison of the same data collected on other alcoholic drinks,it was possible to also evaluate whether TWO DOGS wasincreasing its awareness and purchase intention relative tocompetitors, which serves as an indicator of improving marketshare and market positioning.
ADAPTATION OF THE MARKETING MIX
Product
The TWO DOGS Lemon Brew product required no adap-tation to meet the requirements of the Japanese market.Japanese consumers liked the taste, appreciated the uniqueconcept of a naturally fermented lemon brew, and the for-mulation met the necessary regulatory requirements for itsliquor classification. Later, after Lemon Brew was established,other flavors of TWO DOGS were developed or adaptedspecifically for Japan. The first, launched in 2001, was ‘‘TWODOGS Blackcurrant Brew’’ which needed to be renamed‘‘Cassis Brew’’ as the Japanese did not recognize the word
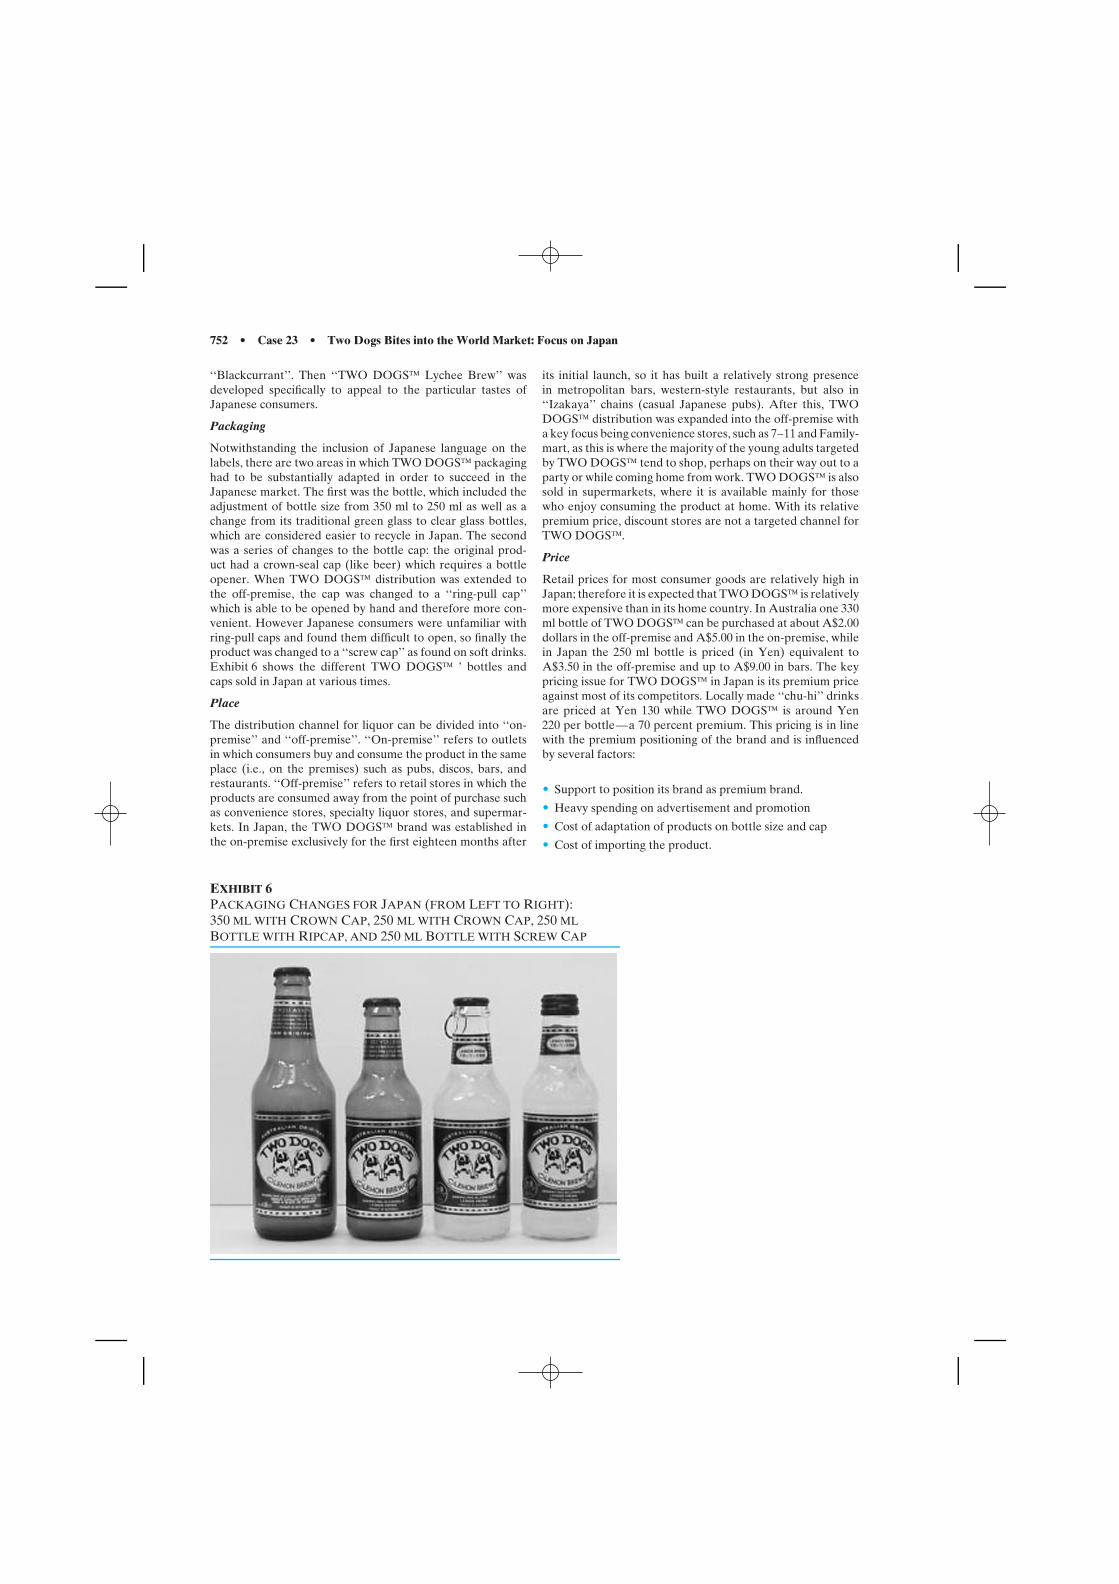
752 • Case 23 • Two Dogs Bites into the World Market: Focus on Japan
‘‘Blackcurrant’’. Then ‘‘TWO DOGS Lychee Brew’’ wasdeveloped specifically to appeal to the particular tastes ofJapanese consumers.
Packaging
Notwithstanding the inclusion of Japanese language on thelabels, there are two areas in which TWO DOGS packaginghad to be substantially adapted in order to succeed in theJapanese market. The first was the bottle, which included theadjustment of bottle size from 350 ml to 250 ml as well as achange from its traditional green glass to clear glass bottles,which are considered easier to recycle in Japan. The secondwas a series of changes to the bottle cap: the original prod-uct had a crown-seal cap (like beer) which requires a bottleopener. When TWO DOGS distribution was extended tothe off-premise, the cap was changed to a ‘‘ring-pull cap’’which is able to be opened by hand and therefore more con-venient. However Japanese consumers were unfamiliar withring-pull caps and found them difficult to open, so finally theproduct was changed to a ‘‘screw cap’’ as found on soft drinks.Exhibit 6 shows the different TWO DOGS ’ bottles andcaps sold in Japan at various times.
Place
The distribution channel for liquor can be divided into ‘‘on-premise’’ and ‘‘off-premise’’. ‘‘On-premise’’ refers to outletsin which consumers buy and consume the product in the sameplace (i.e., on the premises) such as pubs, discos, bars, andrestaurants. ‘‘Off-premise’’ refers to retail stores in which theproducts are consumed away from the point of purchase suchas convenience stores, specialty liquor stores, and supermar-kets. In Japan, the TWO DOGS brand was established inthe on-premise exclusively for the first eighteen months after
its initial launch, so it has built a relatively strong presencein metropolitan bars, western-style restaurants, but also in‘‘Izakaya’’ chains (casual Japanese pubs). After this, TWODOGS distribution was expanded into the off-premise witha key focus being convenience stores, such as 7–11 and Family-mart, as this is where the majority of the young adults targetedby TWO DOGS tend to shop, perhaps on their way out to aparty or while coming home from work. TWO DOGS is alsosold in supermarkets, where it is available mainly for thosewho enjoy consuming the product at home. With its relativepremium price, discount stores are not a targeted channel forTWO DOGS.
Price
Retail prices for most consumer goods are relatively high inJapan; therefore it is expected that TWO DOGS is relativelymore expensive than in its home country. In Australia one 330ml bottle of TWO DOGS can be purchased at about A$2.00dollars in the off-premise and A$5.00 in the on-premise, whilein Japan the 250 ml bottle is priced (in Yen) equivalent toA$3.50 in the off-premise and up to A$9.00 in bars. The keypricing issue for TWO DOGS in Japan is its premium priceagainst most of its competitors. Locally made ‘‘chu-hi’’ drinksare priced at Yen 130 while TWO DOGS is around Yen220 per bottle—a 70 percent premium. This pricing is in linewith the premium positioning of the brand and is influencedby several factors:
• Support to position its brand as premium brand.
• Heavy spending on advertisement and promotion
• Cost of adaptation of products on bottle size and cap
• Cost of importing the product.
EXHIBIT 6PACKAGING CHANGES FOR JAPAN (FROM LEFT TO RIGHT):350 ML WITH CROWN CAP, 250 ML WITH CROWN CAP, 250 MLBOTTLE WITH RIPCAP, AND 250 ML BOTTLE WITH SCREW CAP
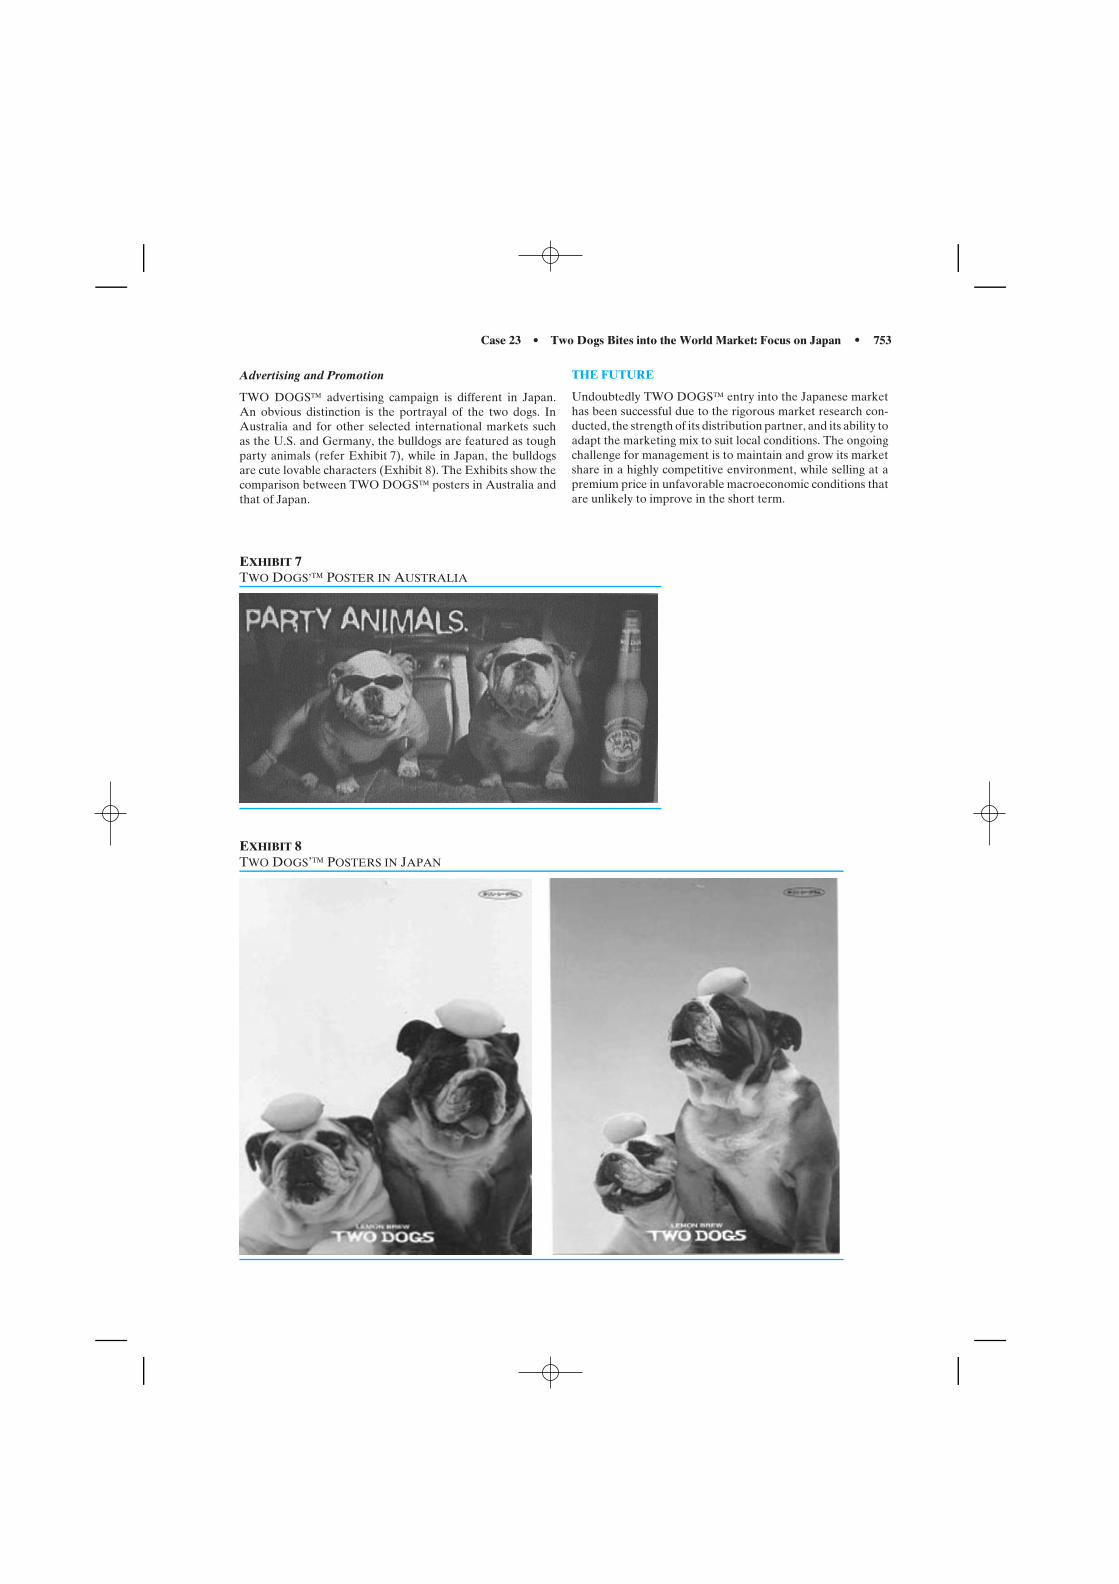
Case 23 • Two Dogs Bites into the World Market: Focus on Japan • 753
Advertising and Promotion
TWO DOGS advertising campaign is different in Japan.An obvious distinction is the portrayal of the two dogs. InAustralia and for other selected international markets suchas the U.S. and Germany, the bulldogs are featured as toughparty animals (refer Exhibit 7), while in Japan, the bulldogsare cute lovable characters (Exhibit 8). The Exhibits show thecomparison between TWO DOGS posters in Australia andthat of Japan.
THE FUTURE
Undoubtedly TWO DOGS entry into the Japanese markethas been successful due to the rigorous market research con-ducted, the strength of its distribution partner, and its ability toadapt the marketing mix to suit local conditions. The ongoingchallenge for management is to maintain and grow its marketshare in a highly competitive environment, while selling at apremium price in unfavorable macroeconomic conditions thatare unlikely to improve in the short term.
EXHIBIT 7TWO DOGS’ POSTER IN AUSTRALIA
EXHIBIT 8TWO DOGS’ POSTERS IN JAPAN
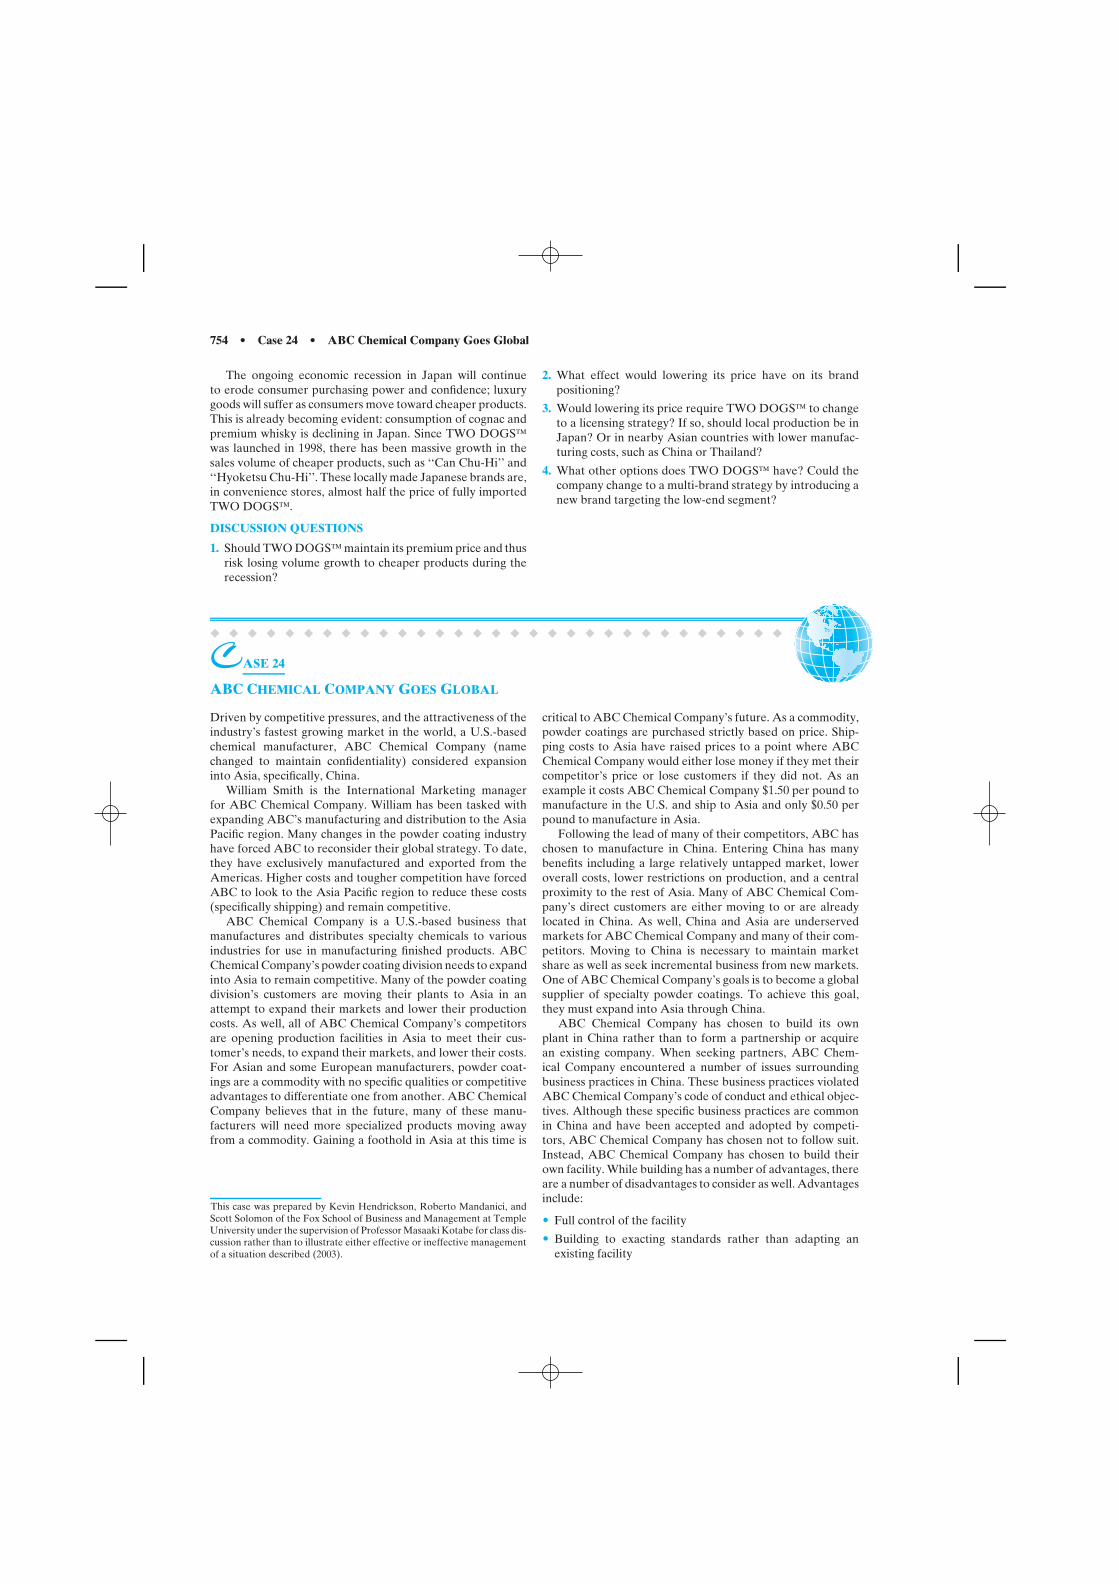
754 • Case 24 • ABC Chemical Company Goes Global
The ongoing economic recession in Japan will continueto erode consumer purchasing power and confidence; luxurygoods will suffer as consumers move toward cheaper products.This is already becoming evident: consumption of cognac andpremium whisky is declining in Japan. Since TWO DOGSwas launched in 1998, there has been massive growth in thesales volume of cheaper products, such as ‘‘Can Chu-Hi’’ and‘‘Hyoketsu Chu-Hi’’. These locally made Japanese brands are,in convenience stores, almost half the price of fully importedTWO DOGS.
DISCUSSION QUESTIONS
1. Should TWO DOGS maintain its premium price and thusrisk losing volume growth to cheaper products during therecession?
2. What effect would lowering its price have on its brandpositioning?
3. Would lowering its price require TWO DOGS to changeto a licensing strategy? If so, should local production be inJapan? Or in nearby Asian countries with lower manufac-turing costs, such as China or Thailand?
4. What other options does TWO DOGS have? Could thecompany change to a multi-brand strategy by introducing anew brand targeting the low-end segment?
� � � � � � � � � � � � � � � � � � � � � � � � � � � � � � �
CASE 24
ABC CHEMICAL COMPANY GOES GLOBAL
Driven by competitive pressures, and the attractiveness of theindustry’s fastest growing market in the world, a U.S.-basedchemical manufacturer, ABC Chemical Company (namechanged to maintain confidentiality) considered expansioninto Asia, specifically, China.
William Smith is the International Marketing managerfor ABC Chemical Company. William has been tasked withexpanding ABC’s manufacturing and distribution to the AsiaPacific region. Many changes in the powder coating industryhave forced ABC to reconsider their global strategy. To date,they have exclusively manufactured and exported from theAmericas. Higher costs and tougher competition have forcedABC to look to the Asia Pacific region to reduce these costs(specifically shipping) and remain competitive.
ABC Chemical Company is a U.S.-based business thatmanufactures and distributes specialty chemicals to variousindustries for use in manufacturing finished products. ABCChemical Company’s powder coating division needs to expandinto Asia to remain competitive. Many of the powder coatingdivision’s customers are moving their plants to Asia in anattempt to expand their markets and lower their productioncosts. As well, all of ABC Chemical Company’s competitorsare opening production facilities in Asia to meet their cus-tomer’s needs, to expand their markets, and lower their costs.For Asian and some European manufacturers, powder coat-ings are a commodity with no specific qualities or competitiveadvantages to differentiate one from another. ABC ChemicalCompany believes that in the future, many of these manu-facturers will need more specialized products moving awayfrom a commodity. Gaining a foothold in Asia at this time is
This case was prepared by Kevin Hendrickson, Roberto Mandanici, andScott Solomon of the Fox School of Business and Management at TempleUniversity under the supervision of Professor Masaaki Kotabe for class dis-cussion rather than to illustrate either effective or ineffective managementof a situation described (2003).
critical to ABC Chemical Company’s future. As a commodity,powder coatings are purchased strictly based on price. Ship-ping costs to Asia have raised prices to a point where ABCChemical Company would either lose money if they met theircompetitor’s price or lose customers if they did not. As anexample it costs ABC Chemical Company $1.50 per pound tomanufacture in the U.S. and ship to Asia and only $0.50 perpound to manufacture in Asia.
Following the lead of many of their competitors, ABC haschosen to manufacture in China. Entering China has manybenefits including a large relatively untapped market, loweroverall costs, lower restrictions on production, and a centralproximity to the rest of Asia. Many of ABC Chemical Com-pany’s direct customers are either moving to or are alreadylocated in China. As well, China and Asia are underservedmarkets for ABC Chemical Company and many of their com-petitors. Moving to China is necessary to maintain marketshare as well as seek incremental business from new markets.One of ABC Chemical Company’s goals is to become a globalsupplier of specialty powder coatings. To achieve this goal,they must expand into Asia through China.
ABC Chemical Company has chosen to build its ownplant in China rather than to form a partnership or acquirean existing company. When seeking partners, ABC Chem-ical Company encountered a number of issues surroundingbusiness practices in China. These business practices violatedABC Chemical Company’s code of conduct and ethical objec-tives. Although these specific business practices are commonin China and have been accepted and adopted by competi-tors, ABC Chemical Company has chosen not to follow suit.Instead, ABC Chemical Company has chosen to build theirown facility. While building has a number of advantages, thereare a number of disadvantages to consider as well. Advantagesinclude:
• Full control of the facility
• Building to exacting standards rather than adapting anexisting facility
Case 24 • ABC Chemical Company Goes Global • 755
• Maintaining quality standards similar to other ABC Chem-ical Company plants
• Maintaining company code of conduct and ethical standards
Disadvantages include:
• One to two years to build a facility, slowing speed to market(competitors already producing, including North Americanand European manufacturers who have partnered with localfirms as well as thousands of small local competitors)
• Exporting from U.S. facilities at a loss
• Lack of local partners and knowledge may impede entryinto market
While ABC Chemical Company builds their factory inChina they will continue to supply Asian customers from theirNorth American manufacturing facilities, at a substantial lossdue to logistical and transportation costs.
COMPANY OVERVIEW
ABC Chemical Company is one of the world’s largest man-ufacturers of specialty chemicals—technologically sophisti-cated materials that find their way into applications in avariety of major markets. Consumers never see most ofABC’s products; rather, they are used by other industriesto produce better-performing, high-quality end products andfinished goods. The history of ABC Chemical Company hasbeen a series of innovative technical contributions to scienceand industry, usually taking place behind the scenes.
Markets where extensive use is made of ABC’s productsinclude the paint and coatings industry, electronics, householdproducts/detergents/personal care, water treatment, adhe-sives, plastics, and salt. In every corner of the world, ABCproducts are Quietly Improving the Quality of Life.
In the late 1990s, ABC acquired two great compa-nies—Ronlea (name changed), a maker of electronic chem-icals, and Tomro International (name changed), a globalproducer of specialty chemicals and salt.
ABC has sales of approximately $6 billion and more than17,000 employees. It operates nearly 140 research and man-ufacturing locations in 27 countries. The company has morethan one hundred ISO 9000 and more than twenty-five ISO14000 EMAS registrations around the world. Worldwide head-quarters are located in the United States. ABC is a Delawarecorporation whose stock is traded on the New York StockExchange under the symbol ABC.
ABC is committed to being a good neighbor and responsi-ble corporate citizen. At various places on their web site thereare discussions of a number of initiatives, including Responsi-ble Care, Community Advisory Committees, and activitiescentered on the health and safety of employees, customers, thecommunities where they are located, and the environment.
ABC CHEMICAL COMPANY’S CODE OF CONDUCT
ABC Company stresses the importance of its code of conductto each employee worldwide. The code is strictly embracedand enforced at all levels of the organization: from the CEOand the Board of Directors to each entry-level salaried staffposition. In fact, once a year each salaried employee is askedto: 1) sign the Code of Conduct and certify that he/she has notviolated any of the ethical provisions contained in it; and 2)
certify that he/she is not aware that any other employee hasviolated the code.
Portions of the Purchasing section of the code of conductare reported below:
Relationships between ABC Company and its suppliersshould be based on mutual respect and integrity. These rela-tionships should be maintained at the highest standards ofbusiness ethics. [. . .] Under no circumstance may an ABCemployee misrepresent a competitive situation to a supplier.
ABC Company does not require nor does it expect any formof entertainment, promotional gifts or holiday cards as a con-dition for doing business. It is strictly prohibited for an ABCpurchasing agent to solicit any gifts or entertainment or acceptspontaneous nominal gifts valued in excess of $50; acceptingany cash gift; traveling at a supplier’s expense or participatingin a supplier-sponsored training seminar that is extravagant innature. [. . .] Any supplier or employee who suspects that anABC employee is not operating within the Code of Conduct,should promptly report their suspicion anonymously to theABC Compliance Hotline at 1-800-123-4567.
The General Code of Business Conduct repeats, in part,the provisions mentioned in the Purchasing Code, and addsthe following:
Gifts of cash or property may not be offered or made toany officer or employee of a customer or supplier or any gov-ernment official or employee unless the gift is legal, nominal invalue (less than $50) and approved in advance by a Director orBusiness Executive (in most countries it is illegal to make giftsto government officials).
Conflicts of interest: any employee who has a financial inter-est or performs work for a company with which we do businessor compete, must disclose such conflict to the respective Directoror Business Executive.
Securities Transactions: at times, some ABC employeesmay become aware of confidential information that has not yetbeen disclosed to the general public. In those cases, the infor-mation must be held in strict confidence. Those who becameaware of such information may not buy or sell company stock,nor advise others to do so, until the information has been madeavailable to the general public.
Safety, Health and Environmental laws: ABC conducts itsworldwide operations and manufactures its products in a wayas to not harm the environment and the health and safety of itsemployees, customers and the public. ABC is also committedto complying with all local applicable laws and regulations.
Accounting records: ABC’s financial statements and thebooks of record on which they are based must accurately reflectall corporate transactions. All receipts and disbursements mustbe accurately reflected on the accounting books, and ABC’srecords must disclose the nature and purpose of all corporatetransactions. [. . .] ABC employees are instructed to cooperatefully with both internal as well as external auditors and withholdno information from them.
Other accounting and internal control provisions pertinentto the case study are as follows:
1. Bank accounts: the corporate treasurer must approve theestablishment of all bank accounts.
2. Financial arrangements: the corporate treasurer mustapprove all financial arrangements with banks such as:
756 • Case 24 • ABC Chemical Company Goes Global
loans, sales or purchases of securities; dealing in foreigncurrency; etc.
3. Cash disbursements: every disbursement (with the excep-tion of petty cash) must be supported by an approvedPurchase Order or Check Request. The full name of thepayee must be recorded on the payment. Checks may notbe made payable to ‘‘cash’’, ‘‘bearer’’ nor the individualapproving the transaction.
4. Employee compensation: all payments to employees mustbe justified based on services rendered. Employees maynot be asked to refund a portion of their compensation orspend it in an illegal or unethical manner.
5. Billing: all shipments must be billed promptly and accu-rately.
6. Cash receipts: all checks made payable to the Companymust be deposited in an ABC checking account promptly.Checks received from customers may not be endorsedto a third party as a means of payment for our pur-chases.
7. Sales agents and commissions: only respected and compe-tent agents or distributors may be hired to represent ABCCompany. All commission payments must be properlyrecorded on the accounting books with full documentationincluding the name of the payee, the commission rate, theproduct sold and the customer orders involved. Cash pay-ments, payments to unnamed individuals or disguised bankaccounts are not permitted.
8. Consultants: all engagements with consultants and advisorsmust be based on ABC’s needs for technical or profes-sional assistance. The background and professional abilitymust be scrutinized carefully before engaging a new con-sultant. All invoices received and paid must accuratelydescribe the services rendered and the basis for the feescharged.
9. Unusual business transactions: all transactions outside thenormal course of ABC’s business (sale of scrap material,leasing of buildings and equipment, entering into a newbusiness activity, etc.) must be authorized by a BusinessUnit Manager or a Vice-President.
10. Accounting records: all corporate transactions must bereflected in the accounting records. Any fictitious or unau-thorized entries are strictly forbidden.
INDUSTRY OVERVIEW
Powder Coatings (dry paint), a relatively new technology,is an economical and environmental improvement over thetraditional liquid paint. It is mostly used by Original Equip-ment Manufacturers (OEMs) and by small custom ‘‘job-shops.’’
The application characteristics of powder coatings providesuperior consistency and uniformity of finish. They provideextremely tough, durable coats, enhancing the high-quality,value-added image of consumer products. In general, per-formance properties such as impact resistance and corrosionresistance of powder coatings are better than liquid paints.Powder-coated parts resist cracking and peeling during han-dling and normal service use. In many cases, merchandise isspecifically being advertised as ‘‘powder coated’’ because ofthe quality image it projects.
‘‘Environmental issues are of significant interest and impor-tance to the government and general public today. Unlikemany liquid paints, powder coatings are compliant with envi-ronmental regulations. Liquid paints often contain solvents,which can contribute to air pollution and, in some cases, ozonedepletion. Powder coatings are free of such pollutants. Wetpainting processes can generate sludge, which must be dis-posed of into hazardous waste landfills. Properly formulatedpowder coatings generate no such hazardous waste. The con-sumer can feel good about buying a powder-coated product,which is environmentally responsible.’’1
The global powder coatings market registered an estimated$3.5 billion in sales in the year 2002. The three major marketsare Europe (with sales of $1.3 billion), North America (withsales of $1 billion), and Asia Pacific (with sales of $0.85 billion)(see Exhibit 1).
The global powder market is dominated by three majorplayers (see Exhibit 2):
1Source: ABC’s website.
EXHIBIT 1GLOBAL POWDER COATINGS MARKET
$1,000
$1,300
$850
$150$200North AmericaAGR 6-7%
Europe AGR 3-4%
Asia PacificAGR 12-15%
Latin AmericaAGR 10-12%
Rest of WorldAGR 10-12%
Values are 2001 estimates in Millions of US$ and Estimated Annual Growth Rate (AGR) for the next 5 years
Case 24 • ABC Chemical Company Goes Global • 757
EXHIBIT 2GLOBAL POWDER MARKET POSITIONS
F5%
P4%
Wooden Shoes13%
ABC Company6%
Delco11%
J3%B
3%V3%
G2% H
3%T
3%
1,000 Others44%
1. Wooden Shoes, a Dutch company, is the market leadercommanding 13 percent of the worldwide market. WoodenShoes is the leader in Europe and in Asia Pacific.
2. Delco, a U.S.-based corporation, owns 11 percent of theglobal market, with a second-place position in all threemajor markets, including Asia.
3. ABC holds a 6 percent global share, with a narrow numberone position in the U.S., and the second position in Europe.ABC’s presence in Asia is negligible at 0.2 percent.
4. Eight other smaller producers own 26 percent of the mar-ket. These powder coatings manufacturers operate in selectregional markets, concentrating their efforts on single-typecustomers and speed of delivery.
5. The remaining 44 percent of the market is composed ofover 1,000 single-plant producers who serve a handful oflocal customers and specialize in a narrow line of products.They compete on speed and price, since their low-techand high-volume production of similar products allows foreconomies of scale.
Although Europe is the largest market, it represents amature industry where margins are low and the powder coatingproduct is considered a semi-commodity. Estimated growthrates for the next five years are approximately 3–4 percentper year, while customers are not willing to pay higher pricesfor improved technology. In fact, technological improvementsare a means to retaining business rather than increasing pricesand margins. ABC holds the number two position in Europe(behind Wooden Shoes) using low-cost, consistency, an estab-lished network of agents and distributors, as well as speedydelivery as its differential advantage.
The North American market is a younger market, andbenefits from larger margins, with estimated growth rates of6–7 percent over the next five years. North American OEMsrequire a higher degree of technological innovations fromtheir powder coatings suppliers, and thus are willing to pay a
higher price per pound. ABC Chemical Company is the mar-ket leader in North America, specializing in highly customizedand specialty powders. ABC’s strengths are:
• Color-matching abilities
• Speed of delivery
• Innovation
• Low-temperature curing powders, which lead to energysavings
• Powders that can be applied with a thinner film, thus beingable to cover more surface per pound
• A highly skilled sales force
Asia Pacific is the smallest of the three major markets (with$0.85 billion sales) but offers a very attractive growth rate of12–15 percent per year. Although this is the youngest market,it already shows signs of price and margins erosion. Customersconsider powder coatings as a simple means for painting parts,and place little to no value on technological differentiation.The environmental benefits of powder coatings are also oflittle importance to the Asian market (due to less stringentenvironmental regulations).
The Asian powder coatings manufacturers’ arena is dom-inated by over 1,000 small entrepreneurial businesses rep-resenting 78 percent of the market share (see Exhibit 3).Wooden Shoes and Delco control 9 percent and 4 percent ofthe market. Powder coatings are used mainly to cover smallparts for export to the industrialized countries. Many Ameri-can manufacturers that are moving their operations to Asia inorder to capitalize on lower labor and raw material costs fuelthe high degree of growth. ABC’s vision is that these manufac-turers will require the same degree of service and technologythat was demanded in their North American facilities, thusproviding for higher margin sales in the future.
While ABC decides on the course of action, it will supplypowder coatings to the Asian market from its North Americanmanufacturing facilities. Although this is a strategic choice to
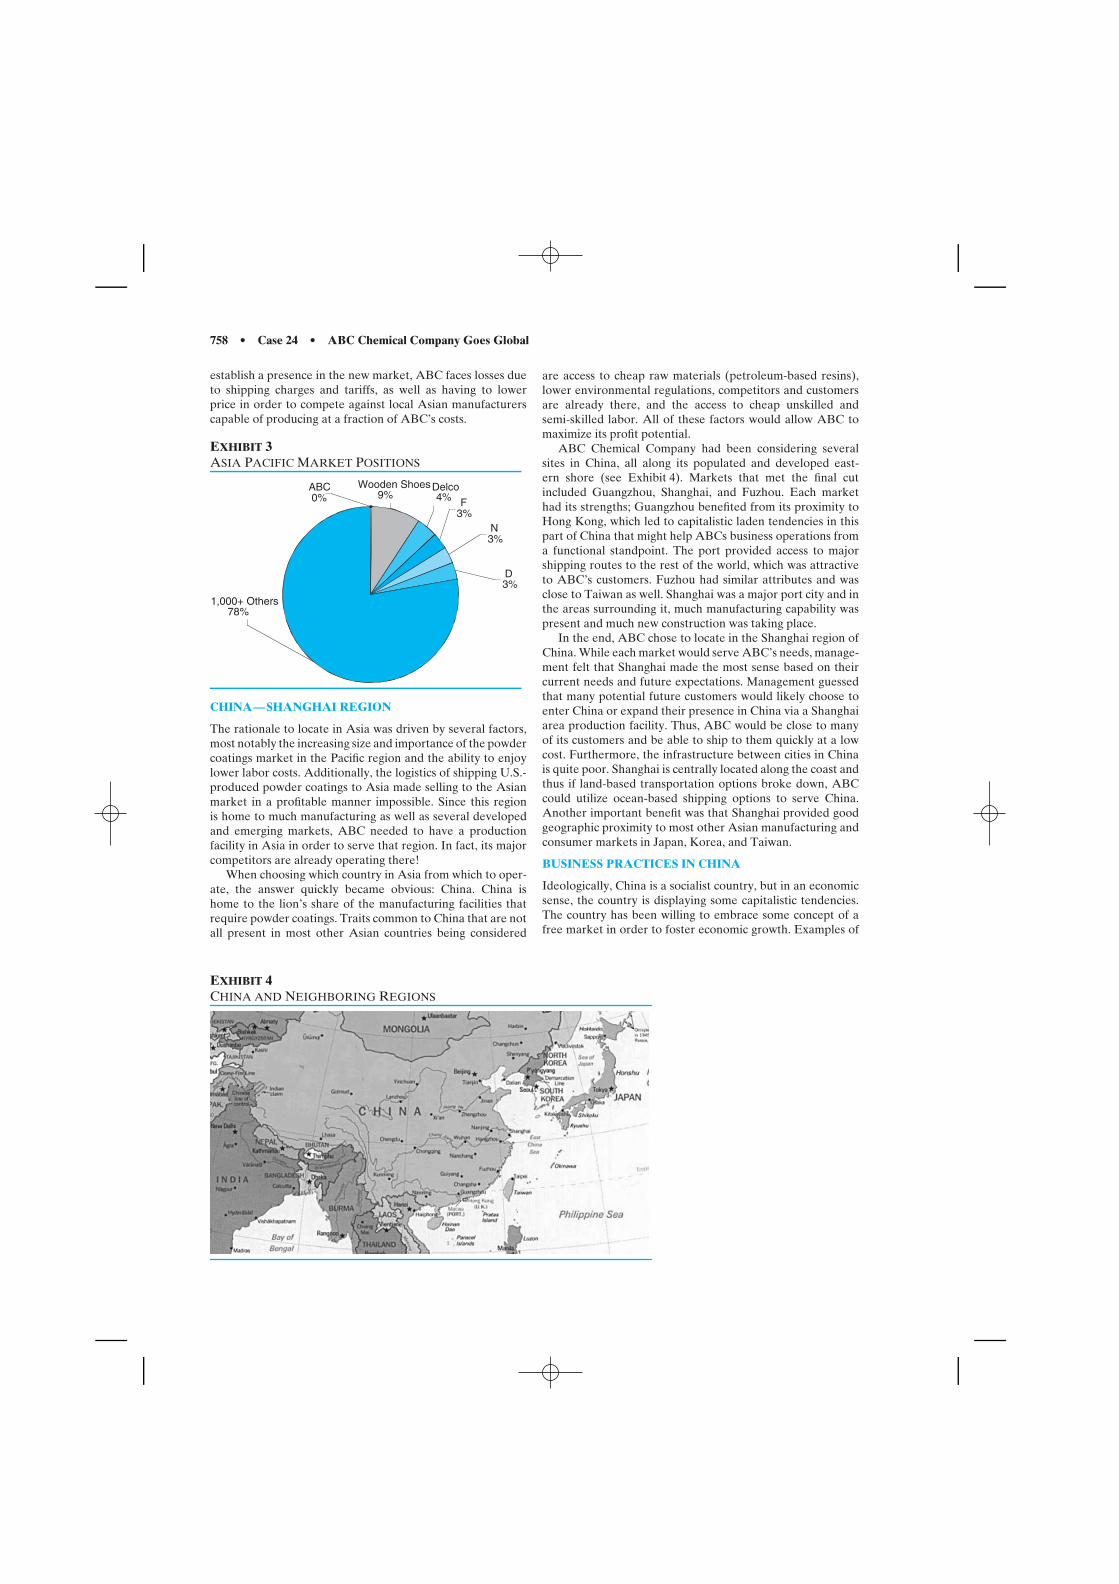
758 • Case 24 • ABC Chemical Company Goes Global
establish a presence in the new market, ABC faces losses dueto shipping charges and tariffs, as well as having to lowerprice in order to compete against local Asian manufacturerscapable of producing at a fraction of ABC’s costs.
EXHIBIT 3ASIA PACIFIC MARKET POSITIONS
1,000+ Others78%
D3%
Delco4%
ABC0%
Wooden Shoes9%
N3%
F3%
CHINA—SHANGHAI REGION
The rationale to locate in Asia was driven by several factors,most notably the increasing size and importance of the powdercoatings market in the Pacific region and the ability to enjoylower labor costs. Additionally, the logistics of shipping U.S.-produced powder coatings to Asia made selling to the Asianmarket in a profitable manner impossible. Since this regionis home to much manufacturing as well as several developedand emerging markets, ABC needed to have a productionfacility in Asia in order to serve that region. In fact, its majorcompetitors are already operating there!
When choosing which country in Asia from which to oper-ate, the answer quickly became obvious: China. China ishome to the lion’s share of the manufacturing facilities thatrequire powder coatings. Traits common to China that are notall present in most other Asian countries being considered
are access to cheap raw materials (petroleum-based resins),lower environmental regulations, competitors and customersare already there, and the access to cheap unskilled andsemi-skilled labor. All of these factors would allow ABC tomaximize its profit potential.
ABC Chemical Company had been considering severalsites in China, all along its populated and developed east-ern shore (see Exhibit 4). Markets that met the final cutincluded Guangzhou, Shanghai, and Fuzhou. Each markethad its strengths; Guangzhou benefited from its proximity toHong Kong, which led to capitalistic laden tendencies in thispart of China that might help ABCs business operations froma functional standpoint. The port provided access to majorshipping routes to the rest of the world, which was attractiveto ABC’s customers. Fuzhou had similar attributes and wasclose to Taiwan as well. Shanghai was a major port city and inthe areas surrounding it, much manufacturing capability waspresent and much new construction was taking place.
In the end, ABC chose to locate in the Shanghai region ofChina. While each market would serve ABC’s needs, manage-ment felt that Shanghai made the most sense based on theircurrent needs and future expectations. Management guessedthat many potential future customers would likely choose toenter China or expand their presence in China via a Shanghaiarea production facility. Thus, ABC would be close to manyof its customers and be able to ship to them quickly at a lowcost. Furthermore, the infrastructure between cities in Chinais quite poor. Shanghai is centrally located along the coast andthus if land-based transportation options broke down, ABCcould utilize ocean-based shipping options to serve China.Another important benefit was that Shanghai provided goodgeographic proximity to most other Asian manufacturing andconsumer markets in Japan, Korea, and Taiwan.
BUSINESS PRACTICES IN CHINA
Ideologically, China is a socialist country, but in an economicsense, the country is displaying some capitalistic tendencies.The country has been willing to embrace some concept of afree market in order to foster economic growth. Examples of
EXHIBIT 4CHINA AND NEIGHBORING REGIONS
Case 24 • ABC Chemical Company Goes Global • 759
this relaxing of ideology may be seen simply in the fact thatforeign multinational corporations (MNCs) are operating inthe country.
Despite the fact that China has opened somewhat, thereare still systems (both stated and implied) in place, whichrestrict freedom for economic growth. In the more officialsense, China’s equity markets are closed to private startupsand there is widespread piracy, restricting economic growth.As well, the government maintains price controls in overtwenty industries, censures the press, and does not allow fullInternet access. Unofficial systems in place in the country,which tend to impede efficient markets, are the nuances ofgetting things done, namely bribery and facilitating payments.
In China, there are many rules, but not necessarily laws.The rules are subject to change at anytime by anyone, pro-vided you have the right access to government officials willingto alter their views. Additionally, there are multiple govern-ment agencies/ministries with overlapping jurisdictions. Themain government body is known as the State Council, which isthe highest administrative body in the country. Other govern-ment agencies that have an effect on commerce, particularlyinternational trade, include the Ministry of Foreign Trade andEconomic Cooperation (MOFTEC), State Administration forIndustry and Commerce (SAIC) and the State Bureau ofInternational Trade (SBIT).
POLITICAL RISK IN CHINA
Countries that lack political stability or are inconsistent in theapplication of laws create a reputation among internationalfirms that they are more risky. While China has made greatefforts to open its doors to international business, the countryis still considered very risky. This is because China does nothave an effective legal system, or reliable commercial codeestablishing rules of commercial interactions and obligations.This is due to the fact that situations often fall under the juris-diction of multiple government bodies, which often contradictone another. These elements make firms less willing to investlarge amounts of money. While the amount of foreign invest-ment in China is large, metaphorically speaking, it amountsto no more than a toe in the water with respect to the valuethese firms would be willing to invest if the government wererun differently.
CODE OF CONDUCT IN CHINA
Many nations have enacted legislation attempting to controlthe behavior of domestically based firms in their operationsabroad. Such laws are meant to limit corrupt or immoralbehavior in dealing with other countries. The laws wereparticularly expected to apply to dealings with second andthird world countries. The most relevant international accordsrelating to this fact are
• The United Nations Universal Declaration of HumanRights—1948
• The European Convention on Human Rights—1950
• The Helsinki Final Act—1975
• OECD Guidelines for Multinational Enterprises—1976
• The International Labor Office Tripartite Declaration ofPrinciples Concerning Multinational Enterprises and SocialPolicy—1977
• The United Nations Code of Conduct on TransnationalCorporations
Over time, these accords have set up a series of explicit guide-lines for the behavior of international companies in countriesin which they operate; outlining codes of conduct, basic obli-gations, and upholding policies benefiting basic human rights.The broad categories regulated are employment practices,consumer protection, environmental protection, political pay-ments, and basic human rights.
The political payments section is most germane to ABC’sentry into China. The various accords noted above speakingon this topic say the following:
• MNCs cannot pay bribes or make improper payments topublic officials
• MNCs should avoid improper or illegal involvement orinterference in the internal politics of host countries
• MNCs should not interfere in intergovernmental relations.
While these guidelines were expected to limit corruption,bribery remains pervasive. The United States went a step fur-ther than the U.N. dictates and passed the Foreign CorruptPractices Act (FCPA) in 1977. The law specifically allowsfacilitation payments, but does not permit bribery. This lawmakes it illegal for a U.S. citizen to make a corrupt paymentto a member of a government for the express purpose ofhaving that office grant a contract or other business back tothe firm. The law also includes making payments to interme-diaries (who would in turn make bribes on the firm’s behalf).Penalties for individuals found guilty of the FCPA law includefive years imprisonment and a fine of $100,000. Firms can befined up to $2 million. Because bribery is often necessary tomake things work in China, many U.S.-based firms could notlegally do business there.
POTENTIAL TARGET COMPANIES EVALUATED
In order to evaluate potential Chinese firms that ABC maypartner with, ABC hired the Shanghai office of PriceWa-terHouseCoopers (PWC). PWC was hired to analyze theaccounting and business practices of a number of companies.Two companies, Target #1 and Target #2 (names changedto protect confidentiality) rose to the top and a synopsis ofPWC’s report follows.
PWC reported that part of Target #1’s financial infor-mation was not reported to government authorities and taxliabilities were under-recorded and underpaid. In fact, Target#1 keeps two sets of financial statements. One set of financialstatements is audited and used for external reporting purposessuch as the basis for tax assessments. The second set is usedfor management reporting and includes revenue and assetsnot reported on the external statements. To understand themagnitude of this phenomenon, PWC provided documenta-tion showing that in the year 2000 Target #1 reported only33 percent of sales and 12 percent of revenue on the externalstatements.
PWC advised that since a significant portion of the com-pany’s revenue and expenses was not reported to governmentauthorities, significant tax liabilities [Value Added Tax (VAT)and income tax] are underrecorded and underpaid. In addi-tion, penalties arising from these unreported tax liabilities
760 • Case 24 • ABC Chemical Company Goes Global
may be incurred as the above activities violated the People’sRepublic of China (PRC) accounting and tax laws.
Local management further advised the PWC partner thatover 60 percent of Target # 1’s sales were made to Taiwanesecompanies. Most of this revenue was not reported to PRCgovernment authorities as sales invoices were not issued. Asa common business practice in the Shanghai region, Target #1has agreements with these customers under which the salesrevenue will be collected by Target #1’s parent company inTaiwan in foreign currencies (Taiwan New Dollars or HongKong Dollars) from the customers’ parent companies in Tai-wan. When Target #1 needs cash, management will bringforeign currencies from its parent company to China withoutdeclaring it to customs. Consequently, these foreign currencieswill be exchanged into Yuan Renminbi (Chinese Currency,Rmb) in the black market. As these transactions violated thePRC foreign currency administration regulations, significantcontingent liabilities exist.
Another major issue is the treatment of the VAT. Asrequired by certain customers, VAT invoices were not issuedso that those customers can report less revenue and VATliabilities to government authorities.
Management advised that it is a common business practicein Shanghai that suppliers are requested not to issue sales(VAT) invoices to customers. In 2000, 67 percent of Target #1’s sales did not have VAT invoices. This enables customersto exclude these purchases from their official accountingrecords and consequently exclude sales revenue from theofficial accounting records and report less tax liabilities togovernment authorities.
As this practice is not consistent with ABC’s Code of Busi-ness Conduct, the risk of losing customers and sales revenueexist should ABC Chemical Company take over Target #1’sbusiness and insist on issuing VAT invoices to customers. Asa consequence, the following may occur:
1. Customers may terminate business with ABC ChemicalCompany as VAT invoices are audit trails that may raisethe suspicion of the tax authorities and lead to the eventualdiscovery of the previous improper practices.
2. Customers may be unwilling to pay VAT for purchasesfrom ABC Chemical Company as they do not need inputVAT to offset their VAT liabilities. Accordingly, ABC mayhave to absorb the VAT as part of the cost of sales. Thiswill lower ABC Chemical Company’s gross margin. (Forexample, if Target # 1 had to absorb VAT for customers in2000, its gross margin would be lowered from 17 percent to6 percent).
Furthermore, during a plant visit, PWC noticed returnedand obsolete inventories. However, no provision for inventoryobsolescence was made. Management estimated the costs ofthese obsolete or returned inventories to be Rmb 640,000.These inventories either had quality problems or did not havemarket demands. As these inventories will be of little valueto ABC, ABC may wish to consider excluding these agedinventories from the proposed acquisition. Local manage-ment acknowledged that Target #1 has been utilizing obsoleteinventories in production and this could cause quality prob-lems. Accordingly, sales returns and quality disputes mayoccur in the future. In 2000, sales returns accounted for 2.5percent of total sales.
PWC partners also found that Target #1’s managementhas also been understating the reserves for doubtful accounts,and overstating assets. Both accounting practices should becarefully examined by ABC company, as they have the effectof inflating the market value of the Target company. Addi-tionally, in 1997, Target #1 purchased certain equipment andmachinery from its investor in Taiwan. These assets wereexempt from VAT or custom duties according to PRC taxregulations. However, the exempted VAT and custom dutieswould become payable if these assets are sold within the next6 years.
Other matters of concern are the following:
1. Target #1 provides kickbacks to customers to boost sales.Although management indicated that kickback paymentsto customers were not a key incentive to promote sales, asmost of the customers are private companies, the amountsrecorded over the previous two years would be consideredmaterial by government officials.
2. Over 60 percent of sales are made to Taiwanese compa-nies. Management stated that Taiwanese firms prefer to dobusiness with other Taiwanese firms due to cultural reasonsand flexible payment arrangements and acknowledged thatit was very difficult for non-Taiwanese companies to sellproducts to Taiwanese customers. Accordingly, the risk oflosing Taiwanese customers may exist if ABC ChemicalCompany acquires Target #1.
3. A proper accounting system has not yet been establishedin Target #1. Some accounts do not have accountingledgers and financial statements are prepared manuallyfrom vouchers at period end. Additional investments toimprove working efficiency will be required if ABC Chem-ical Company acquires Target #1.
PriceWaterHouseCoopers was also involved in analyzingthe business practices of a second Chinese-based companynamed Target #2 (name changed to maintain confidentiality).Many of the issues found at Target #2 were similar to thoseaffecting Target #1.
Target #2 also keeps two sets of financial statements; onefor external and tax purposes, and one for management.Furthermore, as seen with the first target company, this enter-prise does not issue VAT invoices in their entirety. In factonly 20 percent of sales are invoiced. However, in early 2001,Target #2 issued more sales invoices and only 37 percent ofits sales did not have VAT invoices. Management advisedthat the reason for issuing more invoices and paying moreVAT was to make local tax authorities believe that it was agood taxpayer so as to avoid a comprehensive tax audit. Thisapproach also led Target #2 to request its suppliers to invoicea higher percentage of their purchases in order to offset theVAT charged to its customers. This created some tension withTarget # 2’s supplier base.
As stated above, if ABC Company takes over the opera-tions of Target #2 and insists on issuing VAT invoices in theirentirety, customers may terminate their business relationshipsince VAT invoices are audit trails that may raise the suspicionof the tax authorities and lead to the eventual discovery ofthe previous improper practices. Another option would be forABC Chemical Company to absorb VAT into their cost ofsales, thus lowering the overall profitability of the operations.
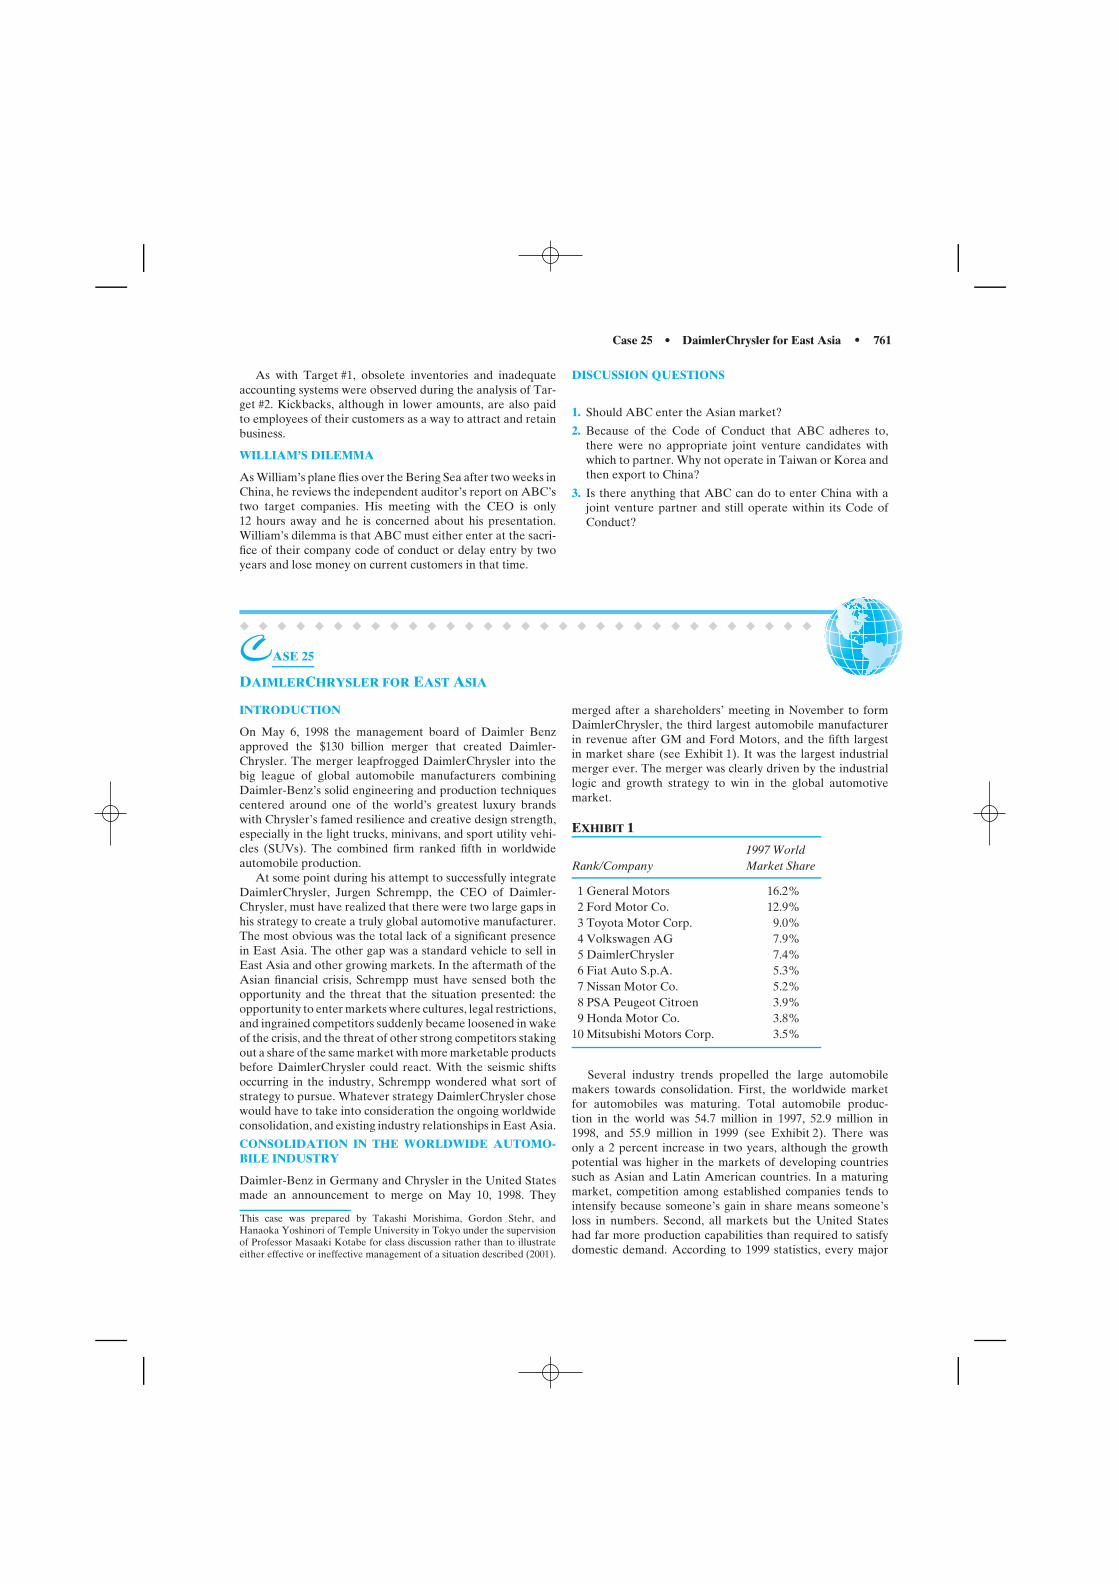
Case 25 • DaimlerChrysler for East Asia • 761
As with Target #1, obsolete inventories and inadequateaccounting systems were observed during the analysis of Tar-get #2. Kickbacks, although in lower amounts, are also paidto employees of their customers as a way to attract and retainbusiness.
WILLIAM’S DILEMMA
As William’s plane flies over the Bering Sea after two weeks inChina, he reviews the independent auditor’s report on ABC’stwo target companies. His meeting with the CEO is only12 hours away and he is concerned about his presentation.William’s dilemma is that ABC must either enter at the sacri-fice of their company code of conduct or delay entry by twoyears and lose money on current customers in that time.
DISCUSSION QUESTIONS
1. Should ABC enter the Asian market?
2. Because of the Code of Conduct that ABC adheres to,there were no appropriate joint venture candidates withwhich to partner. Why not operate in Taiwan or Korea andthen export to China?
3. Is there anything that ABC can do to enter China with ajoint venture partner and still operate within its Code ofConduct?
� � � � � � � � � � � � � � � � � � � � � � � � � � � � � � �
CASE 25
DAIMLERCHRYSLER FOR EAST ASIA
INTRODUCTION
On May 6, 1998 the management board of Daimler Benzapproved the $130 billion merger that created Daimler-Chrysler. The merger leapfrogged DaimlerChrysler into thebig league of global automobile manufacturers combiningDaimler-Benz’s solid engineering and production techniquescentered around one of the world’s greatest luxury brandswith Chrysler’s famed resilience and creative design strength,especially in the light trucks, minivans, and sport utility vehi-cles (SUVs). The combined firm ranked fifth in worldwideautomobile production.
At some point during his attempt to successfully integrateDaimlerChrysler, Jurgen Schrempp, the CEO of Daimler-Chrysler, must have realized that there were two large gaps inhis strategy to create a truly global automotive manufacturer.The most obvious was the total lack of a significant presencein East Asia. The other gap was a standard vehicle to sell inEast Asia and other growing markets. In the aftermath of theAsian financial crisis, Schrempp must have sensed both theopportunity and the threat that the situation presented: theopportunity to enter markets where cultures, legal restrictions,and ingrained competitors suddenly became loosened in wakeof the crisis, and the threat of other strong competitors stakingout a share of the same market with more marketable productsbefore DaimlerChrysler could react. With the seismic shiftsoccurring in the industry, Schrempp wondered what sort ofstrategy to pursue. Whatever strategy DaimlerChrysler chosewould have to take into consideration the ongoing worldwideconsolidation, and existing industry relationships in East Asia.
CONSOLIDATION IN THE WORLDWIDE AUTOMO-BILE INDUSTRY
Daimler-Benz in Germany and Chrysler in the United Statesmade an announcement to merge on May 10, 1998. They
This case was prepared by Takashi Morishima, Gordon Stehr, andHanaoka Yoshinori of Temple University in Tokyo under the supervisionof Professor Masaaki Kotabe for class discussion rather than to illustrateeither effective or ineffective management of a situation described (2001).
merged after a shareholders’ meeting in November to formDaimlerChrysler, the third largest automobile manufacturerin revenue after GM and Ford Motors, and the fifth largestin market share (see Exhibit 1). It was the largest industrialmerger ever. The merger was clearly driven by the industriallogic and growth strategy to win in the global automotivemarket.
EXHIBIT 1
1997 WorldRank/Company Market Share
1 General Motors 16.2%2 Ford Motor Co. 12.9%3 Toyota Motor Corp. 9.0%4 Volkswagen AG 7.9%5 DaimlerChrysler 7.4%6 Fiat Auto S.p.A. 5.3%7 Nissan Motor Co. 5.2%8 PSA Peugeot Citroen 3.9%9 Honda Motor Co. 3.8%
10 Mitsubishi Motors Corp. 3.5%
Several industry trends propelled the large automobilemakers towards consolidation. First, the worldwide marketfor automobiles was maturing. Total automobile produc-tion in the world was 54.7 million in 1997, 52.9 million in1998, and 55.9 million in 1999 (see Exhibit 2). There wasonly a 2 percent increase in two years, although the growthpotential was higher in the markets of developing countriessuch as Asian and Latin American countries. In a maturingmarket, competition among established companies tends tointensify because someone’s gain in share means someone’sloss in numbers. Second, all markets but the United Stateshad far more production capabilities than required to satisfydomestic demand. According to 1999 statistics, every major
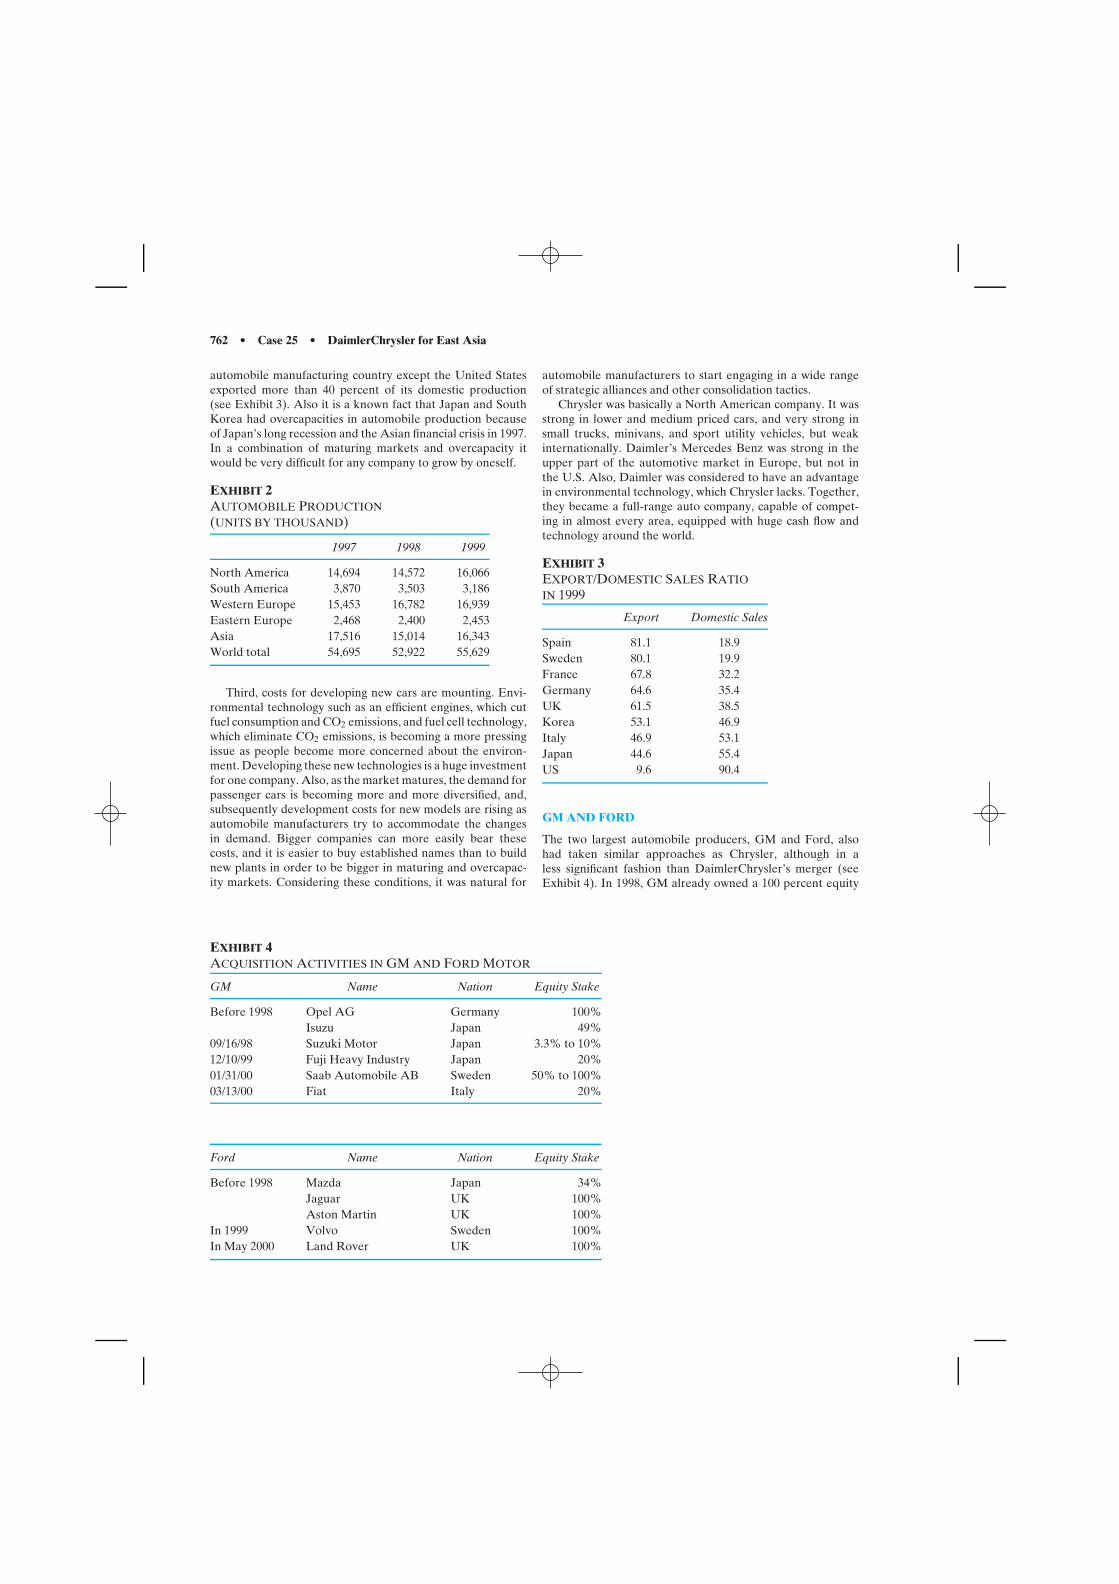
762 • Case 25 • DaimlerChrysler for East Asia
automobile manufacturing country except the United Statesexported more than 40 percent of its domestic production(see Exhibit 3). Also it is a known fact that Japan and SouthKorea had overcapacities in automobile production becauseof Japan’s long recession and the Asian financial crisis in 1997.In a combination of maturing markets and overcapacity itwould be very difficult for any company to grow by oneself.
EXHIBIT 2AUTOMOBILE PRODUCTION(UNITS BY THOUSAND)
1997 1998 1999
North America 14,694 14,572 16,066South America 3,870 3,503 3,186Western Europe 15,453 16,782 16,939Eastern Europe 2,468 2,400 2,453Asia 17,516 15,014 16,343World total 54,695 52,922 55,629
Third, costs for developing new cars are mounting. Envi-ronmental technology such as an efficient engines, which cutfuel consumption and CO2 emissions, and fuel cell technology,which eliminate CO2 emissions, is becoming a more pressingissue as people become more concerned about the environ-ment. Developing these new technologies is a huge investmentfor one company. Also, as the market matures, the demand forpassenger cars is becoming more and more diversified, and,subsequently development costs for new models are rising asautomobile manufacturers try to accommodate the changesin demand. Bigger companies can more easily bear thesecosts, and it is easier to buy established names than to buildnew plants in order to be bigger in maturing and overcapac-ity markets. Considering these conditions, it was natural for
automobile manufacturers to start engaging in a wide rangeof strategic alliances and other consolidation tactics.
Chrysler was basically a North American company. It wasstrong in lower and medium priced cars, and very strong insmall trucks, minivans, and sport utility vehicles, but weakinternationally. Daimler’s Mercedes Benz was strong in theupper part of the automotive market in Europe, but not inthe U.S. Also, Daimler was considered to have an advantagein environmental technology, which Chrysler lacks. Together,they became a full-range auto company, capable of compet-ing in almost every area, equipped with huge cash flow andtechnology around the world.
EXHIBIT 3EXPORT/DOMESTIC SALES RATIOIN 1999
Export Domestic Sales
Spain 81.1 18.9Sweden 80.1 19.9France 67.8 32.2Germany 64.6 35.4UK 61.5 38.5Korea 53.1 46.9Italy 46.9 53.1Japan 44.6 55.4US 9.6 90.4
GM AND FORD
The two largest automobile producers, GM and Ford, alsohad taken similar approaches as Chrysler, although in aless significant fashion than DaimlerChrysler’s merger (seeExhibit 4). In 1998, GM already owned a 100 percent equity
EXHIBIT 4ACQUISITION ACTIVITIES IN GM AND FORD MOTOR
GM Name Nation Equity Stake
Before 1998 Opel AG Germany 100%Isuzu Japan 49%
09/16/98 Suzuki Motor Japan 3.3% to 10%12/10/99 Fuji Heavy Industry Japan 20%01/31/00 Saab Automobile AB Sweden 50% to 100%03/13/00 Fiat Italy 20%
Ford Name Nation Equity Stake
Before 1998 Mazda Japan 34%Jaguar UK 100%Aston Martin UK 100%
In 1999 Volvo Sweden 100%In May 2000 Land Rover UK 100%
Case 25 • DaimlerChrysler for East Asia • 763
stake in Opel, which produced about one-quarter of all Ger-man vehicle output, and a 49 percent equity stake of Isuzu, theninth largest Japanese automobile manufacturer. Also, Fordowned a 34 percent equity stake in Mazda, the fifth largestJapanese automobile manufacturer, and 100 percent equitystakes in Jaguar and Aston Martin, small but respected U.K.automobile manufacturers.
After the merger of Daimler-Benz and Chrysler, GMincreased its holding in Suzuki Motors of Japan to 10 per-cent in September 1998, and acquired a 20 percent equitystake in Fuji Heavy Industries, makers of Subaru automo-biles, of Japan, and acquired a 100 percent equity stake inSaab of Sweden in January 2000. Ford also acquired Volvo’s(Sweden) passenger car division in 1999. Furthermore, GMannounced its intentions to acquire a 20 percent equity stakein Fiat, which is sixth in market share, on March 13, 2000.
However, after all this GM, the largest automobile man-ufacturer in the world, still holds only a 4 percent market
share in the Asian Pacific region, but a 20 percent share of theworld market and 10 percent share of the European market(see Exhibit 5). Automobile sales earnings of GM and Fordin Asia are minus $218 million for GM and plus $133 millionfor Ford, respectively (see Exhibit 6). These amounts are notvery exciting when compared with almost $6 billion incomefor each company’s automobile sales.
DAIMLERCHRYSLER IN ASIAN PACIFIC REGION
DaimlerChrysler sold only 50,000 cars in Japan out of 4.9million productions (see Exhibit 7). This is just 1 percent ofproduction and a 0.8 percent share of the Japanese mar-ket although its Mercedes-Benz was the best-selling foreignmade car in Japan. Also the annual report listed no Asianmanufacturer or important subsidiaries in the area except onecompany in India. In conclusion, while GM and Ford’s pres-ence was weak DaimlerChrysler had no significant presencein the Asian region in 1999.
EXHIBIT 5VEHICLE UNIT DELIVERIES (UNITS IN THOUSAND)
North America 19968 36% 5706 28.6%
Total US 17419 32% 5017 28.8%Others 2549 5% 689 27.0%Europe 20138 37% 1979 9.8%LAAME 3231 6% 536 16.6%Asia and Pacific 11610 21% 457 3.9%World total 54947 100% 8578 15.8
EXHIBIT 6INCOME IN AUTOMOBILE MANUFACTURING IN FORD MOTOR CO. AND GM IN 1999
Ford Total North America Europe Latin America Others
Income($M) 5721 6137 28 −452 133Revenue($B) 137 100 30 2 5
GM Total North America Europe LAAM Asia & Pacific
Income($M) 4981 4822 423 −81 −218Revenue($B) 146 115 26.2 4.7 3.2
EXHIBIT 7DAIMLERCHRYSLER UNIT SALES (UNITS IN THOUSAND)
M-B Passenger Chrysler Commercial Total
EU 716 267 983NAFTA 212 3052 193 3457US 197 2694 172 3063Japan 50 50South Africa 43 43Rest 102 177 51 330
Total 1080 3227 555 4862
764 • Case 25 • DaimlerChrysler for East Asia
EXHIBIT 8SUMMARY OF THE EAST ASIAN MARKET IN 1998
2) GDP per 3) Cars per 4) Domestic 5) Domestic 6) ExportCountry 1) Population Capita 1000 people Sales Production Ratio
Japan 126.5 23,100 395 5,879 10,050 44.6%Korea 46.4 12,600 227 780 1,954 69.7%Taiwan 21.9 16,500 286 474 405 —Thailand 61.2 6,100 100 144 158 32.1%Indonesia 204.4 2,830 20 58 58 —Malaysia 21.0 10,300 213 164 164 —China 1,250.2 3,600 11 1,630 1,628 —
Notes Million US$ USA 484 Thousand carsUK 461
EXHIBIT 9PRODUCTION (THOUSAND CARS)
1997 1998 1999Country Total Cars CVs Total Total
Japan 10,975 8,056 1,994 10,050 9,895Korea 2,818 1,625 329 1,954 2,843Taiwan 381 293 112 405 350Thailand 360 32 126 158 327Indonesia 389 8 7 134 205Malaysia 266 126 7 134 205China 1,580 507 1,121 1,628 1,830India 746 384 244 628 803
Asia Total 17,516 11,031 3,983 15,014 16,344
EXHIBIT 10JAPAN BY MAKE IN 1999 (NOTE: IMPORTS IN 1999 WERE 271,000.)
2) Domestic 3) D. Sales:1) Domestic Production Market Export:
(Thousand cars) Share OverseasManufacturer Cars CVs Total for Cars Production
Daihatsu 479 183 662 8.2% —Fuji 395 86 481 5.3% —Hino 40 40 0.7% —Honda 1,143 77 1,221 16.5% 1: 0.66: 1.76Isuzu 38 223 261 1.8% —Mazda 705 76 781 6.1% 1: 1.51: 0.47Mitsubishi 753 261 1,014 7.8% 1: 0.73: 0.48Nissan 1,210 175 1,385 13.7% 1: 0.79: 1.86Nissan Diesel 23 23 0.2% —Suzuki 679 230 909 9.9% —Toyota 2,699 419 3,118 27.1% 1: 0.90: 0.97
Total 8,100 1,795 9,895 100%
Case 25 • DaimlerChrysler for East Asia • 765
THE EAST ASIAN MARKET
Production of motor vehicles in Asia reached 16,344,000 carsin 1999, and accounted for 29 percent of the world production.The East Asian Market with a population of more than 1.7 bil-lion is categorized into four groups: Japan; Korea and Taiwan;ASEAN countries; and China. The general characteristicsare that Japanese and Korean automotive manufacturers arebeing restructured and realigned while Chinese and ASEANmarkets with huge growth potential are attracting most of themajor players from all over the world. More specific featuresare discussed below (see Exhibits 8 and 9).
Japan. Japan is a developed country and the domestic mar-ket is mature with 11 automotive manufacturers. Productionin Japan experienced its second straight year of decline in 1999due to weak exports under the impact of the strong yen, anddue to a downturn in domestic sales. This trend has gradually
affected each company’s financial status. In addition, somecompanies have not yet solved their domestic manufactur-ing overcapacity problems after shifting their manufacturingcapacity overseas. Also it is suggested that economies of scale,estimated to be 5 million annual production units for onegroup, will be necessary for surviving in the coming environ-mentally friendly and IT-oriented market of the 21st century.In Japan only Toyota meets this criterion so far. As a result,consolidation is advancing in the domestic market with distinctdivisions along worldwide groupings so that Toyota, Honda,GM, Ford, DCM, and Renault groups are emerging and com-peting against each other in Japan and abroad (see Exhibits 10and 11).
Korea and Taiwan. In order to recover from the downturndue to the Asian financial crisis, Korean manufacturers arenow being restructured and realigned. Daewoo Motors has
EXHIBIT 11JAPANESE AUTOMOTIVE MANUFACTURER’SALLIANCES WITH WORLD MAJOR PLAYERS
51.2%
50%
50%
10%
49%
20%
100%
34%
(Plan)
50%
36.8%
22.5%
22.5%
33.4%
50%
100%
50%Car
supply
5% each
97.1%
100%
51%
49%
Car
Car
supply
Parts supply
supply
33.8%
Isuzu
European Japanese American
Daihatsu
in Europe
50%
Car supply
Toyota
Hino
Suzuki
Isuzu
Fuji
HondaHonda UK
DCM Mitsubishi
Nissan
Nissan D. Ford
AAIMazda
Ned Car
Volvo
Renault
Ford
VW NUMMI
GM
SIA
Honda USA
MMMA
DCM
766 • Case 25 • DaimlerChrysler for East Asia
been the subject of intense offers from GM, Ford, Daim-lerChrysler, and Renault. Recently Ford received exclusivenegotiation right from Daewoo’s creditors. Hyundai has alsotaken a stake in Kia Motors. Taiwanese manufacturers suf-fered less because of a lack of investment in manufacturingcapability, and lack of an export-driven market. Both domesticmarkets are getting mature (see Exhibits 12, 13, and 14).
EXHIBIT 12KOREAN PRODUCTION BYMAKE (THOUSAND CARS)
1997 1998
Hyundai 1,301 845Kia 614 363Daewoo 607 411Daewooshop 156 248Samsung 42Others 140 45
Total 2,818 1,954
EXHIBIT 13KOREAN MANUFACTURER’S ALLIANCESWITH WORLD MAJOR PLAYERS
10%
(Plan)
Alliances
100%
1.4%
Source: 1999 Nihon Jidosha Kogyo
American/European
DCM
GM
Renault
Hyundai
Kia
Daewoo
Samsung
Mitsubishi
Korean Japanese
ASEAN countries. Due to the Asian financial crisis in 1997,the production in ASEAN nations, consisting of Indonesia,Malaysia, Thailand, and India, decreased to 70 percent ofthe peak level recorded in 1996. It may take 3 to 5 yearsto recover to precrisis levels, even though each country isseeking to stimulate domestic demand by changing policiesfrom protectionism to liberalization. Japanese manufacturersdominate ASEAN countries, except Malaysia. However, themarkets still attract some major players due to the high growthpotential in these markets (see Exhibits 8 and 9 shown earlier).
China. Although most automotive manufacturers are inter-ested in the huge potential of the Chinese market, it willtake some time to penetrate into the market mainly due tothe Chinese government’s strict control. The government setspricing limitations and regulations on local content and tariffsto prevent ease of entry by outsiders. There are 2 to 3 big
groups and 6 to 7 middle size groups. The industry is notmature and the demand for trucks still strong (see Exhibit 15).
EXHIBIT 14TAIWANESE SALES
Capital Sales inAutomaker Participation 2000
China Motor (Mitsubishi) 14.6% 35,348Kuozui Hua Tung (Toyota) 46.6% 64,094Yue Loong (Nissan) 25.0% 72,733Lio Ho (Ford/Mazda) — 45,331San Yan (Honda) 13.5% 37,343
EXHIBIT 15CHINESE PRODUCTION (THOUSAND CARS)
Market1998 1999 Share Alliance
China First Auto 290 341 18.7%Shanghai Auto 236 257 14.0% GM/VWDongfeng Motor 191 206 11.2%Changan Auto 129 171 9.0% SuzukiTianjin Auto 155 115 7.0% ToyotaBeijing Auto 82 121 6.6%Others 559 605 33.5%
Total 1628 1830 100.0%
EAST ASIAN MARKET OVERVIEW
As outlined, the East Asian auto market is quite diverse. Inthis market several trends exist. First, there is the presence ofstrong regional players like those in Korea. Second, East Asiais home to several national car manufacturers like Malaysia’sProton. Third are the global brands and manufacturers inJapan that not only have a history of exporting to marketsin East Asia but also have long-standing technical and equitytie-ups throughout the region. Finally, until recently, is thetotal lack of any significant presence by major American orEuropean manufacturers in the area. This has allowed exist-ing regional players to consolidate their brand name and saleschannels in this market.
DAIMLERCHRYSLER’S STRATEGY FOR EAST ASIA
As Exhibit 16 shows, DaimlerChrysler’s vehicle platform andsales pattern are extremely weak in East Asia. The Asian cri-sis presented the opportunity to quickly change this withoutforcing DaimlerChrysler into investing in costly ground-upproduction and sales channel facilities, or an expensive acqui-sition. Initially DaimlerChrysler pursued Nissan, but fearover the actual extent of Nissan’s debt problems convincedSchrempp to pass on Nissan. Honda was also considered,but Honda’s desire to remain independent as well as thepotential for cultural differences scuttled the negotiations.Convinced of the need for a partner Daimler initiated discus-sions with Mitsubishi Motors in Japan. Mitsubishi seemed theoptimum partner due to its long-standing relationship withChrysler.
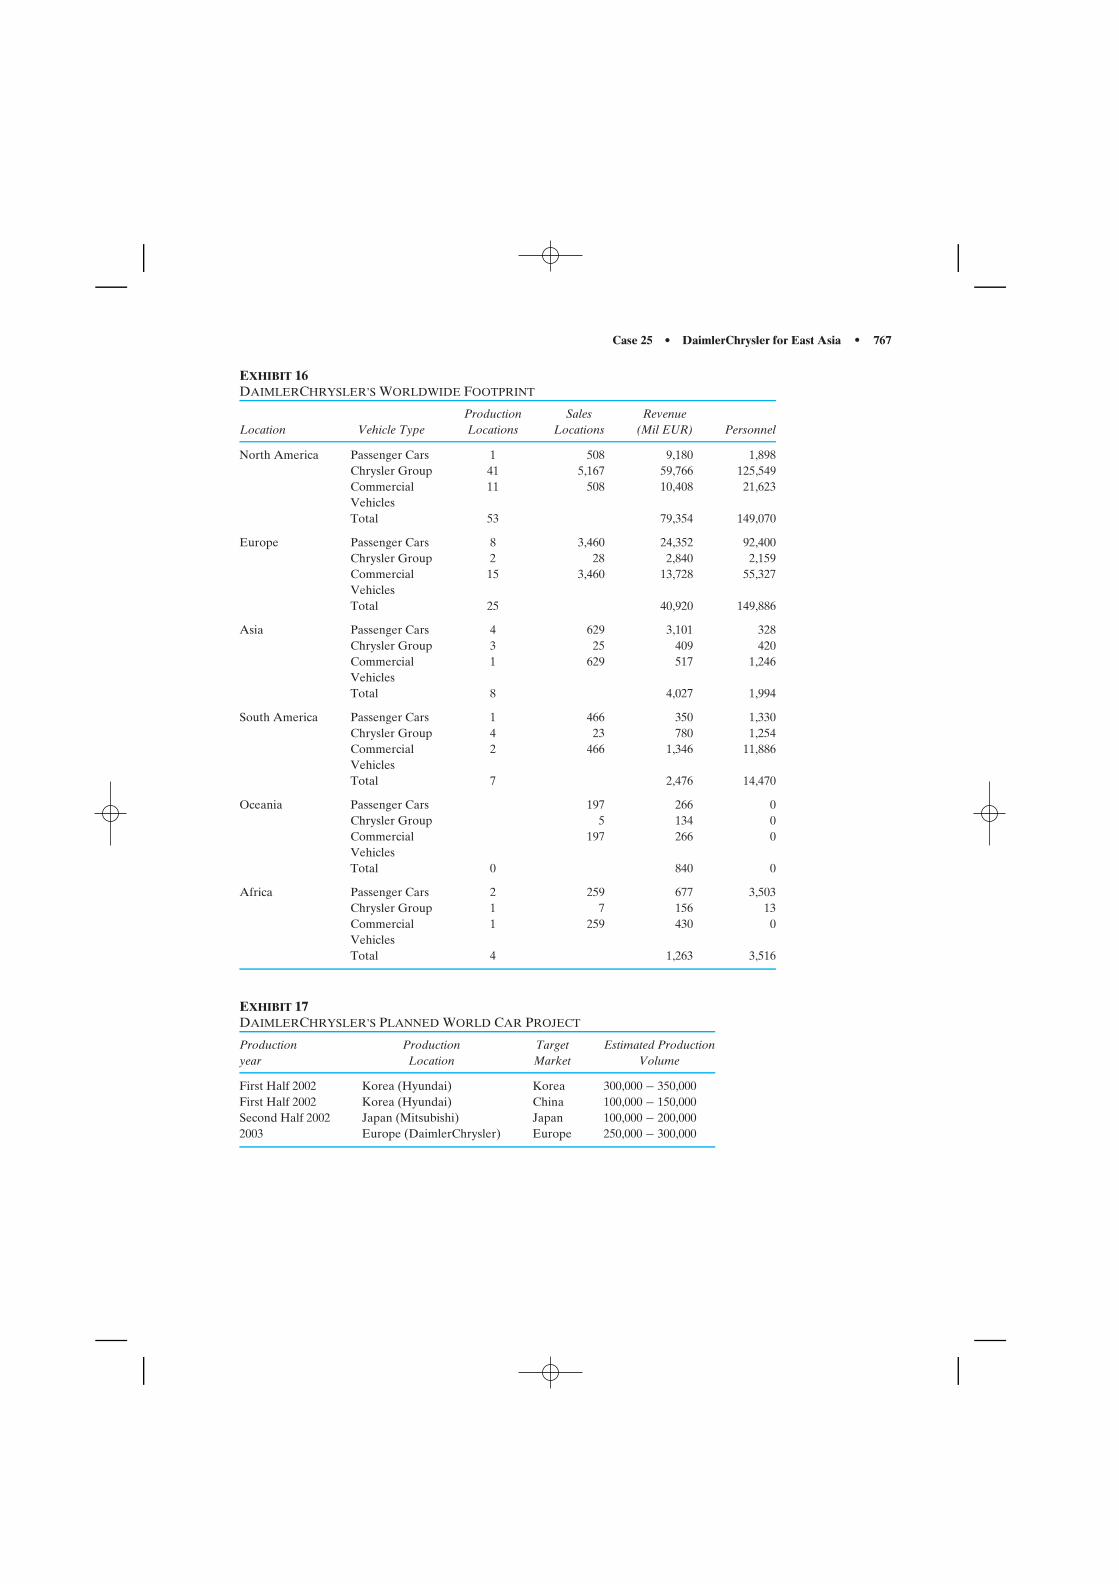
Case 25 • DaimlerChrysler for East Asia • 767
EXHIBIT 16DAIMLERCHRYSLER’S WORLDWIDE FOOTPRINT
Production Sales RevenueLocation Vehicle Type Locations Locations (Mil EUR) Personnel
North America Passenger Cars 1 508 9,180 1,898Chrysler Group 41 5,167 59,766 125,549Commercial 11 508 10,408 21,623VehiclesTotal 53 79,354 149,070
Europe Passenger Cars 8 3,460 24,352 92,400Chrysler Group 2 28 2,840 2,159Commercial 15 3,460 13,728 55,327VehiclesTotal 25 40,920 149,886
Asia Passenger Cars 4 629 3,101 328Chrysler Group 3 25 409 420Commercial 1 629 517 1,246VehiclesTotal 8 4,027 1,994
South America Passenger Cars 1 466 350 1,330Chrysler Group 4 23 780 1,254Commercial 2 466 1,346 11,886VehiclesTotal 7 2,476 14,470
Oceania Passenger Cars 197 266 0Chrysler Group 5 134 0Commercial 197 266 0VehiclesTotal 0 840 0
Africa Passenger Cars 2 259 677 3,503Chrysler Group 1 7 156 13Commercial 1 259 430 0VehiclesTotal 4 1,263 3,516
EXHIBIT 17DAIMLERCHRYSLER’S PLANNED WORLD CAR PROJECT
Production Production Target Estimated Productionyear Location Market Volume
First Half 2002 Korea (Hyundai) Korea 300,000 − 350,000First Half 2002 Korea (Hyundai) China 100,000 − 150,000Second Half 2002 Japan (Mitsubishi) Japan 100,000 − 200,0002003 Europe (DaimlerChrysler) Europe 250,000 − 300,000
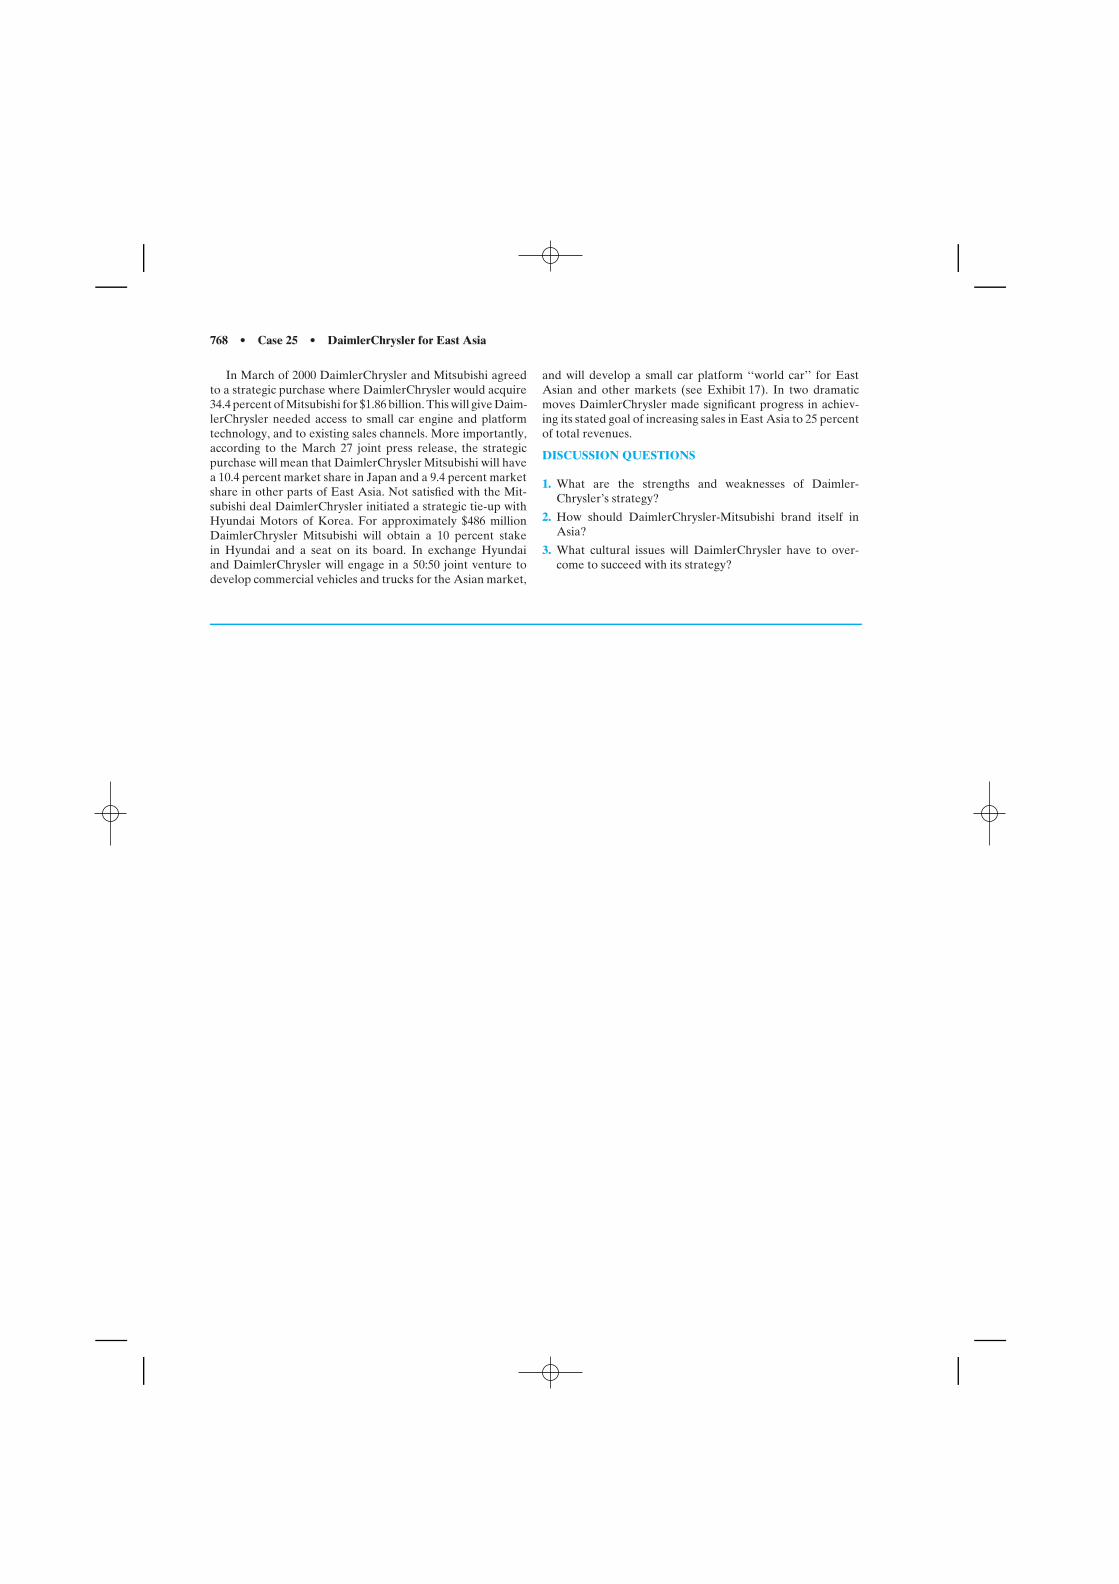
768 • Case 25 • DaimlerChrysler for East Asia
In March of 2000 DaimlerChrysler and Mitsubishi agreedto a strategic purchase where DaimlerChrysler would acquire34.4 percent of Mitsubishi for $1.86 billion. This will give Daim-lerChrysler needed access to small car engine and platformtechnology, and to existing sales channels. More importantly,according to the March 27 joint press release, the strategicpurchase will mean that DaimlerChrysler Mitsubishi will havea 10.4 percent market share in Japan and a 9.4 percent marketshare in other parts of East Asia. Not satisfied with the Mit-subishi deal DaimlerChrysler initiated a strategic tie-up withHyundai Motors of Korea. For approximately $486 millionDaimlerChrysler Mitsubishi will obtain a 10 percent stakein Hyundai and a seat on its board. In exchange Hyundaiand DaimlerChrysler will engage in a 50:50 joint venture todevelop commercial vehicles and trucks for the Asian market,
and will develop a small car platform ‘‘world car’’ for EastAsian and other markets (see Exhibit 17). In two dramaticmoves DaimlerChrysler made significant progress in achiev-ing its stated goal of increasing sales in East Asia to 25 percentof total revenues.
DISCUSSION QUESTIONS
1. What are the strengths and weaknesses of Daimler-Chrysler’s strategy?
2. How should DaimlerChrysler-Mitsubishi brand itself inAsia?
3. What cultural issues will DaimlerChrysler have to over-come to succeed with its strategy?