Embed Size (px)
Citation preview
Malaria, Other Vectorborne and Parasitic Diseases
WHO Western Pacific Regional Office
Sources: (i) Country reports to WHO, (ii) Country website, (iii) PPHSN and (iv) DengueNet
Last updated: 8 Sep 2011
Disclaimer: © World Health Organization. The boundaries and names shown and the designations used on this map do not imply the expression of an opinion whatsoever on the part of the World Health Organization concerning the legal status of any country, territory, city or area or of its authorities, or concerning the delimitation of its frontiers or boundaries.
Case Fatality Rates of Dengue Fever and Dengue
Haemorrhagic Fever (DF/DHF)in the Western Pacific Region,
2000-2010
Malaria, Other Vectorborne and Parasitic Diseases
WHO Western Pacific Regional Office
Sources: (i) Country reports to WHO, (ii) Country website, (iii) PPHSN and (iv) DengueNet
Last updated: 8 Sep 2011
Disclaimer: © World Health Organization. The boundaries and names shown and the designations used on this map do not imply the expression of an opinion whatsoever on the part of the World Health Organization concerning the legal status of any country, territory, city or area or of its authorities, or concerning the delimitation of its frontiers or boundaries.
Acknowledgement– Improved data gathering, reporting and surveillance are key to dengue
outbreak preparedness. All countries are encouraged to provide official, updated information to WHO or through other official venues (eg. DengueNet).
– Efforts were made to collect official national data from Member States on DF/DHF in the Western Pacific Region.
– The Regional Office would like to acknowledge the valuable collaboration provided by those countries which reported through our country offices or other official venues.
– Only country data from these Member States are reflected in the enclosed maps.
– Absence of information on some country maps does not necessarilymean absence of dengue cases in those countries.
Malaria, Other Vectorborne and Parasitic Diseases
WHO Western Pacific Regional Office
Sources: (i) Country reports to WHO, (ii) Country website, (iii) PPHSN and (iv) DengueNet
Last updated: 8 Sep 2011
Disclaimer: © World Health Organization. The boundaries and names shown and the designations used on this map do not imply the expression of an opinion whatsoever on the part of the World Health Organization concerning the legal status of any country, territory, city or area or of its authorities, or concerning the delimitation of its frontiers or boundaries.
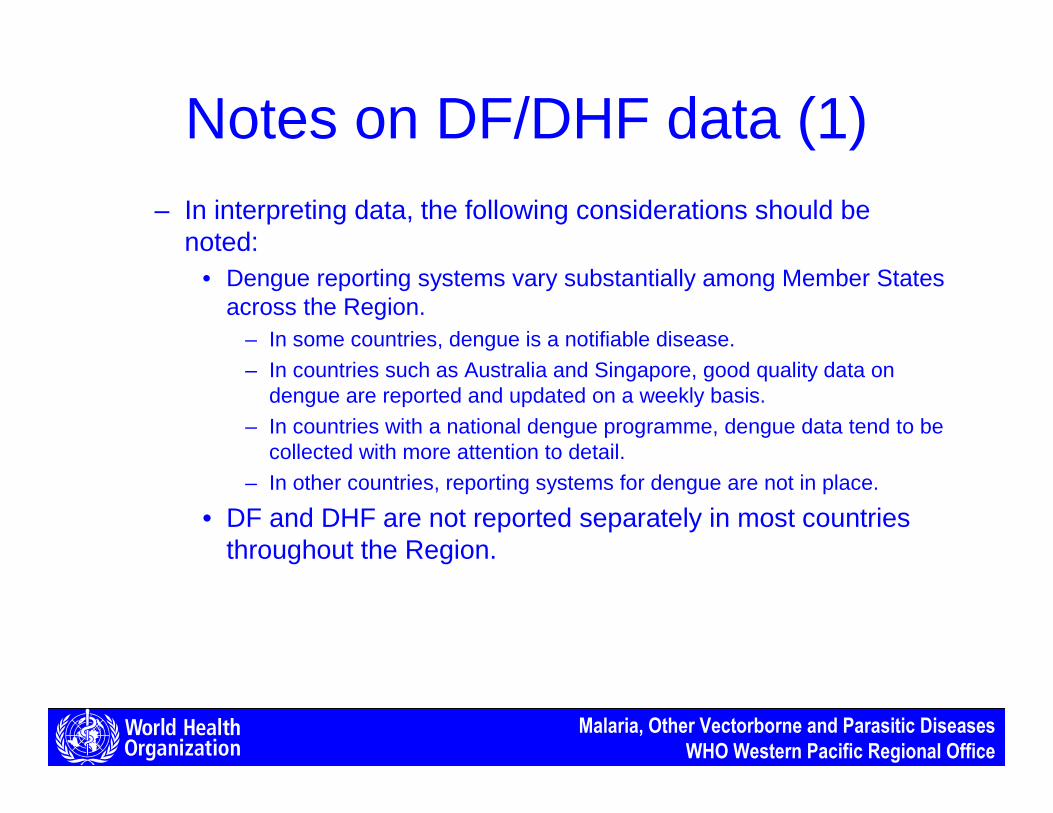
Notes on DF/DHF data (1)– In interpreting data, the following considerations should be
noted:• Dengue reporting systems vary substantially among Member States
across the Region. – In some countries, dengue is a notifiable disease.
– In countries such as Australia and Singapore, good quality data on dengue are reported and updated on a weekly basis.
– In countries with a national dengue programme, dengue data tend to be collected with more attention to detail.
– In other countries, reporting systems for dengue are not in place.
• DF and DHF are not reported separately in most countries throughout the Region.

Malaria, Other Vectorborne and Parasitic Diseases
WHO Western Pacific Regional Office
Sources: (i) Country reports to WHO, (ii) Country website, (iii) PPHSN and (iv) DengueNet
Last updated: 8 Sep 2011
Disclaimer: © World Health Organization. The boundaries and names shown and the designations used on this map do not imply the expression of an opinion whatsoever on the part of the World Health Organization concerning the legal status of any country, territory, city or area or of its authorities, or concerning the delimitation of its frontiers or boundaries.
Notes on DF/DHF data (2)– In interpreting data, the following considerations should be noted
(cont.):• Dengue cases are mostly reported in clinical settings. People with
few or no severe manifestations and/or less access to health care are also less likely to seek medical services and thus less likely to be counted by the health reporting system.
• It is believed that the DF/DHF data presented here are underestimated. The fraction which is reported by the health system varies among the countries and it does so at different levels, national, subnational and among population groups.
• The proportion of DF/DHF cases reported by the health systems could be small in:
– less developed countries;– rural areas; and– those with less access to health care services, e.g. the poor, the
uninsured people.

Malaria, Other Vectorborne and Parasitic Diseases
WHO Western Pacific Regional Office
Sources: (i) Country reports to WHO, (ii) Country website, (iii) PPHSN and (iv) DengueNet
Last updated: 8 Sep 2011
Disclaimer: © World Health Organization. The boundaries and names shown and the designations used on this map do not imply the expression of an opinion whatsoever on the part of the World Health Organization concerning the legal status of any country, territory, city or area or of its authorities, or concerning the delimitation of its frontiers or boundaries.
List of Countries and Areas
AMS American Samoa KOR Korea, Republic of PAL Palau
AUS Australia LAO Lao People's Democratic Republic PNG P apua New Guinea
BRU Brunei Darussalam MAC Macao (China) PHL Philippines
CAM Cambodia MAA Malaysia PTI Pitcairn Islands
CHN China MSI Marshall Islands SAM Samoa
COK Cook Islands MIC Micronesia, Federated States of SI N Singapore
FIJ Fiji MOG Mongolia SOL Solomon Islands
FRP French Polynesia NAU Nauru TOK Tokelau
GUM Guam NEC New Caledonia TON Tonga
HOK Hong Kong (China) NEZ New Zealand TUV Tuvalu
JPN Japan NIU Niue VAN Vanuatu
KIR Kiribati NMI Northern Mariana Islands, Commonwealth of the
VTN
WAF
Viet Nam
Wallis and Futuna

Malaria, Other Vectorborne and Parasitic Diseases
WHO Western Pacific Regional Office
Sources: (i) Country reports to WHO, (ii) Country website, (iii) PPHSN and (iv) DengueNet
Last updated: 8 Sep 2011
Disclaimer: © World Health Organization. The boundaries and names shown and the designations used on this map do not imply the expression of an opinion whatsoever on the part of the World Health Organization concerning the legal status of any country, territory, city or area or of its authorities, or concerning the delimitation of its frontiers or boundaries.
Dengue Case Fatality Rate (*)
in the Western Pacific Region, 2010
No data0 (if zero figure)0.01 - 0.090.10 - 0.490.50 - 0.991.00 - 4.995.0 and more
0
(*) Case Fatality Rate per 100 DF/DHF cases
MAA, 0.29
VTN, 0.04
CAM, 0.30
PHL, 0.59LAO, 0.20
MIC, 4.35
SIN, 0.11
BRU, 0.67
VAN, 0
KIR, 0
FRP, 0
AUS, 0
AMS, 0
COK, 0
GUM, 0
NAU, 0
NMI, 0
SOL, 0
TUV, 0
NEZ, 0

Malaria, Other Vectorborne and Parasitic Diseases
WHO Western Pacific Regional Office
Sources: (i) Country reports to WHO, (ii) Country website, (iii) PPHSN and (iv) DengueNet
Last updated: 8 Sep 2011
Disclaimer: © World Health Organization. The boundaries and names shown and the designations used on this map do not imply the expression of an opinion whatsoever on the part of the World Health Organization concerning the legal status of any country, territory, city or area or of its authorities, or concerning the delimitation of its frontiers or boundaries.
MAA, 0.21
VTN, 0.08
CAM, 0.32
Dengue Case Fatality Rate (*)
in the Western Pacific Region, 2009
No data0 (if zero figure)0.01 - 0.090.10 - 0.490.50 - 0.991.00 - 4.995.0 and more
0
(*) Case Fatality Rate per 100 DF/DHF cases
PHL, 0.95LAO, 0.17
NEC, 0.05
SIN, 0.18

Malaria, Other Vectorborne and Parasitic Diseases
WHO Western Pacific Regional Office
Sources: (i) Country reports to WHO, (ii) Country website, (iii) PPHSN and (iv) DengueNet
Last updated: 8 Sep 2011
Disclaimer: © World Health Organization. The boundaries and names shown and the designations used on this map do not imply the expression of an opinion whatsoever on the part of the World Health Organization concerning the legal status of any country, territory, city or area or of its authorities, or concerning the delimitation of its frontiers or boundaries.
VTN, 0.10
LAO, 0.51
CAM, 0.68
MAA, 0.23
PHL, 0.94
TON, 1.03
AMS, 0.15
PAL, 0.49
NEC, 0.08
Dengue Case Fatality Rate (*)
in the Western Pacific Region, 2008
No data0 (if zero figure)0.01 - 0.090.10 - 0.490.50 - 0.991.00 - 4.995.0 and more
0
(*) Case Fatality Rate per 100 DF/DHF cases
SMA, 0.15

Malaria, Other Vectorborne and Parasitic Diseases
WHO Western Pacific Regional Office
Sources: (i) Country reports to WHO, (ii) Country website, (iii) PPHSN and (iv) DengueNet
Last updated: 8 Sep 2011
Disclaimer: © World Health Organization. The boundaries and names shown and the designations used on this map do not imply the expression of an opinion whatsoever on the part of the World Health Organization concerning the legal status of any country, territory, city or area or of its authorities, or concerning the delimitation of its frontiers or boundaries.
VTN, 0.08
LAO, 0.08
CAM, 1.02
MAA, 0.20
PHL, 0.96
SIN, 0.27
FRP, 0.05
AMS, 1.59
PAL, 1.25
MIC, 16.67
Dengue Case Fatality Rate (*)
in the Western Pacific Region, 2007
No data0 (if zero figure)0.01 - 0.090.10 - 0.490.50 - 0.991.00 - 4.995.0 and more
0
(*) Case Fatality Rate per 100 DF/DHF cases

Malaria, Other Vectorborne and Parasitic Diseases
WHO Western Pacific Regional Office
Sources: (i) Country reports to WHO, (ii) Country website, (iii) PPHSN and (iv) DengueNet
Last updated: 8 Sep 2011
Disclaimer: © World Health Organization. The boundaries and names shown and the designations used on this map do not imply the expression of an opinion whatsoever on the part of the World Health Organization concerning the legal status of any country, territory, city or area or of its authorities, or concerning the delimitation of its frontiers or boundaries.
VTN, 0.08
LAO, 0.09
CAM, 0.95
MAA, 0.23
PHL, 1.02
BRU, 0.00
CHN, 0.00
MAC, 0.00
MOG, 0.00
SIN, 0.32
AMS, 0.00
AUS, 0.00
COK, 0.00
FRP, 0.00
KIR, 0.00
MSI, 0.00
VAN, 0.00
Dengue Case Fatality Rate (*)
in the Western Pacific Region, 2006
No data0 (if zero figure)0.01 - 0.090.10 - 0.490.50 - 0.991.00 - 4.995.0 and more
0
(*) Case Fatality Rate per 100 DF/DHF cases
Malaria, Other Vectorborne and Parasitic Diseases
WHO Western Pacific Regional Office
Sources: (i) Country reports to WHO, (ii) Country website, (iii) PPHSN and (iv) DengueNet
Last updated: 8 Sep 2011
Disclaimer: © World Health Organization. The boundaries and names shown and the designations used on this map do not imply the expression of an opinion whatsoever on the part of the World Health Organization concerning the legal status of any country, territory, city or area or of its authorities, or concerning the delimitation of its frontiers or boundaries.
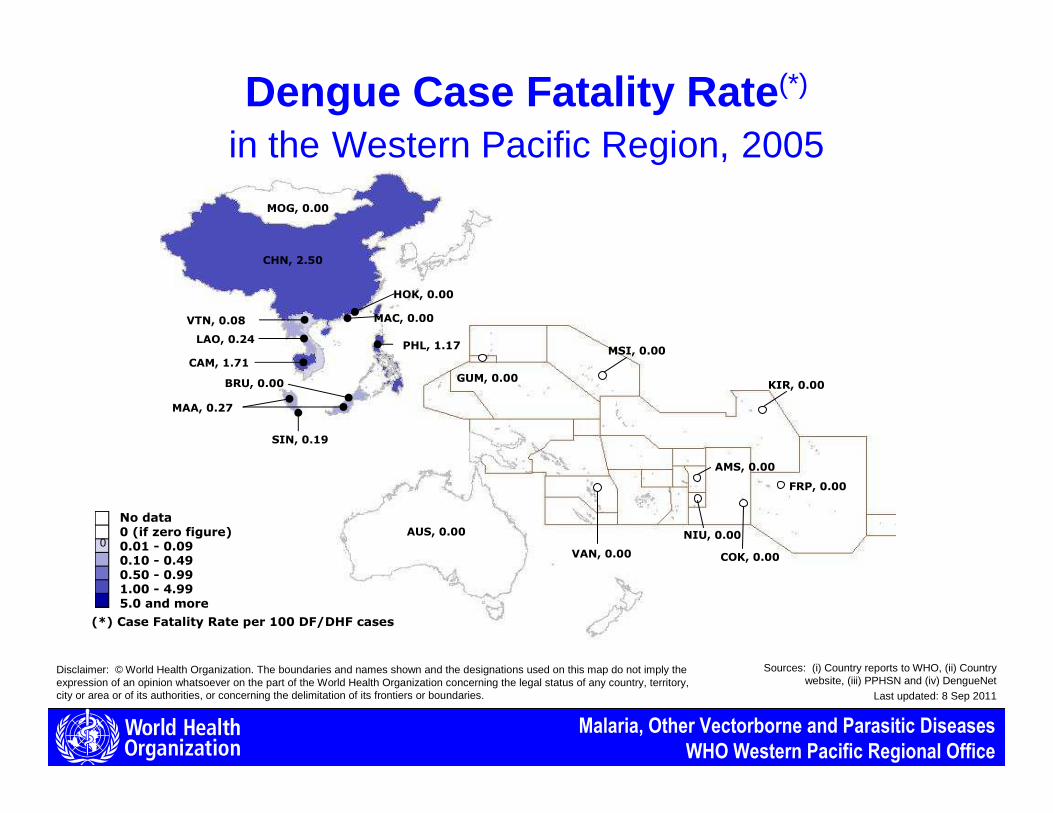
BRU, 0.00
MAA, 0.27
SIN, 0.19
PHL, 1.17
VTN, 0.08
LAO, 0.24
CAM, 1.71
MOG, 0.00
CHN, 2.50
MAC, 0.00
HOK, 0.00
VAN, 0.00
NIU, 0.00
MSI, 0.00
KIR, 0.00GUM, 0.00
FRP, 0.00
COK, 0.00
AUS, 0.00
AMS, 0.00
Dengue Case Fatality Rate (*)
in the Western Pacific Region, 2005
No data0 (if zero figure)0.01 - 0.090.10 - 0.490.50 - 0.991.00 - 4.995.0 and more
0
(*) Case Fatality Rate per 100 DF/DHF cases
Malaria, Other Vectorborne and Parasitic Diseases
WHO Western Pacific Regional Office
Sources: (i) Country reports to WHO, (ii) Country website, (iii) PPHSN and (iv) DengueNet
Last updated: 8 Sep 2011
Disclaimer: © World Health Organization. The boundaries and names shown and the designations used on this map do not imply the expression of an opinion whatsoever on the part of the World Health Organization concerning the legal status of any country, territory, city or area or of its authorities, or concerning the delimitation of its frontiers or boundaries.
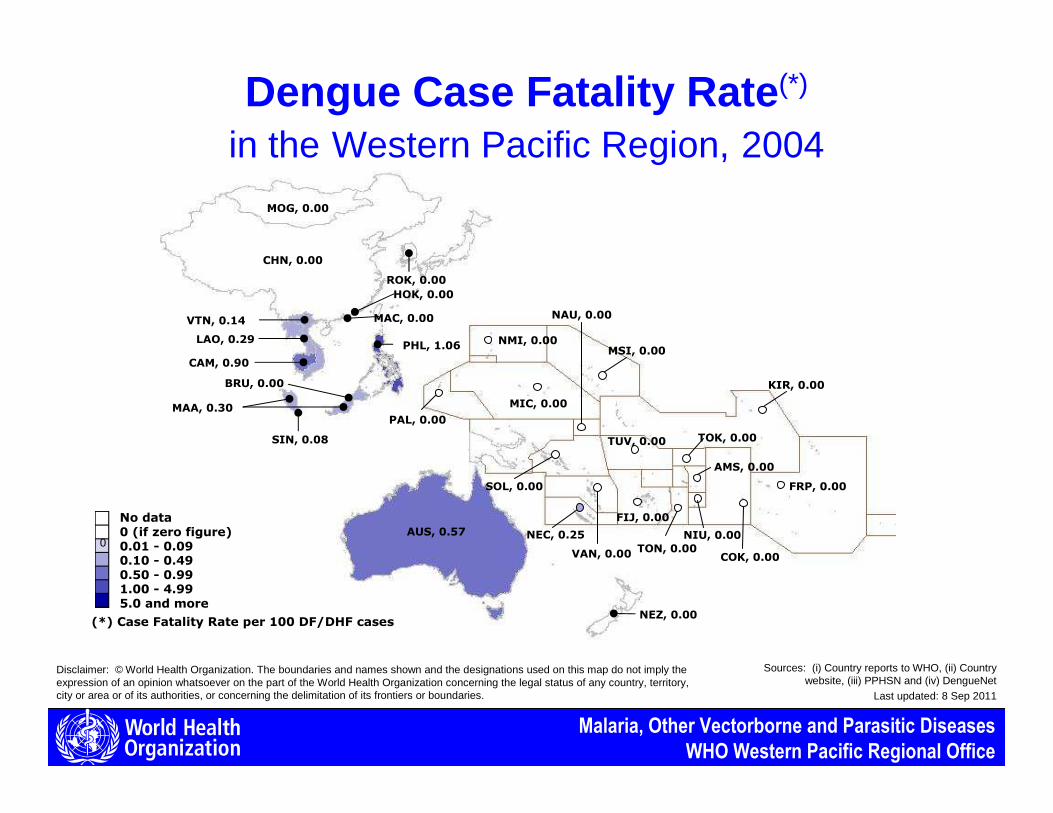
BRU, 0.00
MAA, 0.30
SIN, 0.08
PHL, 1.06
VTN, 0.14
LAO, 0.29
CAM, 0.90
MOG, 0.00
CHN, 0.00
MAC, 0.00
HOK, 0.00
ROK, 0.00
VAN, 0.00
NIU, 0.00
MSI, 0.00
KIR, 0.00
FRP, 0.00
COK, 0.00
AMS, 0.00
AUS, 0.57
FIJ, 0.00
MIC, 0.00
NAU, 0.00
NEC, 0.25
NEZ, 0.00
NMI, 0.00
PAL, 0.00
SOL, 0.00
TOK, 0.00
TON, 0.00
TUV, 0.00
Dengue Case Fatality Rate (*)
in the Western Pacific Region, 2004
No data0 (if zero figure)0.01 - 0.090.10 - 0.490.50 - 0.991.00 - 4.995.0 and more
0
(*) Case Fatality Rate per 100 DF/DHF cases
Malaria, Other Vectorborne and Parasitic Diseases
WHO Western Pacific Regional Office
Sources: (i) Country reports to WHO, (ii) Country website, (iii) PPHSN and (iv) DengueNet
Last updated: 8 Sep 2011
Disclaimer: © World Health Organization. The boundaries and names shown and the designations used on this map do not imply the expression of an opinion whatsoever on the part of the World Health Organization concerning the legal status of any country, territory, city or area or of its authorities, or concerning the delimitation of its frontiers or boundaries.
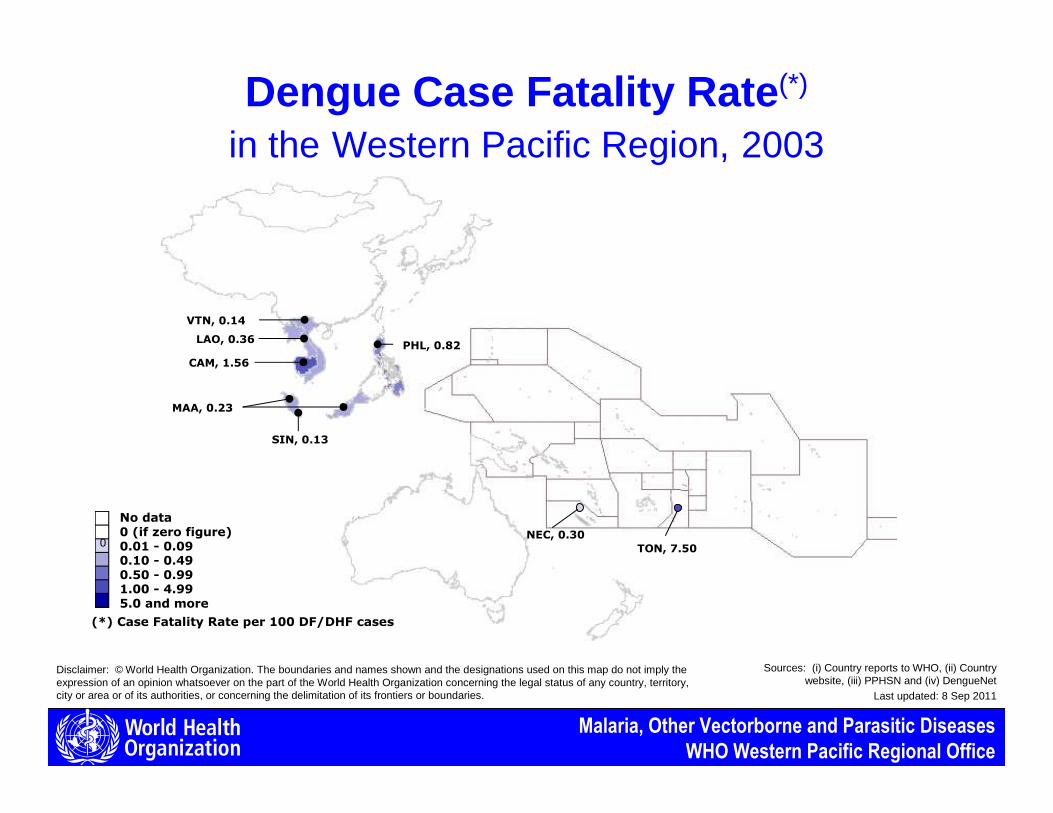
VTN, 0.14
LAO, 0.36
CAM, 1.56
MAA, 0.23
PHL, 0.82
TON, 7.50
NEC, 0.30
Dengue Case Fatality Rate (*)
in the Western Pacific Region, 2003
No data0 (if zero figure)0.01 - 0.090.10 - 0.490.50 - 0.991.00 - 4.995.0 and more
0
(*) Case Fatality Rate per 100 DF/DHF cases
SIN, 0.13

Malaria, Other Vectorborne and Parasitic Diseases
WHO Western Pacific Regional Office
Sources: (i) Country reports to WHO, (ii) Country website, (iii) PPHSN and (iv) DengueNet
Last updated: 8 Sep 2011
Disclaimer: © World Health Organization. The boundaries and names shown and the designations used on this map do not imply the expression of an opinion whatsoever on the part of the World Health Organization concerning the legal status of any country, territory, city or area or of its authorities, or concerning the delimitation of its frontiers or boundaries.
VTN, 0.16
LAO, 0.24
CAM, 1.23
MAA, 0.30
PHL, 1.09
Dengue Case Fatality Rate (*)
in the Western Pacific Region, 2002
No data0 (if zero figure)0.01 - 0.090.10 - 0.490.50 - 0.991.00 - 4.995.0 and more
0
(*) Case Fatality Rate per 100 DF/DHF cases
SIN, 0.15
SOL, 13.33
VAN, 6.67
Malaria, Other Vectorborne and Parasitic Diseases
WHO Western Pacific Regional Office
Sources: (i) Country reports to WHO, (ii) Country website, (iii) PPHSN and (iv) DengueNet
Last updated: 8 Sep 2011
Disclaimer: © World Health Organization. The boundaries and names shown and the designations used on this map do not imply the expression of an opinion whatsoever on the part of the World Health Organization concerning the legal status of any country, territory, city or area or of its authorities, or concerning the delimitation of its frontiers or boundaries.
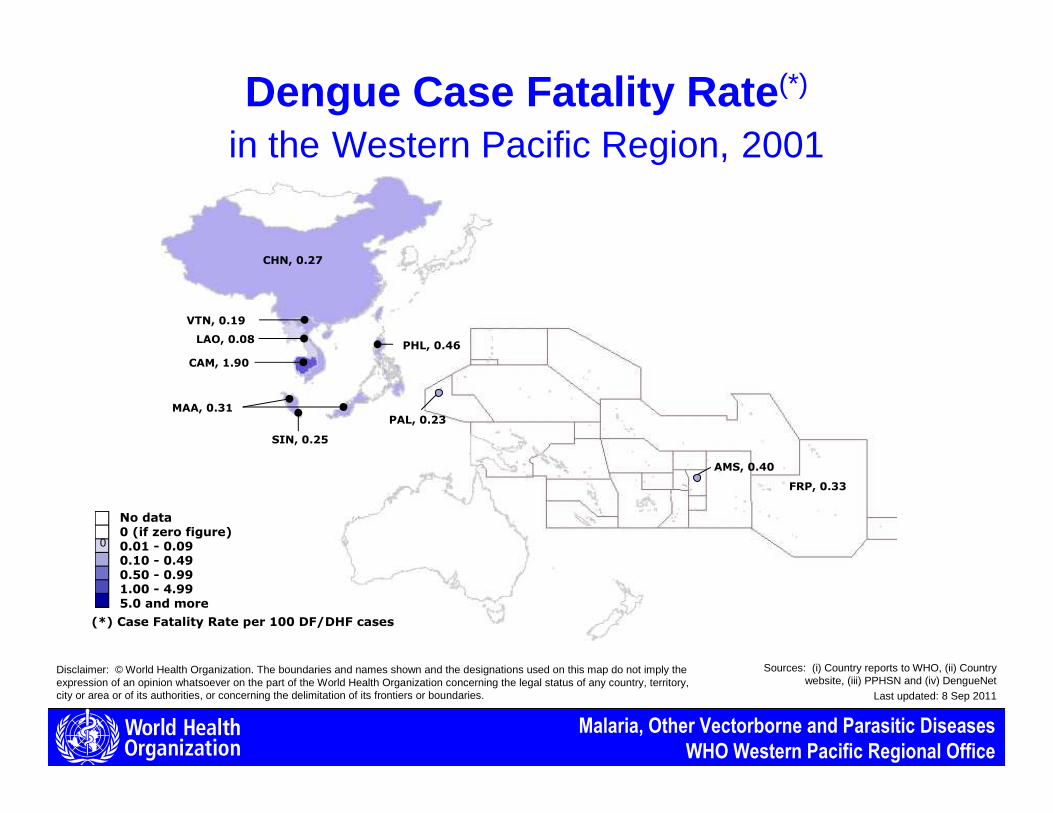
VTN, 0.19
LAO, 0.08
CAM, 1.90
MAA, 0.31
PHL, 0.46
AMS, 0.40
PAL, 0.23
Dengue Case Fatality Rate (*)
in the Western Pacific Region, 2001
No data0 (if zero figure)0.01 - 0.090.10 - 0.490.50 - 0.991.00 - 4.995.0 and more
0
(*) Case Fatality Rate per 100 DF/DHF cases
CHN, 0.27
SIN, 0.25
FRP, 0.33
Malaria, Other Vectorborne and Parasitic Diseases
WHO Western Pacific Regional Office
Sources: (i) Country reports to WHO, (ii) Country website, (iii) PPHSN and (iv) DengueNet
Last updated: 8 Sep 2011
Disclaimer: © World Health Organization. The boundaries and names shown and the designations used on this map do not imply the expression of an opinion whatsoever on the part of the World Health Organization concerning the legal status of any country, territory, city or area or of its authorities, or concerning the delimitation of its frontiers or boundaries.
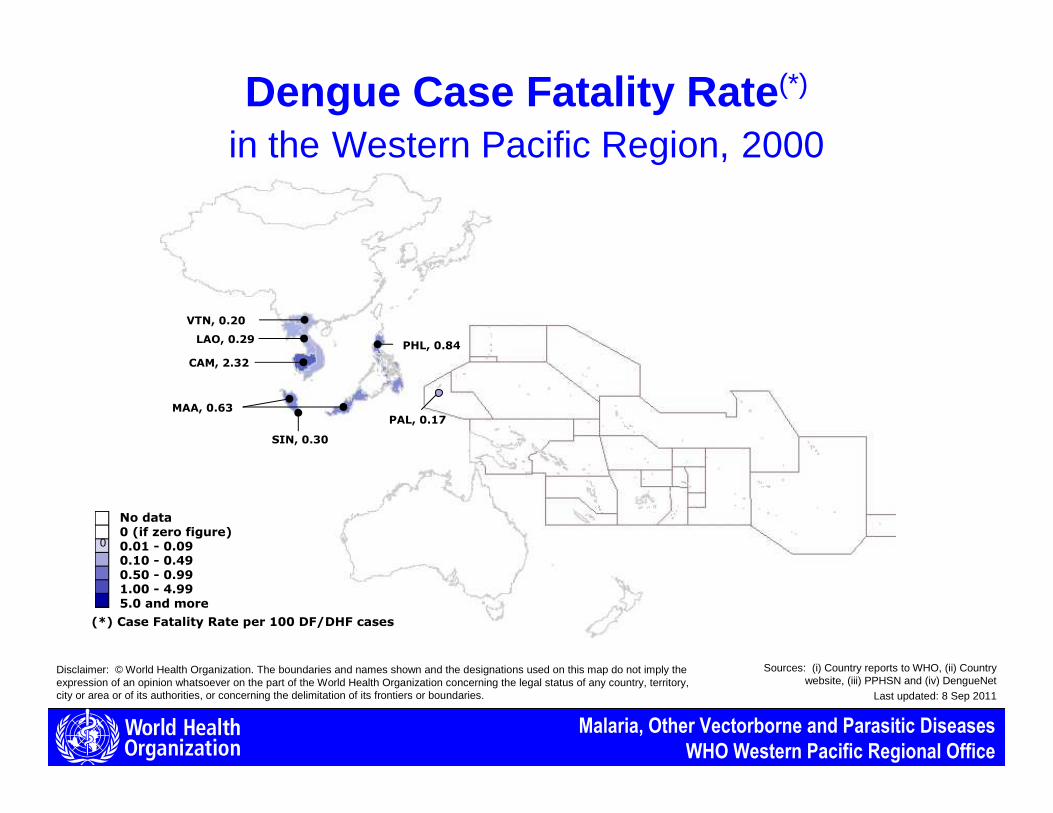
VTN, 0.20
LAO, 0.29
CAM, 2.32
MAA, 0.63
PHL, 0.84
PAL, 0.17
Dengue Case Fatality Rate (*)
in the Western Pacific Region, 2000
No data0 (if zero figure)0.01 - 0.090.10 - 0.490.50 - 0.991.00 - 4.995.0 and more
0
(*) Case Fatality Rate per 100 DF/DHF cases
SIN, 0.30
![Dengue Fever/Severe Dengue Fever/Chikungunya Fever · Dengue fever and severe dengue (dengue hemorrhagic fever [DHF] and dengue shock syndrome [DSS]) are caused by any of four closely](https://img.pdfslide.us/doc/110x75/5e87bf3e7a86e85d3b149cd7/dengue-feversevere-dengue-feverchikungunya-dengue-fever-and-severe-dengue-dengue.jpg)