Embed Size (px)
Citation preview
Case Costing and Advanced Benchmarking forAmbulatory Surgery Centers
presents . . .
2:00 p.m.–3:15 p.m. (Eastern)1:00 p.m.–2:15 p.m. (Central)
12:00 p.m.–1:15 p.m. (Mountain)11:00 a.m.–12:15 p.m. (Pacific)
90-minute audio conference
August 6, 2008
2
The Case Costing and Advanced Benchmarking for Ambulatory Surgery Centers audio conference materials package is provided by ASC Communications, 315 Vernon Ave, Glencoe, IL 60022.
Copyright 2008, ASC Communications.
Attendance at the audio conference is restricted to employees, consultants and members of the medical staff of the attendee.
The audio conference materials are intended solely for use in conjunction with the associated ASC Communications audio conference. You may make copies of these materials for your internal use by attendees of the audio conference only. All such copies must bear this message. Dissemination of any information in these materials or the audio conference to any party other than the attendee or its employees is strictly prohibited.
Advice given is general, and attendees and readers of the materials should consult professional counsel for specific legal, ethical or clinical questions.
For more information, contactASC Communications315 Vernon Ave, Glencoe, IL 60022Phone: (800) 417-2035 E-mail: [email protected] site: www.beckersasc.com
3
Welcome!
We are pleased that you have chosen to set aside a part of your day and join us for our Case Costing and Advanced Benchmarking for Ambulatory Surgery Centers audio conference with Ann Geier and Susan Kizirian. We are sure you will find the conference educational and worth your time, and we encourage you to take advantage of the opportunity to ask our experts your questions during the audio conference.
If you would like to submit a question before the audio conference, please send it to [email protected]. Although we cannot guarantee your question will be answered during the program due to time constrictions, we will include it if time permits.
If you have comments, suggestions or ideas about how we might improve our audio conferences, or if you have any questions about the audio conference itself, please do not hesitate to contact me.
Thanks again for taking part in this program.
Sincerely,Robert KurtzDirector of CommunicationsPhone: (410) [email protected]
315 Vernon AveGlencoe, IL 60022
Web site: www.beckersasc.com
4
Speaker bios . . . . . . . . . . . . . . . . . . . . . . . . . . . . . . . . . . . . . . . . 5
Presentation . . . . . . . . . . . . . . . . . . . . . . . . . . . . . . . . . . . . . . . . 6
Speaker contact information . . . . . . . . . . . . . . . . . . . . . . . . . . . . . . . 108
Contents
5
Speaker bios
Ann Geier, RN, MS, CNOR, CASC, is the vice president of operations for Ambulatory Surgical Centers of America (ASCOA). She has worked in ASCs since the mid-80’s. In her various roles, she has worked with controlling costs while maintaining the quality of care provided to patients. Ms. Geier is currently involved on a national level with the Ambulatory Surgery Foundation (ASF), AORN and the ASC Quality Collaboration Expert Group in setting standards for quality of care strategies. She teaches in the AORN Ambulatory Surgery Manager’s Certificate Program twice a year and teaches the annual financial management for Ambulatory Surgery Managers course. Ms. Geier is also on the AORN PNDS Data User Base task force, is a surveyor for AAAHC and speaks at national and regional meetings several times a year.
Susan Kizirian, RN, MBA, is the chief operating officer for ASCOA. Ms. Kizirian has more than 17 years experience in all aspects of ASC operations, serving as executive director and as a consultant for ASC management and development. Most recently, Ms. Kizirian worked with the University of Virginia Health System ASC program. Additionally, she has 15 years of practice management experience and eight years of expertise with clinical site research. She currently serves as lifetime past president emeritus on the board of directors of the Florida Society of Ambulatory Surgery Centers, and is past treasurer of the American Association of Ambulatory Surgery Centers and past president of the Ambulatory Surgery Management Society of the Medical Group Management Association.
6
by Ann Geier and Susan Kizirian
Presentation
77
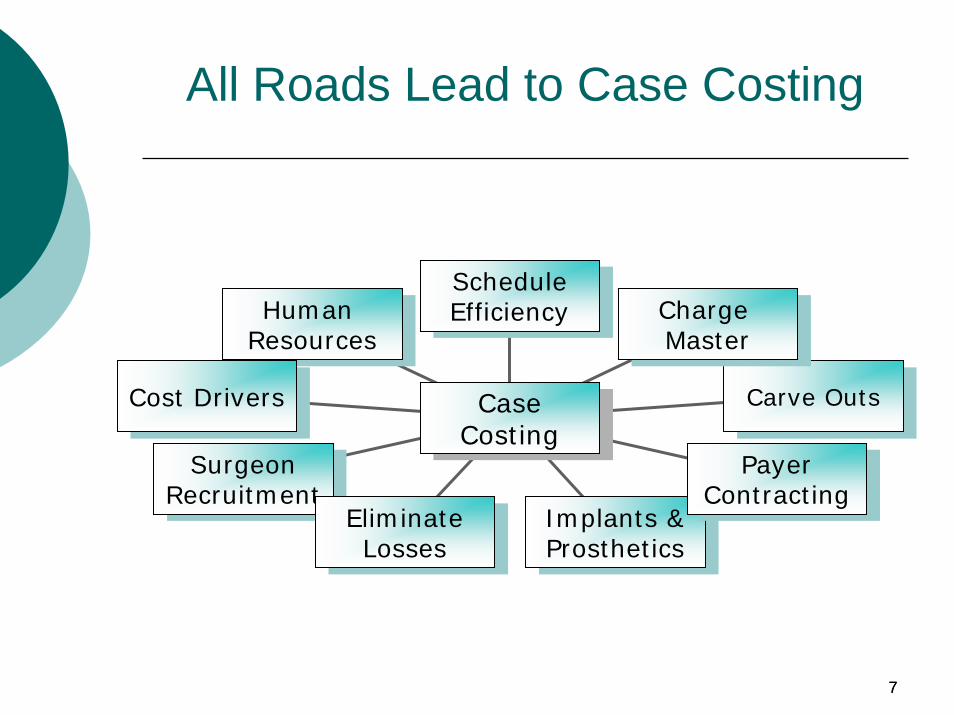
All Roads Lead to Case Costing
Human ResourcesHuman
Resources
Cost DriversCost Drivers
SurgeonRecruitmentSurgeon
RecruitmentEliminate Losses
Eliminate Losses
Implants & Prosthetics
Implants & Prosthetics
Payer Contracting
Payer Contracting
Carve OutsCarve Outs
Charge Master
Charge Master
Schedule Efficiency
Schedule Efficiency
Case CostingCase
Costing
88
Why Do Case Costing?
Hone strategic plans
Highlight possible opportunities & problem areas
Address cost and revenue sources to maximize your bottom line
Benchmark your costs against other ASCs
99
Historical: Cost Setting Initiatives
Medicare – ASC vs. OPPS
ChargesCost SurveysAPCs
Milliman – 1991 selected cases
1010
Medicare
Fee Schedule – Origination1980 - Based on Cost extrapolations from hospital dataCMS (then HCFA) required to perform cost survey every 5 years (Current Rates rebased in 1990 based on 1986 cost survey plus periodic adjustment for inflation)
35% of fee is Labor – with adjustor65% of fee is OverheadLast cost survey 1994 – Data not useableAttempted cost survey in 1998—tabled
1111
How CMS Determined ASC Costs
The Report of the Conference Committee accompanying section 934 of the Omnibus Budget Reconciliation Act of 1980 (Public Law 96–499), which enacted the ASC benefit in December 1980
‘‘This overhead factor is expected to be calculated on a prospective basis utilizing sample survey and similar techniques to establish reasonable estimated overhead allowances for each of the listed procedures which take account of volume (within reasonable limits).’’ (See H.R. Rep. No 1479, 96th Cong., 2nd Sess. 134 (1980).)
1212
Medicare
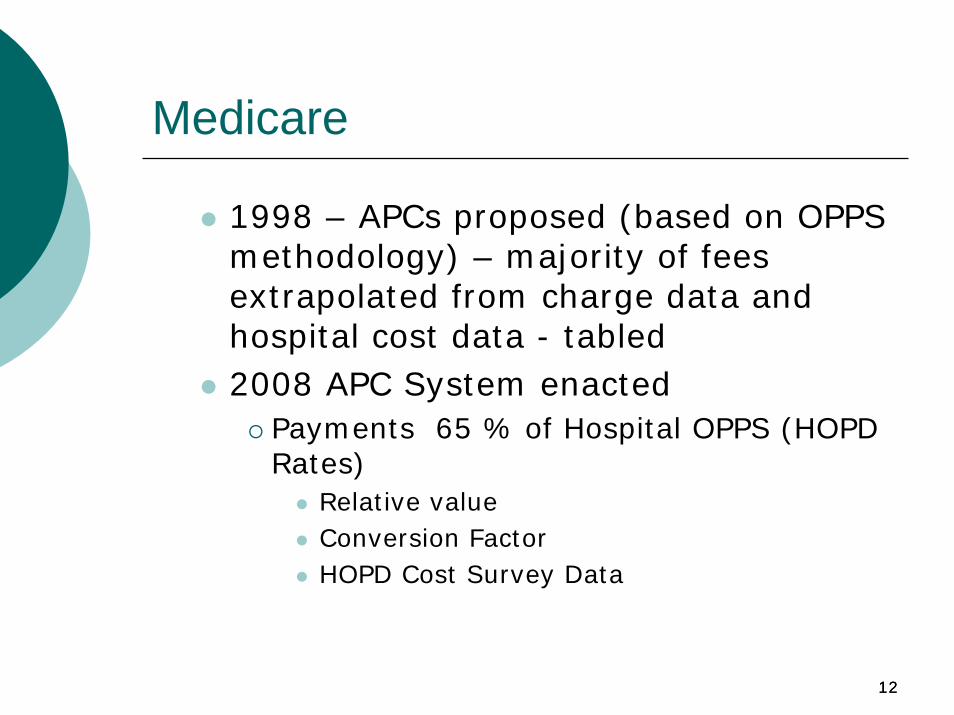
1998 – APCs proposed (based on OPPS methodology) – majority of fees extrapolated from charge data and hospital cost data - tabled 2008 APC System enacted
Payments 65 % of Hospital OPPS (HOPD Rates)
Relative valueConversion FactorHOPD Cost Survey Data
13
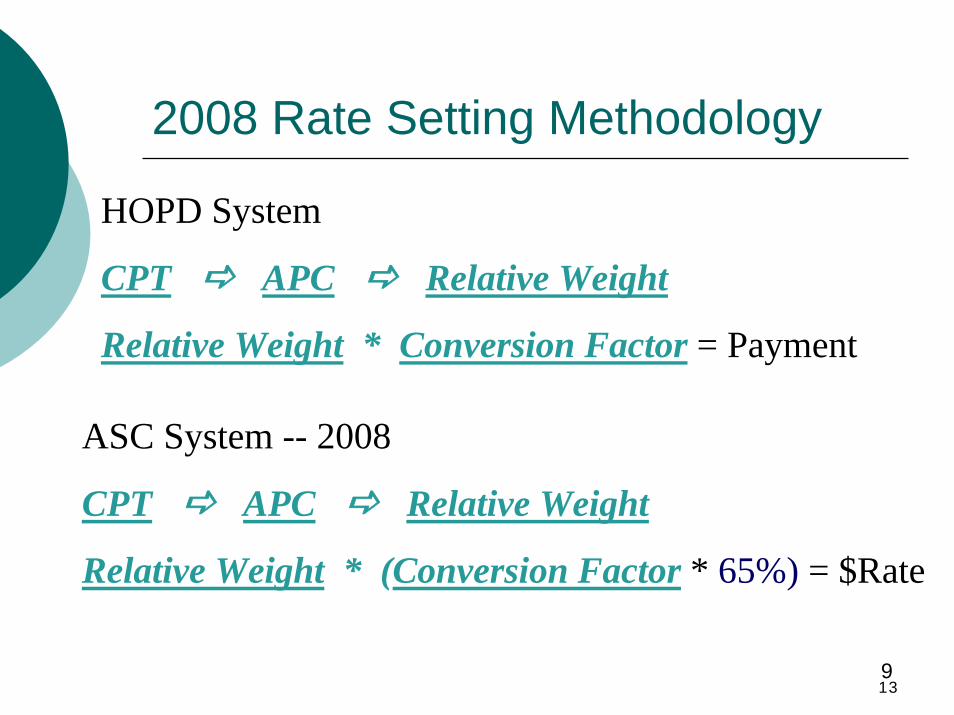
2008 Rate Setting Methodology
HOPD System
CPT APC Relative Weight
Relative Weight * Conversion Factor = Payment
ASC System -- 2008
CPT APC Relative Weight
Relative Weight * (Conversion Factor * 65%) = $Rate
9
14
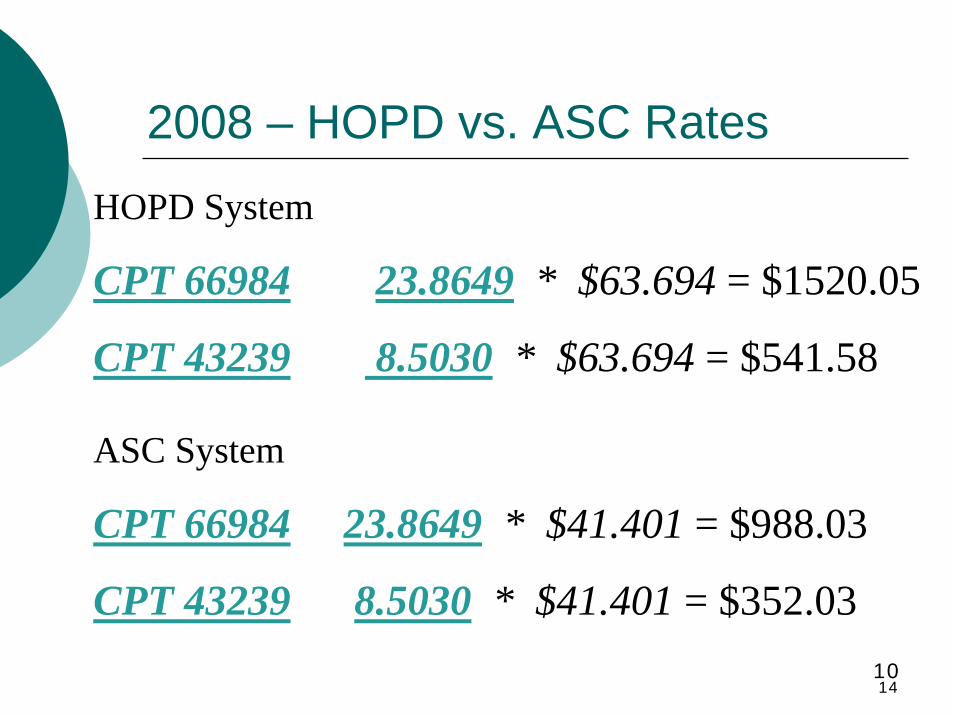
2008 – HOPD vs. ASC Rates
HOPD System
CPT 66984 23.8649 * $63.694 = $1520.05
CPT 43239 8.5030 * $63.694 = $541.58
ASC System
CPT 66984 23.8649 * $41.401 = $988.03
CPT 43239 8.5030 * $41.401 = $352.0310
1515
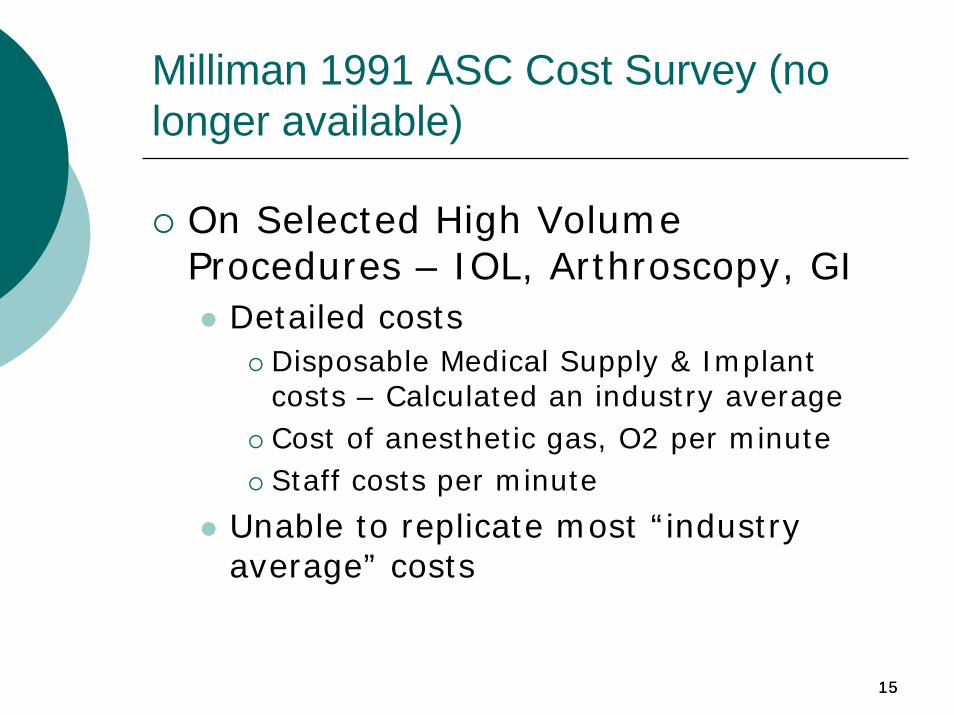
Milliman 1991 ASC Cost Survey (no longer available)
On Selected High Volume Procedures – IOL, Arthroscopy, GI
Detailed costsDisposable Medical Supply & Implant costs – Calculated an industry averageCost of anesthetic gas, O2 per minuteStaff costs per minute
Unable to replicate most “industry average” costs
1616
Charges
1717
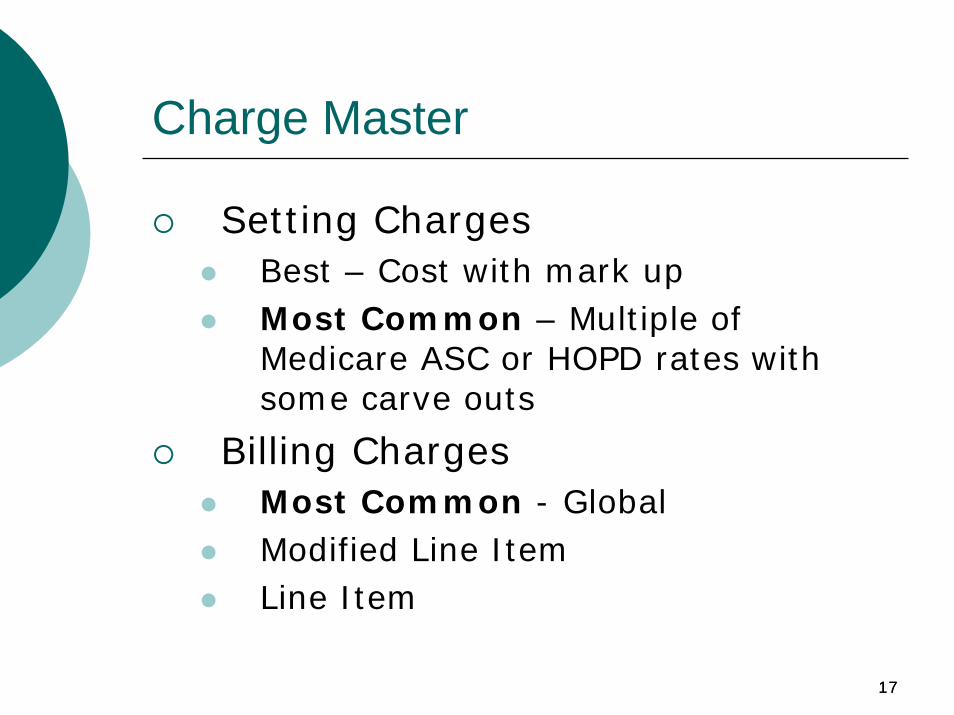
Charge Master
Setting ChargesBest – Cost with mark upMost Common – Multiple of Medicare ASC or HOPD rates with some carve outs
Billing ChargesMost Common - Global Modified Line ItemLine Item
1818
Reimbursement
1919
Reimbursement
Reimbursement SchedulesMedicare Medicare Like Fee for ServiceOut of Network
2020
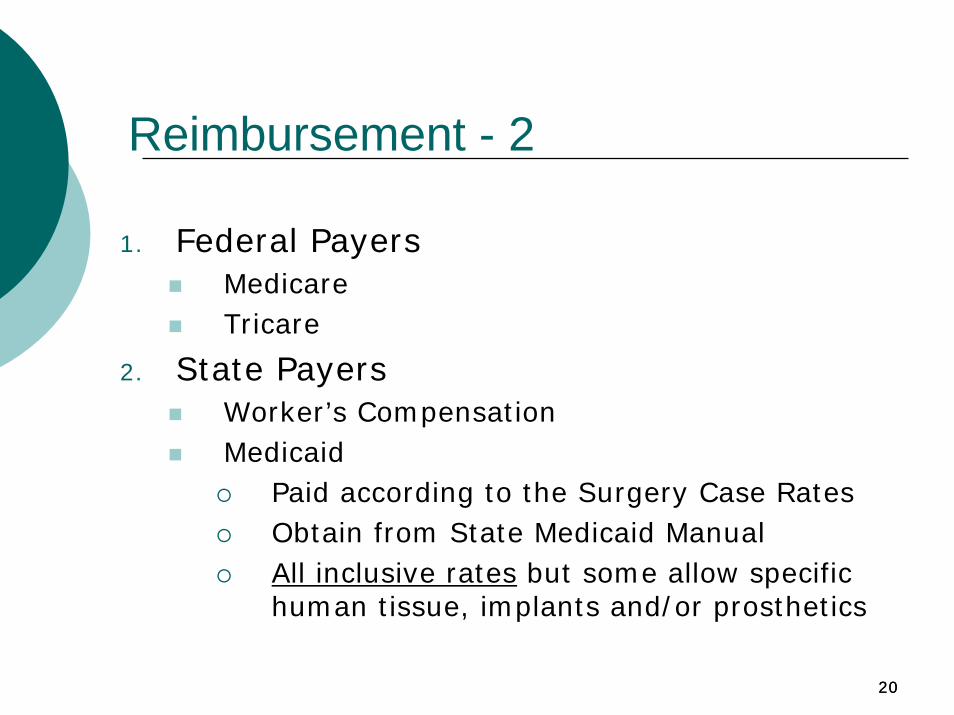
Reimbursement - 2
1. Federal Payers Medicare Tricare
2. State Payers Worker’s CompensationMedicaid
Paid according to the Surgery Case RatesObtain from State Medicaid Manual All inclusive rates but some allow specific human tissue, implants and/or prosthetics
2121
Reimbursement - 3
3. Commercial - Have own rate setting methodologies
Most follow closely to Medicare’s leadIn some cases, Commercial plans pay less than Medicare
2222
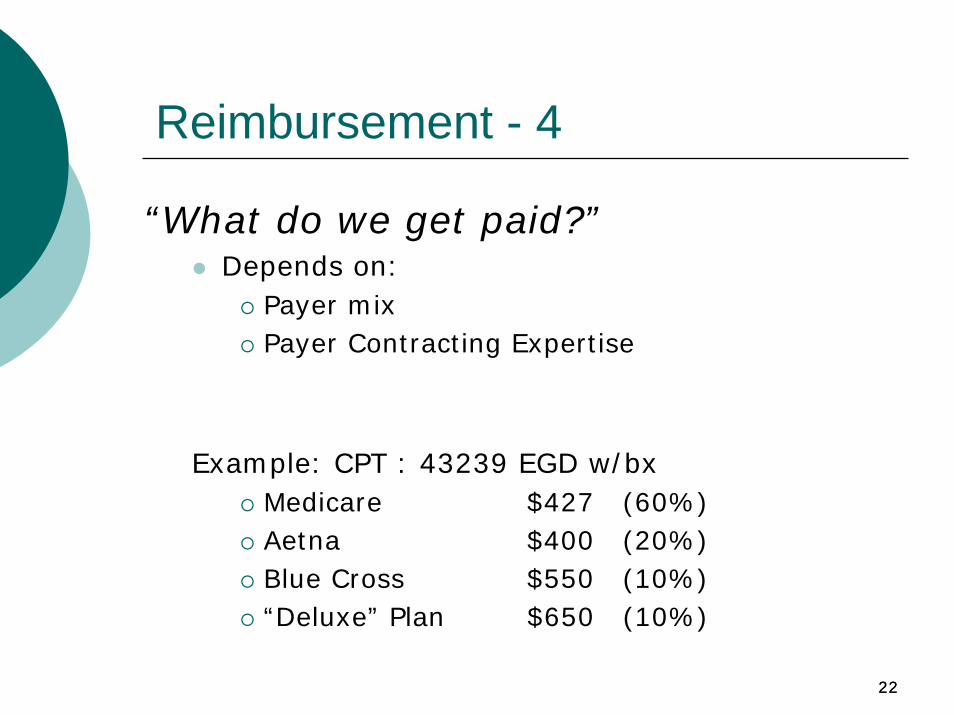
Reimbursement - 4
“What do we get paid?”Depends on:
Payer mix Payer Contracting Expertise
Example: CPT : 43239 EGD w/bxMedicare $427 (60%)Aetna $400 (20%)Blue Cross $550 (10%)“Deluxe” Plan $650 (10%)
2323
Methodologies
2424
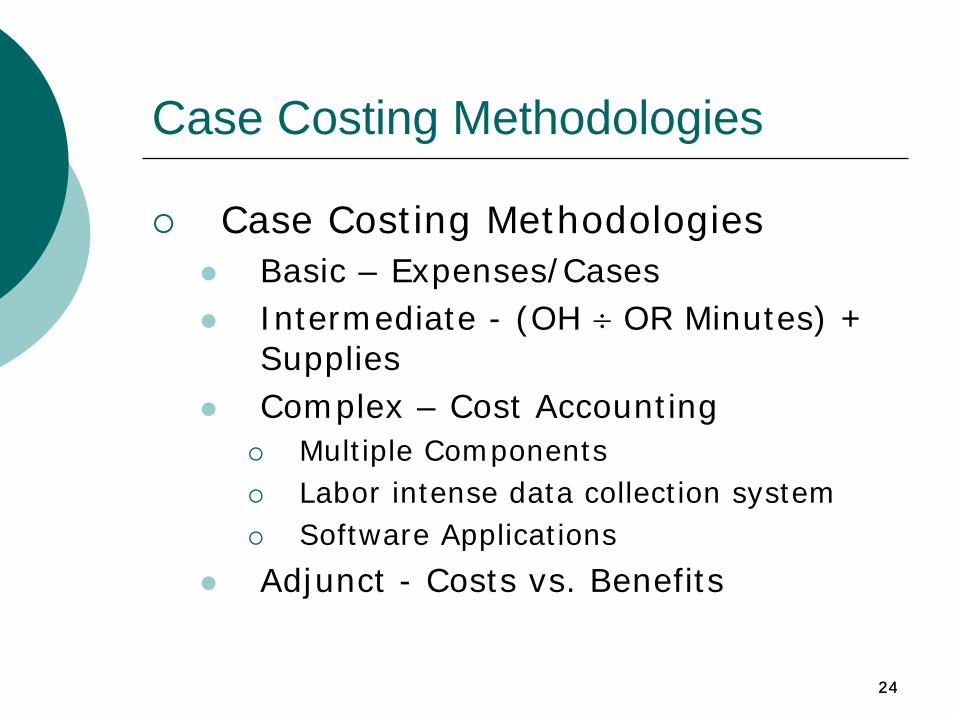
Case Costing Methodologies
Case Costing MethodologiesBasic – Expenses/CasesIntermediate - (OH ÷ OR Minutes) + SuppliesComplex – Cost Accounting
Multiple ComponentsLabor intense data collection systemSoftware Applications
Adjunct - Costs vs. Benefits
2525
Case Costing Methodologies - 2
3rd Dimension – Leadership & Implementation
2626
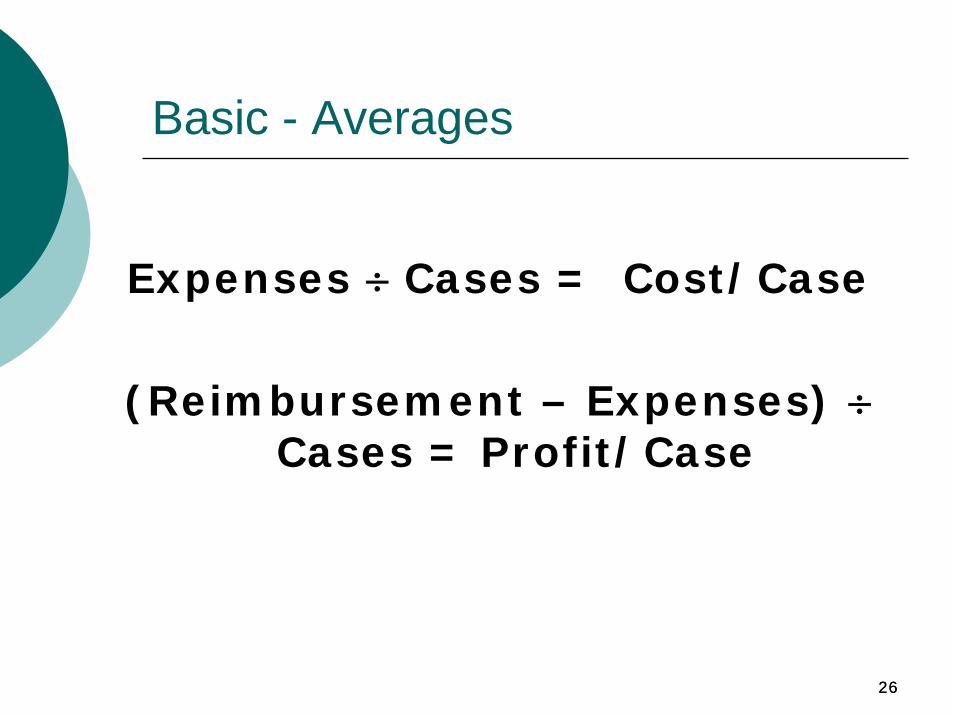
Basic - Averages
Expenses ÷ Cases = Cost/Case
(Reimbursement – Expenses) ÷Cases = Profit/Case
2727
Basic - 2
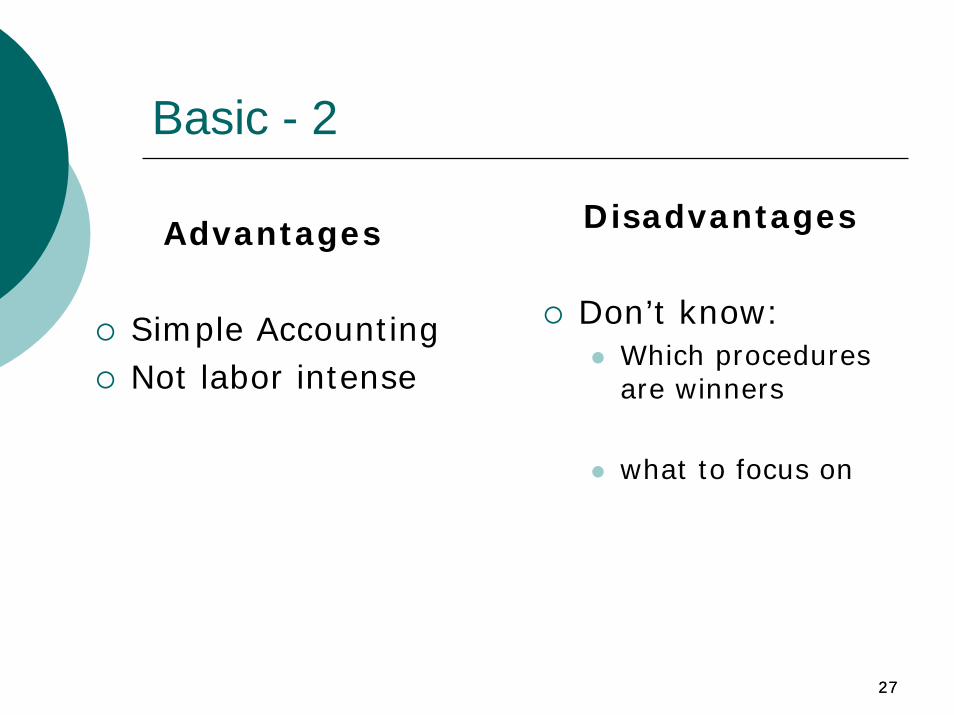
Advantages
Simple AccountingNot labor intense
Disadvantages
Don’t know:Which procedures are winners
what to focus on
2828
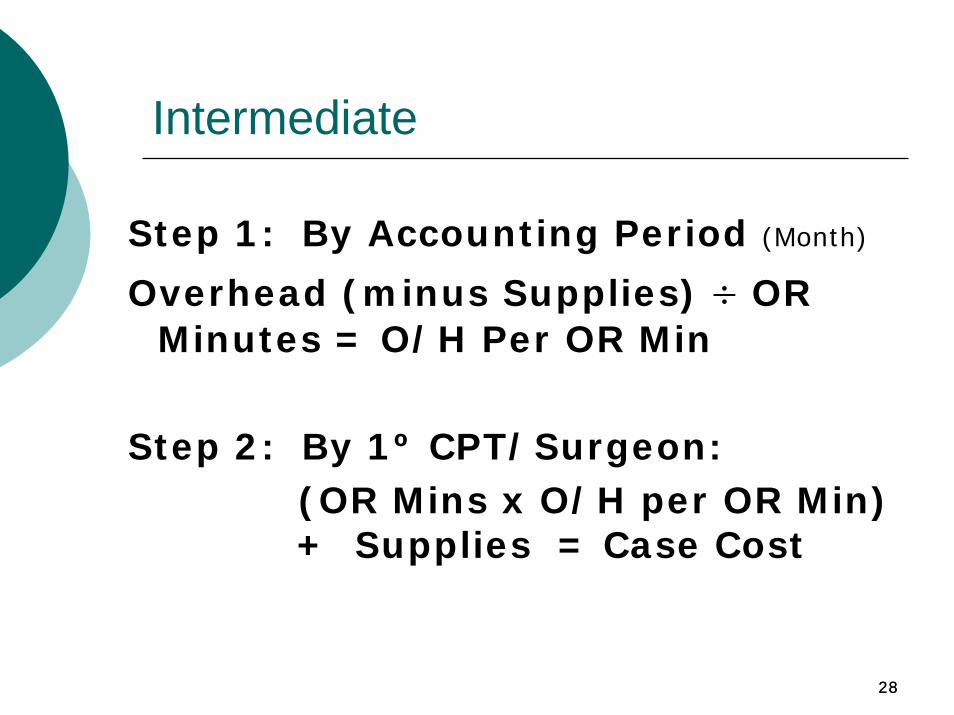
Intermediate
Step 1: By Accounting Period (Month)
Overhead (minus Supplies) ÷ OR Minutes = O/H Per OR Min
Step 2: By 1º CPT/Surgeon:(OR Mins x O/H per OR Min) + Supplies = Case Cost
2929
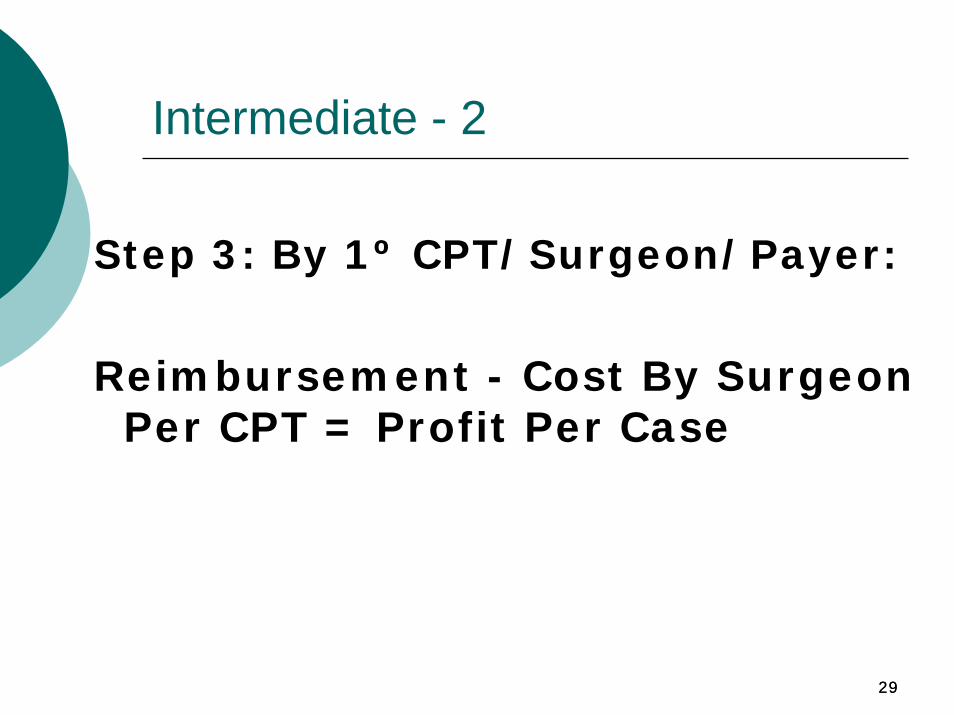
Intermediate - 2
Step 3: By 1º CPT/Surgeon/Payer:
Reimbursement - Cost By Surgeon Per CPT = Profit Per Case
3030
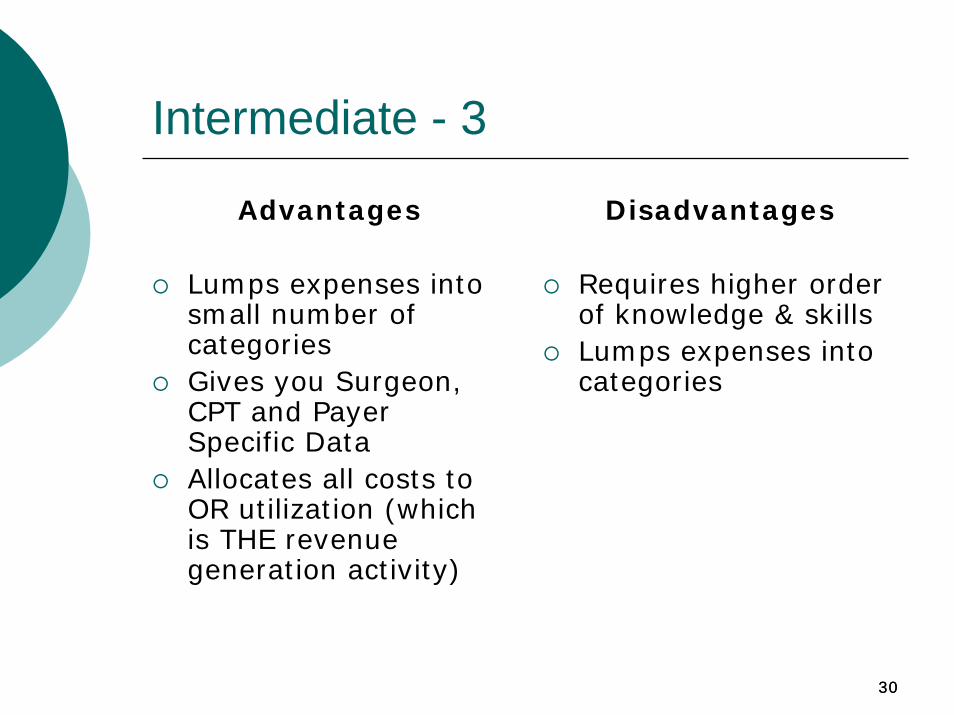
Intermediate - 3
Advantages
Lumps expenses into small number of categoriesGives you Surgeon, CPT and Payer Specific DataAllocates all costs to OR utilization (which is THE revenue generation activity)
Disadvantages
Requires higher order of knowledge & skillsLumps expenses into categories
3131
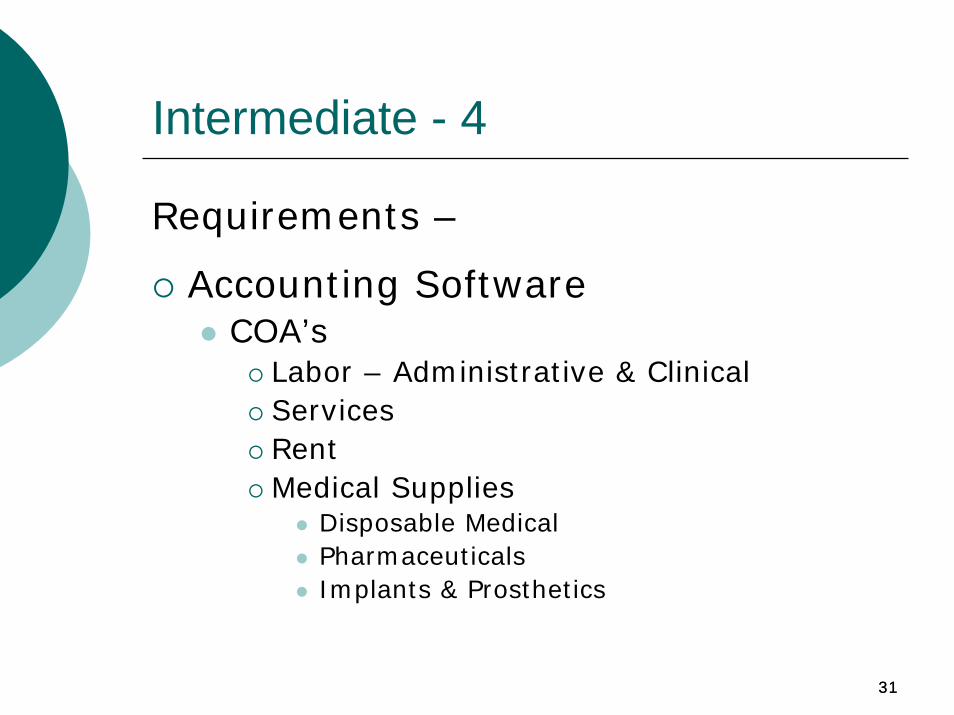
Intermediate - 4
Requirements –
Accounting Software COA’s
Labor – Administrative & ClinicalServicesRentMedical Supplies
Disposable MedicalPharmaceuticalsImplants & Prosthetics
3232
Intermediate - 5
ASC SoftwareInventoryOR LogSchedulingARReportsPreference Cards
3333
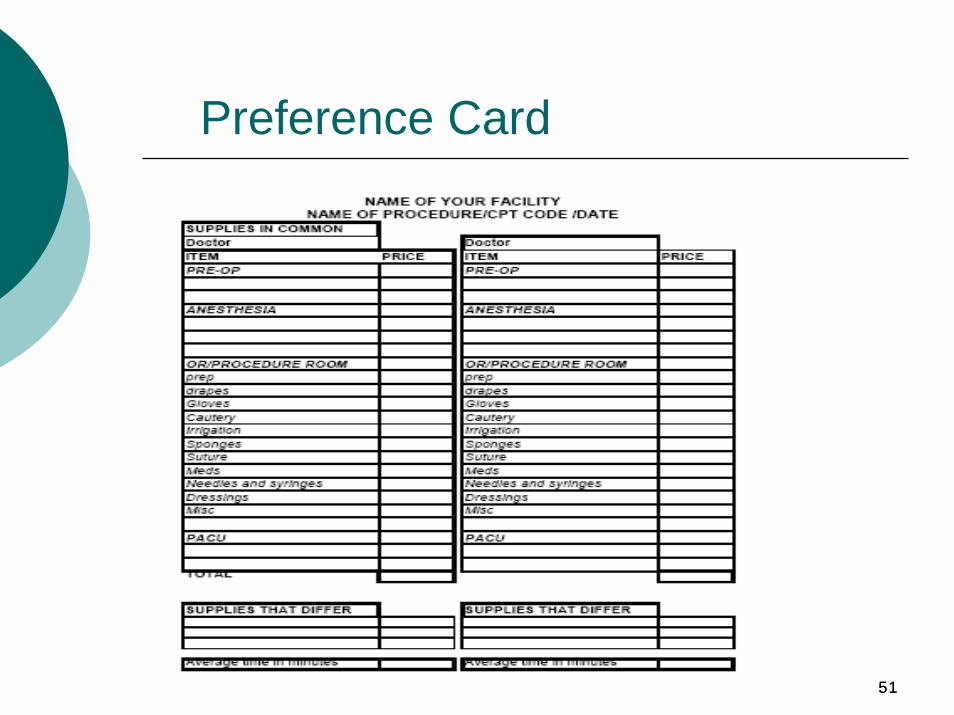
Intermediate - 6
Preference CardsBy Surgeon by CPT
Items Used in Preop, Anesthesia, OR, PACU
OR: Prep, Drapes, Gloves, Irrigation, Sponges, Suture, Meds, Needles & Syringes, Dressings, & Misc
StandardizeKeep Up to Date
3434
Intermediate - 7
Human ResourcesAccounting & Bookkeeping proficiency; CPA oversightASC Software knowledge & skillsMaterials Management & Purchasing capabilityExcel expertiseCommunications adeptChange agent know-how
3535
Complex
True Cost Accounting
Multiple Components
Labor intense data collection system
Multiple Software Applications
3636
Complex - 2
Advantages
Detail knowledgeSlight tweaks can have major impact
Disadvantages
ComplexLabor IntensiveCosts outweigh benefits

3737
Cost vs. Benefit
Cost of Procedure or Service vs. Reimbursement
Need to have at a minimum the Intermediate Case Costing Methodology in place to be useful
3838
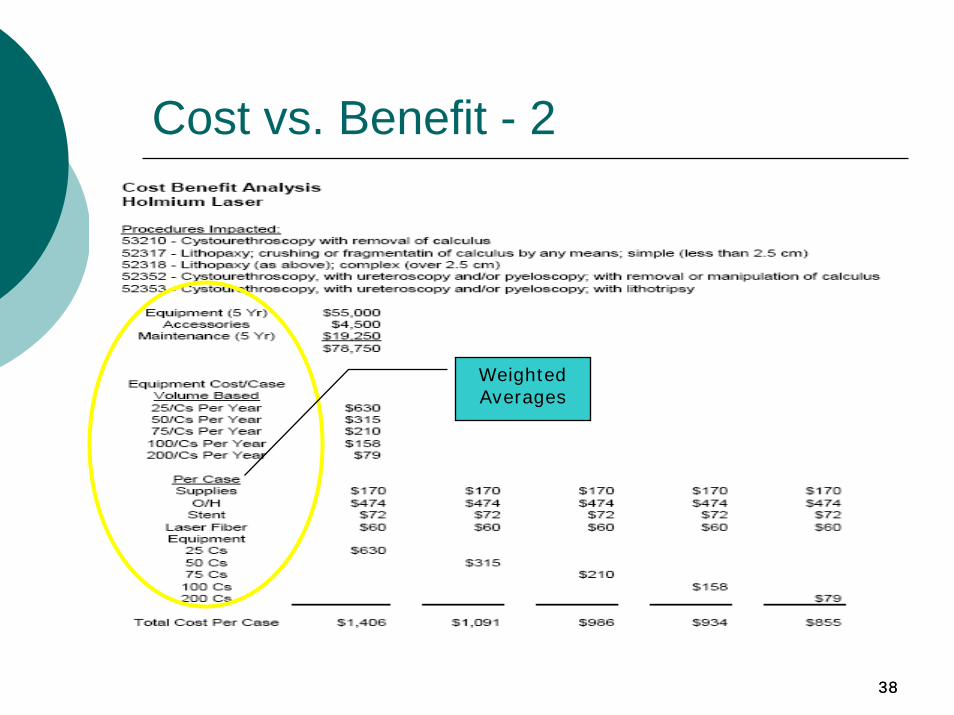
Cost vs. Benefit - 2
Weighted Averages
3939
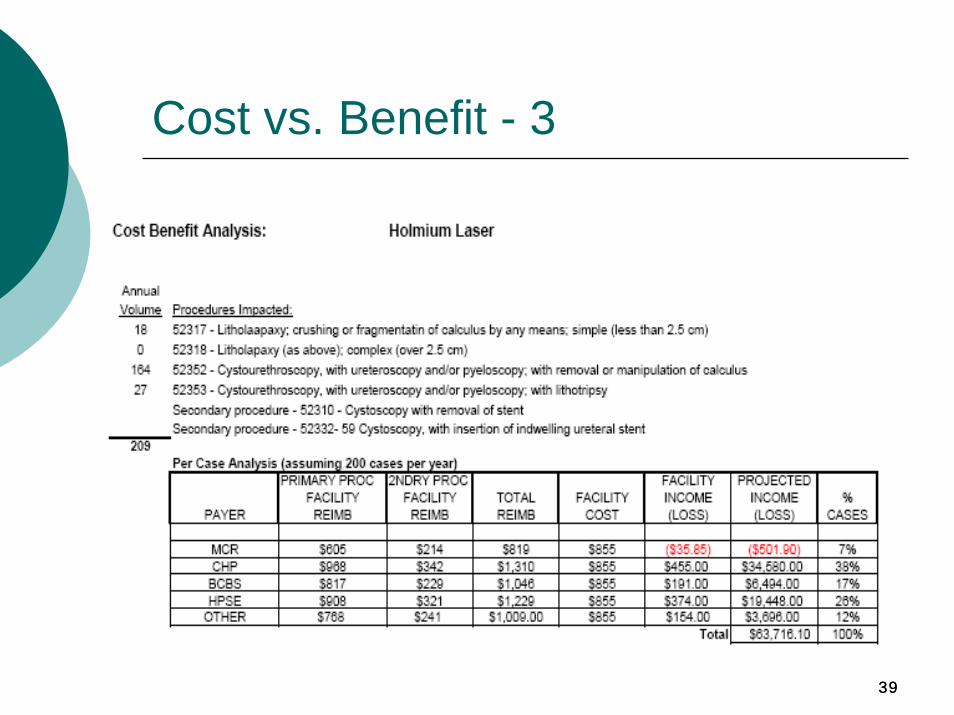
Cost vs. Benefit - 3
4040
COST DRIVERS
Cost DriversRentService ContractsLaborSupply CostsOR UtilizationPhysician Variables
OR Time & UtilizationSuppliesSurgeon PreferencesAnesthesia Preferences
4141
Rent
Cost per Sq FootCAM (Common-Area Maintenance) ChargesVaries by Site
New ProjectsExisting Projects
4242
Service Contracts - Equipment
Required for Equipment & Building:Electrical SafetyAnesthesia Machines & MonitorsHVACEmergency GeneratorVacuum PumpC-Arm (tube)Gas Manifold
4343
Service Contracts – Equipment 2
Required:high volume endoscopy services should carry contracts on the scopes
Not Recommended:microscopes, monitors (anesthesia gas monitors should be part of the anesthesia machine contract, cauteryvideo equipment
4444
Service Contracts – Equipment 3
Required:Other Hi Tech Equipment
PM Service Contract Options:$ - PM check only, technician labor and travel time. For some hi-tech equipment this will include software releases/upgrades$$ - The above plus parts are included$$$ - The above plus labor and travel time for non-PM service (not recommended)
*hi-tech equipment where software releases/upgrades are part of the service contract
4545
Service Contracts - 4
Linen & LaundryCleaningFire SystemsOther
4646
Labor
Allocate globallyTypes:
Direct:Specific activities tracked to specific patient
Indirect:Activities necessary to provide services that are not directly tracked to specific patient
4747
Supplies
Disposable MedicalCase Specific
Preop, OR, PACURoutine suppliesPharmaceuticalsGases
Surgeon PreferenceProcedure specific suppliesPharmaceuticalsImplants & Prosthetics
4848
Supplies - 2
AnesthesiaRoutine SuppliesPharmaceuticalsGases
Supplies – Other Necessary to provide services either non-medical or not directly tracked to a specific patient
Implants & ProstheticsDemand vs. PreferenceDevice Benefits Managers
4949
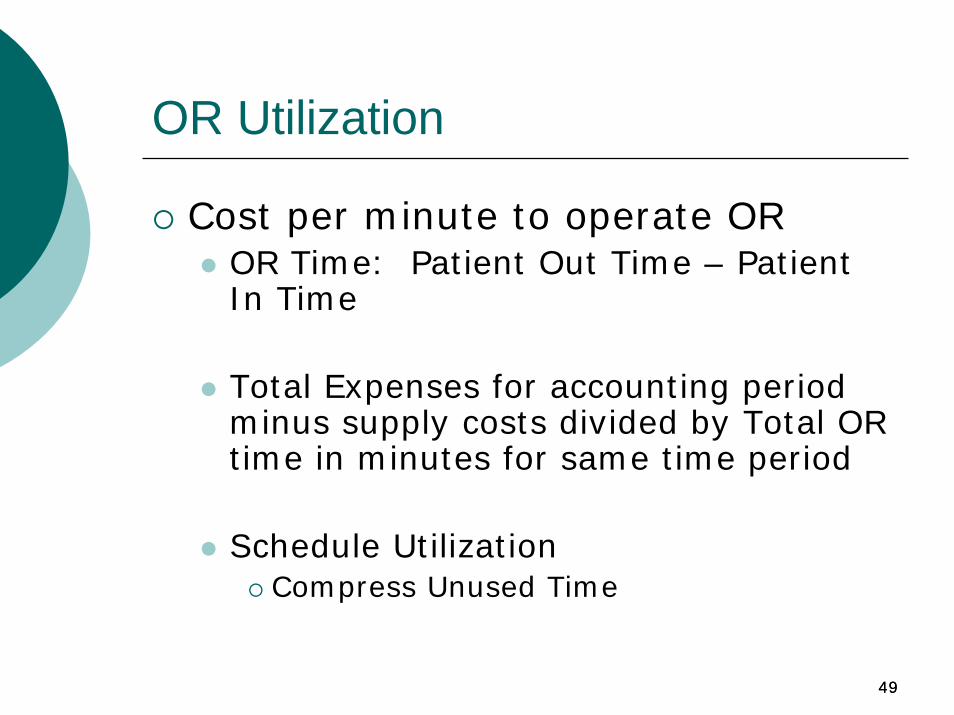
OR Utilization
Cost per minute to operate OROR Time: Patient Out Time – Patient In Time
Total Expenses for accounting period minus supply costs divided by Total OR time in minutes for same time period
Schedule UtilizationCompress Unused Time
5050
Intermediate – More
5151
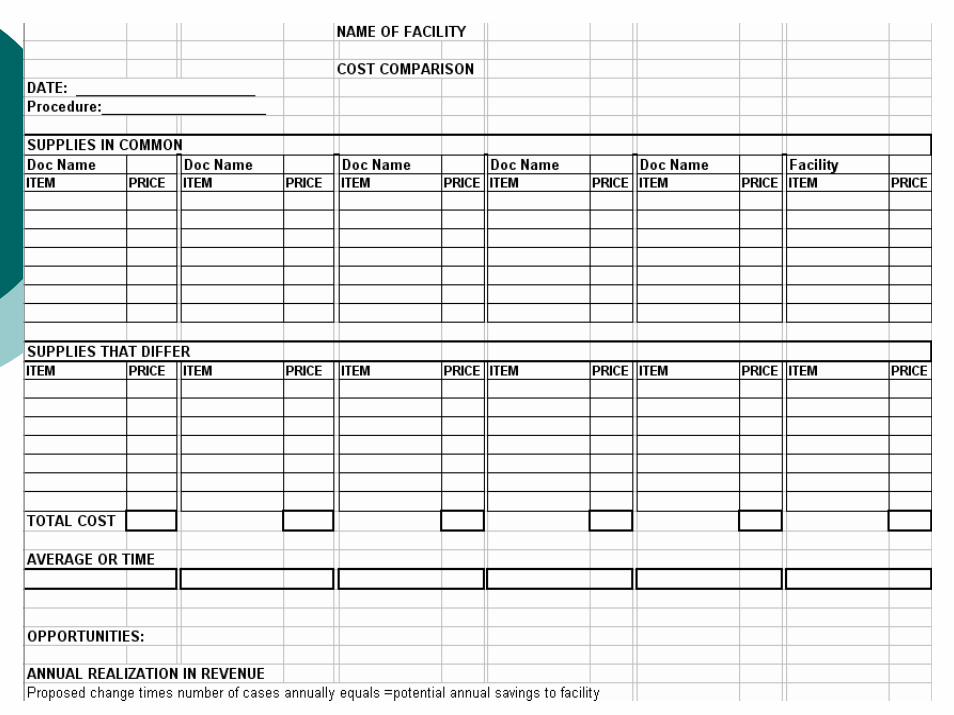
Preference Card
5252
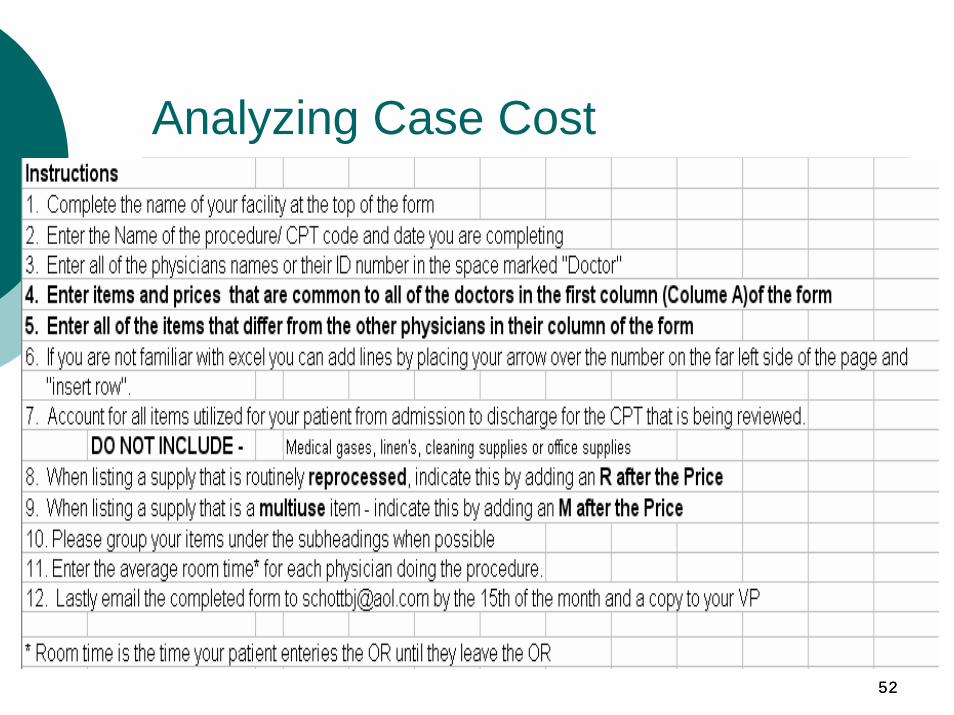
Analyzing Case Cost
5353
5454
NAME OF FACILITY
COST COMPARISONDATE: 8-2005Procedure: BMTs
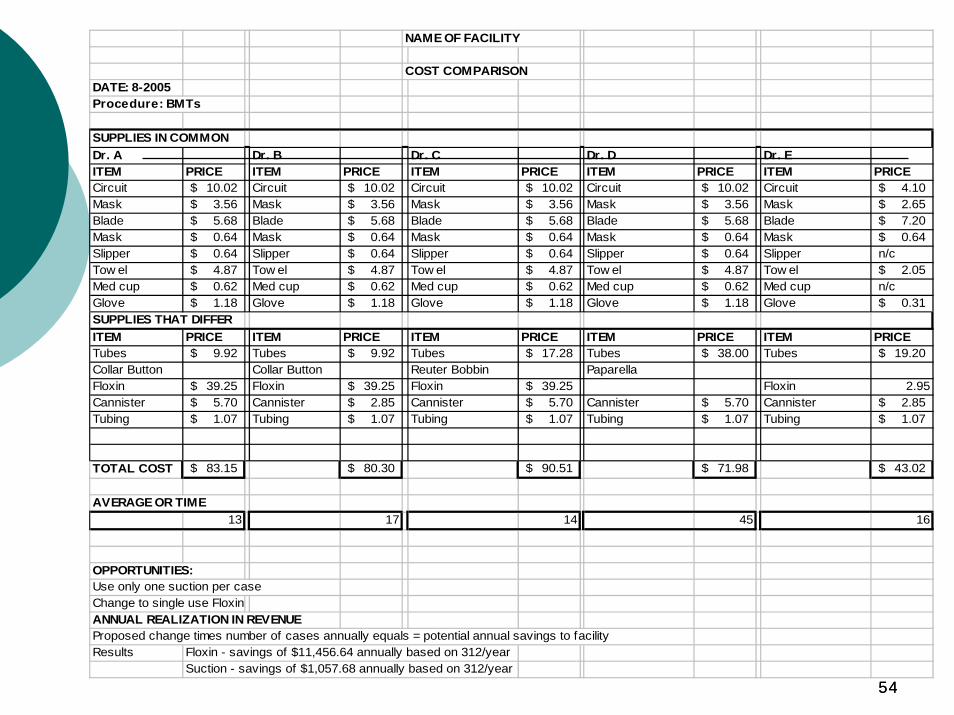
SUPPLIES IN COMMONDr. A Dr. B Dr. C Dr. D Dr. EITEM PRICE ITEM PRICE ITEM PRICE ITEM PRICE ITEM PRICECircuit 10.02$ Circuit 10.02$ Circuit 10.02$ Circuit 10.02$ Circuit 4.10$ Mask 3.56$ Mask 3.56$ Mask 3.56$ Mask 3.56$ Mask 2.65$ Blade 5.68$ Blade 5.68$ Blade 5.68$ Blade 5.68$ Blade 7.20$ Mask 0.64$ Mask 0.64$ Mask 0.64$ Mask 0.64$ Mask 0.64$ Slipper 0.64$ Slipper 0.64$ Slipper 0.64$ Slipper 0.64$ Slipper n/cTow el 4.87$ Tow el 4.87$ Tow el 4.87$ Tow el 4.87$ Tow el 2.05$ Med cup 0.62$ Med cup 0.62$ Med cup 0.62$ Med cup 0.62$ Med cup n/cGlove 1.18$ Glove 1.18$ Glove 1.18$ Glove 1.18$ Glove 0.31$ SUPPLIES THAT DIFFERITEM PRICE ITEM PRICE ITEM PRICE ITEM PRICE ITEM PRICETubes 9.92$ Tubes 9.92$ Tubes 17.28$ Tubes 38.00$ Tubes 19.20$ Collar Button Collar Button Reuter Bobbin PaparellaFloxin 39.25$ Floxin 39.25$ Floxin 39.25$ Floxin 2.95Cannister 5.70$ Cannister 2.85$ Cannister 5.70$ Cannister 5.70$ Cannister 2.85$ Tubing 1.07$ Tubing 1.07$ Tubing 1.07$ Tubing 1.07$ Tubing 1.07$
TOTAL COST 83.15$ 80.30$ 90.51$ 71.98$ 43.02$
AVERAGE OR TIME13 17 14 45 16
OPPORTUNITIES:Use only one suction per caseChange to single use FloxinANNUAL REALIZATION IN REVENUEProposed change times number of cases annually equals = potential annual savings to facilityResults Floxin - savings of $11,456.64 annually based on 312/year
Suction - savings of $1,057.68 annually based on 312/year
5555
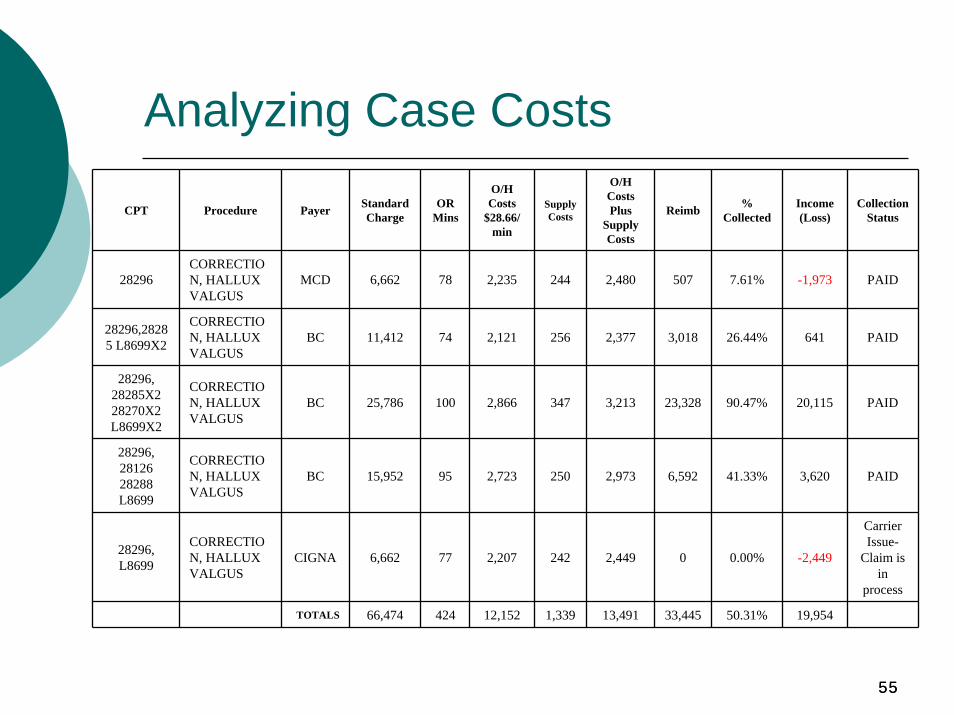
CPT Procedure Payer Standard Charge
OR Mins
O/H Costs
$28.66/min
Supply Costs
O/H Costs Plus
Supply Costs
Reimb % Collected
Income (Loss)
Collection Status
28296CORRECTION, HALLUX VALGUS
MCD 6,662 78 2,235 244 2,480 507 7.61% -1,973 PAID
28296,28285 L8699X2
CORRECTION, HALLUX VALGUS
BC 11,412 74 2,121 256 2,377 3,018 26.44% 641 PAID
28296, 28285X2 28270X2 L8699X2
CORRECTION, HALLUX VALGUS
BC 25,786 100 2,866 347 3,213 23,328 90.47% 20,115 PAID
28296, 28126 28288 L8699
CORRECTION, HALLUX VALGUS
BC 15,952 95 2,723 250 2,973 6,592 41.33% 3,620 PAID
28296, L8699
CORRECTION, HALLUX VALGUS
CIGNA 6,662 77 2,207 242 2,449 0 0.00% -2,449
Carrier Issue-
Claim is in
process
TOTALS 66,474 424 12,152 1,339 13,491 33,445 50.31% 19,954
Analyzing Case Costs
5656
High Impact Metrics
5757
High Impact Metrics
Actual cases as % of projected casesCase per dayCollections as % of chargesSupplies as % of collectionsPayroll as % of collectionsAR – days outstandingAR & AP % current
58
Cases % of Projected
Before development, we estimate the expected case volume.If you’re not reaching anticipated case volume, you need to know why.If case volume falls significantly short of plan, losses can result.Quality care and efficiency will attract additional cases.
59
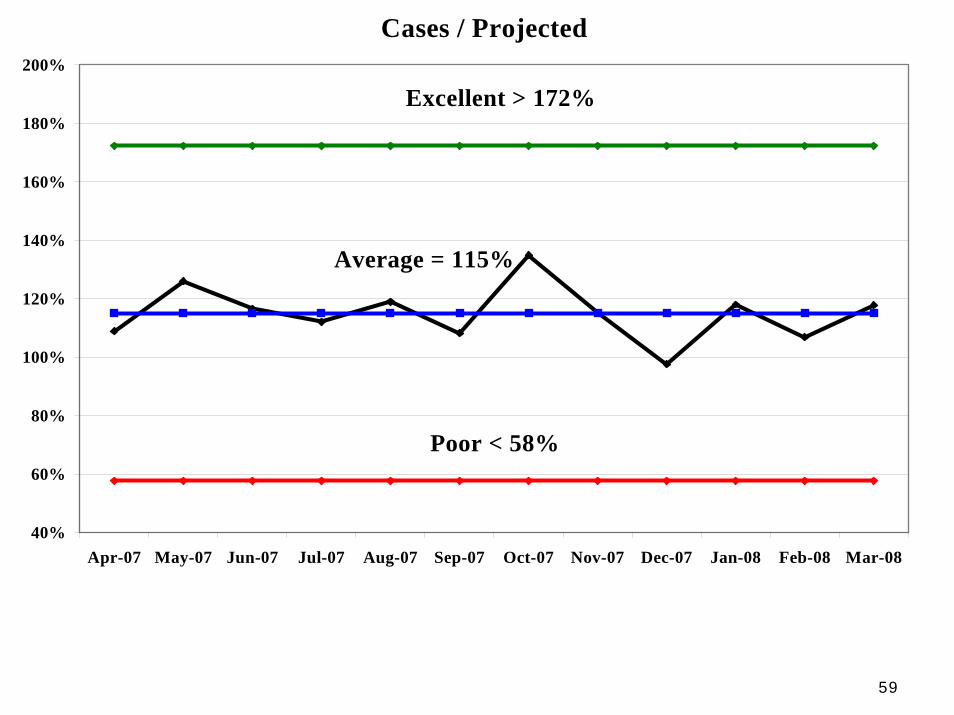
Cases / Projected
40%
60%
80%
100%
120%
140%
160%
180%
200%
Apr-07 May-07 Jun-07 Jul-07 Aug-07 Sep-07 Oct-07 Nov-07 Dec-07 Jan-08 Feb-08 Mar-08
Excellent > 172%
Average = 115%
Poor < 58%
60
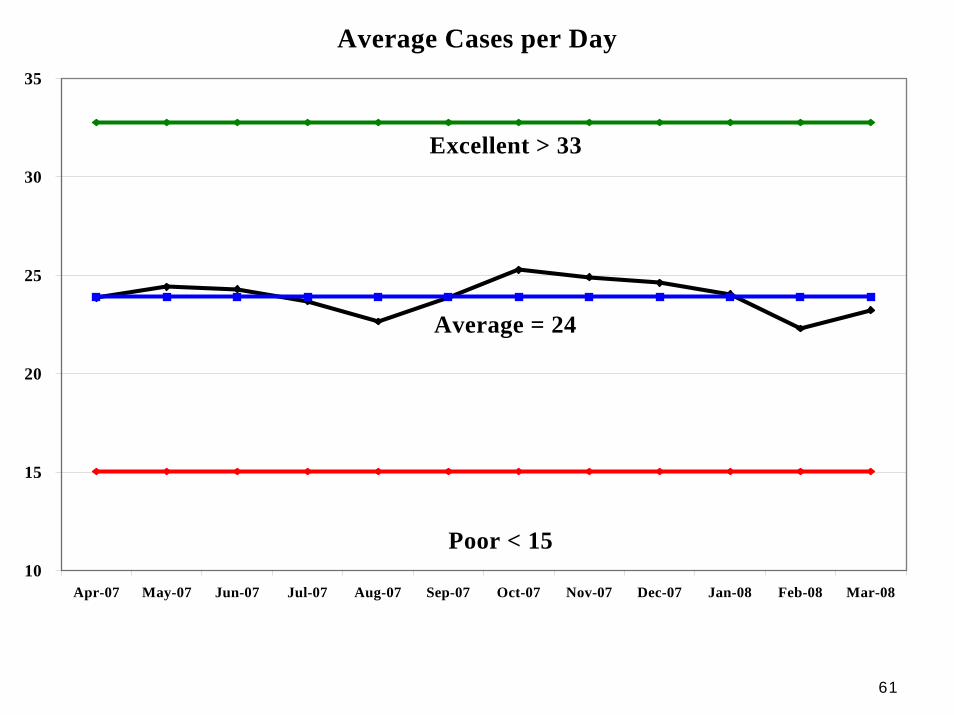
Cases per Day
Measure of ‘throughput’.More cases performed per day means lower per case overhead costs.Wage costs for a day of surgery is relatively fixed.
61
Cases per DayAverage Cases per Day
10
15
20
25
30
35
Apr-07 May-07 Jun-07 Jul-07 Aug-07 Sep-07 Oct-07 Nov-07 Dec-07 Jan-08 Feb-08 Mar-08
Excellent > 33
Average = 24
Poor < 15
62
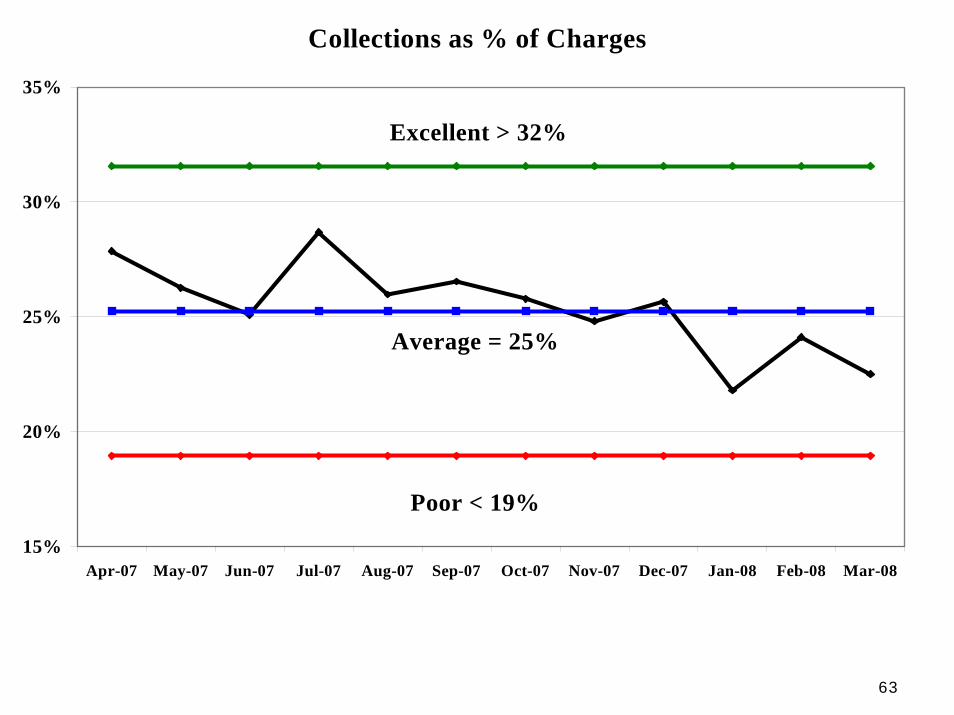
Collections as % of Charges
If % too low then perhaps billing or collections are troubled.If % is too high, you are likely either not charging enough or cleaning up an AR problem.Can only assess this metric well over several months.
63
Collections % of ChargesCollections as % of Charges
15%
20%
25%
30%
35%
Apr-07 May-07 Jun-07 Jul-07 Aug-07 Sep-07 Oct-07 Nov-07 Dec-07 Jan-08 Feb-08 Mar-08
Excellent > 32%
Average = 25%
Poor < 19%
6464
Supplies % of Collections
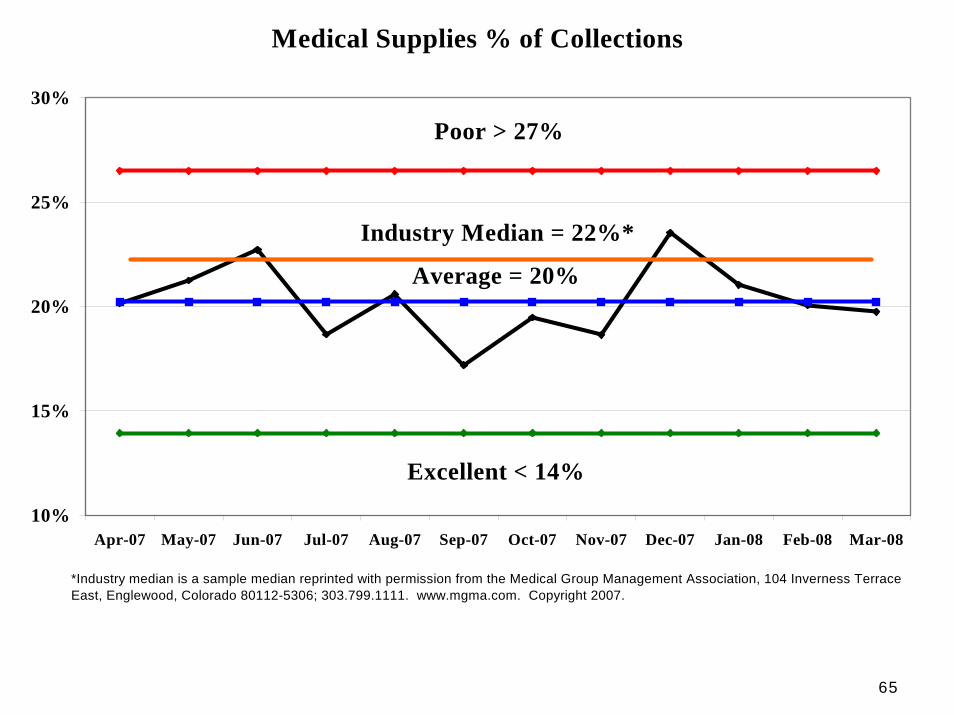
Always one of top two ASC costsLargely physician driven - but you can guide themReduce cost by sourcing through group purchasing organizations (GPO)Case costing critical to reduceProvide recommended preference cards
65
Supplies % of CollectionsMedical Supplies % of Collections
10%
15%
20%
25%
30%
Apr-07 May-07 Jun-07 Jul-07 Aug-07 Sep-07 Oct-07 Nov-07 Dec-07 Jan-08 Feb-08 Mar-08
Poor > 27%
Average = 20%
Excellent < 14%
*Industry median is a sample median reprinted with permission from the Medical Group Management Association, 104 Inverness Terrace East, Englewood, Colorado 80112-5306; 303.799.1111. www.mgma.com. Copyright 2007.
Industry Median = 22%*
6666
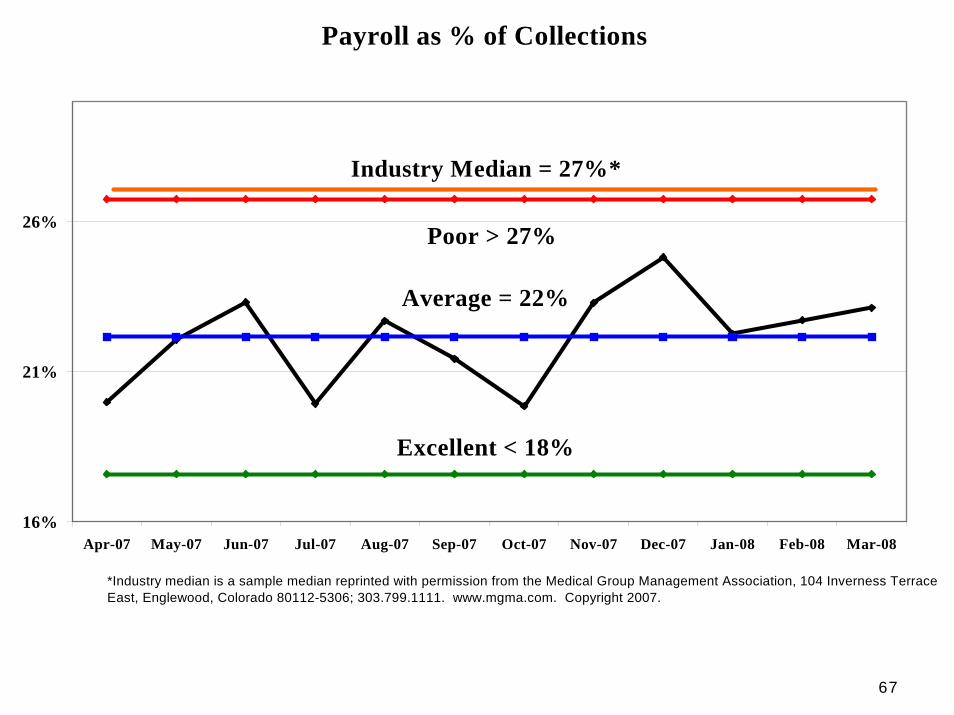
Payroll % of Collections
Typically the largest single cost of an ASC.Compress your schedule to reduce.When the work is done, turn off the lights and send people home.Use PRN staff when possible.Pay more per hour for the right people.
67
Payroll % of CollectionsPayroll as % of Collections
16%
21%
26%
Apr-07 May-07 Jun-07 Jul-07 Aug-07 Sep-07 Oct-07 Nov-07 Dec-07 Jan-08 Feb-08 Mar-08
Poor > 27%
Average = 22%
Excellent < 18%
Industry Median = 27%*
*Industry median is a sample median reprinted with permission from the Medical Group Management Association, 104 Inverness Terrace East, Englewood, Colorado 80112-5306; 303.799.1111. www.mgma.com. Copyright 2007.
6868
Supplies and Payroll
Can be controlledChange thought processesTrack savings Calculate annualized savingsShare information with staffPresent to the Board
69
AR Days Outstanding
((Total Outstanding Charges) / (Total Monthly Charges)) x 30 days.The higher your AR days the more likely you’ll never collect.$ collected is $ you can pay owners.Clean-up pays for itself 10 - 20x.Success by a sound process.
70
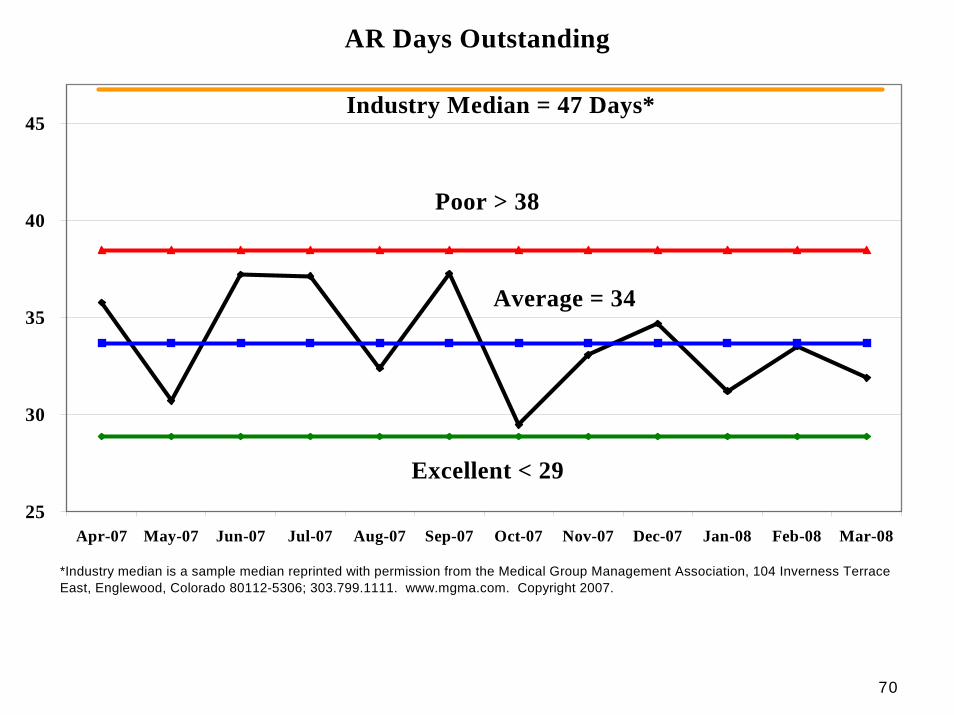
AR Days OutstandingAR Days Outstanding
25
30
35
40
45
Apr-07 May-07 Jun-07 Jul-07 Aug-07 Sep-07 Oct-07 Nov-07 Dec-07 Jan-08 Feb-08 Mar-08
Poor > 38
Average = 34
Excellent < 29
Industry Median = 47 Days*
*Industry median is a sample median reprinted with permission from the Medical Group Management Association, 104 Inverness Terrace East, Englewood, Colorado 80112-5306; 303.799.1111. www.mgma.com. Copyright 2007.
71
AR Percentage Current
Higher is better because you don’t want any of your AR getting old.An imperfect measure because you often get paid in less than 30 days which leads to a lower figure.You want your ‘over 30’ AR to be low due to fast collection.
72
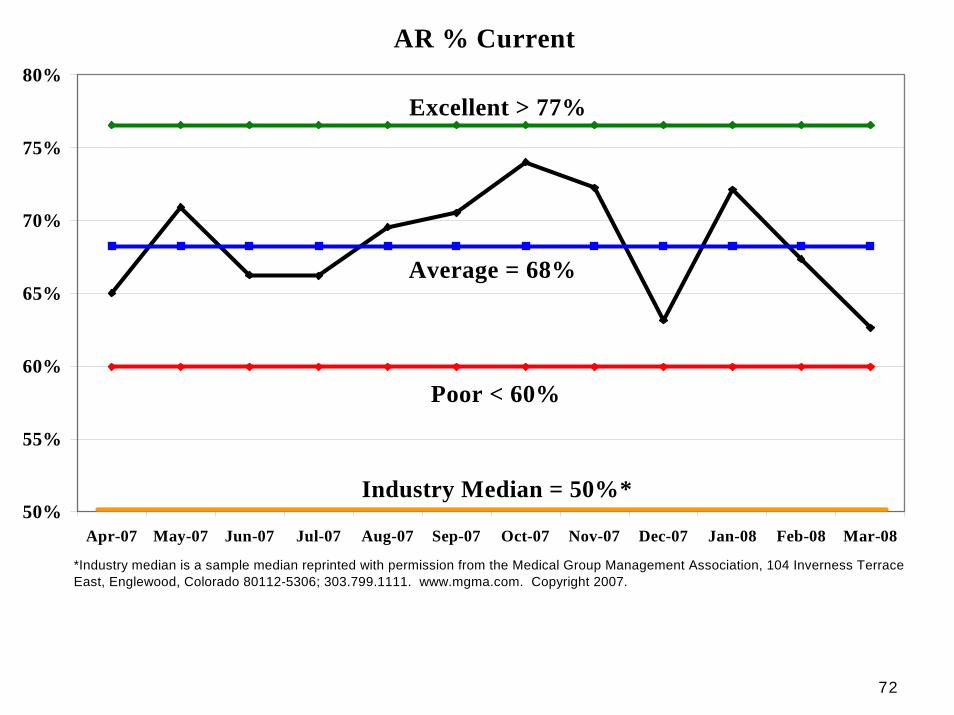
AR Percentage Current AR % Current
50%
55%
60%
65%
70%
75%
80%
Apr-07 May-07 Jun-07 Jul-07 Aug-07 Sep-07 Oct-07 Nov-07 Dec-07 Jan-08 Feb-08 Mar-08
Excellent > 77%
Average = 68%
Poor < 60%
Industry Median = 50%*
*Industry median is a sample median reprinted with permission from the Medical Group Management Association, 104 Inverness Terrace East, Englewood, Colorado 80112-5306; 303.799.1111. www.mgma.com. Copyright 2007.
7373
3rd Dimension – Leadership & Implementation
7474
Will Scope
for Food
Typical Reaction to the Initial
Preference Card Discussion
7575
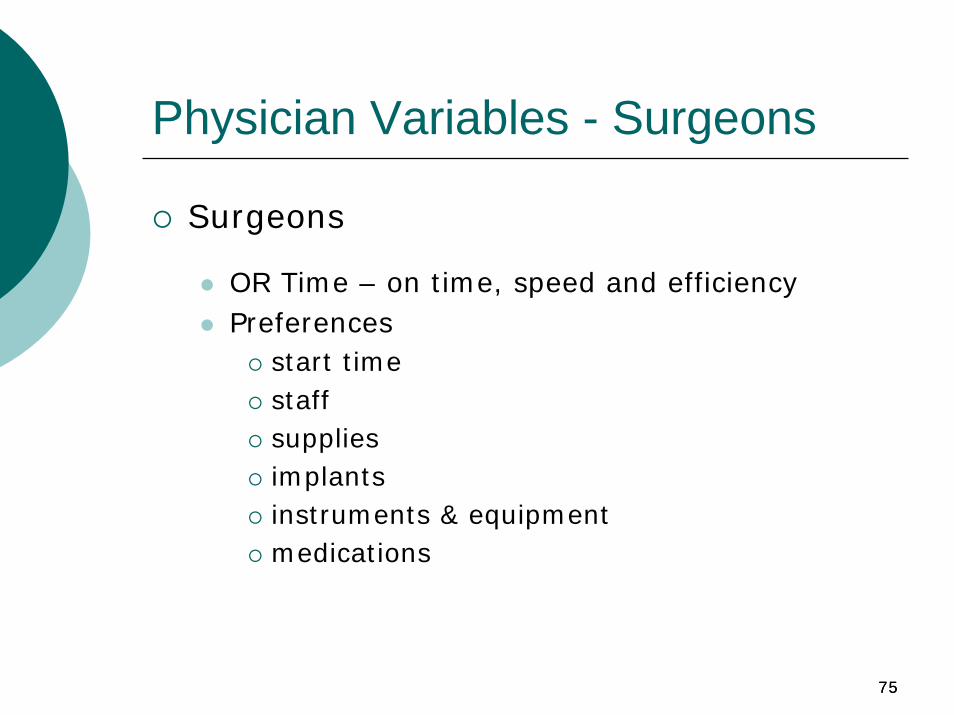
Physician Variables - Surgeons
Surgeons
OR Time – on time, speed and efficiencyPreferences
start timestaff supplies implants instruments & equipment medications
7676
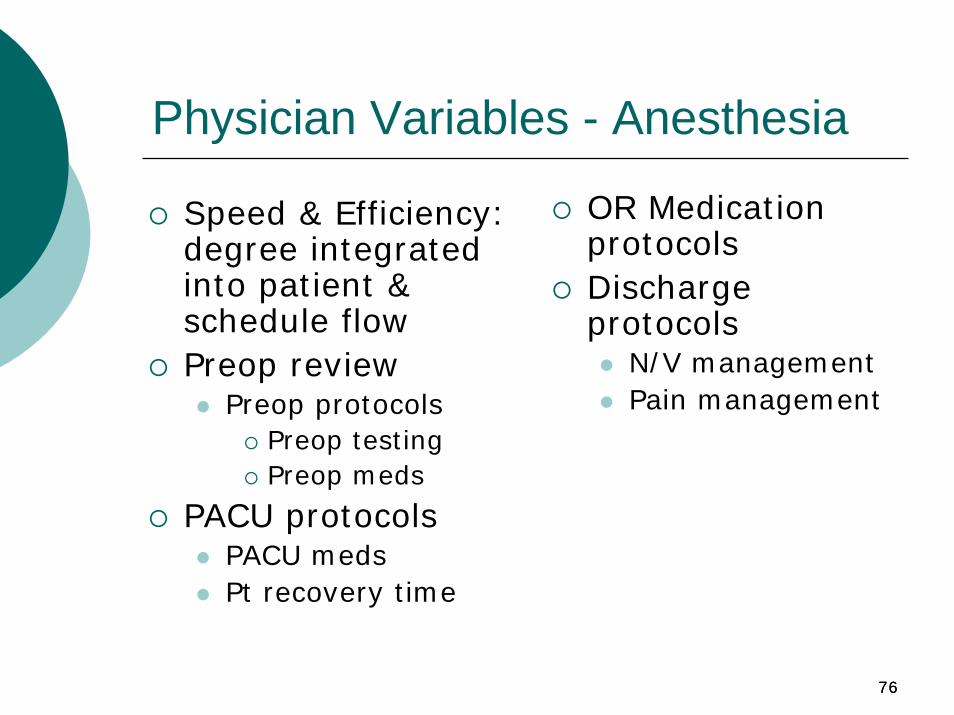
Physician Variables - Anesthesia
Speed & Efficiency: degree integrated into patient & schedule flowPreop review
Preop protocolsPreop testingPreop meds
PACU protocolsPACU medsPt recovery time
OR Medication protocolsDischarge protocols
N/V managementPain management
7777
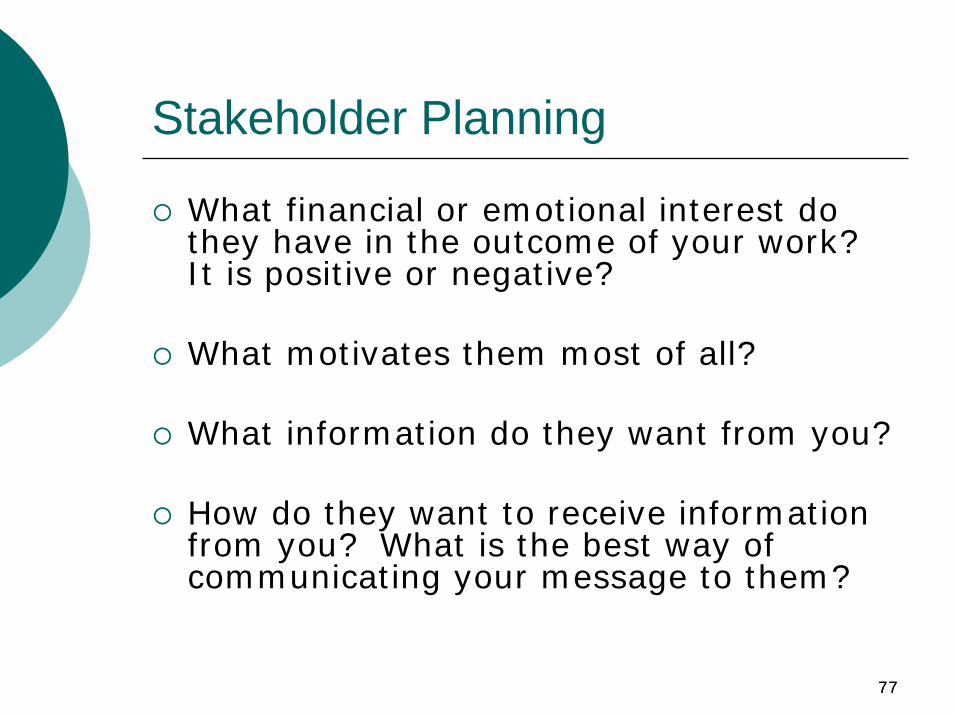
Stakeholder Planning
What financial or emotional interest do they have in the outcome of your work? It is positive or negative?
What motivates them most of all?
What information do they want from you?
How do they want to receive information from you? What is the best way of communicating your message to them?
7878
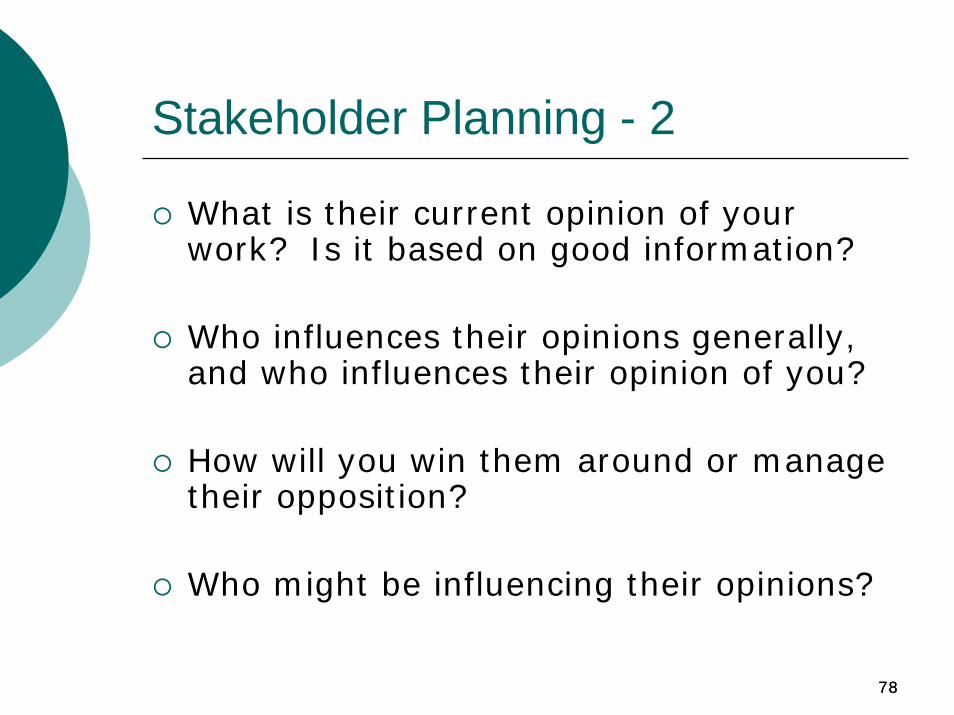
Stakeholder Planning - 2
What is their current opinion of your work? Is it based on good information?
Who influences their opinions generally, and who influences their opinion of you?
How will you win them around or manage their opposition?
Who might be influencing their opinions?
7979
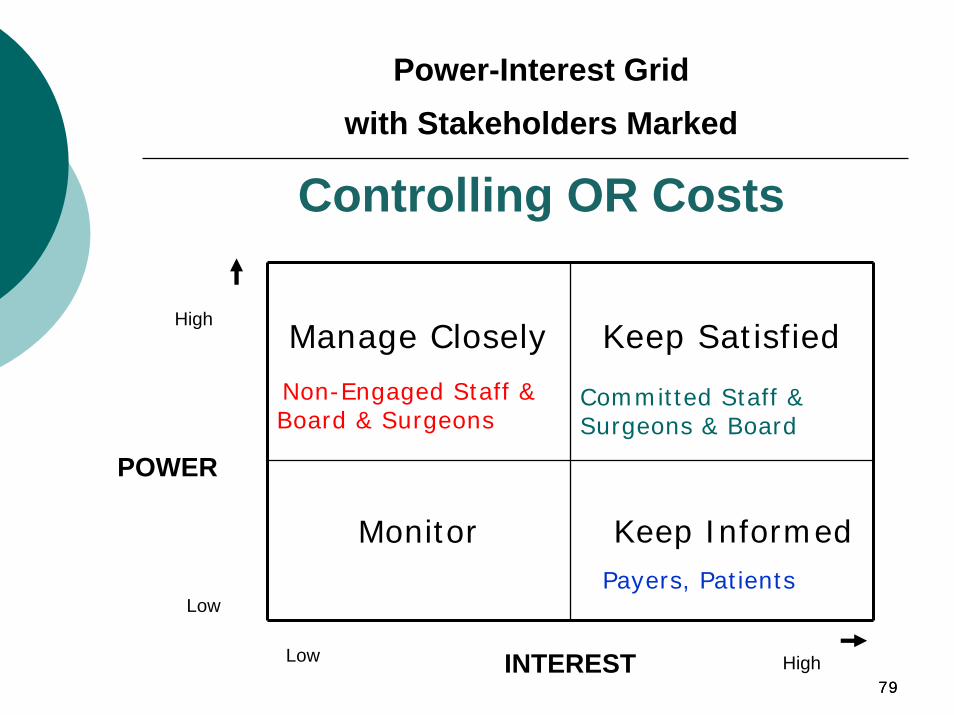
Manage Closely
Non-Engaged Staff & Board & Surgeons
Keep Satisfied
Committed Staff & Surgeons & Board
Monitor Keep InformedPayers, Patients
High
POWER
Low
Low HighINTEREST
Power-Interest Grid with Stakeholders Marked
Controlling OR Costs
8080
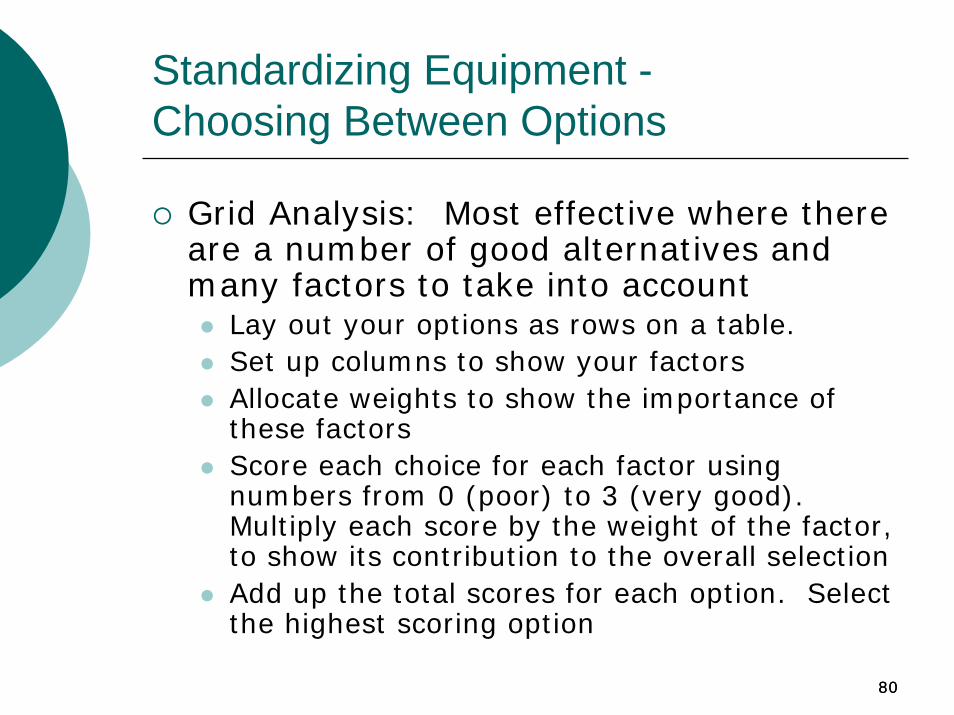
Standardizing Equipment -Choosing Between Options
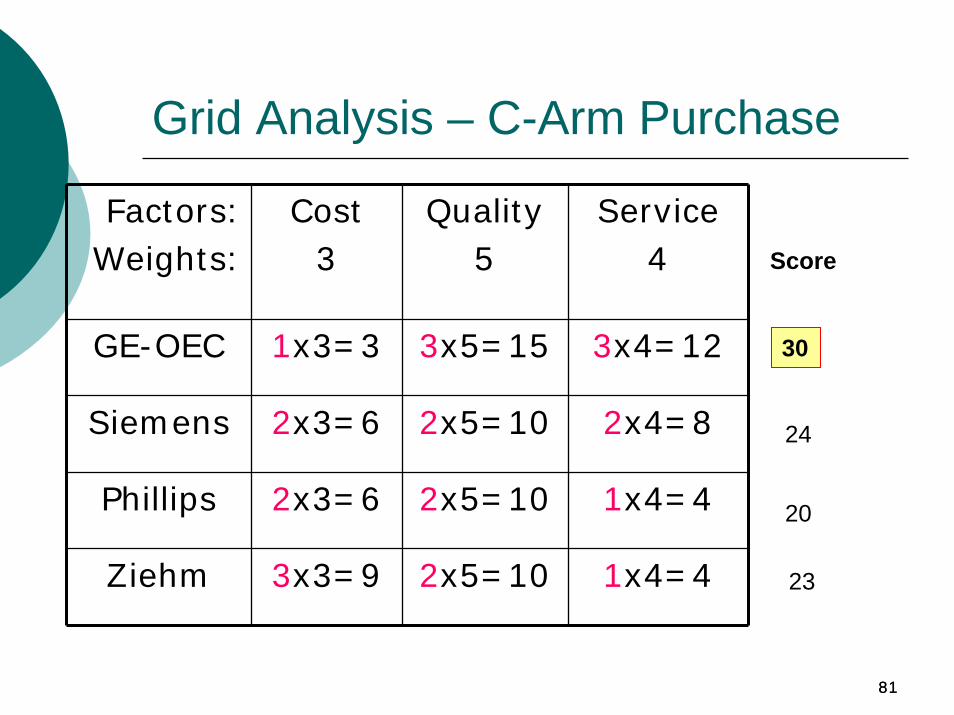
Grid Analysis: Most effective where there are a number of good alternatives and many factors to take into account
Lay out your options as rows on a table.Set up columns to show your factorsAllocate weights to show the importance of these factorsScore each choice for each factor using numbers from 0 (poor) to 3 (very good). Multiply each score by the weight of the factor, to show its contribution to the overall selectionAdd up the total scores for each option. Select the highest scoring option
8181
Grid Analysis – C-Arm Purchase
Factors:Weights:
Cost3
Quality5
Service4
GE-OEC 1x3=3 3x5=15 3x4=12
Siemens 2x3=6 2x5=10 2x4=8
Phillips 2x3=6 2x5=10 1x4=4
Ziehm 3x3=9 2x5=10 1x4=4
Score
30
24
20
23
8282
Ladder of Inference*
Our beliefs are the truthThe truth is obviousOur beliefs are based on real dataThe data we select is the real data
________________*Senge, Peter, The Fifth Discipline Fieldbook, pgs 242-246.
8383
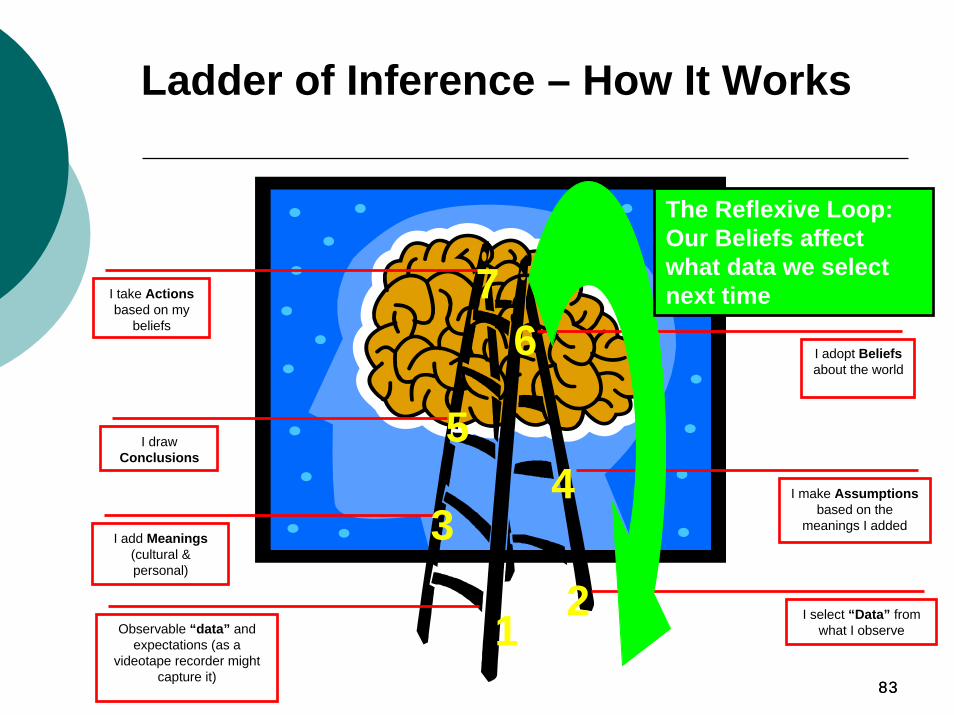
I draw Conclusions
I add Meanings(cultural & personal)
Observable “data” and expectations (as a
videotape recorder might capture it)
I adopt Beliefsabout the world
I take Actionsbased on my
beliefs
I make Assumptionsbased on the
meanings I added
I select “Data” from what I observe1
5
3
6
4
2
7
Ladder of Inference – How It Works
The Reflexive Loop: Our Beliefs affect what data we select next time
8484
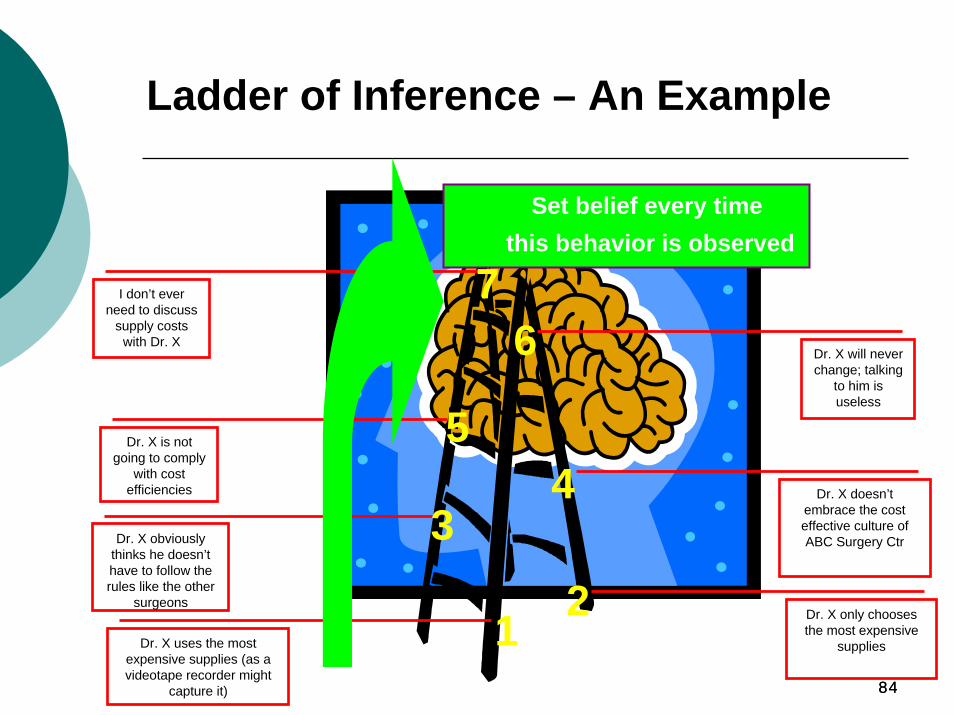
Dr. X is not going to comply
with cost efficiencies
Dr. X obviously thinks he doesn’t have to follow the rules like the other
surgeons
Dr. X uses the most expensive supplies (as a videotape recorder might
capture it)
Dr. X will never change; talking
to him is useless
I don’t ever need to discuss
supply costs with Dr. X
Dr. X doesn’t embrace the cost effective culture of ABC Surgery Ctr
Dr. X only chooses the most expensive
supplies1
5
3
6
4
2
7
Ladder of Inference – An Example
Set belief every time this behavior is observed
8585
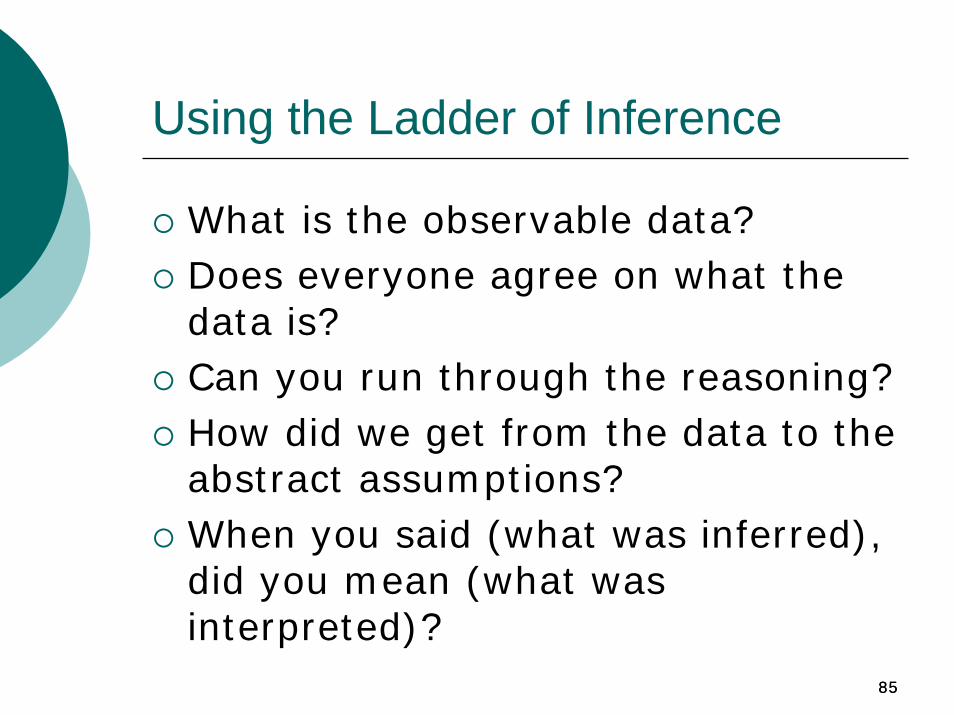
Using the Ladder of Inference
What is the observable data?Does everyone agree on what the data is?Can you run through the reasoning?How did we get from the data to the abstract assumptions?When you said (what was inferred), did you mean (what was interpreted)?
8686
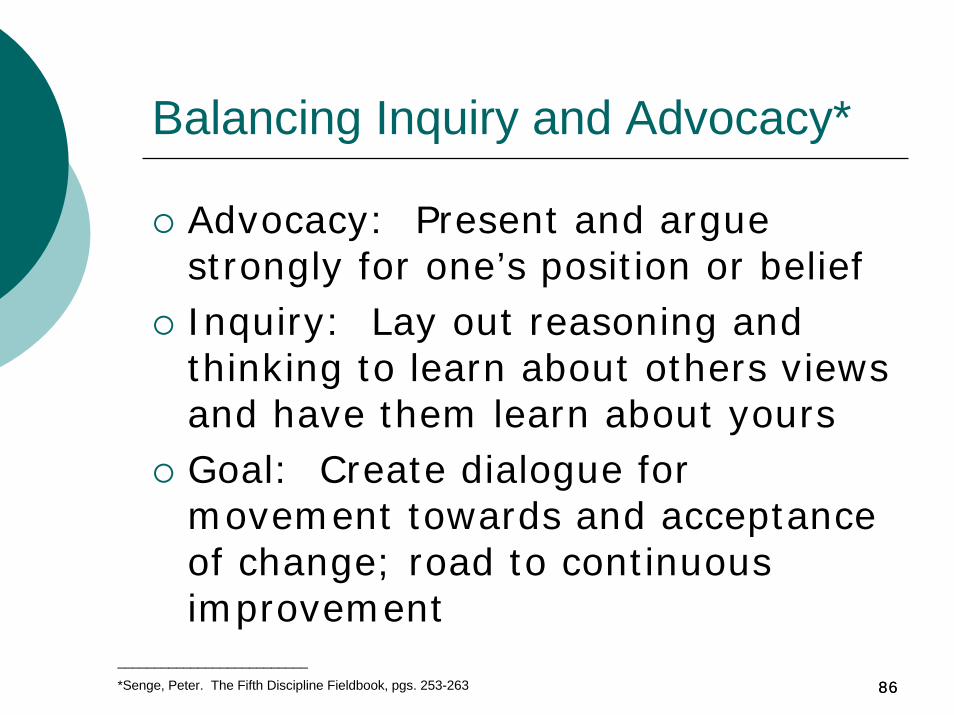
Balancing Inquiry and Advocacy*
Advocacy: Present and argue strongly for one’s position or beliefInquiry: Lay out reasoning and thinking to learn about others views and have them learn about yoursGoal: Create dialogue for movement towards and acceptance of change; road to continuous improvement
__________________________
*Senge, Peter. The Fifth Discipline Fieldbook, pgs. 253-263
8787
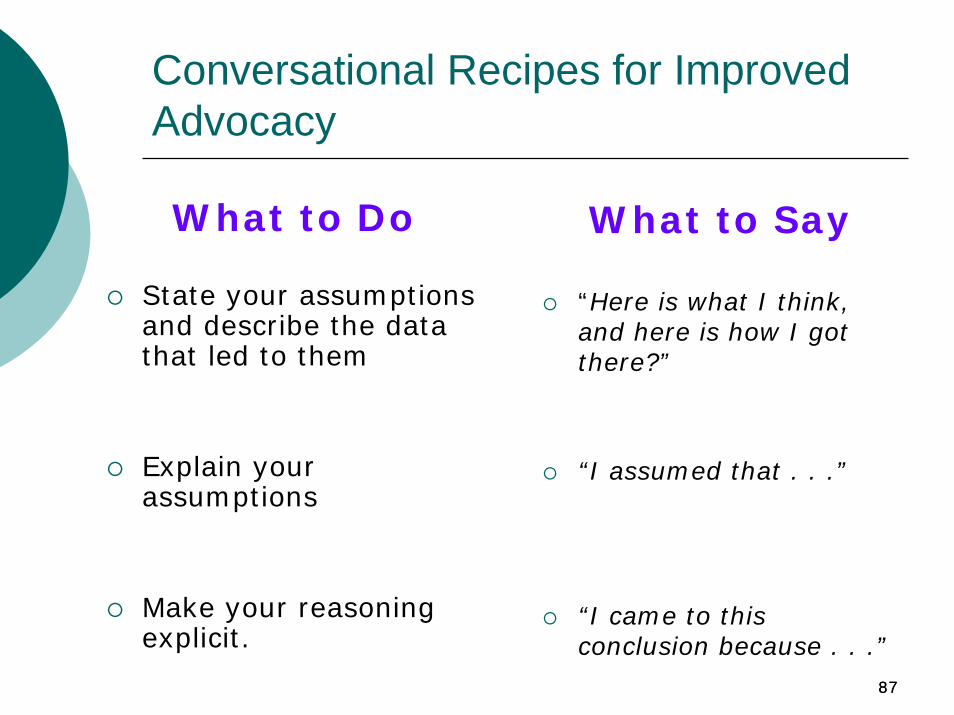
Conversational Recipes for Improved Advocacy
What to Do
State your assumptions and describe the data that led to them
Explain your assumptions
Make your reasoning explicit.
What to Say
“Here is what I think, and here is how I got there?”
“I assumed that . . .”
“I came to this conclusion because . . .”
8888
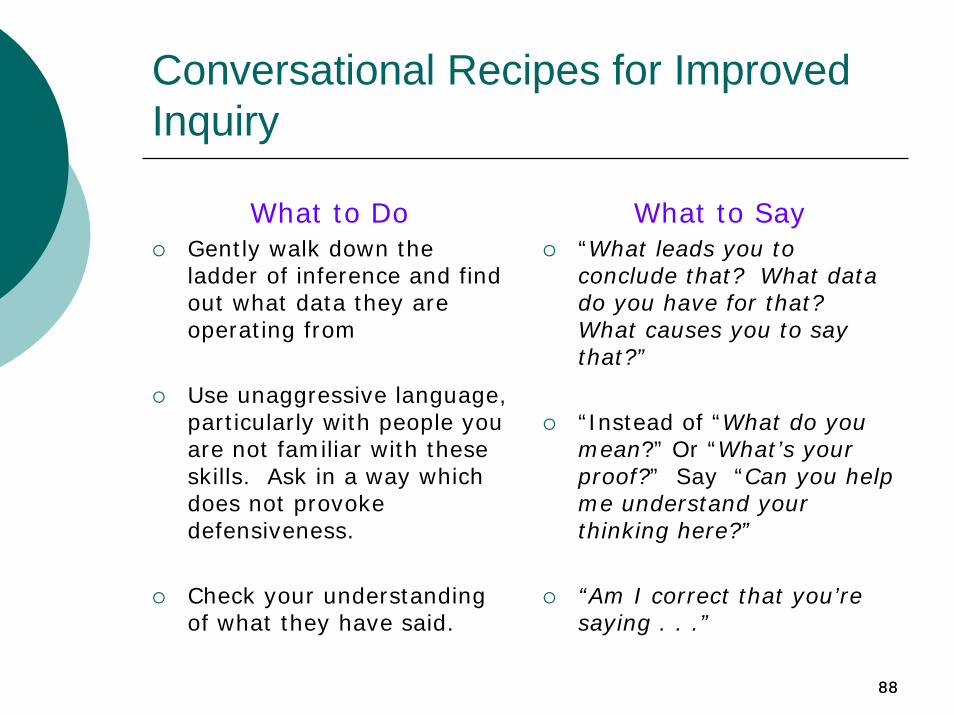
Conversational Recipes for Improved Inquiry
What to DoGently walk down the ladder of inference and find out what data they are operating from
Use unaggressive language, particularly with people you are not familiar with these skills. Ask in a way which does not provoke defensiveness.
Check your understanding of what they have said.
What to Say“What leads you to conclude that? What data do you have for that? What causes you to say that?”
“Instead of “What do you mean?” Or “What’s your proof?” Say “Can you help me understand your thinking here?”
“Am I correct that you’re saying . . .”
8989
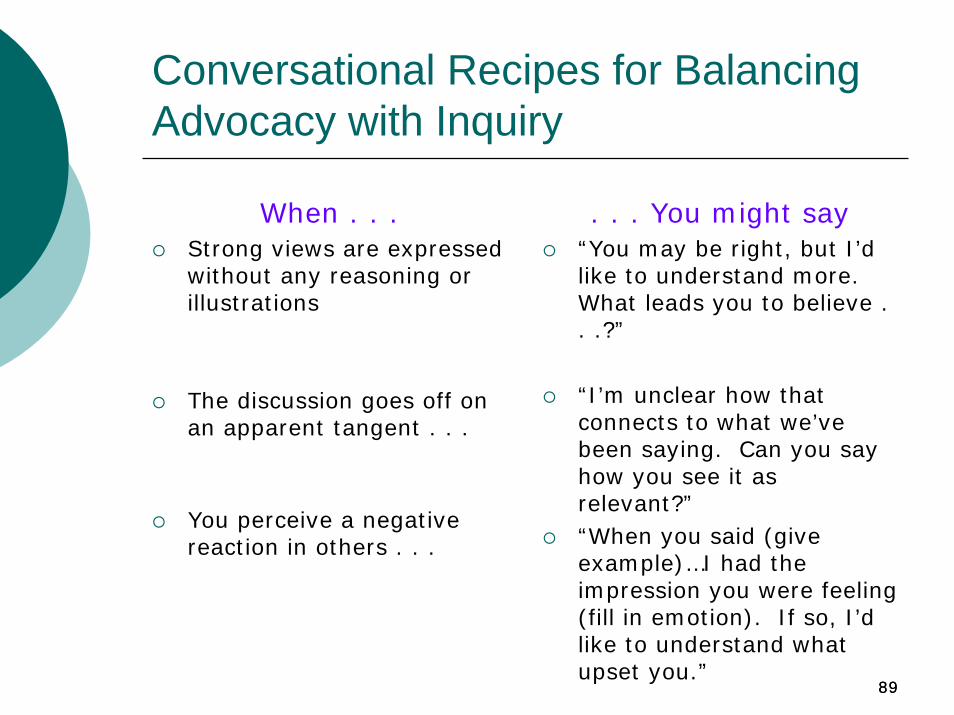
. . . You might say“You may be right, but I’d like to understand more. What leads you to believe . . .?”
“I’m unclear how that connects to what we’ve been saying. Can you say how you see it as relevant?”“When you said (give example)…I had the impression you were feeling (fill in emotion). If so, I’d like to understand what upset you.”
Conversational Recipes for Balancing Advocacy with Inquiry
When . . .Strong views are expressed without any reasoning or illustrations
The discussion goes off on an apparent tangent . . .
You perceive a negative reaction in others . . .
9090
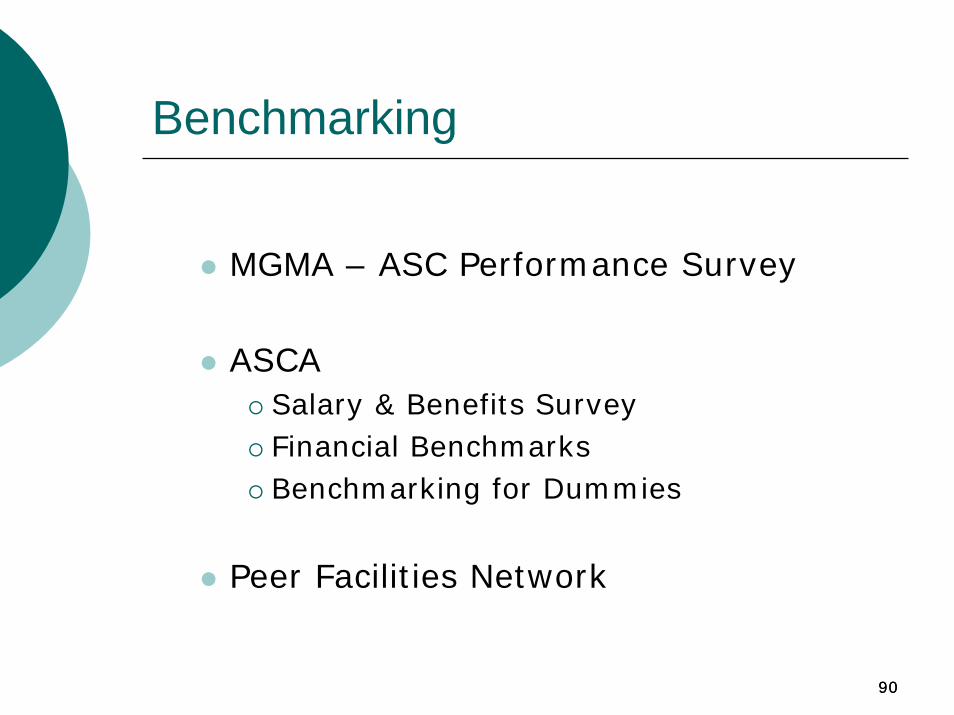
Benchmarking
MGMA – ASC Performance Survey
ASCA Salary & Benefits SurveyFinancial Benchmarks Benchmarking for Dummies
Peer Facilities Network
9191
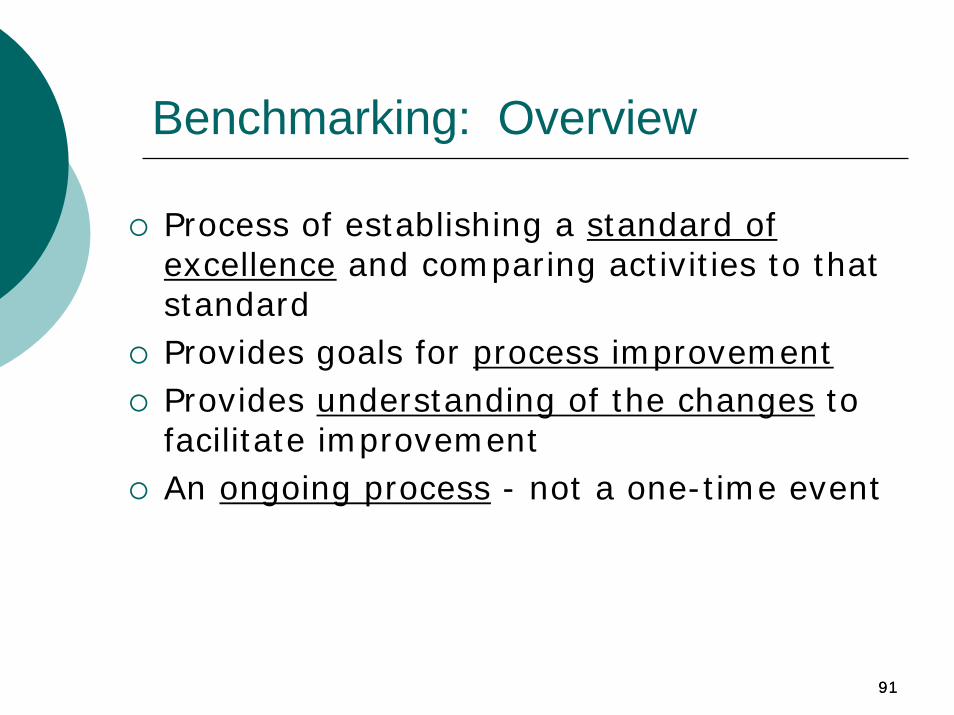
Benchmarking: Overview
Process of establishing a standard of excellence and comparing activities to that standardProvides goals for process improvementProvides understanding of the changes to facilitate improvementAn ongoing process - not a one-time event
9292
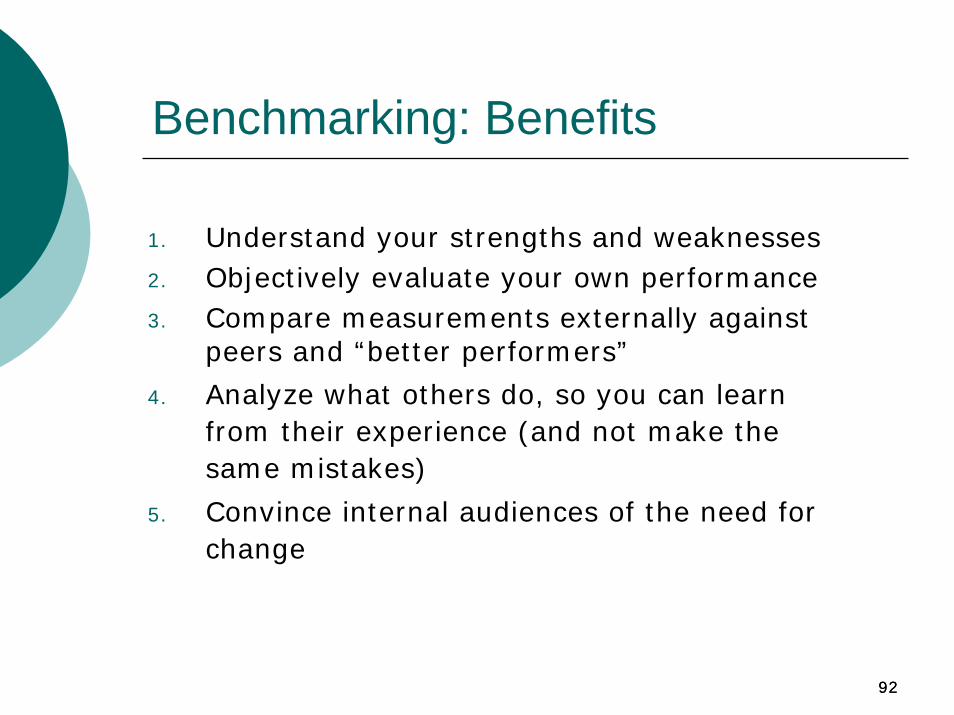
Benchmarking: Benefits
1. Understand your strengths and weaknesses2. Objectively evaluate your own performance3. Compare measurements externally against
peers and “better performers”
4. Analyze what others do, so you can learn from their experience (and not make the same mistakes)
5. Convince internal audiences of the need for change
9393
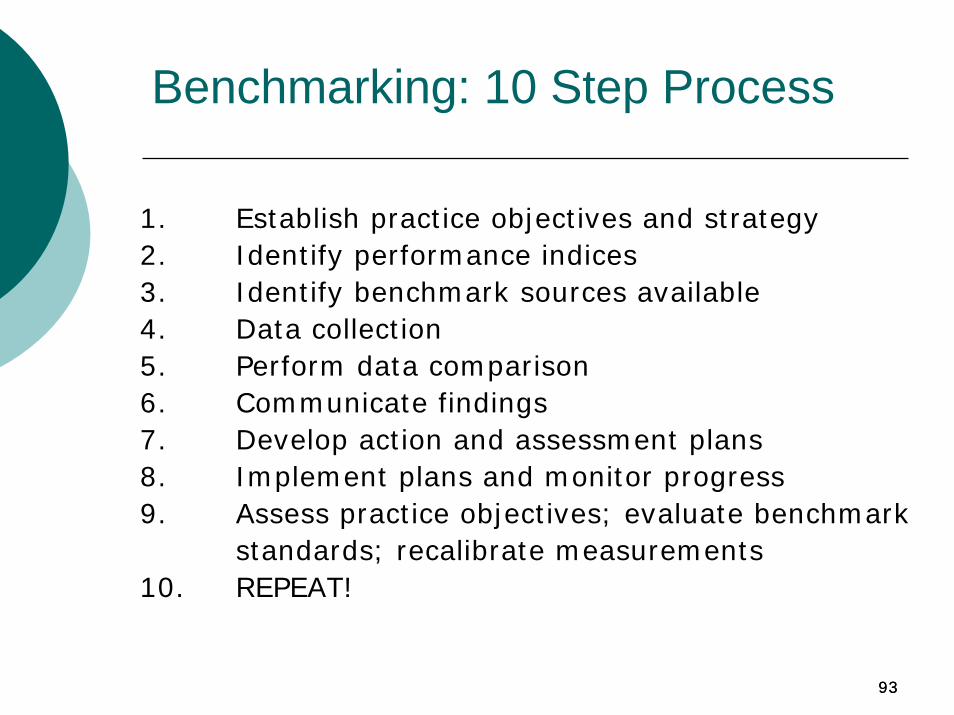
Benchmarking: 10 Step Process
1. Establish practice objectives and strategy2. Identify performance indices3. Identify benchmark sources available4. Data collection5. Perform data comparison6. Communicate findings7. Develop action and assessment plans8. Implement plans and monitor progress9. Assess practice objectives; evaluate benchmark
standards; recalibrate measurements10. REPEAT!
9494
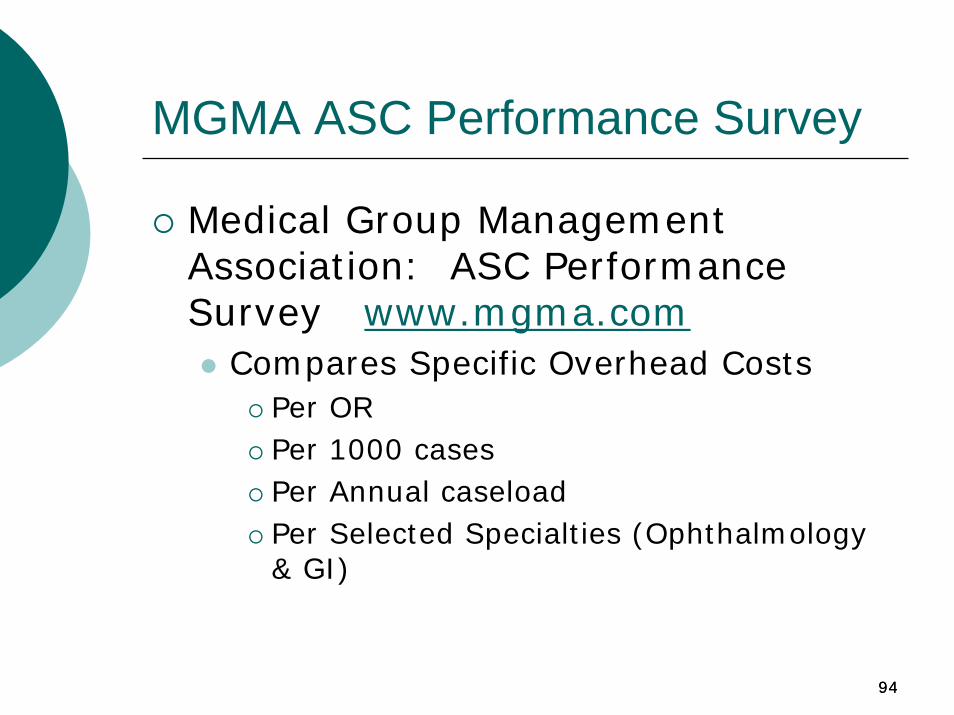
MGMA ASC Performance Survey
Medical Group Management Association: ASC Performance Survey www.mgma.com
Compares Specific Overhead CostsPer ORPer 1000 casesPer Annual caseloadPer Selected Specialties (Ophthalmology & GI)
9595
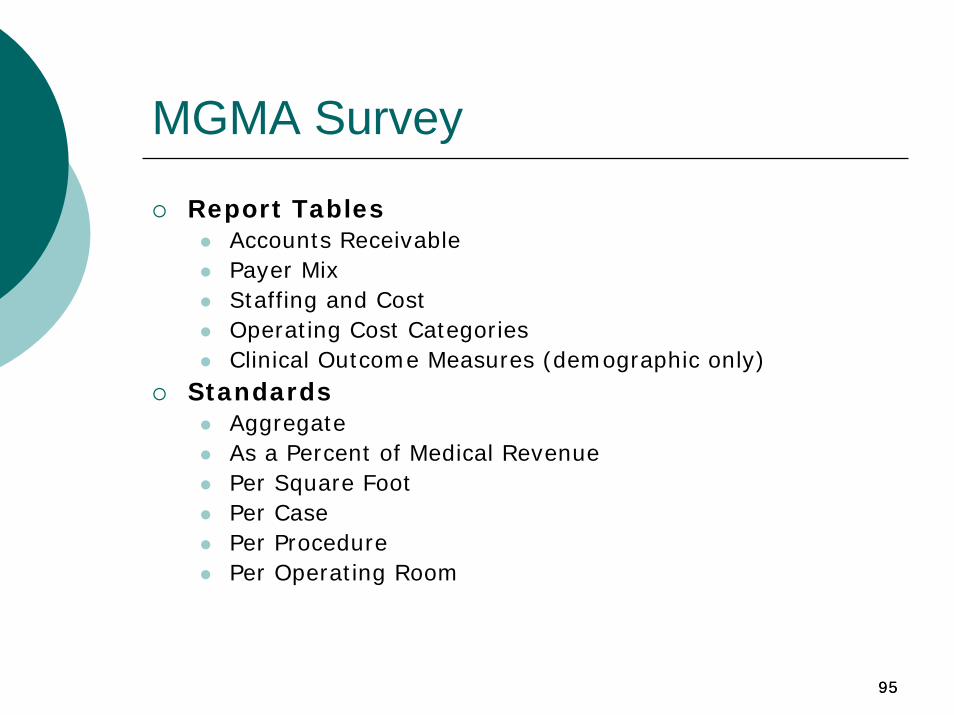
MGMA Survey
Report TablesAccounts ReceivablePayer MixStaffing and CostOperating Cost CategoriesClinical Outcome Measures (demographic only)
StandardsAggregateAs a Percent of Medical RevenuePer Square FootPer CasePer ProcedurePer Operating Room
9696
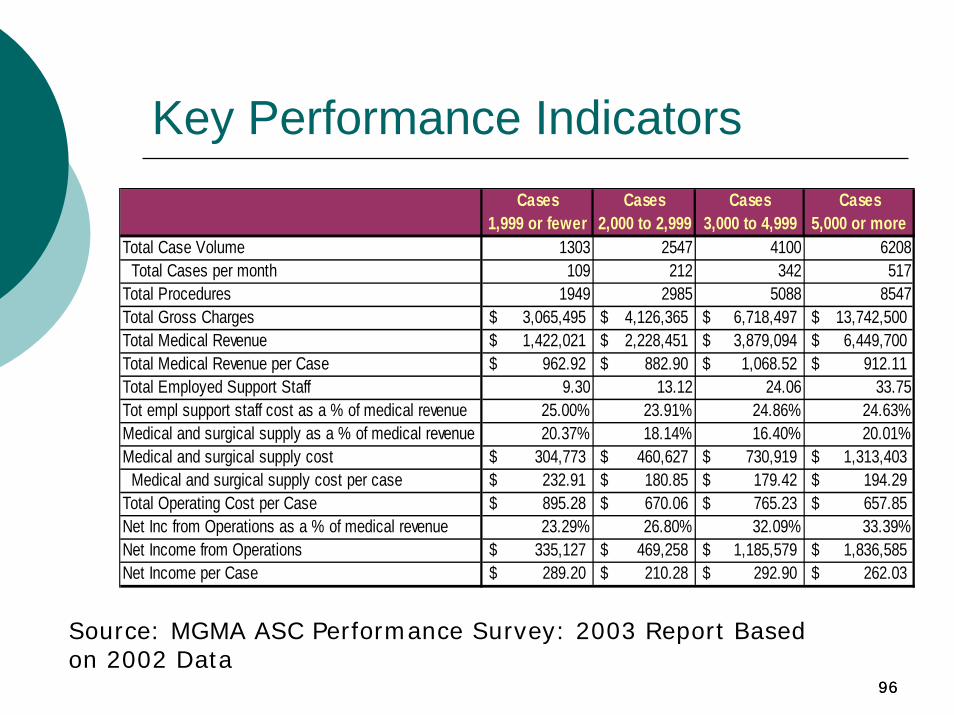
Key Performance IndicatorsCases Cases Cases Cases
1,999 or fewer 2,000 to 2,999 3,000 to 4,999 5,000 or moreTotal Case Volume 1303 2547 4100 6208 Total Cases per month 109 212 342 517Total Procedures 1949 2985 5088 8547Total Gross Charges 3,065,495$ 4,126,365$ 6,718,497$ 13,742,500$ Total Medical Revenue 1,422,021$ 2,228,451$ 3,879,094$ 6,449,700$ Total Medical Revenue per Case 962.92$ 882.90$ 1,068.52$ 912.11$ Total Employed Support Staff 9.30 13.12 24.06 33.75Tot empl support staff cost as a % of medical revenue 25.00% 23.91% 24.86% 24.63%Medical and surgical supply as a % of medical revenue 20.37% 18.14% 16.40% 20.01%Medical and surgical supply cost 304,773$ 460,627$ 730,919$ 1,313,403$ Medical and surgical supply cost per case 232.91$ 180.85$ 179.42$ 194.29$ Total Operating Cost per Case 895.28$ 670.06$ 765.23$ 657.85$ Net Inc from Operations as a % of medical revenue 23.29% 26.80% 32.09% 33.39%Net Income from Operations 335,127$ 469,258$ 1,185,579$ 1,836,585$ Net Income per Case 289.20$ 210.28$ 292.90$ 262.03$
Source: MGMA ASC Performance Survey: 2003 Report Based on 2002 Data

9797
ASCA Salary & Benefits Survey
The leading and only comprehensive ASC salary survey
National, Regional and Select State DataSalaries for 17 ASC Positions Bonus InformationEmployee Benefits Data
9898
ASCA Financial Benchmarks
Key ASC IndicatorsPerformance RatiosAccounts ReceivableCosts Per CaseSalaries and BenefitsMedical Supplies and Drug
9999
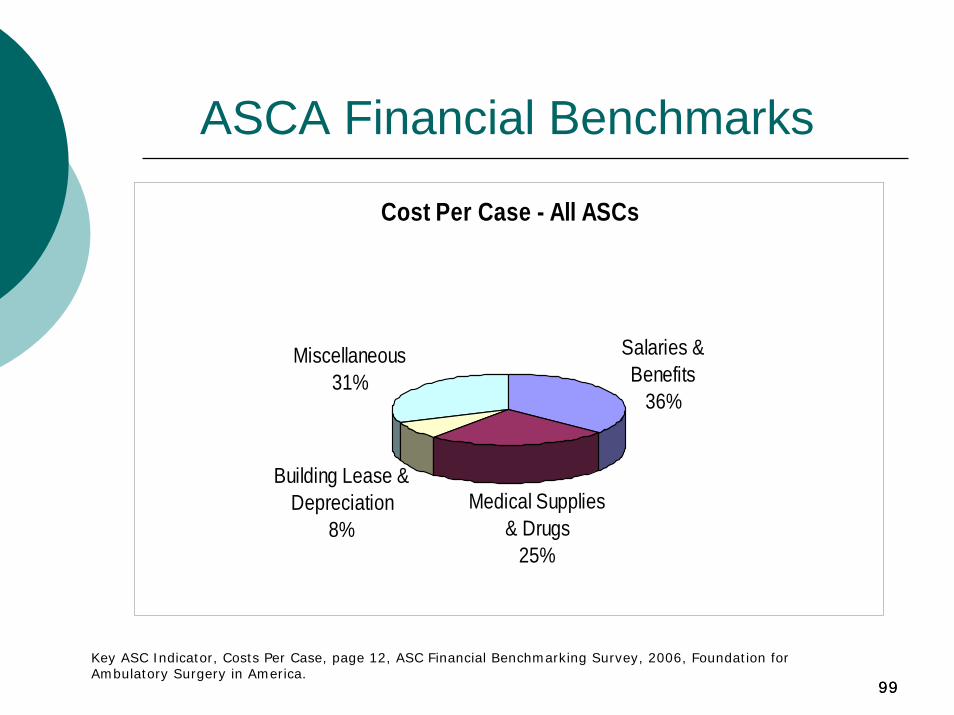
Cost Per Case - All ASCs
Salaries & Benefits
36%
Medical Supplies & Drugs
25%
Building Lease & Depreciation
8%
Miscellaneous31%
ASCA Financial Benchmarks
Key ASC Indicator, Costs Per Case, page 12, ASC Financial Benchmarking Survey, 2006, Foundation for Ambulatory Surgery in America.
100100
ASCA Financial Benchmarks - 2 Operational Information
Accounting MethodAnesthesia Professional TypeAnesthesia Service ArrangementsASC LocationFacility Accreditation & OrganizationFacility Size (Total Square Feet)Facility Size (Square Feet per OR/Procedure Room)Patient Encounter DistributionPayer Mix
101101
ASCA Financial Benchmarks - 3
Procedure Specific DataGross Charges Per CaseNet Revenue Per CaseCosts Per Case – Medical Supplies & DrugsMinutes Per Case
102102
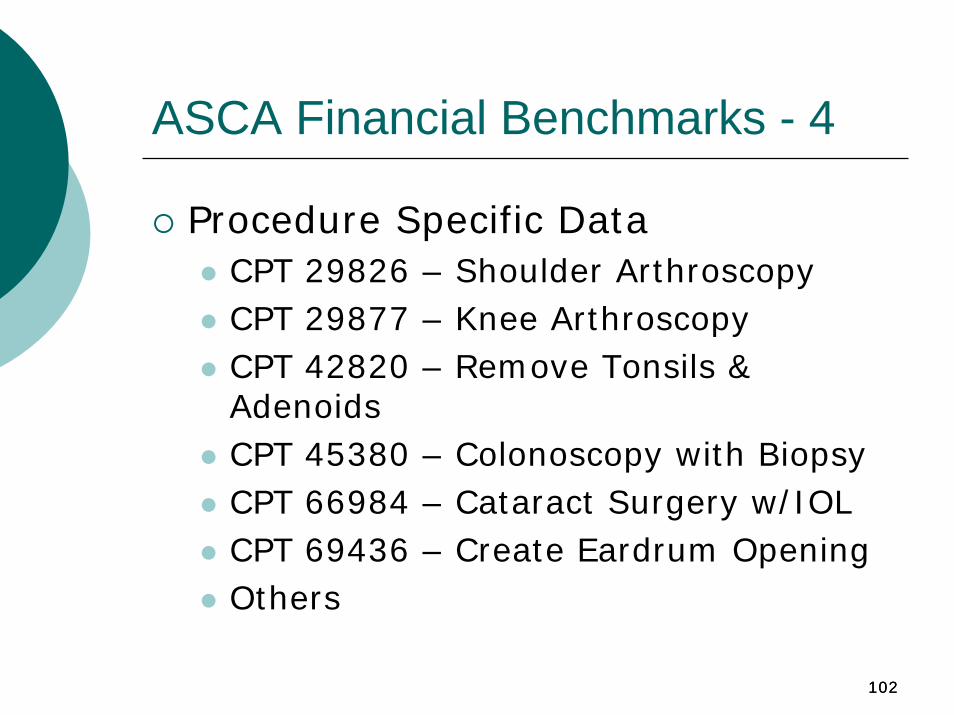
ASCA Financial Benchmarks - 4
Procedure Specific DataCPT 29826 – Shoulder ArthroscopyCPT 29877 – Knee ArthroscopyCPT 42820 – Remove Tonsils & AdenoidsCPT 45380 – Colonoscopy with BiopsyCPT 66984 – Cataract Surgery w/IOLCPT 69436 – Create Eardrum OpeningOthers
103103
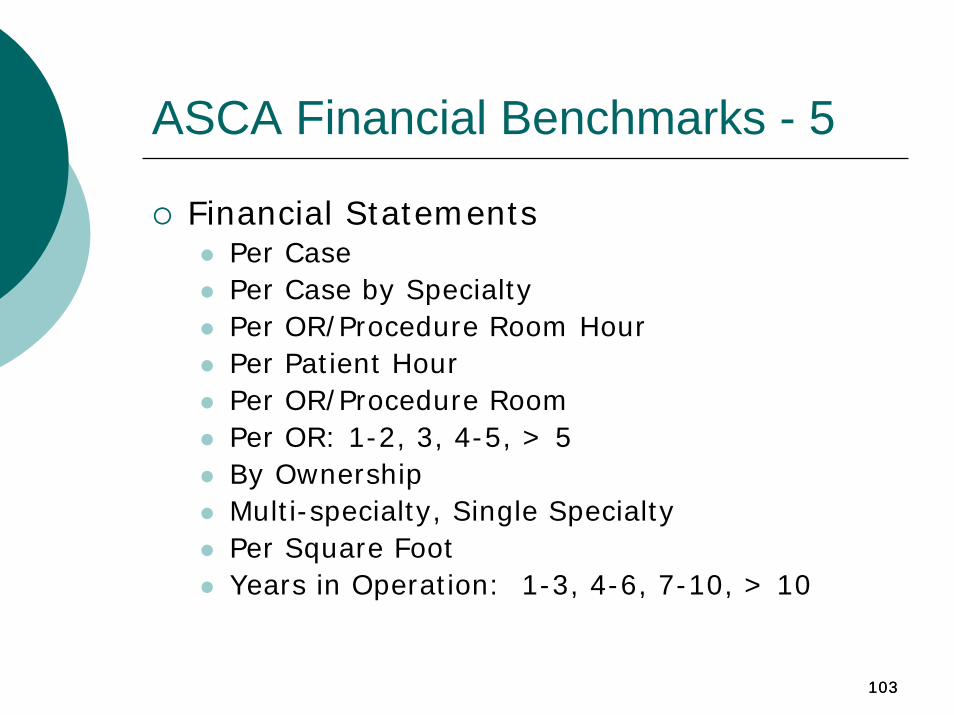
ASCA Financial Benchmarks - 5
Financial StatementsPer CasePer Case by SpecialtyPer OR/Procedure Room HourPer Patient HourPer OR/Procedure RoomPer OR: 1-2, 3, 4-5, > 5By OwnershipMulti-specialty, Single SpecialtyPer Square FootYears in Operation: 1-3, 4-6, 7-10, > 10
104104
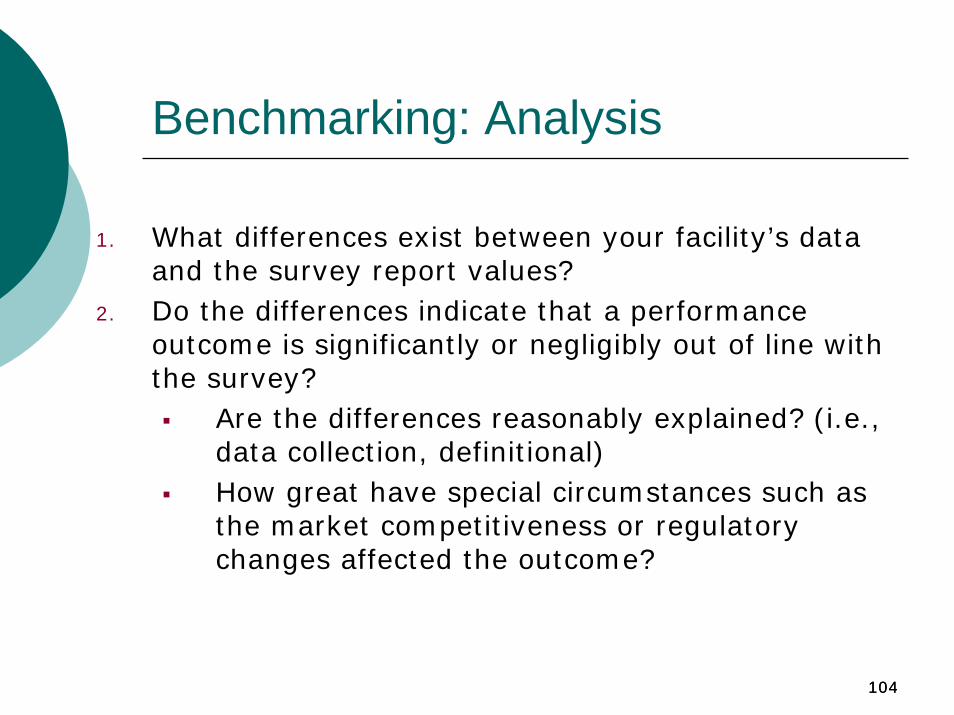
Benchmarking: Analysis
1. What differences exist between your facility’s data and the survey report values?
2. Do the differences indicate that a performance outcome is significantly or negligibly out of line with the survey?
Are the differences reasonably explained? (i.e., data collection, definitional)How great have special circumstances such as the market competitiveness or regulatory changes affected the outcome?
105105
Benchmarking: Analysis - 2
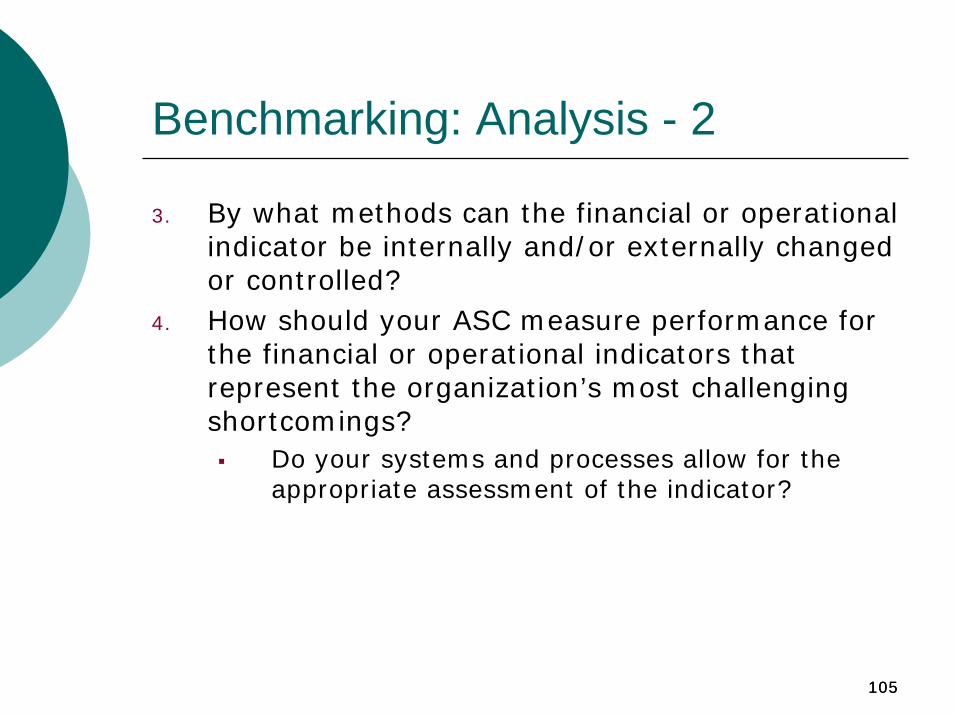
3. By what methods can the financial or operational indicator be internally and/or externally changed or controlled?
4. How should your ASC measure performance for the financial or operational indicators that represent the organization’s most challenging shortcomings?
Do your systems and processes allow for the appropriate assessment of the indicator?
106106
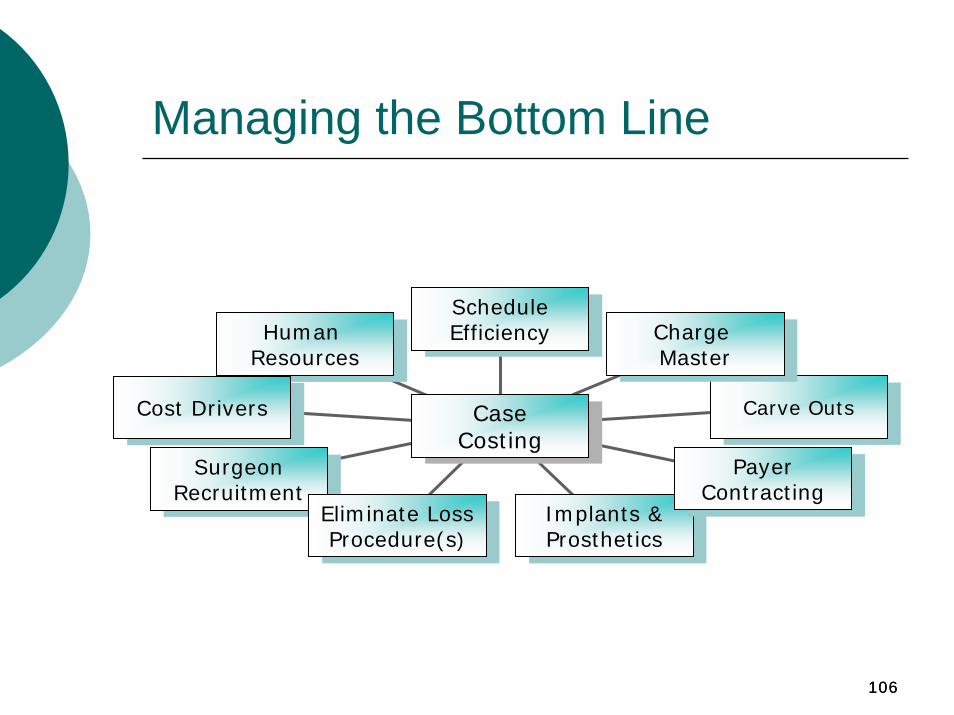
Managing the Bottom Line
Human Resources
Human Resources
Cost DriversCost Drivers
SurgeonRecruitment
SurgeonRecruitment
Eliminate LossProcedure(s)
Eliminate LossProcedure(s)
Implants & Prosthetics
Implants & Prosthetics
Payer Contracting
Payer Contracting
Carve OutsCarve Outs
Charge Master
Charge Master
Schedule Efficiency
Schedule Efficiency
Case CostingCase
Costing
107
Speaker contact informationAnn GeierAmbulatory Surgical Centers of AmericaPhone: (843) 216-2432 E-mail: [email protected] site: www.ascoa.com
Susan KizirianAmbulatory Surgical Centers of AmericaPhone: (850) 510-8203 E-mail: [email protected] site: www.ascoa.com