Embed Size (px)
Citation preview

University of Mississippi University of Mississippi
eGrove eGrove
Honors Theses Honors College (Sally McDonnell Barksdale Honors College)
2017
Case Analyses of Standard Accounting Practices Case Analyses of Standard Accounting Practices
Warren N. Ball University of Mississippi. Sally McDonnell Barksdale Honors College
Follow this and additional works at: https://egrove.olemiss.edu/hon_thesis
Part of the Accounting Commons
Recommended Citation Recommended Citation Ball, Warren N., "Case Analyses of Standard Accounting Practices" (2017). Honors Theses. 940. https://egrove.olemiss.edu/hon_thesis/940
This Undergraduate Thesis is brought to you for free and open access by the Honors College (Sally McDonnell Barksdale Honors College) at eGrove. It has been accepted for inclusion in Honors Theses by an authorized administrator of eGrove. For more information, please contact [email protected].

1
CASE ANALYSES OF STANDARD ACCOUNTING PRACTICES
By Warren Noble Ball III
A thesis presented in partial fulfillment of requirements for the Sally McDonnell Barksdale Honors College at The University of Mississippi.
Oxford, Mississippi May 2017
Approved by:
Advisor: Dr. Victoria Dickinson
Reader: Dr. Mark Wilder

2
TABLE OF CONTENTS
Cases Page Number
1. Glenwood Heating vs. Eads Heaters 1
2. Molson Coors Brewing Company 18
3. Golden Enterprises Inc. 30
4. Pearson PLC 39
5. Graphic Apparel Corporation 48
6. Northwest, Delta, & United 57
7. Rite Aid Corporation 61
8. Merck Inc. & GlaxoSmithKline PLC 71
9. State Street Corporation 78
10. Groupon Inc. 83
11. Construct Inc. 90
12. ZAGG Inc. 94
13. Johnson & Johnson 101

3
ABSTRACT
The completion of this thesis is due mostly in thanks to ACCY 420, a class
designed by the Patterson School of Accountancy and taught by Dr. Victoria Dickinson
that gives accounting students a structured process for designing their theses on
purposeful accounting topics. During my Junior and Senior years, there was a whirlwind
of activity surrounding accounting students: accounting classes step into a new realm of
difficulty, internship recruiting begins, and eventually my peers and I departed for multi-
month internships. All of that activity left us with far less time to work on our theses than
students in other academic arenas.
Luckily, ACCY 420 provided us with an effective process to write our theses.
During both semesters of our Junior year, this class would meet once a week, beginning
every other week with a new case study addressing an ambiguous situation or problem in
financial reporting. In these case studies, we were presented with more complex
accounting problems than normally encountered in standard accounting classes. Each
case required a large amount of background detail on the company (or companies) being
studied in the case and the solution was usually never cut-and-dry. That lack of a “right”
answer was perhaps the most helpful part of the class: whereas tests always have one
right answer, my peers and I often found that we had come to different conclusions on
how to handle certain situations in the case, which was good exposure to how problems
are tacked in the real world.
As far as knowledge gained from this class, I feel that ACCY 420 was beneficial
for me in multiple areas as I prepare to move into the real world. The first and most
4
obvious area that I improved in was knowledge of financial reporting as well as the
process of reporting those findings using technical skills (Excel) as I wrote my
professional reports. As I said before, ACCY 420 presented my classmates and I with
contextualized problems that were not so easily solved; there were not only multiple
variables in the problem, but also multiple approaches on what those variables meant and
how they affected the final solution. Encountering more difficult problems forces you as
a student to truly understand the accounting concepts behind the problem; otherwise, you
have no groundwork to solve the problem with. In this sense, ACCY 420 absolutely
enhanced my understanding of accounting principles in the areas our case studies
pertained to. Also, reporting my findings in a professional manner meant using some of
the tools in Excel that have always evaded me. As I later found out in my internship,
Excel will be my best friend in the coming years, so I was thankful for this class’
introduction to its usefulness.
However, my favorite part of the ACCY 420 experience (the part that I believe is
most important moving forward in my career) is working on complicated problems with
other people, all of whom exercise their critical thinking in different ways. The critical
thinking process can be difficult when you are dealing with a problem alone that you do
not fully understand; with a team, I was able to bounce ideas off of my teammates and
see the problem from other points of view that may have never even crossed my mind.
Then, after discovering each person’s point of view, we worked together to come to a
common agreement on the correct solution, which can also be a process if people are
adamant about their answer being the right one. Ultimately, it was this human element of
ACCY 420 that I enjoyed the most and believe is the most applicable to my future. No

5
matter how easy or complicated the problem, accounting is a team effort in every aspect
and requires as much social skill as it does technical skill. As I move forward into a
career in accounting, I will remember the different team dynamics encountered in ACCY
420 and the lessons I took from those experiences.

1
Financial Analysis for Potential Investment
Financial Position and Profitability of:
Glenwood Heating, Inc.
(Glenwood Springs, CO)
Vs.
Eads Heater, Inc.
(Eads, CO)
Presented by:
Warren Ball
The University of Mississippi

2
Table of Contents
• Comparative Analysis: (p. 3-6)
• Glenwood & Eads Financial Statements (p. 7-9/10-12)
• Ratio Comparisons: (p. 13)
Executive Summary
Glenwood Heating, Inc. and Eads Heater, Inc. are two highly comparable businesses
selling home heating units in Colorado, functioning under similar economic conditions
with identical operations during the year. While both companies have positive qualities
that make them attractive potential investments, my analysis has led me to believe that
Glenwood Heating would be the better investment choice for our company at this time
due to its higher profitability and Earnings per Share, among other qualities. Below, I will
discuss certain differentiating financial aspects of each company while also highlighting
some of the qualities that I believe make Glenwood a more attractive investment.

3
Analysis
Glenwood Eads
The three ratios listed above deal with these companies’ profitability, obviously an
important aspect to an investor. The bullet points below explain the meaning and
significance of these ratios.
• Return on Assets (ROA): Glenwood is receiving nearly 5% more return on their
assets in terms of income than Eads. Both companies’ main assets (land, building)
are identical; however, Eads has acquired equipment on a capital lease agreement,
therefore identifying their equipment as an asset. By identifying the equipment as
an asset, Eads “average total assets” increased, but their net income did not, hence
Eads’ lower ROA. While one could argue that Eads is technically in a more
secure position by owning their equipment, I believe that, long-term, Glenwood’s
rental of equipment will actually work in their favor. We live in a world that is
focusing more and more on conserving energy; as a result, energy-related
products and markets have become increasingly competitive. It’s highly unlikely
ReturnonAssets 0.14 ReturnonAssets 0.1
ReturnonOwner'sEquity 0.4 ReturnonOwner'sEquity 0.34
EarningsPerShare 28.98 EarningsPerShare 22.04

4
that the heaters Eads is currently selling are going to be relevant 8 years from
now. Therefore, Glenwood’s choice to rent equipment should be viewed as higher
flexibility, not lower security.
• Return on Owner’s Equity (ROE): This statistic measures the return on
stockholders’ investments after interest is paid to creditors, a category in which
Glenwood leads by 6%. Even with identical amounts of Common Stock invested
in each company, Glenwood managed to produce $22,227 more in both Net
Income and Retained Earnings than Eads, leading to a higher ROE.
• Earnings per Share: As a result of Glenwood’s higher Net Income on the year,
Glenwood’s shares are worth $6.94 more per share than Eads stock, a wide
margin for any potential investor. The numbers speak for themselves.
Glenwood Eads
ProfitMargin 0.23 ProfitMargin 0.18
DebtRatio 0.64 DebtRatio 0.71
• Profit Margin: Glenwood is keeping 5% more of their total sales dollars than
Eads, or $22,227 more Net Income. Much like Earnings per Share, this ratio
comparison somewhat speaks for itself. If Glenwood and Eads continue to
produce identical or even relatively similar amounts of sales, Glenwood’s Profit

5
Margin will result in a company with much more Retained Earnings and better
Earnings per Share.
• Debt Ratio: Glenwood’s lower Debt Ratio brings us back to the company’s
choice to rent their equipment rather than lease it. Eads is locked in on an 8-year
capital lease agreement with an 8% interest rate that will have them paying
$16,000 every year. Glenwood, on the other hand, has agreed to 2 years’ worth of
$16,000 rental payments without indebting themselves to a supplier. Once again,
Glenwood’s decision to rent equipment works in their favor.
The last item I want to address is each company’s cash flow, particularly relating to their
cash flows from operations. As you can see below, Glenwood’s operating cash flow lost
$16,049 more dollars than Eads, which, on the surface, may be concerning; after all, cash
is king. However, the charts below will show you that this seemingly negative aspect of
Glenwood’s operations derives mainly from their choices in GAAP application compared
to Eads.

6
The three areas to concentrate on are 1) depreciation expense, 2) bad debt expense, and 3)
inventory. 1) Eads chose to depreciate their delivery equipment using the double-
declining balance method, whereas Glenwood used straight-line depreciation. This choice
results in Eads accounting for $22,500 more depreciation, which positively affects their
cash flow. 2) Eads estimated their bad debt at 5% of accounts receivable compared to
only 1% by Glenwood, resulting in Eads accounting for $3,976 more bad debt expense
than Glenwood. 3) Eads used LIFO inventory method and Glenwood used FIFO. Both
companies’ inventory was valued higher the later it was purchased, which means that
Glenwood (using FIFO) ends the year with higher-valued equipment. As a result,
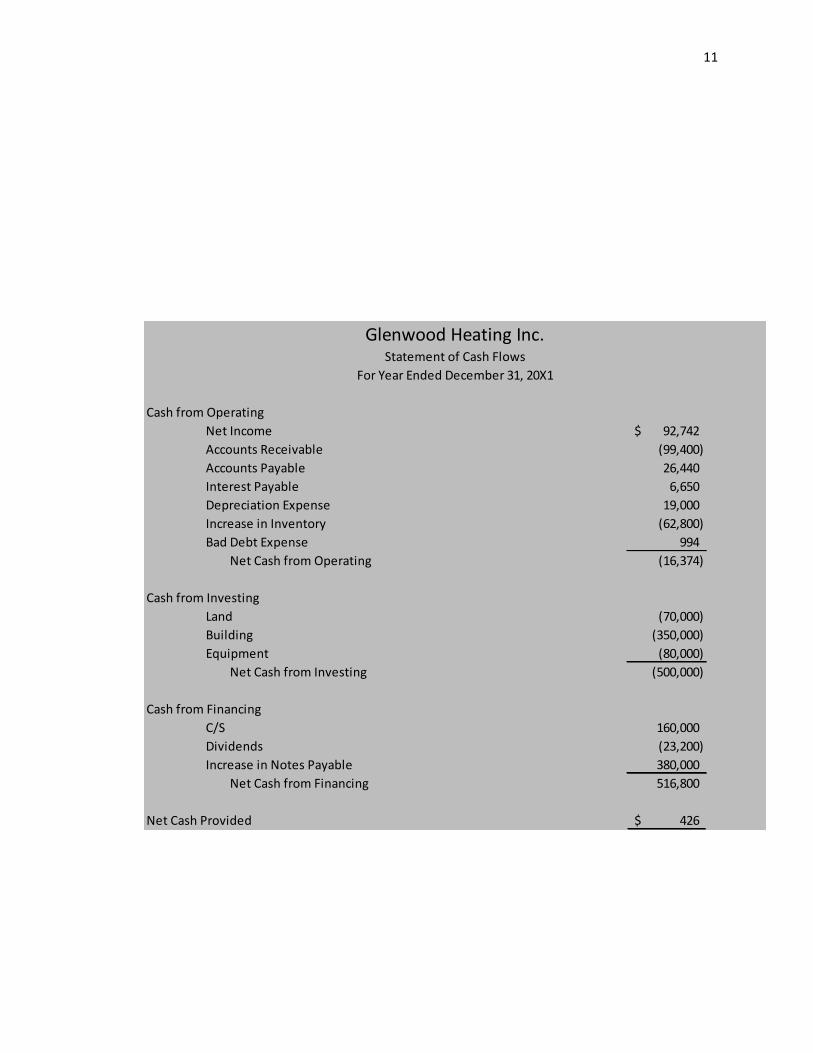
CashfromOperatingNetIncome 92,742$AccountsReceivable (99,400)AccountsPayable 26,440InterestPayable 6,650DepreciationExpense 19,000IncreaseinInventory (62,800)BadDebtExpense 994
NetCashfromOperating (16,374)
GlenwoodHeatingInc.StatementofCashFlows
ForYearEndedDecember31,20X1
CashfromOperatingNetIncome 70,515$AccountsReceivable (99,400)AccountsPayable 26,440InterestPayable 6,650DepreciationExpense 41,500BadDebtExpense 4,970IncreaseinInventory (51,000)
NetCashfromOperating (325)
EadsHeatersInc.StatementofCashFlows
ForYearEndedDecember31,20X1
7
Glenwood’s inventory drives their cash flow from operations down by $11,800 more than
Eads. All 3 of these factors make Glenwood’s cash flow from operations appear much
worse than Eads, when in reality Glenwood could simply change their application of
GAAP and the cash flows would look much different.
Note: The Appendix below will provide with both Glenwood’s and Eads’ financial
statements, along with all their comparative ratios.

8
Appendix
• Glenwood Heating, Inc. Financial Statements

9
CurrentAssetsCash 426$AccountsReceivable 99,400
Less:AllowanceforDoubtfulAccounts 994 98,406Inventory 62,800
161,632$
Long-termAssetsLand 70,000Building 350,000
Less:AccumulatedDepreciation 10,000 340,000Equiment 80,000
Less:AccumulatedDepreciation 9,000 71,000TotalLong-termAssets 481,000
TotalAssets 642,632$
CurrentLiabilitiesAccountsPayable 26,440$InterestPayable 6,650
TotalCurrentLiabilities 33,090$
Long-termDebtNotesPayable 380,000
TotalLiabilities 413,090
Stockholders'EquityCommonStock 160,000$RetainedEarnings 92,742Less:DividendsPaid 23,200 69,542
TotalEquity 229,542
TotalLiabilitiesandStockholderEquity 642,632$
Liabilities&Owners'Equity
GlenwoodHeatingInc.ClassifiedBalanceSheet
December31,20X1
Assets
TotalCurrentAssets

10
Sales 398,500$CostofGoodsSold 177,000
GrossProfit 221,500SellingandAdministrativeExpenses
BadDebtExpense 994DepreciationExpense 19,000OtherOperatingExpenses 34,200RentExpense 16,000
TotalSellingandAdministrativeExpenses 70,194
IncomefromOperations 151,306OtherExpenses
InterestExpense 27,650
IncomebeforeTaxes 123,656ProvisionforIncomeTaxes 30,914
NetIncome 92,742$
GlenwoodHeatingInc.IncomeStatement
ForYearEndedDecember31,20X1
BeginningRetainedEarnings -Plus:NetIncome 92,742Less:Dividends (23,200)
EndingRetainedEarnings 69,542$
GlenwoodHeatingInc.StatementofRetainedEarnings
ForYearEndedDecember31,20X1
11
CashfromOperatingNetIncome 92,742$AccountsReceivable (99,400)AccountsPayable 26,440InterestPayable 6,650DepreciationExpense 19,000IncreaseinInventory (62,800)BadDebtExpense 994
NetCashfromOperating (16,374)
CashfromInvestingLand (70,000)Building (350,000)Equipment (80,000)
NetCashfromInvesting (500,000)
CashfromFinancingC/S 160,000Dividends (23,200)IncreaseinNotesPayable 380,000
NetCashfromFinancing 516,800
NetCashProvided 426$
GlenwoodHeatingInc.StatementofCashFlows
ForYearEndedDecember31,20X1

12
• Eads Heater, Inc. Financial Statements
13
CurrentAssetsCash 7,835$AccountsReceivable 99,400
Less:AllowanceforDoubtfulAccounts 4,970 94,430Inventory 51,000
TotalCurrentAssets 153,265$
Long-termAssetsLand 70,000Building 350,000
Less:AccumulatedDepreciation 10,000 340,000Equiment 80,000
Less:AccumulatedDepreciation 20,000 60,000LeasedEquipment 92,000
Less:AccumulatedDepreciation 11,500 80,500TotalLong-termAssets 550,500
TotalAssets 703,765$
CurrentLiabilitiesAccountsPayable 26,440$InterestPayable 6,650
TotalCurrentLiabilities 33,090$
Long-termDebtNotesPayable 380,000LeasePayable 83,360
TotalLong-termLiabilities 463,360TotalLiabilities 496,450
Stockholders'EquityCommonStock 160,000$RetainedEarnings 70,515Less:DividendsPaid 23,200 47,315
TotalEquity 207,315
TotalLiabilitiesandStockholderEquity 703,765$
EadsHeatersInc.ClassifiedBalanceSheet
December31,20X1
Assets
Liabilities&Owners'Equity

14
Sales 398,500$CostofGoodsSold 188,800
GrossProfit 209,700SellingandAdministrativeExpenses
BadDebtExpense 4,970DepreciationExpense 41,500OtherOperatingExpenses 34,200RentExpense -
TotalSellingandAdministrativeExpenses 80,670
IncomefromOperations 129,030OtherExpenses
InterestExpense 35,010
IncomebeforeTaxes 94,020ProvisionforIncomeTaxes 23,505
NetIncome 70,515$
EadsHeatersInc.IncomeStatement
ForYearEndedDecember31,20X1
BeginningRetainedEarnings -Plus:NetIncome 70,515Less:Dividends (23,200)
EndingRetainedEarnings 47,315$
EadsHeatersInc.StatementofRetainedEarnings
ForYearEndedDecember31,20X1

15
CashfromOperatingNetIncome 70,515$AccountsReceivable (99,400)AccountsPayable 26,440InterestPayable 6,650DepreciationExpense 41,500BadDebtExpense 4,970IncreaseinInventory (51,000)
NetCashfromOperating (325)
CashfromInvestingLand (70,000)Building (350,000)Equipment (80,000)LeasedEquipment (92,000)
NetCashfromInvesting (592,000)
CashfromFinancingC/S 160,000Dividends (23,200)IncreaseinNotesPayable 380,000IncreaseinLeasePayable 83,360$
NetCashfromFinancing 600,160$
NetCashProvided 7835
EadsHeatersInc.StatementofCashFlows
ForYearEndedDecember31,20X1

16
Glenwood & Eads Comparative Ratios
Glenwood Eads
Liquidity
Current Ratio !"#!!!"##!!"#$$
!"##$!!!"# = 4.8 !"#$!!!"##!!"###
!"##$!!!"#
= 4.73
Acid-Test Ratio !"#!98406!"##$!!!"#
= 2.99 !"#$!!""#$!"##$!!!"#
=
3.09
Accounts Receivable Turnover !"#$%%!"#$%
= 4.05 !"#$%%!""#$
=
4.22
Days to Collect Receivables !"#!.!"
= 90.1 !"#!.!!
=
86.5
Inventory Turnover !""###!"#$$
= 2.82 !"""##!"###
=
3.7
Days to Sell Inventory !"#!.!"
= 129.43 !"#!.!
=
98.65
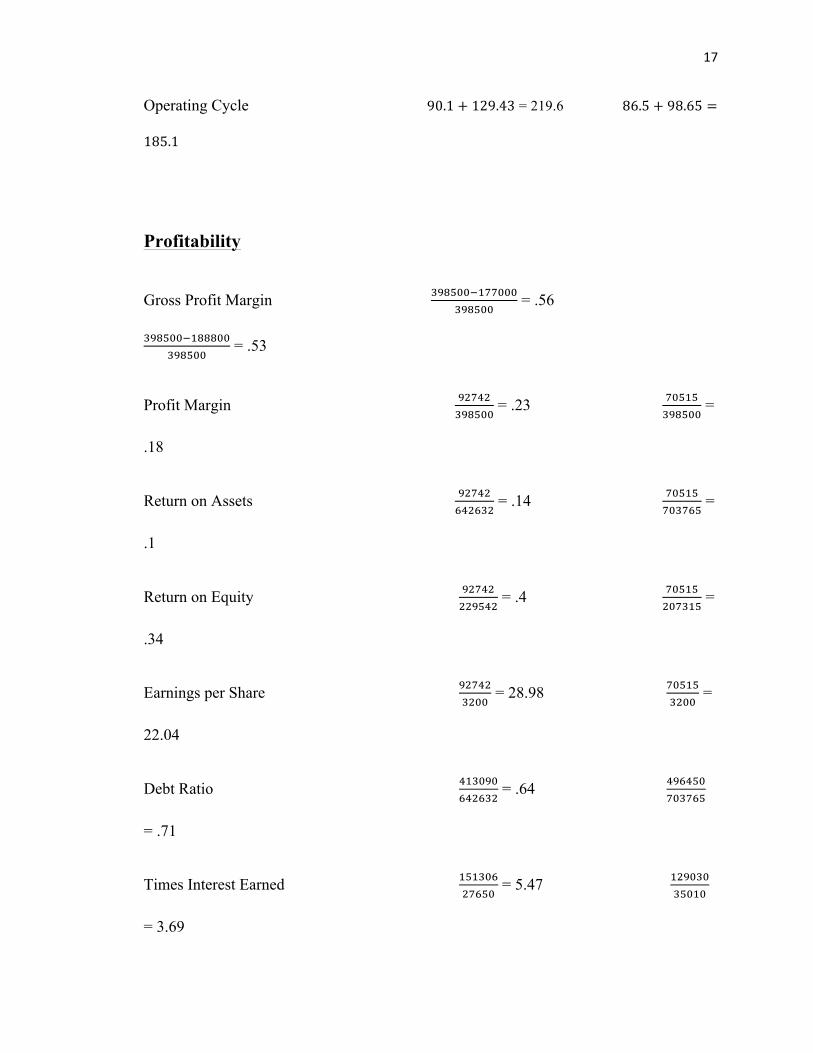
17
Operating Cycle 90.1 + 129.43 = 219.6 86.5 + 98.65 =
185.1
Profitability
Gross Profit Margin !"#$%%!!""###!"#$%%
= .56
!"#$%%!!"""##!"#$%%
= .53
Profit Margin !"#$"!"#$%%
= .23 !"#$#!"#$%%
=
.18
Return on Assets !"#$"!"#!$#
= .14 !"#$#!"#!$%
=
.1
Return on Equity !"#$"!!"#$!
= .4 !"#$#!"#$%&
=
.34
Earnings per Share !"#$"!"##
= 28.98 !"#$#!"##
=
22.04
Debt Ratio !"#$%$!"#!$#
= .64 !"#!$%!"#!$%
= .71
Times Interest Earned !"!#$%!"#$%
= 5.47 !"#$%$!"#$#
= 3.69

18
Financial Analysis for Potential Investment
Molson Coors Brewing Company
Profitability and Earnings Persistence
Presented by:
Warren Ball
The University of Mississippi

19
Summary
As a potential investor in Molson Coors Brewing Company, the company’s efficiency,
profitability, and resulting future stock prices are all important factors in our investment
decision. One of the main concentrations in our analysis of Molson Coors was
differentiating between the company’s operations and non-operations related items, from
non-operating assets to discontinued operations. A company’s income from operations is
the biggest driver behind its stock prices and profitability; with this knowledge, we
analyzed what portion of Molson Coors’ income is expected to reoccur (persistent
income) as well as the company’s return on their operating assets (efficiency). Below, I
will highlight the 3 main factors that I believe make Molson Coors an attractive
investment opportunity.
• Effective Tax Rate: The United States Federal Statutory rate for income taxes is
35%, roughly 19% higher than Molson Coors’ effective tax rate. This discrepancy
derives from Molson Coors’ tax planning as well as their foreign businesses,
which operate under a significantly lower income tax rate than the U.S. Although
Molson Coors’ operations and general effectiveness as a company do not
positively affect their tax rates, their lower tax rates will have a noticeable effect

20
on their income. Caution: Do not be alarmed by the fact that our calculated
effective tax rate is about 3% higher than previous years for Molson Coors. In our
estimations of future tax rates, we were conservative in our elimination of certain
unpredictable elements, namely unrecognized tax benefit, change in valuation
allowance, and “Other, net.” We also expect foreign tax rates to remain
consistent, and Molson Coors will continue to reap the benefits from these
cheaper tax rates. See part J) in the appendix for further detail.
• Increase in both Operating Profit Margin and Net Operating Asset Turnover:
Relevant financial ratios to a company’s operations can be very useful in
identifying a company’s efficiency and profitability; for Molson Coors, those
ratios are operating profit margin and net operating asset turnover. Because of a
higher net operating profit after tax in 2013, Molson Coors was able to increase
their operating profit margin by 1.1%. We also saw net operating asset turnover
increase from 3.56 to 4.82, or a 26% increase. Molson Coors was able to increase
their turnover during the year of 2012-2013 by producing $384.6 Million more in
sales even with $330.7 Million less in average net operating assets. Both of these
ratios speak to increased profitability and efficiency within Molson Coors, and
both ratios play directly into our most important item in supporting a Molson
Coors investment.
• Return on Net Operating Assets (RNOA): Earlier in our summary, we mentioned
that operating income is the biggest driver of profitability and stock price
increases. RNOA is the perfect ratio to quantify this relationship, and for Molson
Coors RNOA indicates an improving company with stability. First, their RNOA

21
increased 22.3% from 2012 to 2013, close to a 25% improvement in operating
efficiency. Secondly, Molson Coors’ RNOA only dropped 6.2% after eliminating
non-persistent income from the equation. Just over 91% of Molson Coors’ income
after tax derives from persistent income, a great indicator of current stability in
the company’s revenue flows.
Ultimately, I believe that these 3 factors are the most important in supporting an
investment in Molson Coors Brewing Company. However, if greater detail is needed
or wanted for making this decision, the appendix below will provide it.
22
Appendix
The answers below provide detailed explanations to questions provided in our case. This
appendix will 1) highlight important elements in evaluating Molson Coors Brewing
Company’s future profitability and 2) give you a more thorough, step-by-step analysis of
why we chose to invest in Molson Coors. Each letter responds to a question in our case.
A) The major classifications on an income statement are: sales, gross profit, expenses
(controllable and fixed), profit, and loss. Each one of these income statement
elements is crucial to the process of determining a company’s income, including
their income from operations.
B) Classified income statements permit users to assess the amounts, timing and
uncertainty of future cash flows. Prediction of future cash flows is key to any
potential or current investor’s financial interest in the company.
C) Financial statement users would be interested in persistent income because it is
the portion of a company’s income that can be fully expected to reoccur the
following year. Considering that investments are made based on potential future
profitability, persistent income is obviously important.
D) Comprehensive income includes all changes in equity during a period except
those resulting from an investment by an owner or a distribution to owners. Net
income includes all changes in owner’s equity.
23
E) Net sales =𝑆𝑎𝑙𝑒𝑠 − 𝑒𝑥𝑐𝑖𝑠𝑒 𝑡𝑎𝑥. Excise taxes inflate the total sales number. If
Molson Coors chose not to subtract excise tax from sales, their sales numbers
would be inflated by an average of 1,715 million per year, subsequently
decreasing their profit margin.
F) Special items are gains or expenses that a company believes are not indicative of
their core operations. These items are listed separately because it is likely that
they will not reoccur. While there are a couple of items that seem unrelated to
operations (flood losses, for example), for the most part Molson Coors’
assessment of special items is accurate. In Molson Coors’ case, some of these
items include:
- Expenses from restructuring employee severance programs
- Flood losses
- Asset impairment
G) “Other income” related expenses and gains are completely unrelated to
operations, whereas special items are non-recurring operations-related items.
H) Comprehensive income totals 760.2 million for the year compared to 572.5
million in net income. The 188.3 million in additional income attributed to
comprehensive income stems entirely from non-operating gains, such as foreign
currency and pension adjustments.
I) There are 3 statements on Molson Coors’ income statement that we considered
non-persistent:
- Special Items: they may still exist next year, but the future
amounts of these items are undeterminable.

24
- Income/losses from discontinued operations.
These items are self-explanatory. - Income/losses from non-
controllable interests: like special items, non-controllable interests will probably
affect the company next year, but there is no accurate way to determine these
amounts.
J) Elements 1-4 are consistent tax rates that can be expected to reoccur at similar
values to previous years. Unrecognized tax benefit, change in valuation
allowance, and “other” taxes (elements 5-7) are unpredictable both in amount and
existence for future years. We considered eliminating the unpredictable taxes
from our effective tax rate but ultimately determined that eliminating these
elements would probably result in an undervaluation of tax expenses for the
company. Instead, we averaged the amounts of each element (predictable and
unpredictable) and added these totals up to create a new effective tax rate.
-Note: Foreign tax law rate was not averaged because its 2012 total was
not indicative of future rates: Serbia’s change in foreign policy resulted in a
temporarily 5% higher corporate income tax rate. Instead, we used the 2013
foreign tax law rate.

25
K) Our calculation of Molson Coors’ persistent income can be found in the chart on
the next page. We used our effective tax rate calculated in J) to tax these items.
Also, we are told that discontinued operations, special items, and other income are
all nonrecurring items.
35%1.40%-24.40%0.50%0.50%2.25%1%
16.35%EffectiveTaxRate
EffectofforeigntaxratesEffectofforeigntaxlaw
EffectofunrecognizedtaxbenefitsChangeinvaluationallowance
Other,net
MolsonCoorsBrewingCompanyEffectiveTaxRate
FederalStatutoryIncometaxrateStateincometaxes,netoffed.benefits

26
1-i) We determined that special items, discontinued operations, and other income are all
non-operating items. The only other item we considered as possibly non-operating was
non-controlling interest; however, because the operations of subsidiaries of Molson
Coors produced this income, we classified it as an operating item.
1-ii) Note: Other income and special items are both listed at “before tax” on the income
statement; for these items, we will apply the company’s three year marginal tax rate of
12%. Discontinued operations are listed as “after tax” and remain the same as previously
listed on the income statement.
2013 2012 20115999.6 5615 5169.9-1793.5 -1698.5 -1654.24206.1 3916.5 3515.7-2545.6 -2352.5 -2049.11660.5 1564 1466.6-1193.8 -1126.1 -1019
539 510.9 457.91005.7 948.8 905.5-164.43 -155.13 -148.05841.27 793.67 757.45
OperatingIncomeIncomeTaxExpense
NIfromContinuingOperations
PersistentIncome 797.46
NetSales
GrossProfitCostofGoodsSold
Marketing,General,AdminexpEquityIncomeinMillerCoors
MolsonCoorsBrewingCompanyandSubsidiariesConsolidatedPersistentIncomeStatement
(InMillions)
SalesExcisetaxes

27
1-iii)
𝑁𝑒𝑡 𝑂𝑝𝑒𝑟𝑎𝑡𝑖𝑛𝑔 𝑃𝑟𝑜𝑓𝑖𝑡 𝐴𝑓𝑡𝑒𝑟 𝑇𝑎𝑥
= 𝑁/𝐼 𝑏𝑒𝑓𝑜𝑟𝑒 𝑒𝑓𝑓𝑒𝑐𝑡𝑠 𝑜𝑓 𝑛𝑜𝑛𝑜𝑝𝑒𝑟𝑎𝑡𝑖𝑛𝑔 𝑖𝑡𝑒𝑚𝑠 𝑝𝑜𝑠𝑡 𝑡𝑎𝑥
2013 = 567.3+ 176+ 133.06− 2 = 874.36 Million
2012 = 443+ 71.63+ 242.26− 1.5 = 755.39 Million
M-i)
Non-operating Assets
Investment in Miller Coors: investment in another company may provide Molson Coors
with cash, but it is not a part of operations.
Affiliate: Like the investment in Miller Coors, affiliates provide return on investments
but do not relate to operations.
Goodwill & other intangibles: Intangible assets produce long-term value and may derive
from operations in some cases; however, they are not essential to operations.
2013 2012-176 -71.63
-133.06 -242.262 1.5
OtherIncomeDiscontinuedOperations
TotalAfterTaxAmountofNonoperatingItemsMolsonCoorsBrewingCompanyandSubsidiaries
(InMillions)
SpecialItems

28
Non-operating liabilities
Hedging instruments: hedging instruments are used to “hedge” the risk of changes in fair
value of liabilities and assets. This is an equity related item and is not part of operations.
Discontinued Operations: Self-explanatory. This item is no longer operating.
Long-term debt: The obligation pay off a long term debt is not part of current operations
and is therefore excluded.
Pension: Post-retirement payments are clearly not part of operations.
Derivative Hedging: See “hedging instruments” above.
Discontinued Operations: This is a long term version of previously listed discontinued
operations liability.
Short term debt: This is the current portion of the company’s long term debt. Even though
it is a current liability, it is still not part of operations.
M-ii) To find the “net operating assets” amount, we simply subtract the companies
operating liabilities from their operating assets, all listed above.
2013 20123799 4040.3
-2552.8 -2463.41246.2 1576.9NetOperatingAssets
MolsonCoorsBrewingCompany
(InMillions)NetOperatingAssets
OperatingAssetsOperatingLiabilities

29
N) 2013 RNOA = !"#.!"!"#$.!
= 70.2% 2012 RNOA = !"".!"!"#$.!
=
47.9%
Note: See case guide for definition of Return on Net Operating Assets
O) 𝐎𝐩𝐞𝐫𝐚𝐭𝐢𝐧𝐠 𝐏𝐫𝐨𝐟𝐢𝐭 𝐌𝐚𝐫𝐠𝐢𝐧 = 𝐧𝐞𝐭 𝐨𝐩𝐞𝐫𝐚𝐭𝐢𝐧𝐠 𝐩𝐫𝐨𝐟𝐢𝐭 𝐚𝐟𝐭𝐞𝐫 𝐭𝐚𝐱𝐬𝐚𝐥𝐞𝐬
2013 = !"#.!"!""".!
= 14.6% 2012 = !"".!"!"#!
= 13.5%
𝐍𝐞𝐭 𝐎𝐩𝐞𝐫𝐚𝐭𝐢𝐧𝐠 𝐀𝐬𝐬𝐞𝐭 𝐓𝐮𝐫𝐧𝐨𝐯𝐞𝐫 =𝐬𝐚𝐥𝐞𝐬
𝐧𝐞𝐭 𝐚𝐯𝐞𝐫𝐚𝐠𝐞 𝐨𝐩𝐞𝐫𝐚𝐭𝐢𝐧𝐠 𝐚𝐬𝐬𝐞𝐭𝐬
2013 = !""".!!"#$.!
= 4.82 2012 = !"#!!"#$.!
= 3.56
P) Persistent income is a better predictor of future return on investment. Why? Profit
from operations is the main driver of stock price, and persistent income provides users
with a better picture of a company’s future income than net profit after tax. This also
results in a more accurate RNOA calculation. So, even though RNOA calculated with
persistent income is 6.2% lower than RNOA from net profit, this is a much more accurate
depiction of Molson Coors’ future income.
2013 RNOA Persistent Income =797.461246.2 = 64%
30
Golden Enterprises, Inc.
Statement of Cash Flows Analysis
By: Warren Ball III
The University of Mississippi

31
Executive Summary
The purpose of this report is to give you a more detailed look into how we created
Golden Enterprises’ 2013 indirect statement of cash flows. Below, you will find answers
to each question provided in our case, including information regarding the statement of
cash flows’ different elements as well as the statement’s relation to the company’s
balance sheet. This statement of cash flows provides investors and creditors with
information relating to Golden Enterprises’ liquidity and short-term solvency, as well as
their immediate profitability.
A) The income statement includes all revenues and expenses, including transactions
that don’t involve cash exchanges. The statement of cash flows provides
information about a company’s cash receipts and cash payments during a period.
These cash exchanges fall under 3 categories: operating, investing, and financing
activities.
B) There are 2 methods for preparing a statement of cash flows: direct and indirect.
The direct method includes all cash receipts and expenses listed step-by-step in
the operating section, such as “cash from customers” and “cash paid to suppliers.”
The indirect method simply starts the operating section with net income and then
adjusts this total by adding/subtracting revenues and expenses that don’t involve
cash. As you can see by looking at Golden Enterprises’ 2012 statement of cash
flows, Golden Enterprises uses the indirect method, starting with net income.
32
Companies almost always use the indirect method for 2 reasons: 1) net income
provides a better picture of a company’s day-to-day transactions than do cash
exchanges; 2) the indirect method is much easier to prepare; imagine transcribing
the thousands of cash transactions that a corporation sized-company has every
year.
Here are a couple of examples for adjusting net income. Say that Golden
Enterprises’ accounts receivable have decreased by $1,000. In order for this to
happen, someone has to pay the company $1,000 owed, and this transaction is not
recognized on an income statement; therefore, it must be added to net income. On
the other hand, say that Golden Enterprises purchases $1,000 in prepaid
insurance. Technically this prepaid insurance is an asset, but the company paid
$1,000 to acquire this asset, so the amount is subtracted from net income.
C) 1) Operating: this section covers a company’s cash position from operations.
2) Investing: this section usually relates to fixed assets, such as PPE and
losses/gains from other investments.
3) Financing: this section deals with equity activities and long-term liabilities:
bank loans, loan repayments, debt and equity offerings, and dividends.
D) The operating section of the statement of cash flows is going to involve every day
transactions in business, which will include accounts like accounts
receivable/payable, prepaid expenses (prepaid insurance), inventories, and cash.
The investing section involves PPE and other fixed assets. The financing section
includes equity related activities and long-term liabilities.

33
E) Cash equivalents are short-term, highly liquid investments that will mature in 3
months or less. For Golden Enterprises, an example of this type of account would
be “checks outstanding in excess of bank balances.”
F) The convenience of net income actually comes from the fact that it is accrual
based. By automatically covering every transaction the company has made, the
only work left to do is adjust the total by getting rid of transactions that don’t
include cash. The indirect method saves the time and effort of specifically listing
every cash transaction that a company makes.
G) See end of report for Golden Enterprises statement of cash flows (page 4).
H) No, depreciation expense does not directly or “actually” generate cash for Golden
Enterprises. However, depreciation occurs when the company’s plant assets are
used to produce goods or services that will eventually generate cash; so,
indirectly, depreciation does relate to cash.
I)
Net income decreased by about 51% from 2012 to 2013, but net cash from
operating activities only decreased by about 20%. How can this be? First, go to
the income statement and notice that Golden Enterprises’ gross margin was
roughly 1 million greater in 2013 than in 2012, suggesting increased productivity
for the company; unfortunately, this increased productivity was not reflected in
net income, a discrepancy stemming mainly from 2 accounts: 1) the company
2013 2012NetIncome $1,134,037 $2,207,623Cashfromoperatingactivities $4,607,029 $5,747,290

34
incurred just over $140,000 more in “other” expenses in 2013 due to less “gain on
sale of plant assets” and more interest expense; 2) selling, general and
administrative expenses increased by over $2.5 million from 2012 to 2013, an
expense that does even directly relate to production. Both of these factors
contribute heavily to Golden Enterprises’ decrease in net income.
The decrease in net cash from operations can also be easily
explained. In 2013, Golden Enterprises paid off over $900,000 more of their
accounts payable than they did in 2012; although this payment decreases the
company’s liability, it also immediately decreases the company’s net cash from
operations by close to $1 million.
J) Golden Enterprises has increased their productive capacity over the last 3 years.
This increase in capacity can be explained by viewing the PPE and depreciation
accounts. Over the course of both the 2012 and 2013 fiscal years, Golden
Enterprises invested in $9,364,086 of PPE while accumulating only $6,842,093 of
depreciation. As a result of their investments, the company’s net sales increased
by over $1.1 million from 2012 to 2013. As long as the company continues to
increase the net worth of its PPE, the company will also have the potential for
greater productive capacity.
K) There are 3 routes that Golden Enterprises could take for financing this
investment: debt financing, equity financing, or increased productivity (net
income). Although Golden Enterprises does not currently have the cash flow to
cover a $5 million investment, the company has multiple characteristics that could
suggest greater capacity for capital expenditures. Golden Enterprises has

35
consistently repaid and issued their debt over the past 2 years, suggesting both
good credit and dependability; for these reasons, debt financing appears to be a
viable option for Golden Enterprises, should the company’s owners entertain the
idea (debt financing). Golden Enterprises also has good potential for income
growth in future years due to their continual investment in PPE (increased net
income). Although Golden Enterprises has not issued any common stock dating
back to June 3, 2011, equity financing could also potentially be an option (equity
financing). Of these 3 options, debt financing and increased productivity appear to
be the most viable options.

36

37
*Note: all adjustments made to net income can be found by viewing the differences
between each relevant t-account’s beginning and ending balance. These t-accounts can be
found on page 5 of our case. The only t-account included in the statement of cash flows
that is not listed among the other t-accounts is “gain on sale of plant assets,” which was

38
found by determining the difference between the sold fixed assets’ cash value and
accumulated depreciation.

39
Pearson plc—Accounts Receivable
Accounts Receivable Analysis of Pearson
Presented by:
Warren Ball
The University of Mississippi

40
Executive Summary
Pearson is an international company headquartered in London, England with businesses
in education, business information and consumer publishing. Pearson shares trade in
London and New York, operates in more than 60 countries, and prepares its financial
statements in accordance with IFRS. Analysis of Pearson’s financial statements in the
items listed below will help you understand a number of concepts, including: accounts
receivable terminology, the use of contra accounts, and the use of an aging schedule to
estimate uncollectible accounts. You will also learn how to calculate and analyze
accounts receivable turnover and average collection period information.
A) An account receivable is an oral promise of a purchaser to pay for goods or
services rendered by the supplier. A receivable is a claim held against a customer
or others for money, goods, or services. Accounts receivable can also be referred
to as trade receivables.
Dr. Account receivable (A/R)
Cr. Sales revenue
B) An account receivable is a short-term extension of credit usually collected within
30-60 days. A note receivable is a written promise to pay a sum at a future date. A

41
note receivable may arise from sales, financing, or other transactions, and it can
be either short or long term.
C) A contra account is a valuation account whose normal balance is opposite of the
normal balance of the account to which it relates. The two contra accounts listed
on Pearson’s trade receivables are 1) provision for bad and doubtful debt and 2)
provision for sales returns. Provision for bad and doubtful debt is an estimation of
receivables that will be uncollectible; provision for sales returns estimates the
amount of sales that will be returned. In the process of estimating these contra
accounts, managers might consider past years’ amounts in these accounts, as well
as the reliability of both their current customers and their current product.
D) The percentage of sales procedure, also known as the income statement approach,
takes a predetermined percentage of sales and estimates that amount to be the
balance in doubtful accounts (provision for bad and doubtful debt). The aging-of-
accounts procedure (balance sheet approach) increases the uncollectible
percentage of a receivable as more time passes because payment becomes less
likely. For the percentage of sales method, managers will need the amount of net
credit sales and the percentage of that amount that the company estimates to be
uncollectible; the amount will then be added to the existing allowance for
doubtful accounts amount (if any exists). For the aging-of-accounts procedure,
managers need the percentage of A/R deemed uncollectible multiplied by the net
A/R. The difference between the number found and the company’s beginning
allowance amount gives us the company’s bad debt expense for the year.

42
E) Even though some sales are uncollectible, eliminating uncollectible accounts
would actually be a bad idea for sales. If credit policies are too strict, there will be
lots of unnecessarily lost sales. So, managers have to weigh the risk of bad debts
versus lost sales in order to determine company policy on extending credit. Also,
for an international company like Pearson with a large client base, it is hard to
individually judge customers on their reliability; writing off receivables is just
part of business.
F)
i)
1) 72 million- beginning balance
2) Exchanges- changes in valuation due to currency translation
3) Income Statement movements- bad debt expense resulting
from estimation of uncollectible credit sales
4) Utilised: this is the amount of bad and doubtful debt expense
that the company wrote off when accounts were written off
(Dr. provision for bad and doubtful debt; Cr. A/R).
1) 72.00£2) 5.00£3) 26.00£4) 20.00£5) 3.00£
76.00£
ProvisionforBadandDoubtfulDebts(inmillions)

43
5) Acquisition through business combination- When combining
with another business, the other company’s A/R’s and bad
debts are taken on as well.
ii)
1) Dr. Bad and doubtful debt expense (I/S) 26 million
Cr. Provision for bad and doubtful debts (B/S)
26 million
2) Dr. Provision for bad and doubtful debt (B/S) 20 million
Cr. Accounts Receivable (B/S)
20 million
iii) Provision for bad and doubtful debt expense will normally be included
in operating expenses, specifically selling, general and administrative
expenses.
G)
i)
1) 372.00£2) 425.00£3) 443.00£
354.00£
Provisionforsalesreturns(inmillions)
44
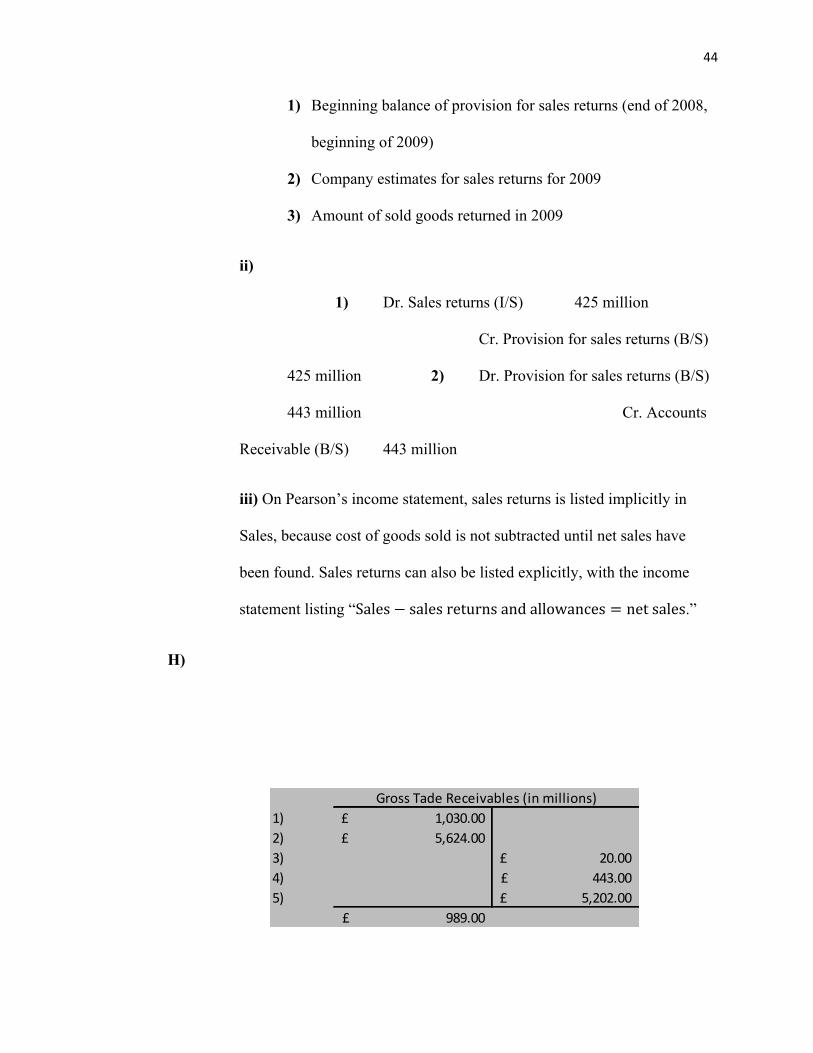
1) Beginning balance of provision for sales returns (end of 2008,
beginning of 2009)
2) Company estimates for sales returns for 2009
3) Amount of sold goods returned in 2009
ii)
1) Dr. Sales returns (I/S) 425 million
Cr. Provision for sales returns (B/S)
425 million 2) Dr. Provision for sales returns (B/S)
443 million Cr. Accounts
Receivable (B/S) 443 million
iii) On Pearson’s income statement, sales returns is listed implicitly in
Sales, because cost of goods sold is not subtracted until net sales have
been found. Sales returns can also be listed explicitly, with the income
statement listing “Sales− sales returns and allowances = net sales.”
H)
1) 1,030.00£2) 5,624.00£3) 20.00£4) 443.00£5) 5,202.00£
989.00£
GrossTadeReceivables(inmillions)

45
1) Beginning balance for gross trade receivables in 2009
2) Credit sales (we are told that all sales are made on account)
3) Write-offs of accounts that are deemed uncollectible
4) Sales returns
5) Collected accounts receivable (converted into cash)
Sales on account (2)
Dr. Accounts receivable 5,624 million
Cr. Sales revenue 5,624 million
Accounts receivable collection (5)
Dr. Cash 5,202 million
Cr. Accounts receivable 5,202 million
I)
*Note: Trade receivables balance and accounts estimated uncollectible are both
listed in millions.
Tradereceivablesbalance Estimtaed%uncollectible AccountsestimateduncollectibleWithinduedate 1,096 2% 21.92Uptothreemonthspastduedate 228 4% 9.12Threetosixmonthspastduedate 51 25% 12.75Sixtoninemonthspastduedate 20 50% 10Nineto12monthspastduedate 4 60% 2.4Morethan12monthspastduedate 20 90% 18Total 1419 5.23% 74.19

46
Based on this estimate, the auditor for Pearson would be comfortable with the 76
million balance in provision for bad and doubtful debts. This aging schedule
estimate is roughly 1.8 million below the balance in provision for bad and
doubtful debt, which provides a little bit of “cushion” and shows that Pearson’s
estimates for uncollectible accounts are fairly accurate.
J)
Accounts receivable turnover =credit sales,net
average gross accounts receivable
*Note: Average the current and previous years’ gross accounts receivable to find
the denominator.
Average collection period in days =365 days
Accounts receivable turnover
See the next page for the breakdown of these ratios in Pearson’s business.
2009 2008Creditsales,net 5,624 4,811Averagegrosstradereceivables 1446.5 1282.5Accountsreceivableturnover 3.89 3.75Averagecollectionperiod 93.83 97.33

47
Both sales and average accounts receivable increased in 2009 compared to 2008. Because
the company’s accounts receivable turnover also increased, their average collection
period dropped by about 4 days.
K) There are a few possible options for reducing Pearson’s average collection period:
• Stricter credit policies on who can and cannot pay on credit (this may be a
difficult option for an international company like Pearson, but plausible
nonetheless).
• Shorter credit payment periods; for example, requiring cash payment
within 30 days instead of 60 days.
• Sales discounts for timely payment of the amount owed.
48
Graphic Apparel Corporation
Analysis of GAC’s efficiency and accounting
methods
Warren Ball
11/4/2015

49
Executive Summary
As a young and inexperienced business owner who recently took over her former boss’
business, Nicki is in need of some expert advice on not only GAC’s financial statements
but also on GAC’s business cycle efficiency as a whole. Under Nicki’s ownership, GAC
switched from equity financing to debt financing, taking out a loan with a covenant
agreement that GAC maintain a current ratio of at least 1.0. GAC’s current ratio could
decrease depending on the changes in accounting methods that will be discussed below;
therefore, it is important for Nicki to understand how GAC’s current ratio can be affected
so that she can assure the ratio remains above 1.0. The explanations below will explain
certain characteristics of GAC’s business as well as changes that need to be made in the
company’s accounting methods.
1.
a. Nicki took over ownership of GAC in January 2014.
b. Before Nicki took over, only the IRS used GAC’s financial statements.
However, Nicki took out a loan and pledged assets as collateral, so now
the bank and the IRS use GAC’s statements.
c. Because GAC switched from equity financing to debt financing through
Nicki’s loan, the bank now finances GAC.
2.

50
a. So far, the company is doing well. In a short time period, Nicki’s
creativity and effort increased the company’s fall orders from $100 in
2013 to $10,000 in 2014.
b. GAC sells standard shirts to retailers and custom-ordered shirts to local
organizations and sports teams.
c. Even though the company lost some of its long-standing customers due to
Nicki’s new, edgier shirts, Nicki has successfully secured new business
from young, start-up companies while also retaining some of GAC’s
original clients.
d. The warehouse had a leak in the roof that did not permanently damage the
building, but it did cause stains and water damage in about half of the
plain shirts ordered for the 2014 season.
3. The revenue recognition principle says that revenues should be recognized in the
same period of the expenses that are incurred to create these revenues. GAAP
indicates that revenue should be recognized when the good has been delivered or
the service performed.
4. GAC reports revenues from its custom orders when a signed order and payment is
received from the customer, which isn’t acceptable under GAAP. This method of
recognizing revenue would apply to dealings with local organizations or sports
teams, etc.
5. The alternative point of recognition would be at the point of delivery
(performance obligation met).
51
6. Recognizing revenue at the point of delivery (like GAC does with retail shirts) is
the better option for custom shirts. Why? Because custom shirts are ordered with
specific design qualifications, there is more room for customer dissatisfaction and
production errors.
7. Recognizing revenue at the point of delivery for custom shirts would increase
liability during the period between payment and delivery (unearned service
revenue) and therefore decrease GAC’s current ratio (current liabilities increase).
8. GAAP requires accounts receivable be reported at net realizable value (NRV) =
accounts receivable (A/R) – allowance for doubtful accounts (ADA).
9. GAC uses the direct write-off method, which writes off bad debts as they occur.
This method is not supported by GAAP and is only acceptable when bad debts are
immaterial or cannot be estimated reliably. Since GAC’s bad debts are estimable,
Nicki should use the allowance method.
10. Because the bank now uses GAC’s financial statements, they must be reported
under GAAP standards.
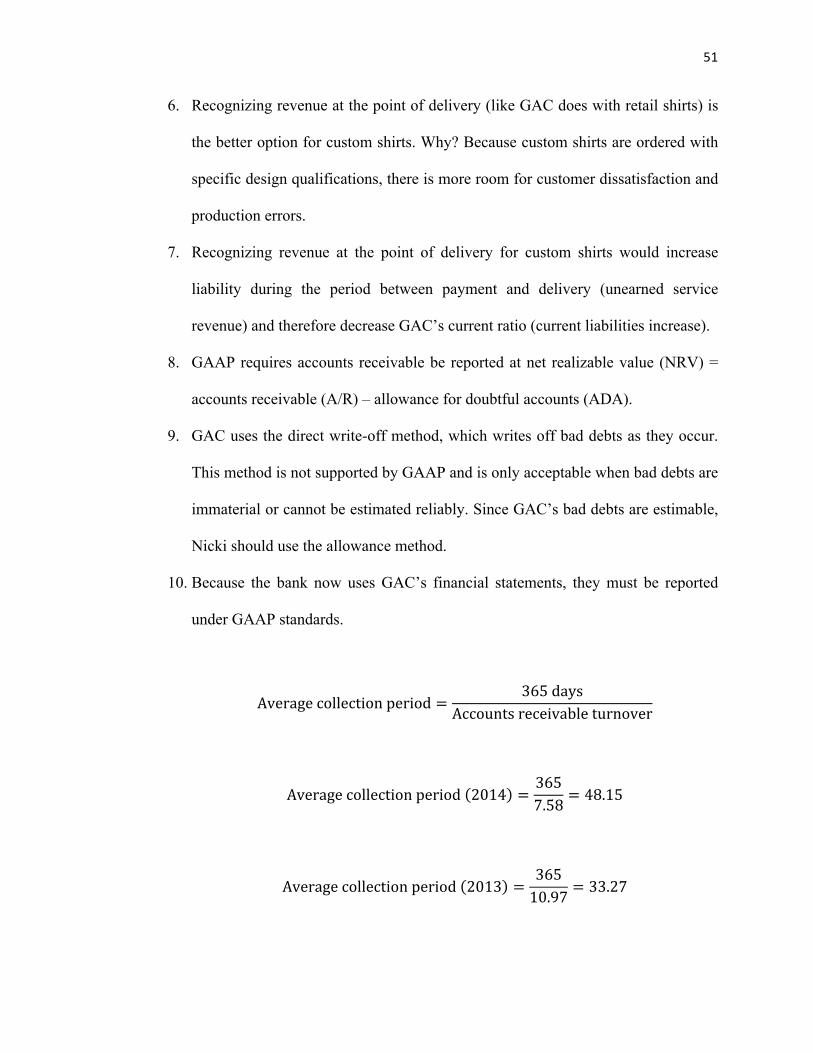
Average collection period =365 days
Accounts receivable turnover
Average collection period 2014 =3657.58 = 48.15
Average collection period 2013 =36510.97 = 33.27

52
The average collection period in 2014 is about 15 days longer than in 2013,
suggesting that GAC’s new customers are possibly less reliable; therefore, it is
safe to assume that the NRV of GAC’s receivables is less than it was in 2013.
11. GAC could use the allowance method or, more specifically, the aging-of-accounts
method. The aging-of-accounts method better estimates the amount of receivables
that will be uncollectible, which will definitely apply to GAC with their increase
in average collection period.
12. See #11. GAC should use the aging-of-accounts method.
13. The aging-of-accounts method would increase the allowance for doubtful
accounts’ balance and subsequently decrease receivables. This change in method
would decrease GAC’s current ratio (decreasing current assets).
14. GAC recognizes sales returns at the end of the summer, at which point they fully
refund all shirts returned by the retailers. GAC does not currently estimate sales
returns, which is not acceptable under GAAP standards. GAC should estimate its
sales returns by creating a “Sales returns and allowances” account, which is a
contra-revenue account.
15. The leak in GAC’s warehouse roof damaged (stained) around 50 percent of the
shirts that GAC purchased for the fall, increasing the chance that those shirts will
be returned by end customers; Nicki also saw a lot of her shirts on the clearance
rack at various department stores, which makes her worry that her shirts possibly
went unsold.
16. GAAP recommends estimating the amount of returns and then creating an
allowance for sales returns and allowances account to offset these returns.

53
17. GAC should consider the alternative listed in #16. Sales returns are definitely
material to GAC’s key external user (the bank): returns decrease revenue and
provide a more accurate picture of the company’s net sales and product reliability.
18. In my opinion, the allowance method is best for estimating returns. For a
company like GAC with t-shirts as its main product, returns are a natural part of
business. Also, GAC fully refunds all sales returns, which only gives customers
more incentive to return shirts. These two factors make sales returns all but
inevitable; therefore, the allowance method is better.
19. Sales would decrease because of the contra-revenue account “sales returns and
allowances.” Sales returns will increase inventory and decrease accounts
receivable (or cash if it has already been paid). The current ratio will not be
affected because the current assets will decrease (decrease in A/R) by the same
amount that they increase (increase in inventory).
20. GAAP reports inventory at lower-of-cost-or-market (replacement cost).
21. GAC uses the lower-of-cost-or-market method, which is acceptable under GAAP
and is an appropriate choice for inventory valuation.
22. Nothing has changed this year that suggests GAC should change their method.
Goods sold will still be subtracted from inventory and the remaining inventory
will still be valuated at lower of cost or market.
Number of days to sell inventory =Inventory
Cost of goods sold ∗ 365
2014 =24,50093,000 ∗ 365 = 96.16
54
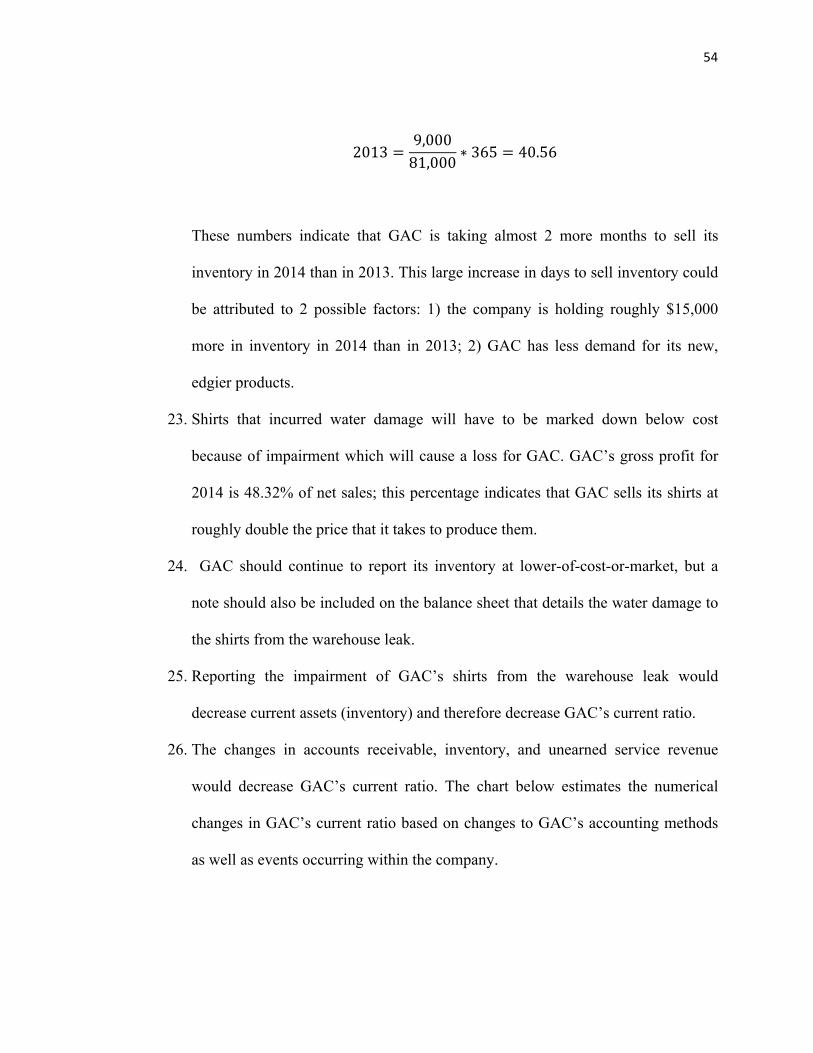
2013 =9,00081,000 ∗ 365 = 40.56
These numbers indicate that GAC is taking almost 2 more months to sell its
inventory in 2014 than in 2013. This large increase in days to sell inventory could
be attributed to 2 possible factors: 1) the company is holding roughly $15,000
more in inventory in 2014 than in 2013; 2) GAC has less demand for its new,
edgier products.
23. Shirts that incurred water damage will have to be marked down below cost
because of impairment which will cause a loss for GAC. GAC’s gross profit for
2014 is 48.32% of net sales; this percentage indicates that GAC sells its shirts at
roughly double the price that it takes to produce them.
24. GAC should continue to report its inventory at lower-of-cost-or-market, but a
note should also be included on the balance sheet that details the water damage to
the shirts from the warehouse leak.
25. Reporting the impairment of GAC’s shirts from the warehouse leak would
decrease current assets (inventory) and therefore decrease GAC’s current ratio.
26. The changes in accounts receivable, inventory, and unearned service revenue
would decrease GAC’s current ratio. The chart below estimates the numerical
changes in GAC’s current ratio based on changes to GAC’s accounting methods
as well as events occurring within the company.

55
1) GAC states that half of the shirts purchased for 2014 incurred water damage;
however, these shirts were still used despite the damage. Estimates suggest
that water damage depreciates the shirts roughly 50 percent. So, the loss due
to water damage is estimated with the following calculation: !",!""!
∗
50% = 6,125.
2) Nicki estimates that all shirts held by retailers at the end of August are worth
about $15,000. Receiving these returned shirts would decrease A/R by
$15,000 (full refund), but inventory would also increase by $15,000.
Therefore, there is zero change in current assets.
3) Nicki is ready to give up on $3,000 of A/R from new customers who seem to
be having a problem with GAC’s sales terms of n/30. These doubtful accounts
will decrease current assets.
4) By recognizing revenue when the service obligation is met instead of at the
point of order, GAC’s sales orders of $10,000 become $10,000 of unearned
service revenue instead of service revenue.
27. Based on GAC’s 2014 balance sheet, the company’s current ratio is 1.35
($61,000/$45,180). However, multiple events (listed in #26) have occurred within
the company that suggest GAC’s current ratio will decrease. Based on these
CurrentAssets CurrentLiabilitiesBeginningbalance 61,000 45,1801)Waterdamagetoshirts (6,125)2)Salesreturnsfromretailers 03)LostA/Rfromnewcustomers (3,000)4)Unearnedservicerevenue 10,000Adjustedbalances 51,875 55,180

56
events, GAC’s new current ratio is estimated to be .94. To return to a current ratio
of 1.0, Nicki would need to contribute at least $3,305 in additional equity.
28. First of all, Nicki needs to make sure that all of her financial accounting methods
are in line with GAAP standards, which they will be if Nicki implements the
suggested changes in valuation methods. Also, Nicki needs to eliminate GAC’s
full refund policy on returned shirts; this change may decrease customer goodwill,
but ultimately a t-shirt company will not survive giving full refunds due to the
amount of returns that will be made annually.
57
Analysis of Northwest, Delta, United, and
Waste Management
By: Warren Ball

58
Part A
Part A of the analysis contains an in-depth look at the depreciation and sales schedules of
three large airlines: Northwest, Delta, and United. First, a look at a table with relevant
financial information for all the companies:
One might be curious why the airlines depreciate this equipment at different rates. The
answer to this is twofold: tax implications and truer representation. First, the tax
implications can be large from deciding how to depreciate large amounts of equipment.
The larger the net income, for example, the larger the taxes. Therefore, to bring that net
income number down, a company can depreciate a piece of equipment more rapidly if it
wants to recognize less profit. Second, companies might depreciate the same equipment
differently because of levels of use. One company might use a piece of equipment more
frequently than another, which means depreciating the equipment quickly would make
more sense.

59
Furthermore, Sales Price II probably makes more sense for all of the companies, for it
creates more of a market for the plane. Sales price I has too much variation to truly be
successful. By starting all of the planes at the same price, companies can make the
necessary adjustments when the market changes for their specific plane.
Part B
Waste Management had a laundry list of charges. They were accused of concealing the
operating realities of the company by making or authorizing misleading statements. The
top executives of Waste Management did this in order to meet earnings goals, which
would allow them to retain their positions and retirement benefits. Moreover, the stock
was inflated, and the executives were accused of selling off the stock knowing of this
inflation. Lastly, the complaint states that the profits were overstated by 1.7 billion
dollars
One of the main ways that Waste Management nefariously managed their earnings was
by utilizing depreciation expense. They deferred their current period expenses, which
incorrectly inflated their income for the current period. Also, they avoided the
depreciation expense by extending the estimated useful life of the trucks while also
making unsupported increases to the trucks’ salvage value. In other words, the older that

60
the trucks got, the more they appreciated in value, which is obviously a backwards
proposition on almost any piece of equipment.
The reasoning behind inflating the earnings of Waste Management is really quite simple:
the executives wanted to make sure that everyone thought they were doing a great job in
turn to keep their job positions. In keeping these positions, they would reap the benefits
of an executive salary as well as performance based benefits and retirement programs. In
other words, the management team wanted to make sure that their money kept coming in,
and they out their integrity in the process.
Arthur Andersen was also a large part of this disaster, since they were the auditor. The
evidence against Arthur Andersen was pretty convincing: it seemed they were helping to
produce the false and misleading reports, and they would not stand up to the managers of
Waste Management to tell them that their financial statements were not fair and
reasonable. This fact could be a product of 14 Waste Management employees previously
worked at Arthur Andersen. Arthur Andersen eventually settled for 7 million dollars, but
they never admitted guilt outright. Arthur Andersen continued to have struggles with
integrity within the financial statements, and they eventually disbanded after many
pending lawsuits.
61
RiteAidCorporation
AnalysisofRiteAid’slong-termdebtandreporting
methods
WarrenBallIII
2/3/2016
TheUniversityofMississippi

62
ExecutiveSummary
Inthisreport,wehaveanalyzedRiteAid’slong-termdebtandthedifferentmethodsof
accounting for this debt. Looking at a company’s long-term debts and some of the
financialratiosassociatedwiththemcanhelpyougetabetterfeelingforthecompany’s
stabilityandlong-termoutlook.Below,youwillfindinformationregardingthedifferent
aspectsand formsofRiteAid’s long-termdebtandwhat someof these factorsmight
havetodowiththecompany’screditrating.
*Note: All numbers provided in this report are in thousands (add three zeros to the
numbersgiven).
A)
1. Secureddebt isbackedby theborrower’s (RiteAid’s)pledgeof collateral,whereas
unsecureddebtisnotbackedbycollateralandisthereforeriskierforthelender.These
unsecured debts also carry higher interest rates. Because of these differences, it is
important todistinguishbetween these two typesofdebt foranycompany, including
RiteAid.
2. “Guaranteed” debtmeans that a third party has backed the borrower in case the
borrowerdefaults on their payment; a guarantee is basically collateral in the formof
another company. In RiteAid’s case, the parent entity is guaranteeing the unsecured
debtofRiteAid’ssubsidiaries.

63
3. Convertible debtis when a company borrows money from investor[s] with both
parties intending on the debt being converted to equity at a later date. This date is
usually specified at the time of borrowing. A “fixed-rate” bond has equal interest
paymentamountsoverthecourseofitsfulllife.“Senior”debtorloansimplythatthese
borrowingstakehigherpriorityinthecompany’sfinancialstructure;inotherwords,the
companywillpaythesedebtsbeforeotherunsecureddebts.
4. Differences in interest rates and debt payment structures are inherent asmultiple
subsidiariesandbranchesofRiteAiddealwithdifferentlenders.
B) On February 27th, 2010, Rite Aid has $6,370,899 in total debt. Of this amount,
$51,502isthecurrentlymaturingportion.Thistotaldebtismadeupofthreeaccounts
on the balance sheet: currentmaturities of long-termdebt ($51,502), long-termdebt
less current liabilities ($6,185,633), and lease financing obligations less current
maturities($133,764).
C)
1. The face value of these notes is $500,000.We know this because no premium or
discountismentionedandthefacevaluedoesnotchangeovertime.
2. Dr.Cash 500,000
Cr.BondsPayable 500,000

64
3. Dr.InterestExpense 37,500
Cr.Cash 37,500
4. Dr.BondsPayable 500,000
Cr.Cash 500,000
D)
1.Theprincipalvalueofthenotesis$410,000;however,thecarryingvalueofthenotes
is $405,951. The reason for the notes’ lesser carrying value is due to unamortized
discountsof$4,049.
2. During the 2009 fiscal year, Rite Aid paid interest on the note in the amount of
$38,438(410,000*.09375).
3. RiteAid incurred$39,143 in total interest expense for the2009 fiscal year.Of this
amount,$705isnoncashinterest(38,438+705)
4.

65
5.Totalrateofinterestrecorded=!",!"#!"#,!"#
=9.64%
E)
1.
*Note:carryingvalue=(410,000*.982)=402,620
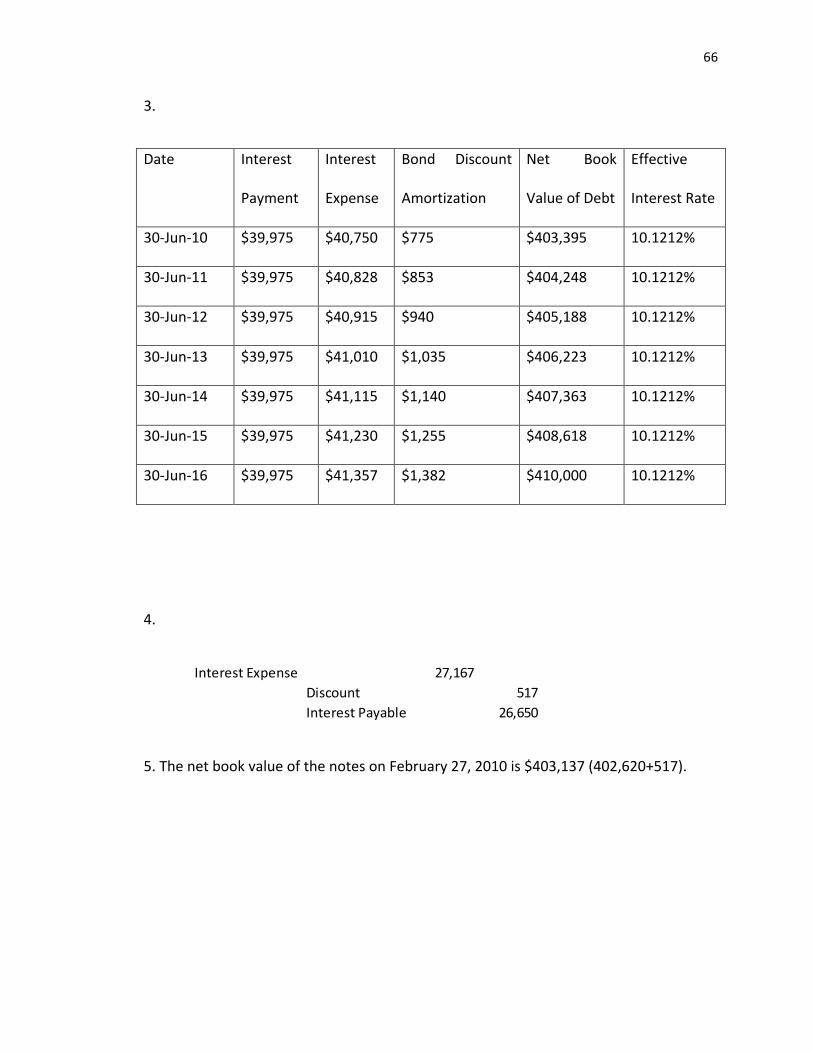
2. These notes were issued at an effective annual interest rate of 10.1212%. The
followingvalueswereput into theRATE functiononExcel toobtain this interest rate:
number of periods (7), cash interest payments (39,975), present value (402,620), and
futurevalue(410,000).
InterestExpense 39,143Discount 705Cash 38,438
Cash 402,620Discount 7,380
BondsPayable 410,000
66
3.
Date Interest
Payment
Interest
Expense
Bond Discount
Amortization
Net Book
ValueofDebt
Effective
InterestRate
30-Jun-10 $39,975 $40,750 $775 $403,395 10.1212%
30-Jun-11 $39,975 $40,828 $853 $404,248 10.1212%
30-Jun-12 $39,975 $40,915 $940 $405,188 10.1212%
30-Jun-13 $39,975 $41,010 $1,035 $406,223 10.1212%
30-Jun-14 $39,975 $41,115 $1,140 $407,363 10.1212%
30-Jun-15 $39,975 $41,230 $1,255 $408,618 10.1212%
30-Jun-16 $39,975 $41,357 $1,382 $410,000 10.1212%
4.
5.ThenetbookvalueofthenotesonFebruary27,2010is$403,137(402,620+517).
InterestExpense 27,167Discount 517InterestPayable 26,650

67
6.
Date Interest
Payments
Interest
Expense
Bond Discount
Amortization
Net Book
ValueofDebt
Straight-Line
Rate
30-Jun-
09
$402,620 10.1905%
30-Jun-
10
$39,975 $41,029 $1,054 $403,674 10.1639%
30-Jun-
11
$39,975 $41,029 $1,054 $404,728 10.1374%
30-Jun-
12
$39,975 $41,029 $1,054 $405,782 10.1111%
30-Jun-
13
$39,975 $41,029 $1,054 $406,836 10.0849%
30-Jun-
14
$39,975 $41,029 $1,054 $407,890 10.0588%
30-Jun-
15
$39,975 $41,029 $1,054 $408,944 10.0329%
30-Jun-
16
$39,975 $41,029 $1,054 $409,998 10.0071%

68
7. Under the effective interest method, the interest expense increases each year,
whereas the expense remains constant under the straight line method. The largest
differencebetweenthetwomethodsoccurs in2016,whenRiteAidaccountsfor$328
more interest expense under the effective interestmethod compared to the straight
line method. On the surface, this may seem like a big difference; however, when
accountingforthecompany’stotalinterestexpenseonthenotes,thisamountbecomes
immaterial.
F)
1.
2.RiteAiddidnothavetorepurchasethenotesatfacevaluebecausethenotesstillhad
unamortizeddiscounts attached to them; also, themarket ratemayhavebeen lower
thanthefacerateofthesenotesatthetimeofRideAid’srepurchase.
3.Themarketrateislowerthanboththe9.5%couponrateandtheeffectiverate,giving
RiteAidtheabilitytorepurchasethenotesatagainof$3,750.
G)
NotesPayable 810,000Cash 797,769Discount 8,481Gain 3,750

69
1.Companiesissueconvertibledebtbecausetheycaneventuallyconvertthedebtinto
equity.Also,companiescanofferthesebondsatalowercouponratethantheywould
beable toofferon theopenmarketwhichsavesmoneyon interestpayments.These
lower ratesareoneof the reasonsyoung,growingcompaniesmight issueconvertible
bonds.Ontheotherhand,investorsbuythesebondsbecausetheyofferthesecurityof
a bond with the potential opportunity for a huge gain if the company’s stock price
increases and the investors’ bonds are converted. On the balance sheet, convertible
debtwouldtranslatefromaliabilitytoanequityaccount(sharesofcommonstock,for
instance).
H)
1.
Ratio Definition Industry
Average
Rite Aid
FY2009
Rite Aid
FY2008
Common-SizeDebt TotalLiabilities/TotalAssets 43.83% 82.79% 87.41%
Common-Size Interest
Expense
InterestExpense/NetSales 0.35% 2.01% 1.82%
Debt-to-Assets TotalLong-TermDebt/Total
Assets
14.41% 79.14% 72.20%
Long-Term Debt to
Equity
TotalLong-TermDebt/Total
ShareholdersEquity
0.26 -3.81 -5.01
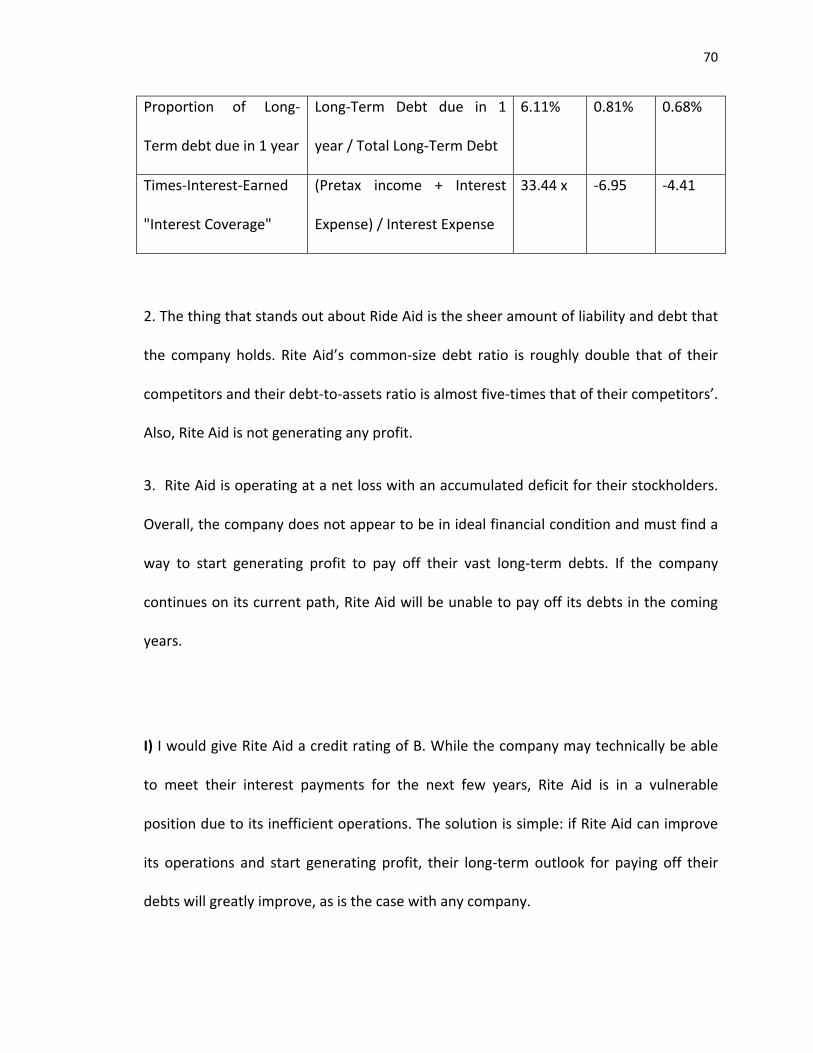
70
Proportion of Long-
Termdebtduein1year
Long-Term Debt due in 1
year/TotalLong-TermDebt
6.11% 0.81% 0.68%
Times-Interest-Earned
"InterestCoverage"
(Pretax income + Interest
Expense)/InterestExpense
33.44x -6.95 -4.41
2.ThethingthatstandsoutaboutRideAidisthesheeramountofliabilityanddebtthat
the company holds. RiteAid’s common-size debt ratio is roughly double that of their
competitorsandtheirdebt-to-assetsratioisalmostfive-timesthatoftheircompetitors’.
Also,RiteAidisnotgeneratinganyprofit.
3.RiteAidisoperatingatanetlosswithanaccumulateddeficitfortheirstockholders.
Overall,thecompanydoesnotappeartobeinidealfinancialconditionandmustfinda
way to start generating profit to pay off their vast long-term debts. If the company
continuesonitscurrentpath,RiteAidwillbeunabletopayoffitsdebtsinthecoming
years.
I)IwouldgiveRiteAidacreditratingofB.Whilethecompanymaytechnicallybeable
to meet their interest payments for the next few years, Rite Aid is in a vulnerable
positionduetoitsinefficientoperations.Thesolutionissimple:ifRiteAidcanimprove
its operations and start generating profit, their long-termoutlook for paying off their
debtswillgreatlyimprove,asisthecasewithanycompany.

71
Merck&Co.,Inc.andGlaxoSmithKlineplc
AnalysisofEquityandreportingmethods
By:WarrenBall
TheUniversityofMississippi

72
ExecutiveSummary
Belowyouwillfindavarietyofinformationregardingequityandthenuancesof
accountingforit:differencesindisclosuremethodsunderU.S.andInternationalGAAP,
reasonsforpayingdividendsandpurchasingtreasurystock,etc.Merck&Co.(Merck)
andGlaxoSmithKline(GSK)arethetwocompaniesanalyzedbelow.
A)
i.Merckisauthorizedtoissue5,400,000,000stocks.
ii.Merckhasissued2,983,508,675sharesasofDecember31st,2007.
iii.2,983,508,675 𝑠ℎ𝑎𝑟𝑒𝑠 𝑖𝑠𝑠𝑢𝑒𝑑 ∗ .01 𝑝𝑎𝑟 𝑣𝑎𝑙𝑢𝑒 = 29,835,087
iv.AsofDecember31,2007,Merckholds811,005,791sharesintreasurystock.
v.Thedifferencebetweenissuedstockandoutstandingstockwillusuallycomefroma
company purchasing treasury stock; otherwise, shares outstanding will be equal to
sharesissued.InMerck’scase,thenumberofsharesoutstandingissimplytheirissued
shareslesstheirtreasuryshares(2,983,508,675–811005791=2,172,502,884).
vi.MarketCapitalization=Sharesoutstanding*pricepershare.
MarketCapitalization=2,172,502,884*$57.61=125,157,891,147
B)

73
i.GlaxoSmithKlineisauthorizedtoissue10,000,000,000ordinaryshares.
ii.AsofDecember31,2007,GlaxoSmithKlinehasactuallyissued6,012,587,026ordinary
shares.
iii.5,373,862,962sharesareinfreeissueasofDecember31,2007.
iv.504,194,158TreasurysharesareheldbyGlaxoSmithKlineatDecember31,2007.
v.Sharecapital issimplythebookvalueofyourstock(numberofshares*parvalue).
Sharepremium is theexcessmarket valueof these sharesover theirpar values.Asa
subscribertoU.S.GAAP,Merckcallstheseaccountscommonstock(sharecapital)and
otherpaid-incapital(sharepremiumaccount).
C)Companiespaydividendsinordertorewardtheirshareholdersfortheirinvestments
in the companywhile simultaneously providing a certain degree of certainty about a
company’s financialwell-being.Also,anotherpositiveofhighdividendpayouts is that
these dividends may attract other investors. These dividend payouts also affect a
company’sstockprice.Stockprice isbasically thepresentvalueofallexpected future
dividends,sowhenacompanypaysoutdividends,thecompany’sstockpricedrops.
D)Companiesmayrepurchasesharesforavarietyofreasons.

74
• A company’s EPS increases when the company repurchases shares
(earningsaredividedamongfewersharesoutstanding).
• If a company believes their stock is undervalued, theymay repurchase
theirstock,waitforthepricetoclimb,andthenresellthestock.
• Ifacompanyfearstakeoverfromanoutsider,theywillrepurchaseshares
to secure theirmajority ownership of the company so that an outsider
willbeunabletotakeoverthecompanythroughthemarket.
E)
F)
i.
ii. Because of IFRS, GSK records dividends in the financial statements when they are
paid, not when they are declared. Because GSK usually pays their dividends two
quarters after the quarter to which the dividends relate, you simply add up the
dividends paid in the last two quarters of 2006 and the first two quarters of 2007
(671+785+670+667=2793)(millions).
DividendsDeclared 3,310,700.00$
Cash 3,307,300.00$DividendsPayable 3,400.00$
DividendsDeclared 2,793,000.00£Cash 2,793,000.00£

75
G)
i.Merckusesthecostmethodinaccountingforthistreasurystockratherthanusingpar
value.ThecostmethodmeansthatMerckwillrecordthevalueofthistreasurystockat
thevalueforwhichtheseshareswererepurchasedontheopenmarket.
ii.Merckrepurchased26.5millionsharesduring2007ontheopenmarket.
iii. In total,Merckpaid1,429.7million to repurchase its stockduring2007,paying an
averageof$53.95pershare.Buyingbacksharesisconsideredafinancingactivityonthe
cashflowstatement.
iv.AlthoughMerckcanimprovetheircashflowbyrepurchasingandthenresellingtheir
stock, they technically cannot disclose treasury stock as an asset because they are
dealingwithin theirownequity (treasury stock is a contra-equityaccount).Classifying
treasurystockasanassetwouldcreatefalsefinancialvalueforthecompany.
H)
i.During2007,GSKrepurchased285,034,000sharesontheopenmarket.Someofthese
shareswerenotheldintreasury:ofthesharespurchasedin2007,269millionareheld
intreasuryand16millionhavebeencancelled.
ii.Onaverage,GSKpaid£13.09perrepurchasedshare.

76
iii.UnderU.S.GAAP,this“Movementsinequity”accountisreferredtoas“Statementof
Stockholder’sEquity.”
I)
Merck’sdividendsper share,dividendyield, anddividends tooperating cash flowsall
decreasedfrom2006-2007,buttheirdividendpayoutincreasedsignificantly.Comparing
RetainedEarnings 3,750,000,000.00£Cash 3,750,000,000.00£
Merck Glaxo(inmillions) 2007 2006 2007DividendsPaid 3,307.30$ 3,332.60$ 2,793.00£SharesOutstanding 2,172.50$ 2,167.79$ 5,373.86£NetIncome 3,275.40$ 4,433.80$ 6,134.00£TotalAssets 48,350.70$ 44,569.80$ 31,003.00£Operatingcashflows 6,999.20$ 6,765.20$ 6,161.00£Year-endstockprices 57.61$ 41.94$ 97.39£
Merck Glaxo2007 2006 2007
Dividendspershare 1.52$ 1.54$ 0.52£Dividendyield 3% 4% 1%Dividendpayout 1.01 0.75 0.46Dividendstototalassets 0.07 0.07 0.09Dividendstooperatingcashflows 0.47 0.49 0.45
77
thetwocompaniesshowsthatGSKhassignificantlylowerdividendspershare,dividend
yield, and dividend payout thanMerck; however, GSK appears tomanage their total
assetsmoreeffectively,andtheyhavesimilaroperatingcashflowstoMerck.

78
StateStreetCorporation
AnalysisofMarketableSecurities
By:WarrenBall
TheUniversityofMississippi
79
A)
i. Trading securitiesaredebtorequity investments thatareheld for a yearor less to
produceashort-termprofit.
ii.Acompanywouldrecognizedividendsorinterestfromtradingsecuritiesbyrecording
areceivable(dividend/interestreceivable)andeventuallyacashreceiptwhichwilltake
thereceivableoffthebooks.
iii.Theentrytorecordanincreaseinthefairmarketvalueoftradingsecuritiesinvolves
adebit/credittoUnrealizedHoldingGains–Income,whicheventuallyshowsuponthe
AccumulatedOtherComprehensiveIncomestatement.
B)
i. Available-for-sale securities are investments that are not classified as either trading
securitiesorheld-to-maturitysecurities.Thesesecuritiesarereportedatfairvalue,with
changesinvaluebeingreportedundercomprehensiveincome.
ii.Theentrytorecorddividendsorinterestreceivablefromavailable-for-salesecurities
issimilartotheentryfortradingsecurities(entryAii).
iii. The entry to record an increase in FMV is like that of trading securities. An
unrecognizedholdinggainorlossisreportedundercomprehensiveincome.
C)

80
i. Investments that are held to maturity are similar to the other types of trading
securities, except that the purpose of these is to hold them until they reach their
maturity date. No changes in FMV are reflected in these investments. Equity
investmentscannotbeclassifiedasheldtomaturitybecausetheyhavenomaturity.
ii.Heldformaturitysecuritiesarerecordedattheiramortizedcostovertheir lifeuntil
theirmaturitydate.Nochangesinmarketvaluearerecorded.
D)
i. The account balance in “Trading account assets” is 637 million, which is also the
market value because State Street Corporation carries their trading account assets at
fairvalue.
ii.
E)
i. The 2012 year-end balance in “investment securities held to maturity” is 11,379
million.
ii.Themarketvalueofthesesecuritiesis11,661million.
Tradingaccountassets 85Unrealizedholdinggain-income 85
81
iii. The amortized cost of these securities is 11,379 million. The amortized cost
represents the face value less the accumulated amortized premium or discount. The
amortized cost will slowly converge to the maturity amount over the course of the
investment’slife.
iv.Thedifferencebetweenmarketvalueandamortizedcost isachangeinthemarket
rateforthesesecurities.Ahighermarketvaluemeansthattheratesonthesesecurities
haverisensincetheywerepurchasedbyStateStreet.
F)
i. The 2012 year-end balance in “investment securities available for sale” is 109,682
million;thisamountrepresentsthemarketvalueofthesecurities.
ii. At December 31, 2012, State Street has 2,001million in unrealized gains and 882
millioninunrealizedlosses.Theseamountsresultinanetgainof1,119million.
iii.StateStreetrealizeda55milliongainfromsalesofavailable-for-salesecurities.This
gain increases both the company’s income and its cash flows because the gain is
realized.
G)
i.
Investmentsavailableforsale 60,812Cash 60,812

82
ii.
iii. Theoriginal costof theavailable for sale securities is$61,601million,which is the
differencebetween$67millionandthe$5339millionfromtheproceedsofthesale.
iv.
Theseunrealizedholdinggainsandlossesfor2012wouldnotimpactStateStreet’scash
flowsatall;eventhoughthesechangesinfairmarketvaluecouldeventuallyresultina
smaller or larger cash flow at the time of sale, they have no current impact on cash
flows.
Availableforsalesecurities 67Unrealizedholdinggain 67
Cash 5339Availableforsalesecurities 5339
18167
13671119
Netunrealizedgain(loss)onAFSSecurities
AdjustmentstoAFSforFMV 1,367Unrealizedholdinggains 1,367
83
Groupon
Analysisofrevenuerecognition,returns,andrisk
WarrenBall
TheUniversityofMississippi
84
1.Grouponismoreofan“e-tailer”thanatraditionalretailer,sellingdiscountcoupons
tocustomerswithoutactuallyparticipatingintheexchangeofthematerialsorservices.
Grouponalsoappearstobemostlyconcentratedonmaximizingrevenue.Walmartand
Amazon, on theotherhand, aremore traditional retailers:Amazonholds goods from
manydifferentsuppliersandsellsthemonline,whileWalmartphysicallysellsthegoods
both in large department stores and online. These companies also appear to
concentratemoreonthecustomerexperienceratherthanmaximizingrevenue,which
mayhavetodowiththefactthatthesecompaniesareolderandmoreestablishedthan
theyoungandgrowingGroupon.
As far as risk factors, these companies sharemany common risks considering
thattheyareallcompetinginthesameindustry.Forfinancialreportingpurposes,these
companieshavemanyconcerns,includingtheneedtobecarefulinhowrecognitionof
revenueisreportedaswellashowtheyaregoingtoaccountforallowances.Let’suse
Groupon for both examples: Groupon is recognizing revenue before the goods and
servicestheypromiseareevendelivered,andtheyhavenohistoricaldatawithwhichto
estimate their allowances. In both cases, the company should be careful in how they
reportthesevalues.

85
2.AlthoughthetrendsinGroupon’sstockpricefollowthecompany’s incomemoreso
thanrevenue(seechartontopofnextpage),revenuegrowthismoreimportantthan
incomegrowthforthisnewbusinessbecauseofwhattheseaccountssignifytoexternal
sources.Ayoungcompanythathassteadilyincreasingrevenueisshowingthecapability
to attract more of the market, something that is inherently important to a young
company trying to compete for market share. Because of this, revenue growth is
irreplaceable:withoutenoughrevenue,acompany’sgrossmarginbecomesimmaterial.
On the other hand, income growth, while also very important, is a little bit more
“fixable.” Income can be enhanced by greater efficiency in the business process and
mitigating costs, things thatayoungcompanycan learnas theygrow; theproductor
servicethatlaunchesthecompany’srevenuegrowthismostimportant.
AnotherfactortoconsideristhatGrouponistakingonnetlossesintheseearly
growthyears,whichmakesstockpricedifficulttocompute.So,eventhoughincomewill
eventually become more important as it affects stock price, as a young company
revenueisthemostimportantindicator.

86
3.
Revenue Income StockPrice1997 $148 -$31 $5.021998 $610 -$124 $53.531999 $1,640 -$720 $76.132000 $2,762 -$1,411 $15.562001 $3,122 -$567 $10.822002 $3,933 -$149 $18.892003 $5,264 $35 $52.622004 $6,921 $588 $44.292005 $8,490 $333 $47.152006 $10,711 $190 $39.462007 $14,835 $476 $92.642008 $19,166 $645 $51.282009 $24,509 $902 $134.522010 $34,204 $1,152 $180.00
(inmillonsexceptforStockPrice)
Amazon
Gross Net Gross NetRevenue 100% 100% 100% 100%COGS 64% 30% 61% 10%GrossMargin 36% 70% 39% 90%MarketingExpense 15% 34% 37% 91%G&AExpense 25% 44% 33% 68%OtherExpenses 28% 65%NetLoss -4% -8% -58% -134%NetLosstocommonshareholders -23% -48% -64% -146%EPS(basic) -$0.04 -$0.04 -$2.66 -$2.66
CommonSizeIncomeStatements2009 2010

87
ConvertingtothenetmethodhadoppositeeffectsonGroupon’sgrossmarginandtotal
asset turnover.Groupon’s grossmarginnearlydoubledunder thenetmethod, a very
positive statistic forGroupon; on the other hand, the company’s total asset turnover
decreasedbyover100%inbothyearsunderthenetmethodduetorecognitionoffar
lessnetsales.
4.
A)Originally,Grouponwasreportingitsrevenuesunderthegrossmethod,reportingall
of their customer sales as revenues without regard to repaying the provider of
goods/servicesaportionofthoserevenues.AfteradjustmentsfollowingtheSECfilings,
Groupon started reporting under the net method, which recognizes revenue as the
differencebetweenwhat thecustomerspaidGrouponandwhatGrouponpaid to the
suppliers.
B) Groupon obviously preferred the gross method; their revenues under the gross
method are over twice the amounts under the net method. This is important for
Groupon because revenue size and growth is a key indicator of success for a young
company.
Gross Net Gross NetGrossMargin 36% 70% 39% 90%Totalassets 14962 14962 381570 381570Totalassetturnover 2031.81 969.12 3598.20 1578.18
2009 2010

88
C)Grouponarguedthattheywerethe“primaryobligor”inthesebusinesstransactions
byprovidingthesecouponstocustomersforthesuppliers,alsostatingthatthecredit
risk Groupon takes on through “The Groupon Promise” supports their position as
primaryobligor.
D)Theyaren’ttheprimaryobligor;theirTerms&ConditionsevenstatesthatGrouponis
innowayresponsibleforthegoodandservicesprovidedbythemerchantbecausethe
merchantistheissuerofthevoucher.
5.
E) When the right of return exists for the customer, the company is supposed to
recognizerevenueattheexpirationofthatright;however,Grouponrecognizesrevenue
immediately upon the sale of its couponswith no historicalway to estimate returns,
creatingariskyreportingsituationforthecompanyshouldamaterialamountofgoods
bereturned.
F) Groupon’s accounting is incorrect. Their unconditional promise to accept any
returnedgoodsmakesitincrediblydifficulttoestimatetheamountofreturnstheywill
have,especially inunfamiliar,“high-ticket”markets.TheresultwasGrouponhavingto
restateits2011financialstatementsbydecreasingthefollowingaccounts:
-Revenues(14.3million)
-Operatingincome(30million)
-NetIncome(22.6million)
-EPS(.04)
89
G)Grouponcouldhavereducedtheircredit riskby implementingapolicythat limited
thereturnperiod(30-60daysforexample).Thiswouldalsoallowthemtoestimatetheir
annualreturnsmoreaccurately.
6. The restatement of these accounts relates to Groupon’s decision to increase its
refund reserve accrual, which affected income related items but did not affect cash
flow.

90
Construct
AnalysisofFinancialPositionthroughGAAPandIFRS
By:WarrenBall
TheUniversityofMississippi

91
Summary
The questions below are answered through both GAAP and IFRS standards.
Question 1: In 2007, at the time of purchase, should construct record a liability for
environmental liabilities? If so, how much?
A: No liability should be recorded for two reasons: first, Construct has not even been
notified of a potential liability regarding environmental damage; if they had known of
this liability, they probably wouldn’t have purchased the tract of land in the first place.
Secondly, even if Construct had hypothetically known of this potential liability, the
liability was not reasonably estimable at the time and therefore would not be recorded.
Question 2: In 2008, should the company record any liability due to BigMix filing
for Chapter 11? If so, how much?
A: Construct should not record a liability for this event, even if they are trying to secure
an interest in BigMix’s shareholders’ assets. BigMix’s bankruptcy filing occurs after
Construct purchases the land. So, technically, Construct has no liability tied to BigMix’s
bankruptcy.

92
Question 3: In 2009, should the company record any liability for the potential
environmental liability? If so, how much?
A: Construct should record a liability in this situation. The liability is likely to be incurred
(60%) and can be reasonably estimated ($250,000).
Question 4: In 2010, should the company record any liability for the potential
environmental remediation? If so, how much?
The company should book a liability in total of $400,000, $100,000 from estimated legal
fees for administering the remediation action and $300,000 from the study itself.
Construct should also use a supplementary note to disclose possible further liability since
the total cost of the remediation effort cannot be reasonably estimated.
Question 5: In 2011, should the company record any additional liability for the
potential environmental remediation?

93
Construct should record a liability of $1.5 million for the estimated costs of the
remediation plan. If Construct does not go through with this remediation plan, harsh
financial consequences will follow from the EPA.
Question 6: In 2012, should the company record any gain contingency or contingent
asset for the potential settlement?
Gain contingencies are not reported until the gain is realized, even if they are probable. In
this case, Construct should disclose the possible $1 million gain in a footnote.

94
ZAGGInc.-ZealousAboutGreatGadgets
AnalysisofDeferredIncomeTaxes
WarrenBall
TheUniversityofMississippi

95
Summary
Intheexplanationsbelow,youwillfindvariouspiecesofinformationregardingdeferred
incometaxaccounting.Forexample,afewofthetopicscoveredare:1)usingdeferred
tax assets and liabilities to interpret differences in book versus taxable income, 2)
understanding the effects of changes in income tax rates, and 3) understanding the
underlyingconceptsfordeferredincometaxaccounting.
A)Bookincomeistheincomethatisreportedonacompany’sfinancialstatements.For
ZAGG, $23,898,000 in the “Income before provision for income taxes” account
represents book income. Tax income can differ from book income for a couple of
reasons: 1) permanent differences (such as non-taxable income or fines) and 2)
temporarydifferences,whichwilleitherresultindeferredtaxassets(DTA’s)ordeferred
taxliabilities(DTL’s).
B)
i)Aswasbrieflydiscussedabove,permanenttaxdifferencesaredifferencesthatwillnot
bereversed.Somerevenuesonthe financialstatementsarenot taxable, justassome

96
expenses are not deductible. An example of a permanent difference is a fine for
pollution,whichisanon-deductibleexpensethatisreportedonfinancialstatements.
ii)Temporarytaxdifferencesaredifferencesthatcanandwillbereversed.Temporary
differences arise from expenses and/or revenues that are recognized in different
periods for financial statements and tax purposes. However, they will eventually be
recognized ineithercase,which“reverses” thedifference.Forexample, companycan
useaccelerateddepreciationfortaxesandstraight-linedepreciationforitsbooks.This
resultsintaxableincomebeinglowerthanstraight-lineinthefirstfewyears.
iii)Thestatutorytaxrateisthegovernment-imposedtaxrate.
iv) The effective tax rate is computed as follows: divide the taxes paid by the book
income,whichwillrevealtheactualpercentageamountofincomepaidoutintaxes.
C) Companies report deferred tax expense in order to fully disclose their financial
position. If a company were to avoid reporting these values, it would essentially be
misrepresentingtheirfutureliabilities,consequentlyprovidinganinaccuratepictureof
theirstandingtoinvestors,creditors,etc.
D)Deferred taxassetsarisewhenacompanyhasahigher taxable income thanbook
income inthecurrentyear; thiswill result in thecompanybeingabletodeduct these

97
amounts on future taxable income. Deferred tax liabilities are taxes that a company
does not currently have to pay for but will pay for in future years. An example of a
deferred tax liability would be using an accelerated depreciation method for tax
purposes, which will decrease your book income more in the current years than in
futureyears(moretaxableincomeinfutureyears).Aprepaidtaxassetwouldarisefrom
“prepaid rent,” for example. For tax purposes, this rent revenue is immediately
recognized, even though it is not recognized on the books; therefore, the company’s
taxable incomewill be less than it’s book income in future years when the “prepaid
rent”isrecognizedasrevenue.
E)When a company has a deferred tax asset that it believes it will not be able to
recognize, the company will create a valuation account to offset the DTA’s balance.
Most of the time, this valuation account is used when a company expects to have
insufficientincome.
F)
i)
Incometaxprovision 9393Netdeferredtaxasset 8293
Incometaxpayable 17,686$

98
ii)Theamountrecordedinnetdeferredtaxassetwasadebitof8,293.Thisamounthas
twoparts:adeferredincometaxassetanddeferredincometaxliability.InNote8,we
canseethatDTA’sincreasedby8,002(debit),whileDTL’sdecreasedby291(debit);this
resultsinanetincreaseof8,293.
iii)ZAGG’seffectivetaxrate for2012equals39.30%.To findthispercentage,wetake
the income tax provision and divide it by the “income before provision for income
taxes”whichgivesustheeffectiverate.Thedifferencebetweenthestatutoryrateand
theeffectiveratecomesfromthepermanentdifferencesbetweenthetaxable income
andthebook income.Thestatutory taxrateandeffectivetaxratecanalsodifferdue
changesinthestatutoryrateovermultipleyears.
iv)GAAPrequiresanetamounttobelistedonthebalancesheetforbothcurrentand
noncurrent taxassets.Net currentdeferred income taxassets isunder currentassets
andequals$6,912,andnetnoncurrentdeferredincometaxassetsisundernoncurrent
assetsandequals$6,596.Addingtheseamountsgives$13,508.
G)
i) In 2012, the tax system recognized a greater depreciation expense. This greater
expense resulted in lower taxable income than book income, which gives rise to
deferredtaxliabilities.

99
ii)Thecumulativedifferencebetweentheamountsis$2,269.
iii) If ZAGG used tax depreciation throughout the assets’ lives, the balance of the
account atDecember31, 2012,wouldbe$1,048. To find this number, take thebook
value listed net of accumulated depreciation and subtract the cumulative difference
betweenthebookandtaxdepreciationexpense.
H)
i) The book system recognized a greater expense for doubtful accounts during 2012,
which can be seen by the fact that taxable income is higher than book income. This
differenceresultsinfuturedeductibleamountswhichresultindeferredtaxassets.
2,269$x
35%=
794$
Cumulativedifferenceinbookandtaxdepreciationexpense
Statutoryincometaxrate
Deferredincometaxliabilityrelatingtopropertyandequipmentat12/31/2012

100
ii)Thedifferenceinbaddebtexpensefor2012betweenthebookandtaxsystemequals
$654.
I) The amount in the deferred income tax asset valuation account is $713 as of
December 31st, 2012. ZAGG created this account to offset losses in their HzO equity
investment; the account was created due to uncertainty of future profits and the
currentstateofoperations.ZAGGbelievesthatthisdeferredtaxassetwilllikelynotbe
realized.
J)
654$x
35%=
229$
Changeinthedeferredincometaxassetrelatingtotheallowancefordoubtfulaccounts
Currentperioddifferenceinbookandtaxbaddebtexpensein2012
Statutoryincometaxrate
Incometaxprovision 1,930Netdeferredtaxassets 1,930

101
Johnson&Johnson(J&J)
AnalysisofRetirementObligations
WarrenBall
UniversityofMississippi
April19,2016

102
Summary
Theexplanationsbelowwillhelpyouinterpretthefootnotesassociatedwithretirement
obligations while also explaining the difference between expensing and funding a
retirement obligation. You will also learn how actuarial assumptions effect pension
expense,assetsandobligations.
A)
i) Defined contribution plans place a specific amount of money in the
retirement account each period, while defined benefit plans identify the
specific amount of benefit that will be available to you at retirement.
Johnson&Johnsonusesbothtypesofplans.
ii) Retirement plan obligations are liabilities because they are future payable
amountstoretiredemployees.
iii) Some of the assumptions for retirement plans are 1) life expectancy after
retirement for a predicted amount of years 2) how many years they will
spendworkingforthecompany,and3)projectedsalarytowardstheendof
theircareer.
B) Servicecostsequalthepresentvalueofbenefitsattributedtoemployeeservice
duringtheperiod.Thisamountisdeterminedbyapensionformula.Interestcost

103
issimplytheinterestonthatperiod’sPBOoutstanding.Actuarialgainsorlosses
comefromamortizationofOCIgainsandlosses.
C) Actualreturnrelatestoincreasesinthepensionfundduetointerest,dividends,
andunrealized/realizedchangesinthefairvalueofplanassets.Benefitspaidare
paid by the company handling J&J’s pension obligation; they reduce PBO and
plan assets. Contributions are cash contributions made by the company to
increasethecompany’splanassets.Benefitspaidtoretireesreduceplanassets
andreduceJ&J/sPBO.
D) Whenactualreturnsoccur,theyincreaseplanassets,buttheydecreasepension
expenses.(expectedvs.actual)
E) Thedifferencebetweentheseotherbenefitsandthecompany’sretirementplan
isthattheretirementplanisasumthathasbeenaccumulatedandwilldefinitely
be available upon retirement. On the other hand, health insurance and other
benefits are not pre-determined and can bemodified by the company at any
time;theyarenotprepaid.
F)
i) J&J accounted for $646 million of pension expense in its 2007 income
statement.
ii)

104
G)
i) J&J’s retirement plan obligation is $12,002 as of December 31, 2007. The
PBO is a reliable number, accounting for changes in fair value, gains and
losses,andcontributionsandexpenses.Thenumberequalsthepresentvalue
ofprojectedobligationstoemployees.
ii) The interestcost isdeterminedby thebeginningamountofPBO;basedon
this calculation, the interest rate is 5.63%. This is a high interest rate
comparedtoindustrycompetitors(Proctor&Gamble,forinstance).
iii) Theamountofpensionbenefitpaidtoretiredemployeesin2007was$481
million. This amount is not paid in cashby J&J; rather, it is deducted from
planassets (wherecashcontributionsgo)andalsodecreases J&J’spension
liability.
H)
i)AsofDecember31,2007,theamountinJ&J’splanassetsis$10,461million,which
isthefairvalueoftheplanassetsattheendoftheyear.
ii)J&J’s2006actualreturnis$265milliongreaterthanexpectedreturn,butin2007
actual return fell short of expected return by $66 million. While J&J’s expected
Pensionexpense 1,253PBO 1,253

105
returnremainedfairlyconsistent,theiractualreturnfluctuatedmuchmoreandisa
betterindicatorofthecompany’sactualpensionexpenses.
iii)2007contributionstotaled$379million,with317comingfromthecompanyand
62comingfromtheemployees.2006totalcontributionsequaled$306million,with
259fromthecompanyand47fromtheemployees.
iv) J&J has both debt and equity securities in its retirement plan assets; in 2007,
equity securities accounted for 79% of the portfolio and debt securities the
remaining21%.
I) J&J’s retirement plan is underfunded for both 2006 and 2007,with obligations
exceedingfundingbyroughly$10million inbothyears.Fundingstatusappearson
thebalancesheetinnon-currentassets,currentliabilities,andnon-currentliabilities