Embed Size (px)
Citation preview

A10158
2008 by a factor of 2.90. Voters in the three states wholeheartedly embraced the provision of
convenience voting reforms.
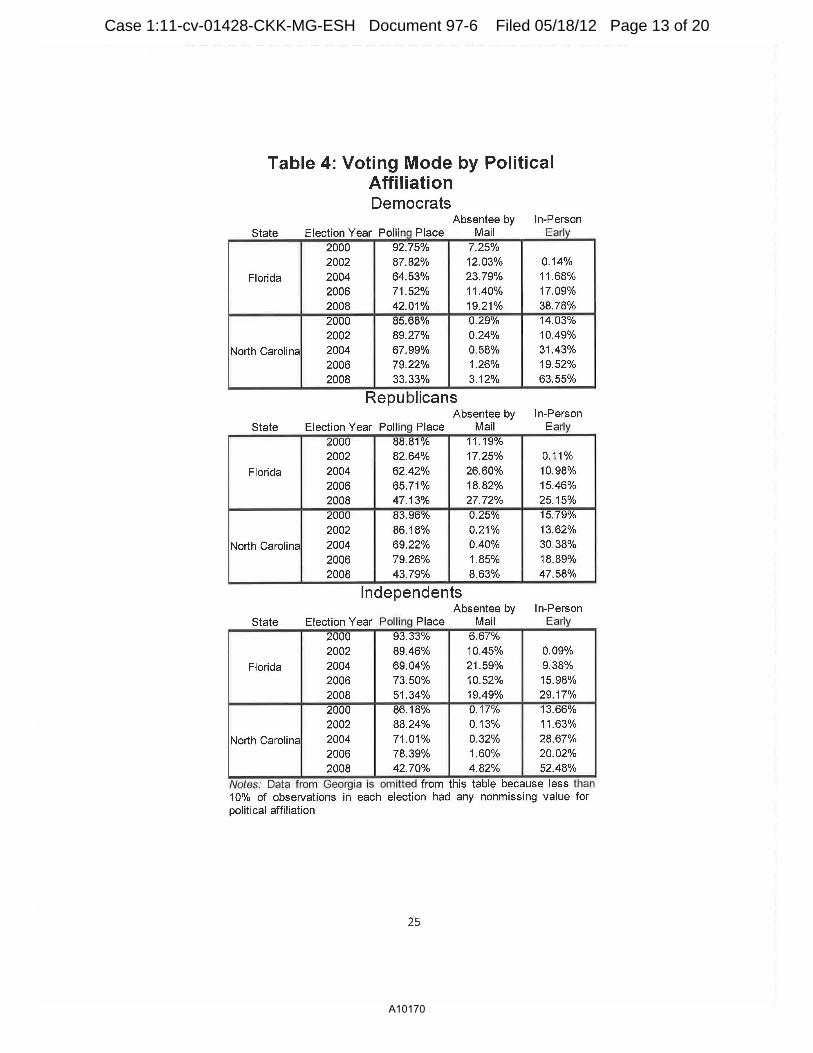
Much of the literature on demographic characteristics of early voters notes that early
voters tend to be older than polling place voters. This relationship is supported by our data prior
to 2008. However, in the 2008 election, we find convenience voting options were increasingly
adopted by younger voters. Figure 1 graphs the ballot mode by age for each observation in the
merged voter registration file. 8
[Insert Figure 1 here]
Our first observation, supported with data from the three states and across all age groups,
is that turnout, as expected, increased in 2008. But the common perception that early voters are
older is challenged by these data. In Florida voters 58 and older were more likely to vote early
than at the polling place on Election Day. The early voting electorate in Georgia is even younger;
voters 43 and older there were more likely to vote absentee. North Carolina is the most extreme
case. In that state, virtually all ages were more likely to vote early in-person than at the polling
place. The 2008 election shows considerable adoption of convenience voting reforms by younger
voters.
A comparison based on the voter's gender yields little evidence of a bias in the use of
convenience voting reforms. Table 3 summarizes the use of convenience voting by men and
women in each ofthe three case states.
[Insert Table 3 about here]
8 To establish a comparison case, we graph electoral data for 2006 and 2008. For space considerations, we
do not include graphs from 2000, 2002, or 2004, though the pattern of early voting usage by age in these elections is
similar to the pattern established in the 2006 election in each of the states.
13
Case 1:11-cv-01428-CKK-MG-ESH Document 97-6 Filed 05/18/12 Page 1 of 20

A10159
In each case state, men and women voted and voted early at similar rates. Nonetheless, men in
Georgia voted absentee more than women in 2002 (12% compared to 3%), but women were
more likely to vote absentee in 2008 (55% vs. 51%). Women in North Carolina in 2008 used
early in-person voting slightly more than men. Use of early voting across all states increased
sharply in 2008. We further observe that Georgia men and women returned to the polling place
for the runoff election, but at lower rates than in elections prior to 2008.
We know from previous literature that early voting has no inherent partisan bias, however
better organized and resourced political parties tend to mobilize greater numbers of voters to cast
their ballots early. Thus, we can expect the Democrats to enjoy an advantage when examining
early voting rates by political affiliation.
Table 4 summarizes the use of convenience voting by partisan identification for Florida
and North Carolina.9 Florida Republicans tend to use absentee voting more often than Democrats
in that state. However, Democrats tend to vote early in-person at higher rates than Republicans.
In 2008, use of early in-person voting by Democrats was 13% higher than Republicans, but use
of absentee voting was 8.5% lower than Republicans. Independents in Florida tend to split the
difference between the major parties when considering how they will cast their ballot.
Independents tend to mimic Democratic rates of absentee voting, but Republican rates of in
person early voting. In North Carolina, partisans and Independents tended to vote early at similar
rates prior to 2008. In that election, however, Democratic use of early in-person voting surged to
more than 63% (or almost 16% higher than Republicans). This suggests that the Obama
campaign's attempts to "get out the early vote" worked to a certain degree among their core
group of supporters.
9 Less than 10% of cases in the voter history files from Georgia contain any non-missing value for party.
14
Case 1:11-cv-01428-CKK-MG-ESH Document 97-6 Filed 05/18/12 Page 2 of 20

A10160
[Insert Table 4 about here]
Finally, we examine the relationship between a voter's racial background and their use of
convenience voting. Table 5 summarizes these results for all three states. Prior to 2008, African
American use of convenience voting typically trailed white use by, at most, 3-5%. However, a
bias favoring whites is apparent when only considering absentee voting. For example, white use
of mail ballots was about 7% higher in Florida and Georgia in 2006, and in the Georgia runoff.
Compare this to an early in-person deficit of about 4% in Florida or 7% in North Carolina in
2006. However, the conditions of the 2008 election largely reversed this bias in use of
convenience voting. African Americans cast their ballot early in-person more often in Florida (by
about 26%) and North Carolina (by almost 20%) and more often by mail in Georgia (by almost
11 %). That being said, whites continued to use absentee voting more often in Florida and North
Carolina. African Americans tend to use convenience voting less than whites, though this
differential in use was almost completely eliminated in an election with a co-ethnic candidate.
[Insert Table 5 about here]
The question remains however, whether this increase in usage of convenience voting
methods was a onetime phenomenon. Using the 2008 Senate runoff election in Georgia, we
examine whether there is a residual empowerment effect. It is important to note that while the
dynamics of a runoff election vary greatly from that of a general election, using this election will
provide preliminary results as to whether black empowerment continues in a "post-Obama"
environment.
In the 2008 runoff election, convenience voting drops off dramatically for both Whites
and African Americans with a 20% decrease for whites and a 30% decrease for blacks. This is
likely due to the nature of the runoff election and its proximity to the general election. While
15
Case 1:11-cv-01428-CKK-MG-ESH Document 97-6 Filed 05/18/12 Page 3 of 20

A10161
numbers drop off across the board, the share of African Americans who voted absentee was
almost 9% higher than in the 2006 general election; usage of absentee voting by Whites was
about 9.5% higher in the runoffthan in 2006.
Conclusion
Our data from Florida, Georgia and North Carolina support the empowerment theory or
the presence of a co-ethnic on the ballot and its positive effect on turnout. We broaden the effects
of this theory by including other forms of voting than just at the polling place on Election Day.
We find a slight differential turnout effect when considering early voting by Whites and African
Americans in elections previous to 2008; the 2008 campaign reversed this differential. In other
regards, we find the 2008 election caused younger voters and Democrats to cast their ballots
earlier. We have further shown, by using data from the December 2008 Senate runoff election in
Georgia, there are residual effects of this phenomenon, at least within a short period after the
election with the co-ethnic on the ballot.
Our results also raise a number of questions on the knowledge of convenience voting.
Based on the meteoric increase in African American voters with the Obama campaign's
mobilization efforts, do states adequately educate their voters on the availability of convenience
voting? While the Obama campaign clearly focused on early voter turnout, it remains unclear
what occurs when both parties focus equally on early voter turnout. Our findings suggest that an
integrated approach using statewide voter registration and voter history files as well as data from
future elections would be the most effective method to fill the gap in this literature.
16
Case 1:11-cv-01428-CKK-MG-ESH Document 97-6 Filed 05/18/12 Page 4 of 20

A10162
References
Alvarez, R. Michael, Thad Hall, and Morgan Llewellyn. 2008. "Are Americans More Confident Their Ballots are Counted?" Journal of Politics Vol. 70, No.3: 754-766.
Barreto, Matt. 2007. "Si Se Puede! Latino Candidates and the Mobilization of Latino Voters." American Political Science Review. Vol. 101: 425-441.
Barreto Matt, Gary Segura and Nathan Woods. 2004. "The Mobilizing Effect of MajorityMinority Districts on Latino Turnout." American Political Science Review. Vol. 98: 65-75.
Barreto, Matt, Matthew Streb, Mara Marks and Fernando Guerra. 2006. "Do Absentee Voters Differ from Polling Place Voters? New Evidence from California." Public Opinion Quarterly Vol. 70 No.2 (Summer): 224-234.
Berinsky, Adam. 2005. "The Perverse Consequences ofElectoral Reform in the United States." American Politics Research Vol. 33 No.4 (July): 471-491.
Berinsky, Adam, Nancy Burns and Michael Traugott. 2001. "Who Votes by Mail? A Dynamic Model of the Individual-Level Consequences of Voting-by-Mail Systems." Public Opinion Quarterly Vol. 65: 178-197.
Bobo, Lawrence and Franklin Gilliam Jr. 1990. "Race, Sociopolitical Participation, Black Empowerment." American Political Science Review. Vol. 84 No.2: 377-393.
Browning, Rufus P., Dale Rogers Marshall, and David H. Tabb. Protest Is Not Enough: The Struggle of Blacks and Hispanics for Equality in Urban Politics. Berkeley: University of California Press, 1986.
Dahl, Robert. 1961. Who Governs: Democracy and Power in an American City. New Haven, CT: Yale University Press.
Dyck, Joshua and James Gimpel. 2005. "Distance, Turnout and the Convenience of Voting." Social Science Quarterly. Vol. 86, No. 3 (September): 531-548.
Fitzgerald, Mary. 2005. "Greater Convenience but not Greater Turnout: The Impact of Alternative Voting Methods on Electoral Participation in the United States." American Politics Research Vol. 33, No. 6: 842-867.
Garcia Bedolla, Lisa. 2003. "The Identity Paradox, Latino language, politics and selective dissociation." Latino Studies. Vol. 1: 264-283.
Giammo, Joseph and Brian Brox. 2010. "Reducing the Costs of Participation: Are States Getting a Return on Early Voting?" Political Research Quarterly Vol. 63, No.2: 295-303.
Gilliam, Frank Jr. 1996. "Exploring Minority Empowerment: Symbolic Politics, Governing Coalitions and Traces of Political Style in Los Angeles." American Journal of Political Science Vol. 40, No.I (February): 56-81.
17
Case 1:11-cv-01428-CKK-MG-ESH Document 97-6 Filed 05/18/12 Page 5 of 20

A10163
Gimpel, James, Joshua Dyck, and Daron Shaw. 2006. "Location, Knowledge and Time Pressures in the Spatial Structure of Convenience Voting." Electoral Studies Vol. 25: 35-58.
Griffin, John and Michael Keane. "Descriptive representation and the composition of African American turnout." American Journal of Political Science 50, no. 4 (2006): 998-1012.
Gronke, Paul, James Hicks and Daniel Toffey. 2009. "N=1? The Anomalous 2008 Election and Lessons for Reform." A paper presented to the 2009 Annual Meeting of the American Political Science Association, Toronto, Ontario.
Gronke, Paul, Eva Galanes-Rosenbaum, Peter Miller and Daniel Toffey. 2008. "Convenience Voting." Annual Review of Political Science Vol. 11: 437-455.
Gronke, Paul, Eva Galanes-Rosenbaum and Peter Miller. 2007. "Early Voting and Turnout." PS: Political Science and Politics. Vol. 40 No.4: 639-645.
Hanmer, Michael and Michael Traugott. 2004. "The Impact of Voting by Mail on Voter Behavior." American Politics Research Vol. 32 No.4 (July): 375-405.
Jamieson, Kathleen Hall. 2009. Electing the President, 2008: The Insiders' View. University of Pennsylvania Press: Philadelphia.
Karp, Jeffrey and Susan Banducci. 2000. "Going Postal: How All-Mail Elections Influence Turnout." Political Behavior Vol. 22 No.3 (September): 223-239.
Karp, Jeffrey and Susan Banducci. 2001. "Absentee Voting, Mobilization and Participation." American Politics Research Vol. 29 No.2 (March): 183-195.
Keiser, Richard. 1990. "The Rise of a Biracial Coalition in Philadelphia." In Politics in American Cities, ed. Rufus P. Browning, Dale Rogers Marshall, and David H. Tabb. White Plains, NY: Longman.
Kaufman, Karen. "Black and Latino voters in Denver: Responses to each other's political leadership." Political Science Quarterly Vol. 118: 107-126.
Mansbridge, Jane . "Should Blacks Represent Blacks and Women Represent Women? A Contingent "Yes"." Journal of Politics 61, no. 3 (1999): 628-657.
Manzano, Sylvia and Gabriel Sanchez. 2009. "Take One for the Team? Limits of Shared Ethnicity and Candidate Preferences." Political Research Quarterly. Forthcoming.
Masket, Seth. 2009. "Did Obama's Ground Game Matter? The Influence of Local Field Offices During the 2008 Presidential Election." Public Opinion Quarterly Vol. 73, No. 5: 1023-1039.
McDonald, Michael. 2007. "The True Electorate: A Cross-Validation of Voter Registration Files and Election Survey Demographics." Public Opinion Quarterly Vol. 71, No.4: 588-602.
Miller, Amanda (ed.). 2009. Campaign for President: The Managers Look at 2008. New York: Rowman and Littlefield.
18
Case 1:11-cv-01428-CKK-MG-ESH Document 97-6 Filed 05/18/12 Page 6 of 20

A10164
Miller, Arthur, Patricia Gurn, Gerlad Gurin, and Oksana Malanchuk. "Group Consciousness and Political Participation." American Journal of Political Science. Vol. 25 No. 3: 494-511.
Neeley, Grant and Lilliard Richardson. 2001. "Who is Early Voting? An Individual Level Examination." The Social Science Journal Vol. 38: 381-392.
Oliver, J. Eric. 1996. "The Effects of Eligibility Restrictions and Party Activity on Absentee Voting and Overall Turnout." American Journal of Political Science Vol. 40 No. 2 (May): 498-513.
Padilla, F M. (1985). Latino Ethnic Consciousness: The Case ofMexican Americans and Puerto Ricans in Chicago.
Patterson, Samuel and Gregory Caldeira. 1985. "Mailing in the Vote: Correlates and Consequences of Absentee Voting." American Journal of Political Science Vol. 29 No.4 (November): 766-788.
Philpot, Tasha, Daron Shaw and Ernest McGowen. 2009. "Winning the Race: Black Voter Turnout in the 2008 Presidential Election." Public Opinion Quarterly Vol. 73, No. 5: 995-1022.
Pinderhughes, Dianne. 1987. Race and Ethnicity in Chicago Politics: A Reexamination of Pluralist Theory. Urbana: University oflllinois Press.
Richey, Sean. 2008. "Voting by Mail: Turnout and Institutional Reform in Oregon." Social Science Quarterly Vol. 89 No.4: 902-915.
Tate, Katherine. 1991. "Black Political Participation in the 1984 and 1988 Presidential Elections." American Political Science Review Vol. 85 (December): 1159-1176.
Todd, Chuck and Sheldon Gawiser. 2009. How Barack Obama Won: A State by State Guide to the Historic 2008 Presidential Election. New York: Vintage.
Shingles, Richard. 1981. "Black Consciousness and Political Participation: The Missing Link." The American Political Science Review. Vol. 75 No. 1: 76-91.
Sonenshein, Raphael J. 1993. Politics in Black and White Race and Power in Los Angeles. Princeton, New Jersey: Princeton University Press.
Southwell, Priscilla and Justin Burchett. 2000. "The Effect of All-mail Elections on Voter Turnout." American Politics Review. Vol. 28 No. 1: 72-79.
Stein, Robert. 1998. "Introduction: Early Voting." Public Opinion Quarterly 62 (1): 57-69.
Stein, Robert and Patricia Garcia-Monet. 1997. "Voting Early but not Often." Social Science Quarterly. 78 (3): 657-671.
19
Case 1:11-cv-01428-CKK-MG-ESH Document 97-6 Filed 05/18/12 Page 7 of 20

A10165
Uhlaner, Carole J. 1991. "Perceived discrimination and prejudice and the coalition prospects of blacks, Latinos, and Asian Americans." In Racial and Ethnic Politics in California, ed.
Bryan 0. Jackson and Michael B. Preston. Berkeley, CA: Institute for Governmental Studies.
Wolfinger, Raymond. 1965. "Development and Persistence of Ethnic Voting." American Political Science Review. 59: 896-908.
20
Case 1:11-cv-01428-CKK-MG-ESH Document 97-6 Filed 05/18/12 Page 8 of 20

A10166
T bl 1 P fV t R . t f F'l a e . reCISIOn 0 o er e ~Is ra 1on 1 es . Number of Number of
Difference
State Election Year Obs . In Obs. in Reported Between File Turnout and Reported
History File Merged File Tumout(in %) 2000 4,367,911 4,070,384 6,138,765 -33.69 2002 4,146,732 3,861 '159 5,143,674 -24.93
Florida 2004 6,872,785 6,401,492 7,640,319 -16.21 2006 4,703,402 4,378,120 4,884,544 -10.37 2008 8,417,439 7,765,200 8,456,329 -8.17 2000 2,637,210 2,224,752 2,583,207 -13.88 2002 2,024,659 1 ,824,114 2,028,757 -10.09
Georgia 2004 3,291,135 3,064,346 3,298,798 -7.11 2006 2,134,315 2,081,232 2, 122,185 -1.93 2008 3,933,052 3,913,694 3,924,486 -0.27
2008 Runoff 2,109,782 2,101,852 2,137,956 -1.69 2000 2,972,350 2,274,332 2,940,637 -22.66 2002 2,363,959 1,991,237 2,349,966 -15.27
North Carolina 2004 3,568,222 3,120,977 3,551,675 -12.13 2006 2,020,537 1,913,174 2,036,451 -6.05 2008 4,347,893 4,302,819 4,353,739 -1.17
Notes. Data collected by authors from statew1de voter reg1strat1on lists . Observation counts from history and voter registration files are from data collected by authors. Reported turnout is from official election results from the state election authorities. Reported turnout in Florida and North Carolina is a count of the ballots cast. Reported turnout in Georgia is based in the number of ballots cast in the Presidential (2000, 2004, 2008), Senatorial (2002 and 2008 runoff) and Gubernatorial (2006) contests.
21
Case 1:11-cv-01428-CKK-MG-ESH Document 97-6 Filed 05/18/12 Page 9 of 20

A10167
Table 2: Growth in Early Voting 2000-2008
Absentee by In-Person State Election Year Polling Place Mall I Early
2000 91.14% 8.86% 2002 85.74% 14.14% 0.12%
Florida 2004 64.40% 24.55% 11.05% 2006 69.21% 14.54% 16.25% 2008 45.70% 22.58% 31.72% 2000 95.50% 4.50% 2002 96.88% 3.12%
Georgia 2004 87.62% 12.38% 2006 82.84% 17.16% 2008 46.83% 53.17%
2008 Runoff 73.85% 26.15% 2000 85.10% 0.26% 14.64% 2002 87.98% 0.21% 11.81%
North Carolina 2004 68.93% 0.48% 30.59% 2006 79.11% 1.53% 19.37% 2008 38.62% 5.28% 56.10%
Notes: Data collected by authors from stateWide voter reg1strat1on files. Cells report row percentages .
22
Case 1:11-cv-01428-CKK-MG-ESH Document 97-6 Filed 05/18/12 Page 10 of 20

A10168
II Florida 2006
, _____ ,..._"'...., =- ,....,r . ..,. ~lorth Cllrollna 2006
.,/
Gcofllln2006
Figure 1: Vote Mode by Age
Florida 2008
NDIIh Carolina 2008
\
\
-~ ZJ • &.; ... 5) ·~ $l II ;") -,. DJ • I~ '<.lit
'L,.-, ~,--=-:.-.. ~ ... -..,~_,-,.,-.~.,-.. -,-..,. OJ • tJ 1>1 ll:l I Apdlhal/d•
'9oltM""'" t=--- ~lil'tQP*B .. ---~ .Abtlil"ltMbyM-1 I
Geo•yln 2008 Runoff
ti ~a 1 t !At., ...... ,. .-.g.llt1t':8~ ... r=---- P6Jii~ ~" __ .,... At _oy(~( Maf 1
23
Case 1:11-cv-01428-CKK-MG-ESH Document 97-6 Filed 05/18/12 Page 11 of 20

A10169
a e o mg T bl 3 V f 0 e IY M d b S ex Men Women
Absentee by In-Person Absentee by In-Person State Election Year Polling Place Mail Early Polling Place Mail Early
2000 91.14% 8.86% 91 .14% 8.86 Vo 2002 86.34% 13.53% 0.13% 85.25% 14.64% 0.12%
Florida 2004 65.28% 23.52% 11.20% 63.64% 25.42% 10.95% 2006 69.73% 13.39% 16.87% 68.73% 15.53% 15.74% 2008 47.18% 21.66% 31.16% 44.41% 23.42% 32.17% 2000 95.90% 4.10% 96.35% 3.65% 2002 87.96% 12.04% 96.85% 3.15% 2004 87.96% 12.04% 87.36% 12.64%
Georgia 2006 83.28% 16.72% 82.46% 17.54% 2008 49.18% 50.82% 44.99% 55.01%
2008 Runoff 73.86% 26.14% 73.83% 26.17% 2000 85.56% 0.24% 14.20% 84.75% 0.26% 14.99% 2002 88.03% 0.21% 11.76% 88.00% 0.22% 11 .78%
North Carolina 2004 70.59% 0.41% 29.00% 68.35% 0.51% 31.14% 2006 79.25% 1.43% 19.32% 78.84% 1.62% 19.54% 2008 40.61% 5.05% 54.34% 37.12% 5.32% 57.57%
24
Case 1:11-cv-01428-CKK-MG-ESH Document 97-6 Filed 05/18/12 Page 12 of 20
A10170
Table 4: Voting Mode by Political Affiliation
State
Florida
North Carolina
State
Florida
North Carolina
State
Florida
North Carolina
Democrats Absentee by In-Person
Election Year Pollinq Place Mail 2000 92.75% 7.25% 2002 87.82% 12.03% 2004 64.53% 23.79%
2006 71.52% 11.40%
2008 42.01% 19.21% 2000 85.68% 0.29% 2002 89.27% 0.24%
2004 67.99% 0.58% 2006 79.22% 1.26%
2008 33.33% 3.12%
Republicans Absentee by
Election Year Polling Place Mail 2000 88.81% 11.19% 2002 82.64% 17.25%
2004 62.42% 26.60%
2006 65.71% 18.82% 2008 47.13% 27.72%
2000 83.96% 0.25%
2002 86.18% 0.21%
2004 69.22% 0.40%
2006 79.26% 1.85%
2008 43.79% 8.63%
Independents Absentee by
Election Year Polling Place Mail 2000 93.33% 6.67% 2002 89.46% 10.45%
2004 69.04% 21.59% 2006 73.50% 10.52%
2008 51.34% 19.49% 2000 86.18% 0.1 7% 2002 88.24% 0.13% 2004 71.01% 0.32% 2006 78.39% 1.60%
2008 42.70% 4.82%
Earlv
0.14% 11.68% 17.09% 38.78% 14.03% 10.49% 31.43% 19.52% 63.55%
In-Person Early
0.11% 10.98% 15.46% 25.15% 15.79% 13.62% 30.38% 18.89% 47.58%
In-Person Early
0.09% 9.38% 15.98% 29.17% 13.66° /o 11.63% 28.67% 20.02% 52.48%
Notes: Data from Georg1a IS omitted from th1s table because less than 10% of observations in each election had any nonmissing value for political affiliation
25
Case 1:11-cv-01428-CKK-MG-ESH Document 97-6 Filed 05/18/12 Page 13 of 20

A10171
T bl 5 V t M d b R a e oe 0 e ty ace Whites African Americans
Absentee by In-Person Absentee by In-Person State Election Year Polling Place Mail Early Polling Place Mail Early
2000 90.47% 9.53% 93.22% 6.78% 2002 85.60% 14.30% 0.10% 88.68% 11.04% 0.28%
Florida 2004 64.41% 23.72% 11.87% 65.79% 23.03% 11 .18% 2006 67.82% 15.26% 16.92% 78.98% 8.13% 12.89% 2008 47.59% 25.07% 27.34% 32.81% 13.47% 53.73% 2000 95.53% 4.47% 98.02% 1.98% 2002 96.39% 3.61% 98.36% 1.64% 2004 86.07% 13.93% 91.46% 8.54%
Georgia 2006 80.84% 19.16% 88.00% 12.00% 2008 49.70% 50.30% 38.83% 61 .17%
2008 Runoff 71.36% 28.64% 79.04% 20.96% 2000 85.15Yo 0.24 Yo 14.61% 84.81 % 0.31% 14.88% 2002 87.44% 0.21% 12.35% 90.37% 0.25% 9.38%
North Carolina 2004 68.51% 0.43% 31.05% 70.18% 0.67% 29.14% 2006 77.72% 1.69% 20.58% 85.84% 0.61% 13.55% 2008 42.85% 4.88% 52.27% 26.56% 1.29% 72.14%
26
Case 1:11-cv-01428-CKK-MG-ESH Document 97-6 Filed 05/18/12 Page 14 of 20

A10172
Making Voting Easier: Convenience Voting in the 2008 Presidential Election
Political Research Quarterly XX(X) 1-15 © 20 I I University oF Utah Reprints and permission: sagepub.com/journalsPermissions.nav DOl: I 0.117711065912911398048 http://prq.sagepub com
®SAGE
R. Michael Alvarez 1, lnes Levin 1
, and J. Andrew Sinclair1
Abstract
The authors analyze the choice of voting mode in the 2008 presidential election using a large-sample survey with national coverage that allows a new perspective of convenience voting. Most importantly, they make clear distinctions among the major forms of convenience voting and demonstrate that not all "convenience voters" share the same attributes. In addition, the authors find little support for the hypothesis that convenience voting methods have partisan implications, despite the differences among mail, early, and election-day voters. Results like these have important implications for future moves toward convenience voting and the design of new outreach campaigns.
Keywords
convenience voting, early voting, 2008 presidential election, multilevel modeling
A basic observation motivates our research: in a democracy, election rules matter. How elections are administered can change the costs of elections, voter satisfaction with the process, the strategies campaigns pursue, the election's integrity, and who wins the election. In recent decades, at the federal, state, and local levels officials and legislators have taken steps to make participating in elections more convenient. One approach is broadly called "convenience voting," including both in-person early voting and voting by mail. Our goal is to examine who takes advantage of these alternatives to better understand the consequences of convenience.
Berinsky (2005, 482) argues that this question is closed. "All told," he writes, "using a variety of methods and data sources to assess the effect of different voting reforms, a series of scholars have come to a single conclusion." He observes that studies indicate convenience voters are "more politically engaged" and are likely to be wealthier and better educated. In other words, convenience voters are likely voters.
We believe that this debate is far from settled. It is not the case that scholars have come to a "single" conclusion; rather than providing a single clear picture, the literature presents a murky view. There is some interesting and well-considered research on this topic, but other studies are less convincing. In addition, convenience voting is a broad topic, and much research focuses on a single election, single state, or small number of survey respondents. This is understandable, and not necessarily a criticism, but the limited scope of the existing literature demands more study before the question is considered closed.
There is also simply the matter of time. For example, one of the early and oft-cited articles is Patterson and Caldeira's (1985) study. In 1982, 6.5 percent of California voters utilized the recently introduced no-excuse absentee voting law; many of them cast ballots for Republican George Deukmejian and landed him in the governor's office. Decades later in the 2008 June primary, 59 percent of California voters submitted ballots by mail; in the 2008 November general election, 42 percent of California voted by mail. It is not appropriate to draw conclusions about the voting behavior of nearly half of California's voters in 2008 based on research regarding the behavior of a small fraction of California's electorate in 1982. Nor is it appropriate to apply conclusions from the study ofby-mail voting in California in 1982 to in-person early voters in Texas in 20 I 0. Thus, we believe that the effects of convenience voting reforms in recent years deserve study.
We intend to clarify our understanding of convenience voting. We make clear the distinction between in-person early voting and by-mail voting, a place of confusion in the application of previous research. We use a largesample national survey from 2008 to study the choice of voting mode-Election Day, early, and by mail-in the 2008 election. To estimate a well-specified model of individual voter choices regarding how to cast their ballots,
1 California Institute of Technology, Pasadena, CA, USA
Corresponding Author: lnes Levin, California Institute of Technology, MC 228-77, California Institute of Technology, Pasadena, CA 91 125, USA. Email: [email protected]
Do'Nilloaded from prq sagepub com by guest on May 14, 2012
Case 1:11-cv-01428-CKK-MG-ESH Document 97-6 Filed 05/18/12 Page 15 of 20

A10173
2
we use a Bayesian hierarchical multinomial logit model. This allows us to better understand the choices made by voters, which will give a greater understanding of the effects of allowing more convenience voting.
Previous Research
The question "who uses which voting alternative" should be fairly straightforward if the data are readily available. Unfortunately, the data are not. The diversity of approaches used in the literature reflects a variety of methods political scientists have used to study this question. We are not immune to some of the difficulties previous authors encountered; for example, we conducted this survey only in 2008. To offset the weakness of using a single election, our approach has some advantages relative to previous studies : our national coverage, large sample size, sophisticated methodology, and analytic distinction between "early in-person" and "by-mail" voting.
Early studies used county-level election and census data to infer which demographic variables were associated with high levels of absentee voting. 1 The advantage of this approach is the availability of election data over a long period of time: Patterson and Caldeira (1985) put together three California elections and a single Iowa election, while Dubin and Kalsow (1996) compiled data from thirty-three California elections. The main methodological disadvantage of these studies is the unresolved ecological inference problem (King 1997). While the conclusions of the Patterson and Caldeira article are widely cited in the literature-"partisan candidates are likely to harvest absentee votes in the very localities where their party is otherwise strong"-this conclusion is drawn from separate ordinary least squares regressions run on data from these four, decades-old, elections (Patterson and Caldeira 1985, 766). Nevertheless, this sort of approach formed the original foundation for our research; their conclusions suggest that likely voters are also likely convenience voters, and we started from that hypothesis.
Another branch of the literature that informed our expectations and choices of independent variables focuses on Oregon's transition to a vote-only-by-mail (VOBM) system. Oregon switched in the late 1990s to conducting all of its elections entirely through the mail. Political scientists have studied whether this switch changed turnout or changed the composition ofthe electorate, demographically or politically. It is difficult to say whether conclusions drawn from the Oregon experience might apply in other states or on the national level. For example, if the VOBM system resulted in a higher proportion of elderly voters participating, this could be because elderly voters found the VOBM system easier or because younger voters
Political Research Quarterly XX(X)
found the absence of a traditional polling place to be an obstacle. Nevertheless, this literature can provide important clues for how to approach the national convenience voting picture.
Unfortunately, in our reading of the literature, these studies do not reach a consensus on either turnout or composition questions (Magleby 1987; Southwell and Burchett 1997, 2000; Karp and Banducci 2000; Berinsky, Bums, and Traugott 2001; Hanmer and Traugott 2004). Berinsky, Burns, and Traugott (2001, 194) find that VOBM "increases turnout by a small amount," but only because of"selective retention ofvoters"-those "already predisposed to vote ." The disagreement among the studies appears to be on the magnitude and significance of education, income, political party, and so on. We do not attempt to resolve these differences; in fact, in our analysis, we do not use survey respondents from Oregon.2 Instead, we focus on the ability to generalize to the national level the hypothesis that voters "predisposed to vote" are convenience voters.
Other studies have used survey data. Survey data avoid the ecological inference problem of inferring individual behavior from aggregate data and allow the researchers to elicit more information about the voters' motivation for their choice. Barreto et a!. (2006, 224) conducted a study of California by-mail voters in the 2003 recall election; they concluded that "absentee voters do not differ significantly from the overall state electorate in terms of their vote preferences, despite being older and better educated." Karp and Banducci (200 1, 191) tried to put together a national study using the National Election Studies survey data; they found that "persons who vote early are likely to be educated, active in politics, and partisan" but not likely to be from one party or the other. Although theirs was a national study, they had only 446 voters in forty-two states pooled over five successive elections; our survey contains many more voters .
Stein (1998) conducted a survey of Texas early and Election Day voters in 1994 and concluded that early voters differed from Election Day voters primarily by their attitudes toward politics (Stein 1998, 67). This confirmed a previous study (Stein and Garcia-Monet 1997) of the 1992 Texas general election. Gronke et al. (2004; Gronke and Krantz Toffey 2008) made much the same observation about convenience voters in general: strength of partisanship may inform voting mode decisions. Gronke and Toffey (2008) did not find the same, but Neeley and Richardson (200 1) did in their analysis of a single Tennessee county.
One other article deserves mention here because it explicitly addresses the important issue that vote mode choice interacts with party strategy. Oliver's (1996, 507) study of the 1992 general election used the Current Population Survey and a survey of his own directed at
Downloaded from prq sagepub com by guesl on May 14,2012
Case 1:11-cv-01428-CKK-MG-ESH Document 97-6 Filed 05/18/12 Page 16 of 20

A10174
Alvarez et a/.
party organizations. He found that turnout increased in liberalized absentee voting states only when combined with state party mobilization and that Republicans were farm ore active in recruiting absentee voters than Democrats . This relates to the motivation for the Patterson and Caldeira article; they observed that Republican George Deukmejian's gubernatorial campaign in 1982 sent out prefilled absentee forms while Democrat Tom Bradley's campaign did not (Patterson and Caldeira 1985; Quinn 1983). This implies that older studies might not generalize to the contemporary situation; if Democrats have in recent elections adopted Republican tactics from the 1980s, then new research is required in this field to keep abreast of changes in political tactics.
Taking all of this into consideration, we advance the study of convenience voting in several ways. First, we separate and explicitly evaluate the differences between "early" and "by-mail" voting. This enables us to test our first hypothesis, which is really an assumption frequently made in other studies, that individual characteristics will have the same effect on early voting as they do on bymail voting. This hypothesis would not hold, for example, if elderly or disabled people were more likely to vote "by mail" rather than in person "early," a reasonable belief. Testing this hypothesis allows us to clarify the assumptions in the field of convenience voting.
Since it appears that political parties are changing their convenience voting strategies and that the convenience voting population continues to grow, it is also worthwhile to test two hypotheses commonly studied in the literature. Our second hypothesis, inspired by the conventional political wisdom, is that Republican and conservative voters are less likely to vote on Election Day. This is inspired by Oliver's (1996) revelations on the greater Republican efforts to mobilize absentee voters and Quinn's (1983) description of the Deukmejian campaign.
Stein ( 1998) observed that individuals who already know how they want to vote do not need to wait until Election Day to vote. Gronke et a!. (2005) attempted to test this in Florida in the 2004 election with mixed results. This is still a compelling argument, though. If a voter always votes for the straight Democratic ticket, for example, the voter may not need the information presented in the last few days of a campaign. So our third hypothesis is that strength of partisanship increases the probability that a voter will choose one of the convenience voting options, relative to precinct voting on Election Day.
Finally, previous studies have found that election administration and voting technology have implications for political representation, in particular regarding race and ethnicity (Alvarez eta!. 2008 Alvarez, Hall, Llewellyn 2008. Alvarez 2004. Sinclair and Alvarez 2008; Bullock, Hood, and Clark 2005; Tomz and Van Houweling 2003). Therefore, it is possible that voters belonging to different
3
racial or ethnic groups have different preferences for voting modes. This is particularly an issue in 2008, the first election with an African American presidential candidate as the Democratic nominee. In the days preceding November 4, 2008, researchers examined early voting figures by race and argued that black voters were making wider use of early voting relative to the 2004 election (McDonald 2008) . Accordingly, our fourth hypothesis is that nonwhite voters were more likely to vote early.
Method and Research Design
We use data from a unique study of voter attitudes about election administration and voting behavior, the 2008 Survey of the Performance of American Elections (Alvarez et a!. 2009). This first-of-its-kind survey was developed to provide a comprehensive national assessment of voter experiences with the electoral process in the 2008 presidential election; the general election survey (which we use in our analysis), while implemented the week after the election, had been extensively pilot tested in prior gubernatorial elections in the fall of 2007 (Mississippi, Kentucky, and Louisiana) as well as in the 2008 Super Tuesday presidential primary.
The survey interviews we use in this study were conducted online, with two hundred interviews from registered voters in every state (yielding a total sample of ten thousand responses from registered voters nationally). YouGov/Polimetrix conducted these interviews, using matched random samples of registered voters in each of the fifty American states. Weights were developed so that on a number of demographic characteristics the samples matched the national demographic profile of registered voters. With these weights used, the external validity of the online survey results was quite strong: the state-bystate Obama vote estimated by the online survey was strongly correlated with the actual state vote (.94) . A telephone survey was also undertaken, with a sample of two hundred registered voters in ten states, and these interviews were conducted using computer-assisted randomdigit dialing techniques. The telephone survey was conducted to provide an assessment of the online sample and survey response, and comparative analysis of the two methods produced a conclusion that overall both methods produced results that are consistent.
Our analysis of convenience voting in the 2008 presidential elections uses responses from a question that was asked to those who said that they voted in the election: did they vote in person on Election Day at a polling place, in person before Election Day, or by mail. In our work, we refer to these different means of casting a ballot as in-person Election Day voting, in-person early voting, and voting by mail. Relative to what may happen with self-reported turnout we do not expect respondents to
Downloaded rrom prq sage pub com by guest on May 14,2012
Case 1:11-cv-01428-CKK-MG-ESH Document 97-6 Filed 05/18/12 Page 17 of 20

A10175
4
misreport their voting mode because of willingness to confonn to socially desirable behavior because no voting mode is perceived as socially unacceptable. Still, we are aware that answers to these questions are subject to misreporting caused by imperfect recall , confusion caused by question wording, and also systematic choice of voting mode by those who misreport their turnout. For instance, individuals who answer that they voted, when they actually abstained, might be more prone to say they voted by mail instead of in person early or on Election Day. If individuals who misreport differ systematically in their characteristics relative to the rest of the sample, models based on self-reported behavior can lead to biased and inconsistent inferences (Katz and Katz 201 0) . Unfortunately, since no validation study was conducted to verify selfreports of voting mode, we cannot correct for potential misreporting.3 That said, we are reassured by the fact that authors who have studied the consequences of turnout misreporting in recent years have found few differences in parameters across models based on self-reported and validated behavior and almost no change in the substantial implications of their analyses (Achen and Blais 2010; Karp and Brockington 2005; Katz and Katz 2010).
The research design of our study is straightforward. We begin by examining data from the various states regarding how permissive their policies in the 2008 presidential election were for each mode of voting, concentrating on how easy it was for voters to cast an in-person early voting ballot or to vote by mail (as those are the modes of voting that vary greatly in their convenience across the states). We then look to our survey data to ascertain across the states what fraction of the electorate might have used each mode of voting in each state. Then, we look at how the choice of voting mode varies by important covariates, and finally we use a Bayesian hierarchical model to estimate parameters of a model where the choice of voting mode is the dependent variable. As we discuss below, this method is appropriate for addressing both the discrete nature of the voting mode choice as well as the fact that we have a data set constructed from individual state samples. The latter point is important to keep in mind, as there is likely much systematic heterogeneity in choices about how to vote across the states, and controlling for this heterogeneity is essential to obtain meaningfu I estimates for our co variates of interest.
An Initial Look at Convenience Voting in 2008 We begin our study by examining the permissiveness of state laws regarding voting by mail and in-person early voting in 2008. We use data on methods of voting across the states that were originally collected by the Early Voting Information Center at Reed College, presented in
Political Research Quarterly XX(X)
Table 1.4 There we see that in 2008 there was substantial variation across the nation in which types of convenience voting methods were allowed.
Beginning with voting by mail, Table I documents that there were four states (California, Colorado, Montana, and Washington) that allowed voters to register as permanent by-mail voters-these voters receive all of their election materials by mail. Twenty-eight of the states allowed for no-excuse provision of ballots by mail (including Oregon, where all voters receive their ballots by mail). And twentytwo of the states required some form of a voter excuse or reason for requesting a ballot by mail. Note that there are not any clear geographic or population size patterns regarding which states adopt which rules.
When we turn to the second set of columns in Table I, where we provide information on the permissiveness of the states with regards to early voting, we see that four states did not allow early voting in 2008 : Maryland, Oregon (which instead provides all voters with election materials by mail), Rhode Island, and Washington (which also has widespread use of by-mail voting). Thirty-two of the states allowed no-excuse in-person early voting, while fourteen of the states allowed for in-person early voting if the voter provided some excuse or rationale for voting before Election Day.
Correspondingly we provide in Table 2 data from our survey that document the percentage and number from each state sample of respondents who reported using each mode of voting. The data in Table 2 show that across the nation, voting in person on Election Day was the most prevalent method of participation in the 2008 presidential election, as 64 percent of voters in our samples said that they voted on Election Day. This of course implies that 36 percent voted before the election, with equal percentages saying they voted before the election in person (18 percent) and by mail (18 percent).
These data indicate that there are some states where voting in person on Election Day was the primary method of voting in 2008: in sixteen states at least 80 percent of voters said that they voted in person on Election Day. However, in four states more than 50 percent of voters said that they voted by mail: Oregon (97 percent), Washington (86 percent), Colorado (61 percent), and Arizona (54 percent). In another ten states more than 20 percent of ballots were cast by mail. And finally, another five states had voters report that more than 50 percent voted in person before the election: Tennessee (63 percent), Texas (62 percent), Nevada (62 percent), North Carolina (53 percent), and New Mexico (52 percent) . Another twelve states had more than 20 percent of voters report voting in person before the election.
The bivariate tables provide a useful introduction to the data before moving on to the multivariate analysis (see Table 3). Some of the results are foreshadowed by
Dovmloaded from prq.sagepub com by guesl on May 14, 2012
Case 1:11-cv-01428-CKK-MG-ESH Document 97-6 Filed 05/18/12 Page 18 of 20

A10176
Alvarez et a/. 5
Table I. Procedural Permissiveness by State
By mail Early voting
Allows permanent No excuse Requires excuse No excuse Requires excuse Not allowed
Alabama Alaska Arizona Arkansas California
Colorado Connecticut Delaware Florida Georgia Hawaii Idaho Illinois Indiana Iowa Kansas Kentucky Louisiana Maine Maryland Massachusetts Michigan Minnesota
Mississippi Missouri Montana
Nebraska Nevada
New Hampshire New Jersey New Mexico New York North Carolina North Dakota Ohio Oklahoma Oregon Pennsylvania Rhode Island South Carolina South Dakota Tennessee Texas Utah Vermont Virginia Washington West Virginia Wisconsin
Wyoming I Total 4 28 2 32 14 4
Downloaded from prq.sagepub.com by guest on May 14,2012
Case 1:11-cv-01428-CKK-MG-ESH Document 97-6 Filed 05/18/12 Page 19 of 20

A10177
6
Table 2. Voting Mode by State
Alabama Alaska Arizona Arkansas California Colorado Connecticut Delaware Florida Georgia Hawaii Idaho Illinois Indiana Iowa Kansas Kentucky Louisiana Maine Maryland Massachusetts Michigan Minnesota Mississippi Missouri Montana Nebraska Nevada New Hampshire New Jersey New Mexico New York North Carolina North Dakota Ohio Oklahoma Oregon Pennsylvania Rhode Island South Carolina South Dakota Tennessee Texas Utah Vermont Virginia Washington West Virginia Wisconsin Wyoming Total
Election Day
%
94 68 40 52 52 18 94 96 41 45 53 68 72 74 62 59 93 77 68 92 91 73 90 94 87 53 69 26 92
90 24 92 38 54 62 81 2
95 93 72 76 35 33 55 73 84 13 67 77 68 64
355 126 153 92
195 33
178 183 156 173 93
124 273 143 117 110 172 140 125 177 176 133 174 363 160 100 129 49
175 165 47
341 68 98
118 148
4 178 175 132 140 63
119 102 137 160 50
119 147 134
7,222
%
Early voting
24 45 6 22
46 83 13
21 39 0 I 3
39 151 47 178 22 39 14 26 25 94 21 41 16 30 25 46
6 21 38 15 27
2 2
12 10
12 23 10 20 62 116
I 2
52 10 I 10
53 94 19 35 16 31 I I 20
2 2
2
12 23 16 30 63 114 62 221 34 62 12 23 8 16
5 31 54 13 26 17 34 18 1,986
By mail
%
19 8 14
54 205 2 4
45 170 61 115
6 II
20 78 8 31
26 45 18 34
II 9
22 42 16 30 4 7 2 4
18 33 7 14
12 25 46
8 16 12
8 14 35 67 21 40 12 23 7 13 8 15
24 47 19 15
27 49 22 42
8 14 97 184
3 7 10
16 29 8 15 2 4
18 12 21 15 29 7 14
86 330 2 4
10 19 15 29 18 2,034
n is the number of observations. All figures were computed using sampling weights.
Political Research Quarterly XX(X)
differences in the bivariate tables: for example, given the previous literature, it is surprising that Hispanic and African American voters were more likely to choose inperson early voting than were White or Asian respondents, although not out of line with our last hypothesis. Note the ten-percentage-point difference between White and Hispanic respondents in particular. Furthermore, Hispanic voters are the least likely to vote in person on Election Day.
The data on mode choice, by the other demographic characteristics, are consistent with previous research. Disabled people are more likely to vote by mail rather than in person early, although they are still more likely to choose to vote in a traditional polling place than to take advantage of the "convenience" alternatives. There are virtually no differences by gender, as we expected, and also little evidence regarding an association with home ownership or length of residency. Furthermore, also exactly as expected, increasing levels of education correspond with decreasing probability of voting in person on Election Day; however, the differentiation between education levels and their mode preferences will have to wait until the multivariate analysis as little difference is immediately evident from this analysis.
Table 3 also provides an introductory analysis of the relationship between voting mode and political attitudes. As we move along the ideological scale from "very liberal" to "very conservative" respondents are more likely to vote in person on Election Day, and we observe the opposite for both early and by-mail voting. Turning to partisanship, the proportion of those who vote in person on Election Day is larger for Independents and Republicans while Democrats are substantively more likely to vote early. However, the proportion of by-mail voters does not vary by party identification. Finally, while strong Democrats tend to vote early at greater rates compared to other Democrats, strong Republicans tend to vote early at lesser rates relative to other Republicans.
In the remainder of this article we examine these patterns across states and voters and study which factors might determine how voters in the 2008 presidential election decided to cast their ballots. We are most interested in testing hypotheses regarding individual-level voter attributes, and we use a Bayesian estimation method that we describe in the next section. This method lets us obtain estimates about the different potential individual-level determinants of the choice of voting method while controlling for statelevel differences in the extent to which different modes of voting were available to the voters in the state.
Multivariate Method
The goal of our multivariate analysis is to study how sociodemographic attributes and political attitudes affect
Downloaded from prq sagepub com by guest on May 14, 2012
Case 1:11-cv-01428-CKK-MG-ESH Document 97-6 Filed 05/18/12 Page 20 of 20