Embed Size (px)
Citation preview
Cascades to Coast GK12 Curriculum
Using Aquatic Macroinvertebrate Bioassement to Evaluate Stream
Quality in the Cascades and Willamette Valley Ecoregions.
Fellow: Kit Rouhe (Environmental Science)
Teacher: Laurie McDowell (Lent Middle School)
Advisor: Dr. John Rueter (Environmental Science)
Learning goals:
• Upon completion of this curriculum, students should become familiar with stream
Aquatic Macroinvertebrate Bioassessment as a method for evaluating stream
quality using the stream. The students should also know how to use one type of
bioassessment metric (percent EPT of stream macroinvertebrates) to compare
stream quality between two streams.
• Understand the ecological impact of human activities and land development in the
on the quality of streams in the Cascades to Coast Ecoregion.
Objectives:
• Be able to identify stream macroinvertebrates to the order level
• Learn how to collect samples of live macroinvertebrates from a stream
• Learn how to calculate percent EPT for stream samples
• Be able to determine the quality of a stream using percent EPT
• Be able to compare streams with tow different land use intensities using percent
EPT
Target Grade: Sixth
State Standards:
State Standards (Oregon State Board of Education) Addressed in this Curriculum
6.2L.2 Explain how individual organisms and populations in an ecosystem interact and
how changes in populations are related to resources
6.2E.1 Explain the water cycle and the relationship to landforms and weather
6.3S.1 Based on observations and science principles, propose questions and hypotheses
that can be examined through scientific investigation. Design and conduct an
investigation that uses appropriate tools and techniques to collect relevant data.
6.3S.2 Organize and display relevant data, construct an evidence-based explanation of
the results of an investigation, and communicate the conclusions.
Background
This curriculum was developed to show 6th
grade students, with no prior training
or knowledge of bioassessment, how to use aquatic macroinvertebrates to determine the
quality of a stream. This four day, inquiry-based curriculum was introduced to the
students during a unit on Salmon, the water cycle, and water quality. The main goal of
this curriculum was to allow the students to compare two streams and determine which
one had the highest quality. The two-stream comparison was also a part the general
theme of our water unit: “From the Cascades to the Coast, what’s in the water?” Our
school is located in Portland, Oregon. Portland is in the Willamette Valley, which lies
between the Cascades and Coast Range mountains. The theme was chosen to provide a
context for studying water quality in the Cascades and Willamette Valley ecoregions. The
goal of this unit is to compare the similarities and differences of streams in all three areas
(Cascade Mountains, Willamette Valley, and Coast Range mountains), but the goal of the
four-day curriculum presented here is to compare just two of the three areas. For each
activity in this four day curriculum a general question was asked by the instructor (see
activity plan), written down by the students, and used to form the basis for the activity.
Student learning was assessed through his/her answer to the inquiry question for each
activity.
Site description
The two streams chosen for the comparison activity presented in this curriculum
are from two very different ecoregions of Oregon. Sixes Creek (Cascades ecoregion) is a
small stream that flows into the Wilson River. The Wilson River and Sixes Creek both
contain runoff and snowmelt from the slopes of Mount Hood and the surrounding
foothills of Mount Hood in the Northwest Oregon Cascades. This area is dominated by
fir, pine, and cedar forest with very little human influence from residences or industry.
The Willamette Valley stream, Johnson Creek, flows from the foothills of the Cascades
in northwest Oregon and empties into the Willamette River just south of downtown
Portland, Oregon. The headwaters are dominated by fir, pine and cedar forest but the
river mainly runs through the Willamette Valley. A large portion of the river runs
through agriculture land and the lower reach, just before it enters the Willamette River, is
highly urbanized and is directly influenced by human residences and industry. It is in the
lower, urbanized reach, just before it enters the Willamette River, that the samples for
this project were collected.
Bioassessment
In order to compare two streams, there are many ways to measure water quality
and pollution levels including chemical analysis of pollutants, water chemistry. The
chemical analysis of nutrients, oxygen, and oxygen demand of the water are a great ways
of determining stream water quality at the time of collection. However, stream chemicals
can fluctuate from day-to-day and season-to-season, so chemical analysis for pollution
influences is only useful if measured many times throughout a season. If it is only
possible to visit a stream a few times per year (once or twice each season), determining
pollution of the stream using chemical analysis is not very accurate because of the high
variability associated with chemical measurements. Stream condition may be more
accurately determined by examining the organisms living in the stream. This type of
analysis is called bioassessment. Bioassessment has several advantages over traditional
chemical measurements because the organisms live in the streams year round and
therefore reflect long-term stream conditions. In essence, Bioassessment presents a broad
scale view of stream habitat and water quality with the convenience of infrequent
sampling. For this activity we chose to use stream macroinvertebrate communities to
bioasses two streams with different land use pressures. We used a method of analysis
that compares the percentage of pollution tolerant to pollution intolerant
macroinvertebrates.
Description of stream EPT and Percent EPT metrics
There are many different bioassessment collection and analysis methods that can
be used to measure stream pollution. The curriculum presented here is based on
assessing water quality using a bioassessment method called percent EPT. EPT stands
for Ephemeroptera, Plecoptera, Tricoptera. These are the order names for the insects
known as mayflies (E), Stoneflies (P), and Caddisflies (T). For these three orders of
insects, and for many others, the first developmental stages of the life cycle are aquatic.
These larval stages can last from months to years, but all the stages survive in streams by
living in on the stream bottom or by floating and swimming in the water. To calculate
percent EPT, one first collects all the sediment macroinvertebrates from a small area of a
stream using a specialized net. Second, a total count is made of all the
macroinvertebrates found in the sample. Next, organize the macroinvertebrates in to
groups based upon orders. Lastly, calculate a percent of organisms in each order based
on the total and add the three percents for E, P, and T together. If those percents total
greater than 50%, the stream is considered not polluted. If EPT percent falls below 50%,
then the stream is considered polluted. The farther above 50%, the less polluted the
stream. The farther below 50%, the more polluted the stream.
This assessment in this activity is based on the assumption that for most streams,
if there are more mayfly, stonefly, and caddisfly larva living in the stream sediment than
all the other macroinvertebrates collected from a stream bed, then the stream is
considered of high water quality. It is important to note here that this is based on the
general assumption that species from these orders do not tolerate polluted waters.
However, this is not always the case. Some species from these orders can tolerate
polluted waters, but as a general assumption EPT percent works well for most streams,
particularly in regions outside of the Pacific Northwest. . While there are polluted
streams that have an EPT above 50 percent, most streams fit the general assumption and
so EPT percent works well as a practical tool for assessing stream quality. The reason
this is important for this activity is that it is not designed for students to identify each
species of mayfly, stonefly, or caddisfly. Without knowing the exact species, it is difficult
or impossible to determine if each organism found was pollution tolerant or pollution
intolerant. To account for this possible error, this activity was designed to compare the
EPT percent of two streams and then make a conclusion about which stream was less
polluted base on EPT percent.
A major advantage of using EPT percent for water quality assessment is that
students can easily and quickly identify mayflies, stoneflies, and caddisflies with just a
little training. There are many more aquatic macroinvertebrates that are found on the
stream bed besides EPT species. Aquatic macroinvertebrates include the three orders of
EPT insects, other orders of insects, crustaceans, arachnids, worms, mollusks, and
cnidarians are just of few of the major orders, phylums, and classes. Learning to identify
all of the major groups, the species in those groups, and the pollution tolerance of each
species would take a lot of class and field time. Just learning the three EPT orders
allows the students to gain an adequate level of knowledge in order to quickly determine
the water quality of the stream.
Curriculum overview
The four day curriculum explained here involves first learning the general
characteristics of the EPT orders, followed by practice with identification in the
classroom of macroinvertebrates collected from one of the comparison streams, a field
trip to collect and identify aquatic macroinvertebrates at the second comparison stream,
and finally a day in the classroom to analyze the data and create a poster of the results.
Links to field guides for pictures and characteristic can be found in the resources section
of this curriculum plan. Also in the resource section are some links to protocols for
collecting stream macroinvertebrates. If you have not sampled for stream
macroinvertebrates before, it is not difficult to learn. However, you need a specialized
net and some other tools that you may have to order or borrow a head of time.
Activity Summary:
This curriculum describes a Four-day activity. Day one: identify similarities and
difference between drawings of mayflies, caddisflies, and stoneflies, and learn how to
identify each of them. Day two: instructor brings macroinvertebrates collected from a
local stream into the classroom and the students tally number of EPT organisms, total
macroinvertebrates, and then calculate percent EPT. Day three: visit second stream site.
Students collect macroinvertebrates from the stream sediment. Students tally number of
EPT organisms, total macroinvertebrates, and then calculate percent EPT (if field trip is
not an option, instructor can bring the samples from the second site into the classroom as
in day 2). Day four: create a bar chart of total percent mayflies, percent caddisflies, and
percent stoneflies. Answer assessment question each day (see appendix).
Activity Plan:
Day 1 – Introduction to stream macroinvertebrate identification
Question: What is similar and different about Mayflies, Caddisflies, and Stoneflies
1. Students work in pairs
2. Students are given a handout with 3 pictures/drawings (one caddisfly, one mayfly,
and one Stonefly).
3. On the handout, each student pair makes a list of things that are similar and things
that are different about each drawing (students are not given any names or
background information about drawings). 5 minutes
4. On the bottom section of the handout, students write down characteristics of each
of the macro groups (led by instructor)
5. Visual quiz – 10 photographs of mayflies, stoneflies, and caddisflies. They write
answers in their lab books by simply writing mayfly, stonefly, or caddisfly for
each photograph. (quiz to be graded at the beginning of the next lesson)
6. Visual quiz answers: (1) mayfly, (2) stonefly, (3) mayfly, (4) caddisfly, (5)
stonefly, (6) mayfly, (7) stonefly, (8) caddisfly, (9) stonefly, (10) caddisfly
Day 2 – Willamette Valley stream analysis
The day before “Day 2” of the in class activity
The day before you are going to do this activity, the instructor goes to one of the
stream sites and collects macroinvertebrates from the stream sediment. Place
macroinvertebrates in a plastic container with a lid (one for each classroom group).
Put containers on ice to keep them at stream temperature until you take them to the
classroom. Keep the lid cracked overnight to allow oxygen into the container. Keep
container outside so that the invertebrates are exposed to natural light and dark cycles.
Question: Is Johnson Creek a polluted or pristine stream?
Hypothesis: If Johnson Creek has more mayflies, stoneflies, and caddisflies than other
macroinvertebrates, then Johnson Creek is a pristine stream.
In the classroom on the day of the activity:
1. Grade visual quiz from last lesson and recap characteristics of Mayflies (E),
Stoneflies (P), and Caddisflies (T).
2. Students work in groups (3 or 4)
3. Students write question and hypothesis into lab book.
4. Water sample of macroinvertebrates collected from Johnson Creek in a container
given to each group.
5. Group dumps sample into a plastic bin.
6. Use forceps and plastic pipettes to remove macroinvertebrates from the plastic bin
and place them in the sections of an ice cube tray. Place similar looking bugs into
the same section of the ice cube tray.
7. Count total number of macroinvertebrates found in the water sample.
8. Use ID skills learned from intro activity (Day 1) and a provided Freshwater
Macroinvertebrate ID guide to aid in identification of mayflies, caddisflies, and
stoneflies.
9. Count up total number of Mayflies (E), Stoneflies (P), and caddisflies (T) and
write those numbers on the Macroinvertebrate Calculation Johnson Creek Creek
handout.
10. Write down total of all other (non EPT) macroinvertebrates on the calculation
sheet under other.
11. Write down the fraction of total mayflies (E), stoneflies (P), and caddisflies (T) to
total number of macroinvertebrates found in the sample. This is the EPT fraction.
12. Calculate percent from EPT fraction. This is percent EPT.
13. Complete bar chart on Macroinvertebrate Calculation Sheet Johnson Creek
14. Students paste/tape calculation sheet into lab book.
15. Answer question for Day 2 based on Macroinvertebrate Calculation Sheet
Johnson Creek – Write questions and answer into lab book.
Day 3- Cascade Mountain Stream analysis
*If you’re unable to take the class on a field trip, complete day 3 just as day 2 (instructor
collect samples and bring them to the classroom). If you are able to schedule a field trip,
complete the activity as follows:
Question: Is Sixes Creek a polluted or pristine stream?
Hypothesis: If Sixes Creek has more mayflies, stoneflies, and caddisflies than other
macroinvertebrates, then Sixes Creek is a pristine stream.
1. Students work in groups (3 or 4)
2. Students write question and hypothesis into lab book.
3. Groups collect macroinvertebrates from the stream using nets and then dump
macroinvertebrates into a plastic bin for counting.
4. Use forceps and plastic pipettes to remove macroinvertebrates from the plastic bin
and place them in the sections of an ice cube tray. Place similar looking bugs into
the same section of the ice cube tray.
5. Count total number of macroinvertebrates found in the water sample.
6. Use ID skills learned from intro activity (Day 1) and a provided Freshwater
Macroinvertebrate ID guide to aid in identification of mayflies, caddisflies, and
stoneflies.
7. Count up total number of mayflies (E), stoneflies (P), and caddisflies (T) and
write those numbers on the Macroinvertebrate Calculation Sheet Sixes Creek
handout.
8. Write down total of all other (non EPT) macroinvertebrates on the calculation
sheet under other.
9. Write down the fraction of total mayflies (E), stoneflies (P), and caddisflies (T) to
total number of macroinvertebrates found in the sample. This is the EPT fraction.
10. Calculate percent from EPT fraction. This is percent EPT.
11. Complete bar chart on Macroinvertebrate Calculation Sheet Sixes Creek
12. Students paste/tape calculation sheet into lab book.
13. Answer question for Day 3 based on Macroinvertebrate Calculation Sheet Sixes
Creek – Write questions and answer into lab book.
Day 4 – Data analysis
Question: Which stream is more polluted: Johnson Creek or Sixes Creek?
Hypothesis: If Johnson Creek has a higher percent of EPT than Sixes Creek, it is a less
polluted stream.
1. Groups of 3 or 4
2. Use Macroinvertebrate Calculation Sheet from Sixes Creek and Johnson Creek.
3. Create a poster that includes a title, the question to be answered (ie which stream
is more polluted), the hypothesis, a short description of the methods used to
collect and count macroinvertebrates, a bar chart of data (example below), and a
paragraph that answers the question and explains why the hypothesis is correct or
incorrect.
4. Present group findings by hanging the posters on the classroom wall.
5. Have students write question, hypothesis into lab book.
6. Have students draw bar chart from their group in their lab book.
7. Answer Day 4 question in lab book.
0
5
10
15
20
25
30
35
E P T
Macroinvertebrate Group
Johnson Creek
Eagle Creek
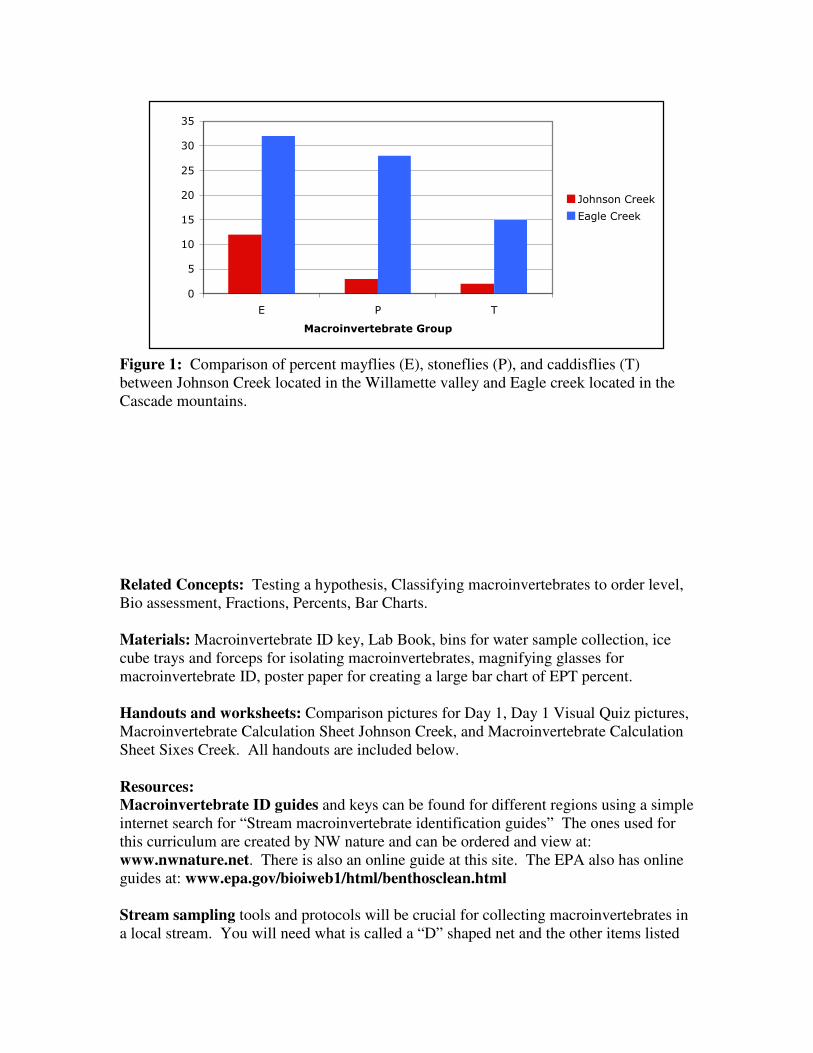
Figure 1: Comparison of percent mayflies (E), stoneflies (P), and caddisflies (T)
between Johnson Creek located in the Willamette valley and Eagle creek located in the
Cascade mountains.
Related Concepts: Testing a hypothesis, Classifying macroinvertebrates to order level,
Bio assessment, Fractions, Percents, Bar Charts.
Materials: Macroinvertebrate ID key, Lab Book, bins for water sample collection, ice
cube trays and forceps for isolating macroinvertebrates, magnifying glasses for
macroinvertebrate ID, poster paper for creating a large bar chart of EPT percent.
Handouts and worksheets: Comparison pictures for Day 1, Day 1 Visual Quiz pictures,
Macroinvertebrate Calculation Sheet Johnson Creek, and Macroinvertebrate Calculation
Sheet Sixes Creek. All handouts are included below.
Resources:
Macroinvertebrate ID guides and keys can be found for different regions using a simple
internet search for “Stream macroinvertebrate identification guides” The ones used for
this curriculum are created by NW nature and can be ordered and view at:
www.nwnature.net. There is also an online guide at this site. The EPA also has online
guides at: www.epa.gov/bioiweb1/html/benthosclean.html
Stream sampling tools and protocols will be crucial for collecting macroinvertebrates in
a local stream. You will need what is called a “D” shaped net and the other items listed
under materials. A You tube search for “Stream Macroinvertebrate sampling protocol”
will bring up some helpful videos and the following links are good too:
http://www.cbr.washington.edu/salmonweb/oregon/Macro.html
http://tinyurl.com/WatershedHealth
http://www.ecy.wa.gov/programs/eap/stsmf/index.html
Assessment Questions:
Day 1: For the Day One quiz: Is each picture a mayfly, caddisfly, or Stonefly
Day 2: What is the fraction and percent of EPT in the activity water sample?
Day 3: What is the fraction and percent of EPT collected from the stream?
Day 4: Which stream is more polluted? Use the data from this activity to explain
your answer.
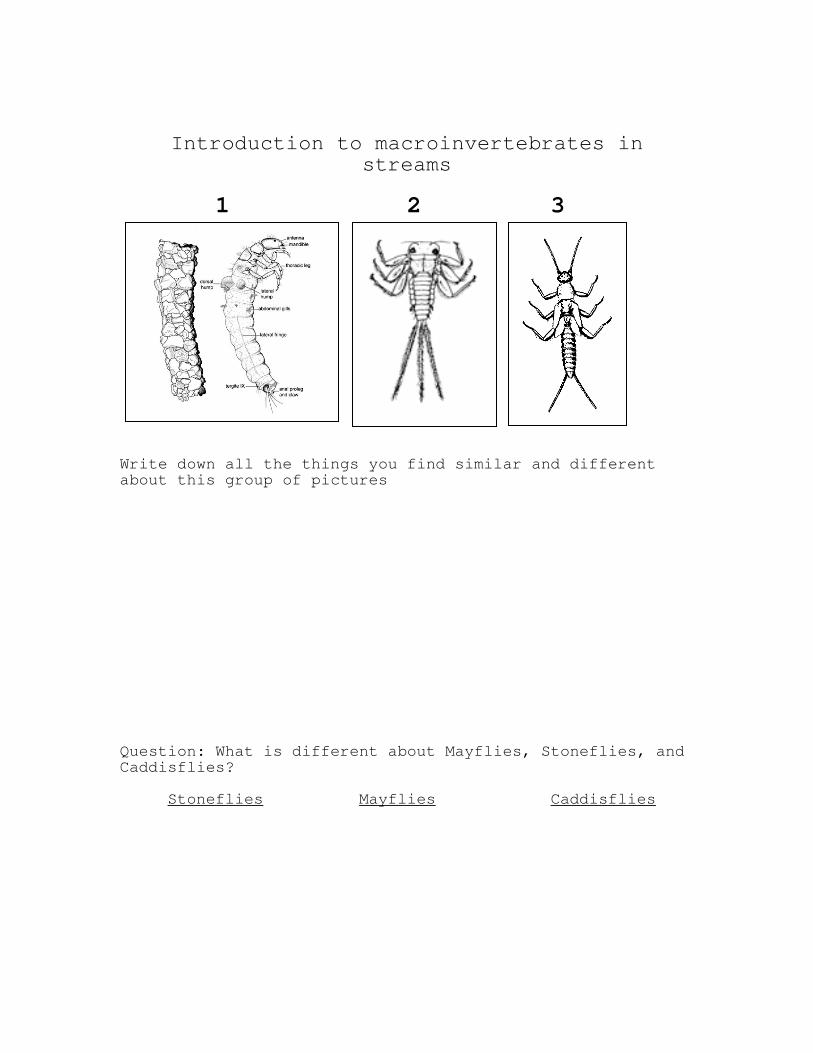
Introduction to macroinvertebrates in streams
1 2 3
Write down all the things you find similar and different about this group of pictures Question: What is different about Mayflies, Stoneflies, and Caddisflies?
Stoneflies Mayflies Caddisflies
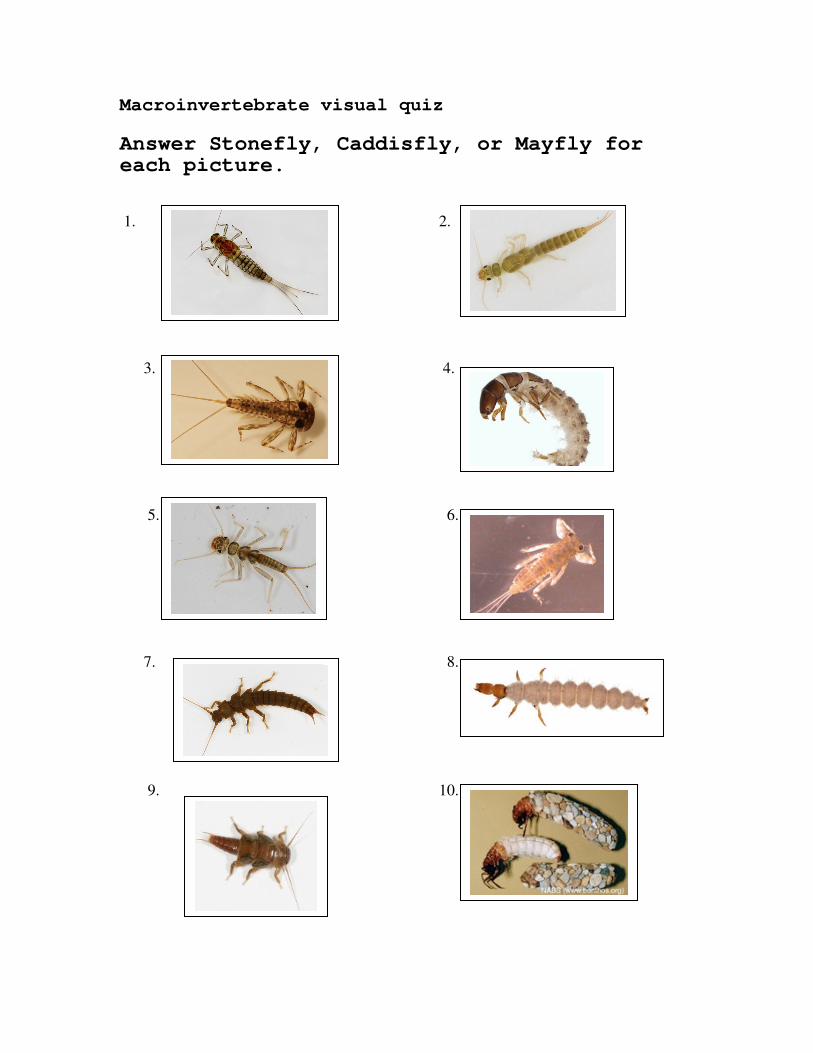
Macroinvertebrate visual quiz
Answer Stonefly, Caddisfly, or Mayfly for each picture.
1. 2.
3. 4.
5. 6.
7. 8.
9. 10.
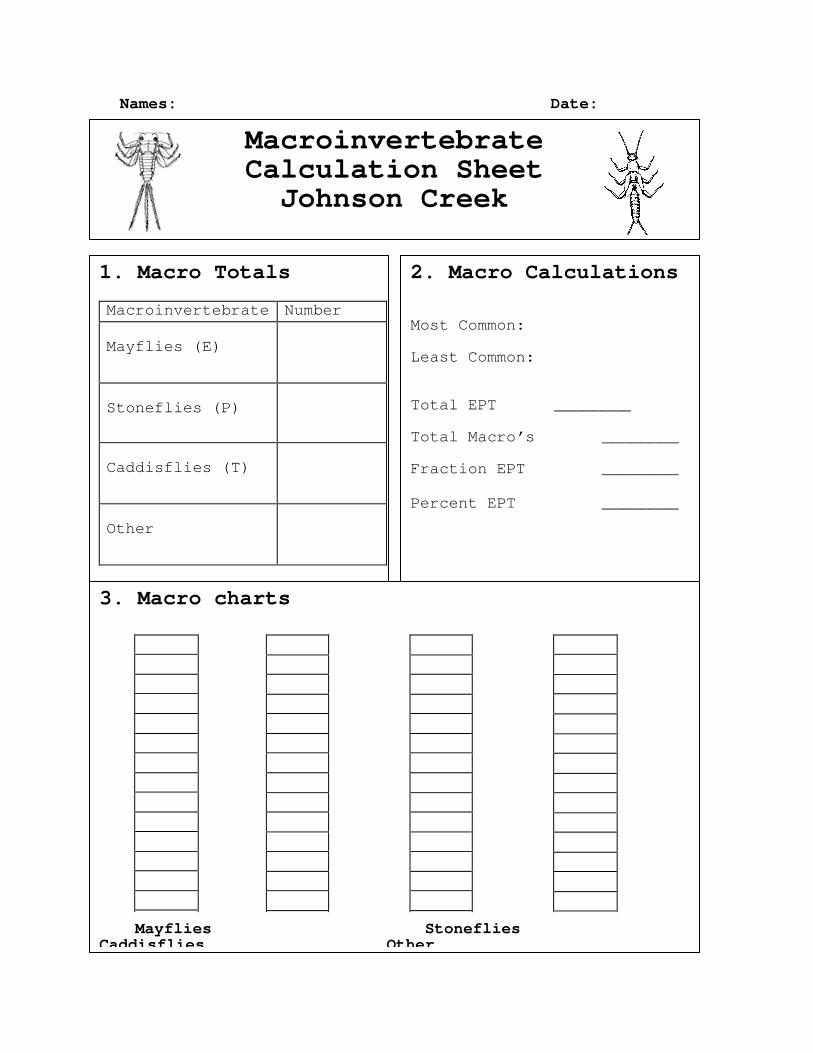
Names: Date:
Macroinvertebrate Calculation Sheet
Johnson Creek
1. Macro Totals Macroinvertebrate Number
Mayflies (E)
Stoneflies (P)
Caddisflies (T)
Other
2. Macro Calculations Most Common: Least Common: Total EPT ________ Total Macro’s ________ Fraction EPT ________
Percent EPT ________
3. Macro charts
Mayflies Stoneflies Caddisflies Other

Names: Date:
Macroinvertebrate Calculation Sheet
Sixes Creek
1. Macro Totals Macroinvertebrate Number
Mayflies (E)
Stoneflies (P)
Caddisflies (T)
Other
2. Macro Calculations Most Common: Least Common: Total EPT ________ Total Macro’s ________ Fraction EPT ________
Percent EPT ________
3. Macro charts
Mayflies Stoneflies Caddisflies Other