Embed Size (px)
Citation preview

CASCADES INC.2016 Industrial & Construction Conference
May 11, 2016

DISCLAIMER
2
Certain statements in this presentation, including statements regarding future results and performance, are forward-lookingstatements within the meaning of securities legislation based on current expectations. The accuracy of such statements issubject to a number of risks, uncertainties and assumptions that may cause actual results to differ materially from thoseprojected, including, but not limited to, the effect of general economic conditions, decreases in demand for Cascades Inc.’s(“Cascades,” “CAS,” the “Company,” the “Corporation,” “us” or “we”) products, the prices and availability of raw materials,changes in the relative values of certain currencies, fluctuations in selling prices and adverse changes in general market andindustry conditions. This presentation may also include price indices as well as variance and sensitivity analyses that areintended to provide the reader with a better understanding of the trends related to our business activities. These items are basedon the best estimates available to the Company.
The financial information included in this presentation also contains certain data that are not measures of performance underIFRS (“non-IFRS measures”). For example, the Company uses operating income before depreciation and amortization (“OIBD”which, for purposes of this presentation, we call “EBITDA”) and operating income before depreciation and amortization(excluding specific items) (“OIBD (excluding specific items)” which, for purposes of this presentation, we call “EBITDA (excludingspecific items)”) because such measures are used by management to assess the operating and financial performance of theCompany’s operating segments. Such information is reconciled to the most directly comparable financial measures, as set forthin the “Supplemental Information on Non-IFRS Measures” section of our most recent quarterly report or annual report.
Specific items are defined as items such as charges for or reversal of impairment of assets, for facility or machine closures,accelerated depreciation of assets due to restructuring measures, premiums paid on long-term debt refinancing, loss onrefinancing of long-term debt, gains or losses on sales of business units, unrealized gains or losses on derivative financialinstruments that do not qualify for hedge accounting, unrealized gains or losses on interest rate swaps, foreign exchange gainsor losses on long-term debt, other significant items of an unusual or non-recurring nature, and all such items included indiscontinued operations or in the share of results of our associates and joint ventures.
All amounts in this presentation are in Canadian dollars unless otherwise indicated.

33%
32%
20%
15%
Containerboard
Tissue Papers
Boxboard Europe
Specialty Products
Segment Sales Breakdown1
COMPANY OVERVIEW
3
• Founded in 1964 by the Lemaire family and
headquartered in Kingsey Falls, QC
• Produces, converts and markets packaging and
tissue products principally composed of recycled
fibre
• Balanced play in less cyclical sectors
• Heavy exposure to two of the strongest paper
segments: Tissue and Containerboard
• Market leader across many of its primary
product offerings
• Unique culture – green visionaries, turnarounds,
entrepreneurial philosophy
• ~11,000 employees worldwide
1 Before inter-segment sales and corporate activities2 EBITDA excluding specific items
LTM 3/31/16 Net Sales $3,954 million
47%
27%
13%
13%
Containerboard
Tissue Papers
Boxboard Europe
Specialty Products
Segment EBITDA Breakdown1, 2
LTM 3/31/16 EBITDA $447 million
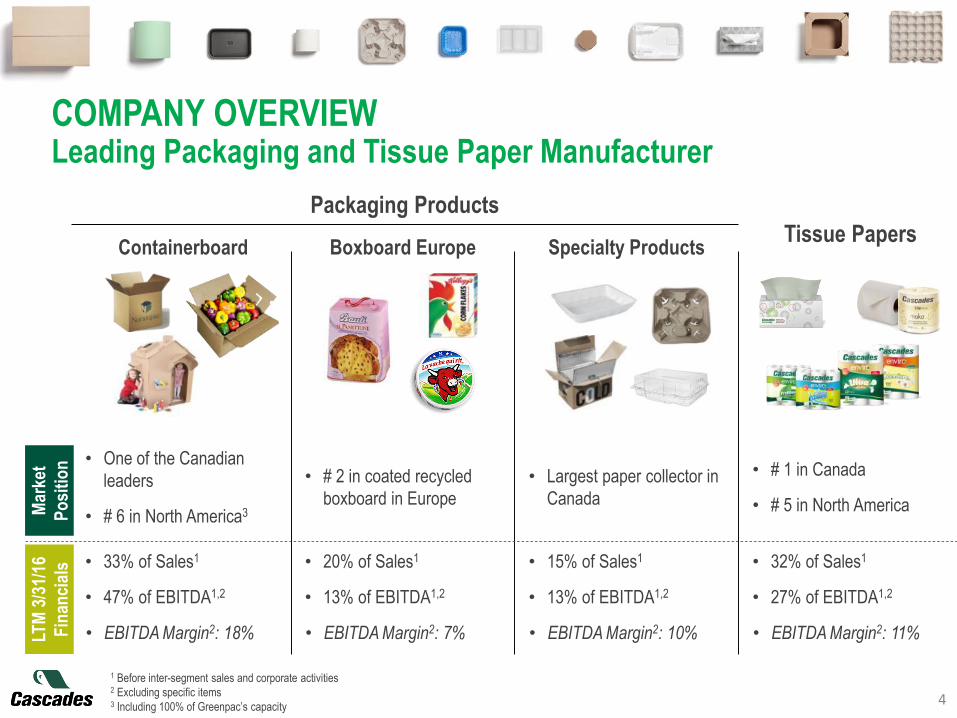
COMPANY OVERVIEWLeading Packaging and Tissue Paper Manufacturer
4
Packaging Products
ContainerboardTissue Papers
Boxboard Europe Specialty Products
Mar
ket
Po
siti
on • One of the Canadian
leaders
• # 6 in North America3
• # 2 in coated recycled
boxboard in Europe
• Largest paper collector in
Canada
• # 1 in Canada
• # 5 in North America
LTM
3/3
1/16
Fin
anci
als • 33% of Sales1
• 47% of EBITDA1,2
• EBITDA Margin2: 18%
• 20% of Sales1
• 13% of EBITDA1,2
• EBITDA Margin2: 7%
• 15% of Sales1
• 13% of EBITDA1,2
• EBITDA Margin2: 10%
• 32% of Sales1
• 27% of EBITDA1,2
• EBITDA Margin2: 11%
1 Before inter-segment sales and corporate activities2 Excluding specific items3 Including 100% of Greenpac’s capacity
5
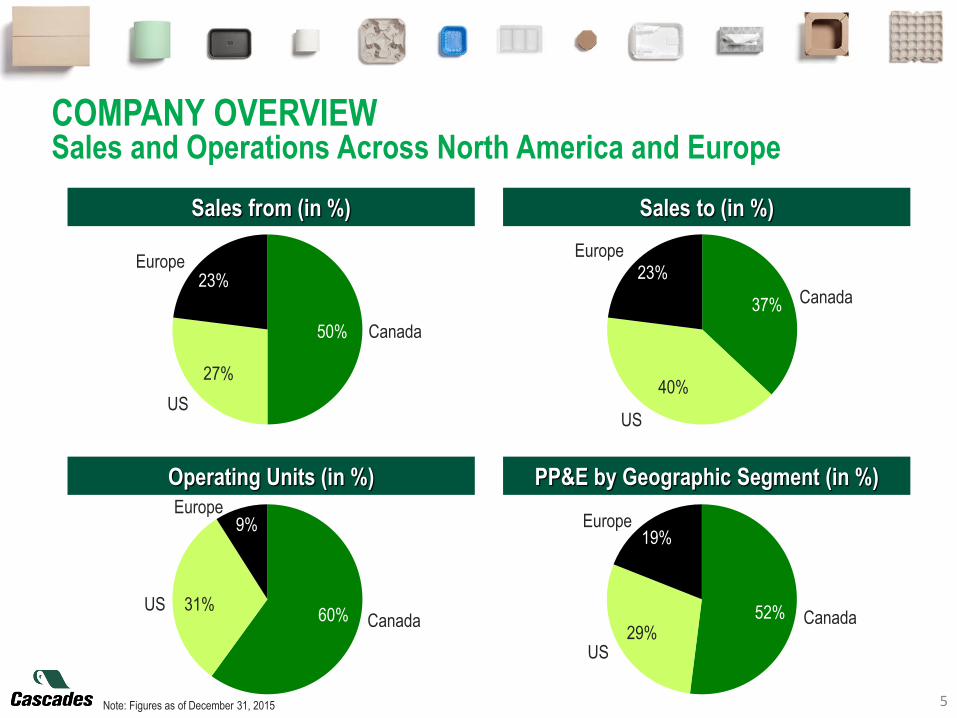
23%Europe
Canada50%
US
27%
23%
Europe
Canada37%
US
40%
9%Europe
Canada60%US 31%
19%Europe
Canada52%
US29%
Sales from (in %) Sales to (in %)
Operating Units (in %) PP&E by Geographic Segment (in %)
Note: Figures as of December 31, 2015
COMPANY OVERVIEWSales and Operations Across North America and Europe

6
GEOGRAPHICALLY DIVERSIFIED

COMPANY OVERVIEWClosed-loop Business Model
7
Upstream and downstream integration in North America
80% recycled fibre (2.6M tons)
NA integration rate (2015):
28% (0.44M tons)
NA integration rate (2015)
•Containerboard1 64%
•Tissue Papers 67%
CLIENTS
1 Integration rate for our containerboard activities in North America (considering 100% of Greenpac’s production as internal capacity)2 Including Reno De Medici’s units and Greenpac. Also including four manufacturing/converting tissue papers units which are counted in both Converting and Manufacturing.
Recovery
• 19 units
Manufacturing2
• Containerboard 6 units
• Boxboard Europe: 6 units
• Specialty Products: 3 units
• Tissue Papers: 11 units
26 units
Converting2
• Containerboard: 18 units
• Specialty Products: 17 units
• Tissue Papers: 13 units
48 units
Finished Products• Trims and rejects sent to
recycling centers

0
1
2
3
4
5
6
Contractual Agreements
23%
Regular and Steady Volume
(Noncontractual)27%
Recovery & Internal
25%
Spot25%
RAW MATERIALSReliable Sourcing Strategy
8
20151
Most of the fibre
supply coming
from internal
sources, contracts
and regular
streams
Top Recovered Paper Suppliers in the WorldCascades’ North American Recycled Fibre Supply
Our Strategy
• Constant review of our inventory strategy
• Ensure control over fibre supply with potential to
increase tons under control
• Develop substitute grades
(M Tonnes)
Source: RISI
• Continue to increase integration rate with CAS’ other
segments
• Potential to increase virgin content in certain
circumstances
• Continue to close the loop with customers & retailers
1 Including volume treated for Greenpac

285
342 340
426447
6.0%
8.0%
10.0%
12.0%
14.0%
16.0%
18.0%
200
250
300
350
400
450
500
2012 2013 2014 2015 LTM 3/31/16
3,141
3,370
3,561
3,861 3,954
2,750
3,000
3,250
3,500
3,750
4,000
4,250
2012 2013 2014 2015 LTM 3/31/16
OPERATING PERFORMANCE AND FINANCIAL SITUATIONStrong Financial Momentum
9
Sales EBITDA (excl. specific items)
(M CAN$) (M CAN$)
Improved results reflect improved productivity, FX and stable raw material & energy costs

138 133
96
119
138
0%
20%
40%
60%
80%
100%
25
50
75
100
125
150
2012 2013 2014 2015 LTM 3/31/16
37 41 40
58 62
0%
20%
40%
60%
80%
100%
0
20
40
60
80
100
2012 2013 2014 2015 LTM 3/31/16
43
5772
63 62
0%
20%
40%
60%
80%
100%
0
20
40
60
80
100
2012 2013 2014 2015 LTM 3/31/16
90
150 164
231 234
0%
20%
40%
60%
80%
100%
50
100
150
200
250
300
2012 2013 2014 2015 LTM 3/31/16
OPERATING PERFORMANCE AND FINANCIAL SITUATIONHistorical Segmented EBITDA
10
Containerboard Boxboard Europe
Specialty Products Tissue Papers
(M CAN$) (M CAN$)
Green line represents segment EBITDA as percent of total Company EBITDA; EBITDA excluding specific items
(M CAN$) (M CAN$)

(0.28)
0.78
0.86
1.58 1.60
(0.50)
0.00
0.50
1.00
1.50
2.00
2012 2013 2014 2015 LTM 3/31/16
155
233
277
337 358
0
100
200
300
400
2012 2013 2014 2015 LTM 3/31/16
1 Excluding specific items2 Excluding increase in investments 11
Objective of ~$100M of free cash flow annually directed toward debt reduction
OPERATING PERFORMANCE AND FINANCIAL SITUATIONCash Flow and Free Cash Flow per Share
Free Cash Flow per Share1,2Cash Flow From Operating Activities1
• Cash flows have grown at a 29% CAGR
since 2012
• Improving cash flows driven by Strategic
Action Plan
(M CAN$) (CAN$)

184
161
184
173
185
100
150
200
2012 2013 2014 2015 2016B
OPERATING PERFORMANCE AND FINANCIAL SITUATIONCapital Expenditures
12
Capital Expenditures
• Divestitures and free cash flow have
funded capital expenditures
(M CAN$)
• 2016 level to be slightly higher at ~$185M,
including IT
• Mainly growth Capex
• Mostly towards US
Capex Distribution for
FY2015 – $173M
Specialty
Products
Containerboard
37%
Tissue
Papers
33%
13%
8%
9%
Corporate
Boxboard
Europe

OPERATING PERFORMANCE AND FINANCIAL SITUATIONDebt Maturities
13
Refinancings in 2014 and 2015 resulting in +US$20 million interest savings
• Over last 24 months, $1 billion+ of
senior notes refinanced
• Extended maturities to 2021,
2022 and 2023
• $750 million revolving facility
extended to 2019
• Average interest rate down 112 bps
to 4.93% in 2015 from 6.05% in 2013
• Resulted in interest savings of
~$23 million annually
33132
282 250
714
325
0
250
500
750
1,000
1 year > 1 year 2019 2021 2022 2023
Debts without recourse Subsidiaries debtsRevolver Senior notes
Debt Repayment as at March 31, 2016
14
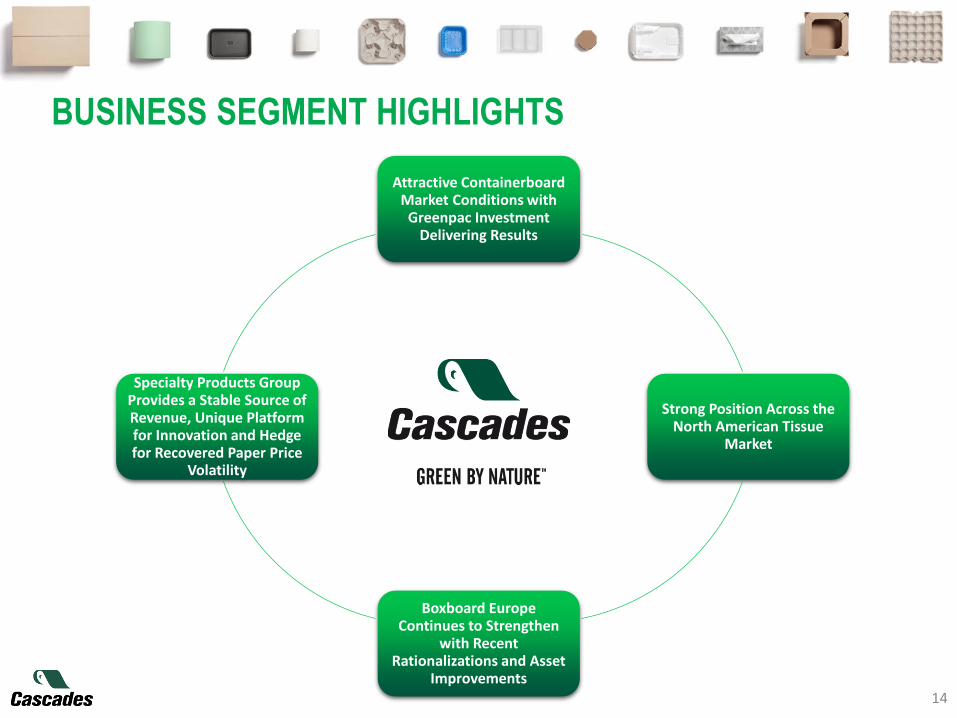
BUSINESS SEGMENT HIGHLIGHTS
Attractive Containerboard Market Conditions with
Greenpac Investment Delivering Results
Strong Position Across the North American Tissue
Market
Boxboard Europe Continues to Strengthen
with Recent Rationalizations and Asset
Improvements
Specialty Products Group Provides a Stable Source of Revenue, Unique Platform for Innovation and Hedge for Recovered Paper Price
Volatility

60%
70%
80%
90%
100%
Q12009
Q12010
Q12011
Q12012
Q12013
Q12014
Q12015
Q12016
North American Containerboard Producers
40.0
36.0
38.0
42.0
44.0
1.0
2014
39.9
0.7
New
capacity
0.942.2
New
capacity
2018e
43.1
New
capacity
2017e
0.640.9
New
capacity
2016e
41.5
2015e
CONTAINERBOARDEnvironment Still Sound
15
Fundamentals Sound Despite Added Capacity
Operating Rates and Expected Capacity
(Million s.t.)
% of total capacity
IP 33%
WestRock 19%
GP 10%
PCA 10%
Kapstone 4%
Cascades 4%
Pratt 4%
Others 16%
Top-5 Producers 76%
2015 Industry Participants
Source: RISI, Deutsche Bank, Company reports and estimates1 Including 59.7% of Greenpac’s total capacity
2 SP Fiber
PCA D3 Yr 2
Pratt Yr 1
Greif Yr 1
IP Valliant Yr 1
Corr. Supplies
Productivity 1%
Pratt Yr 2
Greif Yr 2
IP Valliant Yr 2
SP Fiber Yr 2
Corr. Supplies
Productivity 1%
1
(Operating rate)
Kruger Yr 1
Corr. Sup. Yr 1
Productivity 1%
Kruger Yr 1
Corr. Sup. Yr 1
Productivity 1%
(+2.5%) (+1.5%) (+1.7%) (+2.1%)
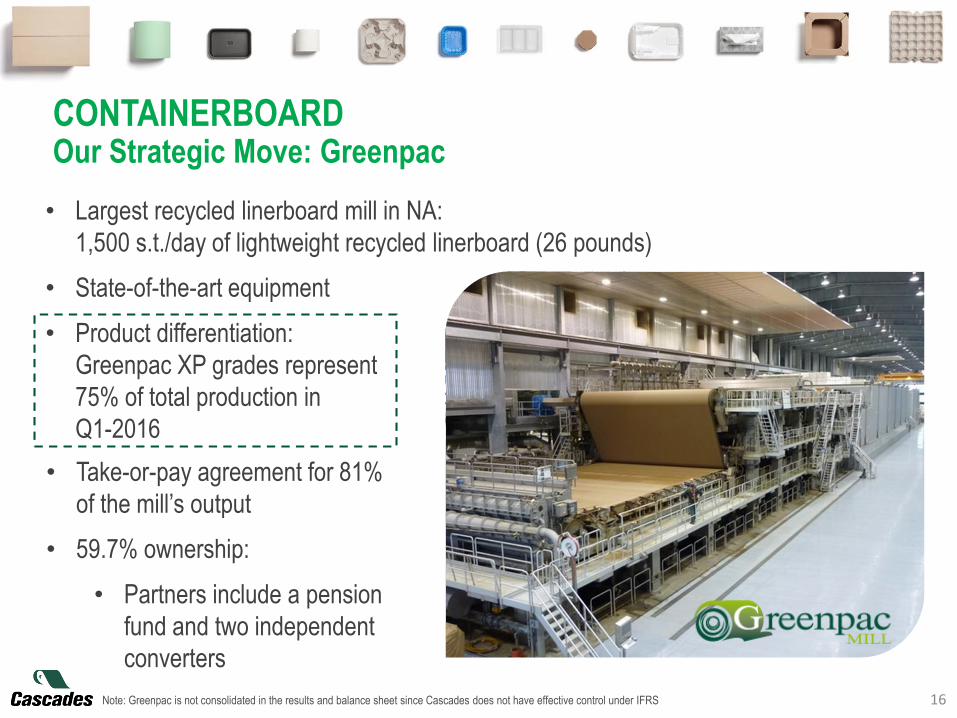
CONTAINERBOARDOur Strategic Move: Greenpac
16Note: Greenpac is not consolidated in the results and balance sheet since Cascades does not have effective control under IFRS
• Largest recycled linerboard mill in NA:
1,500 s.t./day of lightweight recycled linerboard (26 pounds)
• State-of-the-art equipment
• Product differentiation:
Greenpac XP grades represent
75% of total production in
Q1-2016
• Take-or-pay agreement for 81%
of the mill’s output
• 59.7% ownership:
• Partners include a pension
fund and two independent
converters
6% 7% 9% 8% 7%
3340
4845 43
0
10
20
30
40
50
2012 2013 2014 2015 LTMQ1-2016
(M€)
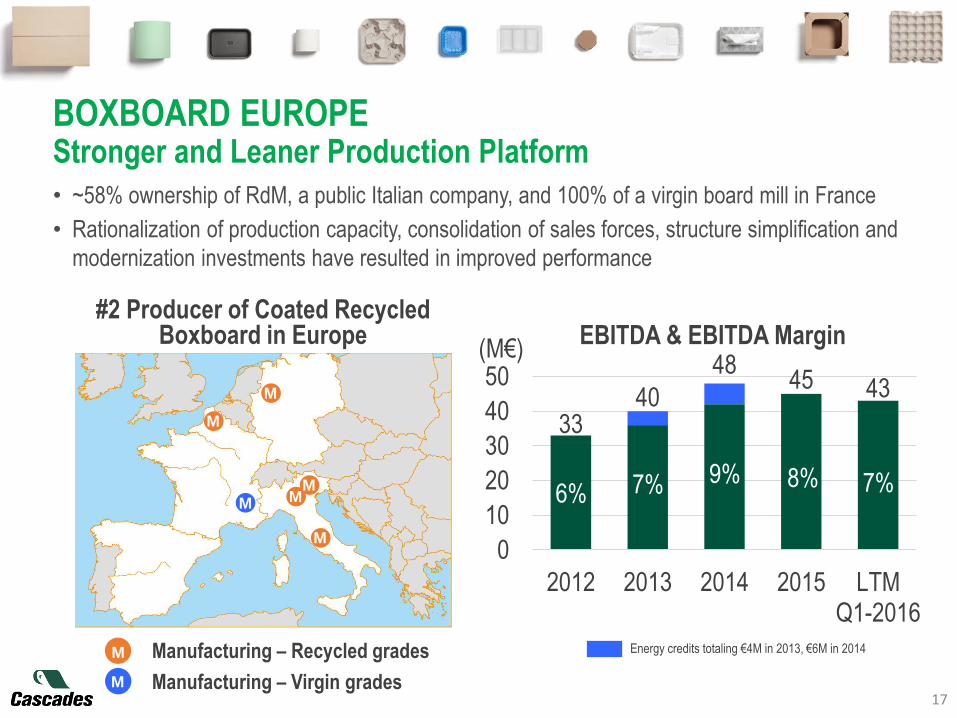
BOXBOARD EUROPEStronger and Leaner Production Platform
17
• ~58% ownership of RdM, a public Italian company, and 100% of a virgin board mill in France
• Rationalization of production capacity, consolidation of sales forces, structure simplification and
modernization investments have resulted in improved performance
M
Manufacturing – Recycled grades
Manufacturing – Virgin grades
M
M MM
M
M
M
#2 Producer of Coated Recycled Boxboard in Europe EBITDA & EBITDA Margin
Energy credits totaling €4M in 2013, €6M in 2014

SPECIALTY PRODUCTS GROUPStable Source of Revenue and Unique Platform for Innovation
18
• Largest recycled paper collector in
Canada
• 19 units
• Largest producer of honeycomb in
Canada
• 6 units
• Leading producer of papermill packaging
• 12 units
• JV Share of EBITDA $10-$15M
• Diversified product offerings and stable revenue stream with leading market positions
• Recent initiatives have included
• Cascades Recovery minority (27%) acquisition completed in December 2015
• Restructuring and minority acquisition of Norcan
Recycling and Recovery (~30% of sales1)
Consumer Packaging Products (~20% of sales1)Industrial Packaging Products (~45% of sales1)
• 2 units
• Vinyl backing
• Deinked pulp
Other Products (~5% of sales1)
1 Including 100% of joint ventures

9,230 9,390 9,570 9,818 10,382160 180 248 564
0
2,500
5,000
7,500
10,000
12,500
2009 Newcapacity
2011 Newcapacity
2013 Newcapacity
2015 Newcapacity
2017e
Branded56%
Private Label44%
At-Home44%
Away-from-Home39%
Parent Rolls17%
Branded11%
Private Label89%
TISSUE PAPERSStong Position Across the North American Tissue Market
19Source: RISI
Sales by Geography (2015)
Sales by End Markets (2015)
Tissue Market Demand
North American Tissue Capacity Additions
80
100
120
140
160
1996 2000 2004 2008 2012 2016E
Ind
exe
d U
.S. T
issu
e
Dem
an
d
(M s.t.)
At-Home58%
At-Home51%
Away-from-Home42%
Away-from-Home49%
Canada (25%) US (75%)
(+1.7%) (+1.9%) (+2.6%) (+5.7%)

TISSUE PAPERSExtended Geographical Reach
20
2015 NORTH AMERICAN TISSUE MANUFACTURERS
Capacity
('000 s.t.)
Market
Share
Capacity
Retail
Capacity
AfH
1 Georgia-Pacific 2,849 29% 67% 33%
2 Procter & Gamble 1,494 15% 100% 0%
3 Kimberly-Clark 1,466 15% 67% 33%
4 SCA Tissue NA 772 8% 0% 100%
5 Cascades Tissue 657 7% 62% 38%
6 Clearwater Paper 435 4% 90% 10%
7 KP Tissue 399 4% 77% 23%
8 First Quality Tissue 290 3% 100% 0%
9 Irving Tissue 282 3% 100% 0%
10 Soundview Paper 161 2% 67% 33%
Others 1,012 10%
TOTAL 9,818 100%
Source: RISI, Company reports and estimates

POTENTIAL BENEFITS STEMMING FROM OUR INITIATIVES
21
Other sources of growth and incremental value• Culture of innovation
• Good performance from European platform and hidden value of Boralex investment
• On-going initiatives to improve our business processes
Modernizing our operating platform to increase profitability• $185M capex program in 2016
• Divestitures and closures of under-performing units
• Containerboard: sound fundamentals and improved platform
• Modernized converting platform and manufacturing productivity improvement
• Greenpac to positively contribute to EPS for a second full year in 2016
• Tissue Papers: strong and growing position in North America
• Increasing presence in the US with recent expansion initiatives
Potential tailwinds• CAD$ weakness
• More stable economic reality in Canada, the US and Europe
• China’s economic weakness and favourable impact on recovered paper prices
• Lower oil and gas costs
Taking the right steps to position Cascades for the future

22
For more information:www.cascades.com/investors
Jennifer Aitken, MBA
Director, Investor Relations
514-282-2697 or [email protected]