Embed Size (px)
Citation preview
Cascade amplifying synergistic effects of
chemo-photodynamic therapy using
ROS-responsive polymeric nanocarriers
Chun-Yang Sun1, ‖, Ziyang Cao2, ‖, Xue-Jun Zhang3, Rong Sun4, Chun-Shui Yu1,*, and
Xianzhu Yang2,*
1 Department of Radiology and Tianjin Key Laboratory of Functional Imaging,
Tianjin Medical University General Hospital, Tianjin 300052, P.R. China
2 Institutes for Life Sciences, School of Medicine and National Engineering Research
Center for Tissue Restoration and Reconstruction, South China University of
Technology, Guangzhou, Guandong 510006, P. R. China
3 School of Medical Imaging, Tianjin Medical University, Tianjin 300203, P.R. China
4 School of Biological and Chemical Engineering, Zhejiang University of Science &
Technology, Hangzhou, Zhejiang 310023, P. R. China
‖ These authors contributed equally.
E-mail: [email protected] (C. S. Yu), [email protected] (X. Z. Yang)
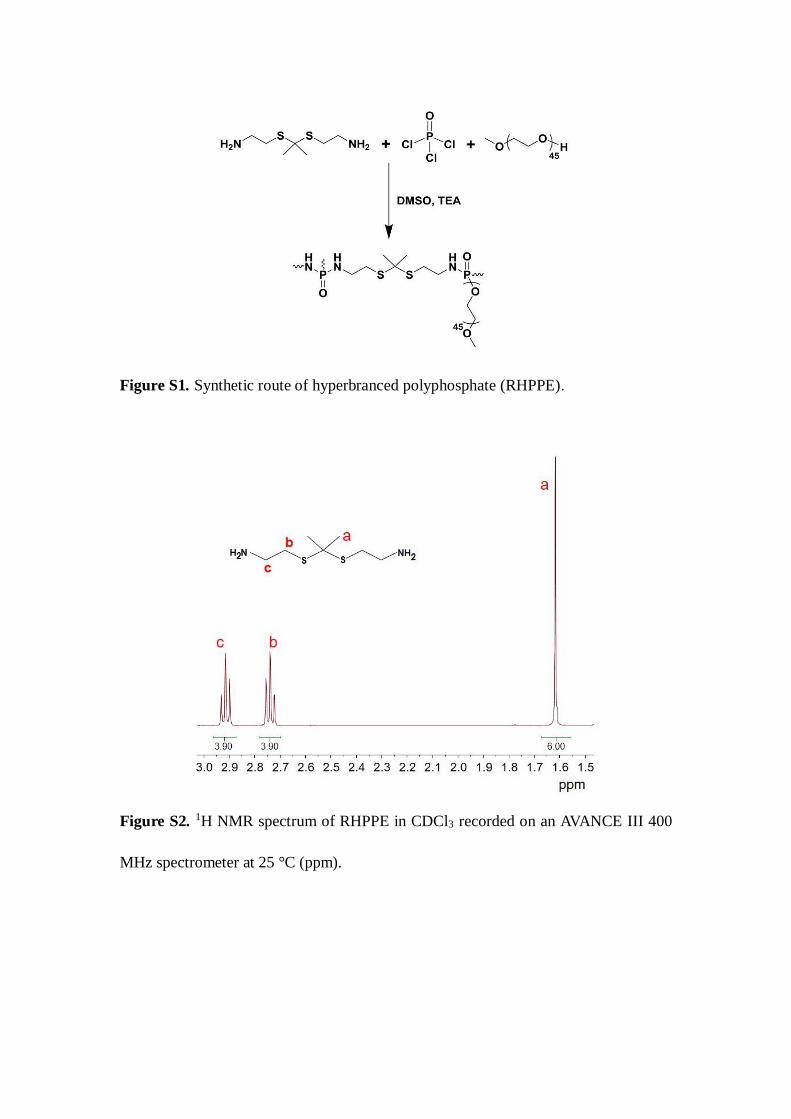
Figure S1. Synthetic route of hyperbranced polyphosphate (RHPPE).
Figure S2. 1H NMR spectrum of RHPPE in CDCl3 recorded on an AVANCE III 400
MHz spectrometer at 25 °C (ppm).
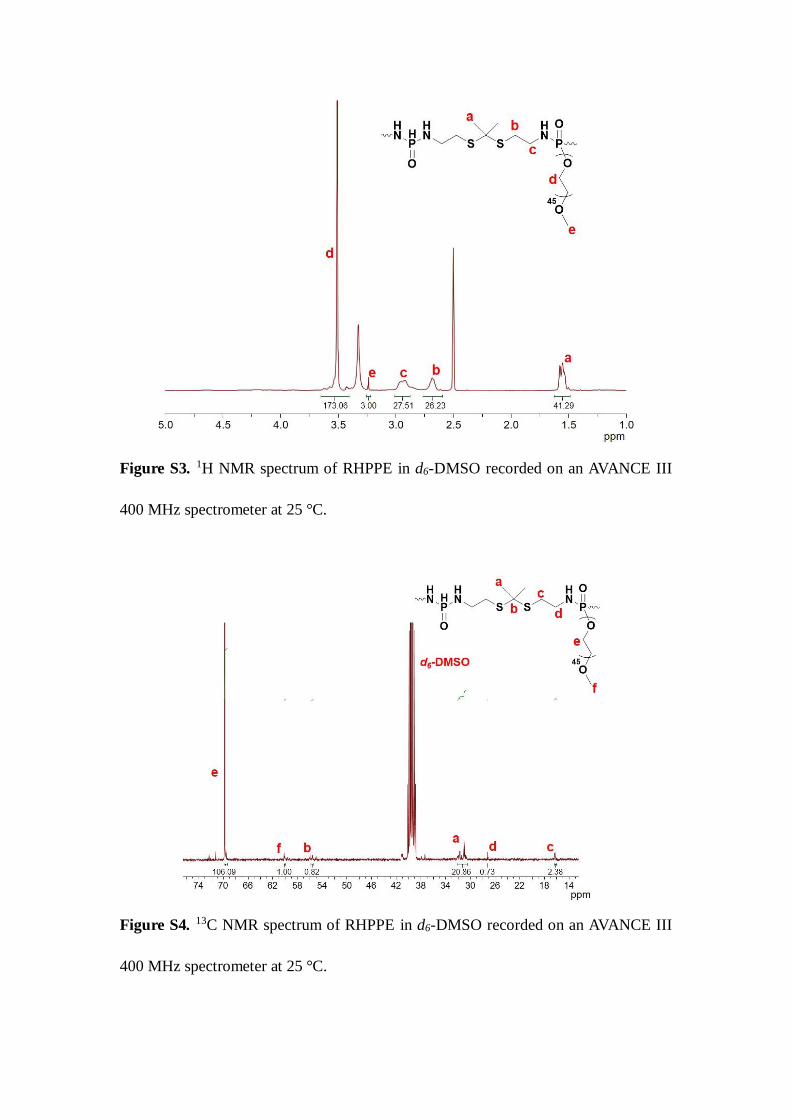
Figure S3. 1H NMR spectrum of RHPPE in d6-DMSO recorded on an AVANCE III
400 MHz spectrometer at 25 °C.
Figure S4. 13C NMR spectrum of RHPPE in d6-DMSO recorded on an AVANCE III
400 MHz spectrometer at 25 °C.
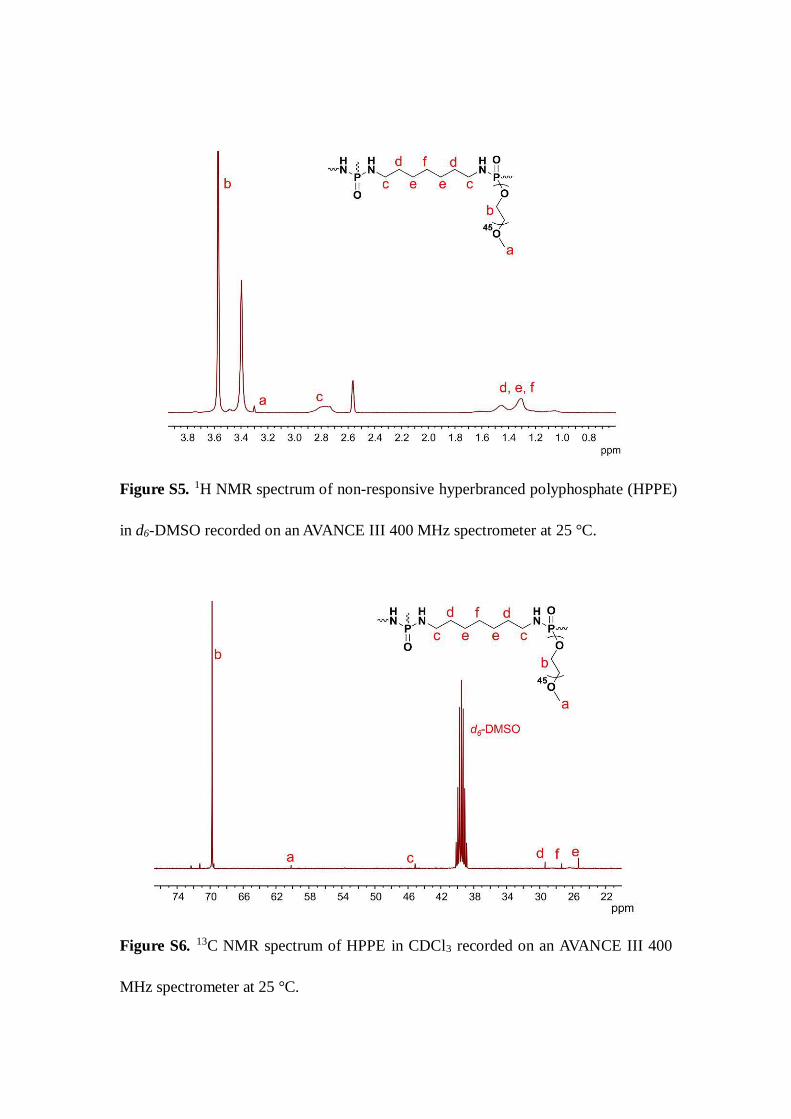
Figure S5. 1H NMR spectrum of non-responsive hyperbranced polyphosphate (HPPE)
in d6-DMSO recorded on an AVANCE III 400 MHz spectrometer at 25 °C.
Figure S6. 13C NMR spectrum of HPPE in CDCl3 recorded on an AVANCE III 400
MHz spectrometer at 25 °C.

Figure S7. Diameter changes of SOHNP or HNP as a function of incubation time in
PB buffer (pH 7.4).
Figure S8. Emission spectra of free DOX, SOHNPCe6/DOX or HNPCe6/DOX in aqueous
solution (Ex=460 nm).
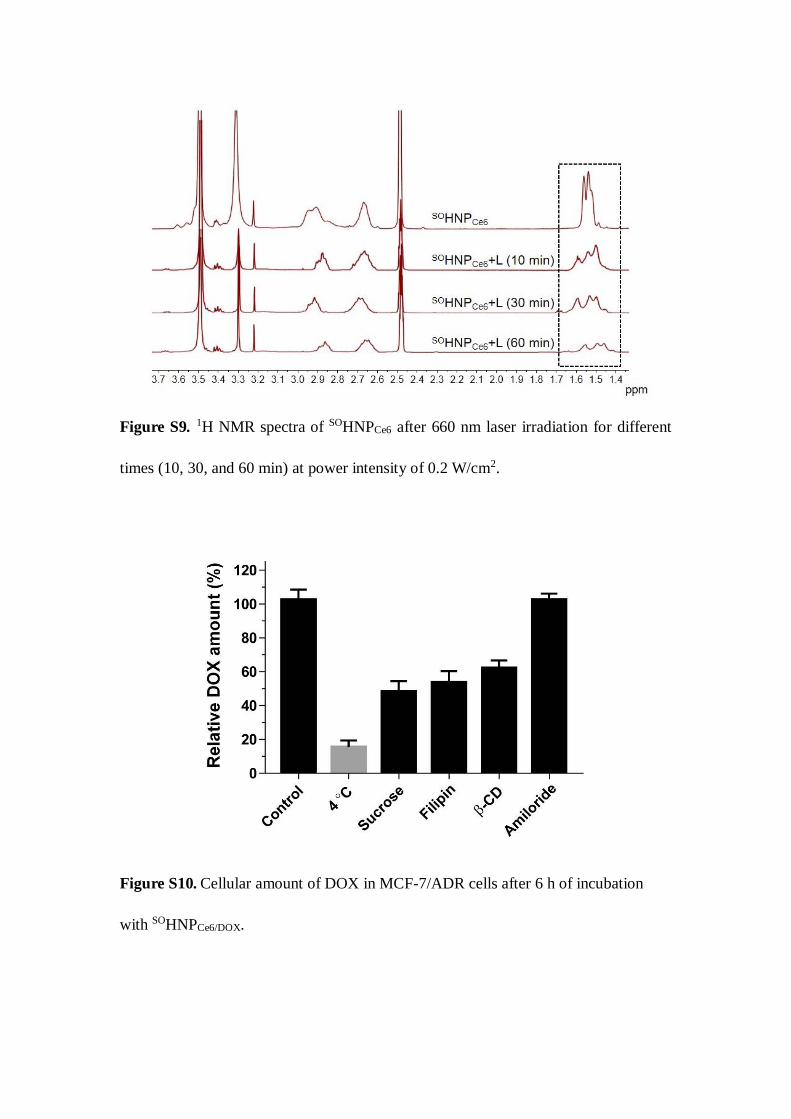
Figure S9. 1H NMR spectra of SOHNPCe6 after 660 nm laser irradiation for different
times (10, 30, and 60 min) at power intensity of 0.2 W/cm2.
Figure S10. Cellular amount of DOX in MCF-7/ADR cells after 6 h of incubation
with SOHNPCe6/DOX.
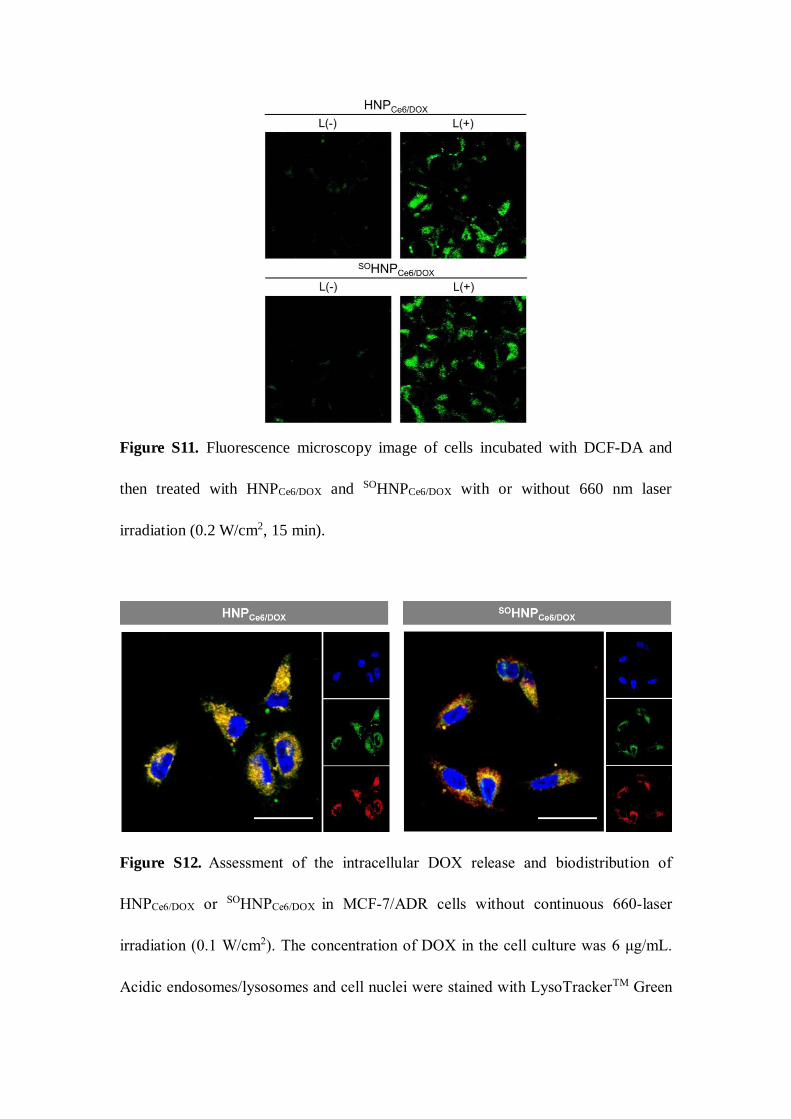
Figure S11. Fluorescence microscopy image of cells incubated with DCF-DA and
then treated with HNPCe6/DOX and SOHNPCe6/DOX with or without 660 nm laser
irradiation (0.2 W/cm2, 15 min).
Figure S12. Assessment of the intracellular DOX release and biodistribution of
HNPCe6/DOX or SOHNPCe6/DOX in MCF-7/ADR cells without continuous 660-laser
irradiation (0.1 W/cm2). The concentration of DOX in the cell culture was 6 μg/mL.
Acidic endosomes/lysosomes and cell nuclei were stained with LysoTrackerTM Green
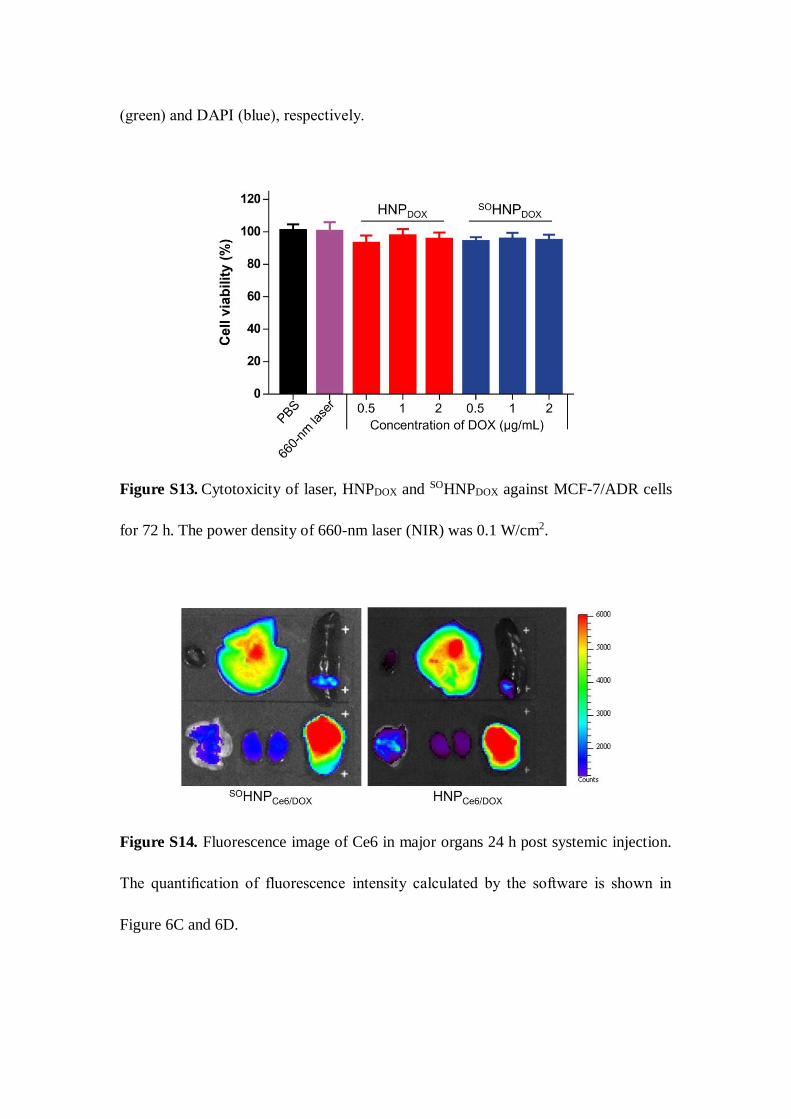
(green) and DAPI (blue), respectively.
Figure S13. Cytotoxicity of laser, HNPDOX and SOHNPDOX against MCF-7/ADR cells
for 72 h. The power density of 660-nm laser (NIR) was 0.1 W/cm2.
Figure S14. Fluorescence image of Ce6 in major organs 24 h post systemic injection.
The quantification of fluorescence intensity calculated by the software is shown in
Figure 6C and 6D.
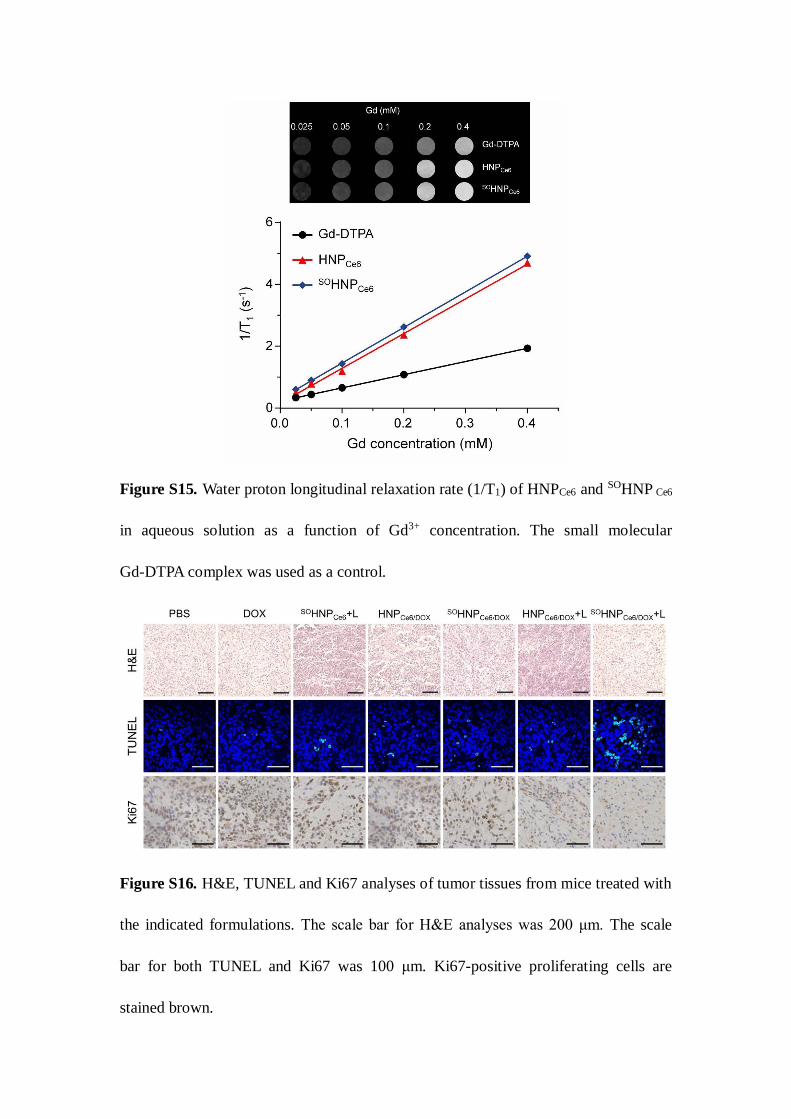
Figure S15. Water proton longitudinal relaxation rate (1/T1) of HNPCe6 and SOHNP Ce6
in aqueous solution as a function of Gd3+ concentration. The small molecular
Gd-DTPA complex was used as a control.
Figure S16. H&E, TUNEL and Ki67 analyses of tumor tissues from mice treated with
the indicated formulations. The scale bar for H&E analyses was 200 μm. The scale
bar for both TUNEL and Ki67 was 100 μm. Ki67-positive proliferating cells are
stained brown.
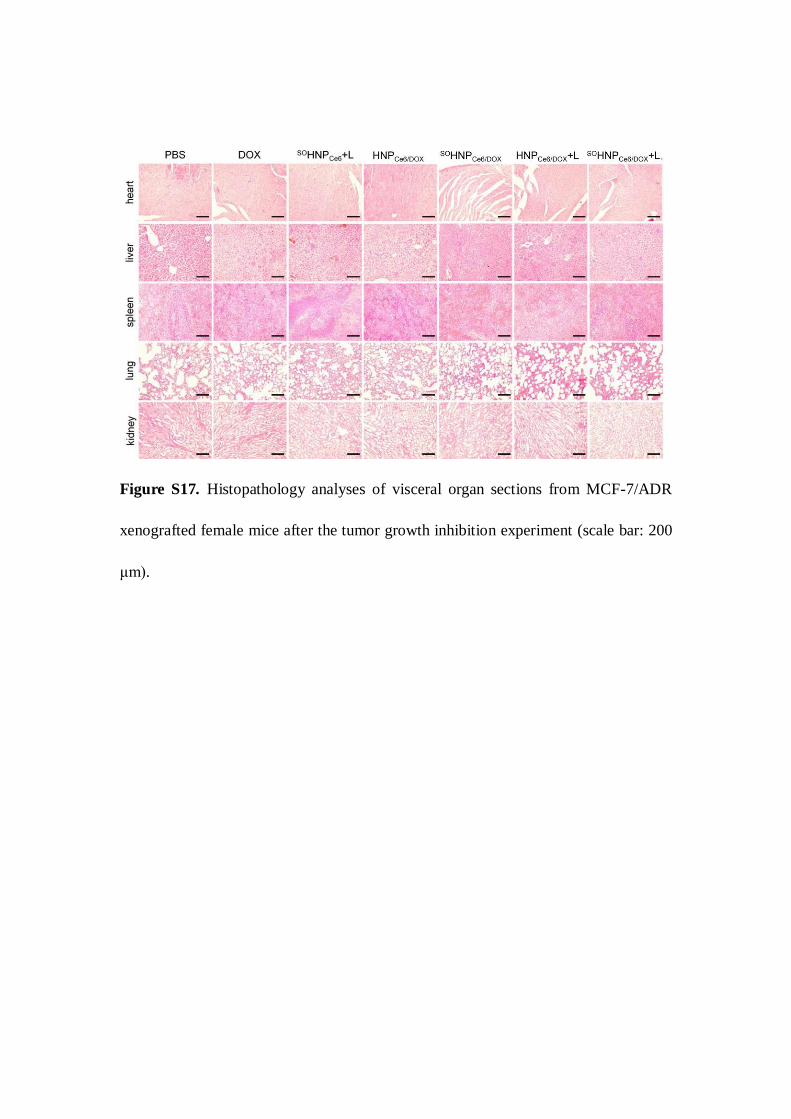
Figure S17. Histopathology analyses of visceral organ sections from MCF-7/ADR
xenografted female mice after the tumor growth inhibition experiment (scale bar: 200
μm).
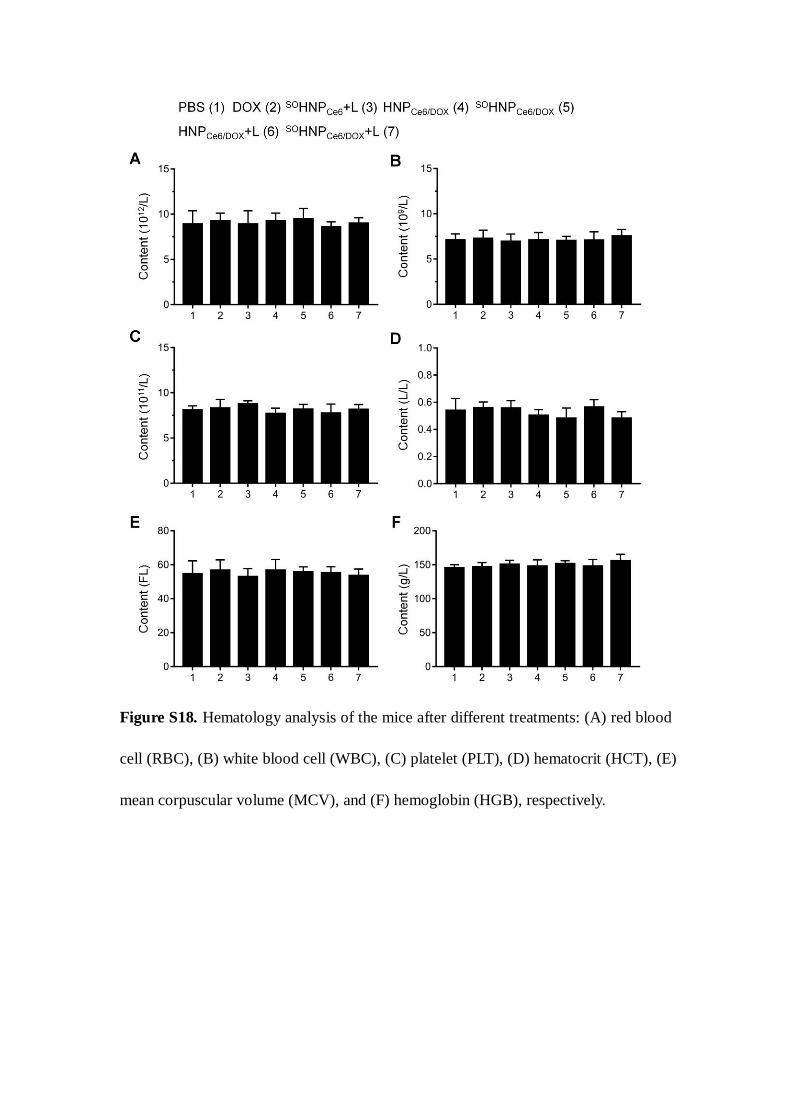
Figure S18. Hematology analysis of the mice after different treatments: (A) red blood
cell (RBC), (B) white blood cell (WBC), (C) platelet (PLT), (D) hematocrit (HCT), (E)
mean corpuscular volume (MCV), and (F) hemoglobin (HGB), respectively.

Table S1. Drug loading content (DLC) and encapsulation efficiency (EE) of Ce6 and
DOX for SOHNP and HNP.
Parameter DLC (%) EE (%)
Ce6 DOX Ce6 DOX
HNPCe6/DOX 3.51 3.27 35.1 32.7
SOHNPCe6/DOX 3.39 3.13 33.9 31.3
Table S2. Pharmacokinetic parameters of these formulations after intravenous
administration.
Parameter AUC0-48h (μg/L*h) t1/2z (h) Cmax (μg/L) CI
DOX 64.70 18.46 14.15 21.53
HNPCe6/DOX 810.79 26.47 124.77 1.64
SOHNPCe6/DOX 728.83 27.74 140.84 2.82
AUC, area under curve; t1/2z, elimination half-life; Cmax, peak concentration; CI, clear
rate.