Embed Size (px)
DESCRIPTION
May 7, 2007. CAS Seminar on Reinsurance 2007 Hidden Risks in (Re)Insurance Systemic Risks and Accumulation:. Spencer M. Gluck, FCAS New York. Outline. Section 1: Systemic Risks and Accumulation A: Introduction - Model Structure B: Systemic Risks C: Accumulation Section 2: Examples - PowerPoint PPT Presentation
Citation preview
Spencer M. Gluck, FCASNew York
CAS Seminar on Reinsurance 2007CAS Seminar on Reinsurance 2007
Hidden Risks in (Re)InsuranceHidden Risks in (Re)InsuranceSystemic Risks and Accumulation:Systemic Risks and Accumulation:
May 7, 2007May 7, 2007
2
Outline
Section 1: Systemic Risks and Accumulation
A: Introduction - Model Structure
B: Systemic Risks
C: Accumulation
Section 2: Examples
Impact of Systemic Risks and Accumulation
3
Section 1 – Systemic Risks Section 1 – Systemic Risks and Accumulationand AccumulationA:A: Introduction -Introduction - Model StructureModel Structure
4
Introduction
A modeling framework that captures important risks that we may have been missing.
Important applications:–Impact of reinsurance, especially casualty–Cross-lines correlation and whole company models:
Capital adequacy and allocation ERM
5
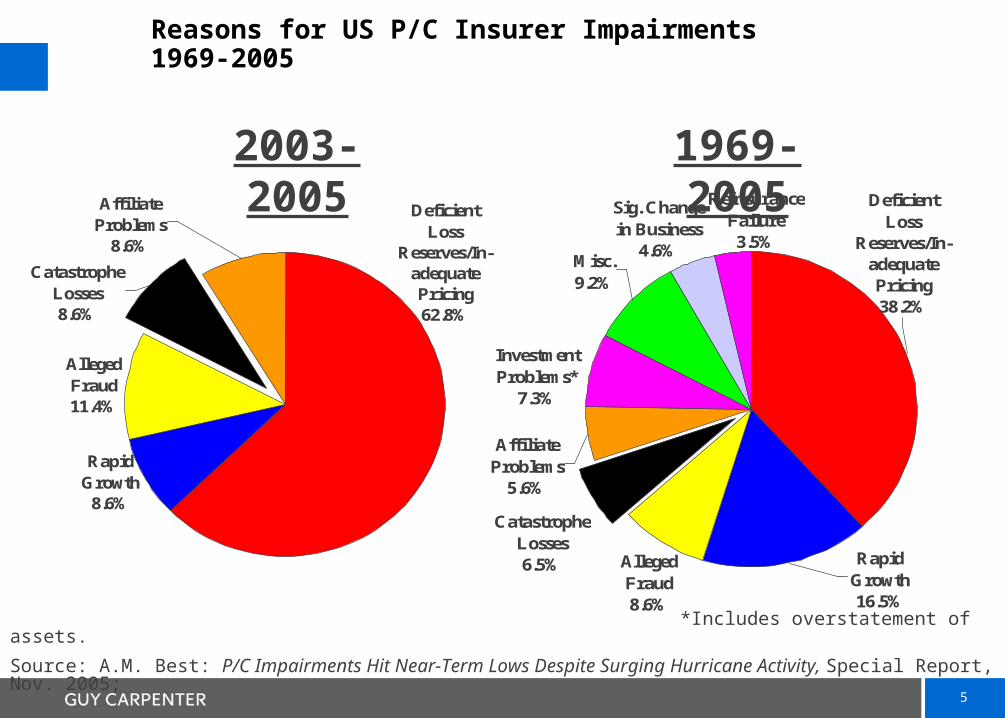
Reasons for US P/C Insurer Impairments 1969-2005
*Includes overstatement of assets.
Source: A.M. Best: P/C Impairments Hit Near-Term Lows Despite Surging Hurricane Activity, Special Report, Nov. 2005;
Catastrophe Losses8.6%
Alleged Fraud11.4%
Deficient Loss
Reserves/In-adequate Pricing62.8%
Affiliate Problems
8.6%
Rapid Growth
8.6%
2003-2005 1969-2005Reinsurance
Failure3.5%
Rapid Growth16.5%
Misc.9.2%
Affiliate Problems
5.6%
Sig. Change in Business
4.6%
Deficient Loss
Reserves/In-adequate Pricing38.2%
Investment Problems*
7.3%
Alleged Fraud8.6%
Catastrophe Losses6.5%
6
Getting the Structure Right
Catastrophe models “understand” the risk that’s being modeled.–The most dangerous risks are those that act in a
correlated way on accumulated exposure.
We require a model structure for other types of underwriting risk that reflect the impact of correlation and accumulation.
7
Some Historical Casualty Killers
Runaway Trends– WC: 1970 through 1990 (California, Texas, etc.)– Med Mal: Late 1960’s through early 1980’s (e.g. NY) and then again
in the 1990’s.– All casualty 1970’s through early 1980’s.
Extended Downcycles– E.g., early 1980’s, late 1990’s
Latent Losses– E.g. asbestos, environmental, construction defects
For the risk model to be meaningful, these types of risk must be captured.

Section 1 – Systemic Risks Section 1 – Systemic Risks and Accumulationand Accumulation B: Systemic RisksB: Systemic Risks

9
Systemic Risks Are Crucial
Systemic Risks:–Difficult to Measure–Affect all LOB’s -- but–Greatest Impact in Casualty
Systemic Risks Accumulate
10
Elements of Systemic Risk
Time Related Risk–Trend and Development Parameters.–Changing Trends –Simultaneously impact new business and accumulated reserves.
Market Related Risk
Also: Casualty catastrophes–But we’re not yet modeling these.

11
Casualty Markets are More Volatile
Price is driven by the lowest estimated costs.
Long tails increase: –Risk of misestimated costs.–Positive cash flows.
Therefore:
Long tail casualty market cycles are the most severe.
12
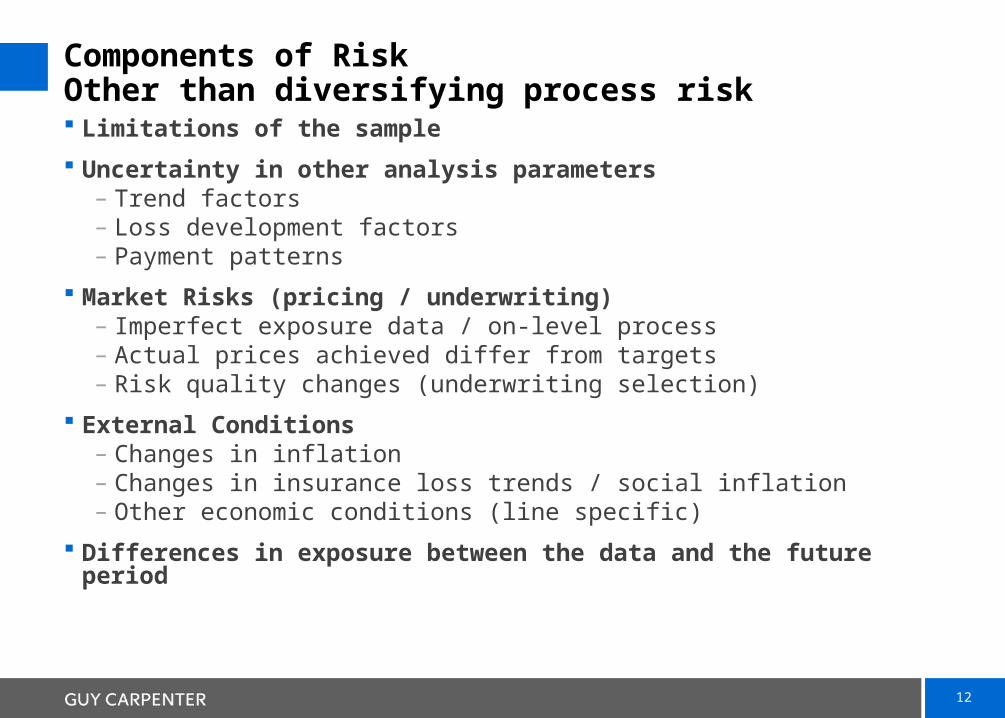
Components of RiskOther than diversifying process risk Limitations of the sample
Uncertainty in other analysis parameters– Trend factors– Loss development factors– Payment patterns
Market Risks (pricing / underwriting)– Imperfect exposure data / on-level process– Actual prices achieved differ from targets– Risk quality changes (underwriting selection)
External Conditions– Changes in inflation– Changes in insurance loss trends / social inflation– Other economic conditions (line specific)
Differences in exposure between the data and the future period

13
Summarized Elements of Systemic Risk
Time Related Risk (i.e. the tail)–Trend and Development Parameters.–Changing Trends –Simultaneously impact new business and accumulated reserves.
Market Related Risk (i.e. the cycle)
Also: Casualty catastrophes
14
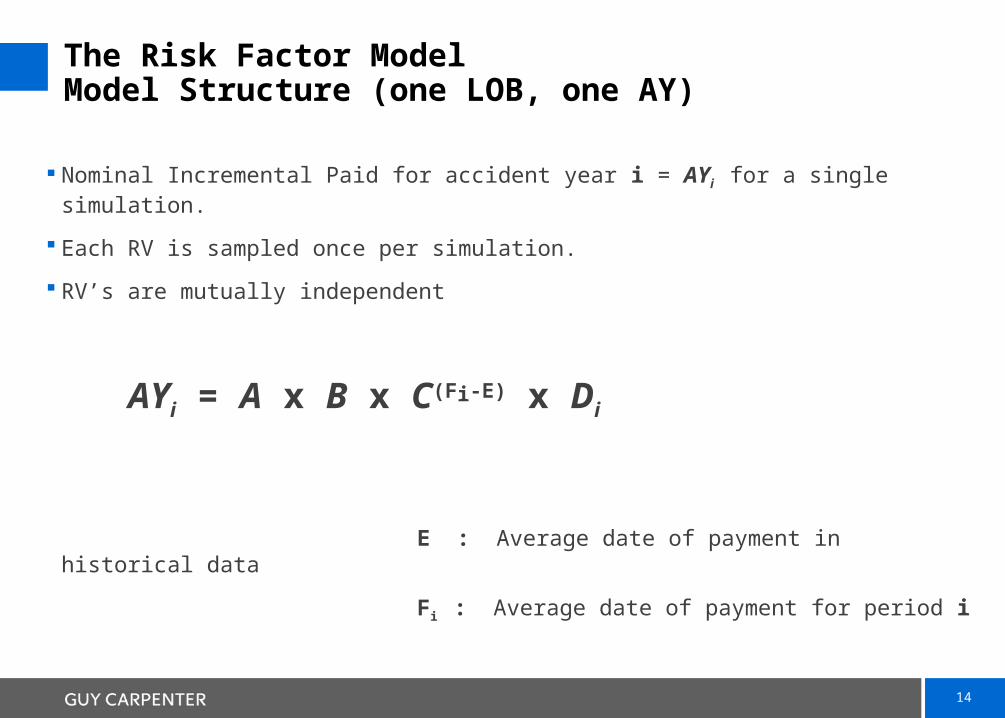
The Risk Factor Model Model Structure (one LOB, one AY)
Nominal Incremental Paid for accident year i = AYi for a single simulation.
Each RV is sampled once per simulation.
RV’s are mutually independent
AYi = A x B x C(Fi-E) x Di
E : Average date of payment in historical data
Fi : Average date of payment for period i

15
Risk Factor Model Components: “Process+” Risk
AYi = A x B x C(Fi-E) x Di
Input Loss Distribution
Reflects both process risk and sample-size related parameter risk–The data “sample” in this case is usually claims at
estimated ultimate values, trended to the appropriate prospective level.
–Reflects risks that typically do not correlate across lines of business
Alternatively, A can be a placeholder for output from another model.
16
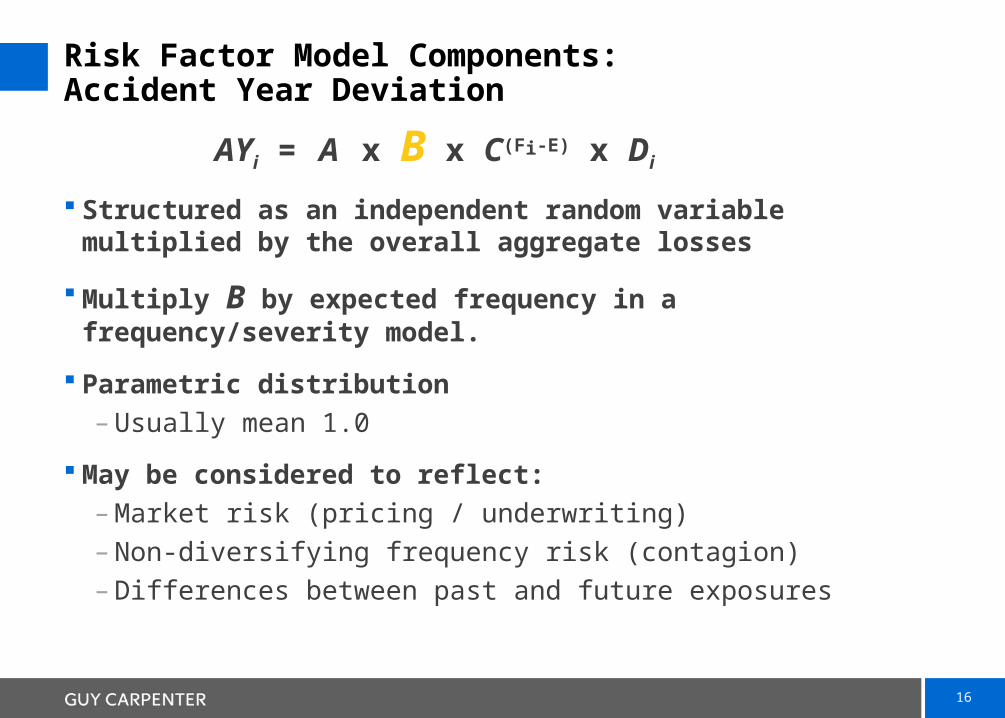
Risk Factor Model Components: Accident Year Deviation
AYi = A x B x C(Fi-E) x Di
Structured as an independent random variable multiplied by the overall aggregate losses
Multiply B by expected frequency in a frequency/severity model.
Parametric distribution – Usually mean 1.0
May be considered to reflect:– Market risk (pricing / underwriting)– Non-diversifying frequency risk (contagion)– Differences between past and future exposures
17
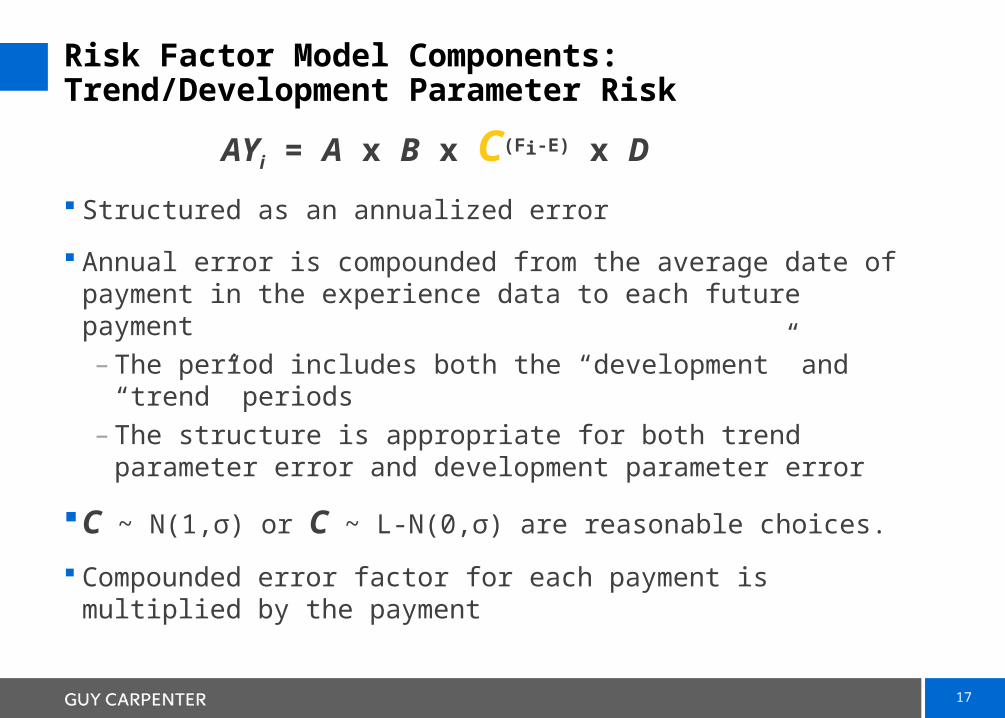
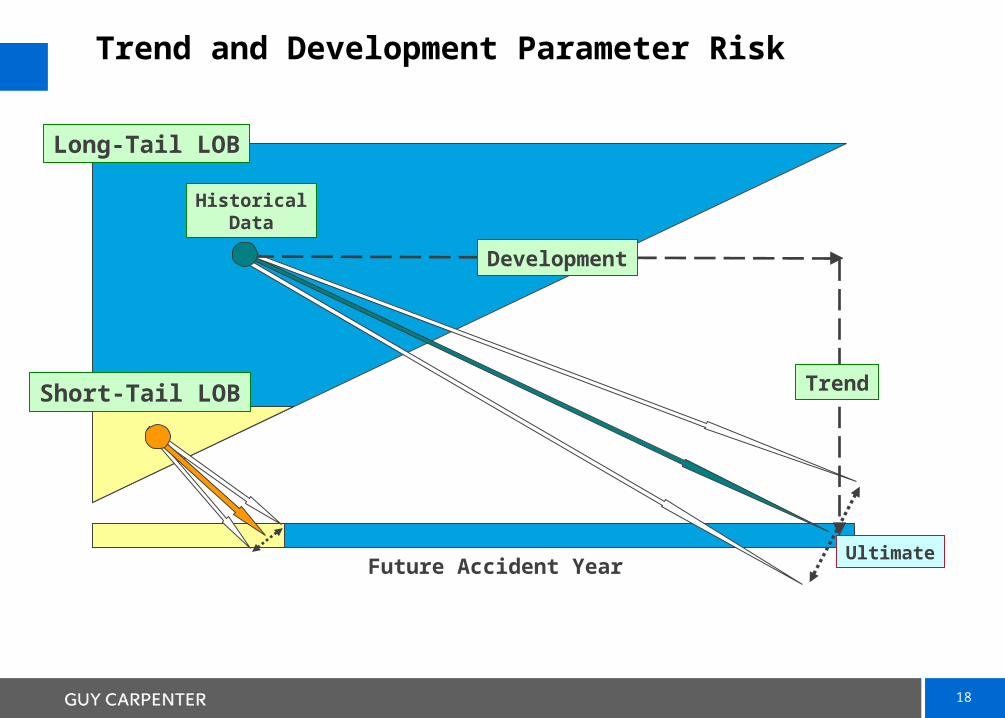
Risk Factor Model Components: Trend/Development Parameter Risk
AYi = A x B x C(Fi-E) x D
Structured as an annualized error
Annual error is compounded from the average date of payment in the experience data to each future payment– The period includes both the “development” and “trend” periods– The structure is appropriate for both trend parameter error and
development parameter error
C ~ N(1,σ) or C ~ L-N(0,σ) are reasonable choices.
Compounded error factor for each payment is multiplied by the payment
18
Trend and Development Parameter Risk
Long-Tail LOB
Short-Tail LOB
Future Accident Year
HistoricalData
Ultimate
Development
Trend

19
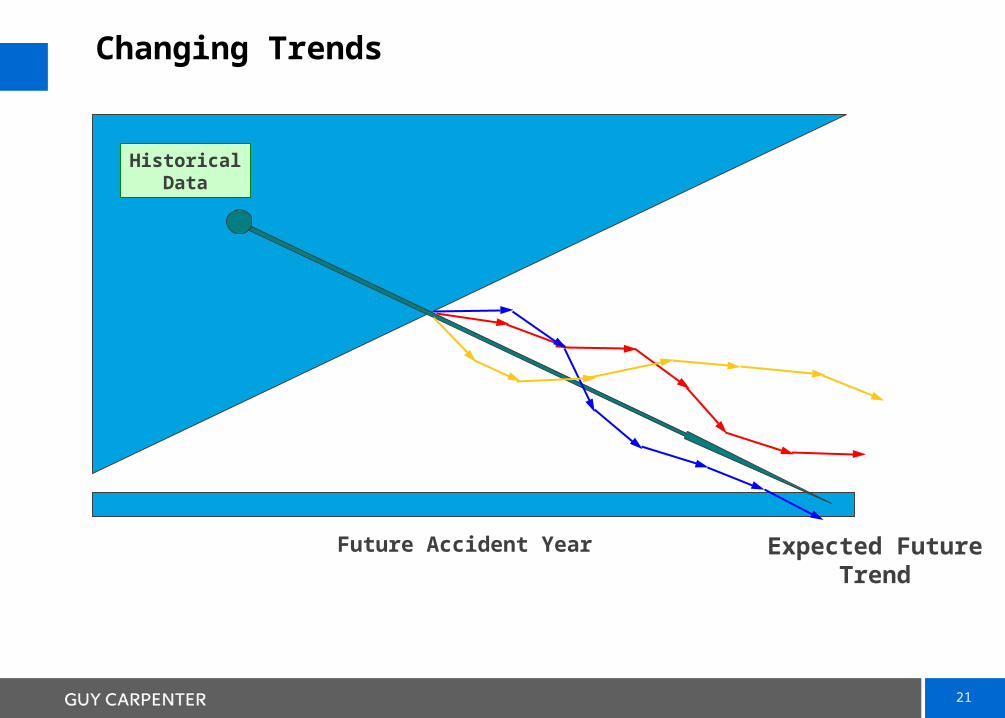
Risk Factor Model Components: Future Trend Process Risk
AYi = A x B x C(Fi-E) x Di
The result of a time series model
The dynamic risk component -- reflects unpredictable changes in future trends / external conditions
Can also be considered as a reflection of specification error
Future trend deviation is modeled as a time series:–First order auto-regressive (AR(1))–The simplest mean-reverting time series (reverts to mean of
zero)

20
Future Trend Process Risk The AR(1) Process
Xi (i = 1, 2, …, n) are independent mean zero Normal
random variables drawn from the same distribution.
Then define:
is the autocorrelation coefficient.
Annual trend error =
Cumulative trend error for year k = Dk =
kkk Xtt 1
11 Xt
kte1
1
k
ii i
k tt
i
e e
21
Changing Trends
Future Accident Year
HistoricalData
Expected FutureTrend
22
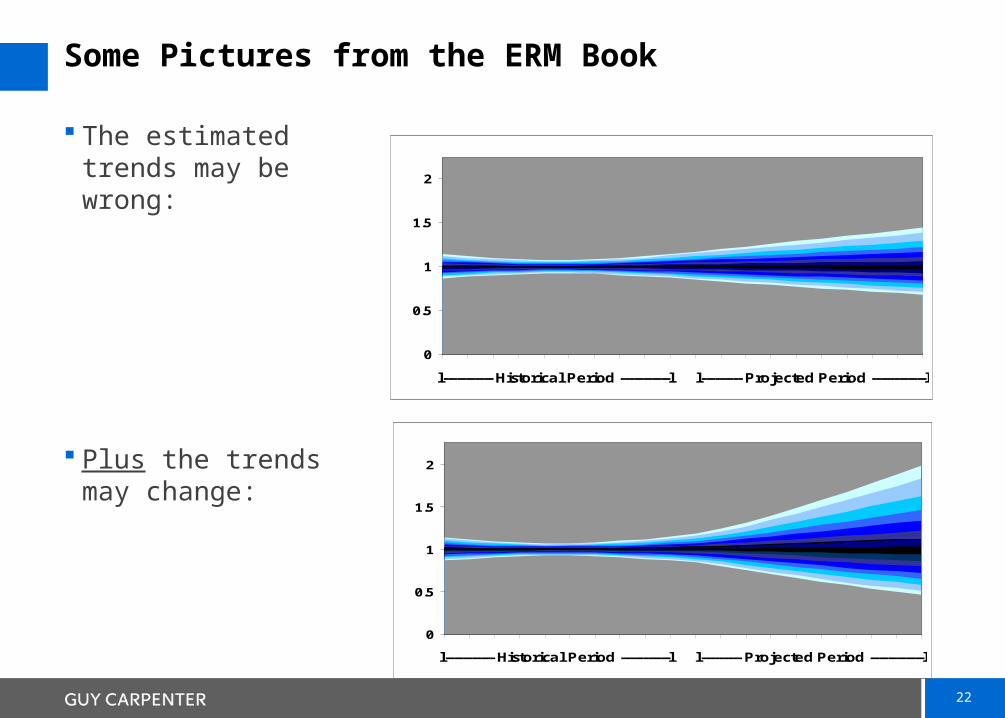
Some Pictures from the ERM Book
The estimated trends may be wrong:
Plus the trends may change:
0
0.5
1
1.5
2
l----------- Historical Period -----------l l--------- Projected Period ------------l
0
0.5
1
1.5
2
l----------- Historical Period -----------l l--------- Projected Period ------------l
23
Section 1 – Systemic Risks Section 1 – Systemic Risks and Accumulation and Accumulation C:C: Accumulation Over TimeAccumulation Over Time
24
Accumulated Risk
Trend and development risks accumulate over many years of underwriting.
Extended down cycles accumulate losses over several years of underwriting.
This appears as reserve risk.
Risk decisions you make now affect reserves for years to come.
The business you write this year absorbs capital for years to come.
25
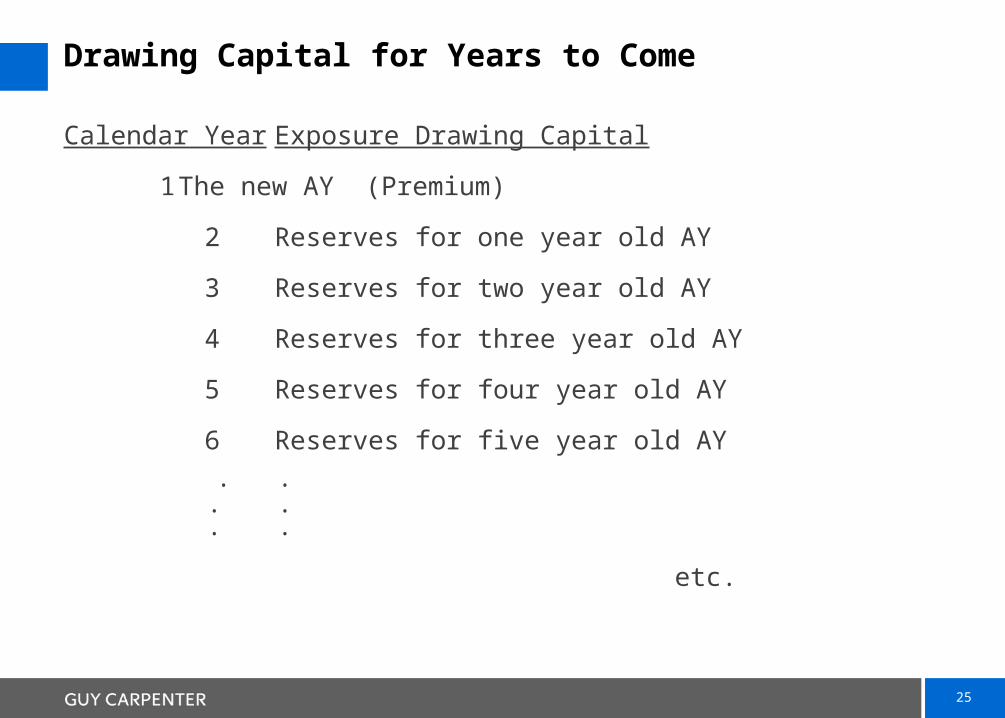
Drawing Capital for Years to Come
Calendar Year Exposure Drawing Capital
1 The new AY (Premium)
2 Reserves for one year old AY
3 Reserves for two year old AY
4 Reserves for three year old AY
5 Reserves for four year old AY
6 Reserves for five year old AY
• •
• •
• •
etc.
26
“As-If” Reserves: An Approach to Accumulated Risk
Reserves “As If” the company had been writing the business consistently over time.
Equivalent to capital to be allocated in the future.
Can reflect the correlated risks on accumulated exposure.
Can measure the impact of reinsurance over time.
27
Accumulation of Systemic Risks
Trend and development parameter risk is identical (100% correlated) between the new AY and the reserves.
Risk of changing trends is identical (100% correlated) between the new AY and the reserves.
The model for changing trend risk can also be a surrogate for latent losses and emerging exposures.
Market risk is partially correlated between successive AY’s.

28
Section 2 - ExamplesSection 2 - ExamplesImpact of Systemic Risk and Impact of Systemic Risk and AccumulationAccumulation
29
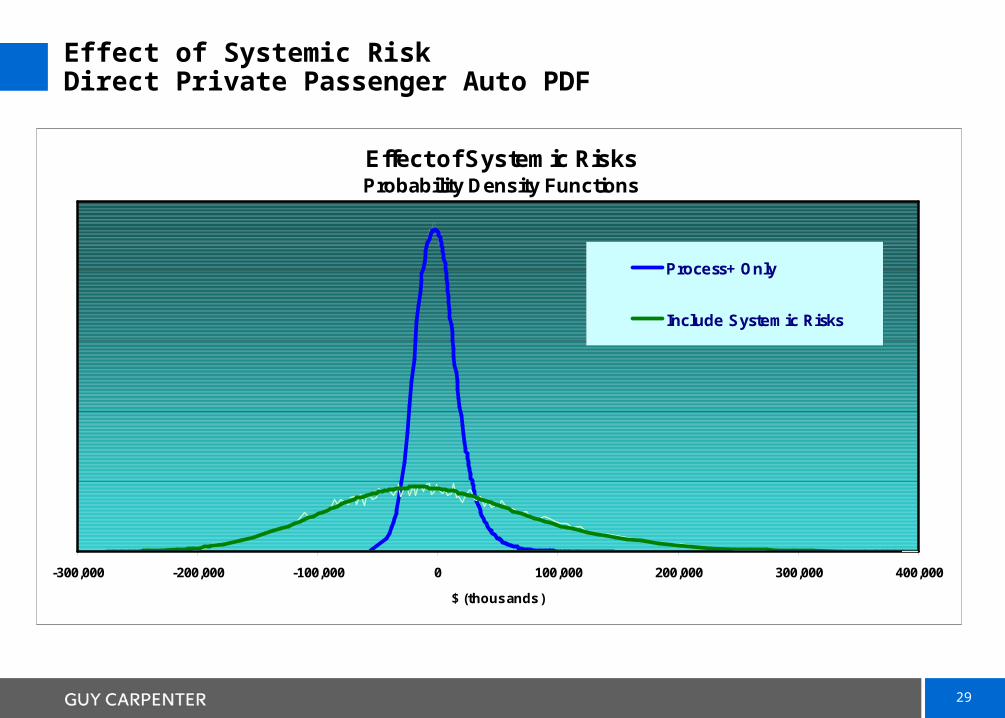
Effect of Systemic RiskDirect Private Passenger Auto PDF
Effect of Systemic Risks Probability Density Functions
-300,000 -200,000 -100,000 0 100,000 200,000 300,000 400,000
$ (thousands)
Process+ Only
Include Systemic Risks

30
Effect of Systemic RiskDirect Private Passenger Auto CDF
Effects of Systemic Risks and AccumulationCumulative Distribution Functions with 99th percentiles
0%
20%
40%
60%
80%
100%
120%
-150,000 -100,000 -50,000 0 50,000 100,000 150,000
Excess Over the Mean
Pro
ba
bili
ty
Process+ Only
Include Systemic Risks
31
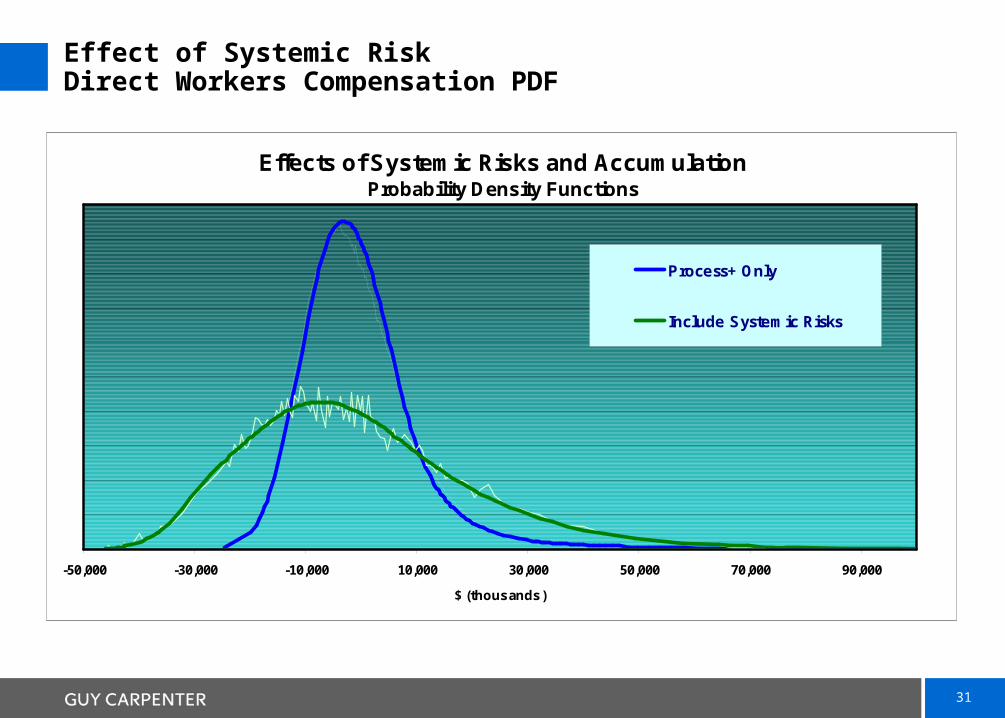
Effect of Systemic RiskDirect Workers Compensation PDF
Effects of Systemic Risks and AccumulationProbability Density Functions
-50,000 -30,000 -10,000 10,000 30,000 50,000 70,000 90,000
$ (thousands)
Process+ Only
Include Systemic Risks

32
Effect of Systemic RiskDirect Workers Compensation CDF
Effects of Systemic Risks and AccumulationCumulative Distribution Functions with 99th percentiles
0%
20%
40%
60%
80%
100%
120%
-50,000 -30,000 -10,000 10,000 30,000 50,000 70,000 90,000
Excess Over the Mean
Pro
ba
bili
ty
Process+ Only
Include Systemic Risks

33
Effect of Systemic RiskDirect Casualty Multiline PDF
Effect of Systemic Risks Probability Density Functions
-300,000 -200,000 -100,000 0 100,000 200,000 300,000 400,000
$ (thousands)
Process+ Only
Include Systemic Risks
34
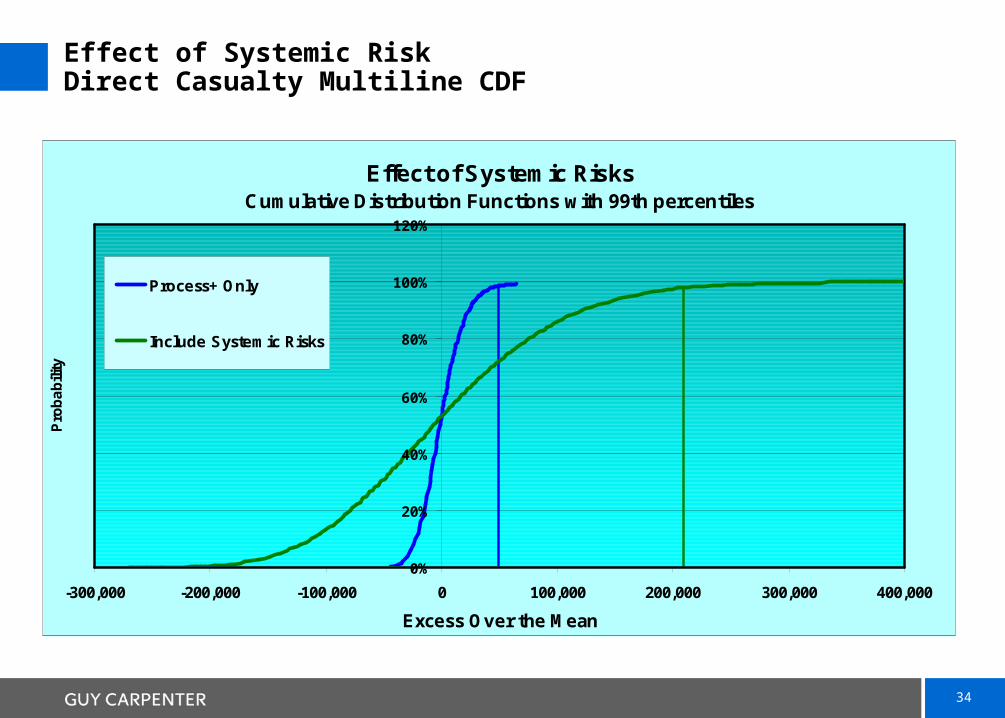
Effect of Systemic RiskDirect Casualty Multiline CDF
Effect of Systemic RisksCumulative Distribution Functions with 99th percentiles
0%
20%
40%
60%
80%
100%
120%
-300,000 -200,000 -100,000 0 100,000 200,000 300,000 400,000
Excess Over the Mean
Pro
ba
bili
ty
Process+ Only
Include Systemic Risks
35
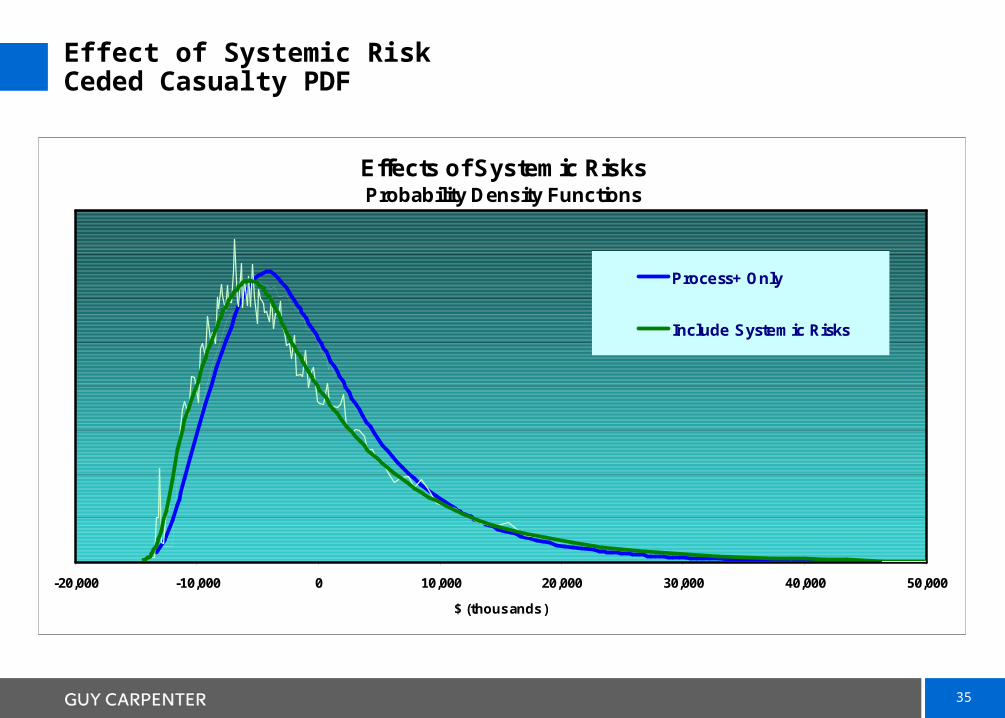
Effect of Systemic RiskCeded Casualty PDF
Effects of Systemic Risks Probability Density Functions
-20,000 -10,000 0 10,000 20,000 30,000 40,000 50,000
$ (thousands)
Process+ Only
Include Systemic Risks
36
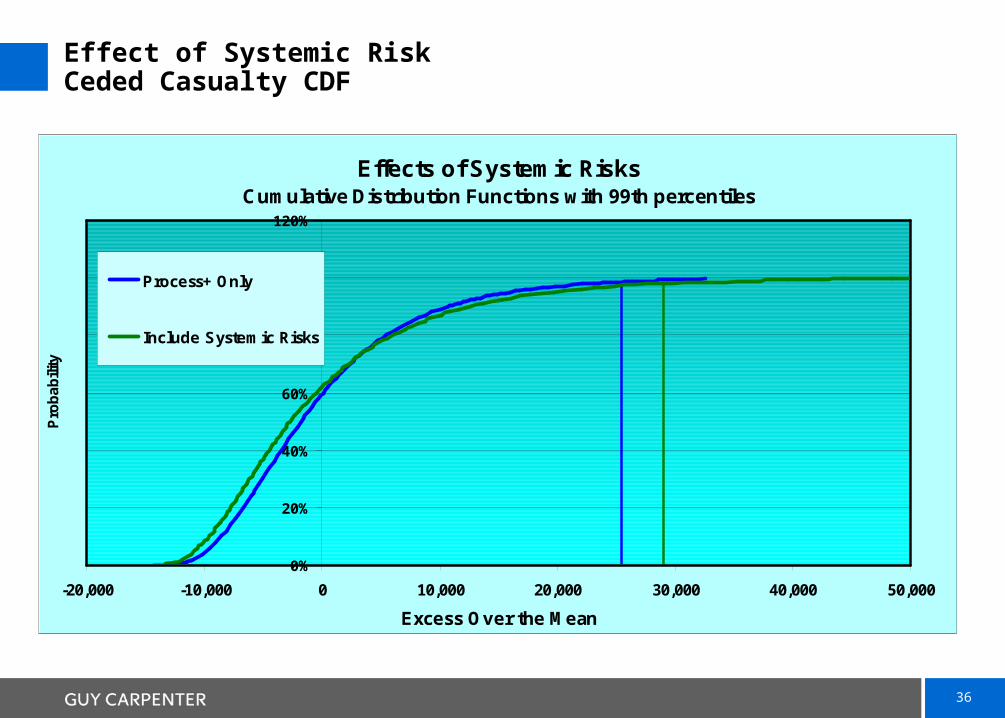
Effect of Systemic RiskCeded Casualty CDF
Effects of Systemic Risks Cumulative Distribution Functions with 99th percentiles
0%
20%
40%
60%
80%
100%
120%
-20,000 -10,000 0 10,000 20,000 30,000 40,000 50,000
Excess Over the Mean
Pro
ba
bili
ty
Process+ Only
Include Systemic Risks
37
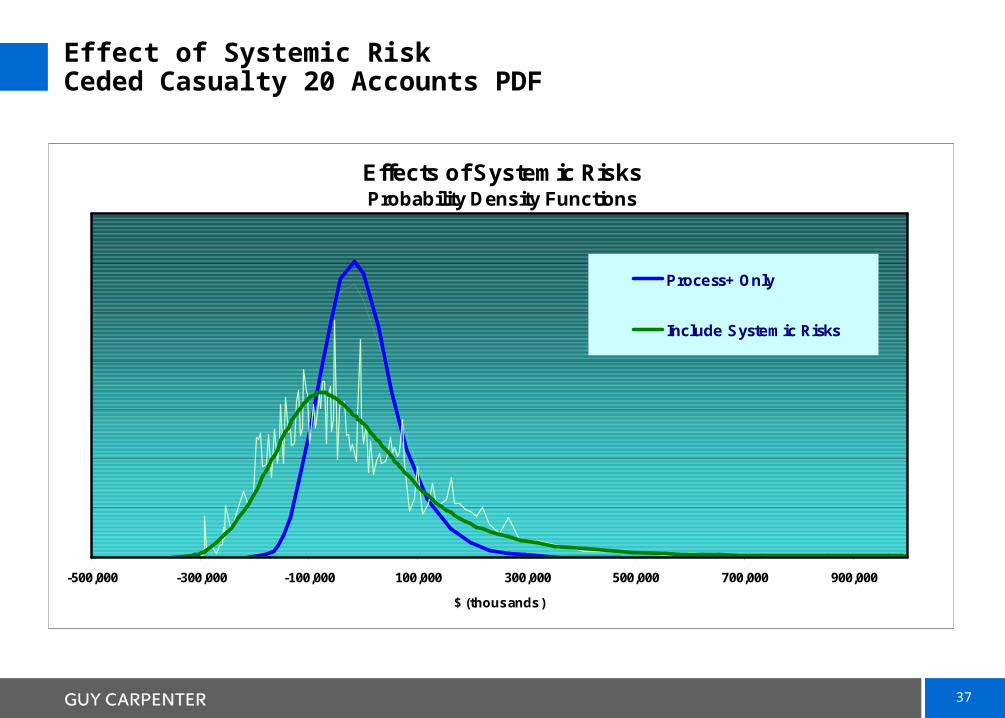
Effect of Systemic RiskCeded Casualty 20 Accounts PDF
Effects of Systemic Risks Probability Density Functions
-500,000 -300,000 -100,000 100,000 300,000 500,000 700,000 900,000
$ (thousands)
Process+ Only
Include Systemic Risks
38
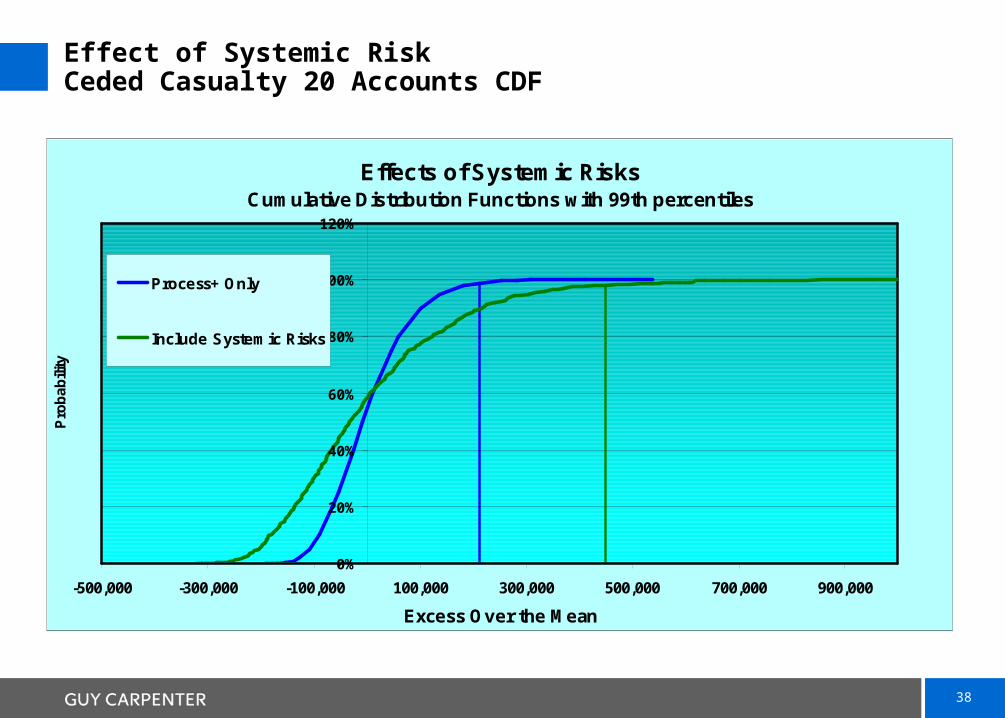
Effect of Systemic RiskCeded Casualty 20 Accounts CDF
Effects of Systemic Risks Cumulative Distribution Functions with 99th percentiles
0%
20%
40%
60%
80%
100%
120%
-500,000 -300,000 -100,000 100,000 300,000 500,000 700,000 900,000
Excess Over the Mean
Pro
ba
bili
ty
Process+ Only
Include Systemic Risks
39
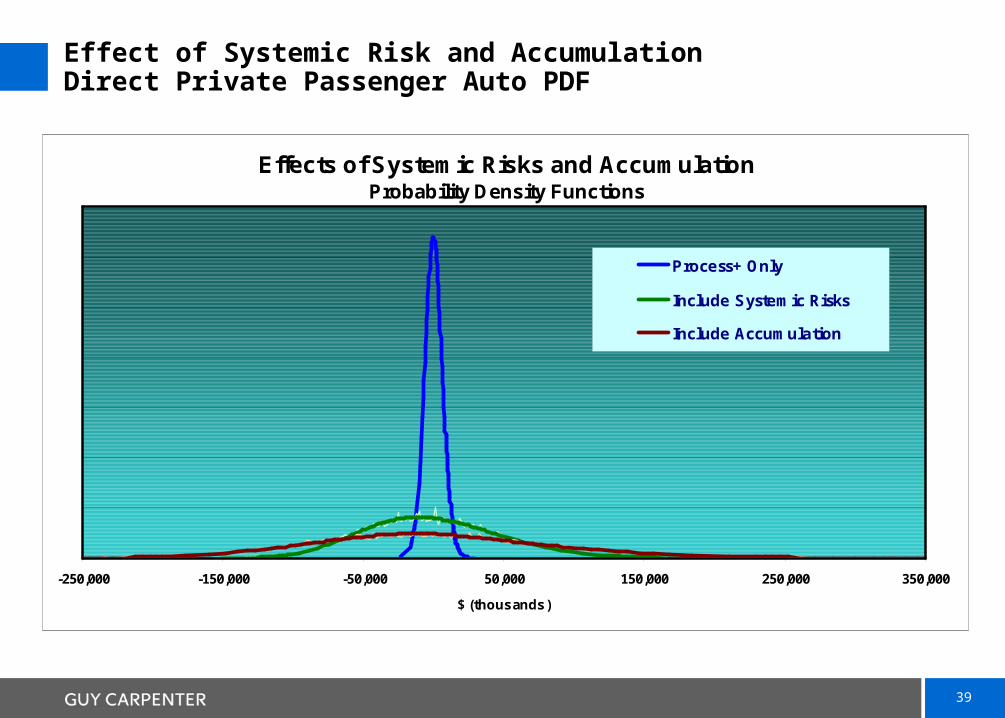
Effect of Systemic Risk and AccumulationDirect Private Passenger Auto PDF
Effects of Systemic Risks and AccumulationProbability Density Functions
-250,000 -150,000 -50,000 50,000 150,000 250,000 350,000
$ (thousands)
Process+ Only
Include Systemic Risks
Include Accumulation
40
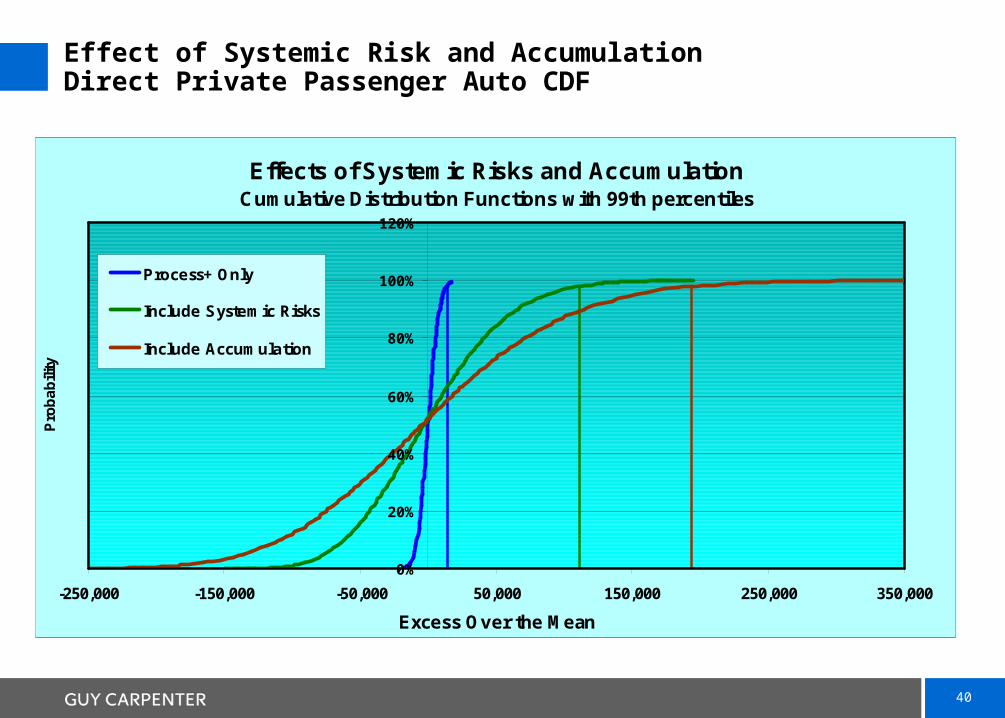
Effect of Systemic Risk and AccumulationDirect Private Passenger Auto CDF
Effects of Systemic Risks and AccumulationCumulative Distribution Functions with 99th percentiles
0%
20%
40%
60%
80%
100%
120%
-250,000 -150,000 -50,000 50,000 150,000 250,000 350,000
Excess Over the Mean
Pro
ba
bili
ty
Process+ Only
Include Systemic Risks
Include Accumulation

41
Effect of Systemic Risk and AccumulationDirect Workers Compensation PDF
Effects of Systemic Risks and AccumulationProbability Density Functions
-200,000 -150,000 -100,000 -50,000 0 50,000 100,000 150,000 200,000 250,000 300,000
$ (thousands)
Process+ Only
Include Systemic Risks
Include Accumulation
42
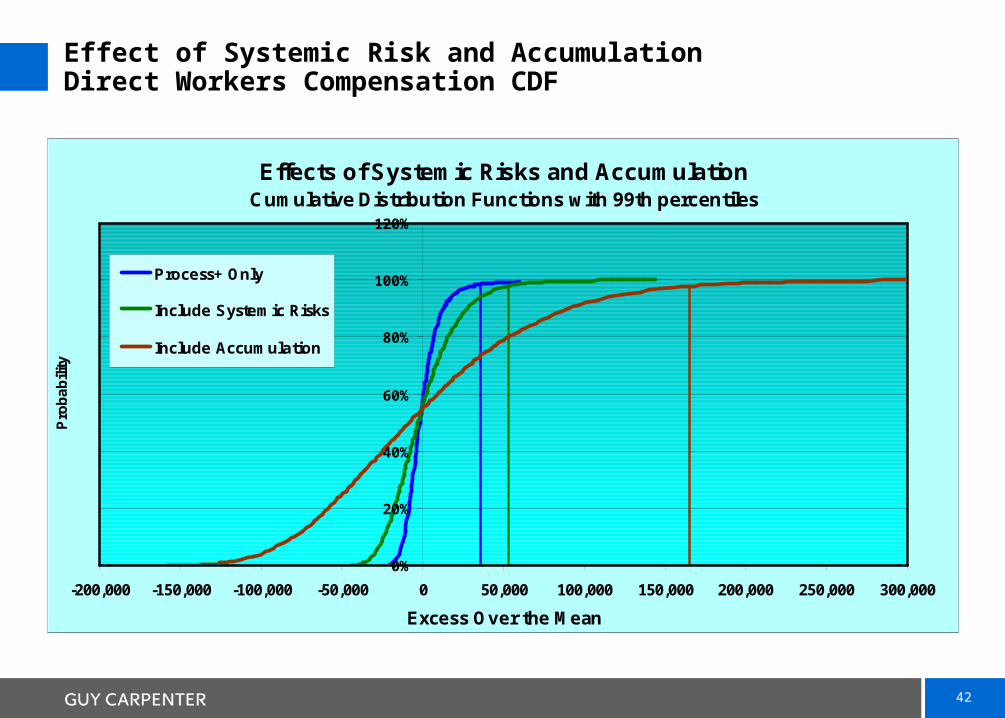
Effect of Systemic Risk and AccumulationDirect Workers Compensation CDF
Effects of Systemic Risks and AccumulationCumulative Distribution Functions with 99th percentiles
0%
20%
40%
60%
80%
100%
120%
-200,000 -150,000 -100,000 -50,000 0 50,000 100,000 150,000 200,000 250,000 300,000
Excess Over the Mean
Pro
ba
bili
ty
Process+ Only
Include Systemic Risks
Include Accumulation
43
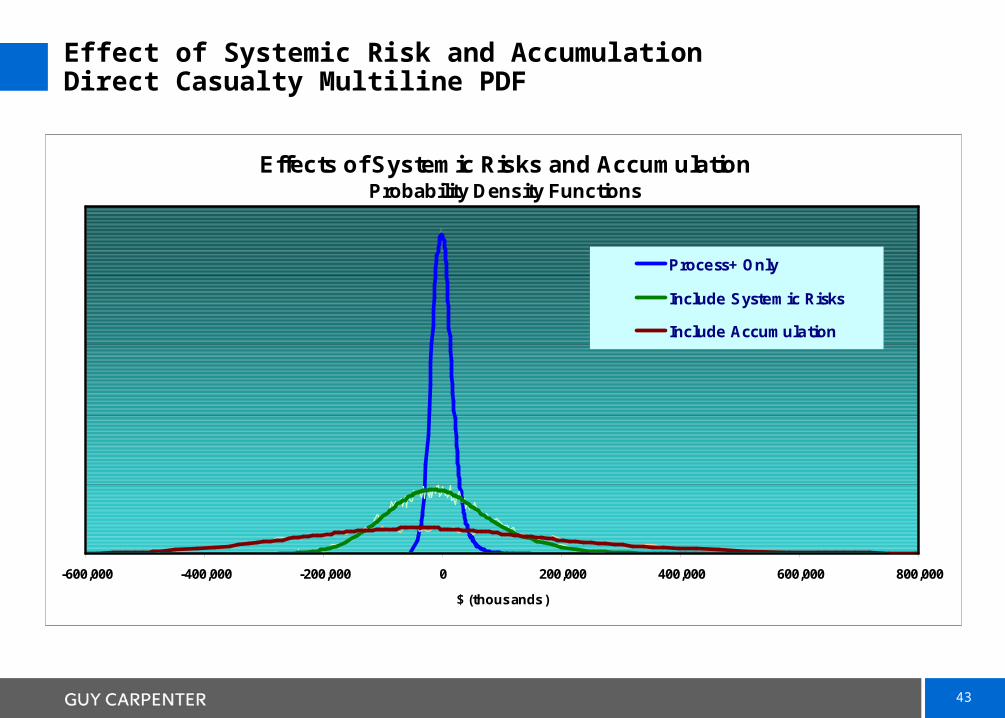
Effect of Systemic Risk and AccumulationDirect Casualty Multiline PDF
Effects of Systemic Risks and AccumulationProbability Density Functions
-600,000 -400,000 -200,000 0 200,000 400,000 600,000 800,000
$ (thousands)
Process+ Only
Include Systemic Risks
Include Accumulation
44
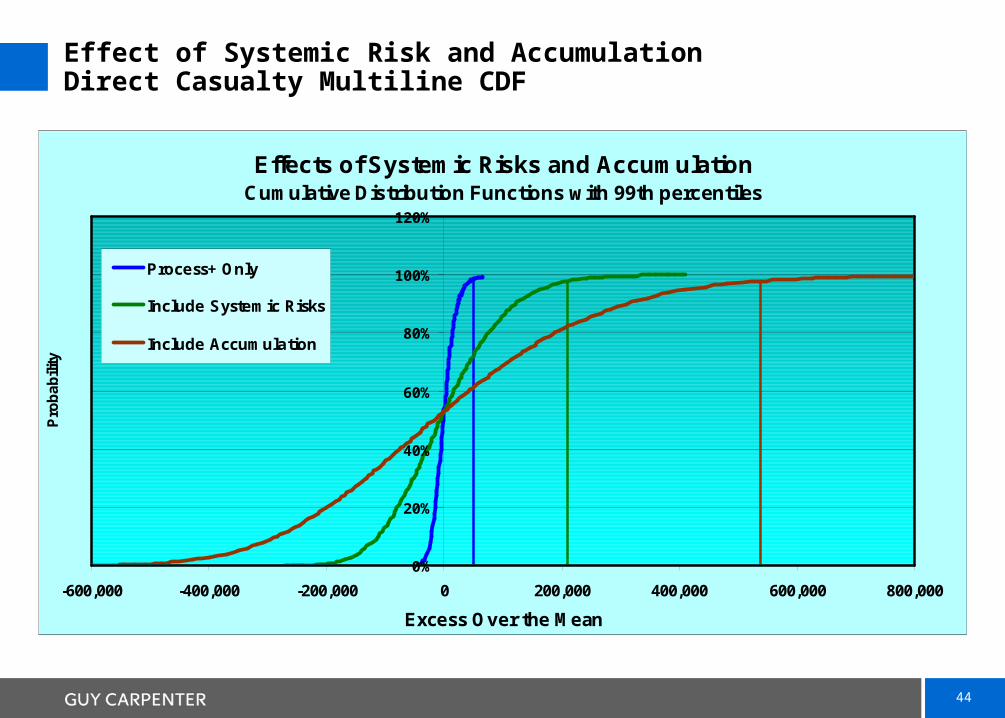
Effect of Systemic Risk and AccumulationDirect Casualty Multiline CDF
Effects of Systemic Risks and AccumulationCumulative Distribution Functions with 99th percentiles
0%
20%
40%
60%
80%
100%
120%
-600,000 -400,000 -200,000 0 200,000 400,000 600,000 800,000
Excess Over the Mean
Pro
ba
bili
ty
Process+ Only
Include Systemic Risks
Include Accumulation

45
Effect of Systemic Risk and AccumulationCeded Casualty PDF
Effects of Systemic Risks and AccumulationProbability Density Functions
-100,000 -50,000 0 50,000 100,000 150,000
$ (thousands)
Process+ Only
Include Systemic Risks
Include Accumulation

46
Effect of Systemic Risk and AccumulationCeded Casualty CDF
Effects of Systemic Risks and AccumulationCumulative Distribution Functions with 99th percentiles
0%
20%
40%
60%
80%
100%
120%
-100,000 -50,000 0 50,000 100,000 150,000
Excess Over the Mean
Pro
ba
bili
ty
Process+ Only
Include Systemic Risks
Include Accumulation
47
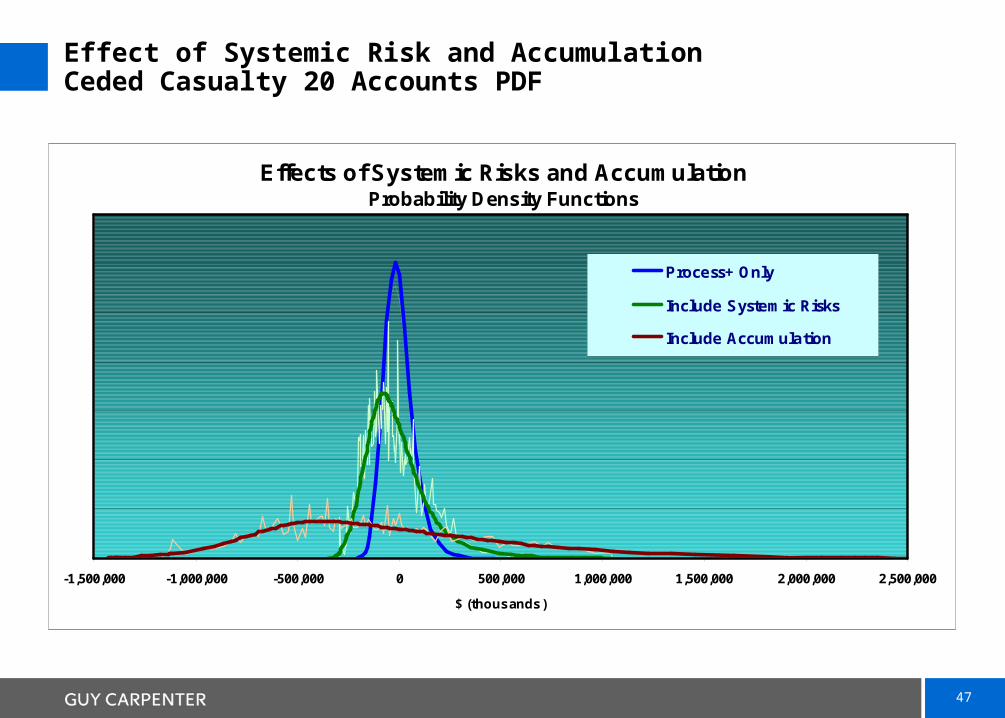
Effect of Systemic Risk and AccumulationCeded Casualty 20 Accounts PDF
Effects of Systemic Risks and AccumulationProbability Density Functions
-1,500,000 -1,000,000 -500,000 0 500,000 1,000,000 1,500,000 2,000,000 2,500,000
$ (thousands)
Process+ Only
Include Systemic Risks
Include Accumulation
48
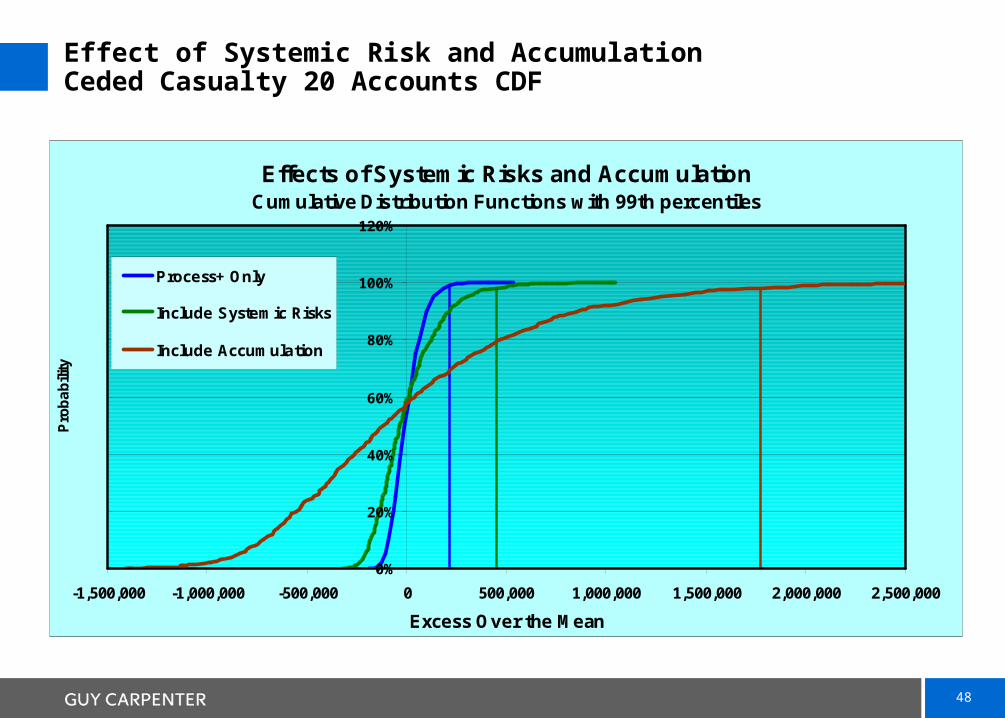
Effect of Systemic Risk and AccumulationCeded Casualty 20 Accounts CDF
Effects of Systemic Risks and AccumulationCumulative Distribution Functions with 99th percentiles
0%
20%
40%
60%
80%
100%
120%
-1,500,000 -1,000,000 -500,000 0 500,000 1,000,000 1,500,000 2,000,000 2,500,000
Excess Over the Mean
Pro
ba
bili
ty
Process+ Only
Include Systemic Risks
Include Accumulation