Embed Size (px)
Citation preview
Cartographic Design and Interaction: An Integrated User-Centered Agile Software Development Framework for Web GIS Applications
by
Jo-Anne Antoun
A Thesis Presented to the Faculty of the USC Graduate School
University of Southern California In Partial Fulfillment of the
Requirements for the Degree Master of Science
(Geographic Information Science and Technology)
August 2018

ii
Copyright © 2018 by Jo-Anne Antoun

iii
To Tony, Nikolas, and Isabella Antoun
iv
Table of Contents
List of Figures ............................................................................................................................... vii
List of Tables ................................................................................................................................. xi
Acknowledgments......................................................................................................................... xii
List of Abbreviations ................................................................................................................... xiii
Abstract ........................................................................................................................................ xvi
Chapter 1 Introduction .................................................................................................................... 1
1.1. Motivation ...........................................................................................................................2
1.1.1. Iterative Software Development Frameworks and GIS .............................................2
1.1.2. Application Interface Design and Software Development Concerns in Web GIS ....3
1.1.3. User-Centered Interface Design Research in Web GIS. ............................................5
1.1.4. The Proposed Interface Design and Software Development Framework ..................6
1.2. Improving Interface Design and Software Development Processes for Web GIS – The Test Case .........................................................................................................................8
1.2.1. The Test Application..................................................................................................8
1.2.2. The Pilot Application ...............................................................................................10
1.2.3. PIA Comparison with Related Existing Applications .............................................13
1.2.4. Research Goals.........................................................................................................13
1.2.5. Thesis Roadmap .......................................................................................................14
Chapter 2 Related Work................................................................................................................ 15
2.1. Online Cartographic Design .............................................................................................15
2.2. User-Centered Design .......................................................................................................17
2.2.1. Relationship between Usability Components ..........................................................18
2.2.2. User-Centered Design Methods ...............................................................................20
v
2.2.3. The Elements of User Experience ............................................................................22
2.3. Agile-Based Development Frameworks ...........................................................................23
2.3.1. The Scrum Development Framework ......................................................................24
2.3.2. Agile Requirements-Gathering: User Stories ..........................................................30
2.3.3. Challenges that Agile Practitioners Face .................................................................34
2.3.4. System Design – Development Activity ..................................................................35
2.3.5. Other Agile-Based Development Frameworks ........................................................36
2.4. User-Centered Agile Software Development (UCASD) ..................................................37
2.5. ArcGIS Online Interactive Web Application Configuration Options...............................39
Chapter 3 Methods: Constructing and Implementing the Web GIS UCASD Framework through the Development of the PIA Test Application ...................................................................... 41
3.1. The Web GIS UCASD Framework ..................................................................................41
3.1.1. Variations to Established Agile-Based Methodologies ...........................................42
3.1.2. Composition of the Web GIS UCASD ....................................................................44
3.2. Framework Test Case: Developing the PIA Application .................................................49
3.2.1. Iteration -1. ..............................................................................................................49
3.2.2. Iteration 0.................................................................................................................52
3.2.3. Post-Iteration 0 Design and Development Iterations ...............................................77
Chapter 4 Web GIS UCASD Implementation Results ............................................................... 102
4.1. Final QA/QC Iteration – Product Release ......................................................................102
4.2. The Final PIA ..................................................................................................................103
4.2.1. The Landing Page and Main Application Template ..............................................104
4.2.2. The Property Information Map, My Zoning, and Other Jurisdiction Map ............105
4.2.3. Zone Type and Zone Type Tours ...........................................................................111
4.2.4. More about Zoning ................................................................................................115
4.2.5. What can I do with my Property? Zone-Specific Guidance ..................................116
vi
4.2.6. Site Characteristics.................................................................................................120
4.2.7. The Permitting Process and Other Considerations ................................................124
Chapter 5 Framework Design, Framework Implementation through the Development of a test Web GIS Application, and Framework Evaluation ............................................................. 127
5.1. Evaluation of the Integrated UCASD Framework for Web GIS ....................................127
5.1.1. The Extended Iteration 0 ........................................................................................128
5.1.2. Requirements-Gathering: Wireframe Prototyping and User Stories .....................128
5.1.3. The GIS UX/UI Design Plan and GIS-specific UX/UI Design Sessions ..............131
5.1.4. Final QA/QC Iteration ...........................................................................................134
5.1.5. Other Important Framework Components .............................................................135
5.1.6. Framework Limitations ..........................................................................................141
5.2. Conclusion ......................................................................................................................143
References ................................................................................................................................... 146
Appendix A: User Stories ......................................................................................................... 150
Appendix B: Business Requirements ...................................................................................... 180
Appendix C: Important Links ................................................................................................. 181
Appendix D: GIS UI Design Plan – Pre-Planning Notes ....................................................... 182
vii
List of Figures
Figure 1. Geoffrey’s Technology Adoption Curve. ........................................................................ 6
Figure 2. Snohomish County Zoning Map. By Snohomish County PDS, 2017 ............................. 9
Figure 3. Pilot application interface design issues ........................................................................ 11
Figure 4. Pilot application developed on the Geocortex Platform. Screen Capture from Internal-
faced Application, Snohomish County PDS, 2017 ....................................................................... 12
Figure 5. The relationship between usability, HCI, UCD, and UX .............................................. 19
Figure 6. The Elements of User Experience (J. J. Garrett 2010). ................................................. 23
Figure 7. The Development Team responsibilities within the scrum framework as illustrated by
Kenneth Rubin, “Essential Scrum”, 2013. .................................................................................... 30
Figure 8. Test Case created from Acceptance Criteria. ................................................................ 31
Figure 9. Story Cards pinned to a wall to facilitate Triangulation. Table by Mike Cohn, “User
Stories Applied,” 2013. ................................................................................................................. 34
Figure 10. Integrated User-Centered Agile Software Development Framework for Web GIS. ... 45
Figure 11. The Jira Project Management tool backlog ................................................................. 50
Figure 12. PIA High-level Product Road Map ............................................................................. 52
Figure 13. PIA Single-Property Owner Persona ........................................................................... 55
Figure 14. Initial Low-fidelity Wireframe Prototypes .................................................................. 56
Figure 15. User Story Card with Acceptance Criteria .................................................................. 59
Figure 16. User Story titles on cards arranged by Epic during brainstorming activity ................ 60
Figure 17. Story Point Triangulation – Stories arranged by Fibonacci point complexity ............ 61
Figure 18. Story Point Board with story point estimations ........................................................... 62
viii
Figure 19. GIS Component Diagram ............................................................................................ 64
Figure 20. PIA High-level Sequence Diagram ............................................................................. 65
Figure 21. PIA Platform Architecture ........................................................................................... 70
Figure 22. PIA Information Architecture and Interaction Design – 1 .......................................... 76
Figure 23. PIA Component Diagram 1 ......................................................................................... 79
Figure 24. Initial medium-fidelity wireframe prototype ............................................................... 81
Figure 25. The Property Information map application after Development Iteration 1 ................. 82
Figure 26. The Snohomish County City and Tribal Jurisdiction application landing page .......... 83
Figure 27. Structured GIS UX/UI Design Plan ............................................................................ 85
Figure 28. Zone Type map application (Web App Builder) ......................................................... 86
Figure 29. Snohomish County Resource Zones map application (Web App Builder) ................. 87
Figure 30. Snohomish County Urban Tour map application ........................................................ 87
Figure 31. The first PIA Accordion-style shell displaying parcel information ............................ 88
Figure 32. The first PIA Accordion-style shell - displaying the Urban Tour page ...................... 89
Figure 33. The first PIA Accordion-style shell - displaying the Other Jurisdiction page ............ 89
Figure 34. Low-Fidelity Prototypes to assist UI Refactoring ....................................................... 91
Figure 35. Refactored Medium-fidelity UI Prototypes ................................................................. 92
Figure 36. The Resource Zone application – Map Journal template ............................................ 93
Figure 37. The updated Information Architecture and Interaction Diagram - reflecting refactoring
changes .......................................................................................................................................... 95
Figure 38. The updated PIA Detailed Component Architecture Diagram.................................... 95
Figure 39. PIA final application - Locate my property page ........................................................ 97
Figure 40. The final PIA regulatory context page ........................................................................ 98
ix
Figure 41. PIA test plan by Iteration ............................................................................................. 99
Figure 42. User Story 2.9 with Acceptance Criteria ................................................................... 100
Figure 43. User Story 2.9 Test cases as shown in Trello ............................................................ 101
Figure 44. The PIA Test plan on Trello ...................................................................................... 103
Figure 45. The PIA landing page and central application – Esri Story Map Cascade template . 104
Figure 46. The PIA menu bar ..................................................................................................... 105
Figure 47. Property Information, zoning, and Other Jurisdiction maps ..................................... 106
Figure 48. The Locate your property page with title .................................................................. 107
Figure 49. Locate your property page - Your Zoning ................................................................. 107
Figure 50. Zoning information pop-up in Property Information Map ........................................ 108
Figure 51. The Property Information map search functionality ................................................. 109
Figure 52. Other Jurisdiction landing page ................................................................................. 110
Figure 53. Other Jurisdiction city selection ................................................................................ 110
Figure 54. The Zone type and Zone type tour section ................................................................ 111
Figure 55. Zone Type map with title .......................................................................................... 112
Figure 56. More about zoning Zone Type map .......................................................................... 112
Figure 57. More about zoning side panel display ....................................................................... 113
Figure 58. The Rural zone type tour application ........................................................................ 114
Figure 59. The Resource zone type tour application .................................................................. 114
Figure 60. More about zoning - narrative text ............................................................................ 115
Figure 61. More about zoning - explanatory visual .................................................................... 116
Figure 62. PIA Zone-specific guidance section .......................................................................... 117
Figure 63. The Multiple Family Residential narrative: Zone-specific guidance page 1 ............ 118
x
Figure 64. The Rural narrative: Zone-specific guidance page 2 ................................................. 118
Figure 65. The Single Family Residential narrative: Zone-specific guidance page 3 ................ 119
Figure 66. The Resource narrative: Zone-specific guidance page 4 ........................................... 119
Figure 67. Rural zones: Zone-specific map ................................................................................ 120
Figure 68. PIA Site Characteristics and the Property Restrictions Map ..................................... 121
Figure 69. PIA site characteristics narrative ............................................................................... 122
Figure 70. Property Restrictions map layer toggle 1 .................................................................. 123
Figure 71. Property Restrictions map layer toggle 2 .................................................................. 123
Figure 72. Property Restrictions map with city bookmarks ....................................................... 124
Figure 73. The permitting process and other considerations ...................................................... 125
Figure 74. The permitting process page ...................................................................................... 125
Figure 75. Restrictions and regulatory context ........................................................................... 126
Figure 76. The Contact Us page ................................................................................................. 126
Figure 77. Wireframe prototyping facilitating UI Design adaptations. ...................................... 129
Figure 78. High-Fidelity UI Assets of User Story 1.4 ................................................................ 130
Figure 79. Property Restrictions Map Design - Symbolization at different Zoom Levels ......... 132
Figure 80. Property Restrictions Map - Symbolization close to "Neighborhood" Level ........... 132
Figure 81. PIA Search result popup display issue ...................................................................... 135
Figure 82. The PIA Permitting Information Page ....................................................................... 137
Figure 83. The County Permitting Information Page ................................................................. 137
Figure 84. High-fidelity UI asset of the PIA Site Characteristics page ...................................... 139
Figure 85. Pop-up comparison between the pilot application and the PIA ................................ 140
xi
List of Tables
Table 1. Web GIS UCASD Composition (Project Vision and Inception Stages) ........................ 47
Table 2. Web GIS UCASD Composition (Construction Stages) ................................................. 48
Table 3. PIA Product Backlog (Including iteration and focus group meeting dates) ................... 66
Table 4. PIA Data Table ............................................................................................................... 72
Table 5. Iteration 1 Development and Design Iteration 2 Activities. ........................................... 78
Table 6. Development Iteration 2 and Design Iteration 3 Activities. ........................................... 83
Table 7. Development Iteration 3 – Design Iteration 4 Activities ................................................ 92
Table 8. Iteration 4 Development Activities. ................................................................................ 96
xii
Acknowledgments
I am grateful to my mentor, Professor Sedano, for the direction I needed and my committee
members, Professor Swift and Professor Vos who provided guidance throughout the thesis
writing process. I would further like to thank my husband Tony for his patience and support
during my entire academic career.
xiii
List of Abbreviations
AGOL ArcGIS Online
API Application Programming Interface
ASD Agile Software Development
AUCDI Agile and User-Centered Design Integration
BIM Building Information Modeling
BRD Business Requirements Document
CSS Cascade Style Sheets
CT Customer Team
DAD Disciplined Agile Development
DAHP Department of Archaeological and Historic Preservation
DEEP Detailed appropriately, Emergent, Estimated, and Prioritized
DNR Department of Natural Resources
DOD Definition of Done
DOM Document Object Model
DMZ Demilitarized Zone
DTS Data Transfer Solutions
Esri Environmental Systems Research Institute
FEMA Federal Emergency Management Agency
GI Science Geographic Information Science
GTCM Geospatial Technology Competency Model
GIS Geographic Information System
HCI Human-Computer Interaction
xiv
HTML Hyper Text Markup Language
HTTP Hyper Text Transfer Protocol
HTTPS Hyper Text Transfer Protocol Secure
INVEST Independent, Negotiable, Valuable, Estimable, Small, and Testable
IA Information Architecture
IDP Identity Provider
IT Information Technology
JSON JavaScript Object Notation
MVP Minimum Viable Product
PBI Product Backlog Items
PDS Planning and Development Services
PIA Property Information Application
PM Project Manager
PO Product Owner
QA Quality Assurance
QC Quality Control
REST Representational State Transfer
SaaS Software as a Service
SAML Security Assertion Markup Language
SDLC Software Development Life Cycle
SME Subject Matter Expert
SP Service Provider
SPO Single Property Owner

xv
TPM Technical Project Manager
UCASD User-centered Agile Software Development
UCD User-Centered Design
UE Usability Engineering
UGA Urban Growth Area
UI User Interface
UML Unified Modeling Language
URISA Urban and Regional Information Systems Association
URL Uniform Resource Locator
USC University of Southern California
USD User-centered Development
USDA US Department of Agriculture
UX User Experience
WIP Work-in-Progress
XML Extensible Markup Language
XP Extreme Programming
xvi
Abstract
Geographic information systems (GIS) professionals have an impressive and powerful
array of software tools and services at their disposal, yet Web GIS applications do not
consistently meet the expectations of end-user business requirements. This thesis examines an
integrated User-Centered Agile Software Development (UCASD) framework, as a vehicle for
Web GIS application developers to deliver solutions that meet end-user requirements. Methods
employed for this research include consultation of both academic and business literature, case
studies, the design of a UCASD, and the creation of a web application to test the implementation
of the UCASD framework. The goal of this thesis is to create an integrated UCASD framework
for Web GIS design and development that is based on the adaptation of existing Agile-based
methodologies such as Scrum and User Stories. The framework includes GIS-specific design
considerations, an extended planning iteration, and an additional testing period to ensure that the
application satisfies user specifications. The framework is tested through the development of a
GIS web application, the Property Information Application (PIA) for Snohomish County. The
PIA is an educational tool that provides permitting and property development explanations to
citizens in regards to what they can do with their properties. Implementing the UCASD by means
of testing the proposed Web GIS application proved to render a better product tailored to the
specifications of end users.
1
Chapter 1 Introduction
Today, Geographic information systems (GIS) software developers and designers have access to
a powerful and impressive technological toolset that enables them to deliver solutions to
complex spatial problems. However, Web GIS applications do not consistently meet the
expectations of end-user requirements. The user’s involvement with an application encompasses
the entire experience that a user encounters during his interaction with the product. A plethora of
principles for the development and design of software applications exist but have not been well
integrated into practice by the Geographic Information (GI) Science and GIS application
development communities. The future of GIS includes an increasing demand for user-friendly,
interactive web mapping applications. It would, therefore, be beneficial to create a general design
and development framework that GIS software developers could consult to create more
compelling end-user products.
The goal of this thesis is to create and test an interface design and software development
framework for Web GIS applications that builds on existing user-centered design and iterative
software development frameworks to best fit the requirements of spatial applications. The
intention of the framework is to structure the development and design process to yield user-
centric Web GIS applications applicable to a wide audience of Web GIS application developers.
The framework is tested through the development of a Web GIS application – the Property
Information Application (PIA) for Snohomish County. The author is a Snohomish County
employee and has access to the application’s target audience – the actual customers that benefit
from the application. This test application serves as a proof of concept that adherence to iterative
software development and user-centered interface design principles can significantly improve the
user’s experience with interactive web mapping applications.
2
1.1. Motivation
Interactive maps have become an integral part of modern society and are used
ubiquitously for navigation and informative purposes. Roth, Ross, and MacEachren (2015)
suggest that interactive maps serve as the central attraction of many web-based applications due
to the value-added context provided to map-centric applications. These applications thus need to
be attractive and intuitive to encourage user exploration. Web GIS applications often lack a user-
friendly experience as the actual user requirements are not readily reflected in the final
applications (Roth, Ross, and MacEachren 2015). Moreover, there is a lack of user-experience
design standardization in the implementation of web-based geo-portals (Resch and Zimmer
2013).
1.1.1. Iterative Software Development Frameworks and GIS
Agile Software Development (ASD) or Agile is a development philosophy that values
people and interaction over processes and tools, working software is preferred over thorough
documentation, customers are more important than negotiating contracts, and adapting to change
is valued over the strict adherence to a plan (Beck 2001). Frameworks such as Scrum, Kanban,
and Extreme Programming (XP) provide the methodology to implement the Agile philosophy
and represent some of the successful iterative development methodologies adopted in the
software industry (Smartsheet.com 2018). Iterative software development frameworks follow a
software development lifecycle (SDLC) that is repeated in cycles. Iterative software
development features continuous enhancement, short development cycles (usually 2 – 4 weeks),
and regular inspection cycles by end-users. This process enables a development team to be
adaptive and learn from mistakes early in the development stages. The Scrum framework is
based on effective team collaboration, user-centric principles, iterative processes, and adaptable
3
design and development. A Forbes magazine article by Denning (2015) describes the iterative
software development frameworks, and Scrum in particular, as the world’s most popular
innovation engine in use by software industry leaders.
GIS projects are similar to other software development projects in their requirements:
data or information gathering, design, development, implementation, testing, deployment, and
maintenance components (Hyderabad 2013). Cyclical methodologies can therefore be applied to
Web GIS development to ensure performance improvement and the development of more user-
friendly end products.
1.1.2. Application Interface Design and Software Development Concerns in Web GIS
The field of geography has seen dramatic changes due to the rapid advancement of
technology since the 1990s. The Internet became a pervasive medium for delivering geographic
information to the masses, transforming how humans interact with cartographic information.
Roth (2013) defines cartographic interaction as an active conversation between humans and
cartographic information by means of a computer medium. This definition implies that the map
is an equal and active part of the communication exchange (Roth 2013). A two-way
communication narrative with an equal emphasis on the interactive product thus exemplifies the
importance of design and ease of use. Both participants in this conversation, therefore, require
trustworthy communication strategies to communicate effectively.
The current version of the Geospatial Technology Competency Model (GTCM) by the
Urban and Regional Information Systems Association (URISA) indicates that the software and
application development component of GIS accounts for the largest segment of sales in the
spatial industry (DiBiase et al. 2010). The GTCM defines 43 core competencies that define the
geospatial industry and provides a scope of disciplines that form part of the geospatial industry.
4
Out-of-the-box application development platforms facilitate the creation of Web GIS
applications by GIS and other professionals that do not possess software design and development
expertise. Web GIS applications created by amateurs may therefore not comply with
fundamental computer science application design principles and therefore may be difficult to
use.
Roth, Ross, and MacEachren (2015) argue that interactive web maps often violate core
cartographic principles and include difficult to use, unnecessary, and impractical functionality.
Based on my personal experiences as a senior GIS analyst working for local government, I
believe that interactive mapping applications often lack design considerations derived from user
perspectives. Problematic navigation within an application can further add to a frustrating user
experience with the product. Moreover, some Internet users are technically well-informed and
demand a responsive and reliable user experience, while others may find an application too
difficult to learn.
Roth (2017b) argues that user-centered interface design principles be considered in
designing web mapping applications. The design component refers to the visual arrangement of a
web application, along with interaction between individual elements. User-Centered Design
(UCD) involves frequent and iterative user participation with designers during the design stages
of a project. The authors raise pertinent questions regarding usability, including when is it
evident that an interactive map works in terms of utility and usability, what components
contribute to rendering an interactive map as useful and working, and what does the study of
user-centered interface design contribute to cartography? The authors argue that such research
should be focused on the creation of standards for user-centered interface design integration with
interactive maps, case studies in interactive cartography, and the establishment of a user-centered
5
design focus in Web GIS, to name a few. The creation of adaptive design guidelines and
standards that could yield user-focused interactive cartography is placed high on the
geovisualization research agenda.
1.1.3. User-Centered Interface Design Research in Web GIS.
Scholars in the fields of geography (Roth, Ross, and MacEachren 2015), interactive
cartography (Roth 2017), and GIScience (Resch and Zimmer 2013) have identified interface
design and navigational difficulties with interactive web mapping applications. Research
initiatives within these fields are focused on incorporating the application of user-centered
interface design principles to improve the usability of interactive mapping applications.
However, the Web GIS application development community has not widely adopted user-
centered design or iterative software development. One reason for this might be the recent rapid
advances in readily available open source and commercial off-the-shelf Web GIS application
development tools that now dominate the developer scene, flooding the Internet as well as
mobile marketplaces with applications quickly built with standardized templates. In contrast,
both the interface design and iterative software development approaches proposed in this thesis
are quite popular in non-GIS related software development initiatives.
Geospatial Today featured an article in November 2013 that explores the possibility of
integrating iterative software development methodologies for GIS development purposes. The
significance of this article is that the Geospatial industry is in fact investigating iterative
development practices in GIS. Spagnuolo (2008) conducted a survey to analyze adoption of
iterative software development methodologies in GIS practices. 347 GIS professional responders
indicated a 32% adoption of iterative methodologies, where at least two projects have been
successfully developed using iterative methodologies according to this article. Iterative
6
development, incremental delivery, collective ownership, self-managing teams, frequent
stakeholder reviews, a story approach for requirements-gathering, flexible architecture, coding
standards, a list of requirements placed in a log, and code refactoring account for the top
accepted iterative software principles within this study.
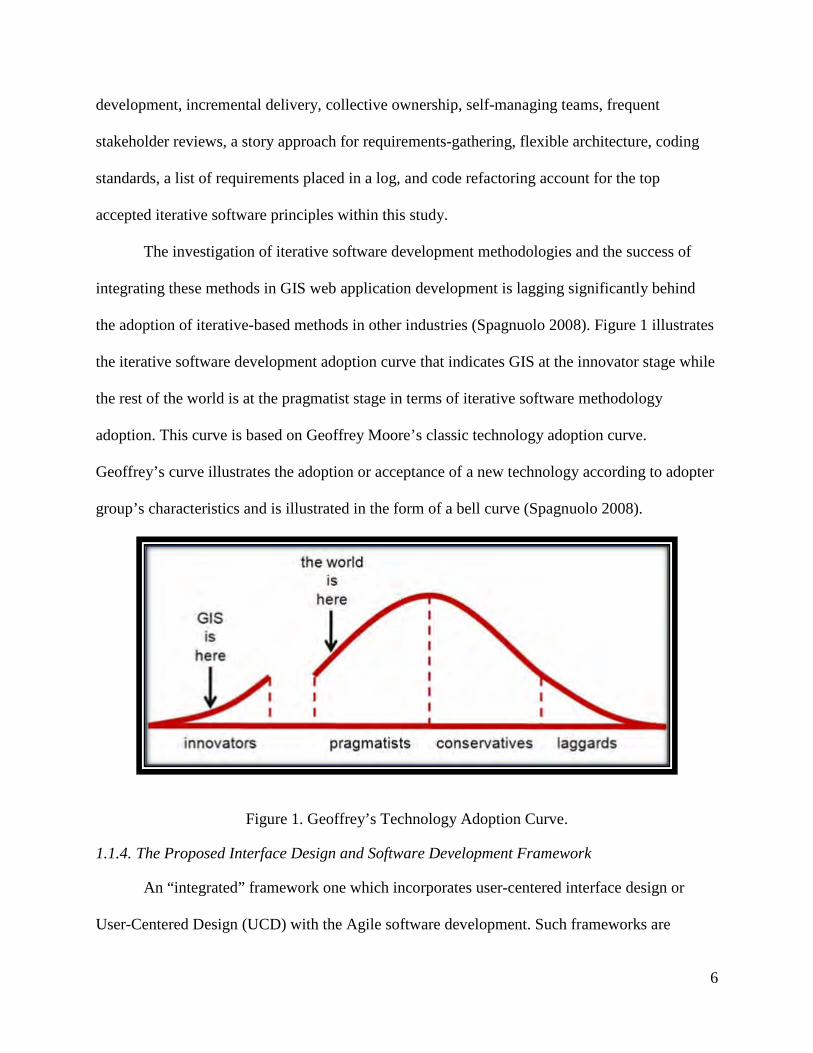
The investigation of iterative software development methodologies and the success of
integrating these methods in GIS web application development is lagging significantly behind
the adoption of iterative-based methods in other industries (Spagnuolo 2008). Figure 1 illustrates
the iterative software development adoption curve that indicates GIS at the innovator stage while
the rest of the world is at the pragmatist stage in terms of iterative software methodology
adoption. This curve is based on Geoffrey Moore’s classic technology adoption curve.
Geoffrey’s curve illustrates the adoption or acceptance of a new technology according to adopter
group’s characteristics and is illustrated in the form of a bell curve (Spagnuolo 2008).
Figure 1. Geoffrey’s Technology Adoption Curve.
1.1.4. The Proposed Interface Design and Software Development Framework
An “integrated” framework one which incorporates user-centered interface design or
User-Centered Design (UCD) with the Agile software development. Such frameworks are
7
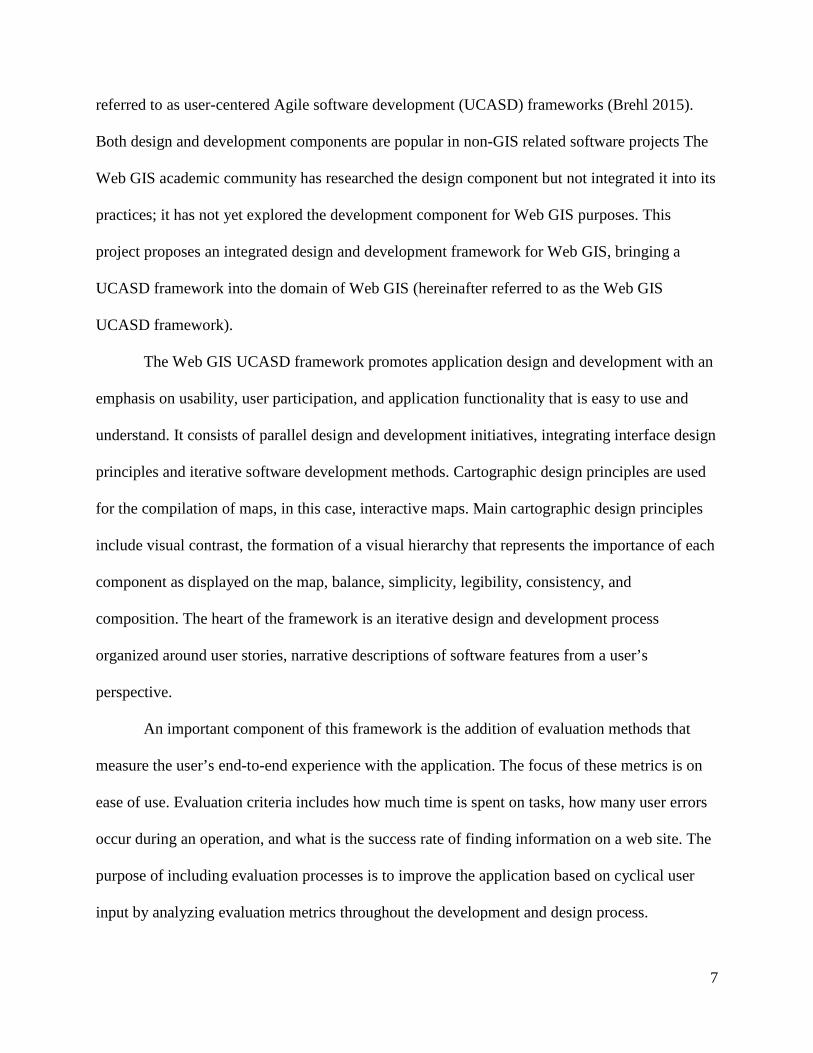
referred to as user-centered Agile software development (UCASD) frameworks (Brehl 2015).
Both design and development components are popular in non-GIS related software projects The
Web GIS academic community has researched the design component but not integrated it into its
practices; it has not yet explored the development component for Web GIS purposes. This
project proposes an integrated design and development framework for Web GIS, bringing a
UCASD framework into the domain of Web GIS (hereinafter referred to as the Web GIS
UCASD framework).
The Web GIS UCASD framework promotes application design and development with an
emphasis on usability, user participation, and application functionality that is easy to use and
understand. It consists of parallel design and development initiatives, integrating interface design
principles and iterative software development methods. Cartographic design principles are used
for the compilation of maps, in this case, interactive maps. Main cartographic design principles
include visual contrast, the formation of a visual hierarchy that represents the importance of each
component as displayed on the map, balance, simplicity, legibility, consistency, and
composition. The heart of the framework is an iterative design and development process
organized around user stories, narrative descriptions of software features from a user’s
perspective.
An important component of this framework is the addition of evaluation methods that
measure the user’s end-to-end experience with the application. The focus of these metrics is on
ease of use. Evaluation criteria includes how much time is spent on tasks, how many user errors
occur during an operation, and what is the success rate of finding information on a web site. The
purpose of including evaluation processes is to improve the application based on cyclical user
input by analyzing evaluation metrics throughout the development and design process.
8
The framework differs from existing UCASD frameworks in three key ways.
1) An extended project inception stage (Iteration 0) to accommodate for GIS interface
design considerations and to allow for comprehensive planning before the start of
active development;
2) The insertion of a GIS-specific interface design component in the design stages; and
3) The addition of a testing stage at the end of the construction iterations that focus on
testing and the identification of necessary future enhancements.
These three differences make the framework more applicable in Web GIS settings than
frameworks developed without consideration to GIS. The following discussion provides a brief
overview of the methods used to develop and test the framework.
1.2. Improving Interface Design and Software Development Processes for Web GIS – The Test Case
This thesis tests the Web GIS UCASD with a test case. The chosen test case, the PIA, is
an application that will improve upon a pilot application that was developed by Snohomish
County technicians without any user input.
1.2.1. The Test Application.
The PIA is designed to provide general information to property owners of unincorporated
Snohomish County. The PIA application’s intent is not to answer all property-related questions
but to serve as a base resource for general customer inquiries on property restrictions.
Furthermore, this application is not a planner review decision support system. It is an educational
tool for individual property owners rather than the development community.
9
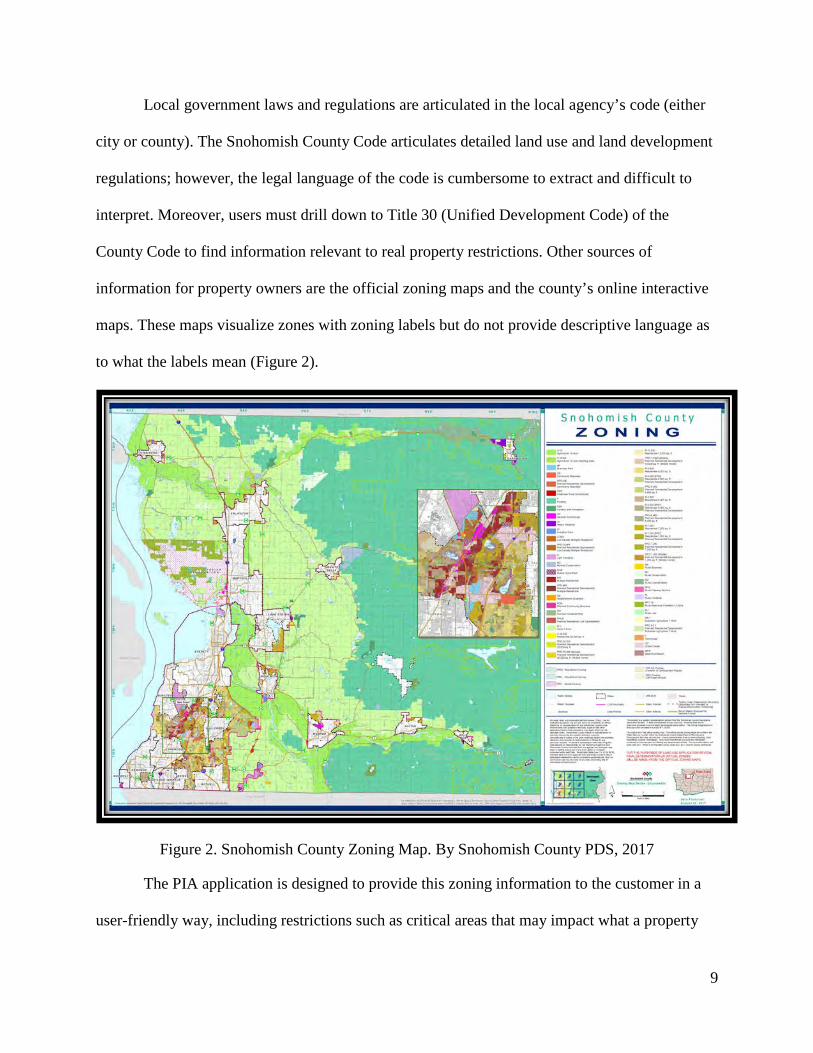
Local government laws and regulations are articulated in the local agency’s code (either
city or county). The Snohomish County Code articulates detailed land use and land development
regulations; however, the legal language of the code is cumbersome to extract and difficult to
interpret. Moreover, users must drill down to Title 30 (Unified Development Code) of the
County Code to find information relevant to real property restrictions. Other sources of
information for property owners are the official zoning maps and the county’s online interactive
maps. These maps visualize zones with zoning labels but do not provide descriptive language as
to what the labels mean (Figure 2).
Figure 2. Snohomish County Zoning Map. By Snohomish County PDS, 2017
The PIA application is designed to provide this zoning information to the customer in a
user-friendly way, including restrictions such as critical areas that may impact what a property
10
owner can do with their property (e.g., flood plain, lahar flows, tsunami inundation, and landslide
hazard areas). The purpose of the PIA is to reduce property-related calls to permit technicians.
General, property-related questions account for about 75 - 80% of call volumes to permit
technicians. Permit technicians that evaluate customer property-related questions along with
actual customers are key participants in determining content for the application. The goal is to
provide a simple explanation of the most prominent designated zones in Snohomish County in
easy-to-understand layman’s terms, thereby reducing the need for customer calls, and to do so in
an intuitive application as a portion of the target users in rural Snohomish County may not be
computer-savvy.
Results of user evaluations determines whether the PIA test application conforms to user
requirements. Proof of concept, measured as success of employing the integrated user interface
design and software development framework, is determined if the test application significantly
improves on the pilot version in terms of utility, usability, and ease of use.
1.2.2. The Pilot Application
The Snohomish County’s PDS - GIS team developed a pilot application with similar
goals of the PIA without consulting end users and with very limited project sponsor input,
project management, or application development structure. The pilot application informs the user
what their zoning is along with links to the County code; however, no explanatory information is
available to guide the user towards a better understanding of property development possibilities.
The pilot version provided the zoning code and zoning abbreviation (that signifies no meaning to
the user), an abstract description, and reference to a planning concept that adds no importance or
meaning to the purpose of the application (e.g., “Transfer of Development Rights Sending
11
Area”), along with a note that points the user to contact the County with little to no added
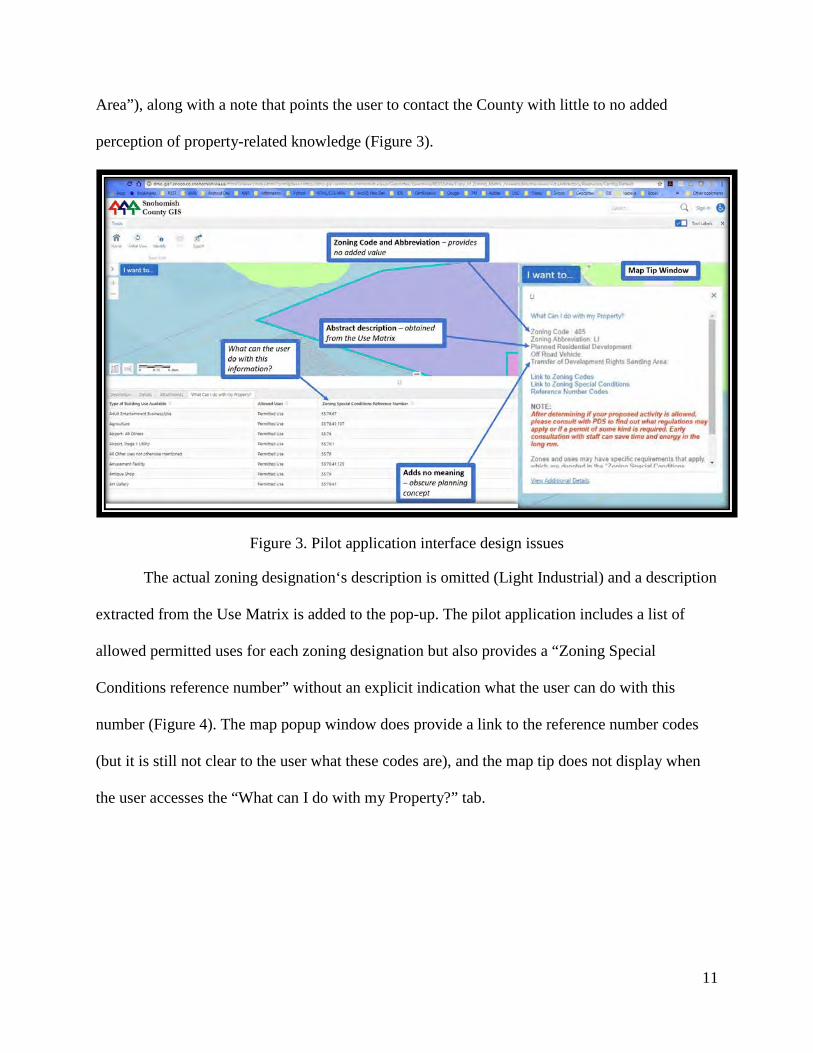
perception of property-related knowledge (Figure 3).
Figure 3. Pilot application interface design issues
The actual zoning designation‘s description is omitted (Light Industrial) and a description
extracted from the Use Matrix is added to the pop-up. The pilot application includes a list of
allowed permitted uses for each zoning designation but also provides a “Zoning Special
Conditions reference number” without an explicit indication what the user can do with this
number (Figure 4). The map popup window does provide a link to the reference number codes
(but it is still not clear to the user what these codes are), and the map tip does not display when
the user accesses the “What can I do with my Property?” tab.
12
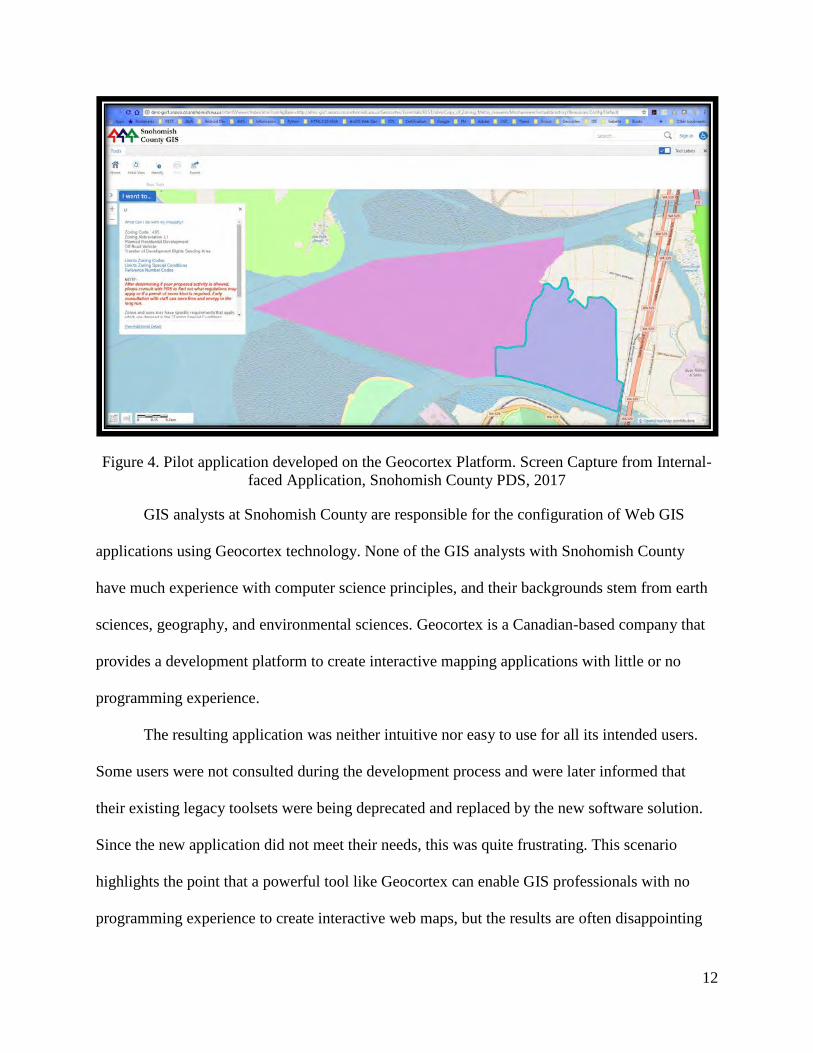
Figure 4. Pilot application developed on the Geocortex Platform. Screen Capture from Internal-faced Application, Snohomish County PDS, 2017
GIS analysts at Snohomish County are responsible for the configuration of Web GIS
applications using Geocortex technology. None of the GIS analysts with Snohomish County
have much experience with computer science principles, and their backgrounds stem from earth
sciences, geography, and environmental sciences. Geocortex is a Canadian-based company that
provides a development platform to create interactive mapping applications with little or no
programming experience.
The resulting application was neither intuitive nor easy to use for all its intended users.
Some users were not consulted during the development process and were later informed that
their existing legacy toolsets were being deprecated and replaced by the new software solution.
Since the new application did not meet their needs, this was quite frustrating. This scenario
highlights the point that a powerful tool like Geocortex can enable GIS professionals with no
programming experience to create interactive web maps, but the results are often disappointing
13
when the delivery is not driven by computer science principles. Many government GIS
professional’s educational backgrounds stems from the natural sciences. Therefore, they are not
equipped to develop Web GIS applications using program-intensive technology as mentioned
earlier.
1.2.3. PIA Comparison with Related Existing Applications
Local Government applications that provide a similar service include the King County
iMap application, Shawnee County’s property search application, the City of Mountain View’s
Zoning District Viewer, and San Francisco’s Property Information Map. However, the purpose
of these applications differs from the PIA in the sense that all property-related information is
provided without a targeted user engagement that aims to educate and explain restrictions in a
user-friendly manner.
Related commercial applications include Accela Permitting software, Zonar – a real-time
interactive zoning code analysis and planning application, Citizenserve Permitting, and the
upcoming Esri - AutoDesk collaborative initiative aimed at bridging the gap between
infrastructure design and GIS mapping. The commercial solutions are decision support systems
that are focused on zoning, permitting, and urban planning and design solutions while the local
government applications serve as data portals that provide information regarding properties
within a specific geographic authority to its customers.
1.2.4. Research Goals
Research goals for this thesis are:
• Design the Web GIS UCASD by consulting the academic and business literature
for generic principles, best-practices, and designs of existing integrated design
14
and development including wire-framing and hybrid-models that are suitable for a
GIS environment.
• Apply the resultant framework towards the development of a test Web GIS
application.
• Evaluate the Web GIS UCASD implementation during the test case and change
the framework as needed.
1.2.5. Thesis Roadmap
The related work chapter (Chapter 2) discusses related research in industry and academia
on application design and development methodologies, including sections on cartographic
design, user-centered design, and iterative software development methods. Chapter 3 articulates
the methods applied to design the Web GIS UCASD and the development of the test application,
and Chapter 4 conveys the results achieved by implementing the designed framework through
the development of the PIA test application. Chapter 5 discusses the framework implementation
and provides future research options, conclusions reached, and problems encountered.
15
Chapter 2 Related Work
Related literature in the fields of cartography and Web GIS explore UCD (design components)
but not Agile software development. Much work has been achieved integrating UCD and Agile
development in the software engineering realm – the key topic being the parallel integration of
interface design with software development – but the integrated work has not heretofore been
taken up in Web GIS. This chapter explores related work in online cartographic design, User-
Centered Design (UCD), Agile-based development frameworks such as Scrum, integrated UCD
design and ASD development (UCASD) initiatives, and ArcGIS Online interactive web
application configuration options.
2.1. Online Cartographic Design
Cartographic design principles urge a mapmaker to consider the intent and purpose of a
map as well as the concepts of visual hierarchy, simplicity, balance, and composition. This
section provides a short summary of research on the transition of traditional cartographic design
principles to the realm of online mapping.
A user-friendly Web GIS application should be designed to serve a target audience and
should not aim to provide all the available information in one single application (Fu and Sun
2011). Users should not be flooded with a plethora of data layers, features, and an abundance of
tools that serve multiple purposes. It is important to hide complexity, to provide just the
necessary tools and functionality that serves a well-defined purpose and all terms used should be
self-explanatory (Fu and Sun 2011). Moreover, Fu and Sun (2011) state that Web GIS
applications should be designed with a workflow in mind that guides users through the
application. Navigating through an application should not be judged on the number of clicks but
by how easy it is to find the right place to click for desired information (Fu and Sun 2011). These
16
notions commonly overlooked by the Web GIS community. A workflow that guides Web GIS
design and development is a necessary component that this thesis aims to put forth in the form of
an integrated interface design and software development framework for implementation during
Web GIS application development efforts.
Web GIS designers faces multi-objective design decisions in the creation of interactive
maps. Amateur geographers can create interactive maps due to available configuration
technology that enables anyone to author maps (Xiao and Armstrong 2012). These amateurs are
referred to as neo-geographers. Neo-geographers are people with no idea about cartographic
design principles and whom lack formal cartographic map design training. Web GIS applications
present an additional level of design complexity over static maps as cartographic design need to
be considered at every zoom level. Xiao and Armstrong (2102) propose a multi-objective GIS
design plan where the map maker (and notably neo-geographers) can choose the desired plan that
renders the best outcome to provide design direction.
The concept of trust can be used to evaluate online Web GIS applications. Users trust
websites that are easy to navigate and that provides straightforward access to pertinent
information. Trust guideline components are classified into five design dimensions: graphic,
content, structure, functionality, and trust cue – all of which is intended to improve Web GIS
user interfaces (Skarlatidou 2013). Trust-oriented interface design potentially induces trust
amongst users and minimize risk. Web GIS interface design should include trust guidelines to
protect users from inadvertently basing decision-making and perceptions on the inappropriate
use of web-based GIS applications (Skarlatidou 2013). The importance of screen size and the
organization of the GIS interface and other GIS-specific work environment parameters are
essential components to consider in evaluating interface success (Hacklay and Zafiri 2008).
17
Screen size contributes to added complexity in Web GIS development and design. Techniques
deliberated in these studies must be considered within a development and design framework as
such considerations ensures that Web GIS applications render on a variety of screen sizes and
that users can trust information that is presented within the application.
Other cartographic design components that could further be enclosed in a GIS Design
Plan include effective menu structuring options (Skarlatidou 2013), appropriate use of map color
combination that promotes trust (Skarlatidou 2013), the inclusion of a data disclaimer
(Skarlatidou 2013), design standardization (Xiao and Armstrong 2102), and the mindful use of
legends that support user needs (Skarlatidou 2013).
2.2. User-Centered Design
UCD involves the layout and interaction components of the User Interface (UI) of a web-
based application. It considers the user’s experience with the product and ensures that end-user
goals remains the focus of system design (Brhel 2015). The UI is the look and feel of an
application, and user experience (UX) is the end-to-end customer encounter with the application.
User experience/user interface (UX/UI) design work has commonly occured separately from
software development efforts (Salah, Paige, and Cairns 2014). It is important to understand the
difference between system design and UX/UI design. UX/UI design is a design activity that
involves the layout and interaction elements of the application, while system design comprises of
several software development-related activities such as the creation of component architecture –
and sequence diagrams which are abstract software system modeling tools that depict system
components and interactions.
The addition of UCD components in a design and development framework ensures that
customer needs are not ignored. It is the customers that interact with your system, and it is
18
customers that may or may not use the application in question, depending on the value that an
application contributes to user needs.
2.2.1. Relationship between Usability Components
Usability as a discipline is deeply rooted in scientific knowledge and is not a subjective
component in software development (Lowdermilk 2013). Usability is focused on ease of use and
accentuates an interface’s ability to provide intuitive methods for accomplishing tasks from a
user perspective (Issa and Isaias 2015). Human-computer interaction (HCI) is the discipline that
studies how people interact with technology and is deeply ingrained in usability. HCI focuses on
the user as an integral contributor to design, development, and implementation of software
systems and further provides evaluation strategies to analyze cognitive factors during
engagement (Issa and Isaias 2015). UCD emerged from HCI and emphasizes software design
methodologies aimed at delivering applications that meet user needs (Lowdermilk 2013). Figure
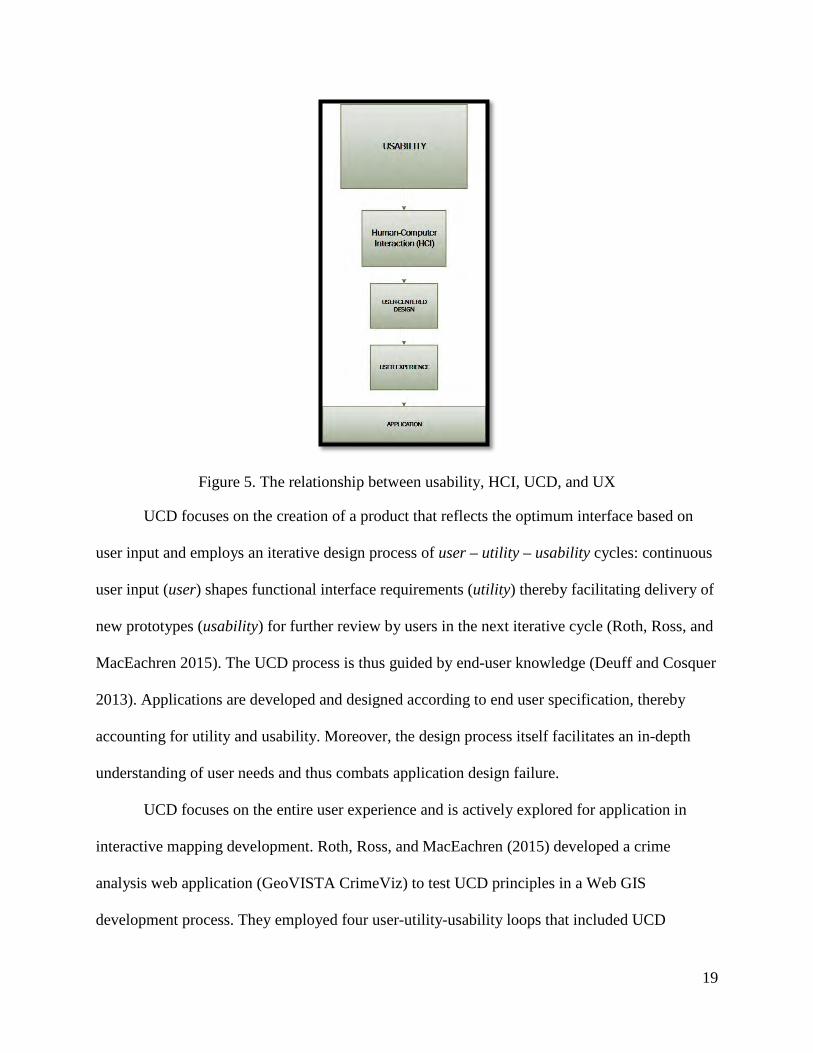
5 illustrates the relationship between all the usability components (Lowdermilk 2013).
19
Figure 5. The relationship between usability, HCI, UCD, and UX
UCD focuses on the creation of a product that reflects the optimum interface based on
user input and employs an iterative design process of user – utility – usability cycles: continuous
user input (user) shapes functional interface requirements (utility) thereby facilitating delivery of
new prototypes (usability) for further review by users in the next iterative cycle (Roth, Ross, and
MacEachren 2015). The UCD process is thus guided by end-user knowledge (Deuff and Cosquer
2013). Applications are developed and designed according to end user specification, thereby
accounting for utility and usability. Moreover, the design process itself facilitates an in-depth
understanding of user needs and thus combats application design failure.
UCD focuses on the entire user experience and is actively explored for application in
interactive mapping development. Roth, Ross, and MacEachren (2015) developed a crime
analysis web application (GeoVISTA CrimeViz) to test UCD principles in a Web GIS
development process. They employed four user-utility-usability loops that included UCD
20
methods such as prototyping, empirical testing, and iterative design. Then they categorized
interface evaluation methods into three groups: expert-based methods, theory-based methods,
and user-based methods. Interface success represented a balance of utility and usability (Roth,
Ross, and MacEachren, 2015). The UCD approach used and refined by Roth, Ross, and
MacEachren (2015) provides an interface evaluation framework that includes guidelines as to
which applicable evaluation method to employ. These evaluation methods are based upon input
and feedback loop characteristics, evaluation goals, and user access.
2.2.2. User-Centered Design Methods
UCD approaches and adaptive design guidelines for interactive maps, along with an
iterative design approach and the importance of user involvement in the design process are
important considerations to incorporate in a Web GIS UCASD. This section discusses UCD
methods such as design planning, design requirements-gathering, and design evaluation
activities.
2.2.2.1. Design planning
An information architecture (IA) diagram, a UCD design planning activity, is a technique
for organizing, structuring, and labeling the content and pages of the application. The purpose of
creating an IA is to ensure that web content and pages are presented and consumed in a manner
that is structured and user-friendly. Interaction design (design planning activity) examines and
prescribes the interaction between the end-user and the application. Information architecture
along with interaction design illustrates the structural layout of the application. Software
interaction considerations included how users could physically interact with the user interface
(such as mouse clicks, mouse wheel, stylus, or finger), user interface appearance that may have
21
provided interaction cues (color, shape, size, underline), error messages, and feedback messages
(Siang 2018).
2.2.2.2. Design evaluation tools
Usability testing, affective computing, focus group meetings, and wireframe prototyping
are effective UCD evaluation tools (Tullis and Albert 2013). Usability testing involves actual
users that evaluate how intuitive an application is. Usability testing further involves the use of a
pre-designed script to guide the testing efforts. Affective computing involves the measuring or
observance of human emotions while using a product (Tullis and Albert 2013). Focus groups are
traditionally used in marketing research, but can be used to assess software-based products as
well. A focus group setting facilitates a guided discussion where focus group participants
evaluate an application’s end-to-end functionality after or during design/development cycles.
Usability testing, affective computing, and wireframe prototyping tools form part of focus group
evaluation sessions.
2.2.2.3. Wireframe prototypes: design-requirements gathering and design evaluation tool
A wireframe is a UCD design requirements-gathering component that serves as a
schematic representation of a website page and provides a skeletal framework that indicates
where all the page components are placed. Wireframing is also used to iteratively improve the
design of application components. Roth (2017a) argues that wireframes can be effectively used
as a prototyping tool in the UCD process to solicit user feedback. This technique provides a
cheap, low-fidelity, and rapid iterative approach to UI design. Low-fidelity prototypes are
wireframe sketches that mimic a final design. These prototypes can be enhanced to represent
more information that specify the navigational flow of the application (medium fidelity) while
high-fidelity prototypes refer to a fully-functioning site. How the construction of these high-,
22
medium-, and low-fidelity wireframes can be generated through continuous user input to
facilitate user-specific elements in the design process was explored as part of this thesis work.
The construction of wireframe prototypes can become part of a Web GIS UX/UI design plan and
can be effectively used to capture UX/UI system requirements.
Roth (2017a) employed wireframe prototypes to evaluate representation and interaction
of a GIS web application. High-fidelity wireframes focused on the representation component
while low-fidelity wireframes analyzed the interaction component. The authors selected eighteen
users from diverse educational and geographic backgrounds to evaluate the wireframes with
cognitive walkthroughs. A cognitive walkthrough is a software usability evaluation method that
aims to establish how new users experience the learning of a software system. This method
evaluates a system’s ease of learning by users that are not familiar with the system in question.
The process starts with a predetermined set of tasks that the user should follow. The evaluator
records the user’s actions based on a list of questions that provides answers on how the user
achieve the desired outcome. Data from these evaluations were analyzed to determine interface
success. This process initiated integral changes to the interactive application. This study
promotes the use of wireframes in UI development and provides a systematic evaluation process
by means of a cognitive walkthrough method and data analysis generated by the participants.
2.2.3. The Elements of User Experience
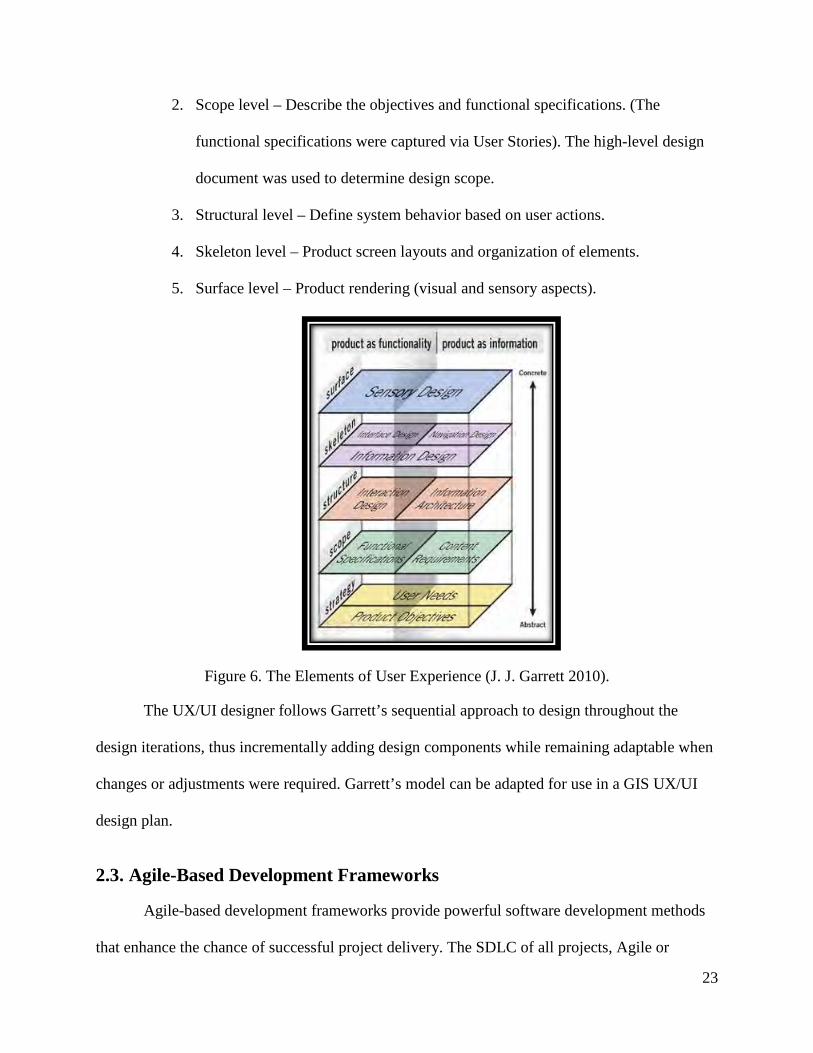
The elements of user experience refer to a design development model by Garrett (2010).
This model moves through the design process starting with abstract components and moving
towards the concrete (Figure 6). The five design levels as articulated by Deuff and Cosquer
(2013) are:
1. Strategy level – Define user requirements and research product objectives.
23
2. Scope level – Describe the objectives and functional specifications. (The
functional specifications were captured via User Stories). The high-level design
document was used to determine design scope.
3. Structural level – Define system behavior based on user actions.
4. Skeleton level – Product screen layouts and organization of elements.
5. Surface level – Product rendering (visual and sensory aspects).
Figure 6. The Elements of User Experience (J. J. Garrett 2010).
The UX/UI designer follows Garrett’s sequential approach to design throughout the
design iterations, thus incrementally adding design components while remaining adaptable when
changes or adjustments were required. Garrett’s model can be adapted for use in a GIS UX/UI
design plan.
2.3. Agile-Based Development Frameworks
Agile-based development frameworks provide powerful software development methods
that enhance the chance of successful project delivery. The SDLC of all projects, Agile or
24
traditional, includes a project vision, project inception where requirements gathering takes place,
design, implementation, testing, deployment, and maintenance. Agile-based projects includes
iterations or cycles within the development construction stages and favor UCD principles for
design purposes. The design component is also approached in a cyclical process. The
construction cycles in Agile SDLC follows planning, development, testing, and evaluation stages
for a set of features that would render a functional, working product and is repeated until the
product exhibits the desired functionality.
2.3.1. The Scrum Development Framework
The Scrum framework (hereafter referred to as Scrum) provides the processes to
implement the Agile philosophy. The Agile philosophy is based upon a set of principles that is
laid out in the Agile Manifesto (a formal proclamation of Agile software development values and
principles) and include the customer as a central consideration, adaptation to changes that arise
during development, the delivery of working software on a frequent basis, continuous attention
to technical excellence, self-managing teams, and regular sessions where the team reflects on
increasing team efficiency.
2.3.1.1. Team roles and user research
Pure Scrum favors project roles for a Product Owner (PO) and a Scrum Master, but a
Project Manager and a senior manager as the PO can also be used. The team structure of an
Agile project can vary significantly depending on the size of the project and the preference of
Agile practitioners. This section discusses the key Agile team roles such as the PO, Customer
Team, Scrum Master, and the Design team.
Other project stakeholders normally appoint the PO role. A PO is a key stakeholder in a
project that is responsible for project vision and for communicating that vision to the team and
25
other stakeholders. The project vision serves as a solution to a problem. The problem, or need for
a solution, can be identified by directors, managers, supervisors, or other staff. The project vision
is a brief statement that articulates the desired future state of the final application that is the
solution to the problem (Rubin 2013). The PO role further provides leadership and is viewed as
the pivotal central point for every component of the project (Rubin 2013). The PO is also
responsible for defining product content and articulating project goals. The PO normally refers to
one individual; however, subject matter expert (SME) knowledge can also be consulted on a
regular basis to guide decision-making (Deuff and Cosquer 2013). SME knowledge that is often
drawn upon by the PO includes the UX designer, Systems Architect, marketing research expert,
business case development analyst, and the Scrum Master. Appointing SME advisors are not a
necessity but a good principle to ensure that the PO exercises good judgment and is informed.
The key consideration for PO selection is decision-making authority. Traditional or non-Agile
based teams do not have this role. Managers are in control in traditional project management and
customization is therefore not the norm as in Agile project management.
The PO and product team members identify actual customers that are part of the potential
target audience to serve as members of the product Customer Team. The purpose of the
Customer Team is to engage in a discussion with the PO and other product team members to
establish requirements for the new application. Access to real customers can be a challenge and
product team members are sometimes forced to rely on customer proxies. A customer proxy is a
person that possesses characteristics like an actual customer and is used when actual customers
are difficult to engage in constant feedback loops. A customer proxy should never be a manager
or a developer, but rather a sales or a marketing person. This process is facilitated through the
identification and creation of end-user Personas. A Persona is a user archetype that exhibits the
26
ethnographic specifications of an actual user (Rubin 2013). A Persona provides comprehensive
insight into an imaginary representation of an actual end-user that reflects the product’s target
audience. The goal is to aggregate individual end-users and refine the roles in groups. Each
Persona represents a group of users.
The Scrum Master is a servant leader who focuses on facilitating the daily activities in
the Sprint. A sprint is an iteration and normally consists of two to three weeks. The Development
Team is normally responsible for the appointment of the Scrum Master. The Scrum Master acts
as a coach and the main function is to ensure that nothing impedes the development process. The
Scrum Master further acts as an interference shield and a change agent (Rubin 2013). The Scrum
Master does not inherently possess hiring and firing authority but is bestowed with process
authority and single-threaded ownership for managing the Sprint activities and execution. In pure
Scrum projects, project management activities are typically spread amongst the PO, Scrum
Master, and Development Team; however, organizations with complex, multi-team development
efforts, may retain a Project Manager to manage the project planning activities and coordinate
the various cross-group dependencies (Rubin 2013). The Scrum Master is responsible for
facilitating the daily scrum, the sprint retrospective, and sprint review sessions. The daily scrum
is a quick session where each team member articulates what they did the day before, what they
plan to do on the day, and if there is anything that could obstruct their actions of the day. The
sprint review is concentrated on the product under development during that sprint while the
sprint retrospective concentrates on the process used to create the project (Rubin 2013). The
Scrum Master is further responsible for team cohesion, team motivation, improvement of team
dynamics, communication between dependent teams, coaching the PO, and serves the team
where needed. A supervisor reports project progress to business leaders, focuses on the

27
processes, allocate tasks, prioritize assignments, and coordinates between other dependent teams.
Some supervisors are also responsible for risk management and budget allocation; however, a
project manager normally handles these tasks. The main difference between the Scrum Master
role and traditional supervisory/management role is that the Scrum Master recognizes the
competency of the team and is more of a facilitator than a process manager or task allocator.
The Design Team is typically comprised of a UX designer, a graphic designer, and an
information architect, but may also include an interaction designer and an evaluating ergonomist,
depending on team size (Deuff & Cosquer 2013). The UX designer is primarily engaged in user
research, the organization of content, and copywriting. The graphic designer considers all visual
aspects of the product while the interaction designer is focused on screen position within an
application and how navigation flows between components. The interaction architect is
responsible for the organization of information and how users can access that information. The
evaluating ergonomist engages with users to solicit UI feedback. Some of these roles can be
performed by a single individual (UX design and interaction design), but depending on the scale
of the project, these roles may be assigned to individual contributors.
Scrum-based Development and Design Teams are self-organized, accountable, and
possess skillsets that are cross-functionally diverse and sufficient enough to create a product
increment (Schwaber & Sutherland 2016). Team size depends on the project and normally range
between three and nine members to facilitate optimum interaction and communication. The
Scrum Master and PO are normally not part of the Development or Design Team. Large projects
are comprised of several scrum teams, where each team is responsible for a feature (feature
team) and warrant a separate quality assurance (QA) and quality control (QC) team (Rubin
2013). The design, development, and testing teams fulfill the same functionality in Agile projects
28
and non-Agile projects. The major difference is that Agile-based teams are smaller and are self-
managing in terms of their work delivery.
2.3.1.2. Scrum components
Scrum consists of iterative cycles, or sprints, with the goal to deliver a potentially
shippable product at the end of each iteration. A potentially shippable product is one that is fully
functional. The Scrum process starts with the formation of a prioritized “Product Backlog” – a
list of all user requirements and all planned software features that ultimately meet these
requirements. These user requirements are translated to User Stories. User Stories represent a
single software feature that is prioritized and placed within the Product Backlog. A selection of
these features is passed to each sprint for development. The process is repeated until all the
Product Backlog features are processed.
Establishing and grooming the Product Backlog is a collaborative effort that is achieved
by the PO, the Scrum Master, all stakeholders, and the Development Team. The Scrum Master’s
role is to facilitate communication between all team members. The Product Backlog is organized
and ranked, and work is spread amongst pre-determined iterations with the high prioritized items
placed in Iteration 1 and lower prioritized items in Iteration n. Grooming of the Product Backlog
entails reprioritization of some of the items and the refinement of at least three stories prior to the
construction iterations and before each iteration. The term “grooming” is used to articulate the
prioritization of feature requirements. Grooming in Agile refer to deciding what features take
priority for development.
The refinement and grooming of the Product Backlog lead to the visualization of the full
scope of each iteration and release. The top Product Backlog items that are ready for
development is referred to as the Definition of Ready. These items are then ready to be moved
29
into the sprint backlog to enable successful sprint completion (Rubin 2013). All these activities
are then managed within the project management tool. Product Backlog Items (PBI) are
essentially the User Stories that are ranked in the Product Backlog.
The prioritization of the backlog is accomplished according to DEEP criteria established
by Mike Cohn and Roman Pichler (Rubin 2013). DEEP stands for Detailed appropriately,
Emergent, Estimated, and Prioritized. The use of DEEP criteria facilitates an effective Product
Backlog. Detailed appropriately means PBIs are detailed and ranked for development in early
sprint iterations, with larger-sized items are placed toward the bottom of the backlog (Rubin
2013). Emergent emphasizes the adaptability of the Product Backlog and the PBI’s. The Product
Backlog structure is therefore dynamic and can be emergent to changes that arise over time
(Rubin 2013). Estimated refers to the estimation of stories as discussed in an earlier section, but
also extrapolates that the size of a story or PBI affects the PBI’s ranking within the Product
Backlog. Prioritization points to the ranking of the PBI in the backlog. Ranking of the PBI’s are
viable to accomplish for early sprints, but the ranking of PBI’s in subsequent sprints can be
postponed and accomplished during sprint planning and backlog grooming sessions.
The Definition of Done or DOD is a checklist generated by the team to indicate whether a
sprint can successfully be described as complete. The potentially shippable product is checked
against the DOD. The DOD should produce a complete portion of product functionality that
includes design components, development, integration, testing, and documentation (Rubin 2013).
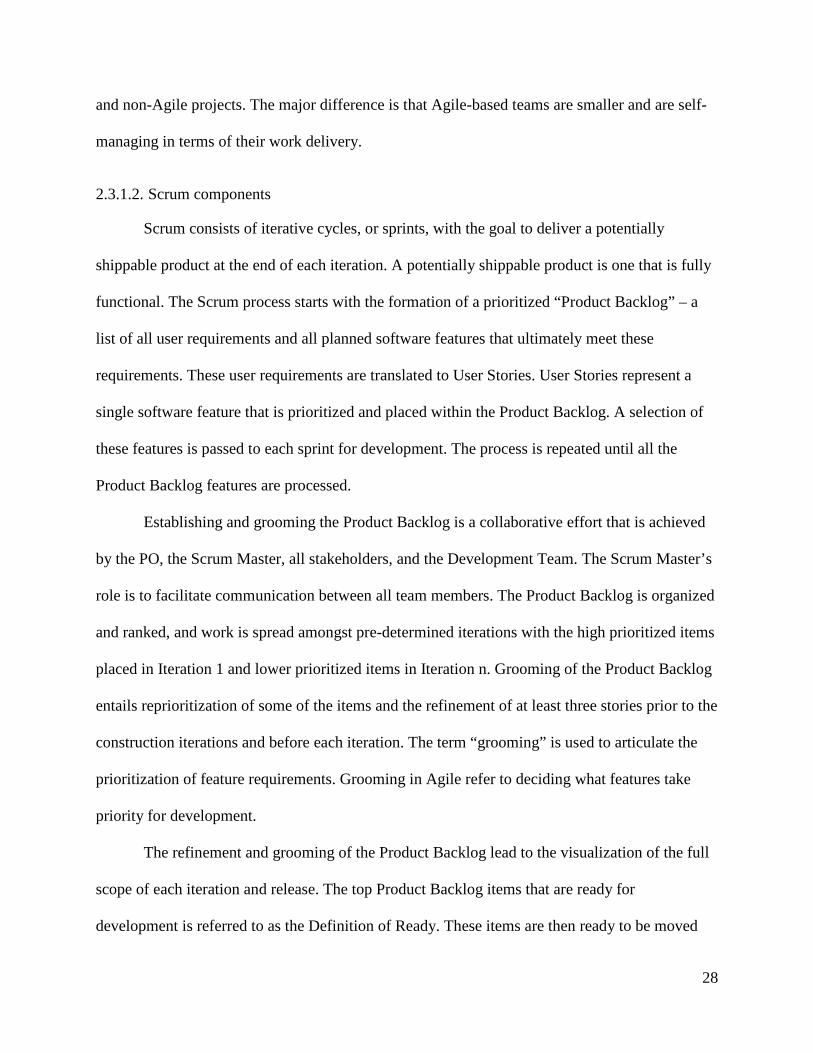
A software release comprises multiple sprints that are carefully orchestrated through the
creation of the Product Backlog. Each iteration starts with sprint planning where the sprint
backlog is groomed for the iteration’s development (Figure 7 – 1). Sprint execution can be
viewed as a sub-project as the Development Team strives to achieve the potentially shippable
30
product for that sprint / iteration Figure 7– 2). Sprint execution includes a short daily scrum that
facilitates communication within the team. Each sprint concludes with a sprint review (Figure 7
– 3) and a sprint retrospective (Figure 7 – 4). The sprint review is sprint-focused while the
retrospective is project-focused.
Figure 7. The Development Team responsibilities within the scrum framework as illustrated by Kenneth Rubin, “Essential Scrum”, 2013.
2.3.2. Agile Requirements-Gathering: User Stories
User Stories provide a customer-centric perspective of the functional requirements. User
Stories can be used for scheduling work and to define project scope (Cohn 2004). Each User
Story describes a specific feature of a system.
2.3.2.1. Creating User Stories
The process of creating User Stories involves the capturing of ideas on paper cards. The
cards are grouped into themes and moved around until a logical flow is achieved. Each theme
translates into a specific product capability and represents a single feature. Larger stories (Epics)
are progressively refined and broken down into smaller stories. The User Story template is
31
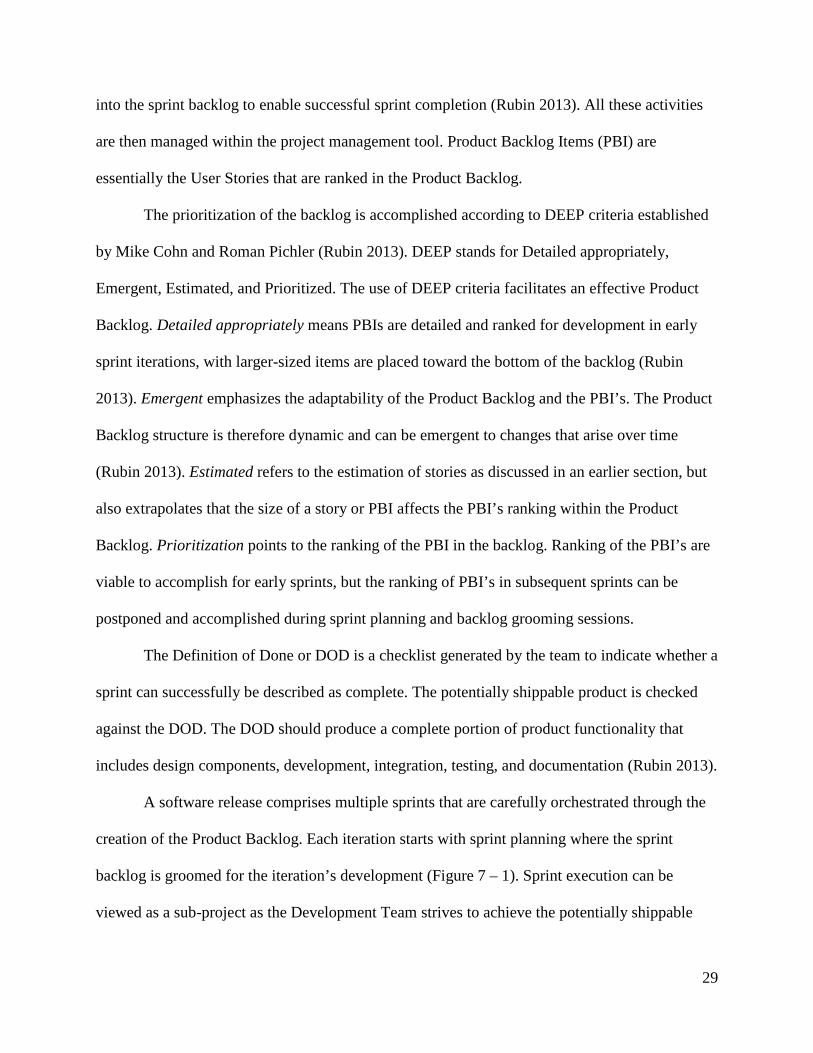
narrated as such: As <type of user>, I want <goal> so that <benefit>. Acceptance Criteria are
recorded on the back of each card. Acceptance Criteria clarify conditions of satisfaction and
clarification of desired behavior of the resultant feature (Rubin 2013). Acceptance Criteria are a
set of conditions specific to a User Story that a web application must have before that User Story
can be marked as complete. Acceptance Criteria further render a story testable and morphs into
the starting point for writing test cases (see the sample explanation and Figure 8).
Figure 8. Test Case created from Acceptance Criteria.
Figure 8 displays a sample User Story: “As a single property owner, I need to view a map
of my zone within a rural zone type.” One Acceptance Criteria for this story says that when the
user views resource information and the user selects to view a designated zone within the
resource zone type, then the application must re-direct the user to a Resource map that displays
and lists all the zones that are part of the resource zone type. The application must also display a
map legend. The test case in turn, articulates the Acceptance Criteria stipulation into an action
32
that is executed by the application. The test cases provide a script that testers use to test the
expected action(s) listed in the expected test case results. For example, the user selects to view a
designated zone in Resource information – the expected results executed by the application are:
the application displays the Resource map where the zones are located, lists the Resource zones,
and displays a legend. The User Stories and Acceptance Criteria are electronically captured
within a project tracking and management tool that facilitates Agile methodology project
management.
2.3.2.2. Evaluating User Stories
User Stories are evaluated by means of INVEST criteria before being entered the project
tracking tool. The INVEST criteria are Independent, Negotiable, Valuable, Estimable, Small, and
Testable characteristics (Rubin 2103). The INVEST criteria ensure that User Stories accomplish
intended goals. The intent of each goal is to represent an important component of a system with
its intended functionality while remaining adaptable. A User Story must be independent (or at
least loosely coupled with other stories) as highly dependent stories complicates estimation,
prioritization, and planning (Rubin 2013). User Stories must be negotiable as it does not
represent a static requirements document, but rather a continuous conversation that captures the
essence of the business functionality and why that functionality needs to be included (Rubin
2013). Valuable stories articulate the value that the component provides to the PO and
stakeholders in non-technical language, estimable indicates the work in terms of effort, time, and
cost components of a functionality, small refers to stories that are appropriately sized for
completion within the iteration, and testable denotes a story with appropriate acceptance criteria
such that a satisfactory completion state can be clearly identified (Rubin 2013).
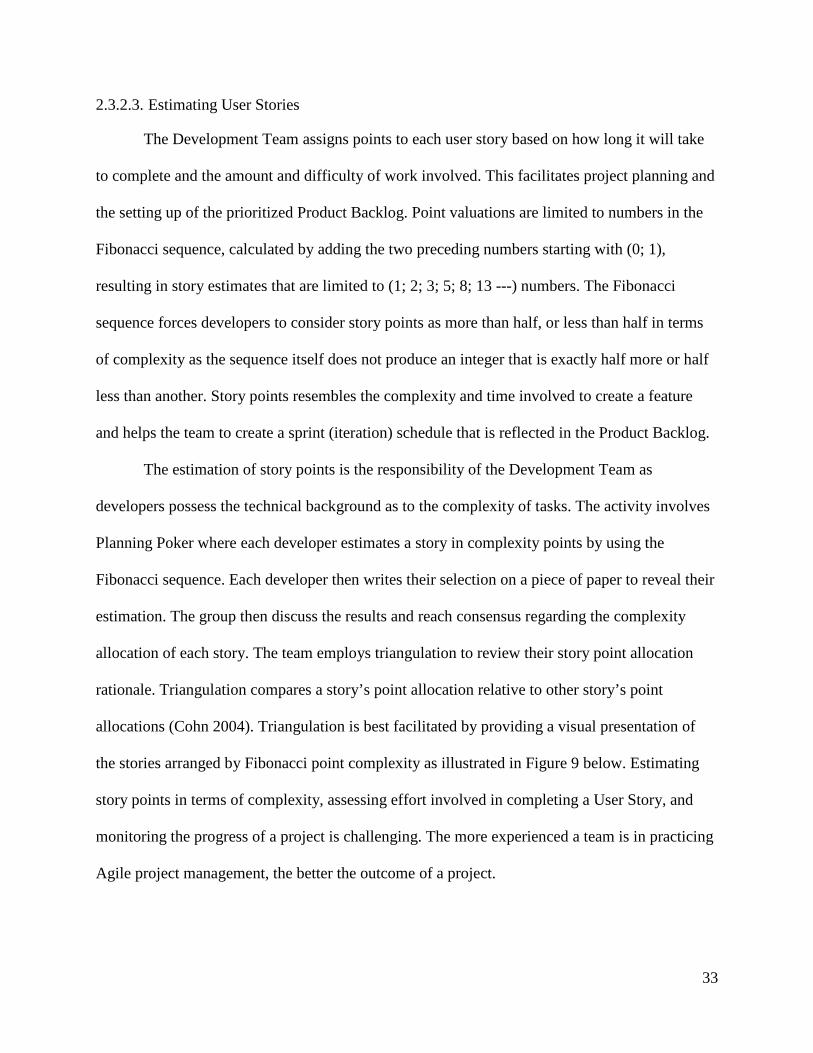
33
2.3.2.3. Estimating User Stories
The Development Team assigns points to each user story based on how long it will take
to complete and the amount and difficulty of work involved. This facilitates project planning and
the setting up of the prioritized Product Backlog. Point valuations are limited to numbers in the
Fibonacci sequence, calculated by adding the two preceding numbers starting with (0; 1),
resulting in story estimates that are limited to (1; 2; 3; 5; 8; 13 ---) numbers. The Fibonacci
sequence forces developers to consider story points as more than half, or less than half in terms
of complexity as the sequence itself does not produce an integer that is exactly half more or half
less than another. Story points resembles the complexity and time involved to create a feature
and helps the team to create a sprint (iteration) schedule that is reflected in the Product Backlog.
The estimation of story points is the responsibility of the Development Team as
developers possess the technical background as to the complexity of tasks. The activity involves
Planning Poker where each developer estimates a story in complexity points by using the
Fibonacci sequence. Each developer then writes their selection on a piece of paper to reveal their
estimation. The group then discuss the results and reach consensus regarding the complexity
allocation of each story. The team employs triangulation to review their story point allocation
rationale. Triangulation compares a story’s point allocation relative to other story’s point
allocations (Cohn 2004). Triangulation is best facilitated by providing a visual presentation of
the stories arranged by Fibonacci point complexity as illustrated in Figure 9 below. Estimating
story points in terms of complexity, assessing effort involved in completing a User Story, and
monitoring the progress of a project is challenging. The more experienced a team is in practicing
Agile project management, the better the outcome of a project.
34
Figure 9. Story Cards pinned to a wall to facilitate Triangulation. Table by Mike Cohn, “User Stories Applied,” 2013.
Story point estimation can be used to later judge a Development Team’s velocity. The
amount of story points is usually equally spread amongst iterations and therefore indicates a
team’s development velocity. A team’s velocity conveys meaning provided all other variables
within a team remains constant, such as work hours, team skillset, and available resources
applied to the project. Moreover, a developer team’s velocity can provide the PO with insight
into feature complexity and time needed to complete a feature in terms of development.
2.3.3. Challenges that Agile Practitioners Face
Story point estimation is a challenging task, especially for novice Agile practitioners
(Sharma 2017). Project documentation to facilitate maintenance can also be problematic due to
limited planning ahead of construction iterations. Agile methodologies promote documentation
that provides only the necessary detail and is generated in a just-in-time manner (Linders 2014).
The monitoring of project progress is difficult as progress is measured across iterations (and not
measured sequentially). Writing User Stories is complicated because the author needs to place
35
himself in the position of the user without transferring bias into the Story. User Story estimation
is challenging when a team’s velocity is not known (Cohn 2004). Estimation is not always
objective as variables such as the skill level of the team, the efficiency of team collaboration, and
the accuracy of system requirements-gathering can significantly alter the perceived duration and
difficulty of a Story. Story estimation itself is therefore based upon assumptions when the
development and design teams responsible for the product are not familiar with Agile process or
are newly-formed teams (whether the team has experience or not). These activities require
practice and team cohesion where every team member participates. Successful Agile teams and
their members normally experienced these stages and are familiar with the abilities and skills of
their colleagues.
2.3.4. System Design – Development Activity
System design is a development activity that establishes a high-level understanding of
application components and identifies down-stream dependencies that are not within the control
of the Development Team. Activities that facilitate system design include Component and
Sequence diagrams. Both these diagrams stem from Unified Modeling Language (UML). UML
provides standardized tools to model the visualization of a system (Tutorialspoint 2018). A
Component diagram indicates all the system components that are required for creating a software
application, including sub-components and dependencies. A Component diagram describes all
the components that are needed to provide the software application with desired functionality
(Tutorialspoint 2018). A Sequence diagram is a behavioral diagram that indicates how system
components interact with each other in time sequence by means of messages that are sent form
one component to the other to activate a certain event (Tutorialspoint 2018). For example, the
user requests email messages. The user’s computer sends the email message request to the email
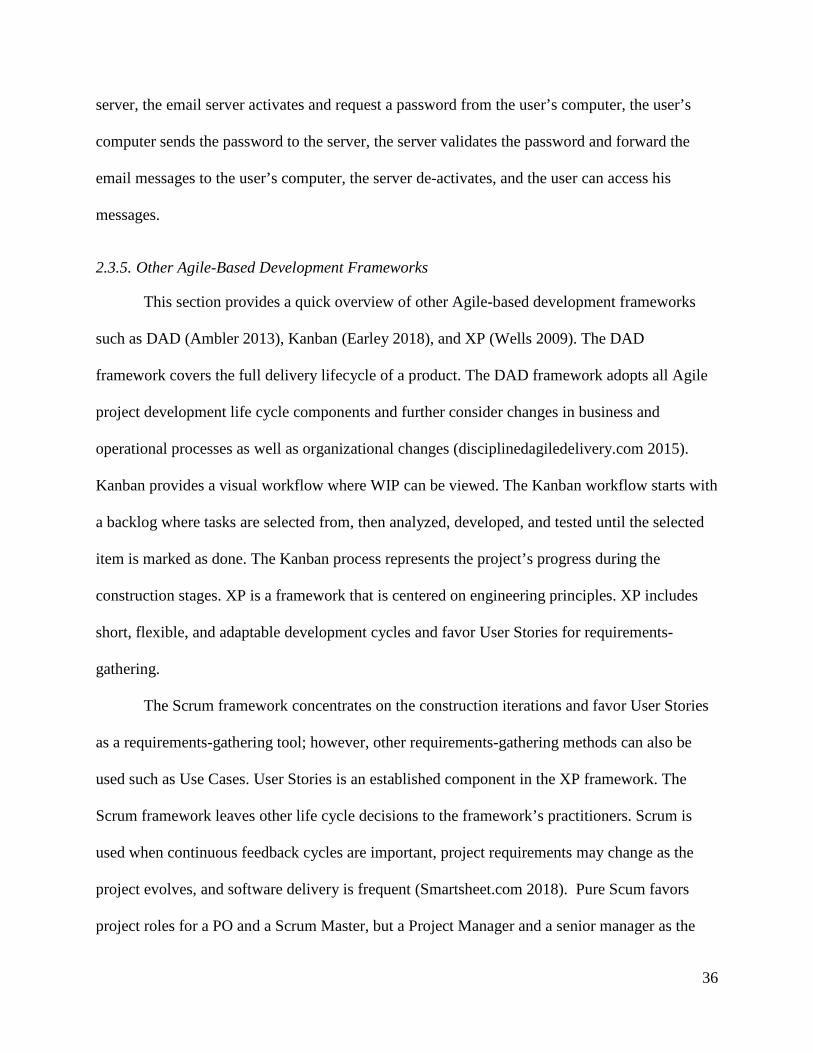
36
server, the email server activates and request a password from the user’s computer, the user’s
computer sends the password to the server, the server validates the password and forward the
email messages to the user’s computer, the server de-activates, and the user can access his
messages.
2.3.5. Other Agile-Based Development Frameworks
This section provides a quick overview of other Agile-based development frameworks
such as DAD (Ambler 2013), Kanban (Earley 2018), and XP (Wells 2009). The DAD
framework covers the full delivery lifecycle of a product. The DAD framework adopts all Agile
project development life cycle components and further consider changes in business and
operational processes as well as organizational changes (disciplinedagiledelivery.com 2015).
Kanban provides a visual workflow where WIP can be viewed. The Kanban workflow starts with
a backlog where tasks are selected from, then analyzed, developed, and tested until the selected
item is marked as done. The Kanban process represents the project’s progress during the
construction stages. XP is a framework that is centered on engineering principles. XP includes
short, flexible, and adaptable development cycles and favor User Stories for requirements-
gathering.
The Scrum framework concentrates on the construction iterations and favor User Stories
as a requirements-gathering tool; however, other requirements-gathering methods can also be
used such as Use Cases. User Stories is an established component in the XP framework. The
Scrum framework leaves other life cycle decisions to the framework’s practitioners. Scrum is
used when continuous feedback cycles are important, project requirements may change as the
project evolves, and software delivery is frequent (Smartsheet.com 2018). Pure Scum favors
project roles for a PO and a Scrum Master, but a Project Manager and a senior manager as the
37
PO can also be used. The Agile development philosophy promotes the use of more than one
framework to create software products – depending on practitioner preference (EPA 2017).
Practitioners can therefore experiment with components of Kanban, Scrum, or XP to establish
which components are more efficient for their unique purposes.
The 2015 State of Scrum survey of Scrum practitioners reported a 62% project success
rate (Denning 2015). The State of Scrum is a yearly survey that aims to provide insight into the
efficiency and adoption of the Scrum framework. This survey consults over 2000 active Scrum
and Agile organizations world-wide. This survey shows Agile adoption at about 53% in North
America, with low adoption percentages in the rest of the world. Agile frameworks are therefore
still not readily used across the globe in non-spatial based software systems.
2.4. User-Centered Agile Software Development (UCASD)
This section investigates design and development integration difficulties. Successful
integration of UCD principles with Agile methodologies in software engineering is still under
investigation. The UCASD development and design framework for Web GIS can benefit from
UCD – Agile integration as design components are considered in parallel with system
development. UX/UI design and system development are mutually dependent and should not be
accomplished in isolation.
Brhel (2015) derived principles that would support user-centered Agile software
development. The authors conducted a systematic literature review comprising of 83 publications
in the UCASD field by means of a coding system that distinguishes four components: process,
practices, people/social, and technology. This study yielded five UCASD principles: product
discovery and creation need to be viewed as separate entities, iterative and incremental design
and development, design and development need to be on parallel paths, the involvement of users
38
and stakeholders at all stages, and artifact-mediated consultation (Brhel 2015). This study
provides principles that can be integrated into the proposed GIS- Agile design and development
framework and explores the notion that applications should be useful and usable. Moreover,
Brhel (2015) suggests a parallel design-development strategy that could be explored in practice.
Brehl (2015) analyzed the UCASD integration question from a theoretical perspective
while Da Silva (2013) explored this integration issue in practice. Da Silva (2013) conducted a
multi-case study in two large organizations that were adept with Agile technologies and
expressed concerns regarding product usability. The Da Silva (2013) study rendered ten valuable
lessons regarding UCASD integration efforts. These valuable integration tips can be applied to
the advancement of a practical development/design methodology. The ten lessons learned
include: Sprint 0 could be used for upfront research and design, evaluation and prototype
creation need to be iterative, user testing can be performed with internal users – but one should
be mindful that these users may not be the end users, user experience issues can be articulated in
User Stories and can also be compiled as part of the acceptance criteria – especially when
enriched with prototypes, iterative evaluation is key, and the design component can be performed
a sprint ahead of development – but communicate with developers in regards to design
advancements. Lessons of note form Da Silva (2103) include the placement of the design sprints
one step ahead of development, the transcribing of issues into User Stories with Acceptance
Criteria, and the use of proxies in testing and consultation. Proxies are individuals that possess
customer characteristics but are not a direct user of a system. Proxies can be effectively used for
consultation and testing is actual customers are difficult to obtain.
Larusdottir, Gulliksen, and Cajander (2017) suggest the importance of elevating user
experience professionals to a more explicit role in the integration of UCD with Agile
39
methodologies. Their argument proposes that Agile processes could greatly benefit from UCD
integration. The authors further extrapolate that Agile methodologies do not automatically ensure
success even though it has been adopted as a de facto standard by many organizations. General
guidance extracted from this research concerns communication, software, customer
collaboration, and proclivity to change directives. Communication directives include: all team
members need to adopt usability and user experience roles, regular face-to-face communication
with users is integral to success, and multiple feedback channels (including social media) should
be in place. Software directives include: set clear usability and user experience visions early,
consult these visions on a regular basis to re-assess, and define measurable goals. Customer
collaboration directives include: user evaluation outcomes should be checked against
requirements, measure user satisfaction iteratively, UCD team members should be given the
mandate to influence subsequent project planning, communicate evaluation results to all team
members, and evaluation results should be managed. The proclivity to change directives
includes: retrospective meetings should be theme-based, UCD improvements should be one of
the retrospective themes, and prioritize change requests from users. This study places the user
within the center of the design and development process – a directive that can be characteristic of
a Web GIS design and development framework.
2.5. ArcGIS Online Interactive Web Application Configuration Options
Esri’s ArcGIS Online (AGOL) platform provides configurable template applications
where one can create applications in a few simple steps. AGOL is a collaborative Web GIS that
facilitates the creation and sharing of maps and data that is housed on Esri’s secure cloud (Esri
2017). AGOL provides a variety of out-of-the-box configuration options that could be extended
and customized when hosted on a local ArcGIS Server. The source code for these applications
40
are available for download to enable organizations to create intricate web mapping applications
by adding to or altering the source code.
Some of the configurable templates include variations of the Story Map template, Web
App Builder, and configurable templates such as the Basic Viewer, and the Minimalist template.
All these templates, including Esri’s Story Map templates, are stand-alone applications. Esri’s
Story Maps are AGOL-based web applications that combines multimedia with maps to tell a
story. Each Story Map template supports a targeted narrative focus such as the Story Map Tour
template that provides a linear location-based sequence that is enriched through multi-media.
The Story Map Cascade template presents an immersive narrative that the user can scroll
through; the Story Map Journal template provides a multimedia stage to engage the user with
maps, video, and images; the Story Map Series Accordion template presents a series of maps
with narratives that are expandable; and the Story Map Shortlist template enables the creative
organization of points of interest.
Esri’s Web App Builder allows for the configuration of compelling web-based
applications without the need for coding and the Esri Minimalist template allows for the creation
of an application with a simple but effective UI.
41
Chapter 3 Methods: Constructing and Implementing the Web GIS UCASD Framework through the Development of the PIA Test Application
The objective of this thesis is to create an integrated UCASD design and development
framework for Web GIS that focuses on an adaptation of existing Agile technologies. This
framework is tested through the development of a test Web GIS application. The expected
conclusion is that the adherence to Agile-based technology significantly improves the UX/UI of
the Web GIS application.
The first section of this chapter describes the Web GIS UCASD framework and includes
an introductory section that illustrates how existing UCD methods do not provide for GIS-
specific design and development needs. The first section further provides a discussion of the
three variations added to the Web GIS UCASD. The second section chronicles the development
and evolution of the PIA application adhering to the Web GIS UCASD framework.
3.1. The Web GIS UCASD Framework
Agile-based frameworks and UCD design methods form the base of the Web GIS
UCASD. All the components of the Scrum framework are used during development construction
iterations. The Scrum framework is a proven Agile project management technique, and I liked
the notion of the delivery of working software after the completion of each iteration. I based my
decision for this inclusion in the Web GIS UCASD due to the Scrum framework’s adoption in
the software development industry (discussed in Chapter 2). Scrum allows for the adoption of
user feedback and the structure of the framework further allows for timely adoption of changes.
The daily scrum meetings provides transparency as all team members know the status of the
project and what other contributors are working on.

42
I leveraged within the design construction iterations include the use of wireframe
prototyping with frequent iterative updates. This prototyping applies to general application
design as well as interactive mapping design components. The process entailed the continuous
upgrading of the prototypes to medium-and-high-fidelity models. Moreover, user involvement at
all stages of the design and development process in the form of focus group meetings formed
part of the development construction iterations, including the use of observation methods such as
affective computing and usability testing. The combination of usability testing and affective
computing within a focus group setting allowed for the extraction of valuable feedback at a
relatively low cost.
3.1.1. Variations to Established Agile-Based Methodologies
The framework builds on the established foundation of the Agile development
philosophy and introduces three variations to standard Agile-based methodologies that address
common challenges of the Web GIS development process. These variations include: an extended
Iteration 0 to facilitate a broader, high-level system design; the inclusion of a GIS UX/UI design
mechanism within each design iteration; and a final QA/QC Iteration (separated from the
Transition stage) to focus on bug resolution and system stability.
3.1.1.1. The extended Iteration 0
The extended Iteration 0 allows for comprehensive UX/UI design planning as well as
system design planning for development iterations. UX/UI design planning components include
a GIS Design plan (discussed later in this section) along with early wireframing and prototyping
that includes the wireframing of screens with interactive mapping capability. Development-
related system design activities normally occur during development construction iterations.
Classic Scrum projects place requirements-gathering (the crafting of User Stories) before
43
construction iterations in the form of a workshop. I hypothesized that constructing a high-level
Component Architecture and Sequence diagram in Iteration 0 would help the team identify all
system components and services that need to be in place prior to each construction iteration. The
Web GIS UCASD places this activity as a formal part of Iteration 0 to better set the stage for the
construction iterations.
3.1.1.2. The Iteration 0 GIS Design plan and iteration-specific GIS UX/UI design mechanisms.
GIS-specific design considerations are not addressed through existing software design
frameworks. Interactive GIS maps entail a wealth of design considerations, similar to the
construction of static maps but with added complexity as the design of the interactive map
requires consideration at each zoom level. The display of mapping components and the detail of
information provided are different at the county, city, neighborhood, and street levels. I found
that it was necessary to document this decision process to facilitate the configuration of design
components of each map during the construction iterations. I created a design plan in document
form (see Appendix D) where I listed all the decisions necessary for the creation of every web
map. The design plan addressed menu structuring, feature symbology, labeling, transparency
levels, tools and widgets to include, along with a column that addressed other design notes. The
structured design plan is further discussed in Iteration 2/3. The design plan was used during each
iteration-specific GIS UX/UI design mechanism as a planning tool. The design plan further
serves as documentation to how the GIS layers were configured to display in the application.
I further integrated a GIS UX/UI design mechanism within each design iteration to
facilitate the implementation of interactive map design as laid out in the GIS Design plan. The
construction design sprints thoroughly addressed design components in relation to the layout of
the application and how individual components interacted as laid out in the Information
44
Architecture and Interaction design diagram and the wireframe prototypes but neglected GIS-
specific design components. The focus of these sessions included map symbolization, labeling,
and information to include and exclude at every zoom level. Other considerations focused on
layer ordering as well as the visibility range of each layer. For example, I did not want to display
parcel layer information at the county level as it will obscure important information that I want
the user to have access to at the county zoom level. Parcel layer information was set to display
only at the neighborhood level.
3.1.1.3. Final QA/QC sprint.
The inclusion of a final QA/QC sprint, after the Design and Construction iterations and
before the Transition and Production stages, resolved remaining bugs and ensured system
stabilization. The assumption was that not all bugs would be resolved within each iteration, so
the final iteration focused on bug fixes and quality. The QA/QC sprint further identified future
feature enhancements. The QA/QC sprint ensured that testing was completed prior to training,
promoting, and documentation compiling activities. All the issues (bugs) identified for fixing
within the development construction iterations required additional time to resolve, and
comprehensive end-to-end testing of the entire application. The QA/QC activities ensured that
the planned functionality worked as expected.
3.1.2. Composition of the Web GIS UCASD
The Web GIS UCASD is an integrated framework where UX/UI design and development
are considered within the same framework. UX/UI design is in parallel with development
iterations and includes a UCD approach. Design iterations are one iteration ahead of
development. Variations to existing frameworks are indicated with a yellow star (Figure 10).
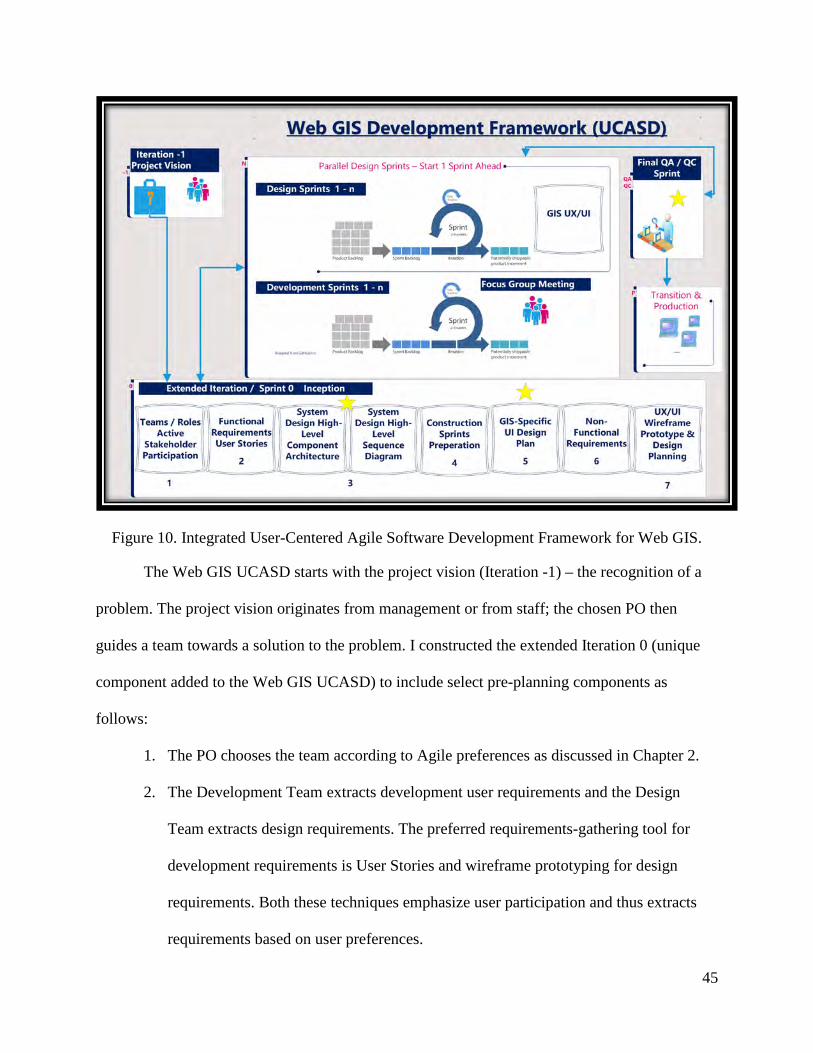
45
Figure 10. Integrated User-Centered Agile Software Development Framework for Web GIS.
The Web GIS UCASD starts with the project vision (Iteration -1) – the recognition of a
problem. The project vision originates from management or from staff; the chosen PO then
guides a team towards a solution to the problem. I constructed the extended Iteration 0 (unique
component added to the Web GIS UCASD) to include select pre-planning components as
follows:
1. The PO chooses the team according to Agile preferences as discussed in Chapter 2.
2. The Development Team extracts development user requirements and the Design
Team extracts design requirements. The preferred requirements-gathering tool for
development requirements is User Stories and wireframe prototyping for design
requirements. Both these techniques emphasize user participation and thus extracts
requirements based on user preferences.
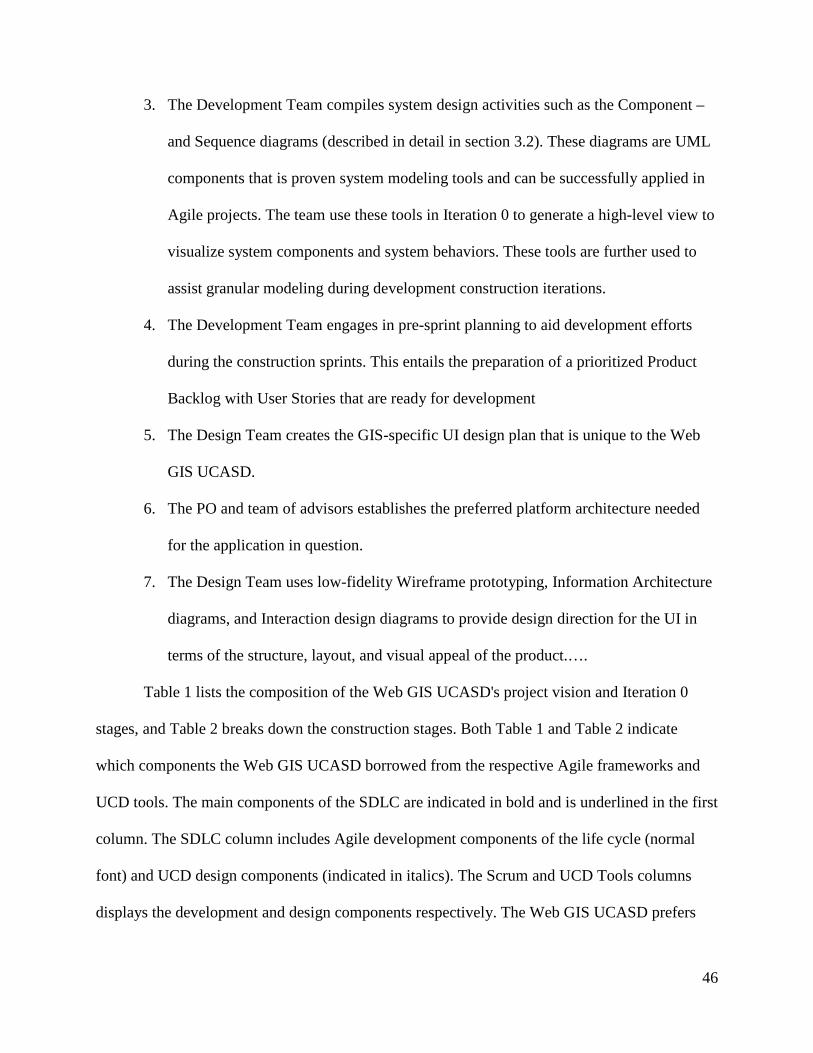
46
3. The Development Team compiles system design activities such as the Component –
and Sequence diagrams (described in detail in section 3.2). These diagrams are UML
components that is proven system modeling tools and can be successfully applied in
Agile projects. The team use these tools in Iteration 0 to generate a high-level view to
visualize system components and system behaviors. These tools are further used to
assist granular modeling during development construction iterations.
4. The Development Team engages in pre-sprint planning to aid development efforts
during the construction sprints. This entails the preparation of a prioritized Product
Backlog with User Stories that are ready for development
5. The Design Team creates the GIS-specific UI design plan that is unique to the Web
GIS UCASD.
6. The PO and team of advisors establishes the preferred platform architecture needed
for the application in question.
7. The Design Team uses low-fidelity Wireframe prototyping, Information Architecture
diagrams, and Interaction design diagrams to provide design direction for the UI in
terms of the structure, layout, and visual appeal of the product.….
Table 1 lists the composition of the Web GIS UCASD's project vision and Iteration 0
stages, and Table 2 breaks down the construction stages. Both Table 1 and Table 2 indicate
which components the Web GIS UCASD borrowed from the respective Agile frameworks and
UCD tools. The main components of the SDLC are indicated in bold and is underlined in the first
column. The SDLC column includes Agile development components of the life cycle (normal
font) and UCD design components (indicated in italics). The Scrum and UCD Tools columns
displays the development and design components respectively. The Web GIS UCASD prefers
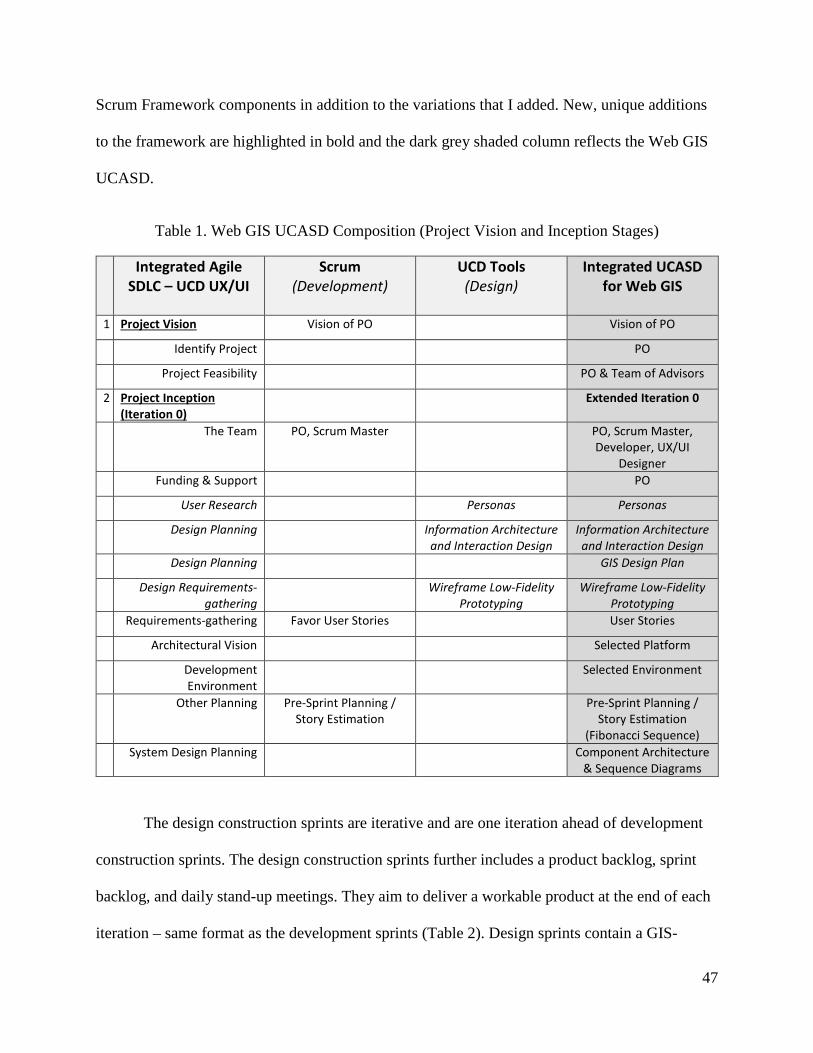
47
Scrum Framework components in addition to the variations that I added. New, unique additions
to the framework are highlighted in bold and the dark grey shaded column reflects the Web GIS
UCASD.
Table 1. Web GIS UCASD Composition (Project Vision and Inception Stages)
Integrated Agile SDLC – UCD UX/UI
Scrum (Development)
UCD Tools (Design)
Integrated UCASD for Web GIS
1 Project Vision Vision of PO Vision of PO
Identify Project PO
Project Feasibility PO & Team of Advisors
2 Project Inception (Iteration 0)
Extended Iteration 0
The Team PO, Scrum Master PO, Scrum Master, Developer, UX/UI
Designer Funding & Support PO
User Research Personas Personas
Design Planning Information Architecture and Interaction Design
Information Architecture and Interaction Design
Design Planning GIS Design Plan
Design Requirements-gathering
Wireframe Low-Fidelity Prototyping
Wireframe Low-Fidelity Prototyping
Requirements-gathering Favor User Stories User Stories
Architectural Vision Selected Platform
Development Environment
Selected Environment
Other Planning Pre-Sprint Planning / Story Estimation
Pre-Sprint Planning / Story Estimation
(Fibonacci Sequence) System Design Planning Component Architecture
& Sequence Diagrams
The design construction sprints are iterative and are one iteration ahead of development
construction sprints. The design construction sprints further includes a product backlog, sprint
backlog, and daily stand-up meetings. They aim to deliver a workable product at the end of each
iteration – same format as the development sprints (Table 2). Design sprints contain a GIS-
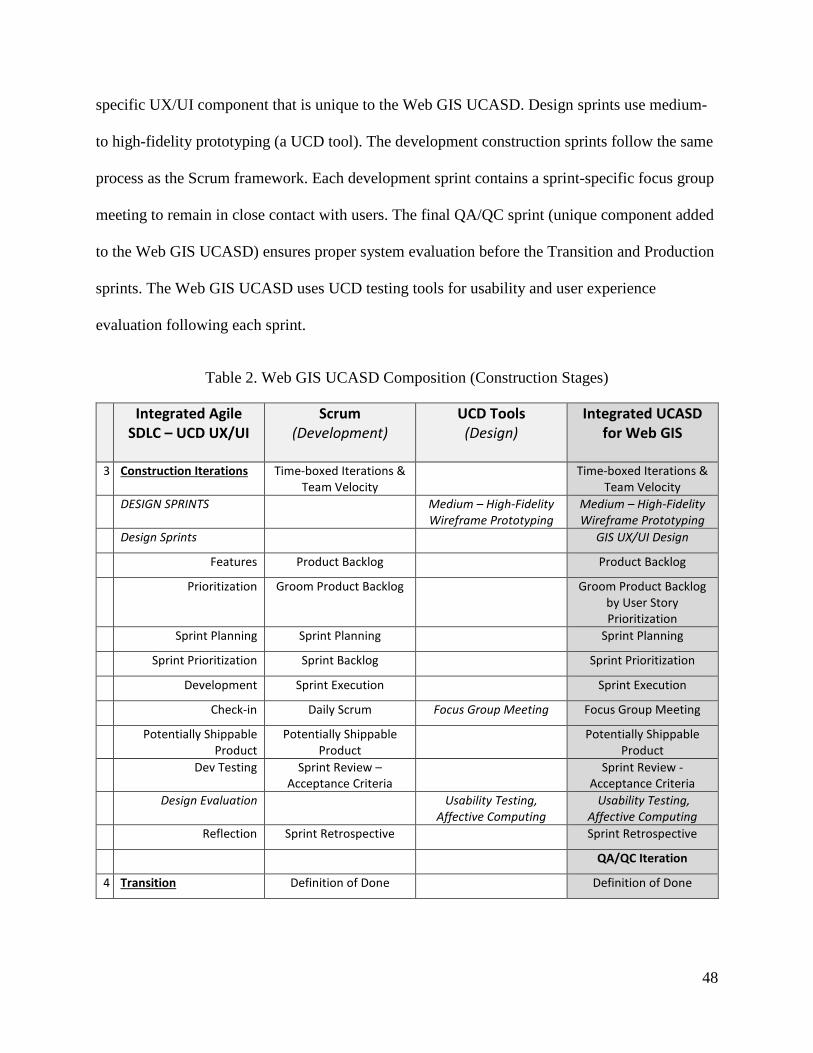
48
specific UX/UI component that is unique to the Web GIS UCASD. Design sprints use medium-
to high-fidelity prototyping (a UCD tool). The development construction sprints follow the same
process as the Scrum framework. Each development sprint contains a sprint-specific focus group
meeting to remain in close contact with users. The final QA/QC sprint (unique component added
to the Web GIS UCASD) ensures proper system evaluation before the Transition and Production
sprints. The Web GIS UCASD uses UCD testing tools for usability and user experience
evaluation following each sprint.
Table 2. Web GIS UCASD Composition (Construction Stages)
Integrated Agile SDLC – UCD UX/UI
Scrum (Development)
UCD Tools (Design)
Integrated UCASD for Web GIS
3 Construction Iterations Time-boxed Iterations & Team Velocity
Time-boxed Iterations & Team Velocity
DESIGN SPRINTS Medium – High-Fidelity Wireframe Prototyping
Medium – High-Fidelity Wireframe Prototyping
Design Sprints GIS UX/UI Design
Features Product Backlog Product Backlog
Prioritization Groom Product Backlog Groom Product Backlog by User Story Prioritization
Sprint Planning Sprint Planning Sprint Planning
Sprint Prioritization Sprint Backlog Sprint Prioritization
Development Sprint Execution Sprint Execution
Check-in Daily Scrum Focus Group Meeting Focus Group Meeting
Potentially Shippable Product
Potentially Shippable Product
Potentially Shippable Product
Dev Testing Sprint Review – Acceptance Criteria
Sprint Review - Acceptance Criteria
Design Evaluation Usability Testing, Affective Computing
Usability Testing, Affective Computing
Reflection Sprint Retrospective Sprint Retrospective
QA/QC Iteration
4 Transition Definition of Done Definition of Done
49
3.2. Framework Test Case: Developing the PIA Application
The development of the PIA application was accomplished through the implementation
of the Web GIS UCASD as illustrated in Figure 10. This section provides a brief synopsis of
each stage of project creation. As with other Agile-based projects, each iteration created a
potentially shippable product.
3.2.1. Iteration -1.
At Iteration -1, organizational personnel identify and establish the need for a software
project to solve a specific problem. In this case, Snohomish County PDS permitting technicians
revealed to permitting supervisors that they deal with a large number of single-property owners
that struggle to navigate the Snohomish County permitting process and voice frustration at
locating information that would explain these complicated processes in layman’s terms.
Permitting supervisors discussed this problem with the PDS director to voice their need for a
solution. The project stakeholders therefore were the permitting planners and permitting
supervisors that established the need for the improvement of the pilot application, as they are the
people that deal with customer questions and permitting applications on a day-to-day basis.
3.2.1.1. The PO and team of advisors.
The project stakeholders established the PO role and chose the PDS director as the PO.
They chose the PDS director because she holds decision-making authority and understands the
need for an easy-accessible educational property information application. The PO, in turn, chose
two senior permitting planners, a training specialist and a senior GIS Analyst to serve as her
SME advisors. I served as the SME senior GIS Analyst. The establishment of other team roles
occurred in Iteration 0 and will be discussed in the next sub-section.
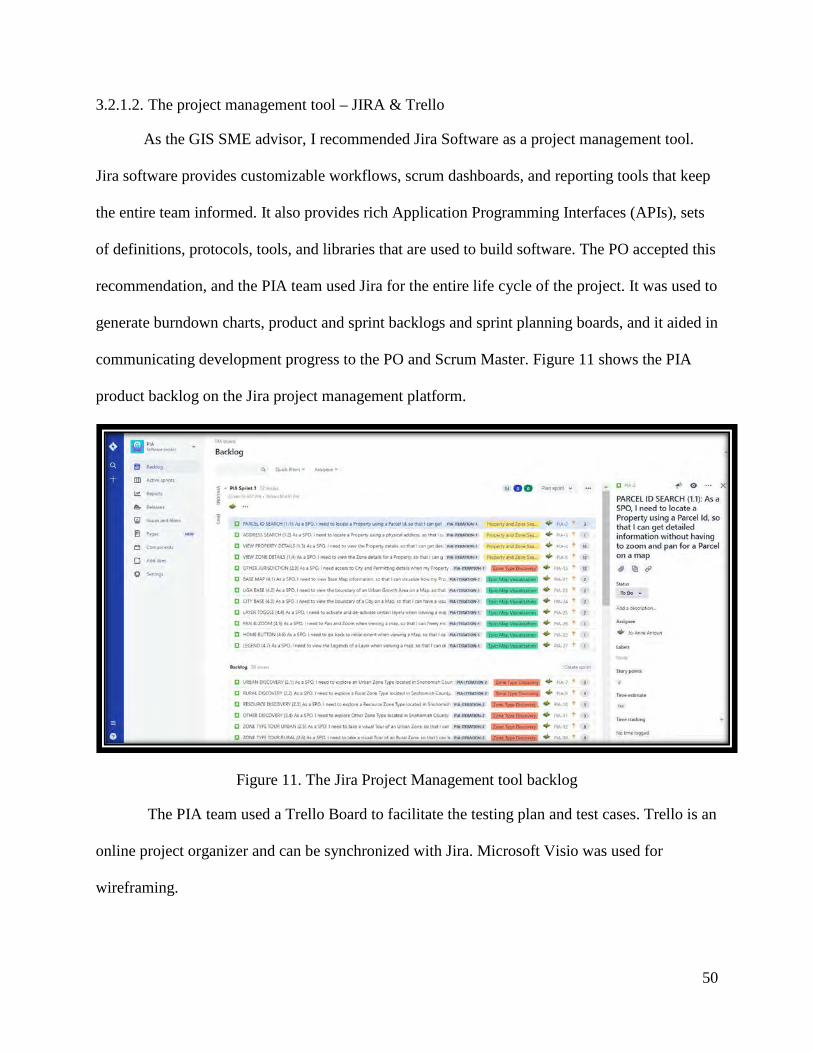
50
3.2.1.2. The project management tool – JIRA & Trello
As the GIS SME advisor, I recommended Jira Software as a project management tool.
Jira software provides customizable workflows, scrum dashboards, and reporting tools that keep
the entire team informed. It also provides rich Application Programming Interfaces (APIs), sets
of definitions, protocols, tools, and libraries that are used to build software. The PO accepted this
recommendation, and the PIA team used Jira for the entire life cycle of the project. It was used to
generate burndown charts, product and sprint backlogs and sprint planning boards, and it aided in
communicating development progress to the PO and Scrum Master. Figure 11 shows the PIA
product backlog on the Jira project management platform.
Figure 11. The Jira Project Management tool backlog
The PIA team used a Trello Board to facilitate the testing plan and test cases. Trello is an
online project organizer and can be synchronized with Jira. Microsoft Visio was used for
wireframing.
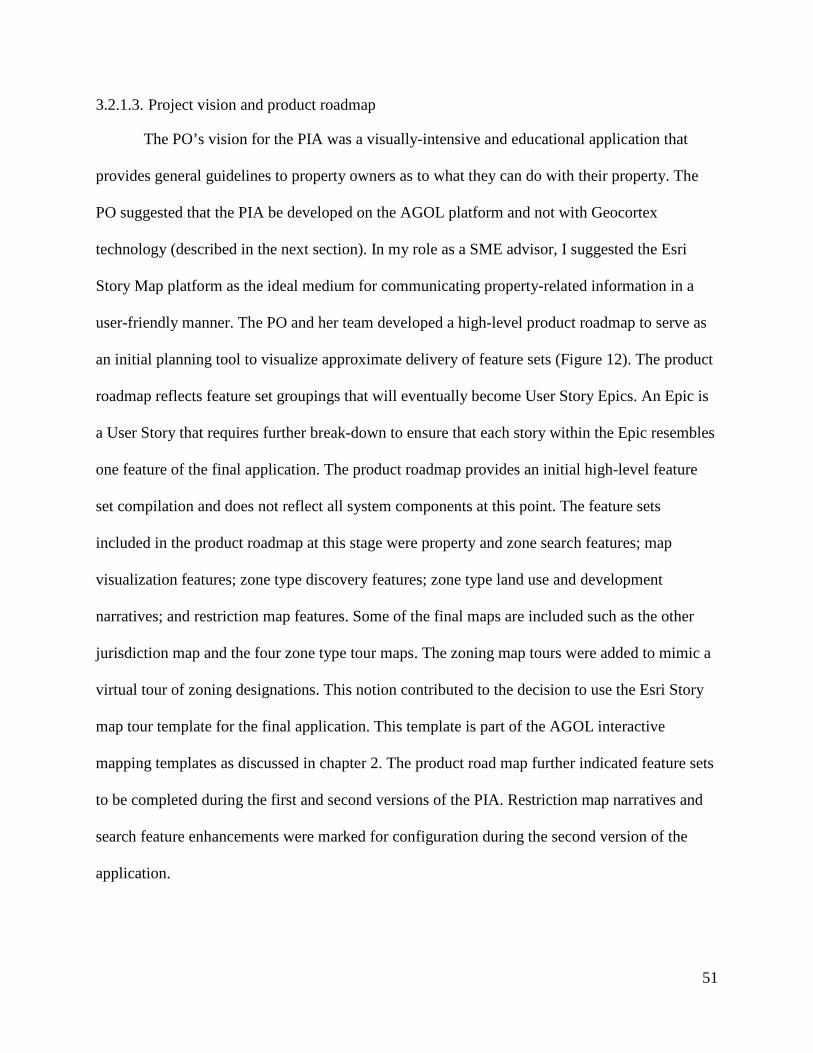
51
3.2.1.3. Project vision and product roadmap
The PO’s vision for the PIA was a visually-intensive and educational application that
provides general guidelines to property owners as to what they can do with their property. The
PO suggested that the PIA be developed on the AGOL platform and not with Geocortex
technology (described in the next section). In my role as a SME advisor, I suggested the Esri
Story Map platform as the ideal medium for communicating property-related information in a
user-friendly manner. The PO and her team developed a high-level product roadmap to serve as
an initial planning tool to visualize approximate delivery of feature sets (Figure 12). The product
roadmap reflects feature set groupings that will eventually become User Story Epics. An Epic is
a User Story that requires further break-down to ensure that each story within the Epic resembles
one feature of the final application. The product roadmap provides an initial high-level feature
set compilation and does not reflect all system components at this point. The feature sets
included in the product roadmap at this stage were property and zone search features; map
visualization features; zone type discovery features; zone type land use and development
narratives; and restriction map features. Some of the final maps are included such as the other
jurisdiction map and the four zone type tour maps. The zoning map tours were added to mimic a
virtual tour of zoning designations. This notion contributed to the decision to use the Esri Story
map tour template for the final application. This template is part of the AGOL interactive
mapping templates as discussed in chapter 2. The product road map further indicated feature sets
to be completed during the first and second versions of the PIA. Restriction map narratives and
search feature enhancements were marked for configuration during the second version of the
application.
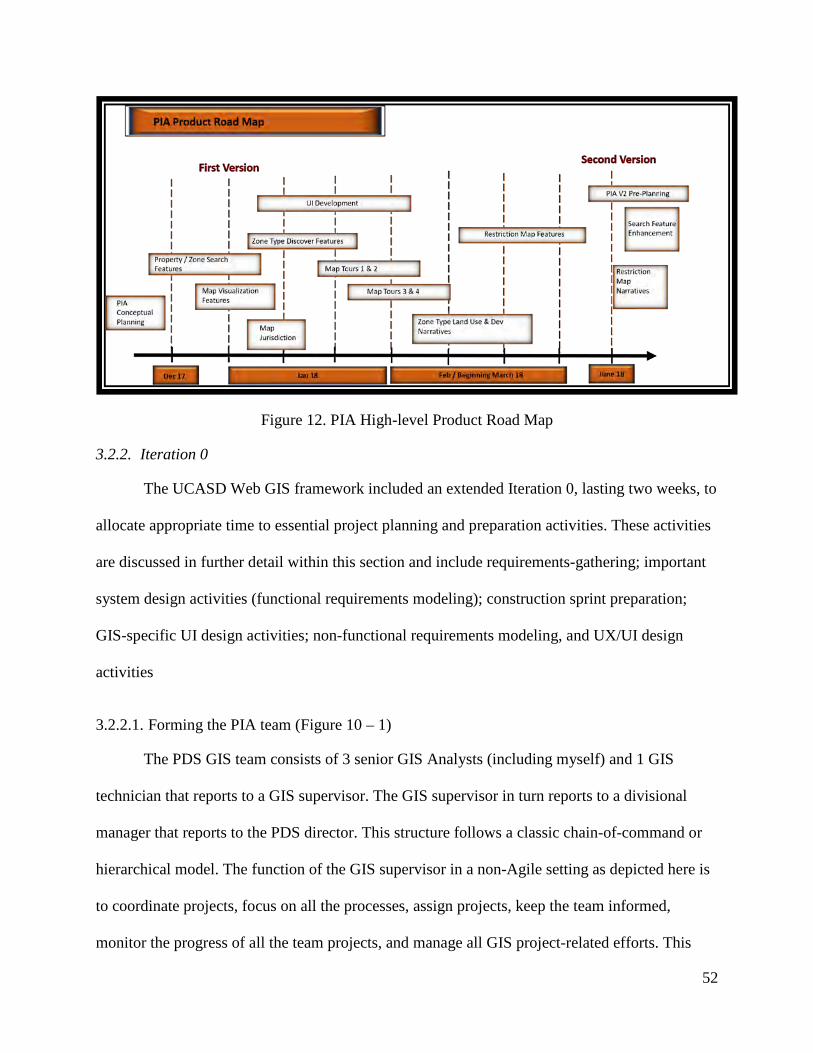
52
Figure 12. PIA High-level Product Road Map
3.2.2. Iteration 0
The UCASD Web GIS framework included an extended Iteration 0, lasting two weeks, to
allocate appropriate time to essential project planning and preparation activities. These activities
are discussed in further detail within this section and include requirements-gathering; important
system design activities (functional requirements modeling); construction sprint preparation;
GIS-specific UI design activities; non-functional requirements modeling, and UX/UI design
activities
3.2.2.1. Forming the PIA team (Figure 10 – 1)
The PDS GIS team consists of 3 senior GIS Analysts (including myself) and 1 GIS
technician that reports to a GIS supervisor. The GIS supervisor in turn reports to a divisional
manager that reports to the PDS director. This structure follows a classic chain-of-command or
hierarchical model. The function of the GIS supervisor in a non-Agile setting as depicted here is
to coordinate projects, focus on all the processes, assign projects, keep the team informed,
monitor the progress of all the team projects, and manage all GIS project-related efforts. This
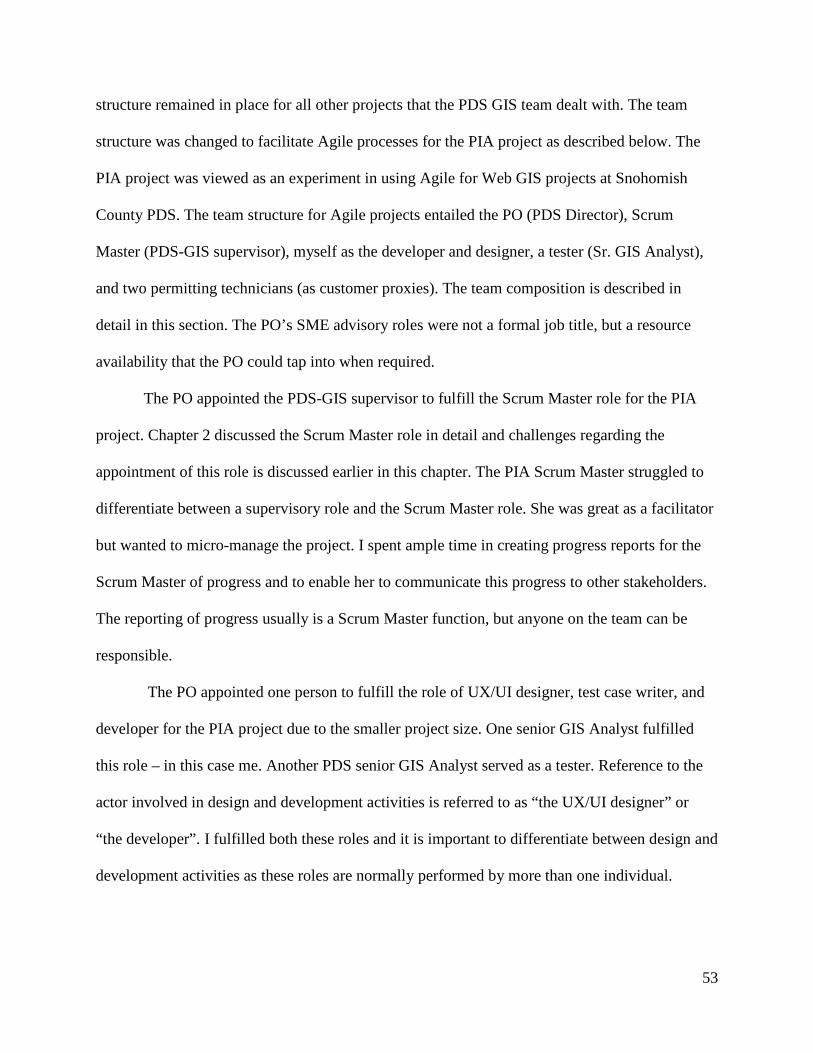
53
structure remained in place for all other projects that the PDS GIS team dealt with. The team
structure was changed to facilitate Agile processes for the PIA project as described below. The
PIA project was viewed as an experiment in using Agile for Web GIS projects at Snohomish
County PDS. The team structure for Agile projects entailed the PO (PDS Director), Scrum
Master (PDS-GIS supervisor), myself as the developer and designer, a tester (Sr. GIS Analyst),
and two permitting technicians (as customer proxies). The team composition is described in
detail in this section. The PO’s SME advisory roles were not a formal job title, but a resource
availability that the PO could tap into when required.
The PO appointed the PDS-GIS supervisor to fulfill the Scrum Master role for the PIA
project. Chapter 2 discussed the Scrum Master role in detail and challenges regarding the
appointment of this role is discussed earlier in this chapter. The PIA Scrum Master struggled to
differentiate between a supervisory role and the Scrum Master role. She was great as a facilitator
but wanted to micro-manage the project. I spent ample time in creating progress reports for the
Scrum Master of progress and to enable her to communicate this progress to other stakeholders.
The reporting of progress usually is a Scrum Master function, but anyone on the team can be
responsible.
The PO appointed one person to fulfill the role of UX/UI designer, test case writer, and
developer for the PIA project due to the smaller project size. One senior GIS Analyst fulfilled
this role – in this case me. Another PDS senior GIS Analyst served as a tester. Reference to the
actor involved in design and development activities is referred to as “the UX/UI designer” or
“the developer”. I fulfilled both these roles and it is important to differentiate between design and
development activities as these roles are normally performed by more than one individual.
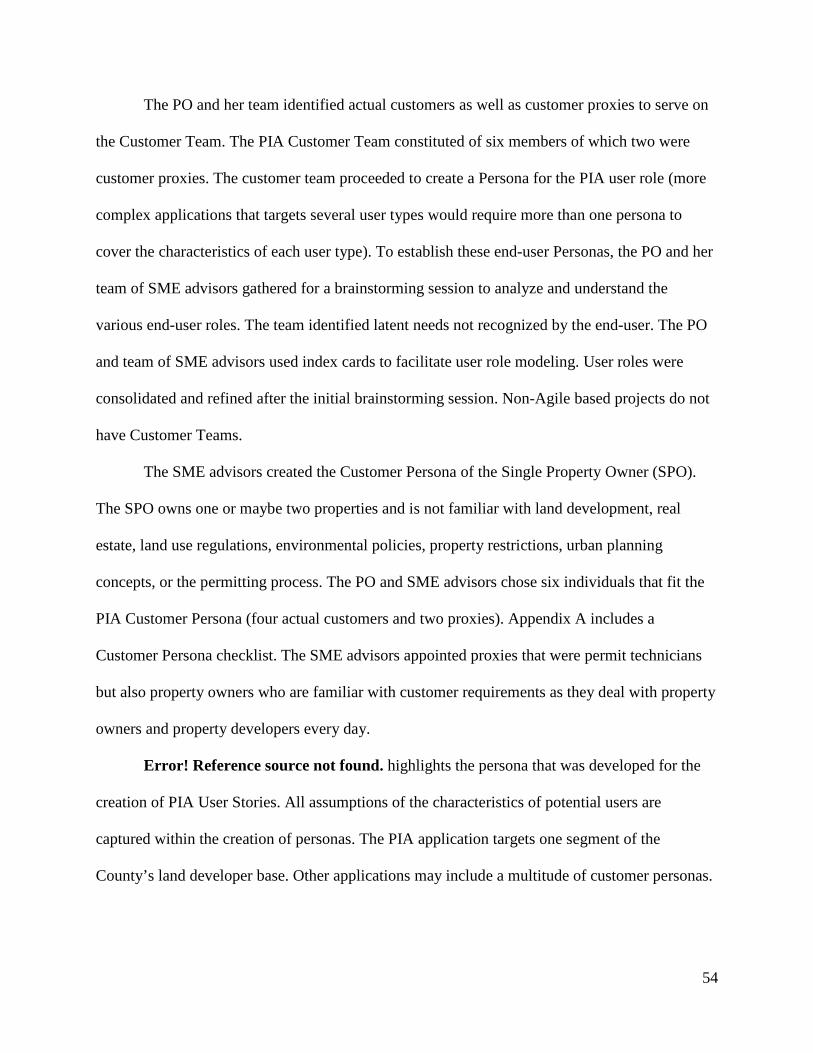
54
The PO and her team identified actual customers as well as customer proxies to serve on
the Customer Team. The PIA Customer Team constituted of six members of which two were
customer proxies. The customer team proceeded to create a Persona for the PIA user role (more
complex applications that targets several user types would require more than one persona to
cover the characteristics of each user type). To establish these end-user Personas, the PO and her
team of SME advisors gathered for a brainstorming session to analyze and understand the
various end-user roles. The team identified latent needs not recognized by the end-user. The PO
and team of SME advisors used index cards to facilitate user role modeling. User roles were
consolidated and refined after the initial brainstorming session. Non-Agile based projects do not
have Customer Teams.
The SME advisors created the Customer Persona of the Single Property Owner (SPO).
The SPO owns one or maybe two properties and is not familiar with land development, real
estate, land use regulations, environmental policies, property restrictions, urban planning
concepts, or the permitting process. The PO and SME advisors chose six individuals that fit the
PIA Customer Persona (four actual customers and two proxies). Appendix A includes a
Customer Persona checklist. The SME advisors appointed proxies that were permit technicians
but also property owners who are familiar with customer requirements as they deal with property
owners and property developers every day.
Error! Reference source not found. highlights the persona that was developed for the
creation of PIA User Stories. All assumptions of the characteristics of potential users are
captured within the creation of personas. The PIA application targets one segment of the
County’s land developer base. Other applications may include a multitude of customer personas.
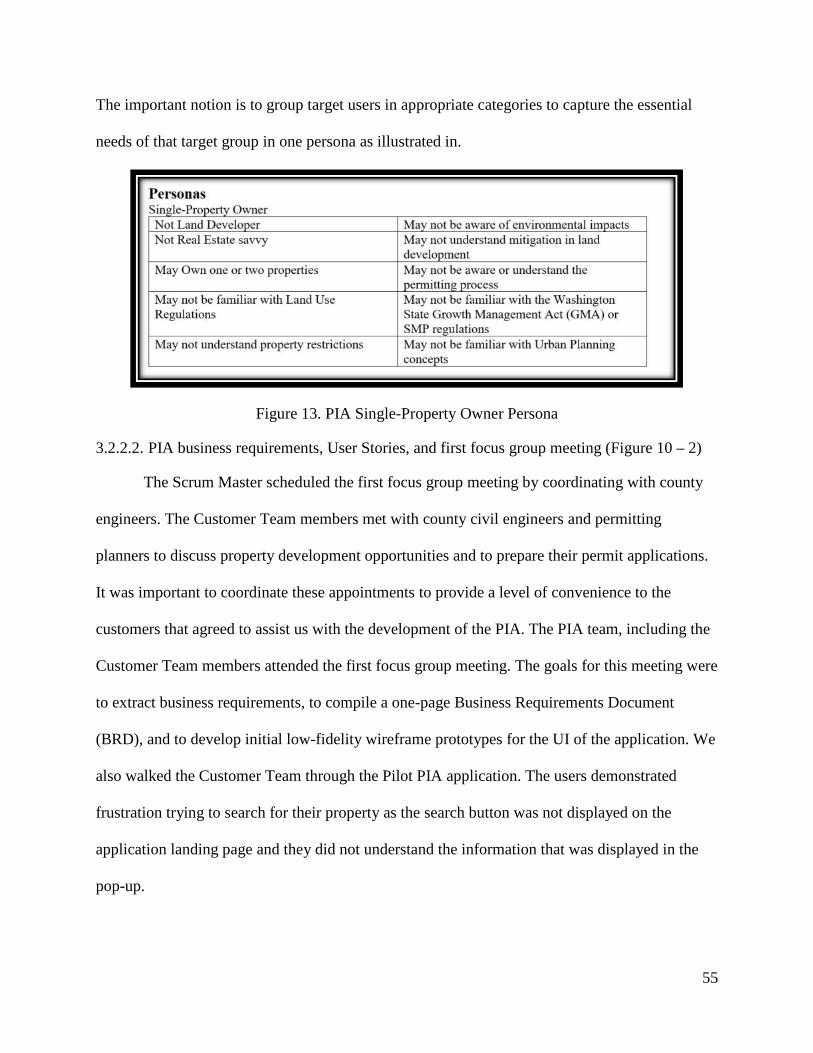
55
The important notion is to group target users in appropriate categories to capture the essential
needs of that target group in one persona as illustrated in.
Figure 13. PIA Single-Property Owner Persona
3.2.2.2. PIA business requirements, User Stories, and first focus group meeting (Figure 10 – 2)
The Scrum Master scheduled the first focus group meeting by coordinating with county
engineers. The Customer Team members met with county civil engineers and permitting
planners to discuss property development opportunities and to prepare their permit applications.
It was important to coordinate these appointments to provide a level of convenience to the
customers that agreed to assist us with the development of the PIA. The PIA team, including the
Customer Team members attended the first focus group meeting. The goals for this meeting were
to extract business requirements, to compile a one-page Business Requirements Document
(BRD), and to develop initial low-fidelity wireframe prototypes for the UI of the application. We
also walked the Customer Team through the Pilot PIA application. The users demonstrated
frustration trying to search for their property as the search button was not displayed on the
application landing page and they did not understand the information that was displayed in the
pop-up.
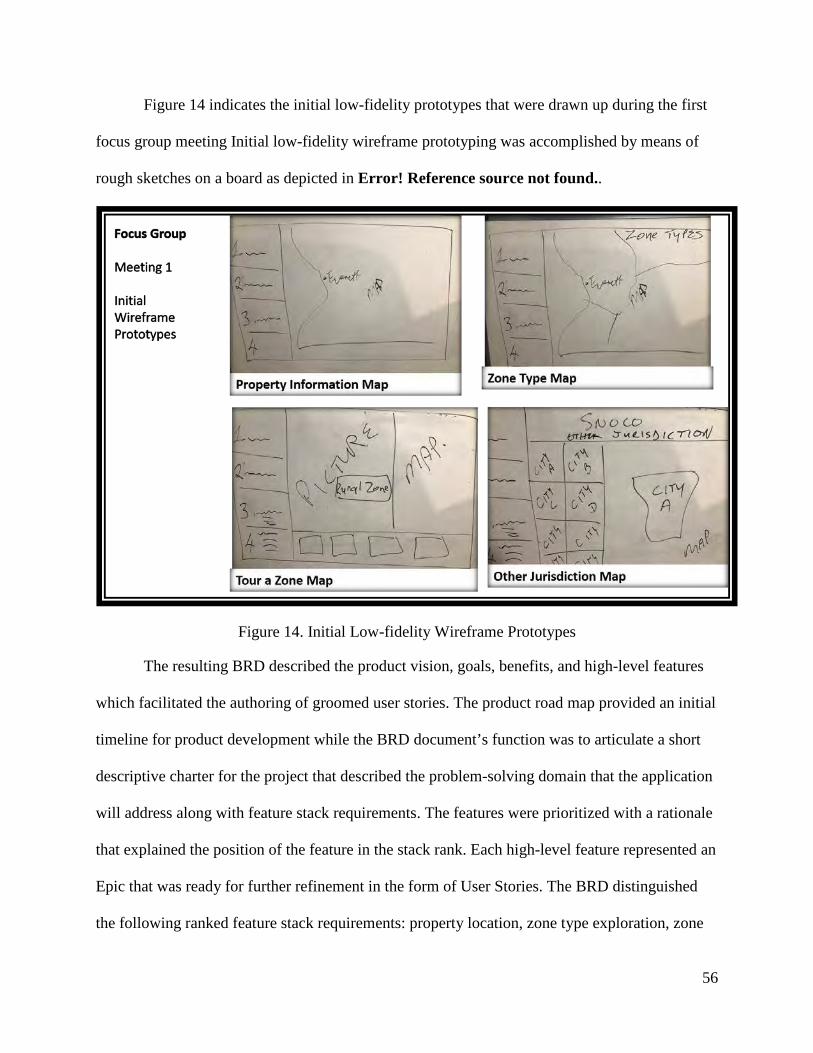
56
Figure 14 indicates the initial low-fidelity prototypes that were drawn up during the first
focus group meeting Initial low-fidelity wireframe prototyping was accomplished by means of
rough sketches on a board as depicted in Error! Reference source not found..
Figure 14. Initial Low-fidelity Wireframe Prototypes
The resulting BRD described the product vision, goals, benefits, and high-level features
which facilitated the authoring of groomed user stories. The product road map provided an initial
timeline for product development while the BRD document’s function was to articulate a short
descriptive charter for the project that described the problem-solving domain that the application
will address along with feature stack requirements. The features were prioritized with a rationale
that explained the position of the feature in the stack rank. Each high-level feature represented an
Epic that was ready for further refinement in the form of User Stories. The BRD distinguished
the following ranked feature stack requirements: property location, zone type exploration, zone
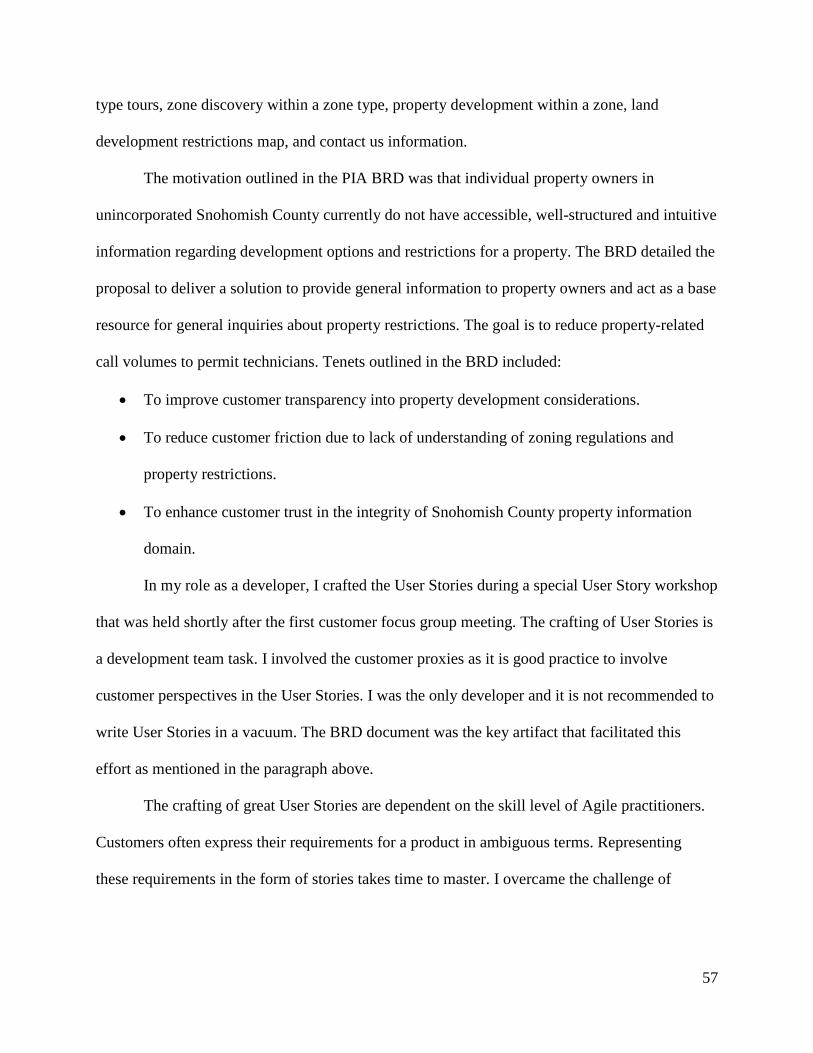
57
type tours, zone discovery within a zone type, property development within a zone, land
development restrictions map, and contact us information.
The motivation outlined in the PIA BRD was that individual property owners in
unincorporated Snohomish County currently do not have accessible, well-structured and intuitive
information regarding development options and restrictions for a property. The BRD detailed the
proposal to deliver a solution to provide general information to property owners and act as a base
resource for general inquiries about property restrictions. The goal is to reduce property-related
call volumes to permit technicians. Tenets outlined in the BRD included:
• To improve customer transparency into property development considerations.
• To reduce customer friction due to lack of understanding of zoning regulations and
property restrictions.
• To enhance customer trust in the integrity of Snohomish County property information
domain.
In my role as a developer, I crafted the User Stories during a special User Story workshop
that was held shortly after the first customer focus group meeting. The crafting of User Stories is
a development team task. I involved the customer proxies as it is good practice to involve
customer perspectives in the User Stories. I was the only developer and it is not recommended to
write User Stories in a vacuum. The BRD document was the key artifact that facilitated this
effort as mentioned in the paragraph above.
The crafting of great User Stories are dependent on the skill level of Agile practitioners.
Customers often express their requirements for a product in ambiguous terms. Representing
these requirements in the form of stories takes time to master. I overcame the challenge of
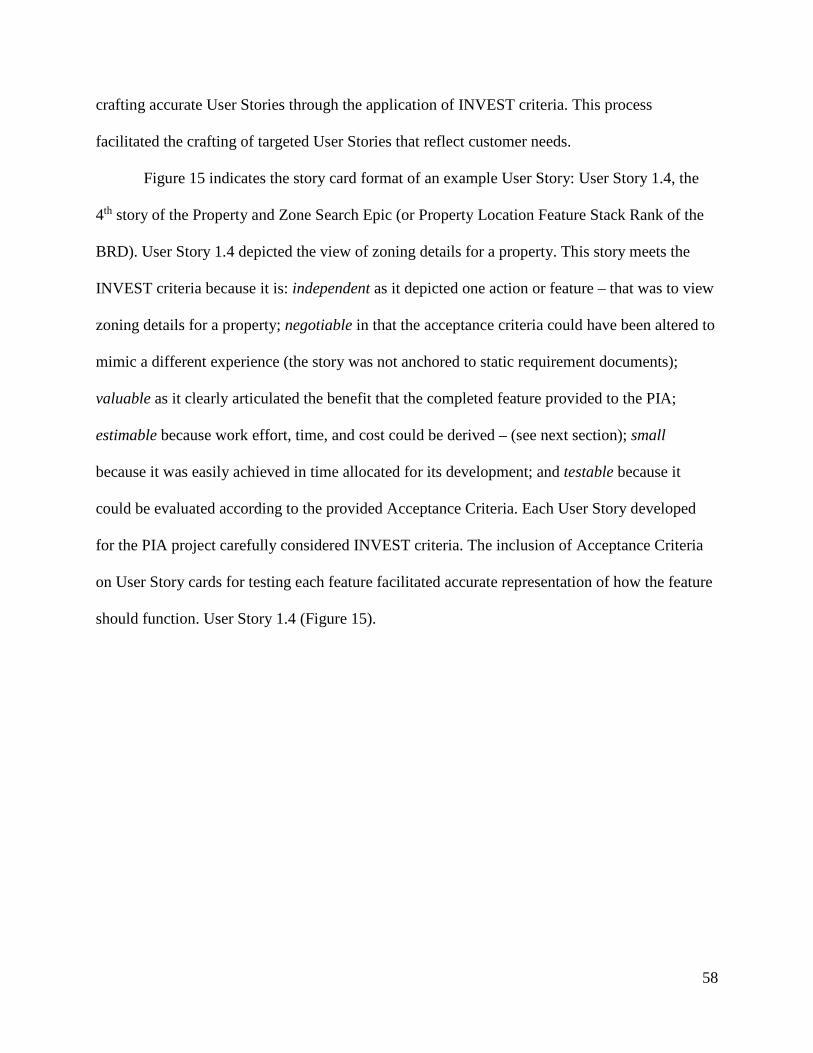
58
crafting accurate User Stories through the application of INVEST criteria. This process
facilitated the crafting of targeted User Stories that reflect customer needs.
Figure 15 indicates the story card format of an example User Story: User Story 1.4, the
4th story of the Property and Zone Search Epic (or Property Location Feature Stack Rank of the
BRD). User Story 1.4 depicted the view of zoning details for a property. This story meets the
INVEST criteria because it is: independent as it depicted one action or feature – that was to view
zoning details for a property; negotiable in that the acceptance criteria could have been altered to
mimic a different experience (the story was not anchored to static requirement documents);
valuable as it clearly articulated the benefit that the completed feature provided to the PIA;
estimable because work effort, time, and cost could be derived – (see next section); small
because it was easily achieved in time allocated for its development; and testable because it
could be evaluated according to the provided Acceptance Criteria. Each User Story developed
for the PIA project carefully considered INVEST criteria. The inclusion of Acceptance Criteria
on User Story cards for testing each feature facilitated accurate representation of how the feature
should function. User Story 1.4 (Figure 15).
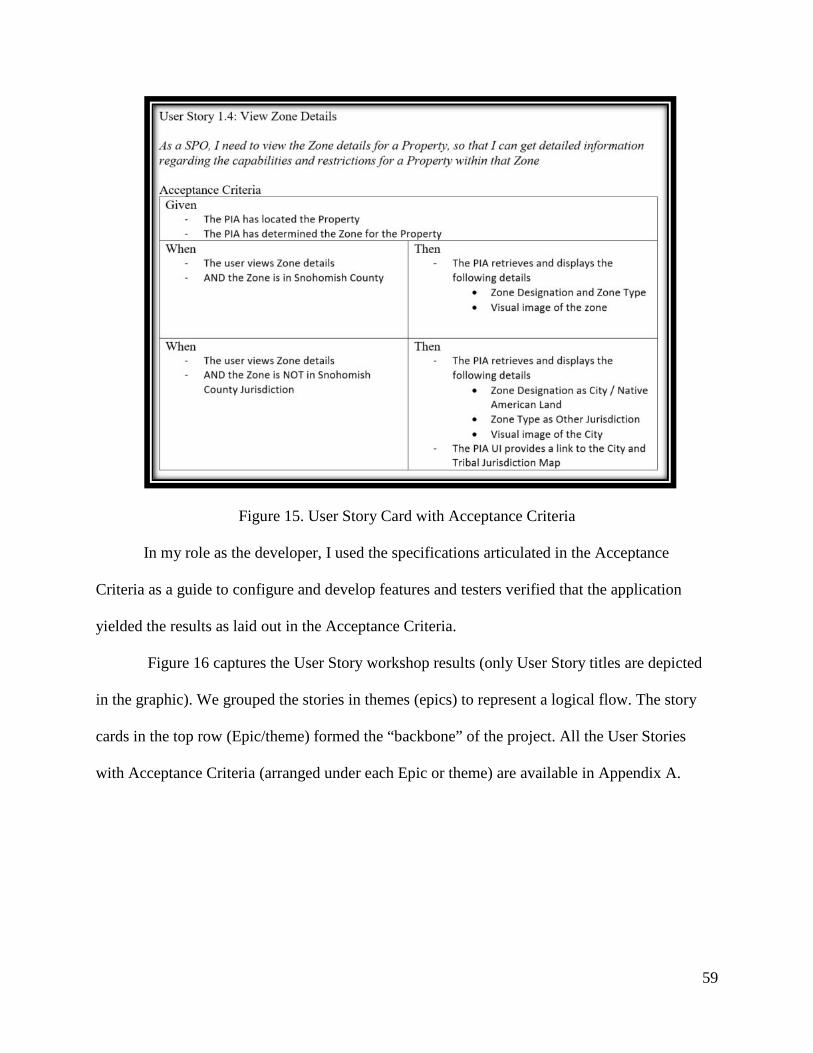
59
Figure 15. User Story Card with Acceptance Criteria
In my role as the developer, I used the specifications articulated in the Acceptance
Criteria as a guide to configure and develop features and testers verified that the application
yielded the results as laid out in the Acceptance Criteria.
Figure 16 captures the User Story workshop results (only User Story titles are depicted
in the graphic). We grouped the stories in themes (epics) to represent a logical flow. The story
cards in the top row (Epic/theme) formed the “backbone” of the project. All the User Stories
with Acceptance Criteria (arranged under each Epic or theme) are available in Appendix A.
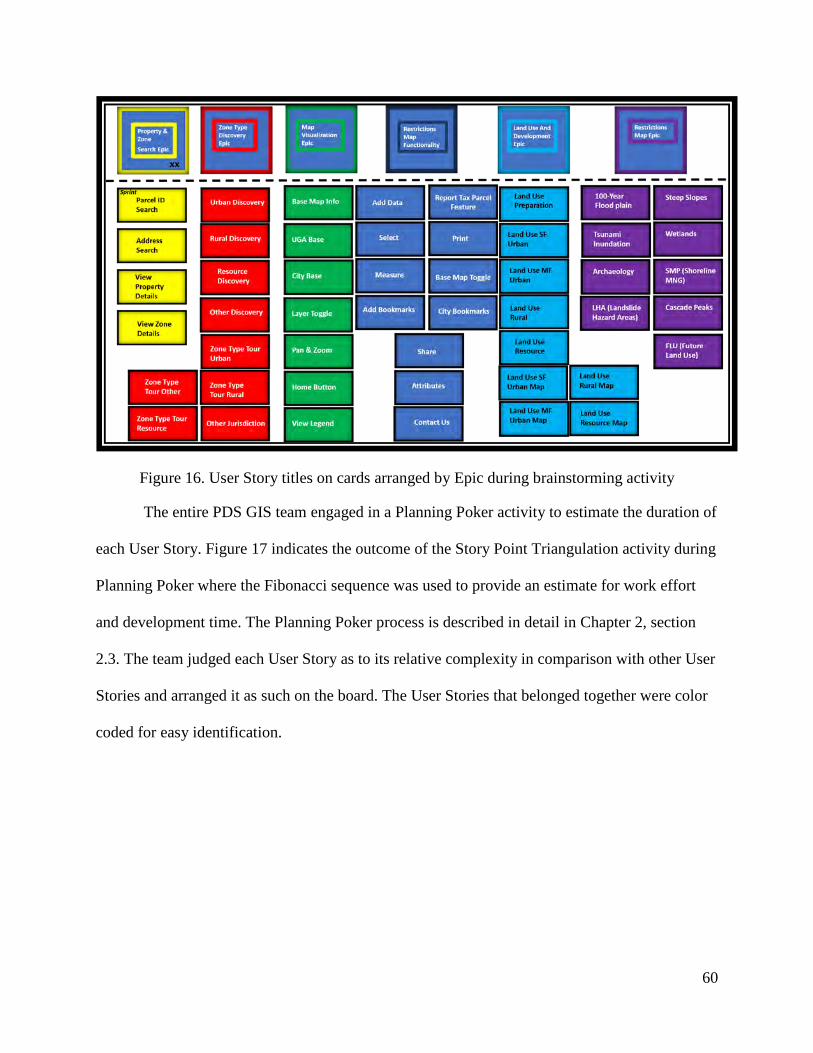
60
Figure 16. User Story titles on cards arranged by Epic during brainstorming activity
The entire PDS GIS team engaged in a Planning Poker activity to estimate the duration of
each User Story. Figure 17 indicates the outcome of the Story Point Triangulation activity during
Planning Poker where the Fibonacci sequence was used to provide an estimate for work effort
and development time. The Planning Poker process is described in detail in Chapter 2, section
2.3. The team judged each User Story as to its relative complexity in comparison with other User
Stories and arranged it as such on the board. The User Stories that belonged together were color
coded for easy identification.
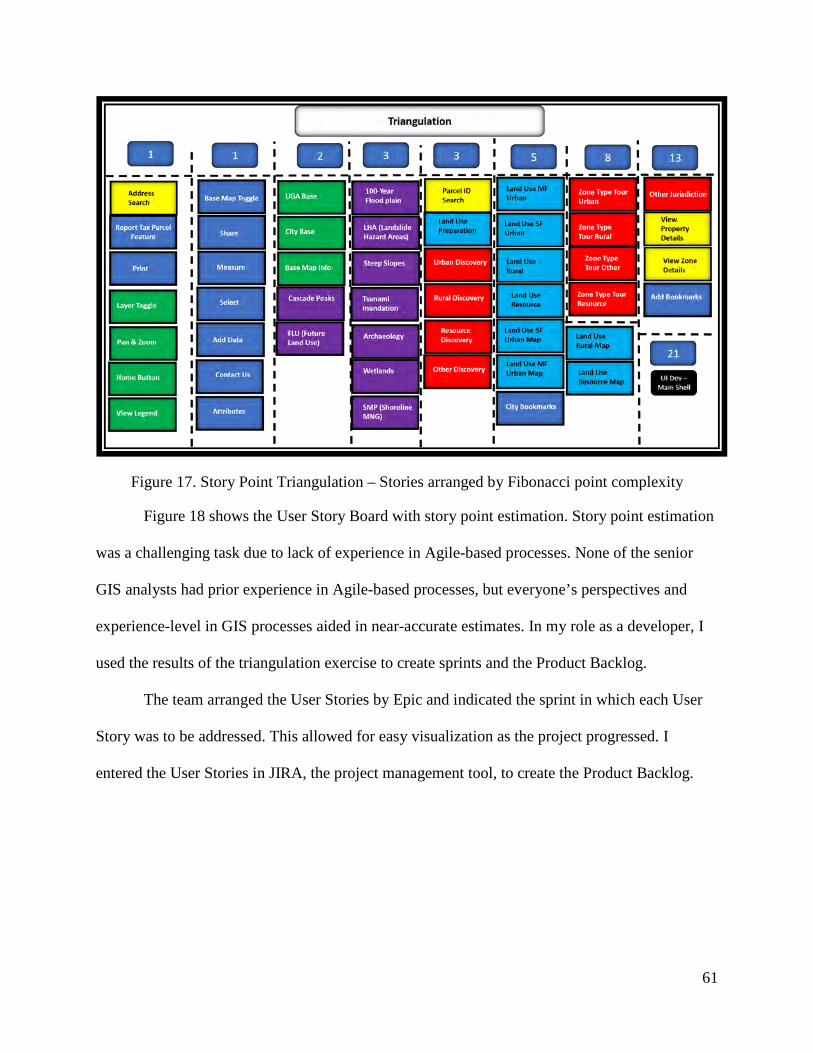
61
Figure 17. Story Point Triangulation – Stories arranged by Fibonacci point complexity
Figure 18 shows the User Story Board with story point estimation. Story point estimation
was a challenging task due to lack of experience in Agile-based processes. None of the senior
GIS analysts had prior experience in Agile-based processes, but everyone’s perspectives and
experience-level in GIS processes aided in near-accurate estimates. In my role as a developer, I
used the results of the triangulation exercise to create sprints and the Product Backlog.
The team arranged the User Stories by Epic and indicated the sprint in which each User
Story was to be addressed. This allowed for easy visualization as the project progressed. I
entered the User Stories in JIRA, the project management tool, to create the Product Backlog.
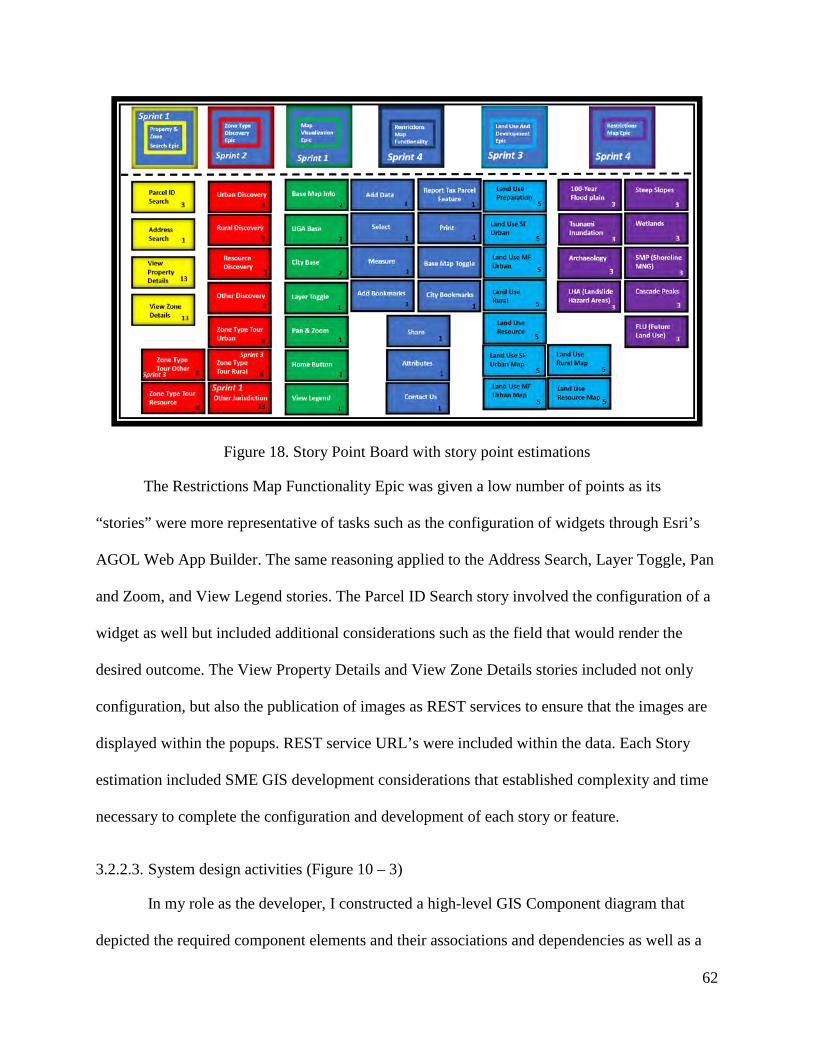
62
Figure 18. Story Point Board with story point estimations
The Restrictions Map Functionality Epic was given a low number of points as its
“stories” were more representative of tasks such as the configuration of widgets through Esri’s
AGOL Web App Builder. The same reasoning applied to the Address Search, Layer Toggle, Pan
and Zoom, and View Legend stories. The Parcel ID Search story involved the configuration of a
widget as well but included additional considerations such as the field that would render the
desired outcome. The View Property Details and View Zone Details stories included not only
configuration, but also the publication of images as REST services to ensure that the images are
displayed within the popups. REST service URL’s were included within the data. Each Story
estimation included SME GIS development considerations that established complexity and time
necessary to complete the configuration and development of each story or feature.
3.2.2.3. System design activities (Figure 10 – 3)
In my role as the developer, I constructed a high-level GIS Component diagram that
depicted the required component elements and their associations and dependencies as well as a
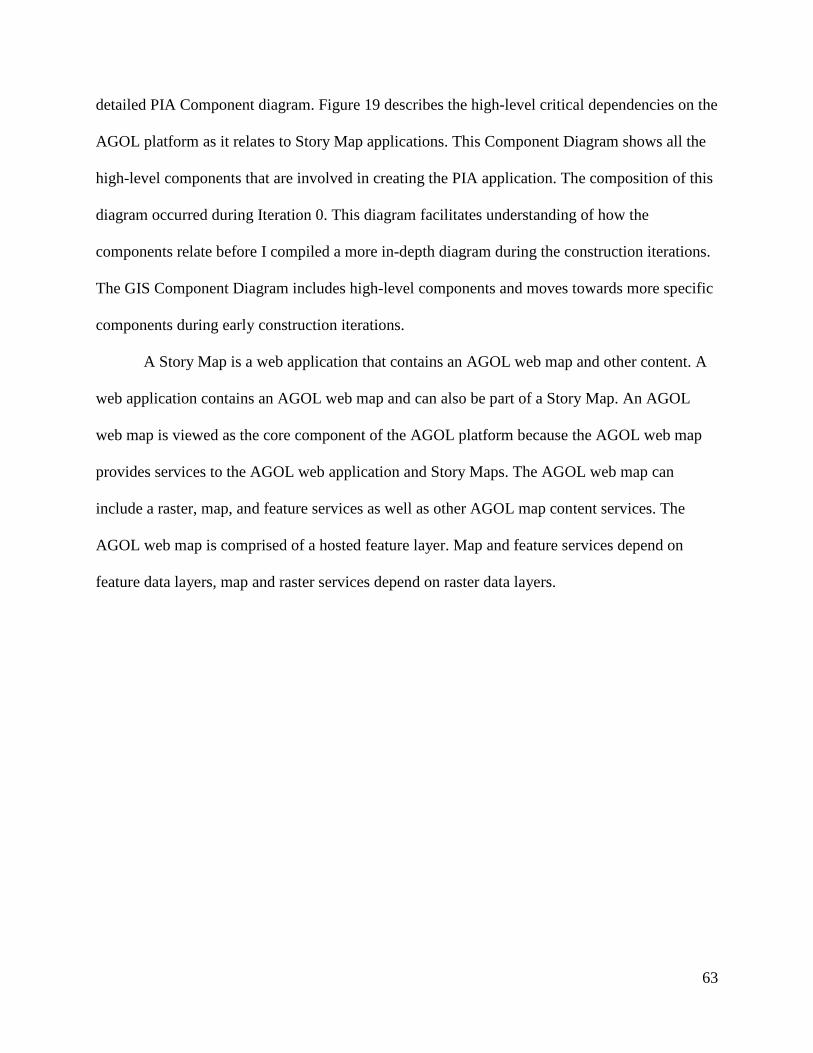
63
detailed PIA Component diagram. Figure 19 describes the high-level critical dependencies on the
AGOL platform as it relates to Story Map applications. This Component Diagram shows all the
high-level components that are involved in creating the PIA application. The composition of this
diagram occurred during Iteration 0. This diagram facilitates understanding of how the
components relate before I compiled a more in-depth diagram during the construction iterations.
The GIS Component Diagram includes high-level components and moves towards more specific
components during early construction iterations.
A Story Map is a web application that contains an AGOL web map and other content. A
web application contains an AGOL web map and can also be part of a Story Map. An AGOL
web map is viewed as the core component of the AGOL platform because the AGOL web map
provides services to the AGOL web application and Story Maps. The AGOL web map can
include a raster, map, and feature services as well as other AGOL map content services. The
AGOL web map is comprised of a hosted feature layer. Map and feature services depend on
feature data layers, map and raster services depend on raster data layers.
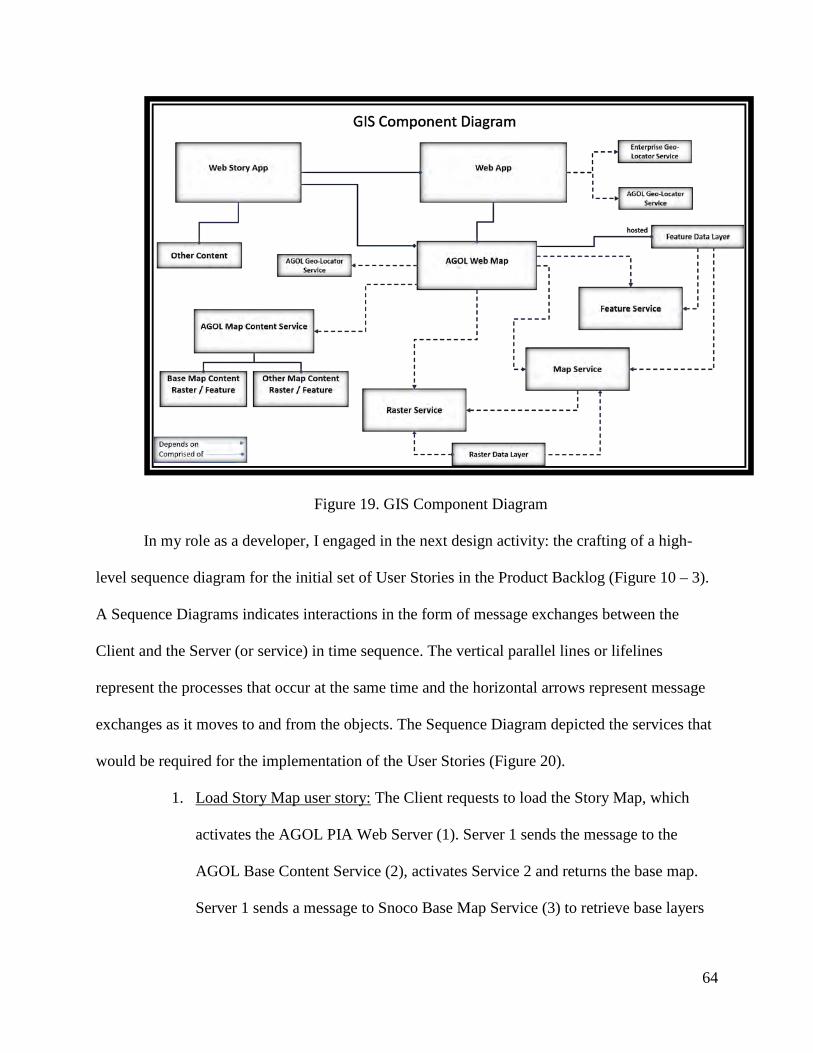
64
Figure 19. GIS Component Diagram
In my role as a developer, I engaged in the next design activity: the crafting of a high-
level sequence diagram for the initial set of User Stories in the Product Backlog (Figure 10 – 3).
A Sequence Diagrams indicates interactions in the form of message exchanges between the
Client and the Server (or service) in time sequence. The vertical parallel lines or lifelines
represent the processes that occur at the same time and the horizontal arrows represent message
exchanges as it moves to and from the objects. The Sequence Diagram depicted the services that
would be required for the implementation of the User Stories (Figure 20).
1. Load Story Map user story: The Client requests to load the Story Map, which
activates the AGOL PIA Web Server (1). Server 1 sends the message to the
AGOL Base Content Service (2), activates Service 2 and returns the base map.
Server 1 sends a message to Snoco Base Map Service (3) to retrieve base layers
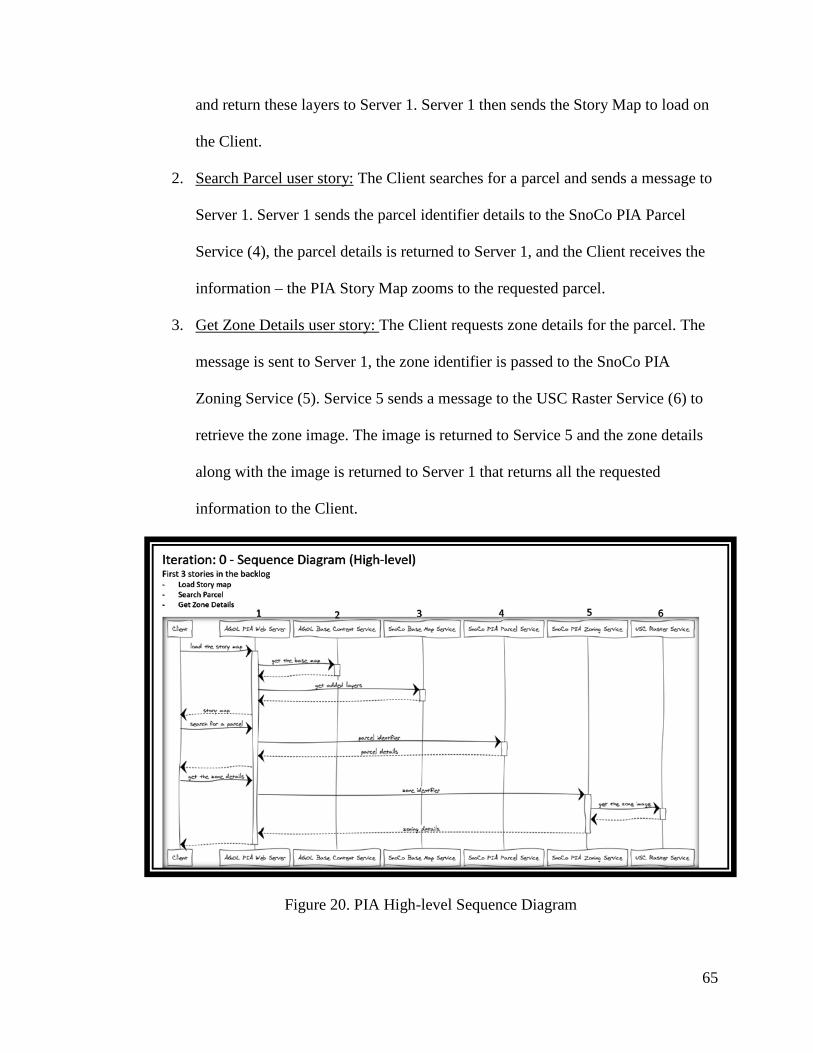
65
and return these layers to Server 1. Server 1 then sends the Story Map to load on
the Client.
2. Search Parcel user story: The Client searches for a parcel and sends a message to
Server 1. Server 1 sends the parcel identifier details to the SnoCo PIA Parcel
Service (4), the parcel details is returned to Server 1, and the Client receives the
information – the PIA Story Map zooms to the requested parcel.
3. Get Zone Details user story: The Client requests zone details for the parcel. The
message is sent to Server 1, the zone identifier is passed to the SnoCo PIA
Zoning Service (5). Service 5 sends a message to the USC Raster Service (6) to
retrieve the zone image. The image is returned to Service 5 and the zone details
along with the image is returned to Server 1 that returns all the requested
information to the Client.
Figure 20. PIA High-level Sequence Diagram
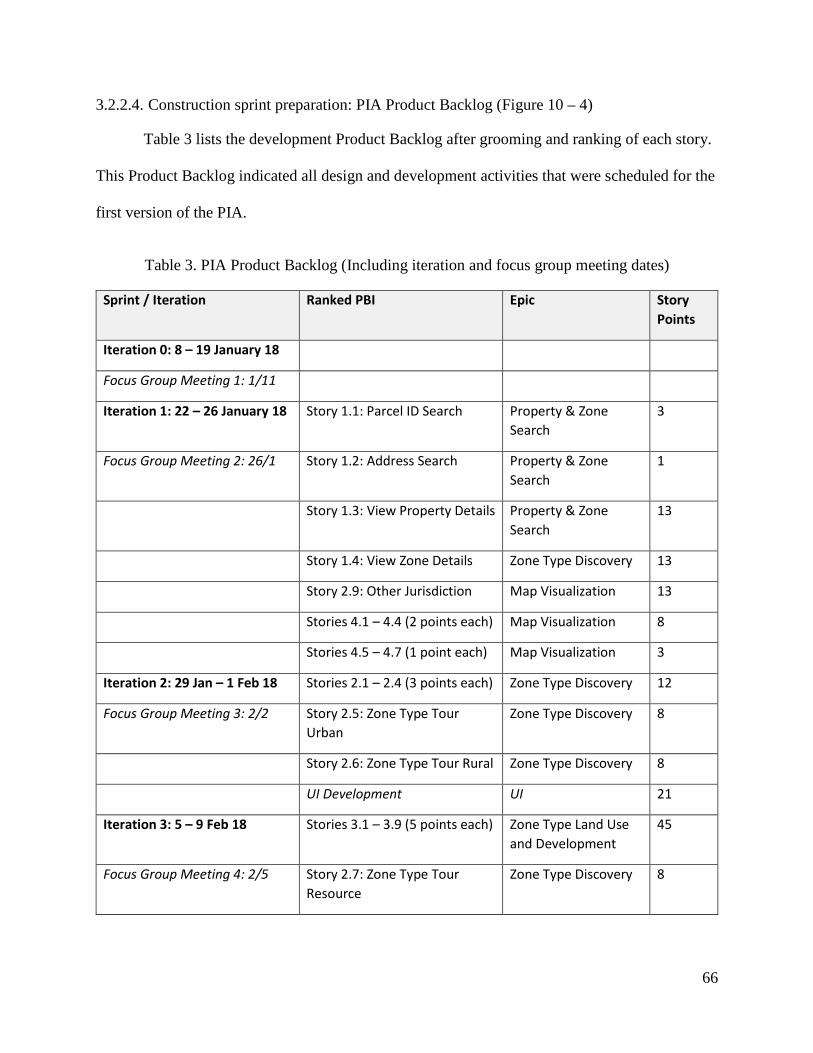
66
3.2.2.4. Construction sprint preparation: PIA Product Backlog (Figure 10 – 4)
Table 3 lists the development Product Backlog after grooming and ranking of each story.
This Product Backlog indicated all design and development activities that were scheduled for the
first version of the PIA.
Table 3. PIA Product Backlog (Including iteration and focus group meeting dates)
Sprint / Iteration Ranked PBI Epic Story Points
Iteration 0: 8 – 19 January 18
Focus Group Meeting 1: 1/11
Iteration 1: 22 – 26 January 18 Story 1.1: Parcel ID Search Property & Zone Search
3
Focus Group Meeting 2: 26/1 Story 1.2: Address Search Property & Zone Search
1
Story 1.3: View Property Details Property & Zone Search
13
Story 1.4: View Zone Details Zone Type Discovery 13
Story 2.9: Other Jurisdiction Map Visualization 13
Stories 4.1 – 4.4 (2 points each) Map Visualization 8
Stories 4.5 – 4.7 (1 point each) Map Visualization 3
Iteration 2: 29 Jan – 1 Feb 18 Stories 2.1 – 2.4 (3 points each) Zone Type Discovery 12
Focus Group Meeting 3: 2/2 Story 2.5: Zone Type Tour Urban
Zone Type Discovery 8
Story 2.6: Zone Type Tour Rural Zone Type Discovery 8
UI Development UI 21
Iteration 3: 5 – 9 Feb 18 Stories 3.1 – 3.9 (5 points each) Zone Type Land Use and Development
45
Focus Group Meeting 4: 2/5 Story 2.7: Zone Type Tour Resource
Zone Type Discovery 8
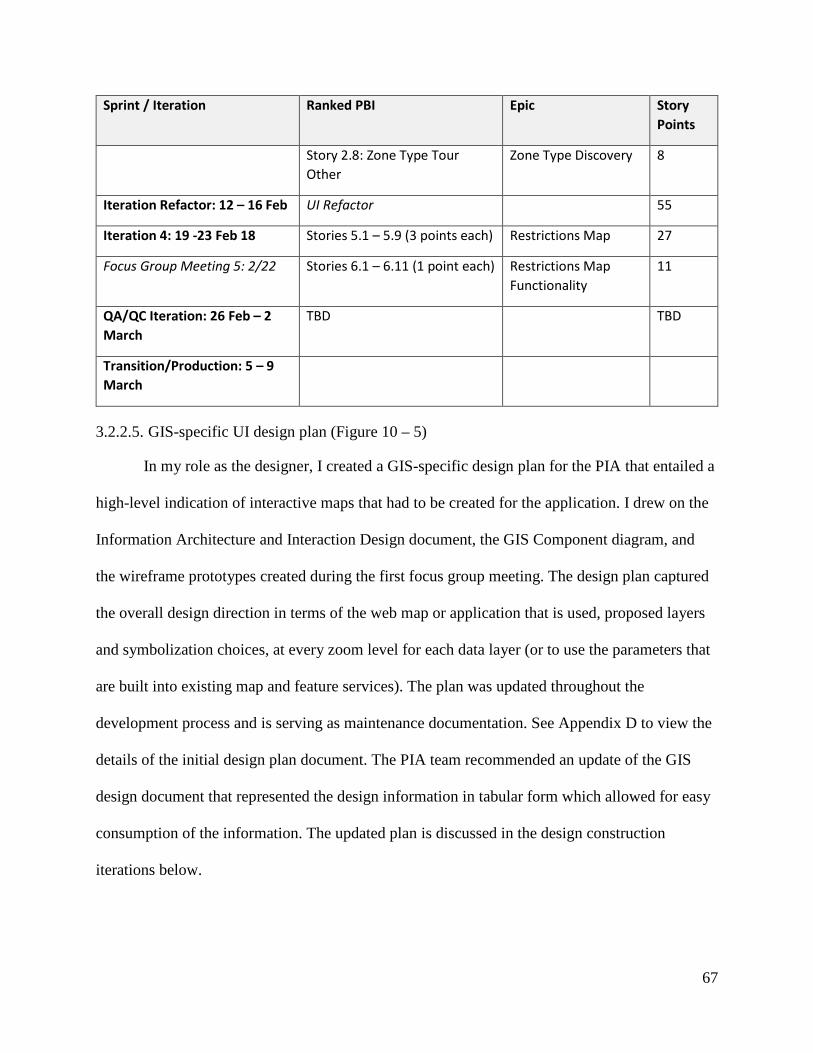
67
Sprint / Iteration Ranked PBI Epic Story Points
Story 2.8: Zone Type Tour Other
Zone Type Discovery 8
Iteration Refactor: 12 – 16 Feb UI Refactor 55
Iteration 4: 19 -23 Feb 18 Stories 5.1 – 5.9 (3 points each) Restrictions Map 27
Focus Group Meeting 5: 2/22 Stories 6.1 – 6.11 (1 point each) Restrictions Map Functionality
11
QA/QC Iteration: 26 Feb – 2 March
TBD TBD
Transition/Production: 5 – 9 March
3.2.2.5. GIS-specific UI design plan (Figure 10 – 5)
In my role as the designer, I created a GIS-specific design plan for the PIA that entailed a
high-level indication of interactive maps that had to be created for the application. I drew on the
Information Architecture and Interaction Design document, the GIS Component diagram, and
the wireframe prototypes created during the first focus group meeting. The design plan captured
the overall design direction in terms of the web map or application that is used, proposed layers
and symbolization choices, at every zoom level for each data layer (or to use the parameters that
are built into existing map and feature services). The plan was updated throughout the
development process and is serving as maintenance documentation. See Appendix D to view the
details of the initial design plan document. The PIA team recommended an update of the GIS
design document that represented the design information in tabular form which allowed for easy
consumption of the information. The updated plan is discussed in the design construction
iterations below.
68
3.2.2.6. Platform architecture, development environment, and data requirements (Figure 10 – 6)
Key components that the PO had to consider included whether to use AGOL that
provides Software as a Service (SaaS) as the architectural platform or to employ the Geocortex
configuration platform. Geocortex provided a complete platform for interactive map application
hosting and development that was already in place on the County’s ArcGIS Server 10.4. The PO
decided to utilize the AGOL platform as the County already owns an AGOL enterprise
membership that was necessary for accessing Esri’s AGOL SaaS. Moreover, The PDS GIS team
published map services on the County’s ArcGIS server. Therefore, representational state transfer
(REST) service endpoint Uniform Resource Locators (URL) were already in place for
consumption in Web GIS applications as these services were currently feeding the main
Snohomish County PDS web mapping portal. RESTful Web Services provided web-based
resources in a predefined stateless set of operations for consumption. Stateless signified that no
information was retained by the sender or receiver during a communications transaction. The
client side (the computer that sends the request) sent requests in the form of a URL over
Hypertext Transfer Protocol (HTTP). The request URL contained all the necessary message
parameters and thus did not require additional messaging layers. Server-side responses were
delivered in JavaScript Object Notation (JSON), Extensible Markup Language (XML), or other
data transfer formats (Fu & Sun 2011). The IT department was responsible for setting up project
architecture for all departments and established the development environment and set up a
development server. As the PIA developer, I requested that the IT department configure the
development server with HTTP and HTTPS ports. The port configuration facilitated that changes
and updates were pushed to the production server.
Error! Reference source not found. shows the platform architecture chosen for the PIA
test application. The PIA application was hosted on the County’s AGOL platform. The main

69
application consisted of hosted feature layers, web maps, and other applications – all of which
resided on the AGOL cloud (Figure 21 – 1). An AGOL hosted feature layer inherited the schema
and extent properties from the template layer (Figure 21– 1). The PIA web application consumed
AGOL base maps and hosted feature layers from Snohomish County’s AGOL account (Figure
21 – 2).
Feature and published map service REST endpoints published on Snohomish County’s
ArcGIS Server supplied pertinent spatial information to the PIA application (Figure 21 – 3). This
included images that were published as REST endpoints. The Demilitarized Zone (DMZ) was a
perimeter network (consisting of a single server) that revealed the organization’s external-facing
services to the Internet and provided additional security (Figure 21 – 4). This single server acted
as a proxy for the ArcGIS Server REST endpoints (Perry 2014). The ArcGIS web adaptor was an
application that forwarded requests to the Snohomish County ArcGIS server (Figure 21– 5).
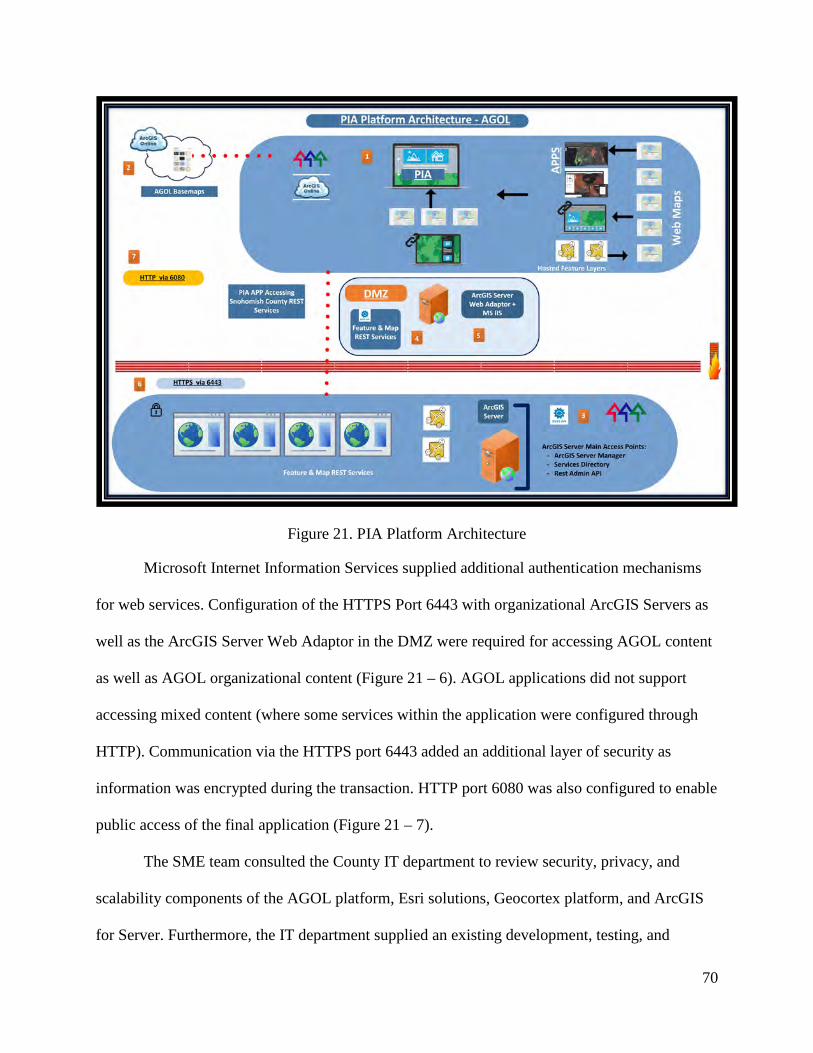
70
Figure 21. PIA Platform Architecture
Microsoft Internet Information Services supplied additional authentication mechanisms
for web services. Configuration of the HTTPS Port 6443 with organizational ArcGIS Servers as
well as the ArcGIS Server Web Adaptor in the DMZ were required for accessing AGOL content
as well as AGOL organizational content (Figure 21 – 6). AGOL applications did not support
accessing mixed content (where some services within the application were configured through
HTTP). Communication via the HTTPS port 6443 added an additional layer of security as
information was encrypted during the transaction. HTTP port 6080 was also configured to enable
public access of the final application (Figure 21 – 7).
The SME team consulted the County IT department to review security, privacy, and
scalability components of the AGOL platform, Esri solutions, Geocortex platform, and ArcGIS
for Server. Furthermore, the IT department supplied an existing development, testing, and
71
production environment that continued to support the Geocortex and AGOL solutions. The IT
department had to configure the HTTPS Port 6443 secure configuration on ArcGIS for Server to
accommodate secure REST endpoint consumption on the AGOL platform. Snohomish County
had an existing AGOL enterprise identity provider (IDP) that verified the identity of the
organizational members. Moreover, AGOL supported Security Assertion Markup Language 2.0
(SAML) that was used to configure enterprise logins. SAML facilitated secure authentication
and authorization of data between an IDP and a Service Provider (SP) – AGOL was the SP (Esri
2017). The platform architecture result discussed in section 3.2.1 above provided additional
security information regarding a DMZ security approach. The AGOL platform provided a
scalable solution due to its capability to support expanded workloads.
3.2.2.7. Data Requirements
The PIA Data Table (Error! Reference source not found.) depicts data used for the PIA
application. The PDS GIS team chose all datasets that provide pertinent planning-related
information for Snohomish County, including the critical area layers that indicated areas where
development restrictions were in place due to environmental characteristics. See Error!
Reference source not found. below for the reason(s) why the team decided to include each
specific layer in the PIA application. The PDS GIS team housed the Snohomish County map and
feature service data in a geodatabase (Snohomish County Publish) that was specifically created
for map and feature services. Map and feature service REST endpoints were already in place on
the County’s ArcGIS Server (Production Server) and were configured with HTTP and HTTPS
ports. All County data was frequently updated (overnight) and maintained. External data
obtained from the Department of Natural Resources (DNR), Federal Emergency Management
Agency (FEMA), and the Department of Archaeological and Historical Preservation (DAHP)
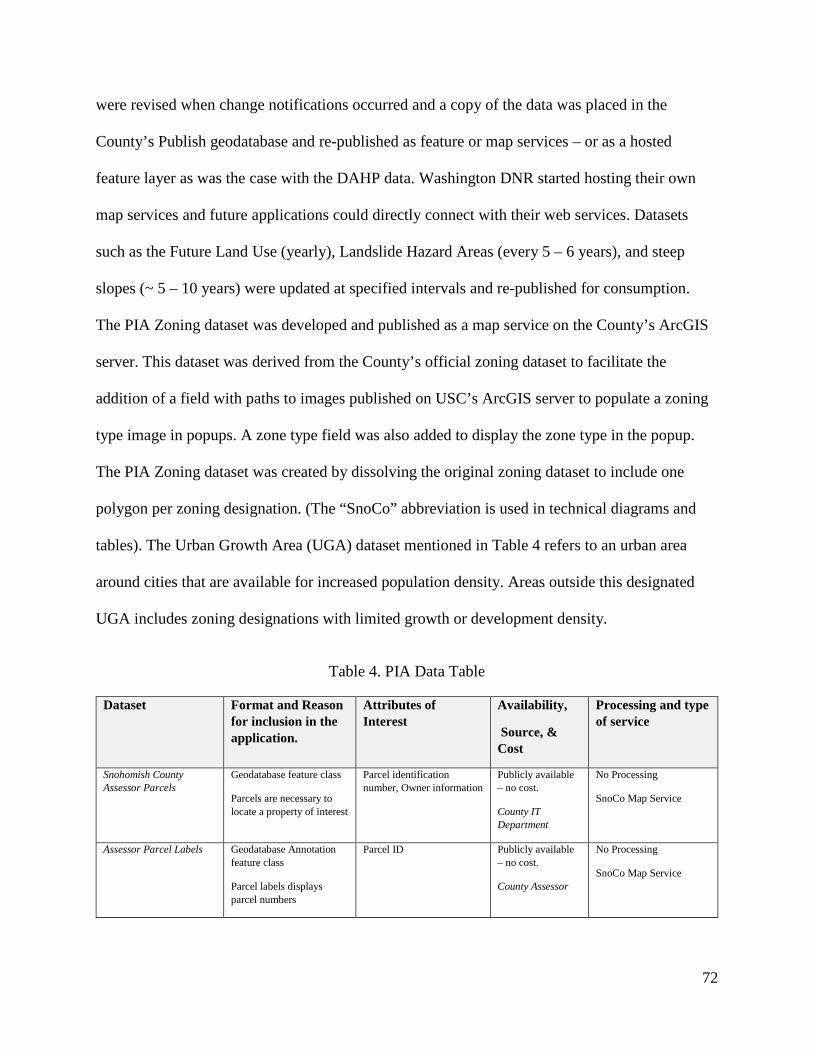
72
were revised when change notifications occurred and a copy of the data was placed in the
County’s Publish geodatabase and re-published as feature or map services – or as a hosted
feature layer as was the case with the DAHP data. Washington DNR started hosting their own
map services and future applications could directly connect with their web services. Datasets
such as the Future Land Use (yearly), Landslide Hazard Areas (every 5 – 6 years), and steep
slopes (~ 5 – 10 years) were updated at specified intervals and re-published for consumption.
The PIA Zoning dataset was developed and published as a map service on the County’s ArcGIS
server. This dataset was derived from the County’s official zoning dataset to facilitate the
addition of a field with paths to images published on USC’s ArcGIS server to populate a zoning
type image in popups. A zone type field was also added to display the zone type in the popup.
The PIA Zoning dataset was created by dissolving the original zoning dataset to include one
polygon per zoning designation. (The “SnoCo” abbreviation is used in technical diagrams and
tables). The Urban Growth Area (UGA) dataset mentioned in Table 4 refers to an urban area
around cities that are available for increased population density. Areas outside this designated
UGA includes zoning designations with limited growth or development density.
Table 4. PIA Data Table
Dataset Format and Reason for inclusion in the application.
Attributes of Interest
Availability,
Source, & Cost
Processing and type of service
Snohomish County Assessor Parcels
Geodatabase feature class
Parcels are necessary to locate a property of interest
Parcel identification number, Owner information
Publicly available – no cost.
County IT Department
No Processing
SnoCo Map Service
Assessor Parcel Labels
Geodatabase Annotation feature class
Parcel labels displays parcel numbers
Parcel ID Publicly available – no cost.
County Assessor
No Processing
SnoCo Map Service
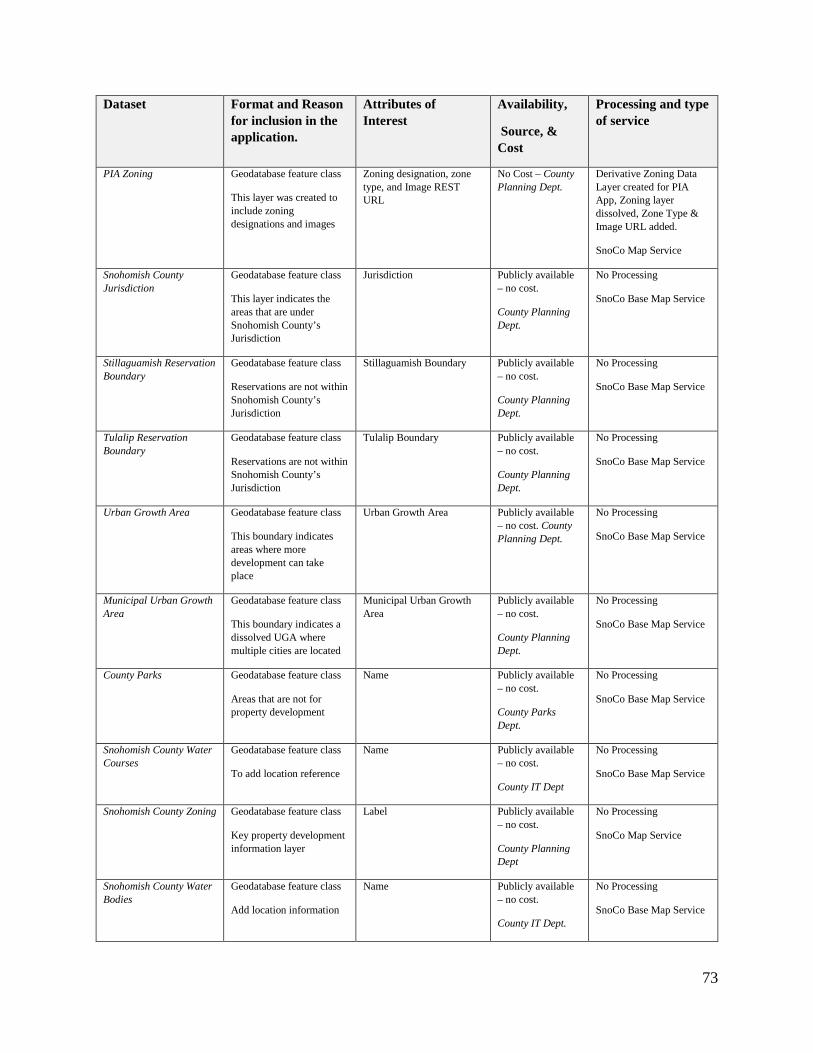
73
Dataset Format and Reason for inclusion in the application.
Attributes of Interest
Availability,
Source, & Cost
Processing and type of service
PIA Zoning Geodatabase feature class
This layer was created to include zoning designations and images
Zoning designation, zone type, and Image REST URL
No Cost – County Planning Dept.
Derivative Zoning Data Layer created for PIA App, Zoning layer dissolved, Zone Type & Image URL added.
SnoCo Map Service
Snohomish County Jurisdiction
Geodatabase feature class
This layer indicates the areas that are under Snohomish County’s Jurisdiction
Jurisdiction Publicly available – no cost.
County Planning Dept.
No Processing
SnoCo Base Map Service
Stillaguamish Reservation Boundary
Geodatabase feature class
Reservations are not within Snohomish County’s Jurisdiction
Stillaguamish Boundary Publicly available – no cost.
County Planning Dept.
No Processing
SnoCo Base Map Service
Tulalip Reservation Boundary
Geodatabase feature class
Reservations are not within Snohomish County’s Jurisdiction
Tulalip Boundary Publicly available – no cost.
County Planning Dept.
No Processing
SnoCo Base Map Service
Urban Growth Area
Geodatabase feature class
This boundary indicates areas where more development can take place
Urban Growth Area Publicly available – no cost. County Planning Dept.
No Processing
SnoCo Base Map Service
Municipal Urban Growth Area
Geodatabase feature class
This boundary indicates a dissolved UGA where multiple cities are located
Municipal Urban Growth Area
Publicly available – no cost.
County Planning Dept.
No Processing
SnoCo Base Map Service
County Parks Geodatabase feature class
Areas that are not for property development
Name Publicly available – no cost.
County Parks Dept.
No Processing
SnoCo Base Map Service
Snohomish County Water Courses
Geodatabase feature class
To add location reference
Name Publicly available – no cost.
County IT Dept
No Processing
SnoCo Base Map Service
Snohomish County Zoning Geodatabase feature class
Key property development information layer
Label Publicly available – no cost.
County Planning Dept
No Processing
SnoCo Map Service
Snohomish County Water Bodies
Geodatabase feature class
Add location information
Name Publicly available – no cost.
County IT Dept.
No Processing
SnoCo Base Map Service
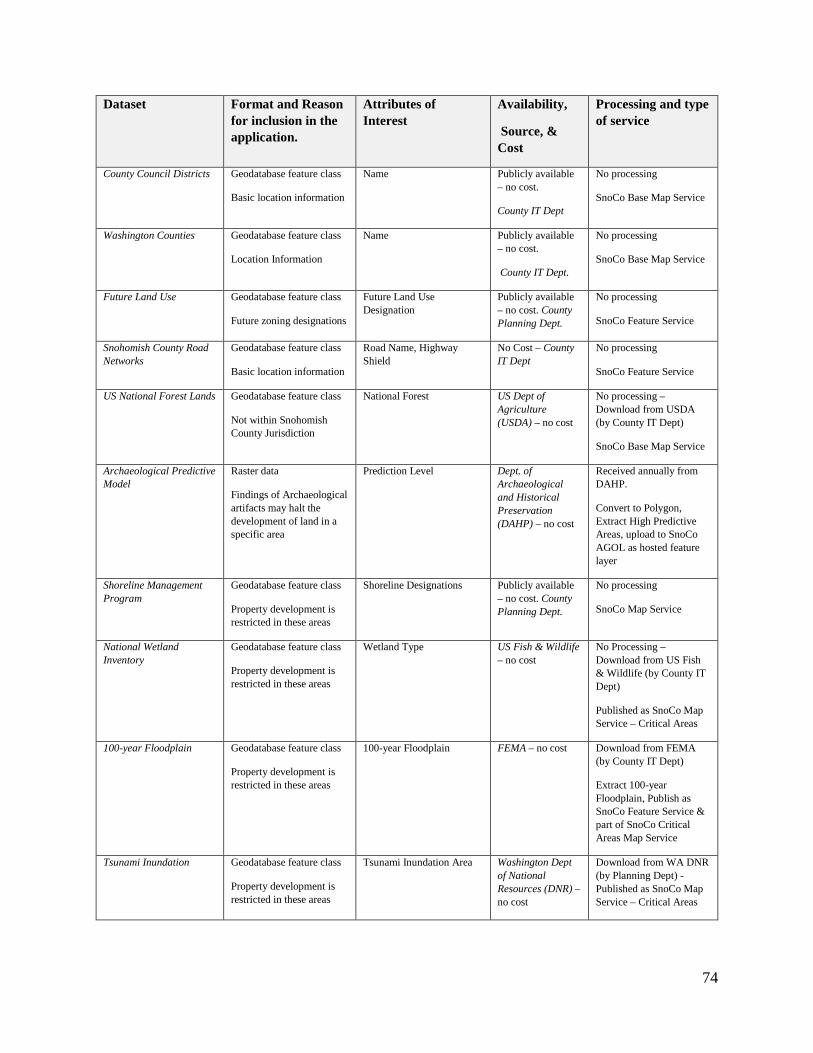
74
Dataset Format and Reason for inclusion in the application.
Attributes of Interest
Availability,
Source, & Cost
Processing and type of service
County Council Districts Geodatabase feature class
Basic location information
Name Publicly available – no cost.
County IT Dept
No processing
SnoCo Base Map Service
Washington Counties Geodatabase feature class
Location Information
Name Publicly available – no cost.
County IT Dept.
No processing
SnoCo Base Map Service
Future Land Use Geodatabase feature class
Future zoning designations
Future Land Use Designation
Publicly available – no cost. County Planning Dept.
No processing
SnoCo Feature Service
Snohomish County Road Networks
Geodatabase feature class
Basic location information
Road Name, Highway Shield
No Cost – County IT Dept
No processing
SnoCo Feature Service
US National Forest Lands Geodatabase feature class
Not within Snohomish County Jurisdiction
National Forest US Dept of Agriculture (USDA) – no cost
No processing – Download from USDA (by County IT Dept)
SnoCo Base Map Service
Archaeological Predictive Model
Raster data
Findings of Archaeological artifacts may halt the development of land in a specific area
Prediction Level Dept. of Archaeological and Historical Preservation (DAHP) – no cost
Received annually from DAHP.
Convert to Polygon, Extract High Predictive Areas, upload to SnoCo AGOL as hosted feature layer
Shoreline Management Program
Geodatabase feature class
Property development is restricted in these areas
Shoreline Designations Publicly available – no cost. County Planning Dept.
No processing
SnoCo Map Service
National Wetland Inventory
Geodatabase feature class
Property development is restricted in these areas
Wetland Type US Fish & Wildlife – no cost
No Processing – Download from US Fish & Wildlife (by County IT Dept)
Published as SnoCo Map Service – Critical Areas
100-year Floodplain Geodatabase feature class
Property development is restricted in these areas
100-year Floodplain FEMA – no cost Download from FEMA (by County IT Dept)
Extract 100-year Floodplain, Publish as SnoCo Feature Service & part of SnoCo Critical Areas Map Service
Tsunami Inundation Geodatabase feature class
Property development is restricted in these areas
Tsunami Inundation Area Washington Dept of National Resources (DNR) – no cost
Download from WA DNR (by Planning Dept) - Published as SnoCo Map Service – Critical Areas
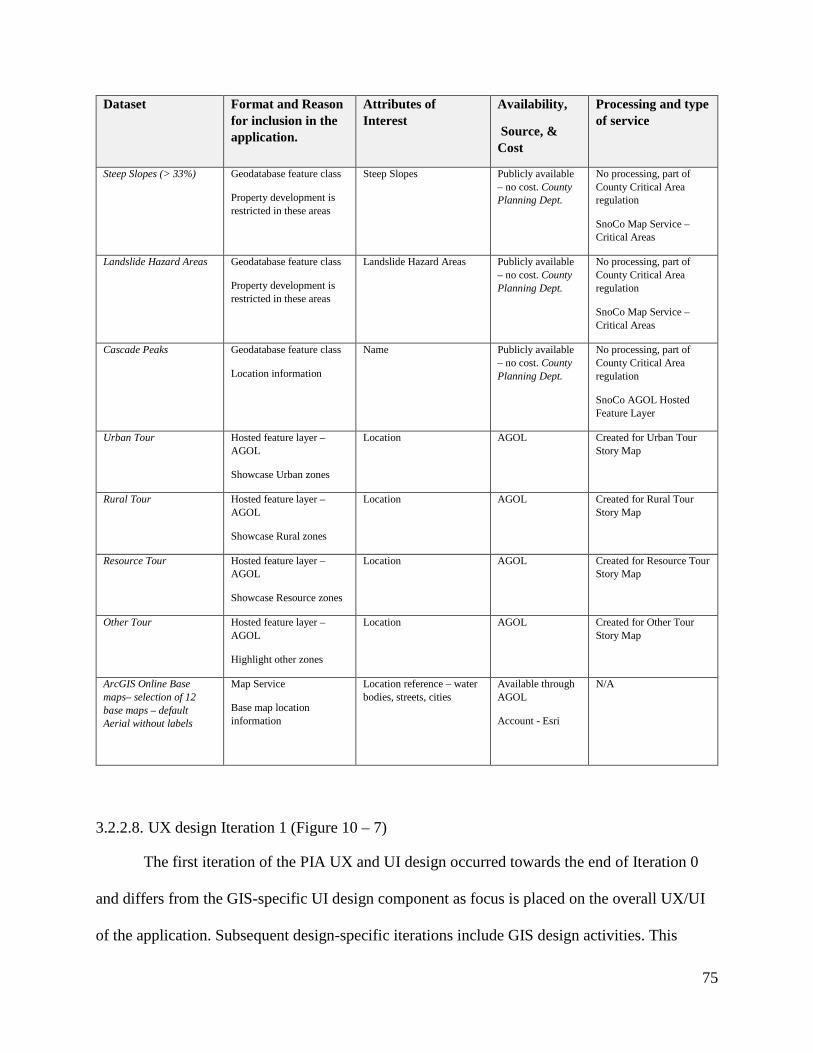
75
Dataset Format and Reason for inclusion in the application.
Attributes of Interest
Availability,
Source, & Cost
Processing and type of service
Steep Slopes (> 33%) Geodatabase feature class
Property development is restricted in these areas
Steep Slopes Publicly available – no cost. County Planning Dept.
No processing, part of County Critical Area regulation
SnoCo Map Service – Critical Areas
Landslide Hazard Areas Geodatabase feature class
Property development is restricted in these areas
Landslide Hazard Areas Publicly available – no cost. County Planning Dept.
No processing, part of County Critical Area regulation
SnoCo Map Service – Critical Areas
Cascade Peaks Geodatabase feature class
Location information
Name Publicly available – no cost. County Planning Dept.
No processing, part of County Critical Area regulation
SnoCo AGOL Hosted Feature Layer
Urban Tour Hosted feature layer – AGOL
Showcase Urban zones
Location AGOL Created for Urban Tour Story Map
Rural Tour Hosted feature layer – AGOL
Showcase Rural zones
Location AGOL Created for Rural Tour Story Map
Resource Tour Hosted feature layer – AGOL
Showcase Resource zones
Location AGOL Created for Resource Tour Story Map
Other Tour Hosted feature layer – AGOL
Highlight other zones
Location AGOL Created for Other Tour Story Map
ArcGIS Online Base maps– selection of 12 base maps – default Aerial without labels
Map Service
Base map location information
Location reference – water bodies, streets, cities
Available through AGOL
Account - Esri
N/A
3.2.2.8. UX design Iteration 1 (Figure 10 – 7)
The first iteration of the PIA UX and UI design occurred towards the end of Iteration 0
and differs from the GIS-specific UI design component as focus is placed on the overall UX/UI
of the application. Subsequent design-specific iterations include GIS design activities. This
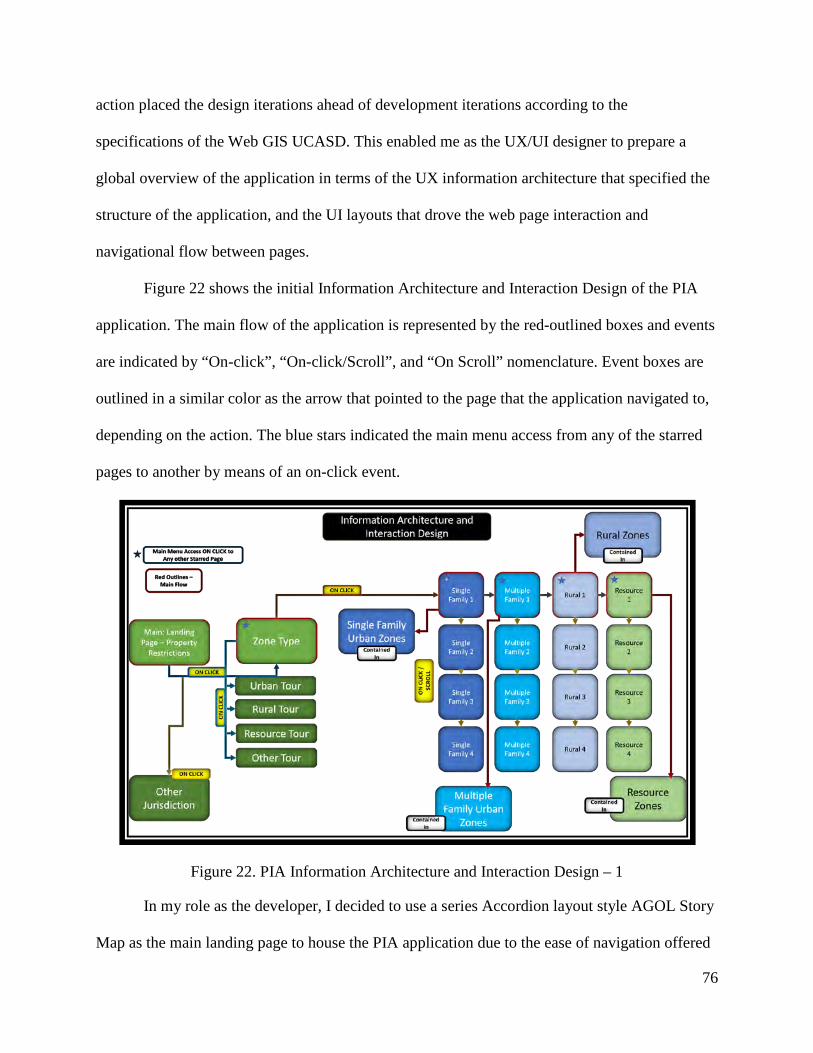
76
action placed the design iterations ahead of development iterations according to the
specifications of the Web GIS UCASD. This enabled me as the UX/UI designer to prepare a
global overview of the application in terms of the UX information architecture that specified the
structure of the application, and the UI layouts that drove the web page interaction and
navigational flow between pages.
Figure 22 shows the initial Information Architecture and Interaction Design of the PIA
application. The main flow of the application is represented by the red-outlined boxes and events
are indicated by “On-click”, “On-click/Scroll”, and “On Scroll” nomenclature. Event boxes are
outlined in a similar color as the arrow that pointed to the page that the application navigated to,
depending on the action. The blue stars indicated the main menu access from any of the starred
pages to another by means of an on-click event.
Figure 22. PIA Information Architecture and Interaction Design – 1
In my role as the developer, I decided to use a series Accordion layout style AGOL Story
Map as the main landing page to house the PIA application due to the ease of navigation offered
77
through this template. The customer clicks on a step on the left side of the application to navigate
to the appropriate page. The Information Architecture diagram describes the landing page of the
PIA. The team chose the AGOL Story Map Tour template to provide zone type tours. The Map
Tour template provided an ideal linear navigation stream through the zone types. We chose the
Map Journal template to provide further educational material regarding each zone type because it
provided a desired balance between text and visuals that include the educational zone-specific
information to the user. We chose the Shortlist template for the “Other Jurisdiction” interactive
map. The Shortlist template provides a layout with functionality that will be perfect for the
“Other Jurisdiction” interactive application.
. The PIA team used the low-fidelity prototypes (drawn up during the first focus group
meeting) along with the User Stories to further the design process and to start with development
of the PIA application (x). The UX/UI designer created several wireframe prototypes during
Iteration 0 that continued throughout the construction iterations. Early and frequent prototyping
was important to adapt to changes proposed by the Customer Team. Each focus group meeting
facilitated this process.
3.2.3. Post-Iteration 0 Design and Development Iterations
Design and development iterations followed the Scrum framework activities in an
iterative manner and included sprint planning, a daily scrum session, as well as inspection and
adaptation review activities. I (as the developer and designer) worked on all the iteration-specific
development and design activities. All design and development iterations were one week in
duration. The PO, Scrum Master, myself as the UX/UI designer and developer, the senior
permitting planners, and the Customer Team attended all the focus group meetings. The Scrum
Master was responsible for scheduling and facilitating all the focus group meetings. The main
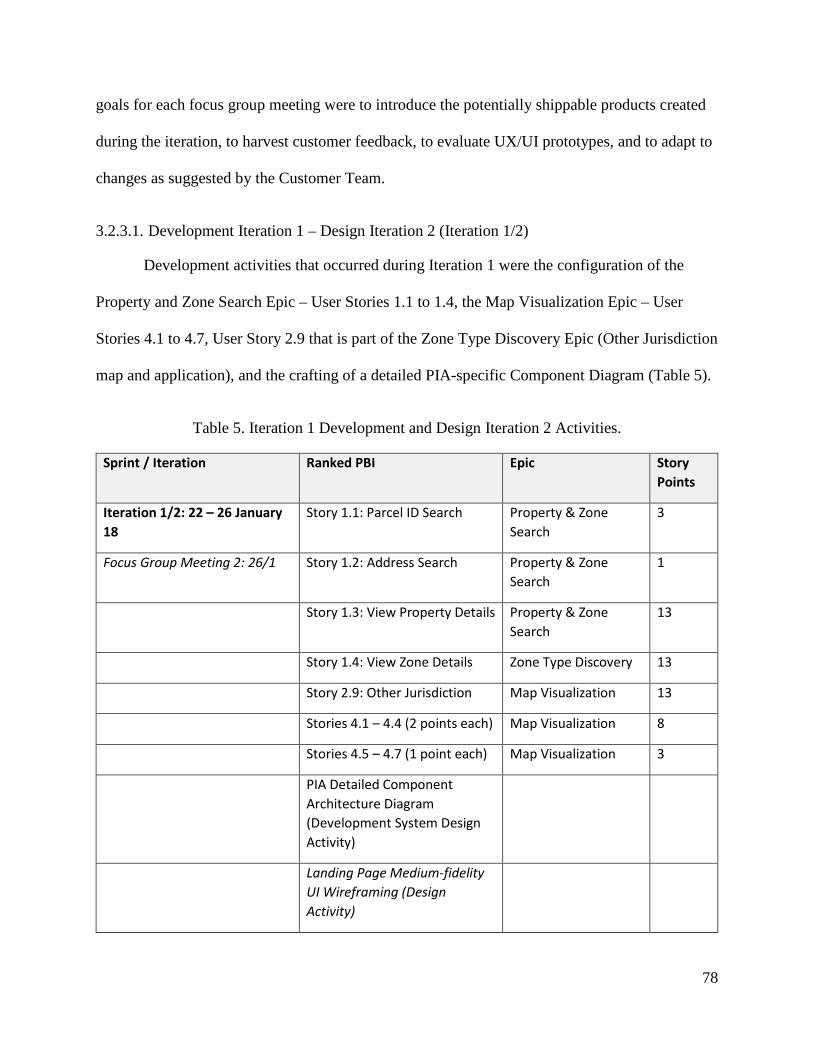
78
goals for each focus group meeting were to introduce the potentially shippable products created
during the iteration, to harvest customer feedback, to evaluate UX/UI prototypes, and to adapt to
changes as suggested by the Customer Team.
3.2.3.1. Development Iteration 1 – Design Iteration 2 (Iteration 1/2)
Development activities that occurred during Iteration 1 were the configuration of the
Property and Zone Search Epic – User Stories 1.1 to 1.4, the Map Visualization Epic – User
Stories 4.1 to 4.7, User Story 2.9 that is part of the Zone Type Discovery Epic (Other Jurisdiction
map and application), and the crafting of a detailed PIA-specific Component Diagram (Table 5).
Table 5. Iteration 1 Development and Design Iteration 2 Activities.
Sprint / Iteration Ranked PBI Epic Story Points
Iteration 1/2: 22 – 26 January 18
Story 1.1: Parcel ID Search Property & Zone Search
3
Focus Group Meeting 2: 26/1 Story 1.2: Address Search Property & Zone Search
1
Story 1.3: View Property Details Property & Zone Search
13
Story 1.4: View Zone Details Zone Type Discovery 13
Story 2.9: Other Jurisdiction Map Visualization 13
Stories 4.1 – 4.4 (2 points each) Map Visualization 8
Stories 4.5 – 4.7 (1 point each) Map Visualization 3
PIA Detailed Component Architecture Diagram (Development System Design Activity)
Landing Page Medium-fidelity UI Wireframing (Design Activity)
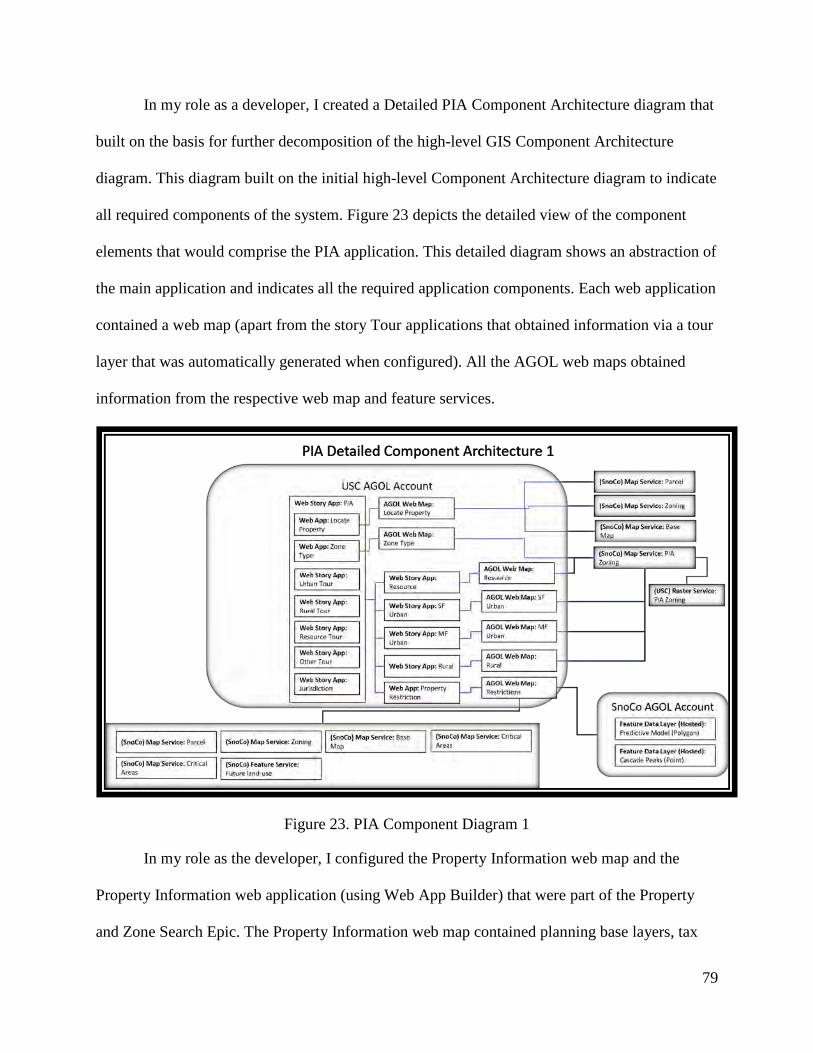
79
In my role as a developer, I created a Detailed PIA Component Architecture diagram that
built on the basis for further decomposition of the high-level GIS Component Architecture
diagram. This diagram built on the initial high-level Component Architecture diagram to indicate
all required components of the system. Figure 23 depicts the detailed view of the component
elements that would comprise the PIA application. This detailed diagram shows an abstraction of
the main application and indicates all the required application components. Each web application
contained a web map (apart from the story Tour applications that obtained information via a tour
layer that was automatically generated when configured). All the AGOL web maps obtained
information from the respective web map and feature services.
Figure 23. PIA Component Diagram 1
In my role as the developer, I configured the Property Information web map and the
Property Information web application (using Web App Builder) that were part of the Property
and Zone Search Epic. The Property Information web map contained planning base layers, tax
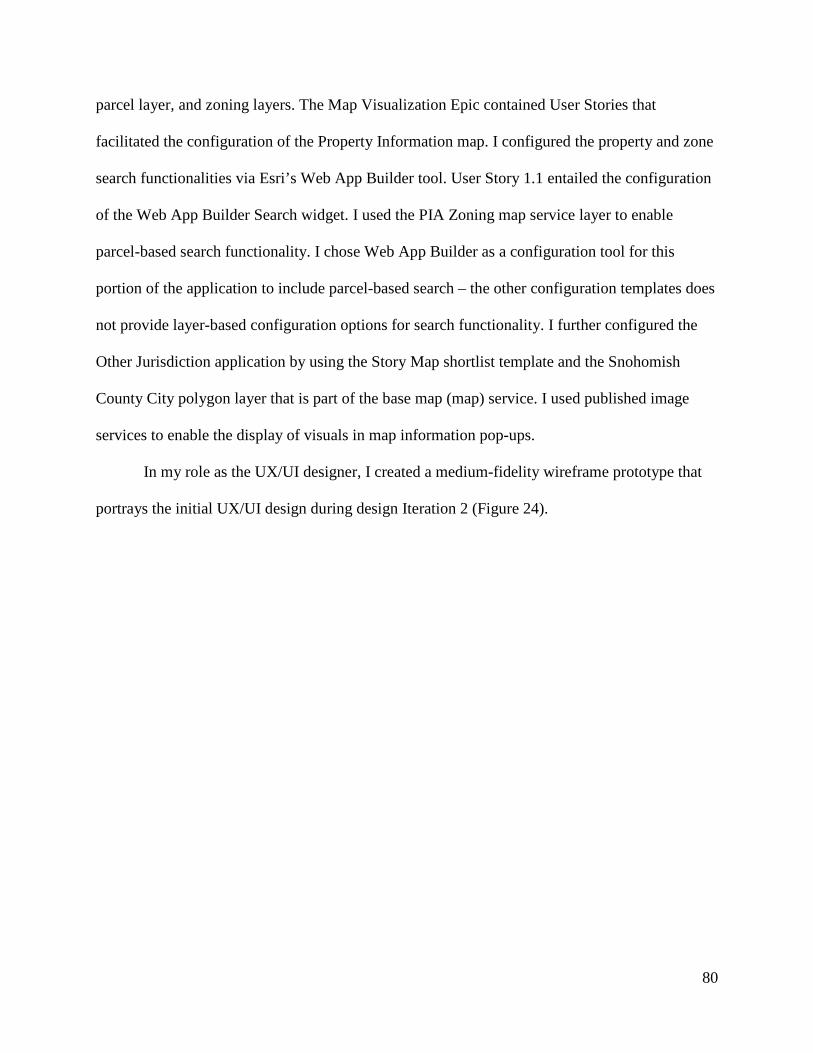
80
parcel layer, and zoning layers. The Map Visualization Epic contained User Stories that
facilitated the configuration of the Property Information map. I configured the property and zone
search functionalities via Esri’s Web App Builder tool. User Story 1.1 entailed the configuration
of the Web App Builder Search widget. I used the PIA Zoning map service layer to enable
parcel-based search functionality. I chose Web App Builder as a configuration tool for this
portion of the application to include parcel-based search – the other configuration templates does
not provide layer-based configuration options for search functionality. I further configured the
Other Jurisdiction application by using the Story Map shortlist template and the Snohomish
County City polygon layer that is part of the base map (map) service. I used published image
services to enable the display of visuals in map information pop-ups.
In my role as the UX/UI designer, I created a medium-fidelity wireframe prototype that
portrays the initial UX/UI design during design Iteration 2 (Figure 24).
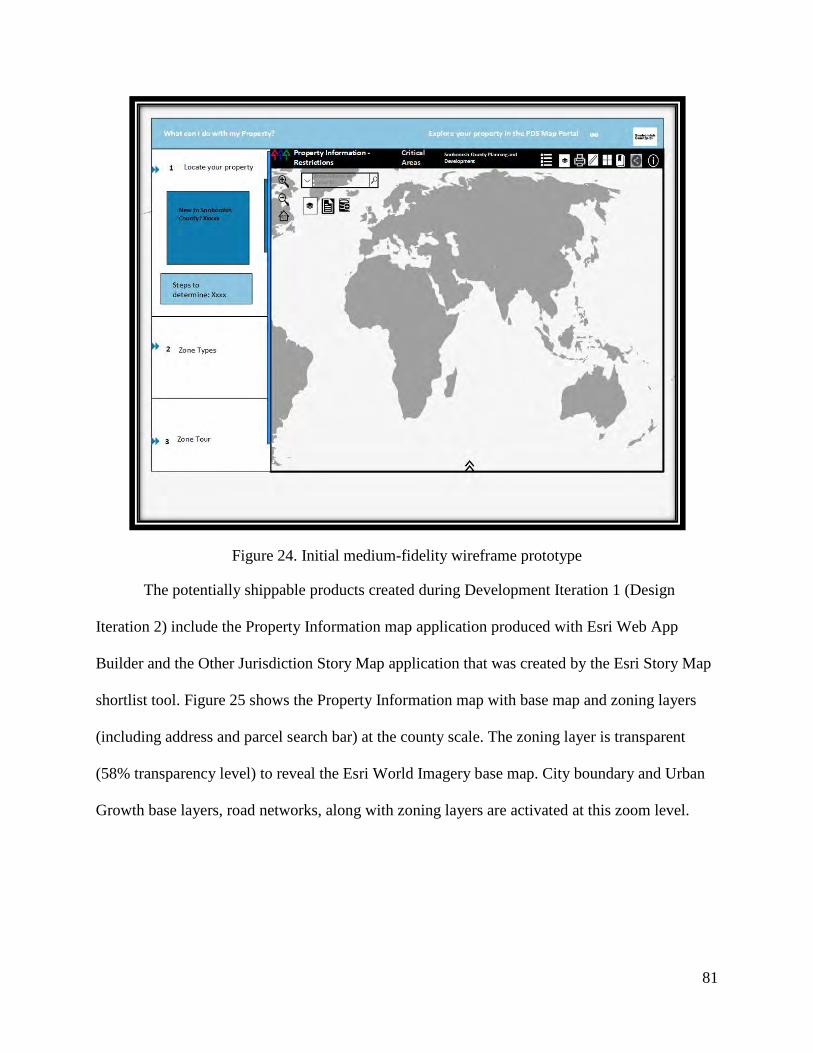
81
Figure 24. Initial medium-fidelity wireframe prototype
The potentially shippable products created during Development Iteration 1 (Design
Iteration 2) include the Property Information map application produced with Esri Web App
Builder and the Other Jurisdiction Story Map application that was created by the Esri Story Map
shortlist tool. Figure 25 shows the Property Information map with base map and zoning layers
(including address and parcel search bar) at the county scale. The zoning layer is transparent
(58% transparency level) to reveal the Esri World Imagery base map. City boundary and Urban
Growth base layers, road networks, along with zoning layers are activated at this zoom level.
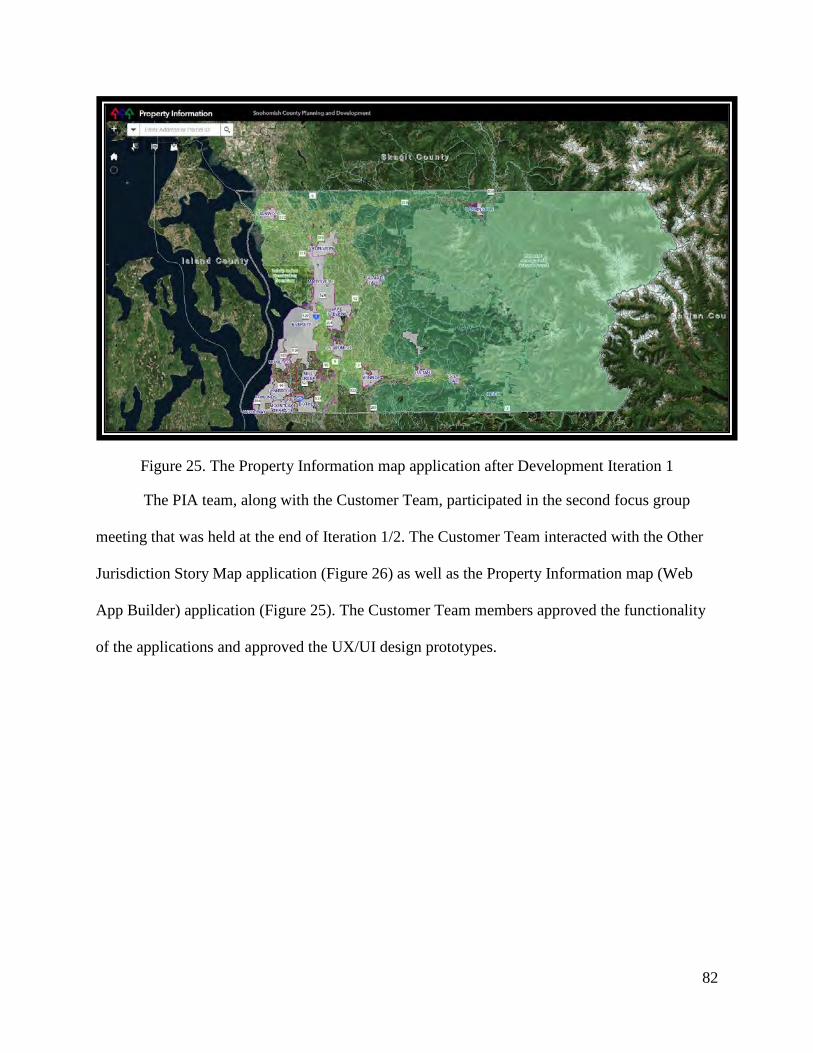
82
Figure 25. The Property Information map application after Development Iteration 1
The PIA team, along with the Customer Team, participated in the second focus group
meeting that was held at the end of Iteration 1/2. The Customer Team interacted with the Other
Jurisdiction Story Map application (Figure 26) as well as the Property Information map (Web
App Builder) application (Figure 25). The Customer Team members approved the functionality
of the applications and approved the UX/UI design prototypes.
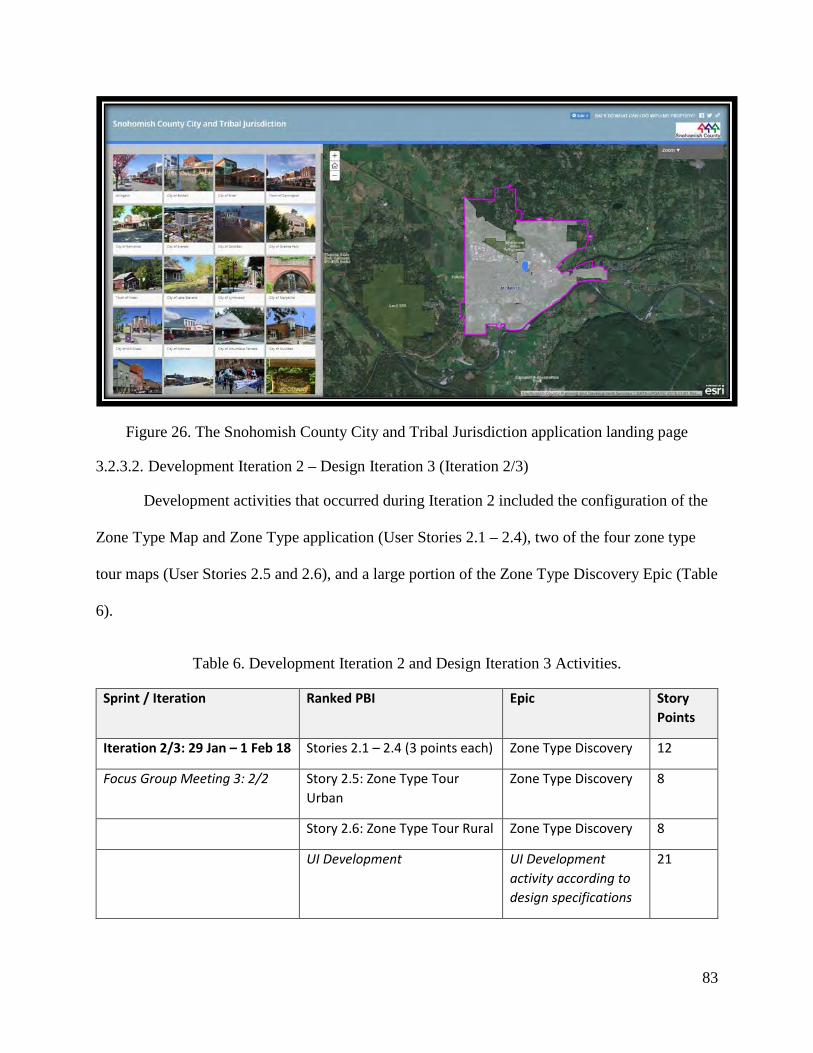
83
Figure 26. The Snohomish County City and Tribal Jurisdiction application landing page
3.2.3.2. Development Iteration 2 – Design Iteration 3 (Iteration 2/3)
Development activities that occurred during Iteration 2 included the configuration of the
Zone Type Map and Zone Type application (User Stories 2.1 – 2.4), two of the four zone type
tour maps (User Stories 2.5 and 2.6), and a large portion of the Zone Type Discovery Epic (Table
6).
Table 6. Development Iteration 2 and Design Iteration 3 Activities.
Sprint / Iteration Ranked PBI Epic Story Points
Iteration 2/3: 29 Jan – 1 Feb 18 Stories 2.1 – 2.4 (3 points each) Zone Type Discovery 12
Focus Group Meeting 3: 2/2 Story 2.5: Zone Type Tour Urban
Zone Type Discovery 8
Story 2.6: Zone Type Tour Rural Zone Type Discovery 8
UI Development UI Development activity according to design specifications
21
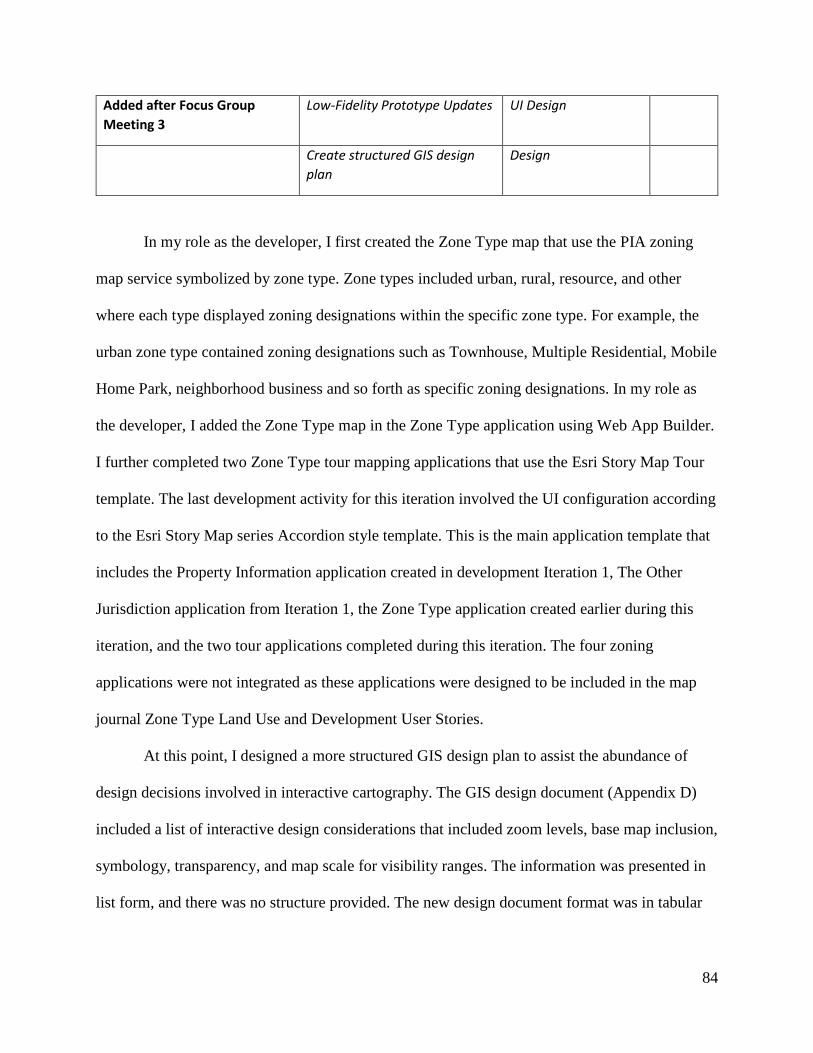
84
Added after Focus Group Meeting 3
Low-Fidelity Prototype Updates UI Design
Create structured GIS design plan
Design
In my role as the developer, I first created the Zone Type map that use the PIA zoning
map service symbolized by zone type. Zone types included urban, rural, resource, and other
where each type displayed zoning designations within the specific zone type. For example, the
urban zone type contained zoning designations such as Townhouse, Multiple Residential, Mobile
Home Park, neighborhood business and so forth as specific zoning designations. In my role as
the developer, I added the Zone Type map in the Zone Type application using Web App Builder.
I further completed two Zone Type tour mapping applications that use the Esri Story Map Tour
template. The last development activity for this iteration involved the UI configuration according
to the Esri Story Map series Accordion style template. This is the main application template that
includes the Property Information application created in development Iteration 1, The Other
Jurisdiction application from Iteration 1, the Zone Type application created earlier during this
iteration, and the two tour applications completed during this iteration. The four zoning
applications were not integrated as these applications were designed to be included in the map
journal Zone Type Land Use and Development User Stories.
At this point, I designed a more structured GIS design plan to assist the abundance of
design decisions involved in interactive cartography. The GIS design document (Appendix D)
included a list of interactive design considerations that included zoom levels, base map inclusion,
symbology, transparency, and map scale for visibility ranges. The information was presented in
list form, and there was no structure provided. The new design document format was in tabular
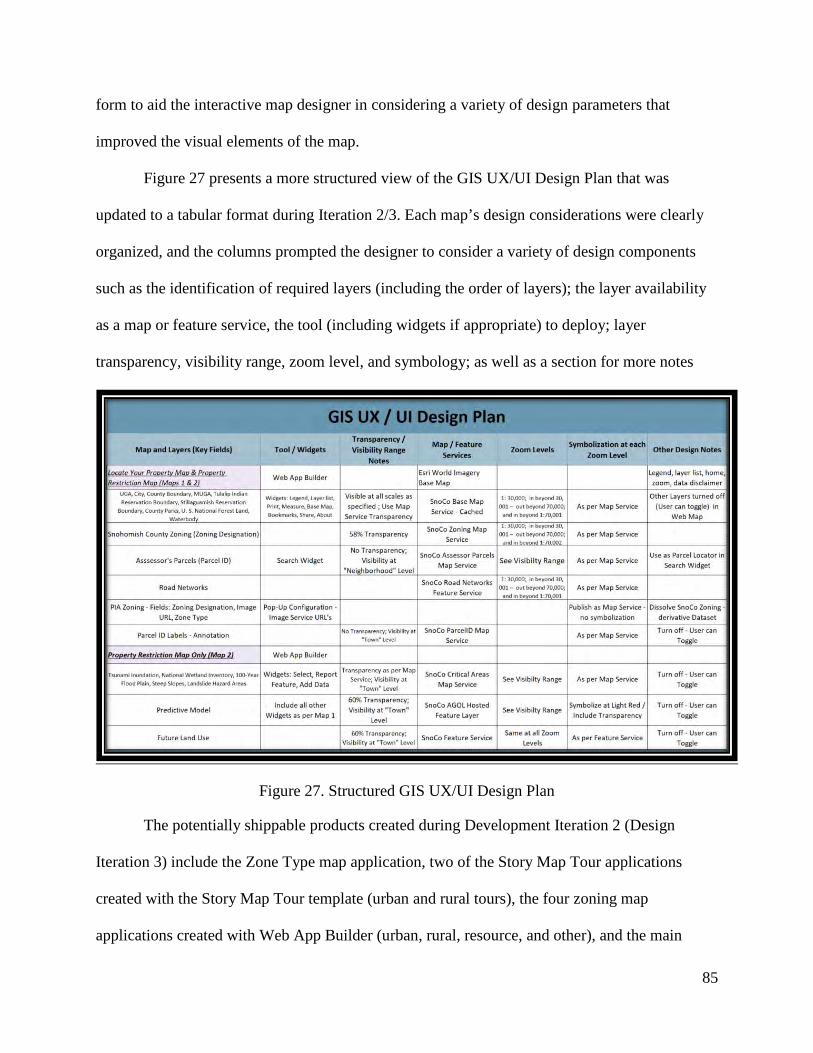
85
form to aid the interactive map designer in considering a variety of design parameters that
improved the visual elements of the map.
Figure 27 presents a more structured view of the GIS UX/UI Design Plan that was
updated to a tabular format during Iteration 2/3. Each map’s design considerations were clearly
organized, and the columns prompted the designer to consider a variety of design components
such as the identification of required layers (including the order of layers); the layer availability
as a map or feature service, the tool (including widgets if appropriate) to deploy; layer
transparency, visibility range, zoom level, and symbology; as well as a section for more notes
Figure 27. Structured GIS UX/UI Design Plan
The potentially shippable products created during Development Iteration 2 (Design
Iteration 3) include the Zone Type map application, two of the Story Map Tour applications
created with the Story Map Tour template (urban and rural tours), the four zoning map
applications created with Web App Builder (urban, rural, resource, and other), and the main
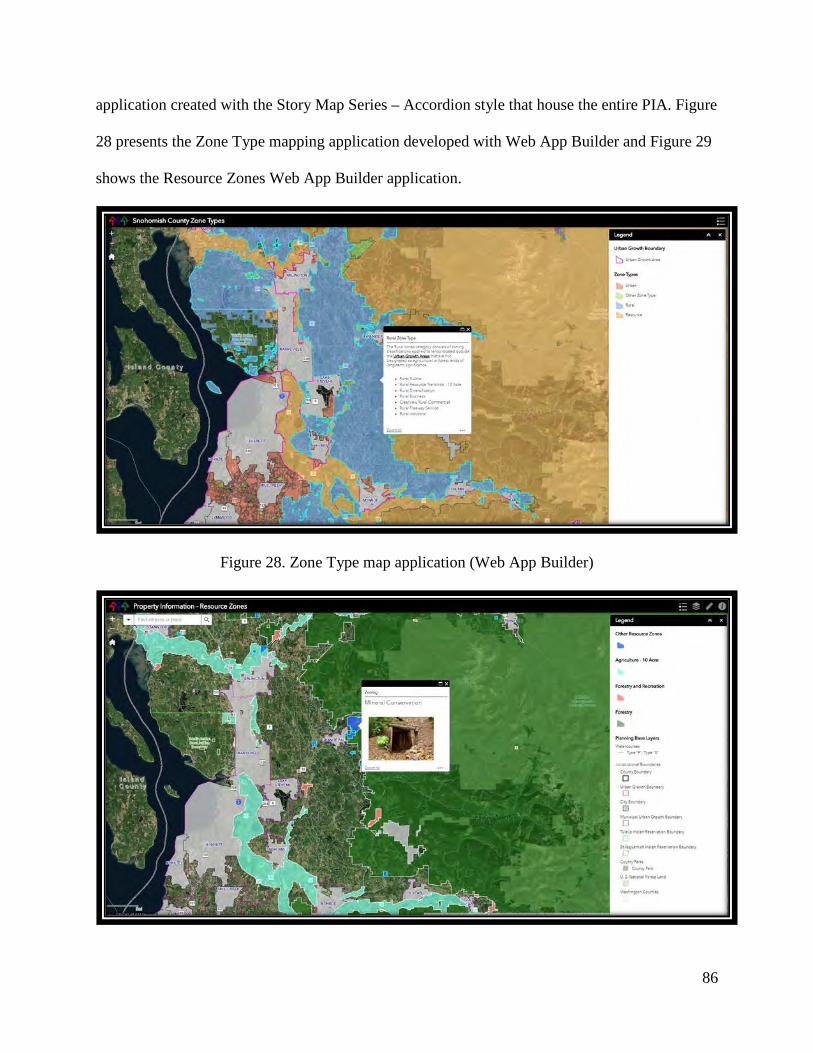
86
application created with the Story Map Series – Accordion style that house the entire PIA. Figure
28 presents the Zone Type mapping application developed with Web App Builder and Figure 29
shows the Resource Zones Web App Builder application.
Figure 28. Zone Type map application (Web App Builder)
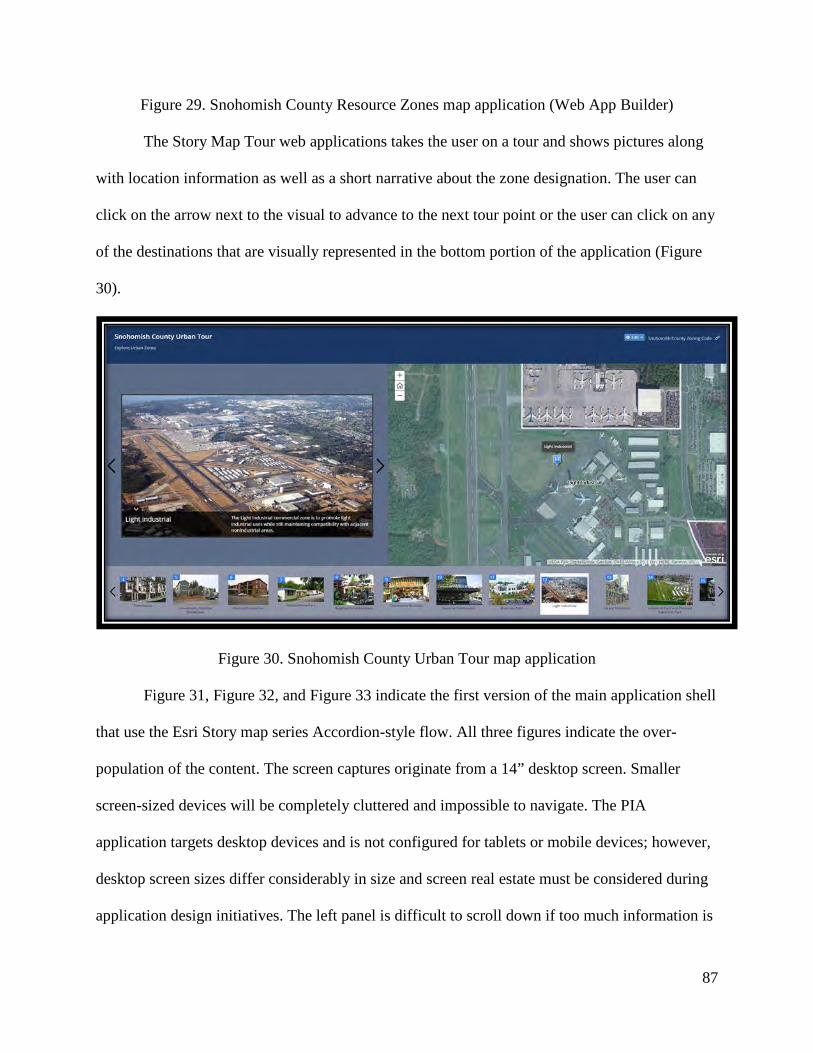
87
Figure 29. Snohomish County Resource Zones map application (Web App Builder)
The Story Map Tour web applications takes the user on a tour and shows pictures along
with location information as well as a short narrative about the zone designation. The user can
click on the arrow next to the visual to advance to the next tour point or the user can click on any
of the destinations that are visually represented in the bottom portion of the application (Figure
30).
Figure 30. Snohomish County Urban Tour map application
Figure 31, Figure 32, and Figure 33 indicate the first version of the main application shell
that use the Esri Story map series Accordion-style flow. All three figures indicate the over-
population of the content. The screen captures originate from a 14” desktop screen. Smaller
screen-sized devices will be completely cluttered and impossible to navigate. The PIA
application targets desktop devices and is not configured for tablets or mobile devices; however,
desktop screen sizes differ considerably in size and screen real estate must be considered during
application design initiatives. The left panel is difficult to scroll down if too much information is
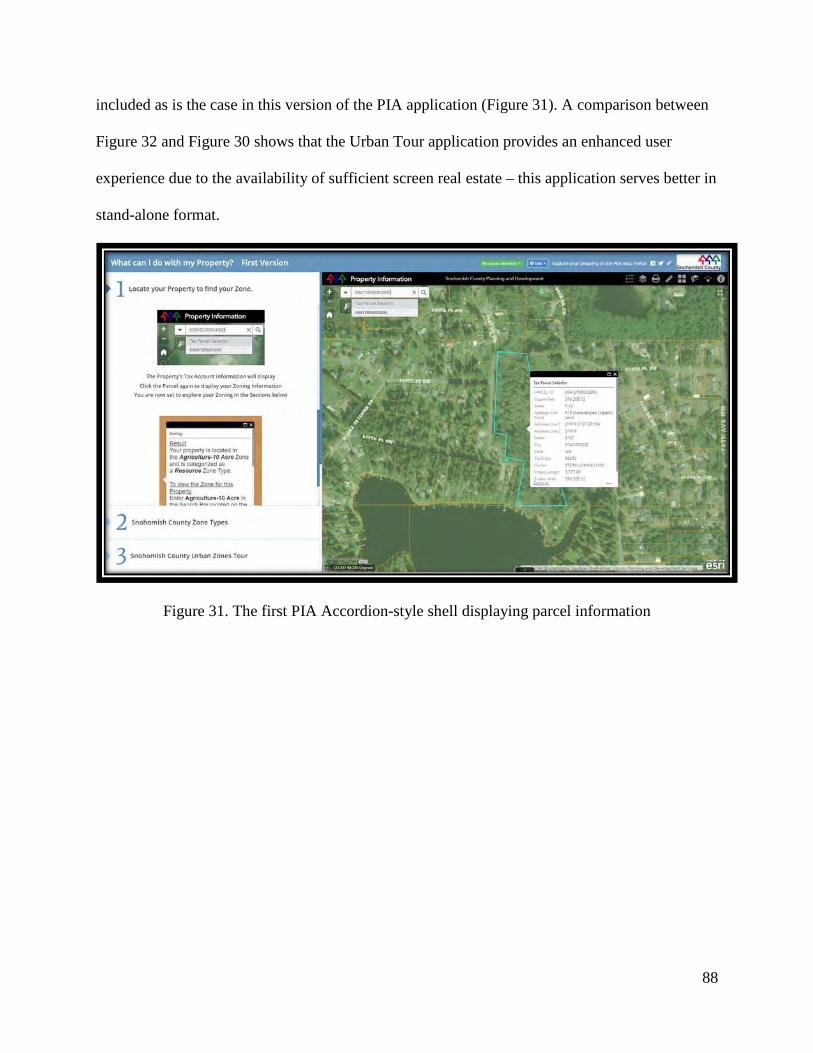
88
included as is the case in this version of the PIA application (Figure 31). A comparison between
Figure 32 and Figure 30 shows that the Urban Tour application provides an enhanced user
experience due to the availability of sufficient screen real estate – this application serves better in
stand-alone format.
Figure 31. The first PIA Accordion-style shell displaying parcel information
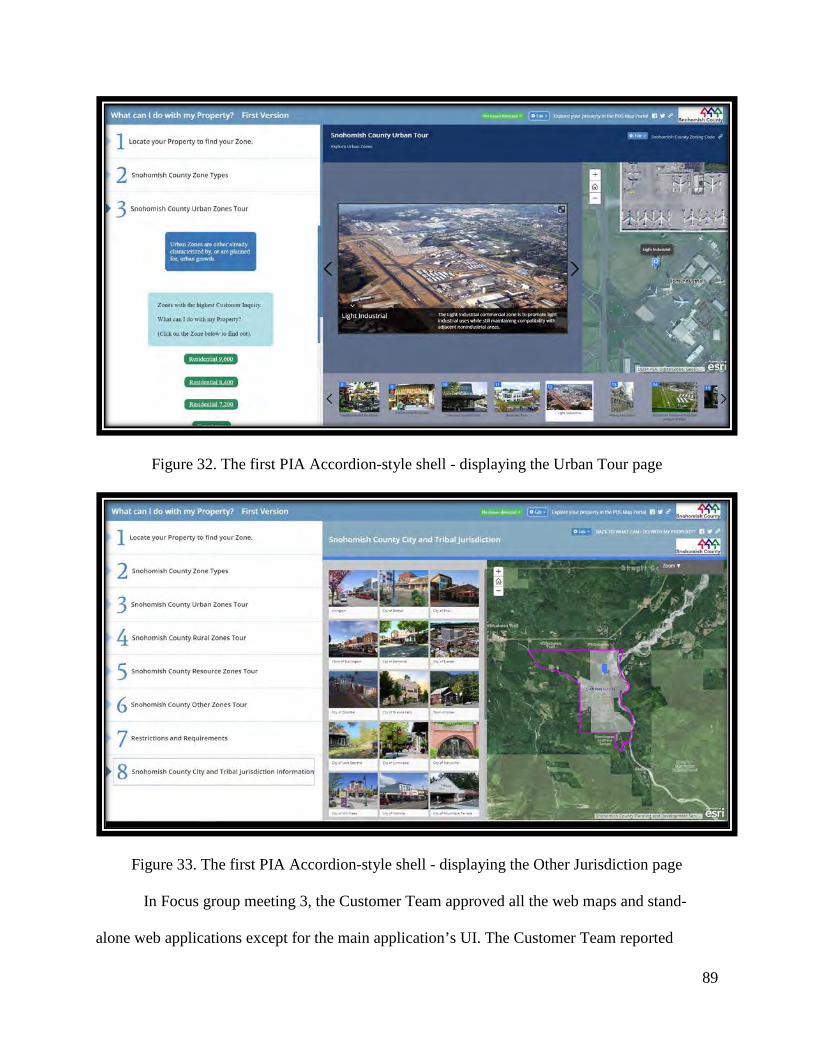
89
Figure 32. The first PIA Accordion-style shell - displaying the Urban Tour page
Figure 33. The first PIA Accordion-style shell - displaying the Other Jurisdiction page
In Focus group meeting 3, the Customer Team approved all the web maps and stand-
alone web applications except for the main application’s UI. The Customer Team reported
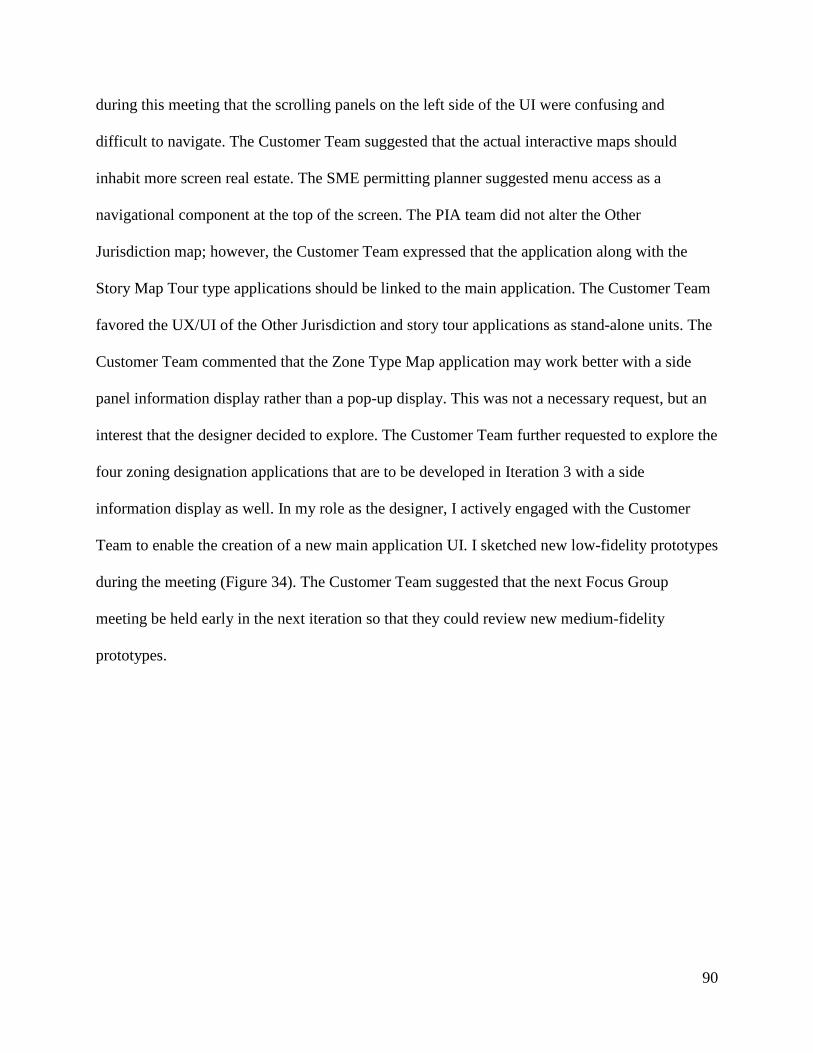
90
during this meeting that the scrolling panels on the left side of the UI were confusing and
difficult to navigate. The Customer Team suggested that the actual interactive maps should
inhabit more screen real estate. The SME permitting planner suggested menu access as a
navigational component at the top of the screen. The PIA team did not alter the Other
Jurisdiction map; however, the Customer Team expressed that the application along with the
Story Map Tour type applications should be linked to the main application. The Customer Team
favored the UX/UI of the Other Jurisdiction and story tour applications as stand-alone units. The
Customer Team commented that the Zone Type Map application may work better with a side
panel information display rather than a pop-up display. This was not a necessary request, but an
interest that the designer decided to explore. The Customer Team further requested to explore the
four zoning designation applications that are to be developed in Iteration 3 with a side
information display as well. In my role as the designer, I actively engaged with the Customer
Team to enable the creation of a new main application UI. I sketched new low-fidelity prototypes
during the meeting (Figure 34). The Customer Team suggested that the next Focus Group
meeting be held early in the next iteration so that they could review new medium-fidelity
prototypes.
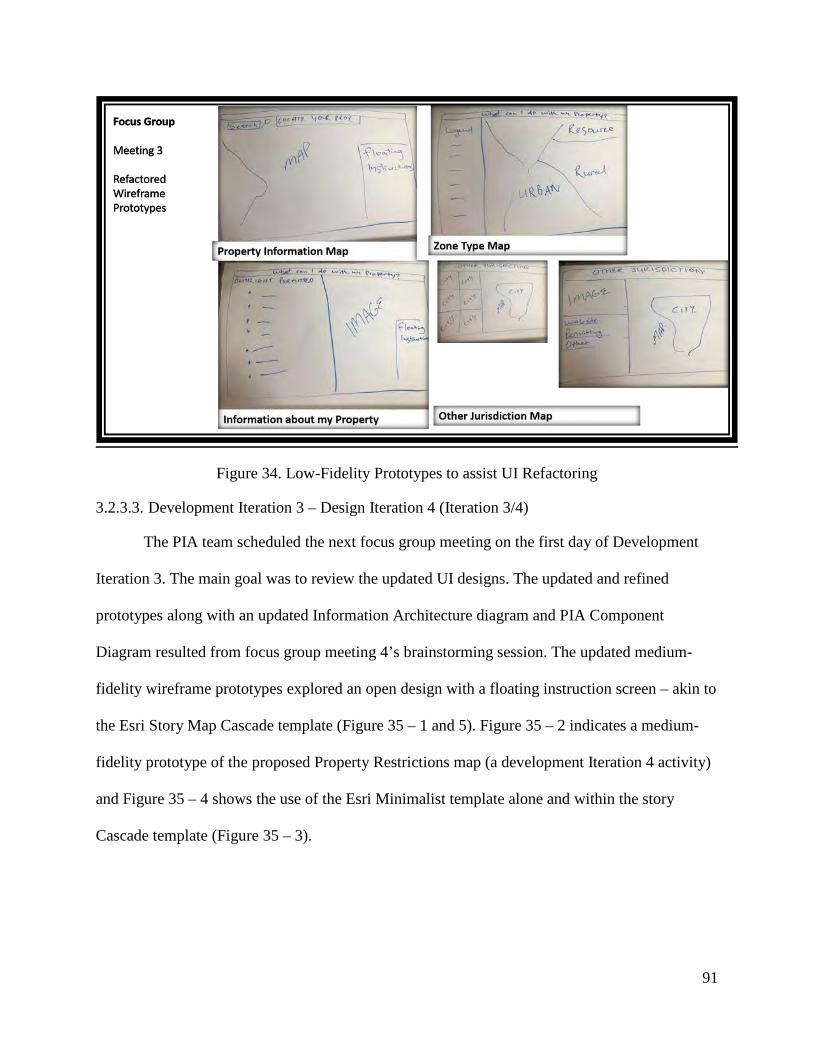
91
Figure 34. Low-Fidelity Prototypes to assist UI Refactoring
3.2.3.3. Development Iteration 3 – Design Iteration 4 (Iteration 3/4)
The PIA team scheduled the next focus group meeting on the first day of Development
Iteration 3. The main goal was to review the updated UI designs. The updated and refined
prototypes along with an updated Information Architecture diagram and PIA Component
Diagram resulted from focus group meeting 4’s brainstorming session. The updated medium-
fidelity wireframe prototypes explored an open design with a floating instruction screen – akin to
the Esri Story Map Cascade template (Figure 35 – 1 and 5). Figure 35 – 2 indicates a medium-
fidelity prototype of the proposed Property Restrictions map (a development Iteration 4 activity)
and Figure 35 – 4 shows the use of the Esri Minimalist template alone and within the story
Cascade template (Figure 35 – 3).
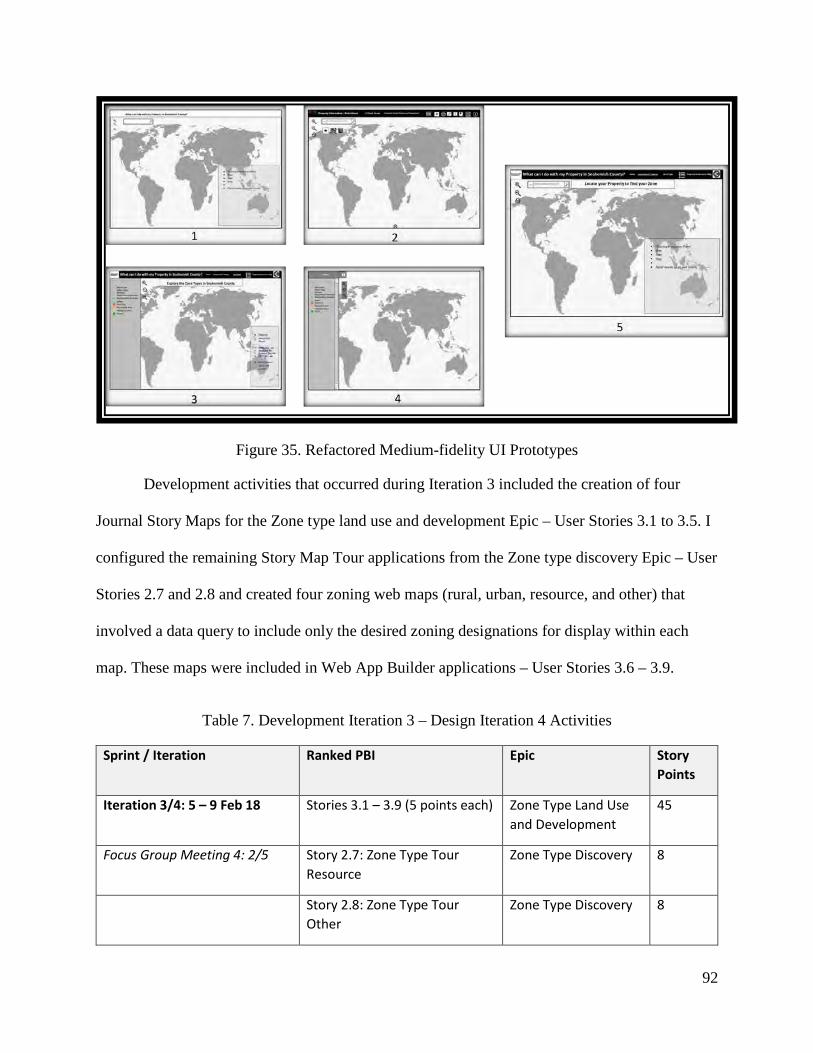
92
Figure 35. Refactored Medium-fidelity UI Prototypes
Development activities that occurred during Iteration 3 included the creation of four
Journal Story Maps for the Zone type land use and development Epic – User Stories 3.1 to 3.5. I
configured the remaining Story Map Tour applications from the Zone type discovery Epic – User
Stories 2.7 and 2.8 and created four zoning web maps (rural, urban, resource, and other) that
involved a data query to include only the desired zoning designations for display within each
map. These maps were included in Web App Builder applications – User Stories 3.6 – 3.9.
Table 7. Development Iteration 3 – Design Iteration 4 Activities
Sprint / Iteration Ranked PBI Epic Story Points
Iteration 3/4: 5 – 9 Feb 18 Stories 3.1 – 3.9 (5 points each) Zone Type Land Use and Development
45
Focus Group Meeting 4: 2/5 Story 2.7: Zone Type Tour Resource
Zone Type Discovery 8
Story 2.8: Zone Type Tour Other
Zone Type Discovery 8
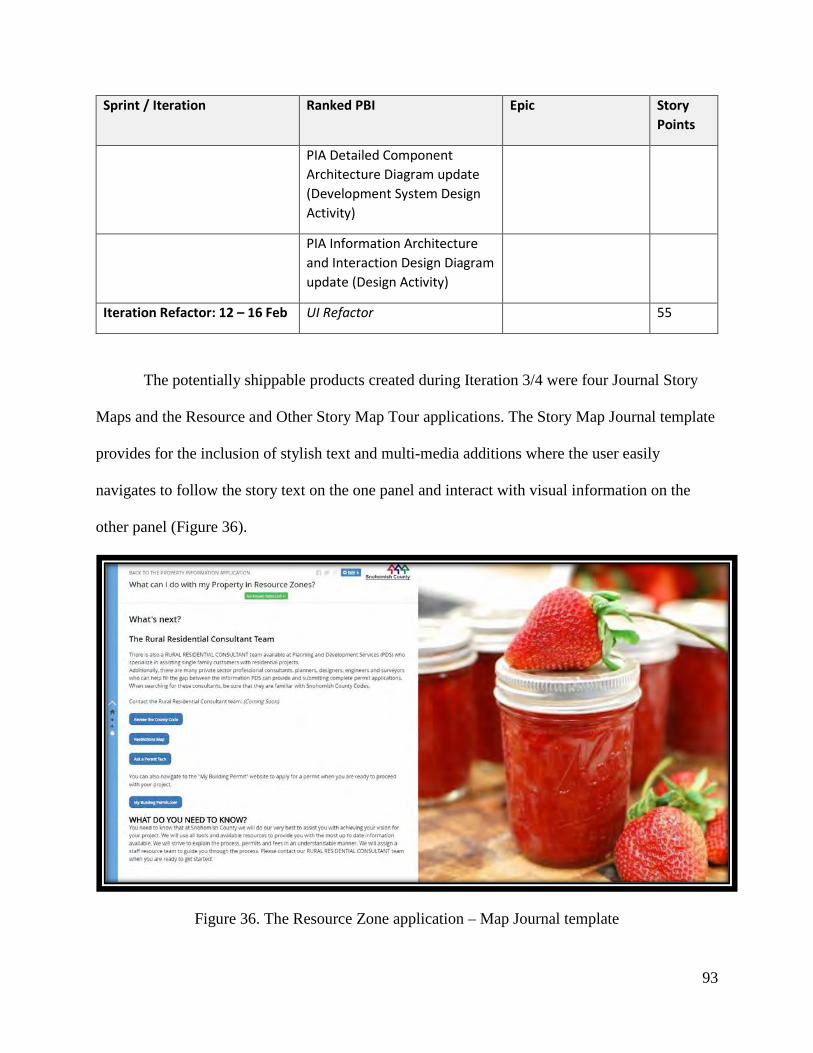
93
Sprint / Iteration Ranked PBI Epic Story Points
PIA Detailed Component Architecture Diagram update (Development System Design Activity)
PIA Information Architecture and Interaction Design Diagram update (Design Activity)
Iteration Refactor: 12 – 16 Feb UI Refactor 55
The potentially shippable products created during Iteration 3/4 were four Journal Story
Maps and the Resource and Other Story Map Tour applications. The Story Map Journal template
provides for the inclusion of stylish text and multi-media additions where the user easily
navigates to follow the story text on the one panel and interact with visual information on the
other panel (Figure 36).
Figure 36. The Resource Zone application – Map Journal template
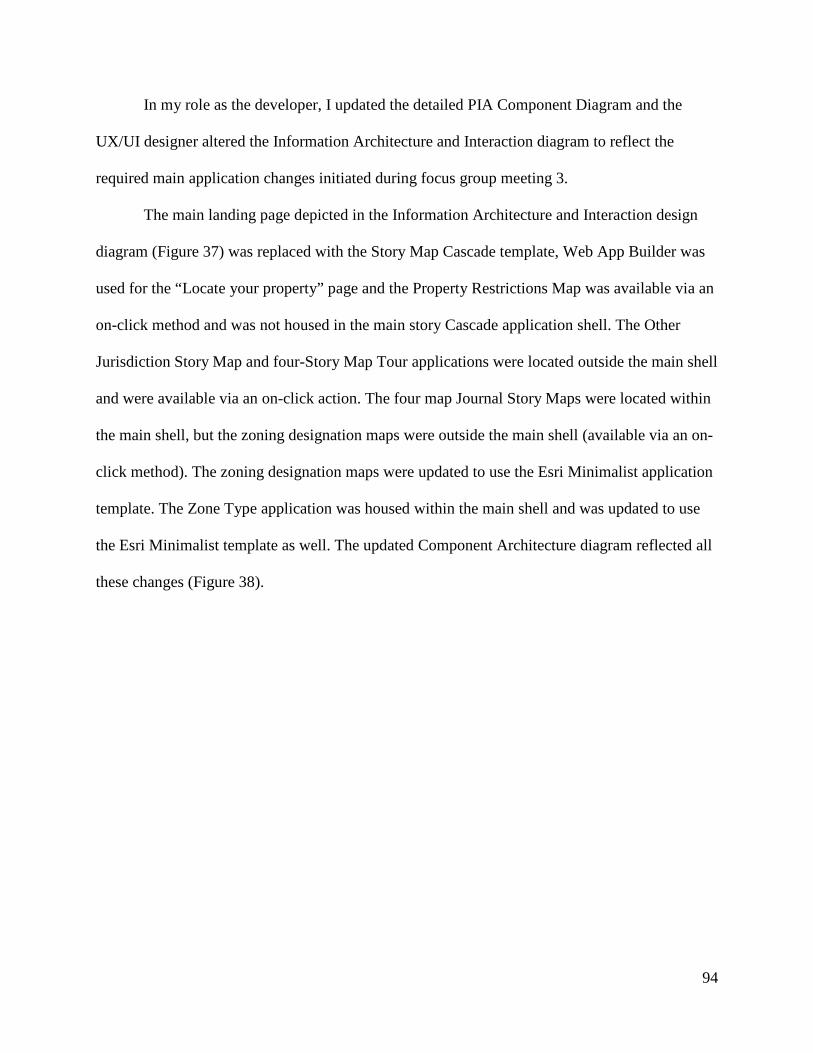
94
In my role as the developer, I updated the detailed PIA Component Diagram and the
UX/UI designer altered the Information Architecture and Interaction diagram to reflect the
required main application changes initiated during focus group meeting 3.
The main landing page depicted in the Information Architecture and Interaction design
diagram (Figure 37) was replaced with the Story Map Cascade template, Web App Builder was
used for the “Locate your property” page and the Property Restrictions Map was available via an
on-click method and was not housed in the main story Cascade application shell. The Other
Jurisdiction Story Map and four-Story Map Tour applications were located outside the main shell
and were available via an on-click action. The four map Journal Story Maps were located within
the main shell, but the zoning designation maps were outside the main shell (available via an on-
click method). The zoning designation maps were updated to use the Esri Minimalist application
template. The Zone Type application was housed within the main shell and was updated to use
the Esri Minimalist template as well. The updated Component Architecture diagram reflected all
these changes (Figure 38).
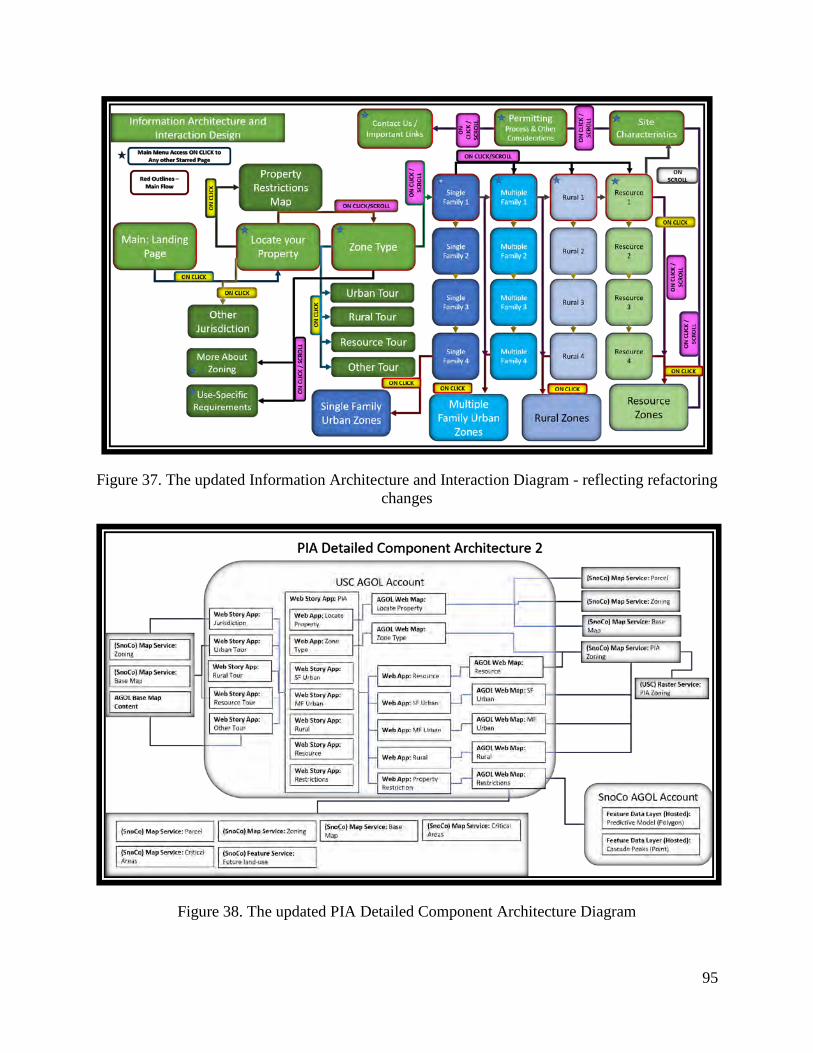
95
Figure 37. The updated Information Architecture and Interaction Diagram - reflecting refactoring changes
Figure 38. The updated PIA Detailed Component Architecture Diagram
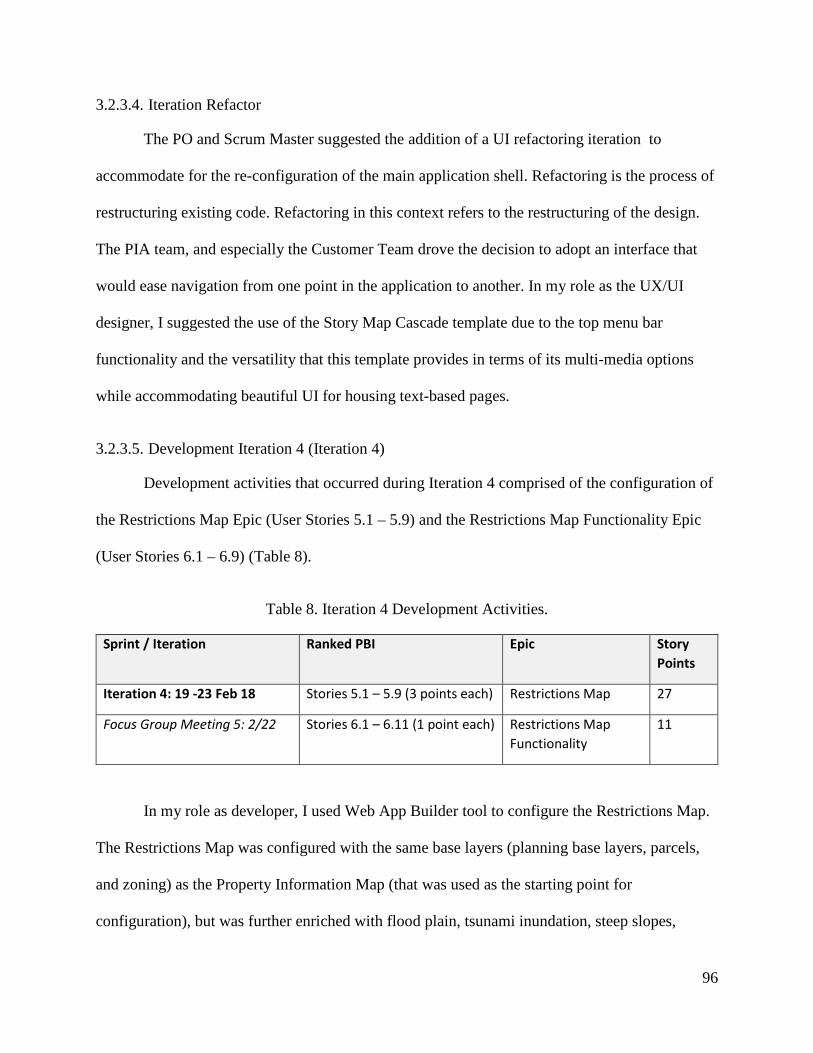
96
3.2.3.4. Iteration Refactor
The PO and Scrum Master suggested the addition of a UI refactoring iteration to
accommodate for the re-configuration of the main application shell. Refactoring is the process of
restructuring existing code. Refactoring in this context refers to the restructuring of the design.
The PIA team, and especially the Customer Team drove the decision to adopt an interface that
would ease navigation from one point in the application to another. In my role as the UX/UI
designer, I suggested the use of the Story Map Cascade template due to the top menu bar
functionality and the versatility that this template provides in terms of its multi-media options
while accommodating beautiful UI for housing text-based pages.
3.2.3.5. Development Iteration 4 (Iteration 4)
Development activities that occurred during Iteration 4 comprised of the configuration of
the Restrictions Map Epic (User Stories 5.1 – 5.9) and the Restrictions Map Functionality Epic
(User Stories 6.1 – 6.9) (Table 8).
Table 8. Iteration 4 Development Activities.
Sprint / Iteration Ranked PBI Epic Story Points
Iteration 4: 19 -23 Feb 18 Stories 5.1 – 5.9 (3 points each) Restrictions Map 27
Focus Group Meeting 5: 2/22 Stories 6.1 – 6.11 (1 point each) Restrictions Map Functionality
11
In my role as developer, I used Web App Builder tool to configure the Restrictions Map.
The Restrictions Map was configured with the same base layers (planning base layers, parcels,
and zoning) as the Property Information Map (that was used as the starting point for
configuration), but was further enriched with flood plain, tsunami inundation, steep slopes,
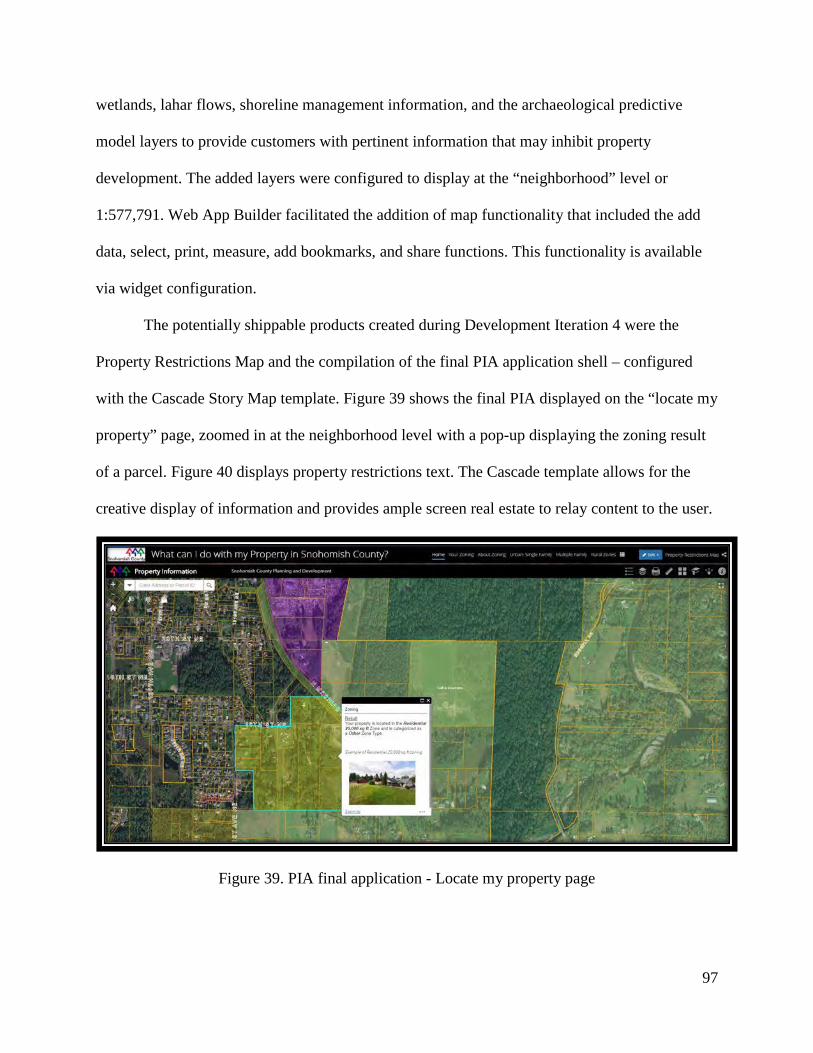
97
wetlands, lahar flows, shoreline management information, and the archaeological predictive
model layers to provide customers with pertinent information that may inhibit property
development. The added layers were configured to display at the “neighborhood” level or
1:577,791. Web App Builder facilitated the addition of map functionality that included the add
data, select, print, measure, add bookmarks, and share functions. This functionality is available
via widget configuration.
The potentially shippable products created during Development Iteration 4 were the
Property Restrictions Map and the compilation of the final PIA application shell – configured
with the Cascade Story Map template. Figure 39 shows the final PIA displayed on the “locate my
property” page, zoomed in at the neighborhood level with a pop-up displaying the zoning result
of a parcel. Figure 40 displays property restrictions text. The Cascade template allows for the
creative display of information and provides ample screen real estate to relay content to the user.
Figure 39. PIA final application - Locate my property page
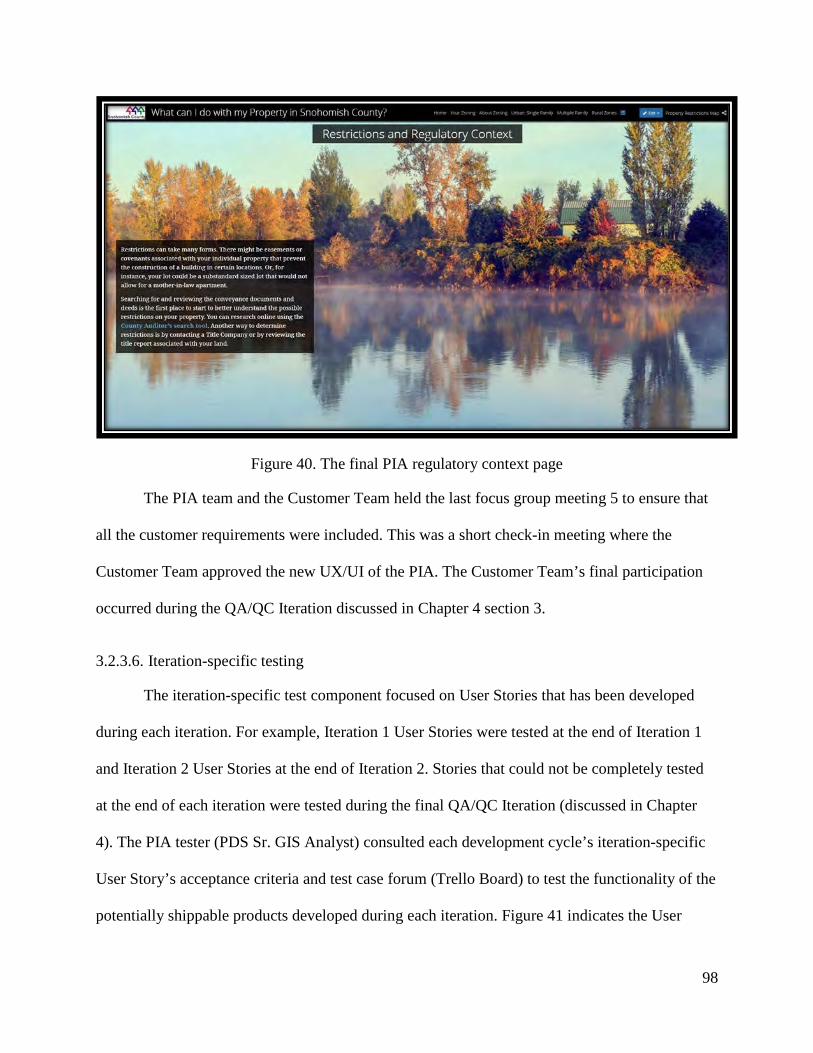
98
Figure 40. The final PIA regulatory context page
The PIA team and the Customer Team held the last focus group meeting 5 to ensure that
all the customer requirements were included. This was a short check-in meeting where the
Customer Team approved the new UX/UI of the PIA. The Customer Team’s final participation
occurred during the QA/QC Iteration discussed in Chapter 4 section 3.
3.2.3.6. Iteration-specific testing
The iteration-specific test component focused on User Stories that has been developed
during each iteration. For example, Iteration 1 User Stories were tested at the end of Iteration 1
and Iteration 2 User Stories at the end of Iteration 2. Stories that could not be completely tested
at the end of each iteration were tested during the final QA/QC Iteration (discussed in Chapter
4). The PIA tester (PDS Sr. GIS Analyst) consulted each development cycle’s iteration-specific
User Story’s acceptance criteria and test case forum (Trello Board) to test the functionality of the
potentially shippable products developed during each iteration. Figure 41 indicates the User
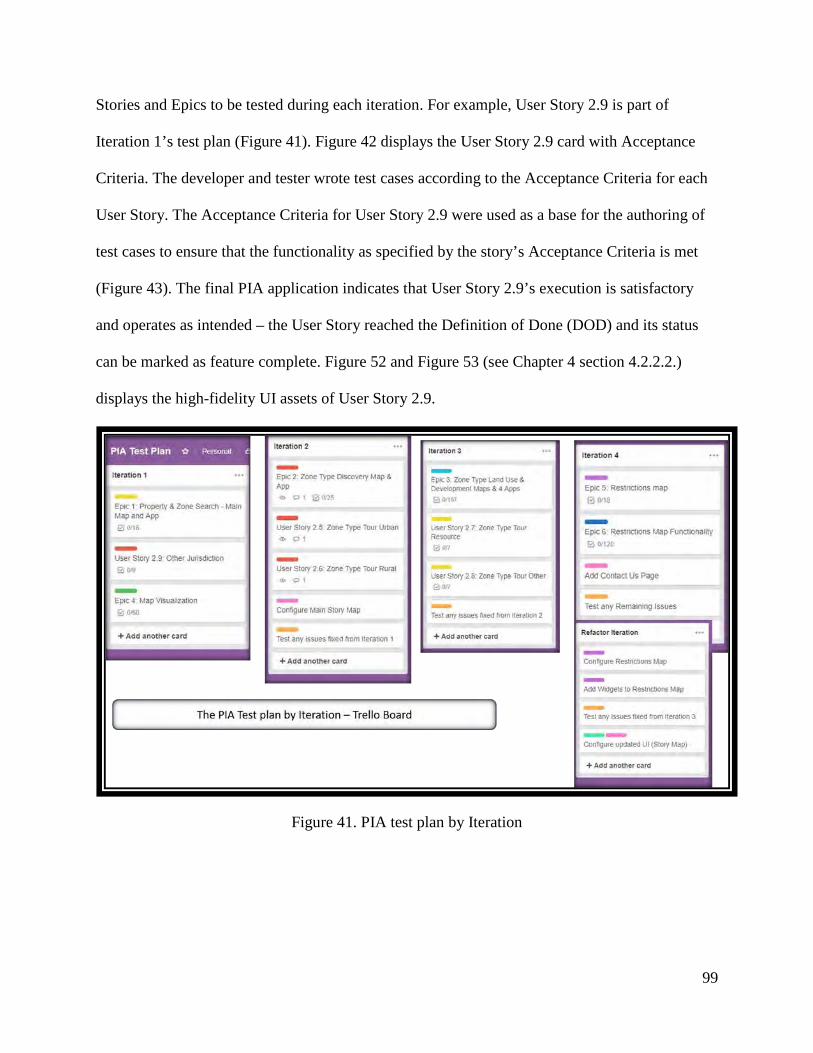
99
Stories and Epics to be tested during each iteration. For example, User Story 2.9 is part of
Iteration 1’s test plan (Figure 41). Figure 42 displays the User Story 2.9 card with Acceptance
Criteria. The developer and tester wrote test cases according to the Acceptance Criteria for each
User Story. The Acceptance Criteria for User Story 2.9 were used as a base for the authoring of
test cases to ensure that the functionality as specified by the story’s Acceptance Criteria is met
(Figure 43). The final PIA application indicates that User Story 2.9’s execution is satisfactory
and operates as intended – the User Story reached the Definition of Done (DOD) and its status
can be marked as feature complete. Figure 52 and Figure 53 (see Chapter 4 section 4.2.2.2.)
displays the high-fidelity UI assets of User Story 2.9.
Figure 41. PIA test plan by Iteration
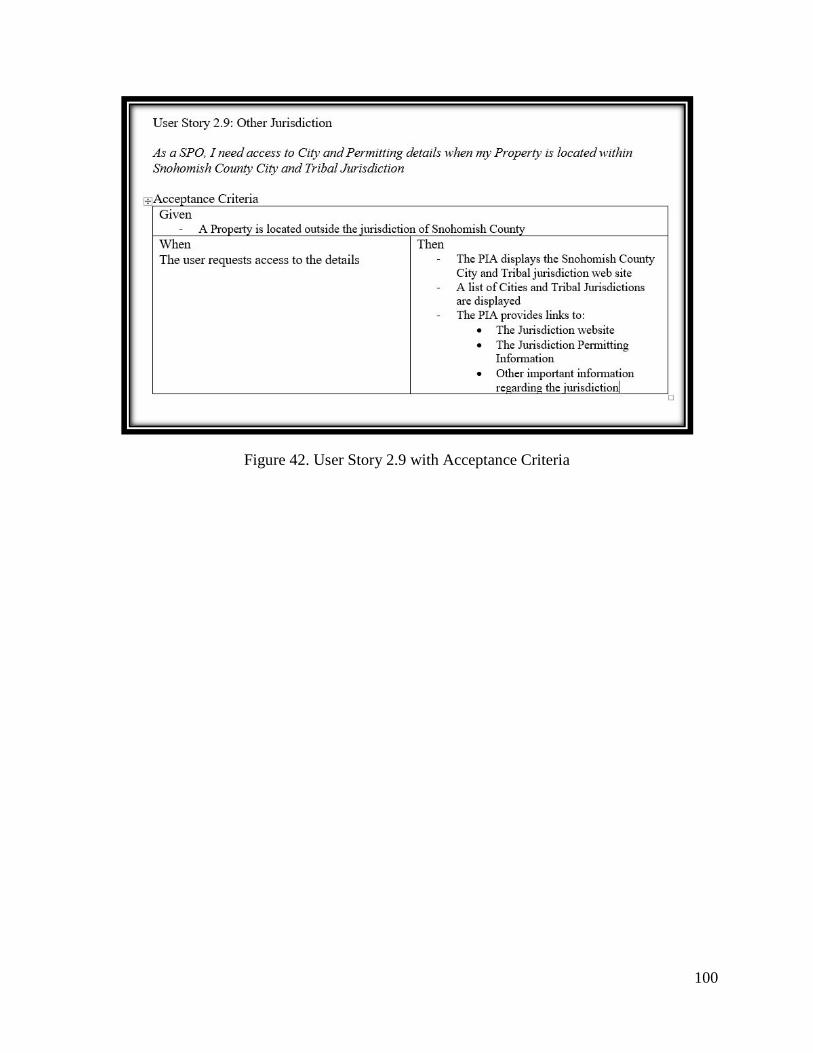
100
Figure 42. User Story 2.9 with Acceptance Criteria
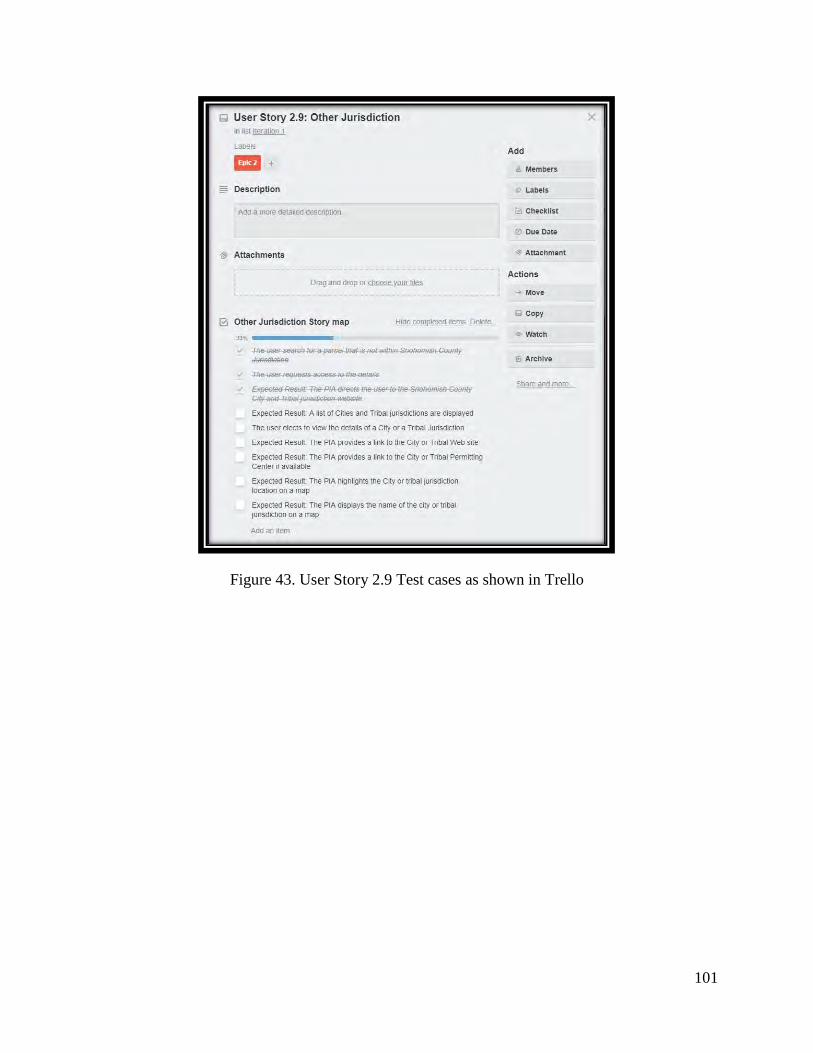
101
Figure 43. User Story 2.9 Test cases as shown in Trello
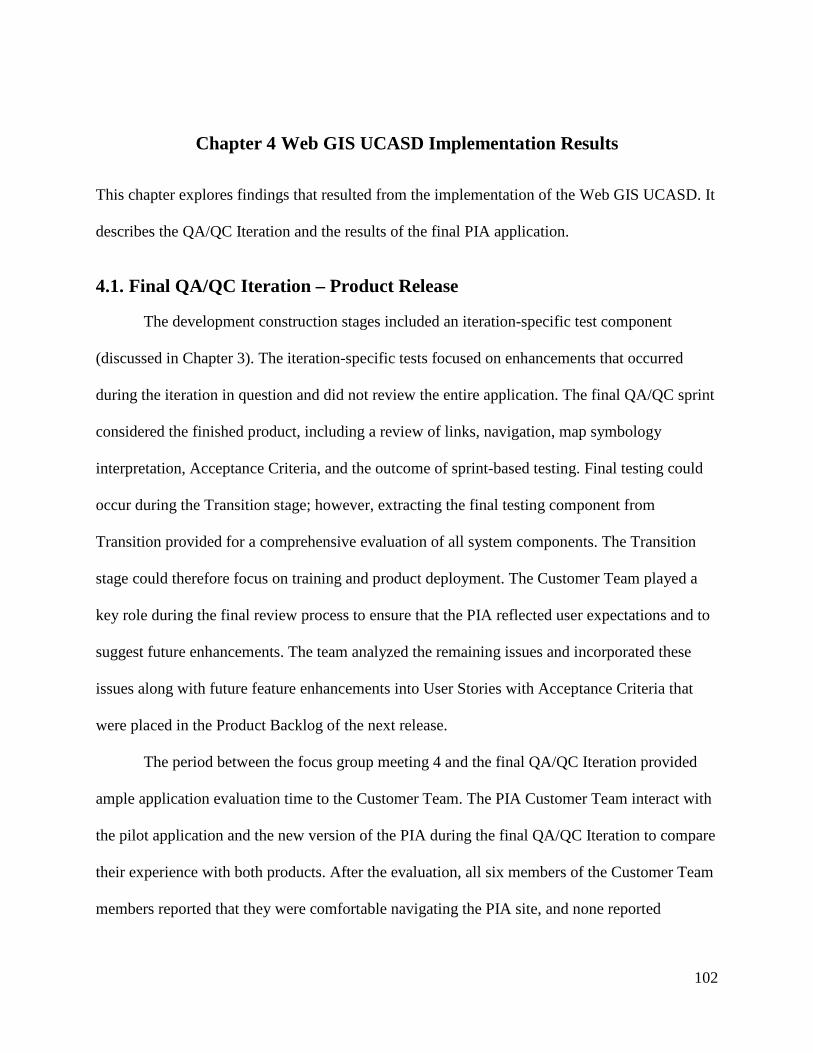
102
Chapter 4 Web GIS UCASD Implementation Results
This chapter explores findings that resulted from the implementation of the Web GIS UCASD. It
describes the QA/QC Iteration and the results of the final PIA application.
4.1. Final QA/QC Iteration – Product Release
The development construction stages included an iteration-specific test component
(discussed in Chapter 3). The iteration-specific tests focused on enhancements that occurred
during the iteration in question and did not review the entire application. The final QA/QC sprint
considered the finished product, including a review of links, navigation, map symbology
interpretation, Acceptance Criteria, and the outcome of sprint-based testing. Final testing could
occur during the Transition stage; however, extracting the final testing component from
Transition provided for a comprehensive evaluation of all system components. The Transition
stage could therefore focus on training and product deployment. The Customer Team played a
key role during the final review process to ensure that the PIA reflected user expectations and to
suggest future enhancements. The team analyzed the remaining issues and incorporated these
issues along with future feature enhancements into User Stories with Acceptance Criteria that
were placed in the Product Backlog of the next release.
The period between the focus group meeting 4 and the final QA/QC Iteration provided
ample application evaluation time to the Customer Team. The PIA Customer Team interact with
the pilot application and the new version of the PIA during the final QA/QC Iteration to compare
their experience with both products. After the evaluation, all six members of the Customer Team
members reported that they were comfortable navigating the PIA site, and none reported
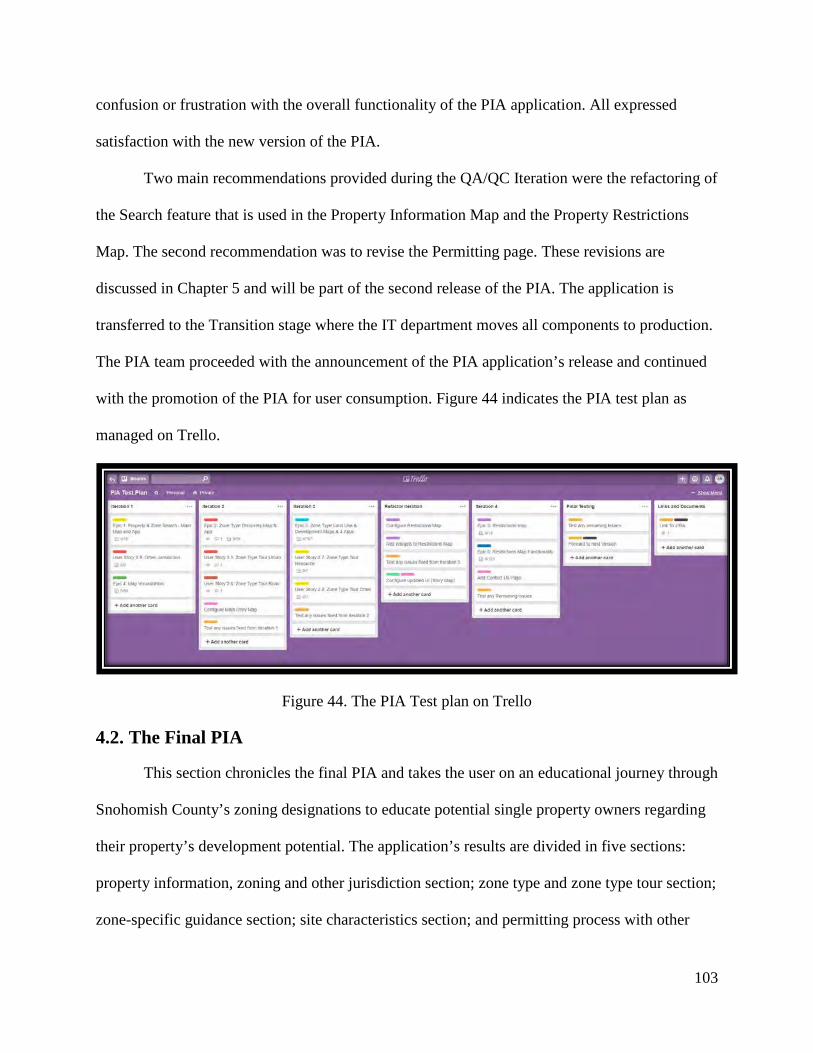
103
confusion or frustration with the overall functionality of the PIA application. All expressed
satisfaction with the new version of the PIA.
Two main recommendations provided during the QA/QC Iteration were the refactoring of
the Search feature that is used in the Property Information Map and the Property Restrictions
Map. The second recommendation was to revise the Permitting page. These revisions are
discussed in Chapter 5 and will be part of the second release of the PIA. The application is
transferred to the Transition stage where the IT department moves all components to production.
The PIA team proceeded with the announcement of the PIA application’s release and continued
with the promotion of the PIA for user consumption. Figure 44 indicates the PIA test plan as
managed on Trello.
Figure 44. The PIA Test plan on Trello
4.2. The Final PIA
This section chronicles the final PIA and takes the user on an educational journey through
Snohomish County’s zoning designations to educate potential single property owners regarding
their property’s development potential. The application’s results are divided in five sections:
property information, zoning and other jurisdiction section; zone type and zone type tour section;
zone-specific guidance section; site characteristics section; and permitting process with other
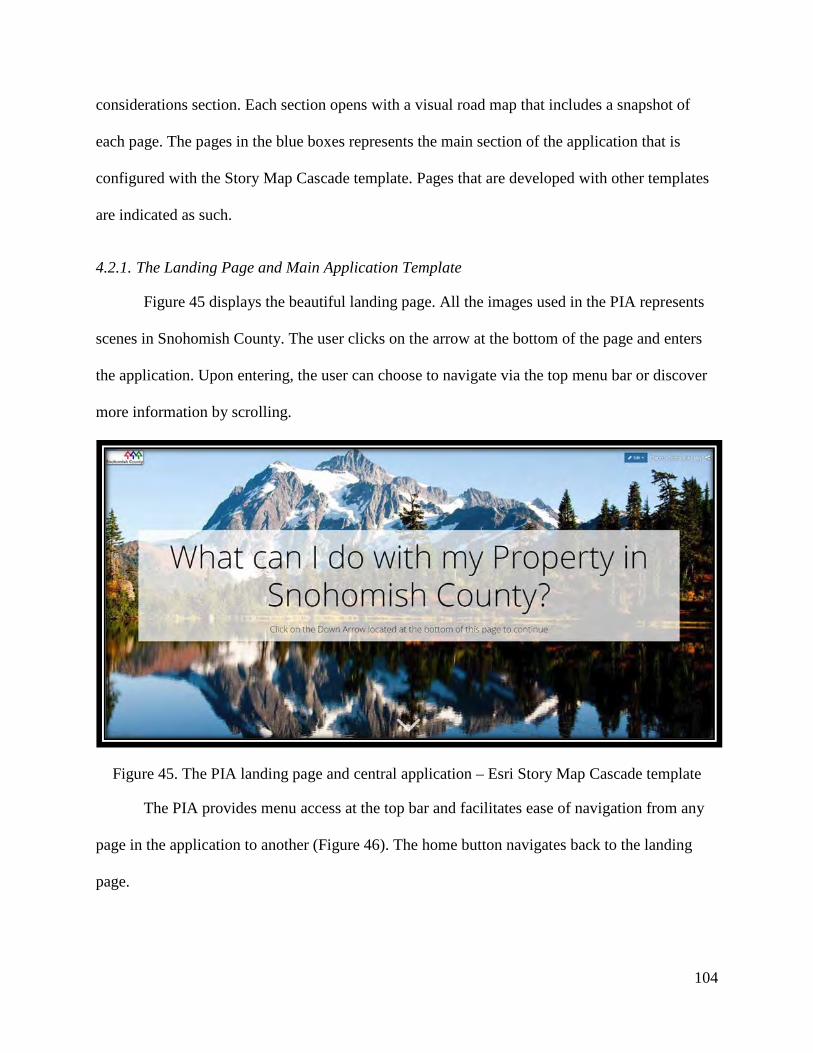
104
considerations section. Each section opens with a visual road map that includes a snapshot of
each page. The pages in the blue boxes represents the main section of the application that is
configured with the Story Map Cascade template. Pages that are developed with other templates
are indicated as such.
4.2.1. The Landing Page and Main Application Template
Figure 45 displays the beautiful landing page. All the images used in the PIA represents
scenes in Snohomish County. The user clicks on the arrow at the bottom of the page and enters
the application. Upon entering, the user can choose to navigate via the top menu bar or discover
more information by scrolling.
Figure 45. The PIA landing page and central application – Esri Story Map Cascade template
The PIA provides menu access at the top bar and facilitates ease of navigation from any
page in the application to another (Figure 46). The home button navigates back to the landing
page.
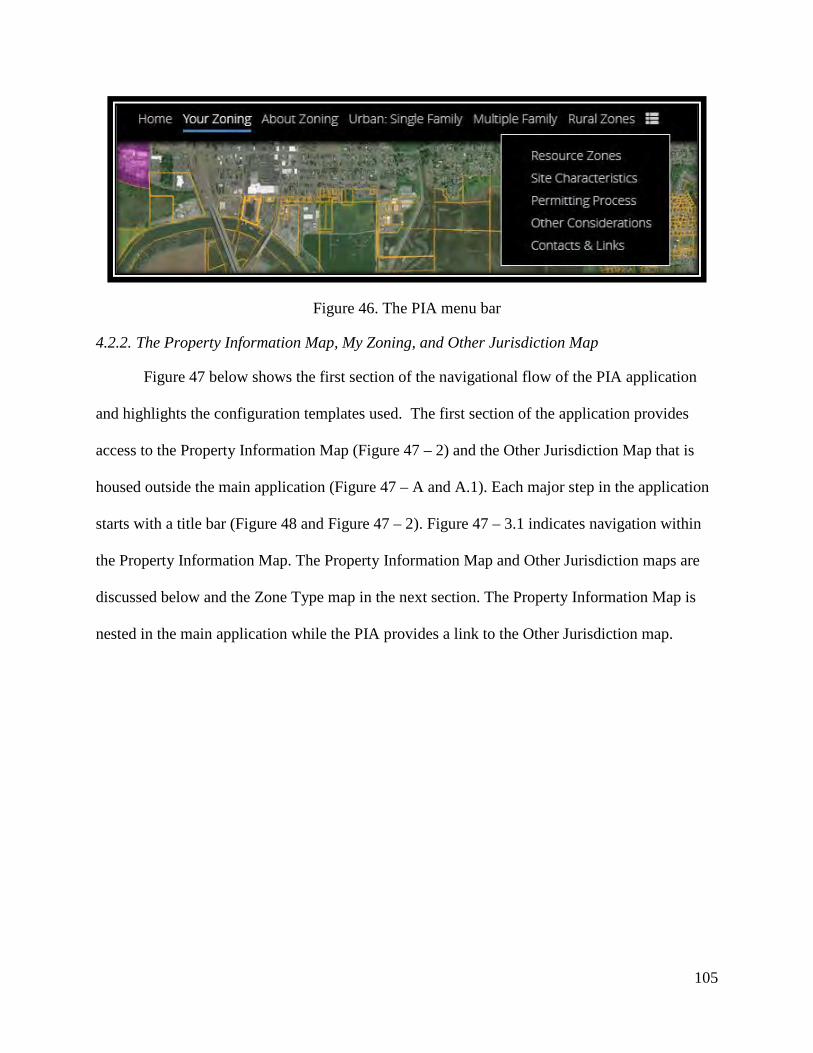
105
Figure 46. The PIA menu bar
4.2.2. The Property Information Map, My Zoning, and Other Jurisdiction Map
Figure 47 below shows the first section of the navigational flow of the PIA application
and highlights the configuration templates used. The first section of the application provides
access to the Property Information Map (Figure 47 – 2) and the Other Jurisdiction Map that is
housed outside the main application (Figure 47 – A and A.1). Each major step in the application
starts with a title bar (Figure 48 and Figure 47 – 2). Figure 47 – 3.1 indicates navigation within
the Property Information Map. The Property Information Map and Other Jurisdiction maps are
discussed below and the Zone Type map in the next section. The Property Information Map is
nested in the main application while the PIA provides a link to the Other Jurisdiction map.
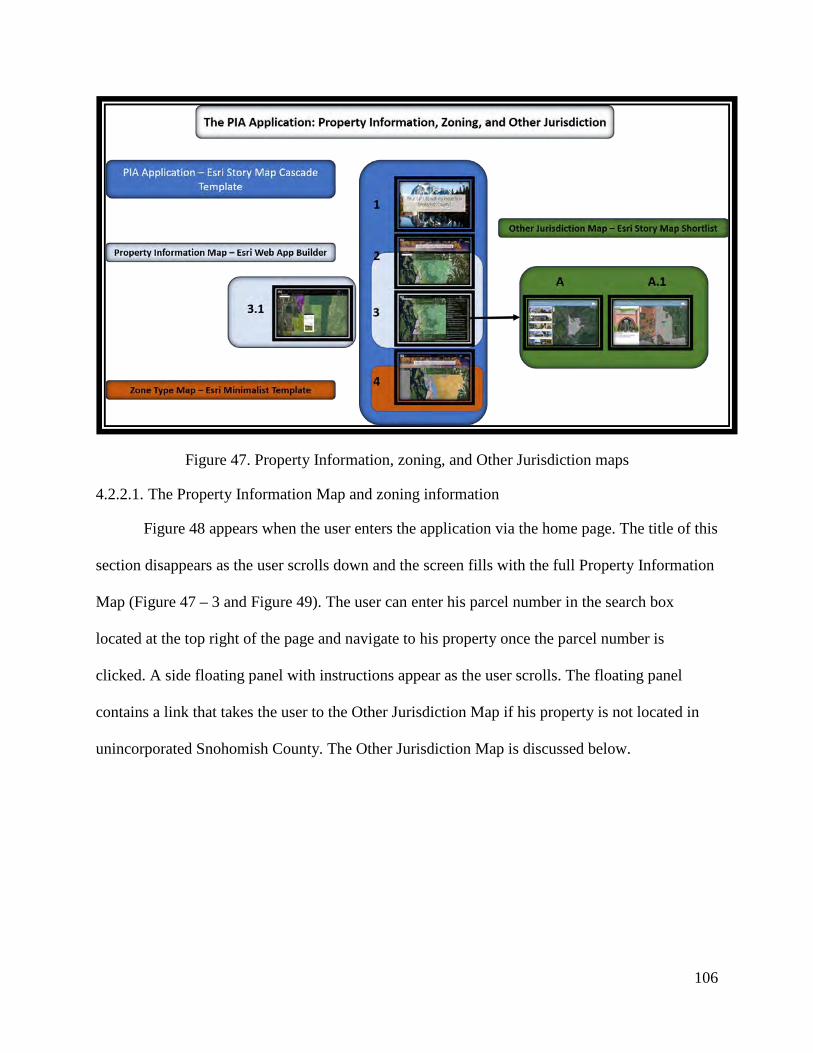
106
Figure 47. Property Information, zoning, and Other Jurisdiction maps
4.2.2.1. The Property Information Map and zoning information
Figure 48 appears when the user enters the application via the home page. The title of this
section disappears as the user scrolls down and the screen fills with the full Property Information
Map (Figure 47 – 3 and Figure 49). The user can enter his parcel number in the search box
located at the top right of the page and navigate to his property once the parcel number is
clicked. A side floating panel with instructions appear as the user scrolls. The floating panel
contains a link that takes the user to the Other Jurisdiction Map if his property is not located in
unincorporated Snohomish County. The Other Jurisdiction Map is discussed below.
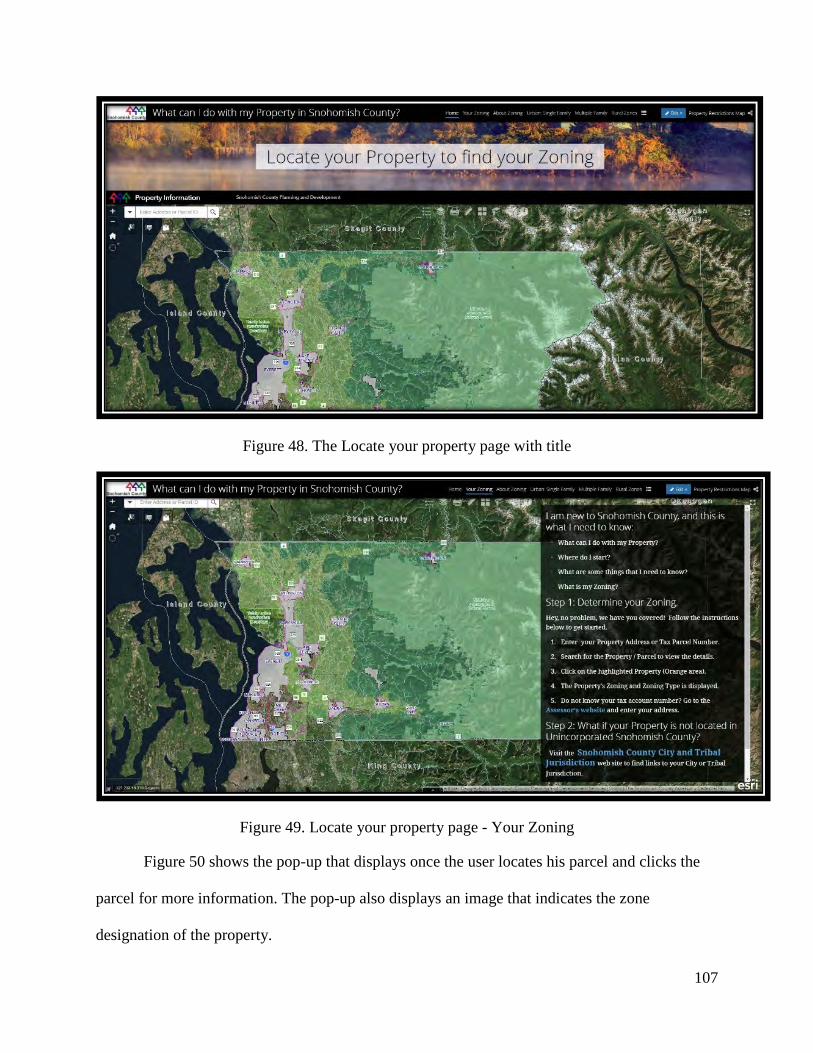
107
Figure 48. The Locate your property page with title
Figure 49. Locate your property page - Your Zoning
Figure 50 shows the pop-up that displays once the user locates his parcel and clicks the
parcel for more information. The pop-up also displays an image that indicates the zone
designation of the property.
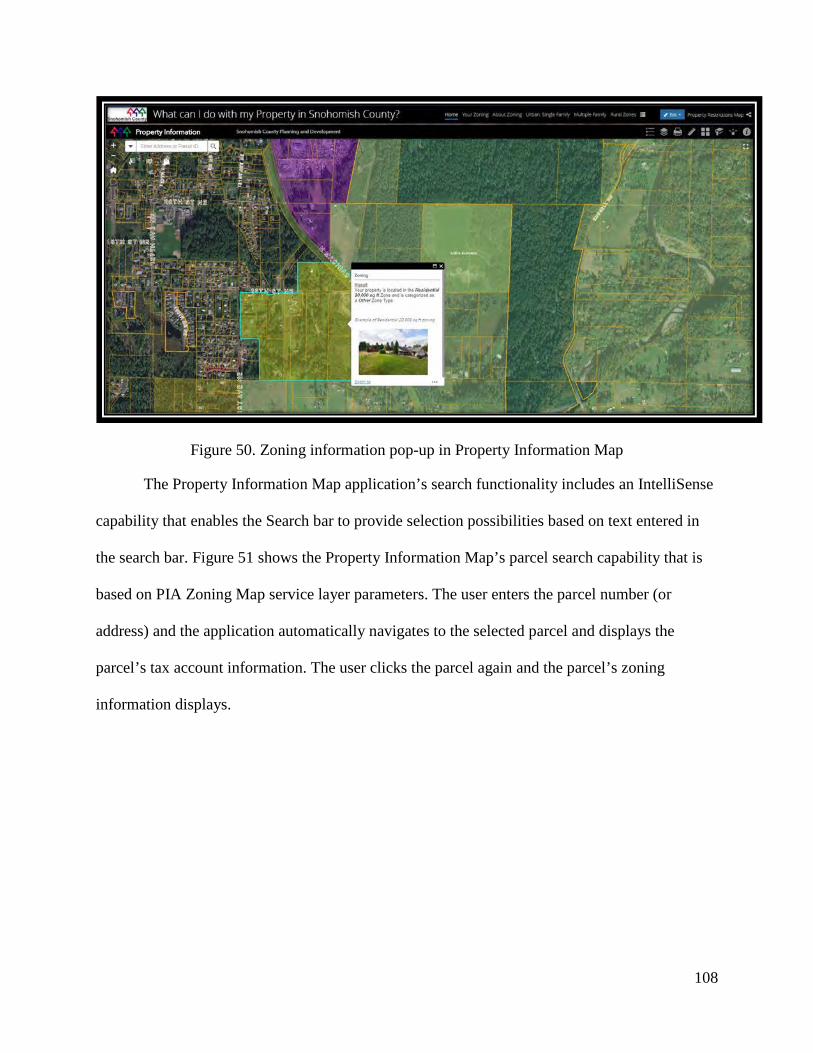
108
Figure 50. Zoning information pop-up in Property Information Map
The Property Information Map application’s search functionality includes an IntelliSense
capability that enables the Search bar to provide selection possibilities based on text entered in
the search bar. Figure 51 shows the Property Information Map’s parcel search capability that is
based on PIA Zoning Map service layer parameters. The user enters the parcel number (or
address) and the application automatically navigates to the selected parcel and displays the
parcel’s tax account information. The user clicks the parcel again and the parcel’s zoning
information displays.
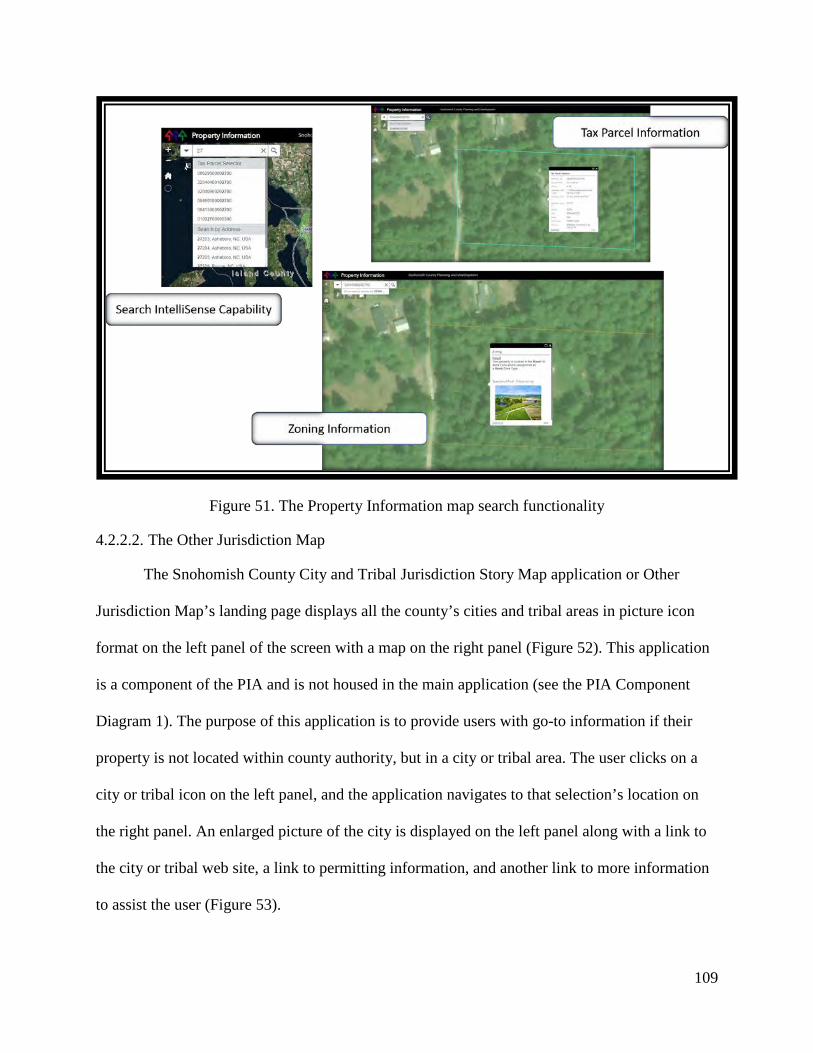
109
Figure 51. The Property Information map search functionality
4.2.2.2. The Other Jurisdiction Map
The Snohomish County City and Tribal Jurisdiction Story Map application or Other
Jurisdiction Map’s landing page displays all the county’s cities and tribal areas in picture icon
format on the left panel of the screen with a map on the right panel (Figure 52). This application
is a component of the PIA and is not housed in the main application (see the PIA Component
Diagram 1). The purpose of this application is to provide users with go-to information if their
property is not located within county authority, but in a city or tribal area. The user clicks on a
city or tribal icon on the left panel, and the application navigates to that selection’s location on
the right panel. An enlarged picture of the city is displayed on the left panel along with a link to
the city or tribal web site, a link to permitting information, and another link to more information
to assist the user (Figure 53).
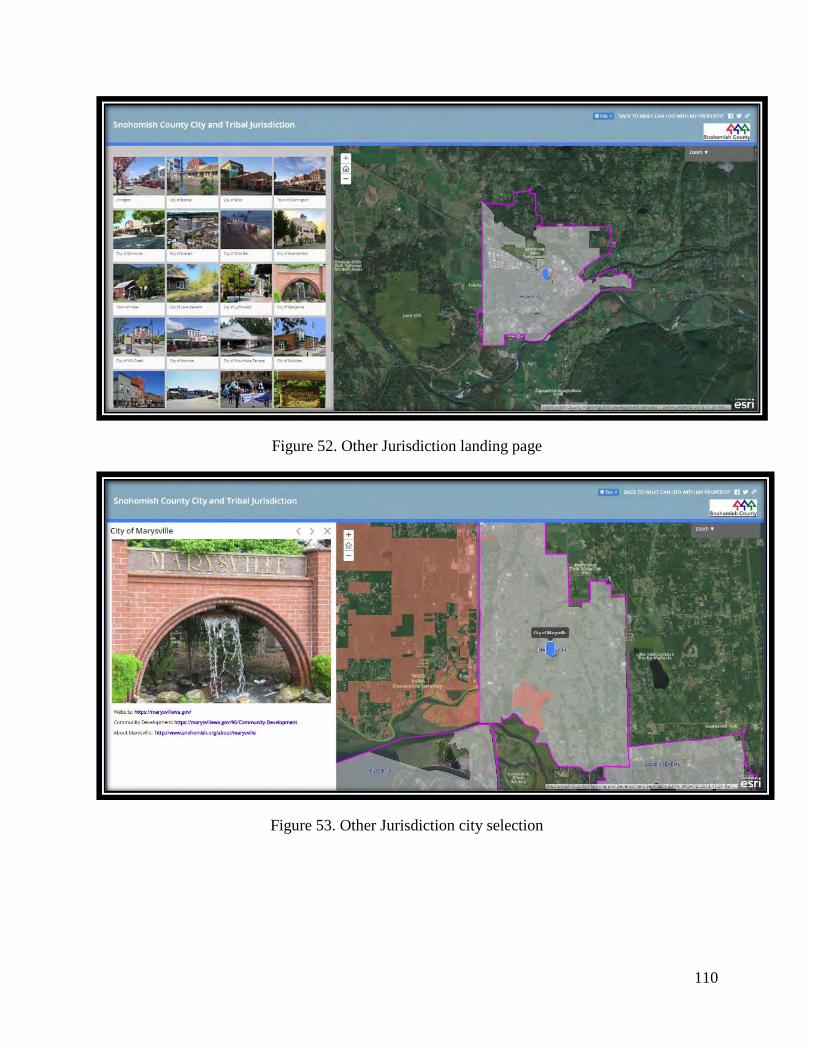
110
Figure 52. Other Jurisdiction landing page
Figure 53. Other Jurisdiction city selection
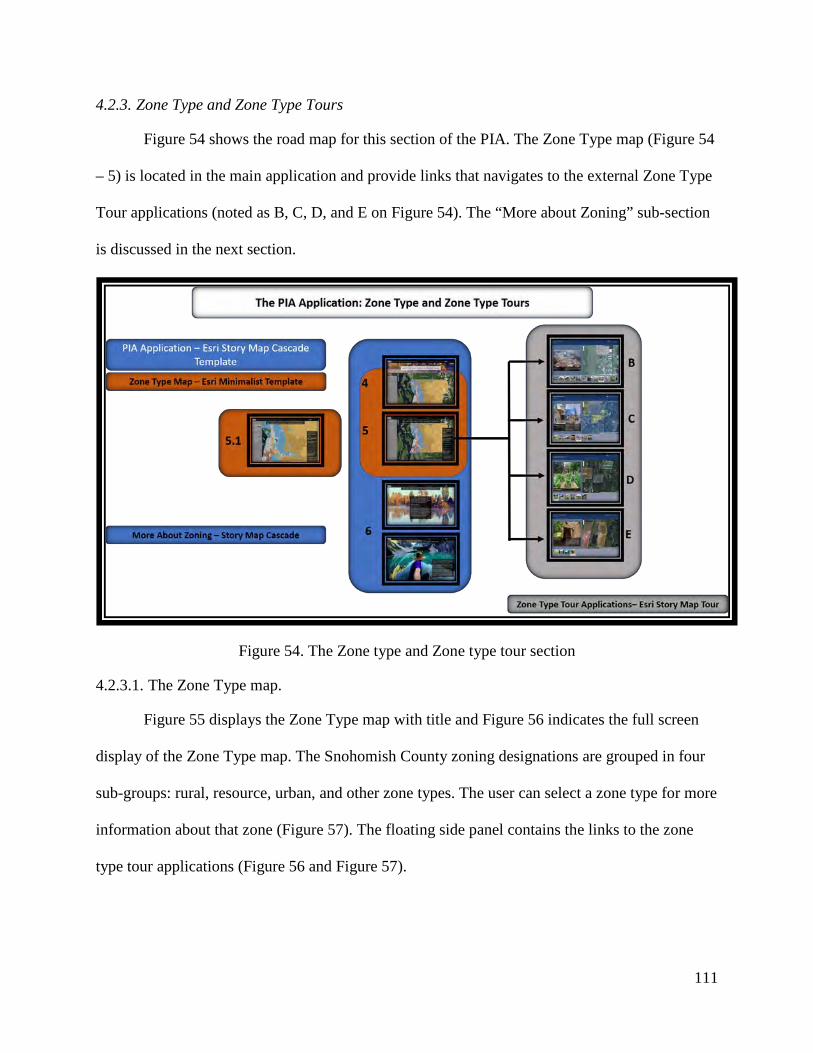
111
4.2.3. Zone Type and Zone Type Tours
Figure 54 shows the road map for this section of the PIA. The Zone Type map (Figure 54
– 5) is located in the main application and provide links that navigates to the external Zone Type
Tour applications (noted as B, C, D, and E on Figure 54). The “More about Zoning” sub-section
is discussed in the next section.
Figure 54. The Zone type and Zone type tour section
4.2.3.1. The Zone Type map.
Figure 55 displays the Zone Type map with title and Figure 56 indicates the full screen
display of the Zone Type map. The Snohomish County zoning designations are grouped in four
sub-groups: rural, resource, urban, and other zone types. The user can select a zone type for more
information about that zone (Figure 57). The floating side panel contains the links to the zone
type tour applications (Figure 56 and Figure 57).
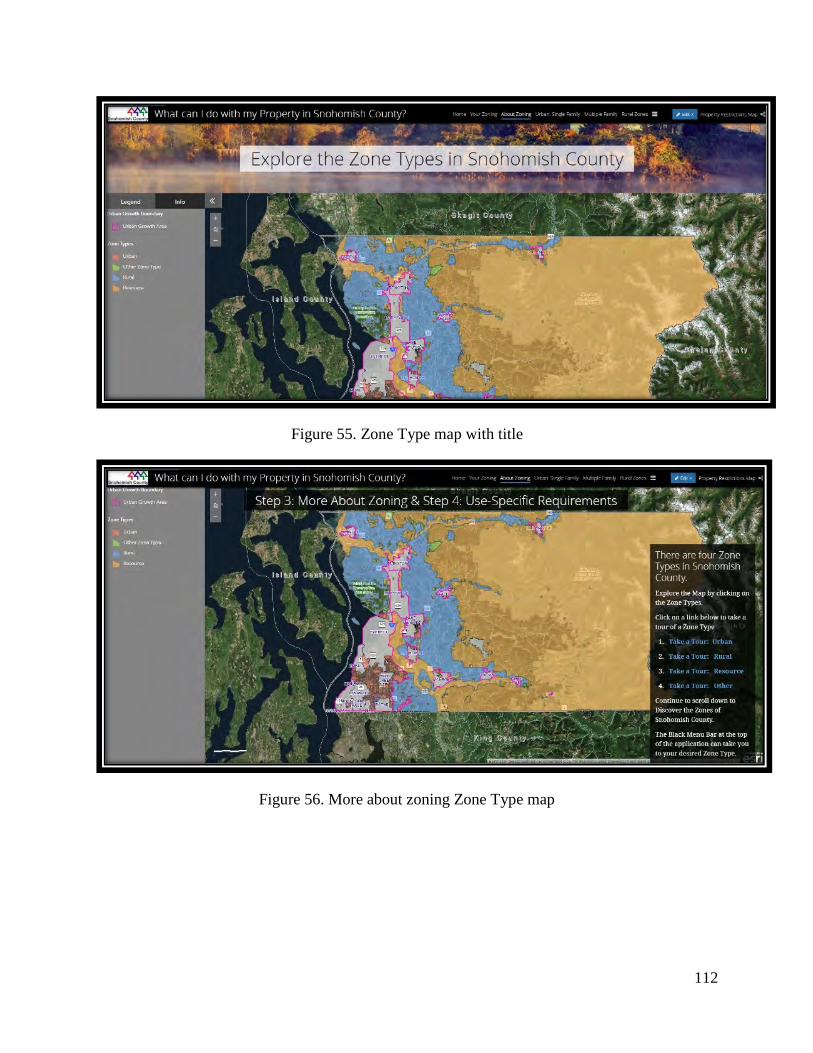
112
Figure 55. Zone Type map with title
Figure 56. More about zoning Zone Type map
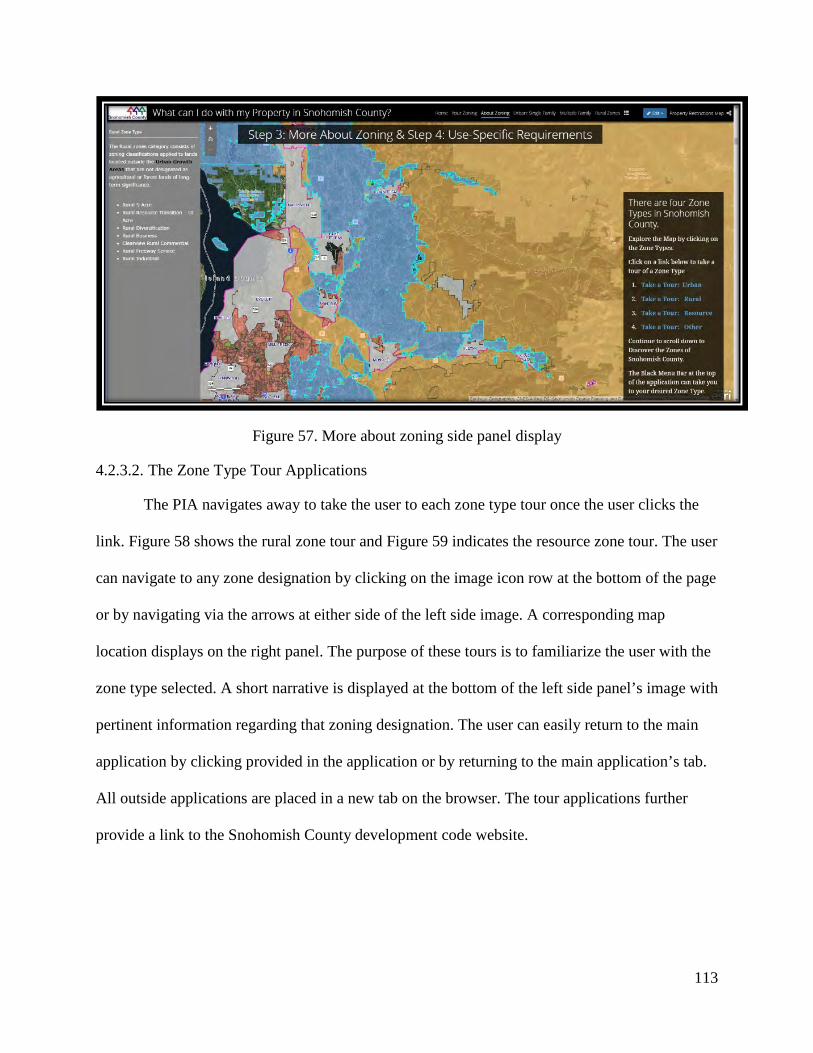
113
Figure 57. More about zoning side panel display
4.2.3.2. The Zone Type Tour Applications
The PIA navigates away to take the user to each zone type tour once the user clicks the
link. Figure 58 shows the rural zone tour and Figure 59 indicates the resource zone tour. The user
can navigate to any zone designation by clicking on the image icon row at the bottom of the page
or by navigating via the arrows at either side of the left side image. A corresponding map
location displays on the right panel. The purpose of these tours is to familiarize the user with the
zone type selected. A short narrative is displayed at the bottom of the left side panel’s image with
pertinent information regarding that zoning designation. The user can easily return to the main
application by clicking provided in the application or by returning to the main application’s tab.
All outside applications are placed in a new tab on the browser. The tour applications further
provide a link to the Snohomish County development code website.
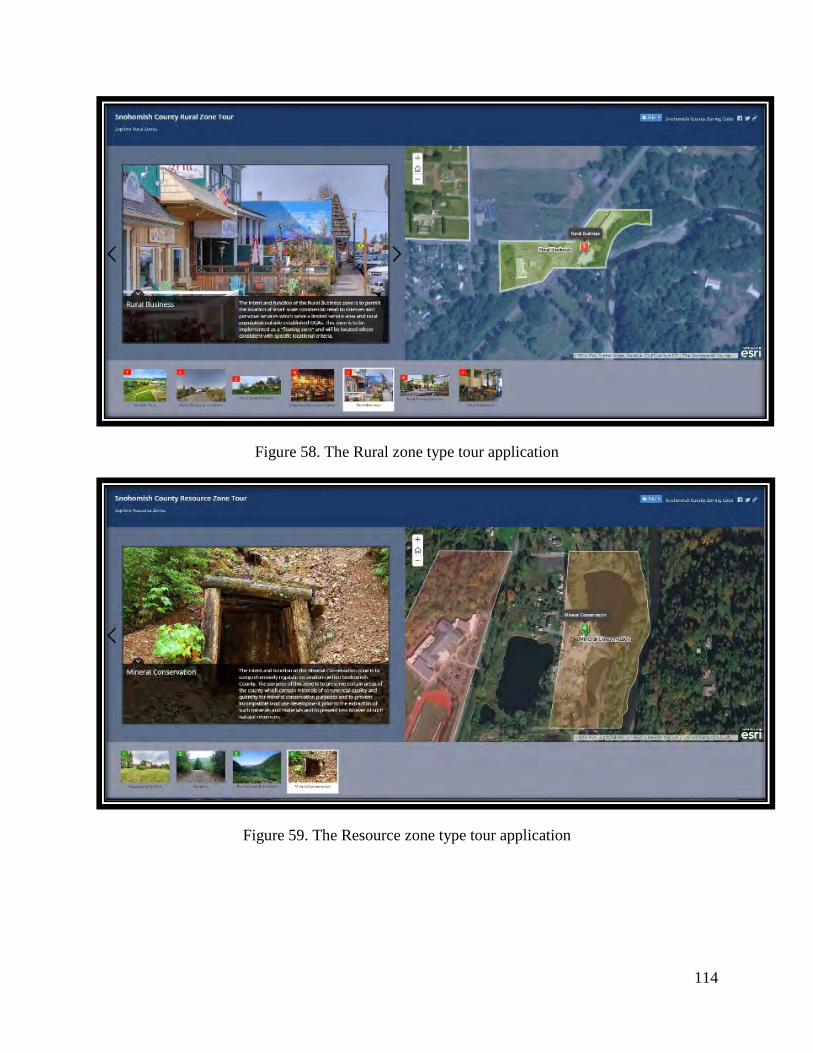
114
Figure 58. The Rural zone type tour application
Figure 59. The Resource zone type tour application
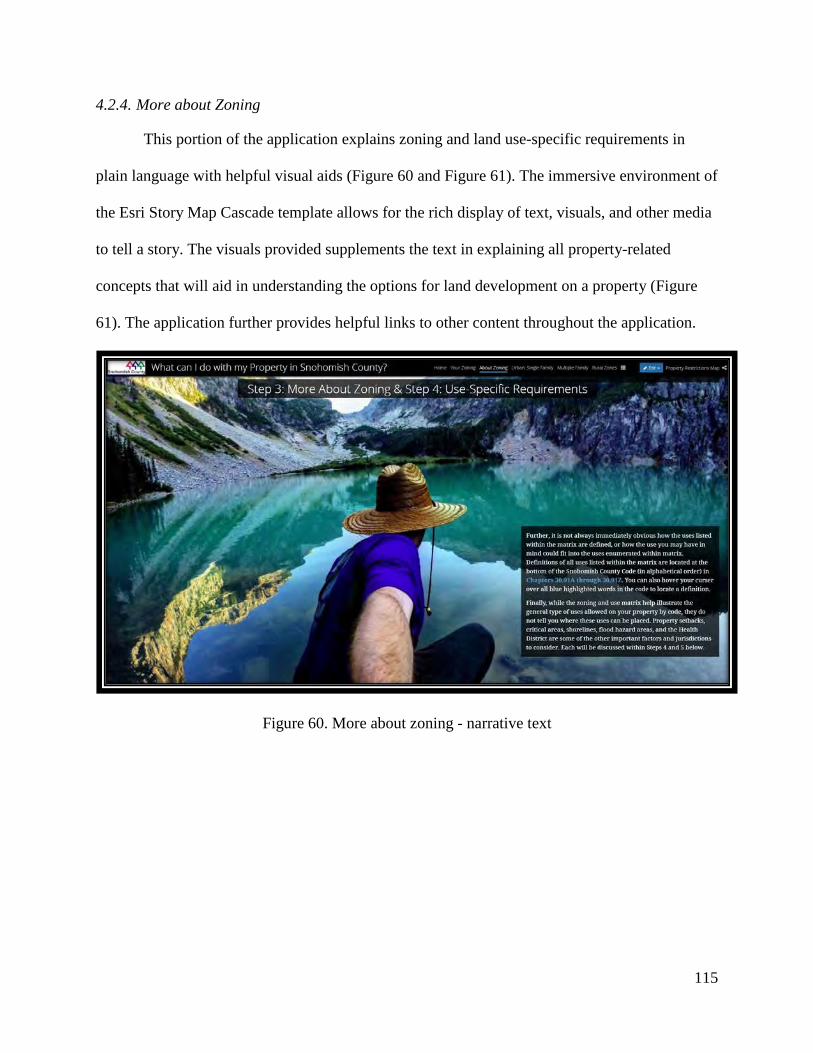
115
4.2.4. More about Zoning
This portion of the application explains zoning and land use-specific requirements in
plain language with helpful visual aids (Figure 60 and Figure 61). The immersive environment of
the Esri Story Map Cascade template allows for the rich display of text, visuals, and other media
to tell a story. The visuals provided supplements the text in explaining all property-related
concepts that will aid in understanding the options for land development on a property (Figure
61). The application further provides helpful links to other content throughout the application.
Figure 60. More about zoning - narrative text
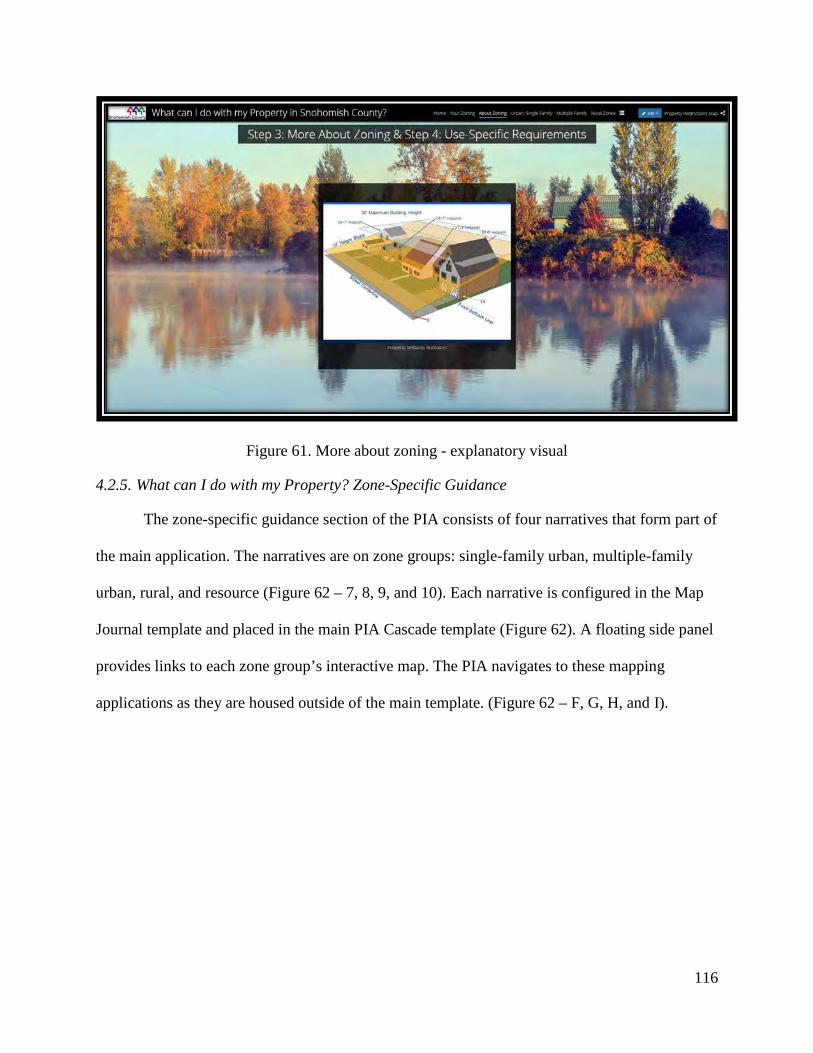
116
Figure 61. More about zoning - explanatory visual
4.2.5. What can I do with my Property? Zone-Specific Guidance
The zone-specific guidance section of the PIA consists of four narratives that form part of
the main application. The narratives are on zone groups: single-family urban, multiple-family
urban, rural, and resource (Figure 62 – 7, 8, 9, and 10). Each narrative is configured in the Map
Journal template and placed in the main PIA Cascade template (Figure 62). A floating side panel
provides links to each zone group’s interactive map. The PIA navigates to these mapping
applications as they are housed outside of the main template. (Figure 62 – F, G, H, and I).
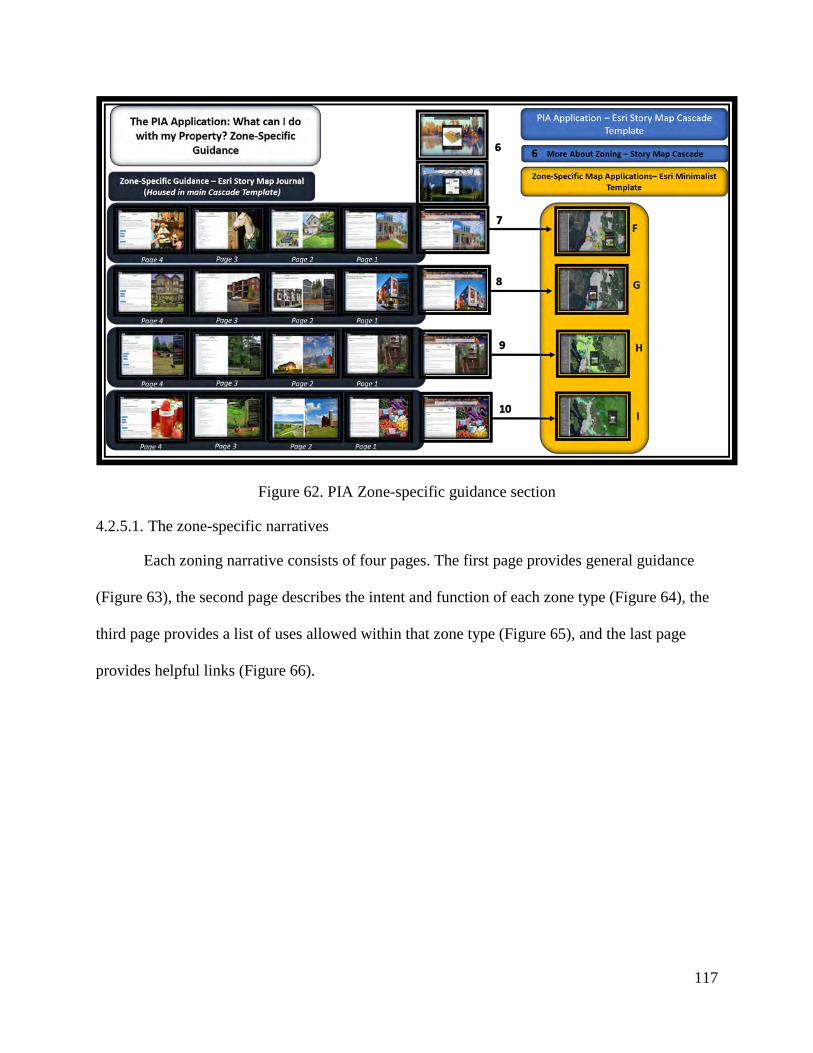
117
Figure 62. PIA Zone-specific guidance section
4.2.5.1. The zone-specific narratives
Each zoning narrative consists of four pages. The first page provides general guidance
(Figure 63), the second page describes the intent and function of each zone type (Figure 64), the
third page provides a list of uses allowed within that zone type (Figure 65), and the last page
provides helpful links (Figure 66).
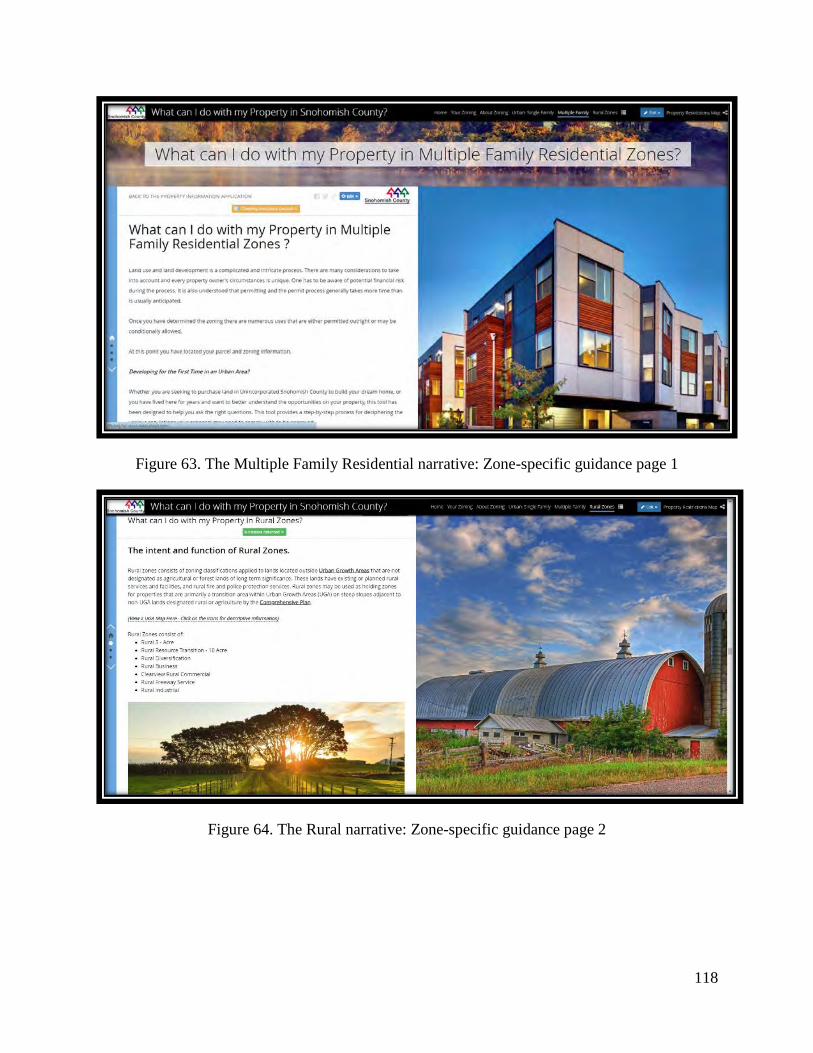
118
Figure 63. The Multiple Family Residential narrative: Zone-specific guidance page 1
Figure 64. The Rural narrative: Zone-specific guidance page 2
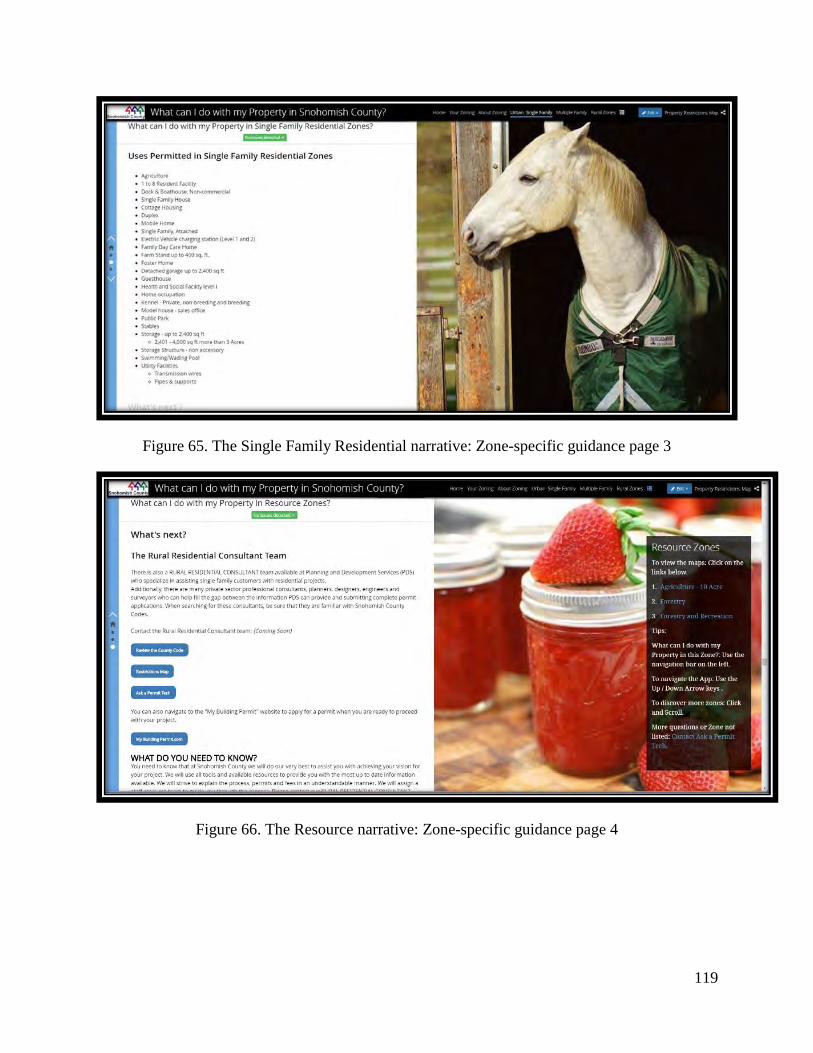
119
Figure 65. The Single Family Residential narrative: Zone-specific guidance page 3
Figure 66. The Resource narrative: Zone-specific guidance page 4
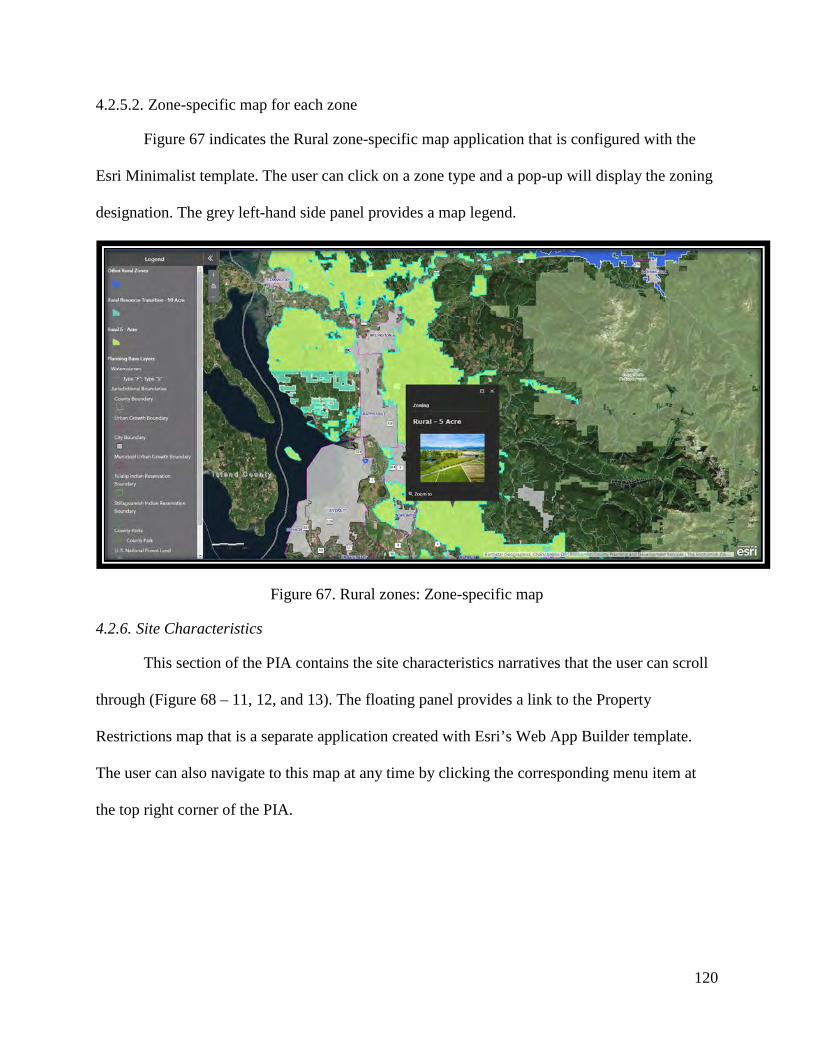
120
4.2.5.2. Zone-specific map for each zone
Figure 67 indicates the Rural zone-specific map application that is configured with the
Esri Minimalist template. The user can click on a zone type and a pop-up will display the zoning
designation. The grey left-hand side panel provides a map legend.
Figure 67. Rural zones: Zone-specific map
4.2.6. Site Characteristics
This section of the PIA contains the site characteristics narratives that the user can scroll
through (Figure 68 – 11, 12, and 13). The floating panel provides a link to the Property
Restrictions map that is a separate application created with Esri’s Web App Builder template.
The user can also navigate to this map at any time by clicking the corresponding menu item at
the top right corner of the PIA.
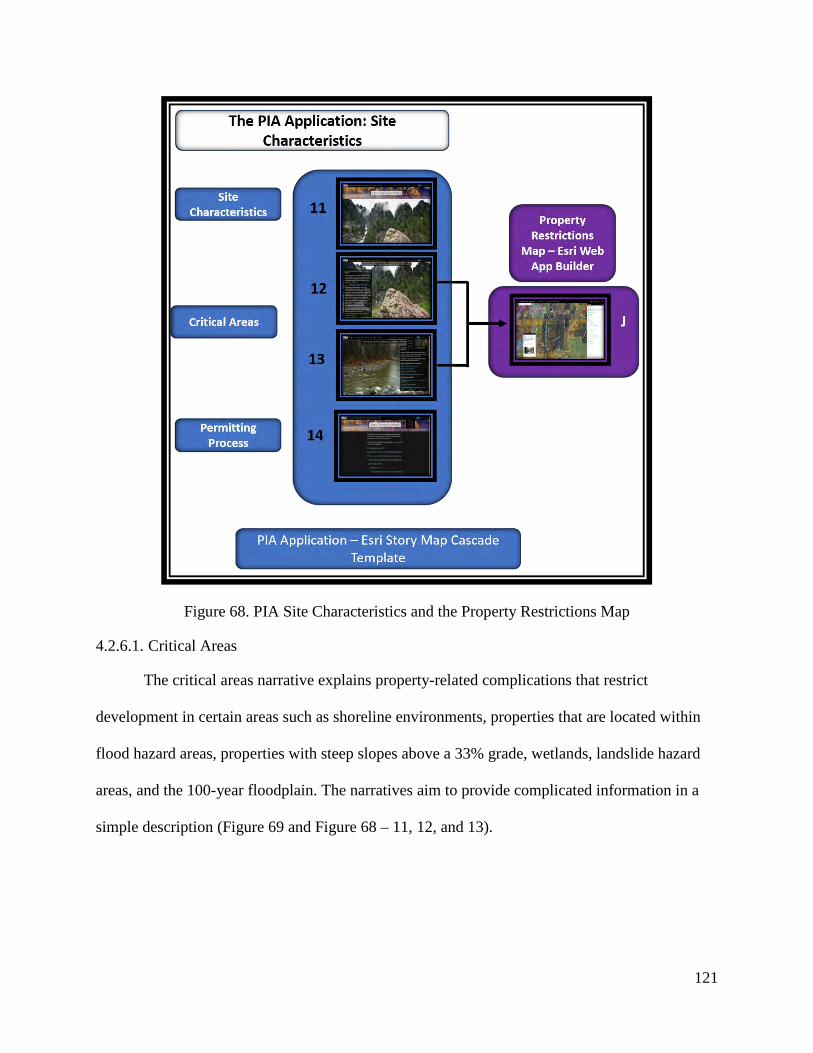
121
Figure 68. PIA Site Characteristics and the Property Restrictions Map
4.2.6.1. Critical Areas
The critical areas narrative explains property-related complications that restrict
development in certain areas such as shoreline environments, properties that are located within
flood hazard areas, properties with steep slopes above a 33% grade, wetlands, landslide hazard
areas, and the 100-year floodplain. The narratives aim to provide complicated information in a
simple description (Figure 69 and Figure 68 – 11, 12, and 13).
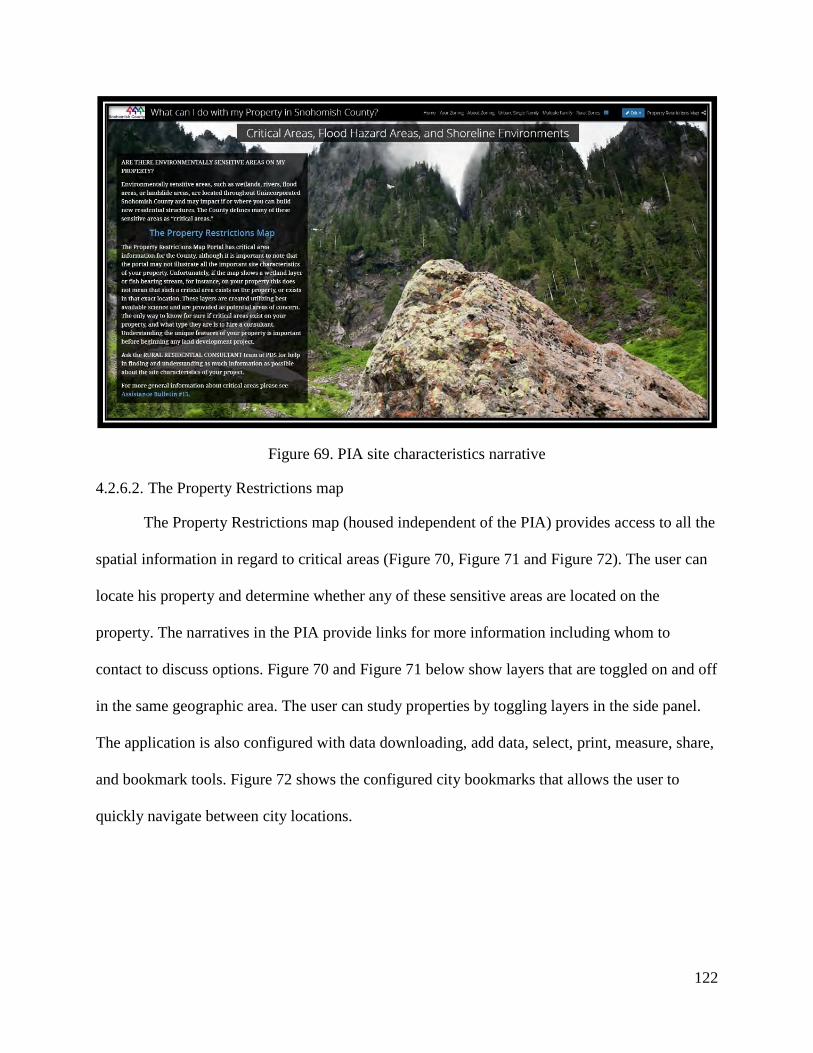
122
Figure 69. PIA site characteristics narrative
4.2.6.2. The Property Restrictions map
The Property Restrictions map (housed independent of the PIA) provides access to all the
spatial information in regard to critical areas (Figure 70, Figure 71 and Figure 72). The user can
locate his property and determine whether any of these sensitive areas are located on the
property. The narratives in the PIA provide links for more information including whom to
contact to discuss options. Figure 70 and Figure 71 below show layers that are toggled on and off
in the same geographic area. The user can study properties by toggling layers in the side panel.
The application is also configured with data downloading, add data, select, print, measure, share,
and bookmark tools. Figure 72 shows the configured city bookmarks that allows the user to
quickly navigate between city locations.
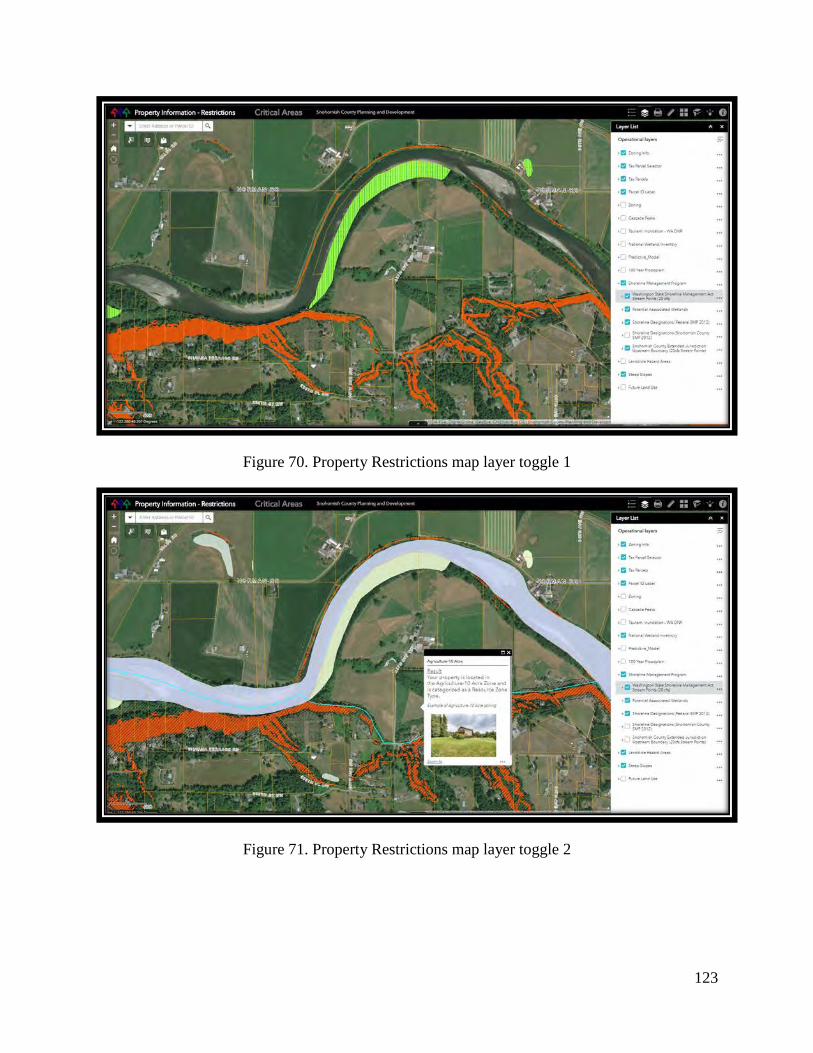
123
Figure 70. Property Restrictions map layer toggle 1
Figure 71. Property Restrictions map layer toggle 2
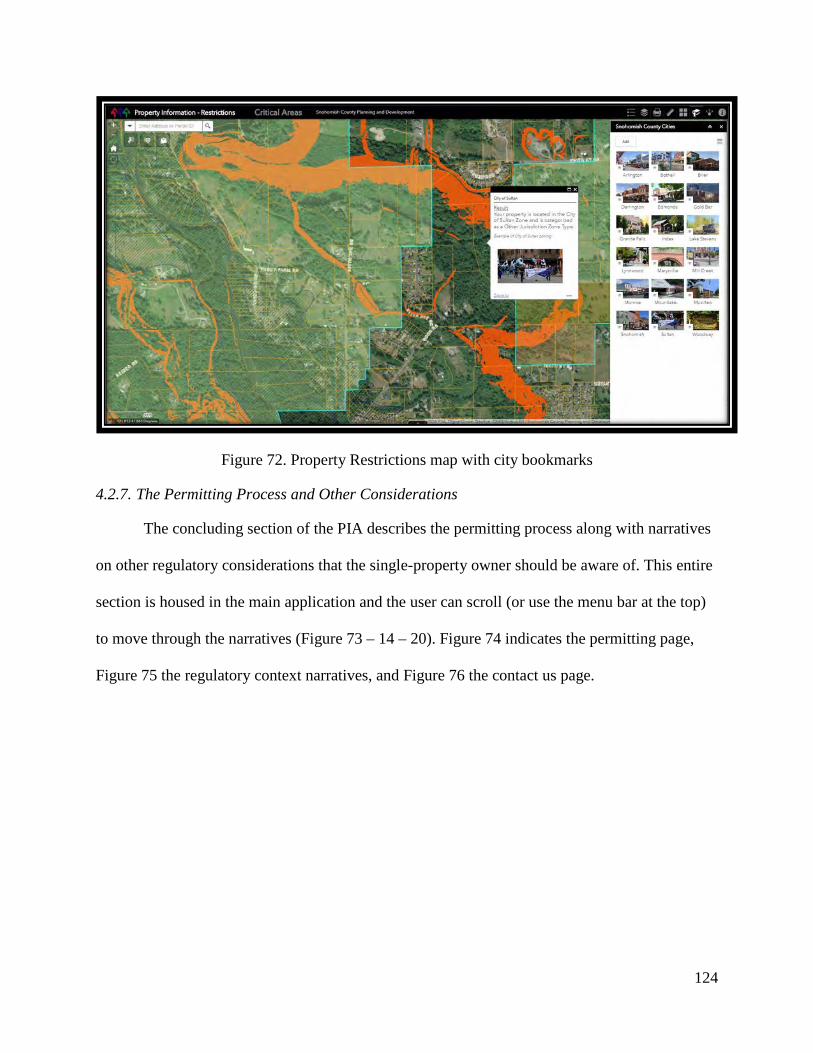
124
Figure 72. Property Restrictions map with city bookmarks
4.2.7. The Permitting Process and Other Considerations
The concluding section of the PIA describes the permitting process along with narratives
on other regulatory considerations that the single-property owner should be aware of. This entire
section is housed in the main application and the user can scroll (or use the menu bar at the top)
to move through the narratives (Figure 73 – 14 – 20). Figure 74 indicates the permitting page,
Figure 75 the regulatory context narratives, and Figure 76 the contact us page.
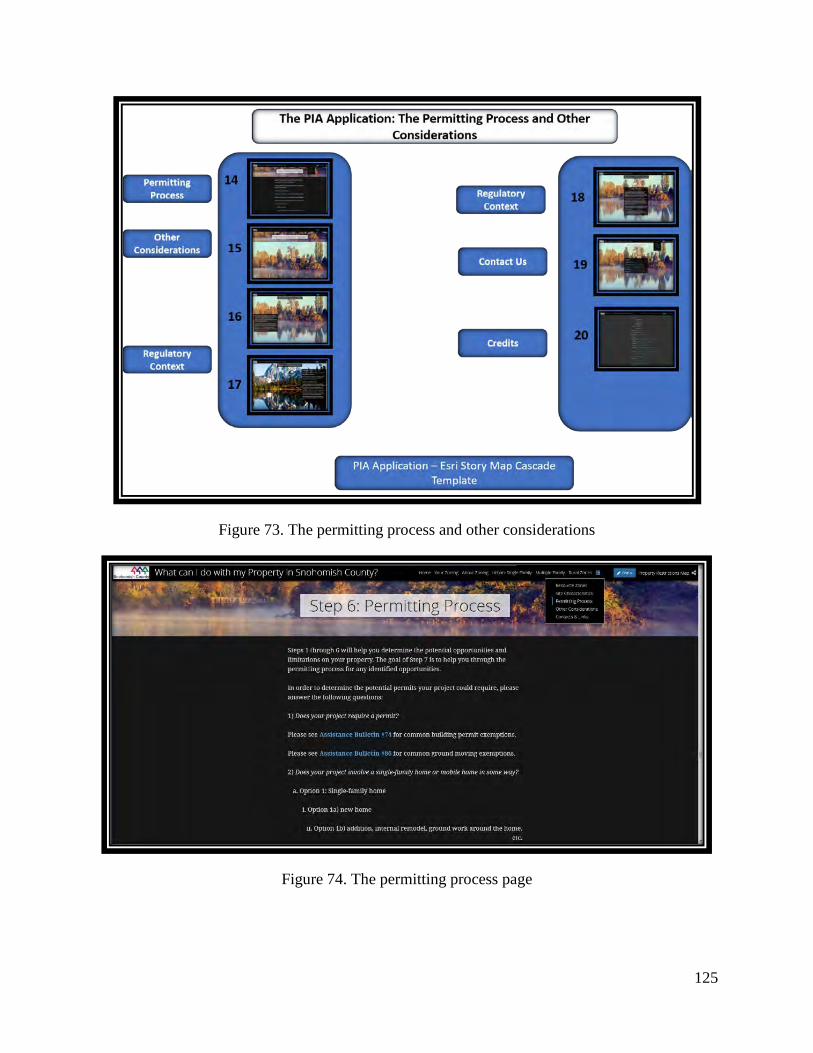
125
Figure 73. The permitting process and other considerations
Figure 74. The permitting process page
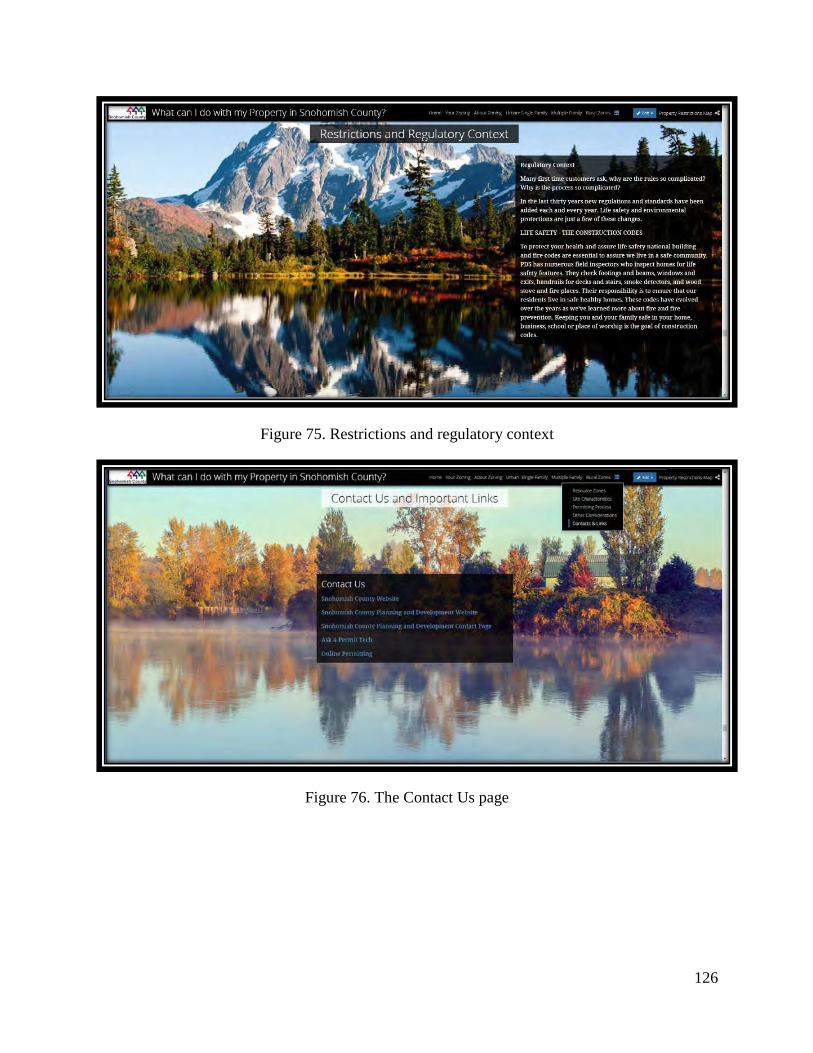
126
Figure 75. Restrictions and regulatory context
Figure 76. The Contact Us page
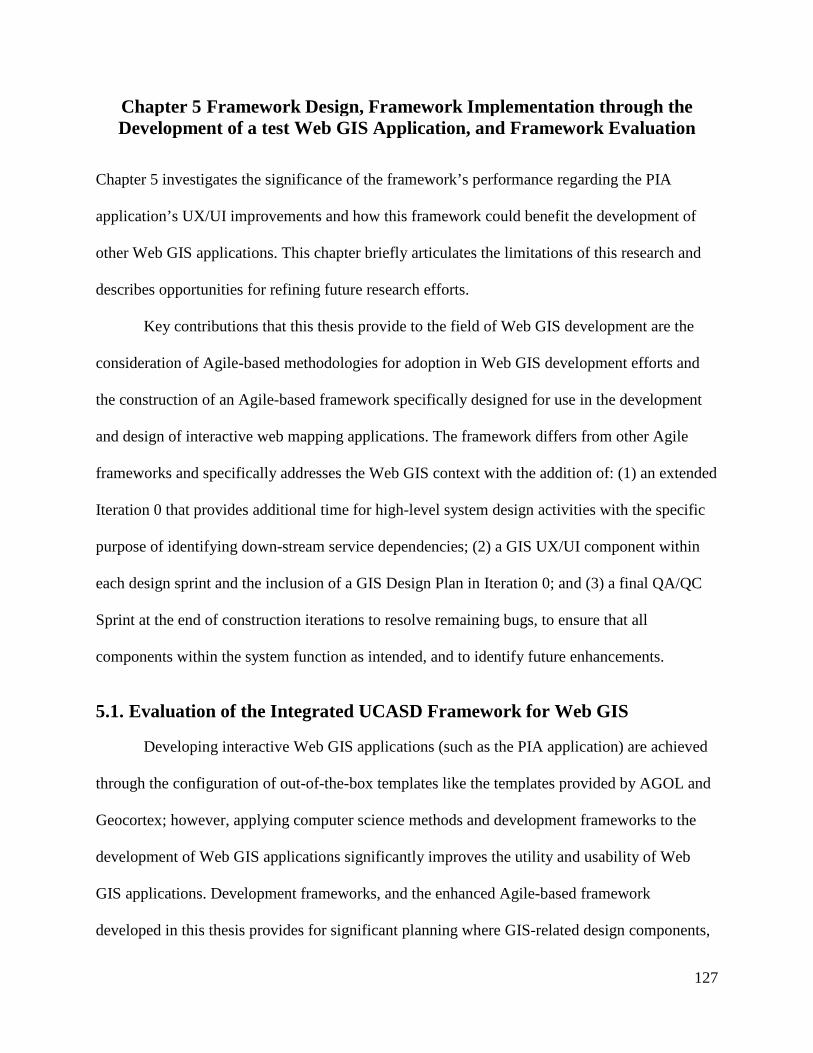
127
Chapter 5 Framework Design, Framework Implementation through the Development of a test Web GIS Application, and Framework Evaluation
Chapter 5 investigates the significance of the framework’s performance regarding the PIA
application’s UX/UI improvements and how this framework could benefit the development of
other Web GIS applications. This chapter briefly articulates the limitations of this research and
describes opportunities for refining future research efforts.
Key contributions that this thesis provide to the field of Web GIS development are the
consideration of Agile-based methodologies for adoption in Web GIS development efforts and
the construction of an Agile-based framework specifically designed for use in the development
and design of interactive web mapping applications. The framework differs from other Agile
frameworks and specifically addresses the Web GIS context with the addition of: (1) an extended
Iteration 0 that provides additional time for high-level system design activities with the specific
purpose of identifying down-stream service dependencies; (2) a GIS UX/UI component within
each design sprint and the inclusion of a GIS Design Plan in Iteration 0; and (3) a final QA/QC
Sprint at the end of construction iterations to resolve remaining bugs, to ensure that all
components within the system function as intended, and to identify future enhancements.
5.1. Evaluation of the Integrated UCASD Framework for Web GIS
Developing interactive Web GIS applications (such as the PIA application) are achieved
through the configuration of out-of-the-box templates like the templates provided by AGOL and
Geocortex; however, applying computer science methods and development frameworks to the
development of Web GIS applications significantly improves the utility and usability of Web
GIS applications. Development frameworks, and the enhanced Agile-based framework
developed in this thesis provides for significant planning where GIS-related design components,
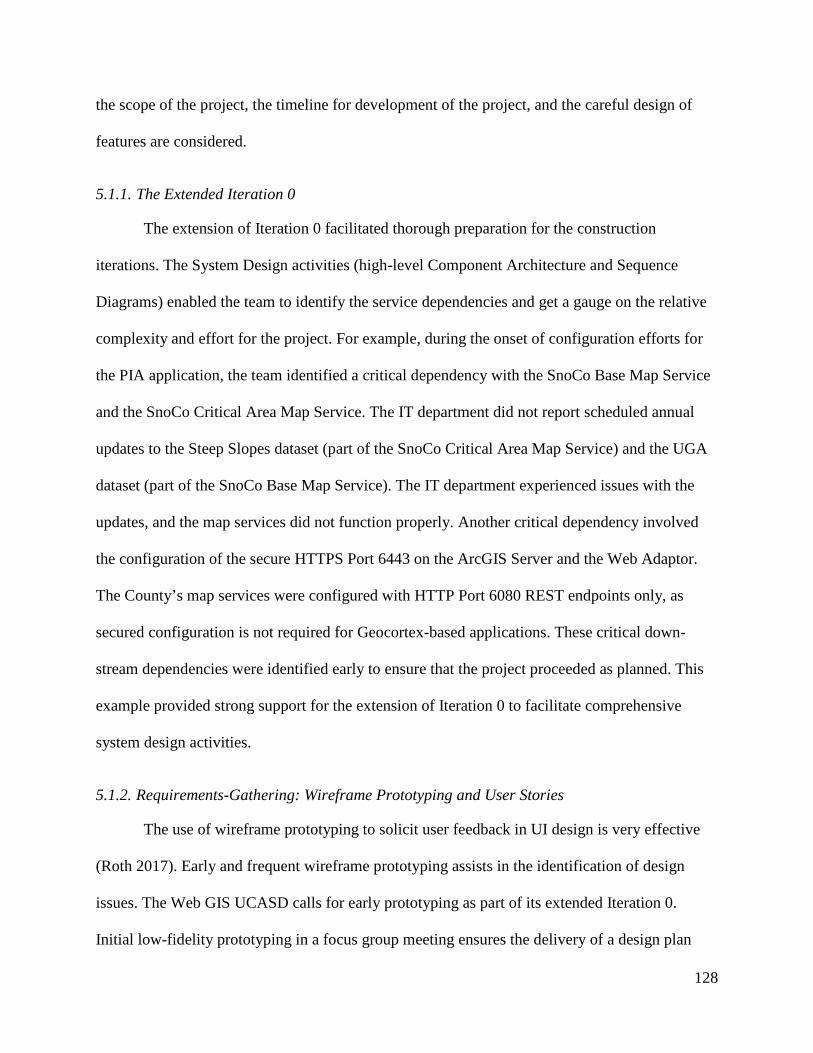
128
the scope of the project, the timeline for development of the project, and the careful design of
features are considered.
5.1.1. The Extended Iteration 0
The extension of Iteration 0 facilitated thorough preparation for the construction
iterations. The System Design activities (high-level Component Architecture and Sequence
Diagrams) enabled the team to identify the service dependencies and get a gauge on the relative
complexity and effort for the project. For example, during the onset of configuration efforts for
the PIA application, the team identified a critical dependency with the SnoCo Base Map Service
and the SnoCo Critical Area Map Service. The IT department did not report scheduled annual
updates to the Steep Slopes dataset (part of the SnoCo Critical Area Map Service) and the UGA
dataset (part of the SnoCo Base Map Service). The IT department experienced issues with the
updates, and the map services did not function properly. Another critical dependency involved
the configuration of the secure HTTPS Port 6443 on the ArcGIS Server and the Web Adaptor.
The County’s map services were configured with HTTP Port 6080 REST endpoints only, as
secured configuration is not required for Geocortex-based applications. These critical down-
stream dependencies were identified early to ensure that the project proceeded as planned. This
example provided strong support for the extension of Iteration 0 to facilitate comprehensive
system design activities.
5.1.2. Requirements-Gathering: Wireframe Prototyping and User Stories
The use of wireframe prototyping to solicit user feedback in UI design is very effective
(Roth 2017). Early and frequent wireframe prototyping assists in the identification of design
issues. The Web GIS UCASD calls for early prototyping as part of its extended Iteration 0.
Initial low-fidelity prototyping in a focus group meeting ensures the delivery of a design plan
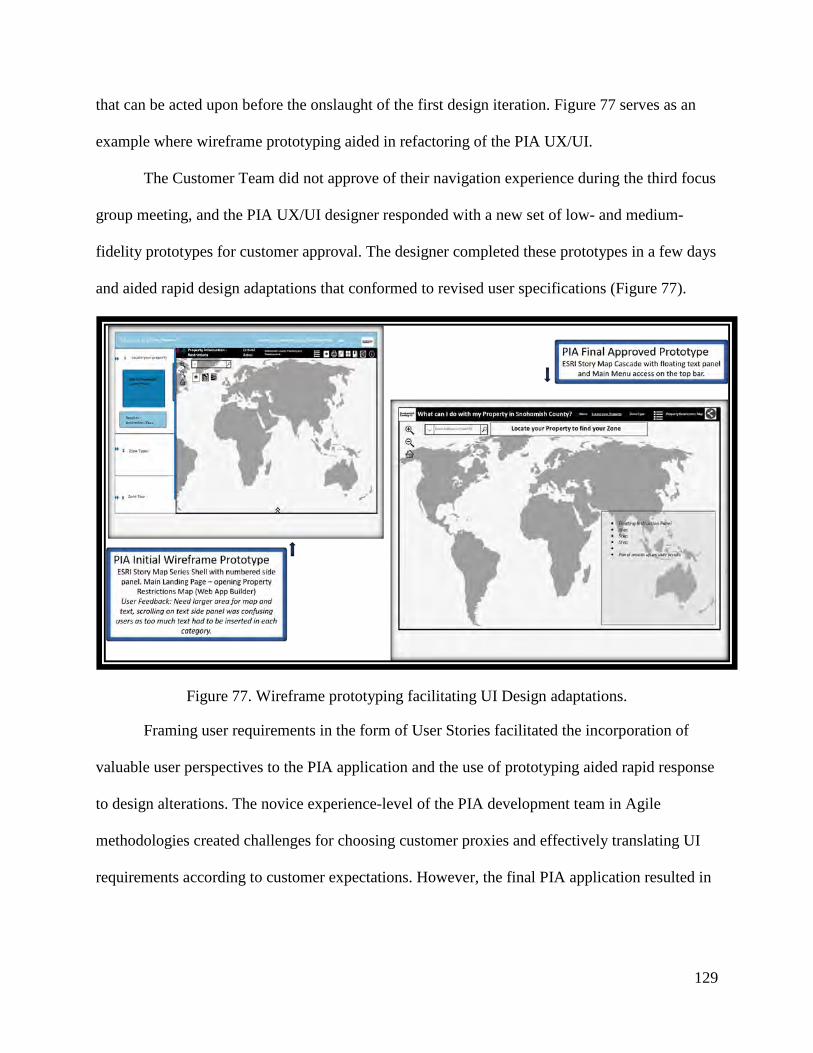
129
that can be acted upon before the onslaught of the first design iteration. Figure 77 serves as an
example where wireframe prototyping aided in refactoring of the PIA UX/UI.
The Customer Team did not approve of their navigation experience during the third focus
group meeting, and the PIA UX/UI designer responded with a new set of low- and medium-
fidelity prototypes for customer approval. The designer completed these prototypes in a few days
and aided rapid design adaptations that conformed to revised user specifications (Figure 77).
Figure 77. Wireframe prototyping facilitating UI Design adaptations.
Framing user requirements in the form of User Stories facilitated the incorporation of
valuable user perspectives to the PIA application and the use of prototyping aided rapid response
to design alterations. The novice experience-level of the PIA development team in Agile
methodologies created challenges for choosing customer proxies and effectively translating UI
requirements according to customer expectations. However, the final PIA application resulted in
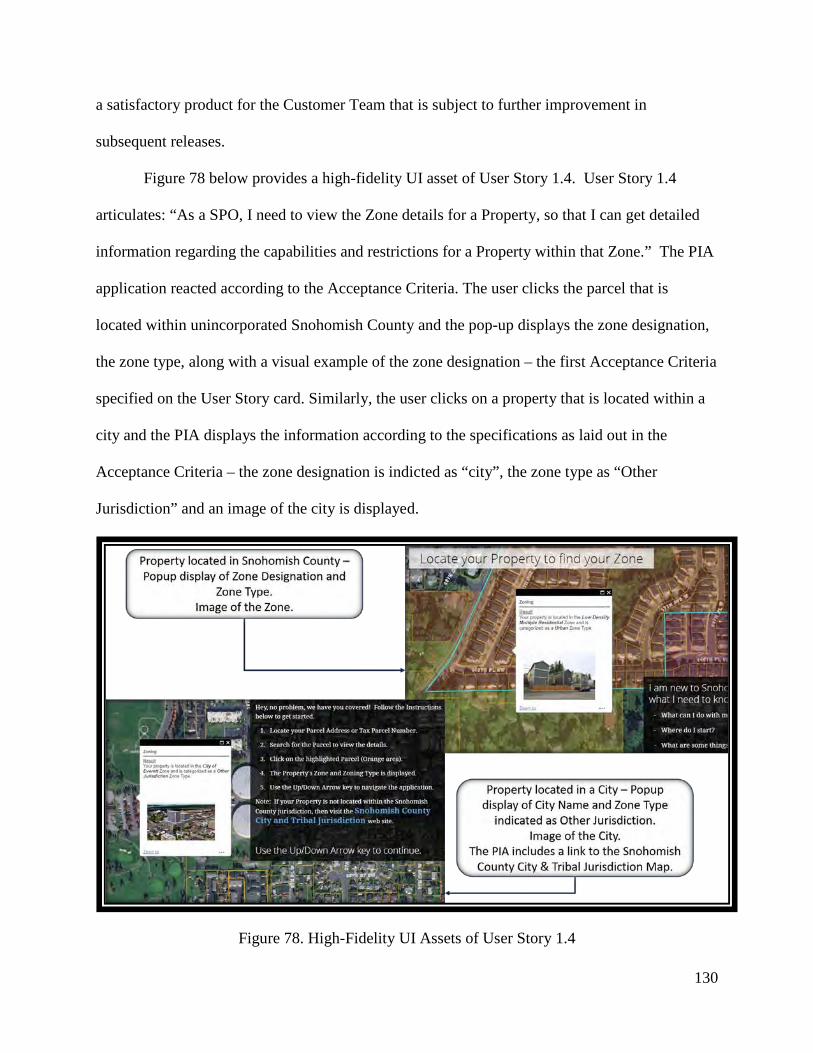
130
a satisfactory product for the Customer Team that is subject to further improvement in
subsequent releases.
Figure 78 below provides a high-fidelity UI asset of User Story 1.4. User Story 1.4
articulates: “As a SPO, I need to view the Zone details for a Property, so that I can get detailed
information regarding the capabilities and restrictions for a Property within that Zone.” The PIA
application reacted according to the Acceptance Criteria. The user clicks the parcel that is
located within unincorporated Snohomish County and the pop-up displays the zone designation,
the zone type, along with a visual example of the zone designation – the first Acceptance Criteria
specified on the User Story card. Similarly, the user clicks on a property that is located within a
city and the PIA displays the information according to the specifications as laid out in the
Acceptance Criteria – the zone designation is indicted as “city”, the zone type as “Other
Jurisdiction” and an image of the city is displayed.
Figure 78. High-Fidelity UI Assets of User Story 1.4
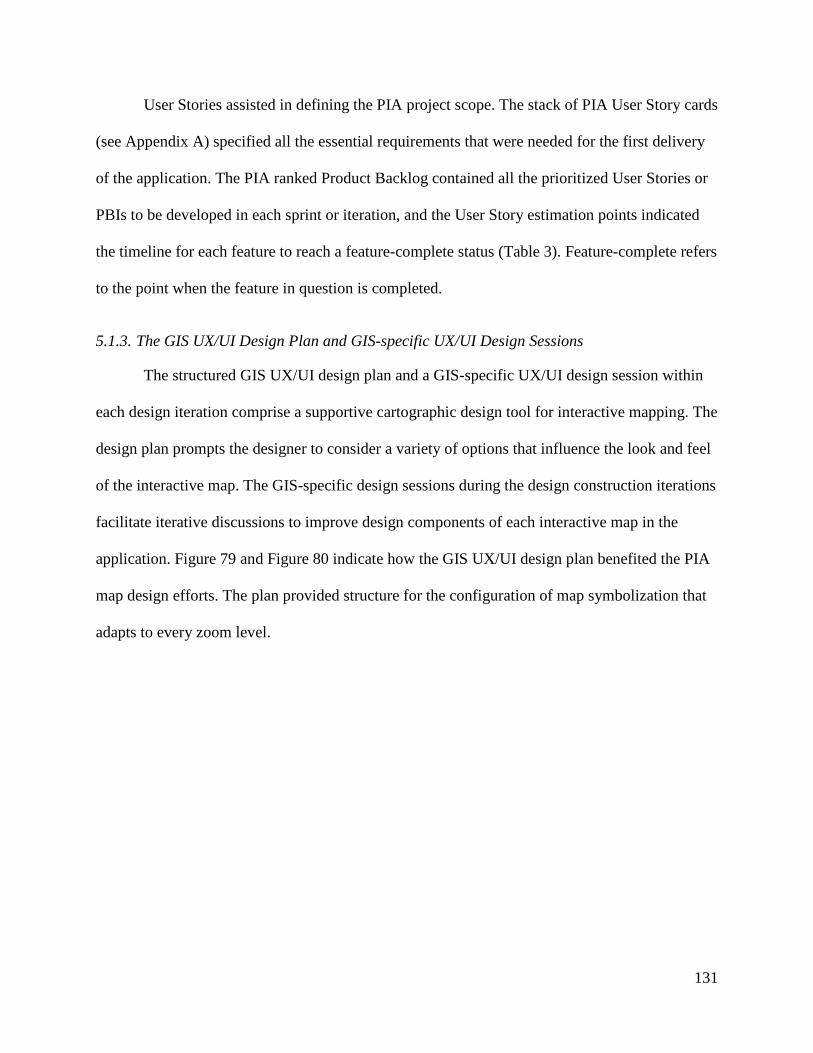
131
User Stories assisted in defining the PIA project scope. The stack of PIA User Story cards
(see Appendix A) specified all the essential requirements that were needed for the first delivery
of the application. The PIA ranked Product Backlog contained all the prioritized User Stories or
PBIs to be developed in each sprint or iteration, and the User Story estimation points indicated
the timeline for each feature to reach a feature-complete status (Table 3). Feature-complete refers
to the point when the feature in question is completed.
5.1.3. The GIS UX/UI Design Plan and GIS-specific UX/UI Design Sessions
The structured GIS UX/UI design plan and a GIS-specific UX/UI design session within
each design iteration comprise a supportive cartographic design tool for interactive mapping. The
design plan prompts the designer to consider a variety of options that influence the look and feel
of the interactive map. The GIS-specific design sessions during the design construction iterations
facilitate iterative discussions to improve design components of each interactive map in the
application. Figure 79 and Figure 80 indicate how the GIS UX/UI design plan benefited the PIA
map design efforts. The plan provided structure for the configuration of map symbolization that
adapts to every zoom level.
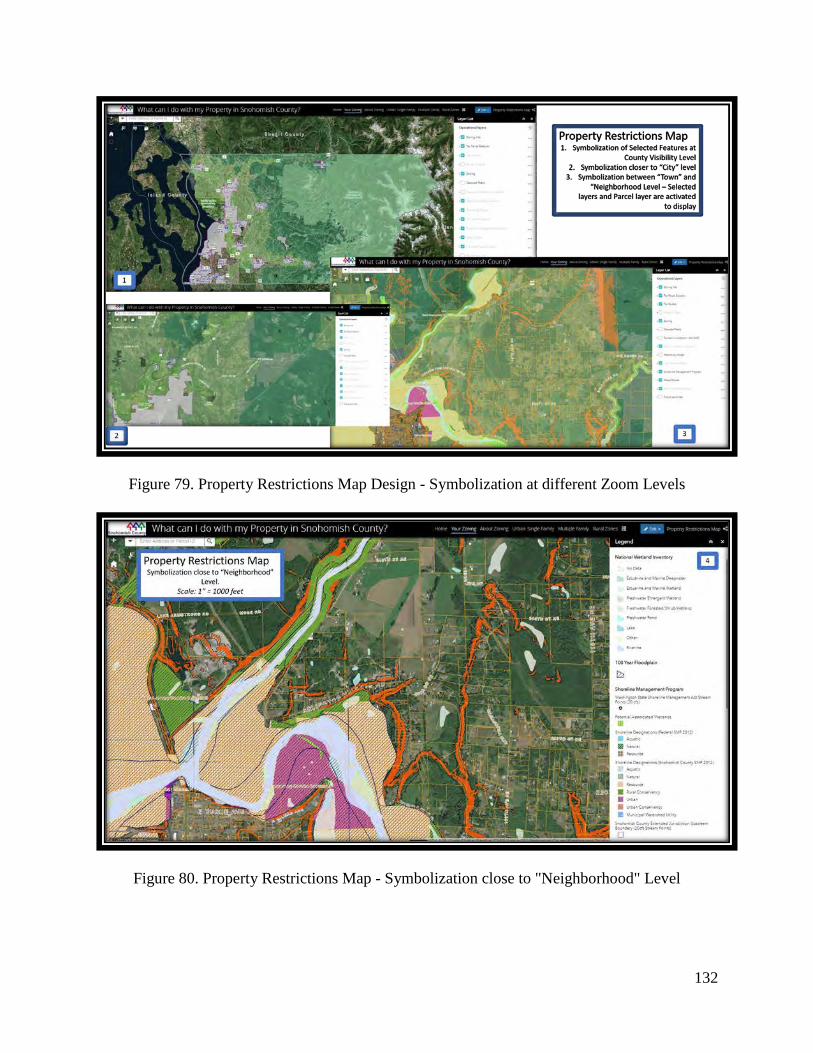
132
Figure 79. Property Restrictions Map Design - Symbolization at different Zoom Levels
Figure 80. Property Restrictions Map - Symbolization close to "Neighborhood" Level
133
The structured design plan that forms part of the Web GIS UCASD can significantly
benefit from further exploration. This plan considers layers and services to be configured for
selected zoom levels, visual considerations in terms of transparency and visibility at a specific
scale, along with AGOL-based tools to use for the map in question. Valuable components to add
to a structured GIS UX/UI plan include the behavior of dynamic elements, a hierarchical
representation of proposed layers and symbolization applications at each zoom level, the
adherence to a certain color scheme, the consideration of a multitude of symbol characteristics,
labeling styles and font selection, as well as accessibility considerations. There are many more
interactive mapping design considerations to discuss and the creation of a comprehensive
interactive GIS UX/UI design plan becomes a valuable future research effort.
Accessible software refers to the removal of software interactive barriers that concern
people with disabilities. Color blindness (especially red-green color blindness) is one example,
especially for map creation. Design plans must consider the application of color schemes that do
not include simultaneous use of reds and greens. Furthermore, it is best practice to employ a
diverse Customer Team that includes potential users with disabilities, if the application under
development is to reach a larger, more inclusive audience. Accessibility is an inclusive UI
concept and must not be ignored in the design process. Pre-configured design plans are an asset
in assisting neo-geographers and amateur map developers in selecting appropriate designs that
complement their interactive mapping efforts. However, a flexible GIS UX/UI design plan is
necessary to successfully assist professional interactive map developers with the configuration of
intricate mapping applications.
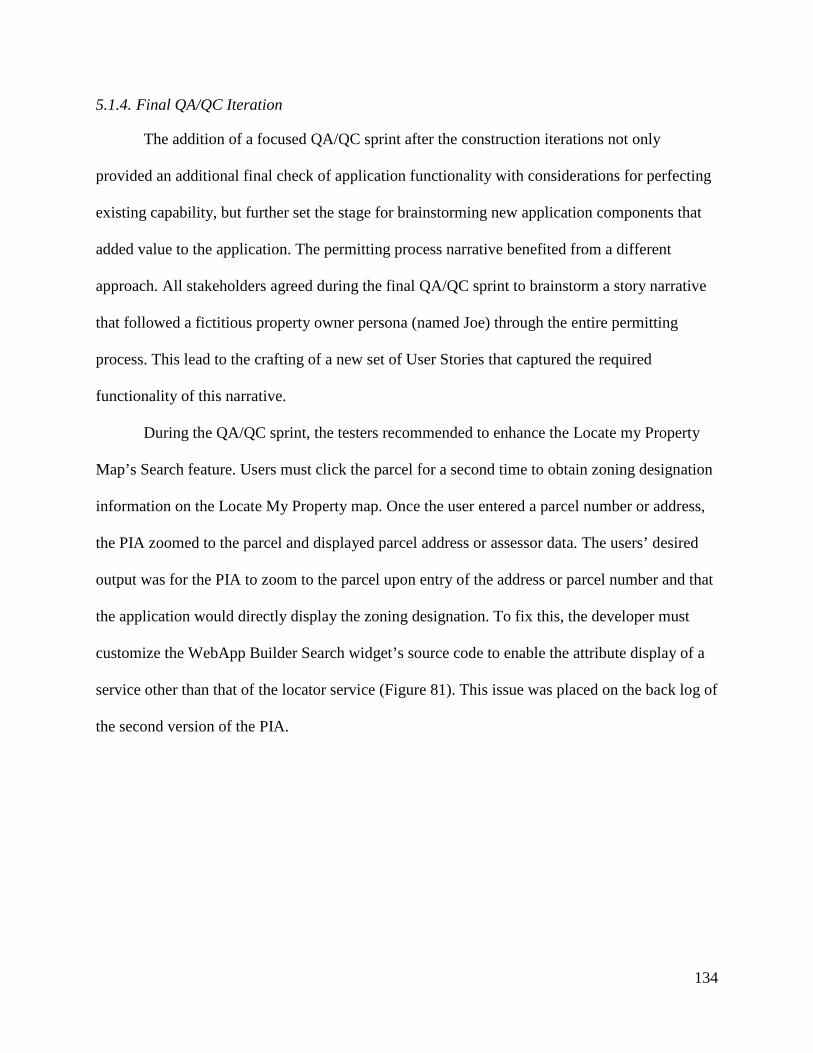
134
5.1.4. Final QA/QC Iteration
The addition of a focused QA/QC sprint after the construction iterations not only
provided an additional final check of application functionality with considerations for perfecting
existing capability, but further set the stage for brainstorming new application components that
added value to the application. The permitting process narrative benefited from a different
approach. All stakeholders agreed during the final QA/QC sprint to brainstorm a story narrative
that followed a fictitious property owner persona (named Joe) through the entire permitting
process. This lead to the crafting of a new set of User Stories that captured the required
functionality of this narrative.
During the QA/QC sprint, the testers recommended to enhance the Locate my Property
Map’s Search feature. Users must click the parcel for a second time to obtain zoning designation
information on the Locate My Property map. Once the user entered a parcel number or address,
the PIA zoomed to the parcel and displayed parcel address or assessor data. The users’ desired
output was for the PIA to zoom to the parcel upon entry of the address or parcel number and that
the application would directly display the zoning designation. To fix this, the developer must
customize the WebApp Builder Search widget’s source code to enable the attribute display of a
service other than that of the locator service (Figure 81). This issue was placed on the back log of
the second version of the PIA.
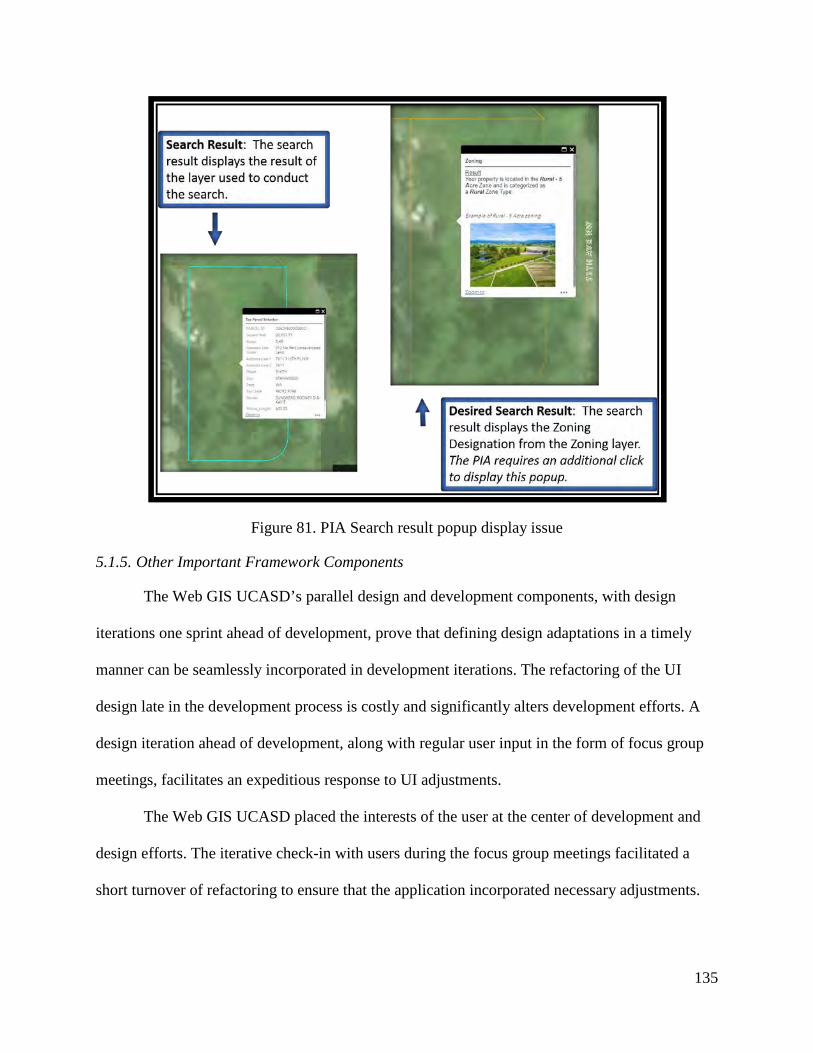
135
Figure 81. PIA Search result popup display issue
5.1.5. Other Important Framework Components
The Web GIS UCASD’s parallel design and development components, with design
iterations one sprint ahead of development, prove that defining design adaptations in a timely
manner can be seamlessly incorporated in development iterations. The refactoring of the UI
design late in the development process is costly and significantly alters development efforts. A
design iteration ahead of development, along with regular user input in the form of focus group
meetings, facilitates an expeditious response to UI adjustments.
The Web GIS UCASD placed the interests of the user at the center of development and
design efforts. The iterative check-in with users during the focus group meetings facilitated a
short turnover of refactoring to ensure that the application incorporated necessary adjustments.
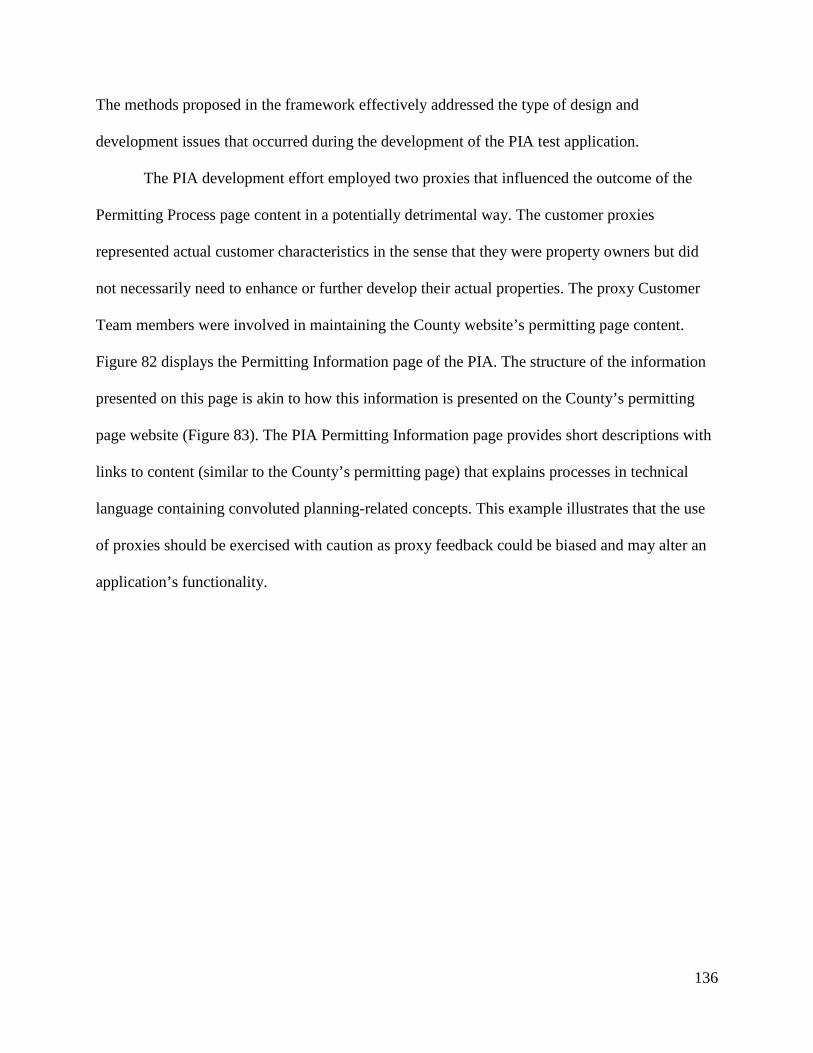
136
The methods proposed in the framework effectively addressed the type of design and
development issues that occurred during the development of the PIA test application.
The PIA development effort employed two proxies that influenced the outcome of the
Permitting Process page content in a potentially detrimental way. The customer proxies
represented actual customer characteristics in the sense that they were property owners but did
not necessarily need to enhance or further develop their actual properties. The proxy Customer
Team members were involved in maintaining the County website’s permitting page content.
Figure 82 displays the Permitting Information page of the PIA. The structure of the information
presented on this page is akin to how this information is presented on the County’s permitting
page website (Figure 83). The PIA Permitting Information page provides short descriptions with
links to content (similar to the County’s permitting page) that explains processes in technical
language containing convoluted planning-related concepts. This example illustrates that the use
of proxies should be exercised with caution as proxy feedback could be biased and may alter an
application’s functionality.
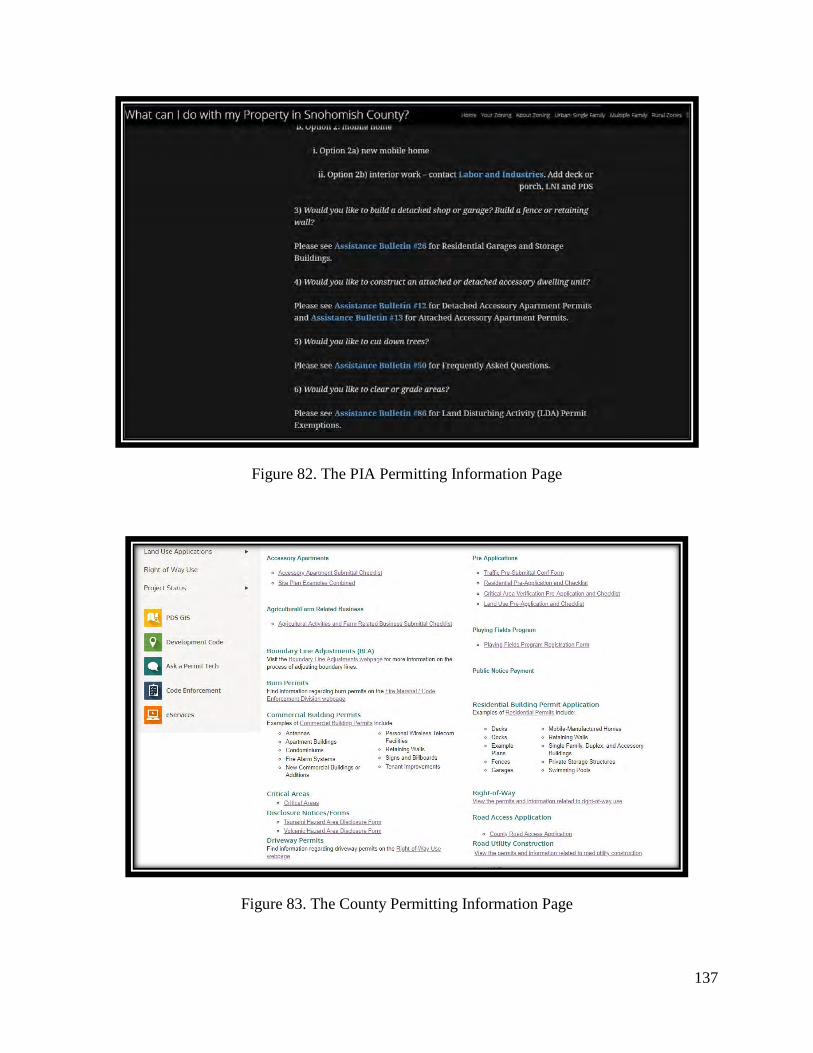
137
Figure 82. The PIA Permitting Information Page
Figure 83. The County Permitting Information Page
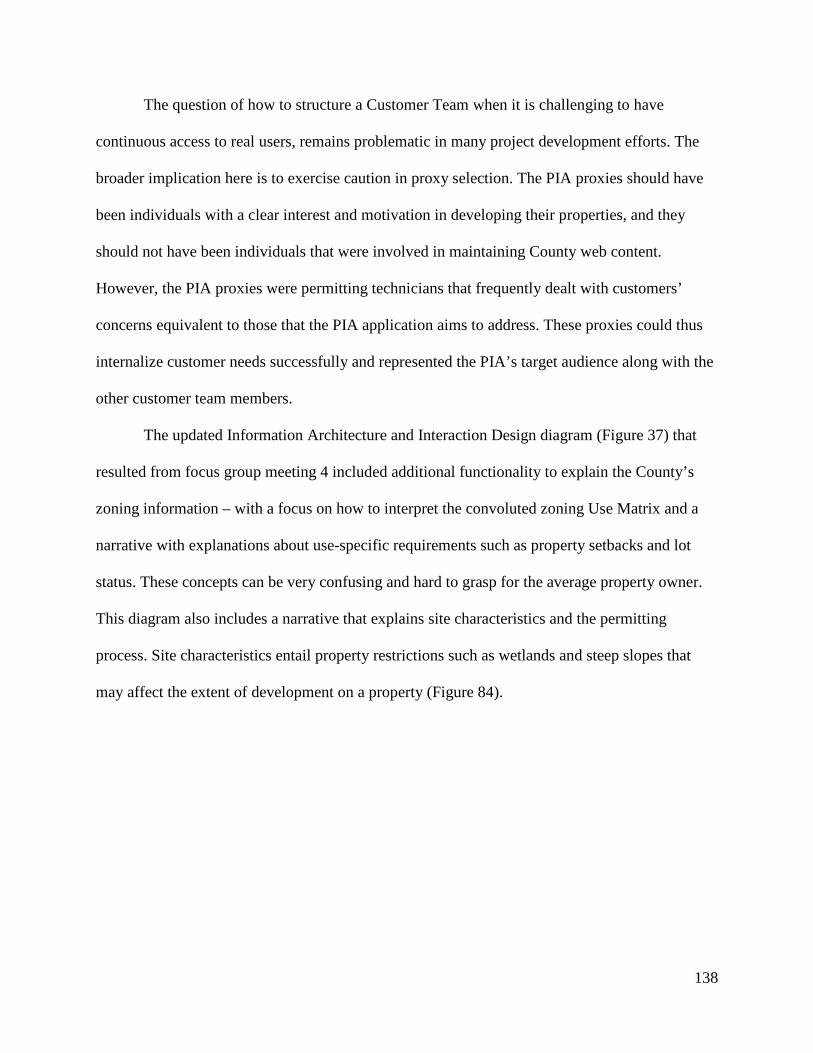
138
The question of how to structure a Customer Team when it is challenging to have
continuous access to real users, remains problematic in many project development efforts. The
broader implication here is to exercise caution in proxy selection. The PIA proxies should have
been individuals with a clear interest and motivation in developing their properties, and they
should not have been individuals that were involved in maintaining County web content.
However, the PIA proxies were permitting technicians that frequently dealt with customers’
concerns equivalent to those that the PIA application aims to address. These proxies could thus
internalize customer needs successfully and represented the PIA’s target audience along with the
other customer team members.
The updated Information Architecture and Interaction Design diagram (Figure 37) that
resulted from focus group meeting 4 included additional functionality to explain the County’s
zoning information – with a focus on how to interpret the convoluted zoning Use Matrix and a
narrative with explanations about use-specific requirements such as property setbacks and lot
status. These concepts can be very confusing and hard to grasp for the average property owner.
This diagram also includes a narrative that explains site characteristics and the permitting
process. Site characteristics entail property restrictions such as wetlands and steep slopes that
may affect the extent of development on a property (Figure 84).
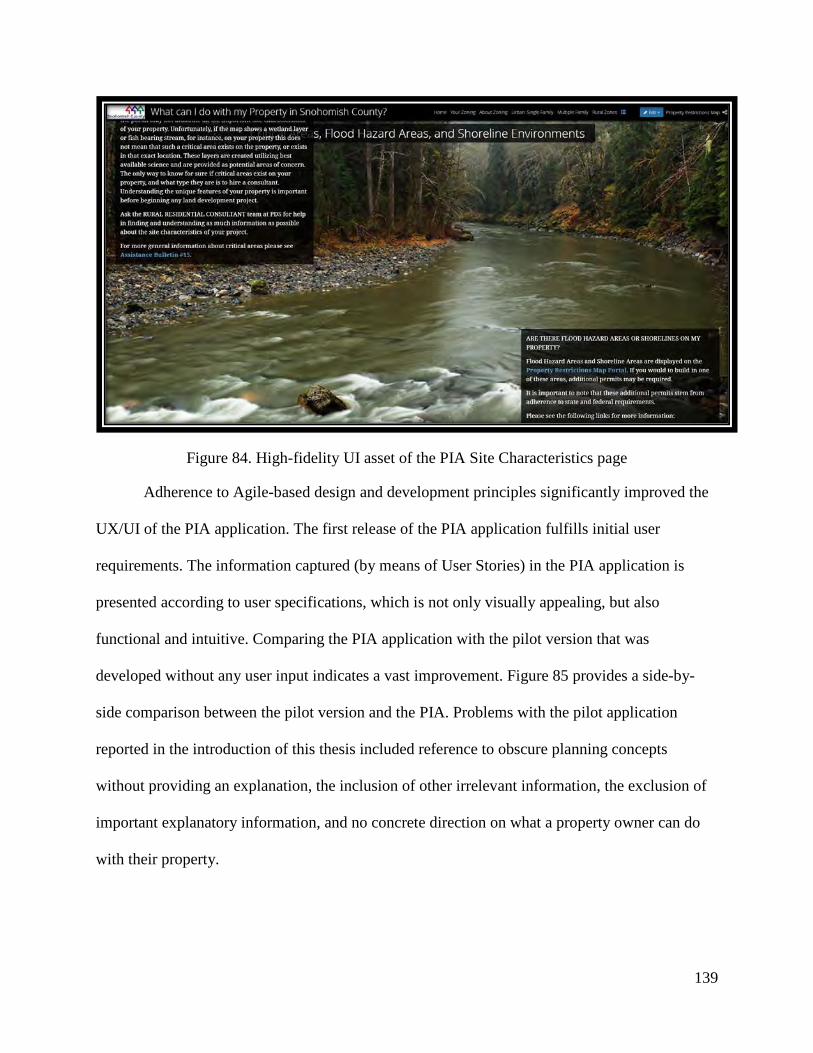
139
Figure 84. High-fidelity UI asset of the PIA Site Characteristics page
Adherence to Agile-based design and development principles significantly improved the
UX/UI of the PIA application. The first release of the PIA application fulfills initial user
requirements. The information captured (by means of User Stories) in the PIA application is
presented according to user specifications, which is not only visually appealing, but also
functional and intuitive. Comparing the PIA application with the pilot version that was
developed without any user input indicates a vast improvement. Figure 85 provides a side-by-
side comparison between the pilot version and the PIA. Problems with the pilot application
reported in the introduction of this thesis included reference to obscure planning concepts
without providing an explanation, the inclusion of other irrelevant information, the exclusion of
important explanatory information, and no concrete direction on what a property owner can do
with their property.
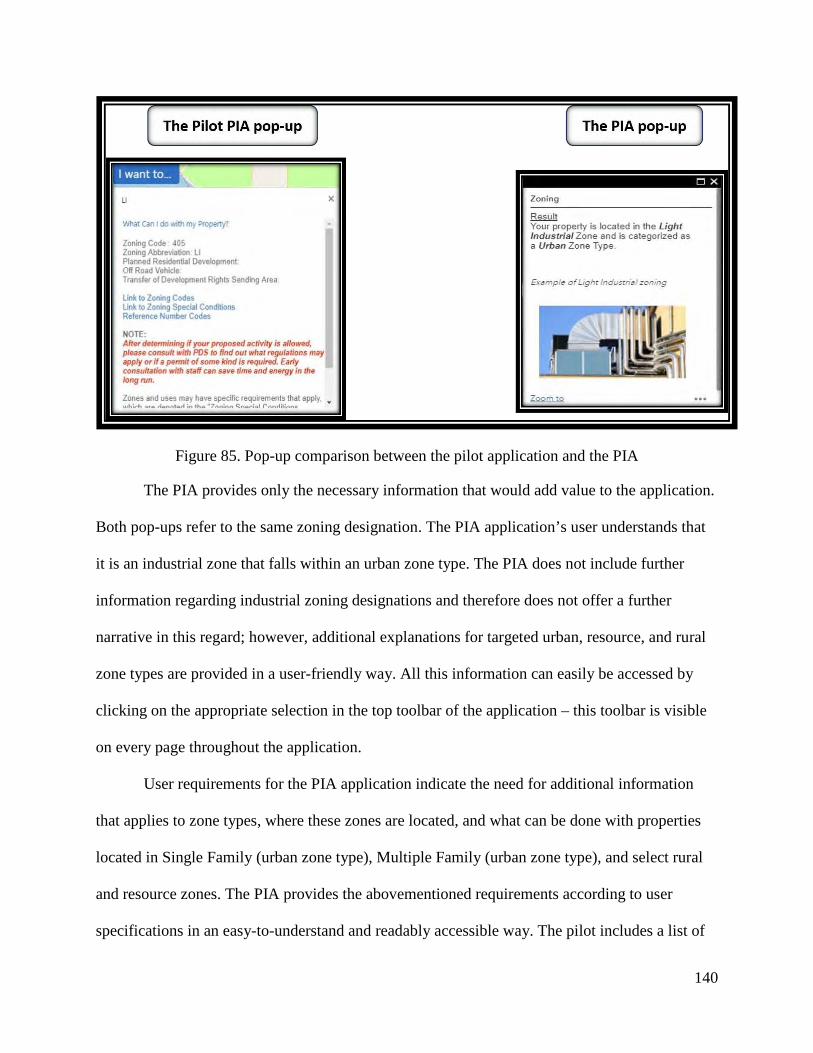
140
Figure 85. Pop-up comparison between the pilot application and the PIA
The PIA provides only the necessary information that would add value to the application.
Both pop-ups refer to the same zoning designation. The PIA application’s user understands that
it is an industrial zone that falls within an urban zone type. The PIA does not include further
information regarding industrial zoning designations and therefore does not offer a further
narrative in this regard; however, additional explanations for targeted urban, resource, and rural
zone types are provided in a user-friendly way. All this information can easily be accessed by
clicking on the appropriate selection in the top toolbar of the application – this toolbar is visible
on every page throughout the application.
User requirements for the PIA application indicate the need for additional information
that applies to zone types, where these zones are located, and what can be done with properties
located in Single Family (urban zone type), Multiple Family (urban zone type), and select rural
and resource zones. The PIA provides the abovementioned requirements according to user
specifications in an easy-to-understand and readably accessible way. The pilot includes a list of
141
allowed uses within a zone, but the information is not readily accessible (Figure 85). This
functionality is extracted and shaped by means of Agile-based methods that place the user in the
center of these efforts by means of iterations that allow for regular assessment and frequent
adaptations.
5.1.6. Framework Limitations
The Web GIS UCASD presents certain limitations, yet these apply to all software
development efforts whether it is Web GIS or any other application. In many ways, the
development of Web GIS applications is no different than the development of other web-based
applications. The Web GIS UCASD presumes that team members are skilled (both in their
profession and in Agile project management), that teams have easy access to customers, and that
all team members are on board to create applications using Agile processes. However, these
presumptions may not always match reality. The discussion below describes these limitations
and how they were handled during the development of the PIA application.
The success of the implementation of the Web GIS UCASD depends on the competence
level of the entire team in both their profession and in Agile processes as it can influence the
outcome of the project. The framework can only be as successful as its practitioners allow it to
be. The Web GIS UCASD suggests the use of requirements-gathering, system design, GIS-
specific design, and UX/UI design tools along with Agile iterative construction processes that a
team can exploit to create a successful end-product. Leveraging these tools successfully requires
experience and training. The design, development, and testing roles of the PIA team (along with
the PO role) exhibited competency in executing their functional roles except for the Scrum
Master. The tester and PO were not familiar with Agile processes but were eager to learn and
adapt. I was responsible for design and development and possessed Agile project management
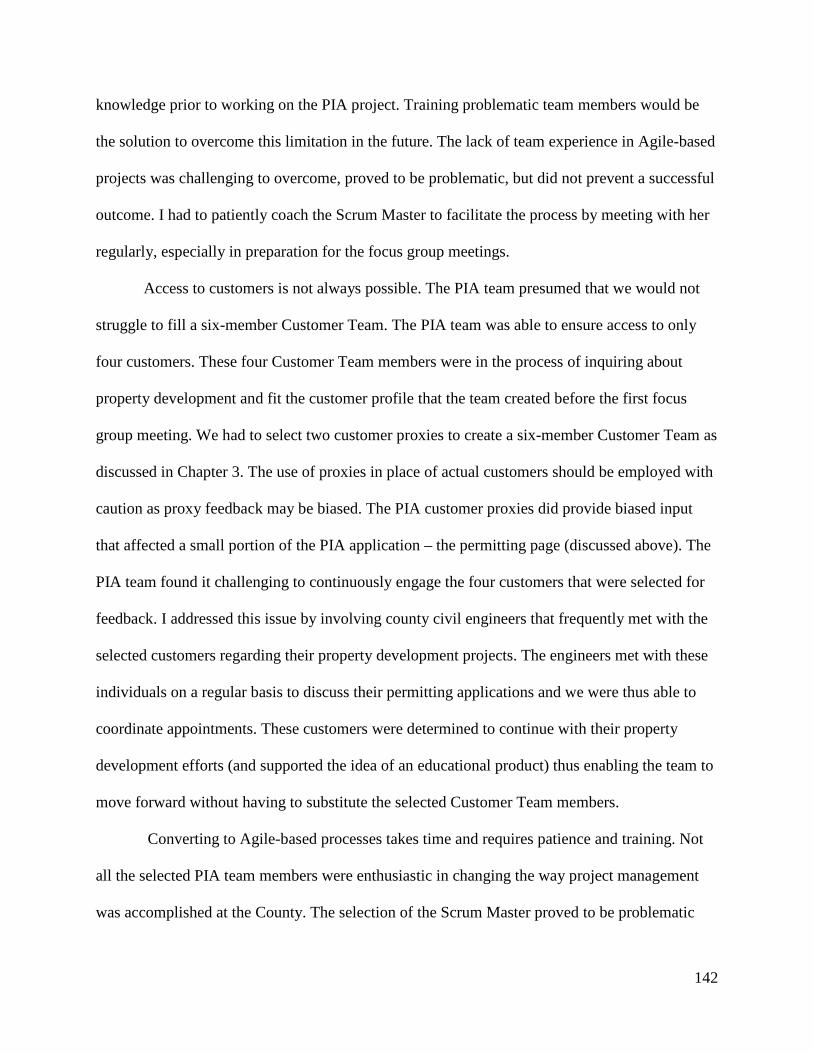
142
knowledge prior to working on the PIA project. Training problematic team members would be
the solution to overcome this limitation in the future. The lack of team experience in Agile-based
projects was challenging to overcome, proved to be problematic, but did not prevent a successful
outcome. I had to patiently coach the Scrum Master to facilitate the process by meeting with her
regularly, especially in preparation for the focus group meetings.
Access to customers is not always possible. The PIA team presumed that we would not
struggle to fill a six-member Customer Team. The PIA team was able to ensure access to only
four customers. These four Customer Team members were in the process of inquiring about
property development and fit the customer profile that the team created before the first focus
group meeting. We had to select two customer proxies to create a six-member Customer Team as
discussed in Chapter 3. The use of proxies in place of actual customers should be employed with
caution as proxy feedback may be biased. The PIA customer proxies did provide biased input
that affected a small portion of the PIA application – the permitting page (discussed above). The
PIA team found it challenging to continuously engage the four customers that were selected for
feedback. I addressed this issue by involving county civil engineers that frequently met with the
selected customers regarding their property development projects. The engineers met with these
individuals on a regular basis to discuss their permitting applications and we were thus able to
coordinate appointments. These customers were determined to continue with their property
development efforts (and supported the idea of an educational product) thus enabling the team to
move forward without having to substitute the selected Customer Team members.
Converting to Agile-based processes takes time and requires patience and training. Not
all the selected PIA team members were enthusiastic in changing the way project management
was accomplished at the County. The selection of the Scrum Master proved to be problematic
143
and only one other GIS Analyst was willing to participate as a tester for the PIA project using
Agile techniques. The pre-Agile team structure is discussed in Chapter 3. A GIS supervisor
assumed the role as Scrum Master. The Scrum Master’s main role was to facilitate
communication between the PO and other team members and to allow the design and
development team (in this case myself) to oversee the design and development process. Self-
managed teams are a characteristic of Agile project management. The chosen Scrum Master
struggled to allow the team to drive the design and development processes and tried to micro-
manage the PIA project. I had to work with the Scrum Master’s management style and suggested
that the PO provide training for future Agile-based endeavors as the role of a Scrum Master is
not to dictate the development or design process, but to facilitate and ensure that there are no
impediments that could hinder progress.
5.2. Conclusion
Factors that limited this research effort include the experience of the team in Agile-based
frameworks, the availability of an extensive team structure, the organization’s resistance to
change, and the period in which to accomplish research objectives. All activities related to the
design and development of the PIA test application were accomplished by the author, except for
the Customer Team feedback loop that consisted of six individuals and the PO role that was
fulfilled by the planning department’s director. The desired composition of an Agile team is at
least 4 - 6 developers (where most of the team should be experienced, Agile-based developers);
at least one UX/UI designer; a Scrum Master (for projects that adhere strictly to Agile
principles); and at least one Project Manager, Technical Project Manager, and Program Manager
(that manages multiple projects) depending on the organizational structure. The PIA
development timetable was limited to the thesis timeline. The PIA application’s development

144
process is restricted to template configuration activities to facilitate timely completion of the
application. The addition of more programming-intensive requirements adds additional insights
to the claims made in this thesis. Resistance to change and an organization’s willingness to adopt
change is challenging. This thesis pioneers the exploration of Agile-based methodologies in the
County, specifically where GIS development efforts are concerned. Expanding this effort in the
future will be challenging as County employees (including other GIS analysts and IT staff) are
very resistant to change.
Agile-based projects do not focus on documentation or extended planning, as emphasis is
placed on creating working software early in the process. I addressed the lack of emphasis on
design and planning through the extension of Iteration 0. The extension of Iteration 0
accommodated for more time in achieving a well-structured system design and requirement
focus and ensured that these efforts were well documented. The artifacts created during Iteration
0 provided enough information to facilitate understanding of how the application was
constructed.
Opportunities for future improvement as discussed in the section above include the
development of larger, coding-intensive projects and the use of a comprehensive design and
development team with experience in Agile-based development. The GIS UX/UI Design Plan
template can further be enhanced to include more design considerations involved in producing
interactive maps, such as standardized design options to aid in choosing appropriate design
combinations. This research experimented with the Scrum framework during the construction
iterations. Future research could substitute Kanban methods during the construction stages to
analyze how Web GIS development can adapt to Kanban methods.
145
GIS professionals can elect to apply Agile-based system design and development
components towards GIS-based projects without adaptation. Agile-based variations added to the
Web GIS UCASD is not GIS-specific and can benefit any software development effort. Existing
UCD design tools can be applied to Web GIS interface design however UCD UX/UI design
methods need to include tools that accommodate Web GIS-specific design complexities such as
visualization at different zoom levels, base map inclusion, symbology at each zoom level,
transparency, and map scale for visibility ranges.
146
References
Ambler, Scott. Mark Lines. 2013. “Disciplined Agile Delivery (DAD): A Practitioner’s Guide to
Agile Software Delivery in the Enterprise.” Accessed May 24, 2018.
http://www.ambysoft.com/books/dad.html
Beck, Kent, Mike Beedle, Arie van Bennekum, Alistair Cockburn, Ward Cunningham, Martin
Fowler, James Grenning, Jim Highsmith, Andrew Hunt, Ron Jeffries, Jon Kern, Brian
Marick, Robert Martin, Steve Mellor Ken Schwaber, Jeff Sutherland, and Dave Thomas.
2001. “Manifesto for Agile Software Development” Accessed on June 1 2018.
http://agilemanifesto.org/iso/en/manifesto.html
Brhel, Manuel, Hendrik Meth, Alexander Maedche, and Karl Werder. 2015. “Exploring
Principles of User-centered Agile Software Development: A Literature Review.”
Information and Software Technology 61 (2015): 163-81.
Cohn, Mike. 2004. User Stories Applied. Boston: Pearson Addison-Wesley.
Da Silva, Tiago, Milene Selbach Silveira, and Frank Maurer. 2013. “Ten Lessons Learned from
Integrating Interaction Design and Agile Development.” Agile Conference (AGILE),
2013, 2013, 42-49.
Denning, Steve. 2015. Agile: The World’s Most Popular Innovation Engine. Forbes. July 23,
2015. Accessed March 21, 2018.
https://www.forbes.com/sites/stevedenning/2015/07/23/the-worlds-most-popular-
innovation-engine/#7d95777b7c76
Deuff, Dominique, Mathilde Cosquer. 2013. User-Centered Agile Method. New Jersey: Wiley.
DiBiase, David, Tripp Corbin, Thomas Fox, Joe Francica, Kass Green, Janet Jackson,Gary
Jeffress, Brian Jones, Brent Jones, Jeremy Mennis, Karen Schuckman, Cy Smith, and Jan
Van Sickle. “The New Geospatial Technology Competency Model: Bringing Workforce
Needs into Focus. (Report).” URISA Journal 22, no. 2 (2010): 55-72.
file:///H:/SSCI_594/Research%20Resources/The_new_geospatial_technology%20compet
ency%20model.PDF
Earley T. 2018. “Kanban” Lean Manufacturing Tools. Accessed May 23, 2018.
http://leanmanufacturingtools.org/kanban/
147
EPA. 2017. “EPA Developers Guide.” EPA, 2017. Accessed May 15, 2018.
https://developer.epa.gov/guide/templates-guides/agile/agile-frameworks/
Esri, 2017. “ArcGIS Online Help”. Esri. Accessed March 19, 2018.
https://doc.arcgis.com/en/arcgis-online/reference/what-is-agol.htm
Fu, Pinde, Jiulin Sun 2011. Web GIS: Principles and Applications. Redlands California: Esri
Press.
Garrett, J. J. 2010. The Elements of User Experience – User-Centered Design for the Web and
beyond, 2nd edition. New Riders: Indianapolis, IN.
Hacklay, Mordechai, Antigoni Zafiri. 2008. “Usability Engineering for GIS: Learning from a
Screenshot.” The Cartographic Journal, Vol. 45(2).
Hyderabad (2013). “Can GIS be agile?” Geospatial Today, November 28
http://libproxy.usc.edu/login?url=https://search-proquest-
com.libproxy1.usc.edu/docview/1518299811?accountid=14749
Issa, Tomayess, Pedro Isaias. 2015. Sustainable Design HCI, Usability and Environmental
Concerns. London: Springer-Verlag. https://link-springer-
com.libproxy2.usc.edu/book/10.1007%2F978-1-4471-6753-2
Larusdottir, Marta., Jan Gulliksen, and Asa Cajander. 2017. A license to kill – Improving UCSD
in Agile development. The Journal of Systems and Software. Vol. 123 (2017).
Linders, Ben. 2014. “Documentation in Agile: How Much and When to Write It?”. InfoQ.
January 23, 2014. Accessed on June 26, 2018.
https://www.infoq.com/news/2014/01/documentation-agile-how-much
Lowdermilk, Travis. 2013. User-Centered Design. Sebastopol, California: O’Reilly Media Inc.
Perry, Skye. 2014. “Recommended Architecture for ArcGIS Online”. SSP Innovations. Accessed
on March 24, 2018. https://sspinnovations.com/blog/recommended-architecture-arcgis-
online/
Resch, Bernd, Bastian Zimmer. 2013. “User Experience Design in Professional Map-Based Geo-
Portals.” ISPRS International Journal of Geo-Information, 2. Doi: 10.3390/ijgi2041015.
Roth, Robert E., Arzu Coltekin, Luciene Delazari, Homero Fonseca Filho, Amy Griffin, Andreas
Hall, Jari Korpi, Ismini Lokka, Andre Mendonca, Kristien Ooms, and Corne P.J.M.
Elzakker. 2017. “User studies in cartography: opportunities for empirical research on
148
interactive maps and visualizations.” International Journal of Cartography. DOI:
10.1080/23729333.2017.1288534
Roth, Robert E., Kevin S. Ross, and Alan M. MacEachren. 2015. “User-Centered Design for
Interactive Maps: A Case Study in Crime Analysis.” ISPRS Int. J. Geo-Inf, no.4 (2015):
262-301. Accessed September 12, 2017. http://www.mdpi.com/2220-9964/4/1/262
Roth, Robert E. 2013. “Interactive maps: What we know and what we need to know.” Journal of
Spatial Information Science, no.6 (2013): 59-115. Accessed September 12, 2017.
http://www.josis.org/index.php/josis/article/view/105/82
Rubin, Kenneth, S. 2013. Essential Scrum. Boston: Pearson Addison-Wesley.
Salah, Dina, Richard F. Paige, and Paul Cairns. 2014. “A Systematic Literature Review for Agile
Development Processes and User Centred Design Integration.” “Proceedings of the 18th
International Conference on Evaluation and Assessment in Software Engineering, 2014,
1-10.
Sharma, Amit. 2017. “Challenges in Story Point Estimation.” DZone/Agile Zone. November 16,
2017. Accessed on June 26, 2018. https://dzone.com/articles/challenges-in-story-point-
estimation
Schwaber, Ken and Jeff Sutherland. 2017. The Scrum Guide. Last modified January 30, 2018.
https://www.scrum.org/resources/scrum-
guide?gclid=Cj0KCQiAzMDTBRDDARIsABX4Awx5zbXy4M9-
0WPT8phtB3LeffXI73Gey_DovGKV2Q2PesToVpNpRCQaAuzcEALw_wcB
Siang, Teo. 2018. What is Interaction Design? Interaction Design Foundation. Accessed March
14, 2018. https://www.interaction-design.org/literature/article/what-is-interaction-design
Skarlatidou, Artemis, Tao Cheng, and Muki Haklay. 2013. “Guidelines for trust interface design
for public engagement Web GIS.” International Journal of Geographical Information
Science, Vol. 27, No. 8, 2013.
Smartsheet.com. 2018. “Agile vs Scrum”. Smartsheet. Accessed April 22, 2018.
https://www.smartsheet.com/agile-vs-scrum-vs-waterfall-vs-kanban
Spagnuolo, Chris. 2008. “Agile Adoption in the GIS Industry.” Directions, March 14. Accessed
September 21, 2017. https://www.directionsmag.com/article/2538
149
Tullis, Tom, Bill Albert. 2013. Measuring the User Experience Collecting, Analyzing, and
Presenting Usability Metrics. 2nd ed. Interactive Technologies. Burlington: Elsevier
Science.
Tutorialspoint 2018. “Learn UML.” Tutorialspoint. Accessed June 26, 2018.
https://www.tutorialspoint.com/uml/index.htm
Wells, Don. 2009. “Extreme Programming: A gentle introduction.” Extreme Programming.
Accessd May 24, 2018. http://www.extremeprogramming.org/
Xiao, Ningchuan, Marc P. Armstrong. 2012. “Towards a Multiobjective View of Cartographic
Design.” Cartography and Geographic Information Science, Vol. 39, No. 2, 2102.
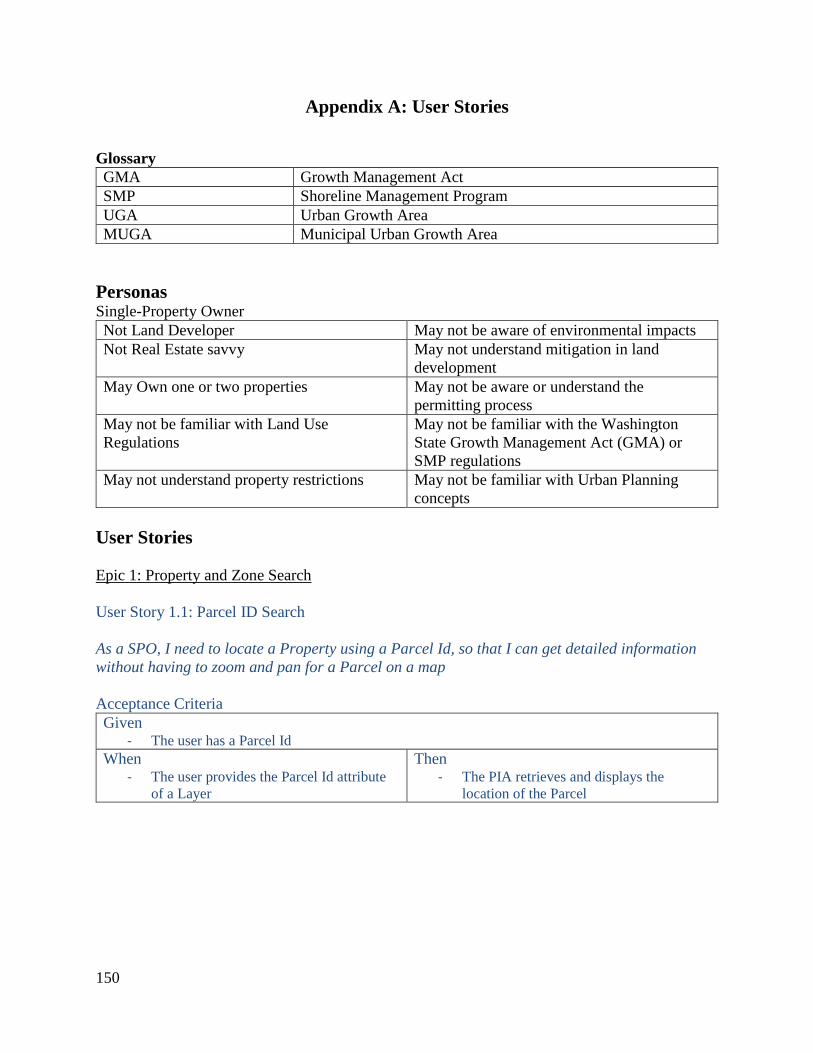
150
Appendix A: User Stories
Glossary GMA Growth Management Act SMP Shoreline Management Program UGA Urban Growth Area MUGA Municipal Urban Growth Area
Personas Single-Property Owner Not Land Developer May not be aware of environmental impacts Not Real Estate savvy May not understand mitigation in land
development May Own one or two properties May not be aware or understand the
permitting process May not be familiar with Land Use Regulations
May not be familiar with the Washington State Growth Management Act (GMA) or SMP regulations
May not understand property restrictions May not be familiar with Urban Planning concepts
User Stories Epic 1: Property and Zone Search User Story 1.1: Parcel ID Search As a SPO, I need to locate a Property using a Parcel Id, so that I can get detailed information without having to zoom and pan for a Parcel on a map Acceptance Criteria Given
- The user has a Parcel Id When
- The user provides the Parcel Id attribute of a Layer
Then - The PIA retrieves and displays the
location of the Parcel
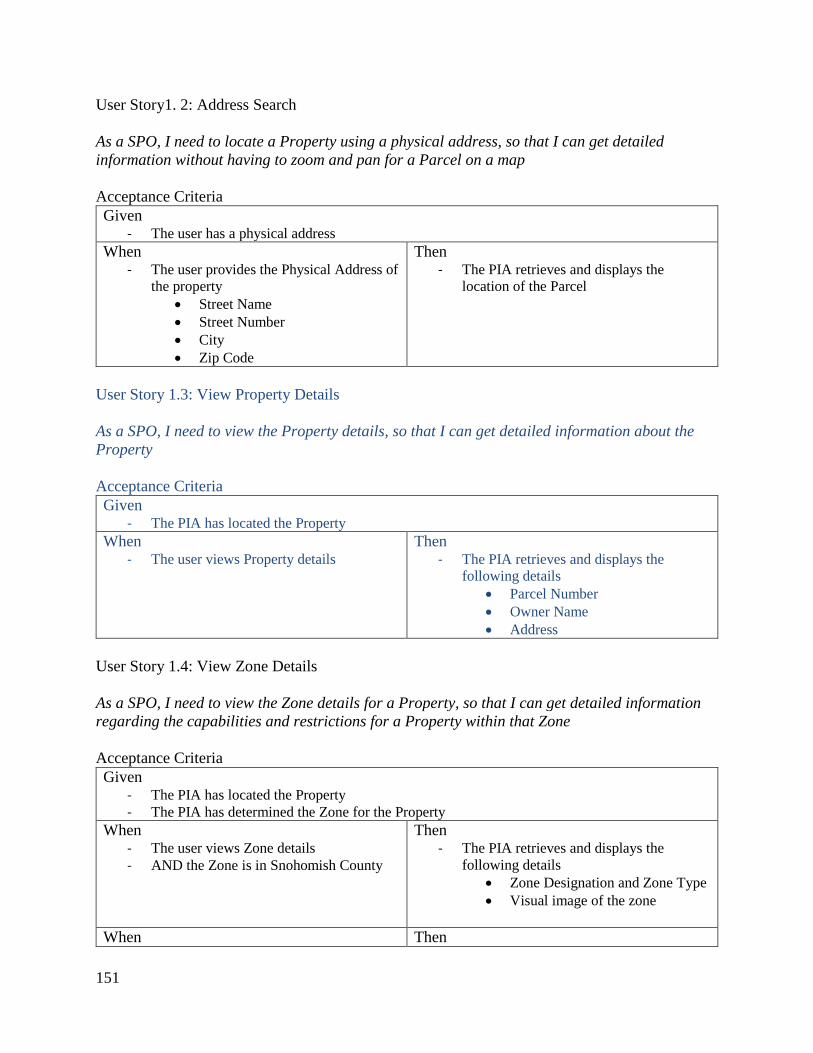
151
User Story1. 2: Address Search As a SPO, I need to locate a Property using a physical address, so that I can get detailed information without having to zoom and pan for a Parcel on a map Acceptance Criteria Given
- The user has a physical address When
- The user provides the Physical Address of the property
• Street Name • Street Number • City • Zip Code
Then - The PIA retrieves and displays the
location of the Parcel
User Story 1.3: View Property Details As a SPO, I need to view the Property details, so that I can get detailed information about the Property Acceptance Criteria Given
- The PIA has located the Property When
- The user views Property details Then
- The PIA retrieves and displays the following details
• Parcel Number • Owner Name • Address
User Story 1.4: View Zone Details As a SPO, I need to view the Zone details for a Property, so that I can get detailed information regarding the capabilities and restrictions for a Property within that Zone Acceptance Criteria Given
- The PIA has located the Property - The PIA has determined the Zone for the Property
When - The user views Zone details - AND the Zone is in Snohomish County
Then - The PIA retrieves and displays the
following details • Zone Designation and Zone Type • Visual image of the zone
When Then

152
- The user views Zone details - AND the Zone is NOT in Snohomish
County Jurisdiction
- The PIA retrieves and displays the following details
• Zone Designation as City / Native American Land
• Zone Type as Other Jurisdiction • Visual image of the City
- The PIA UI provides a link to the City and Tribal Jurisdiction Map
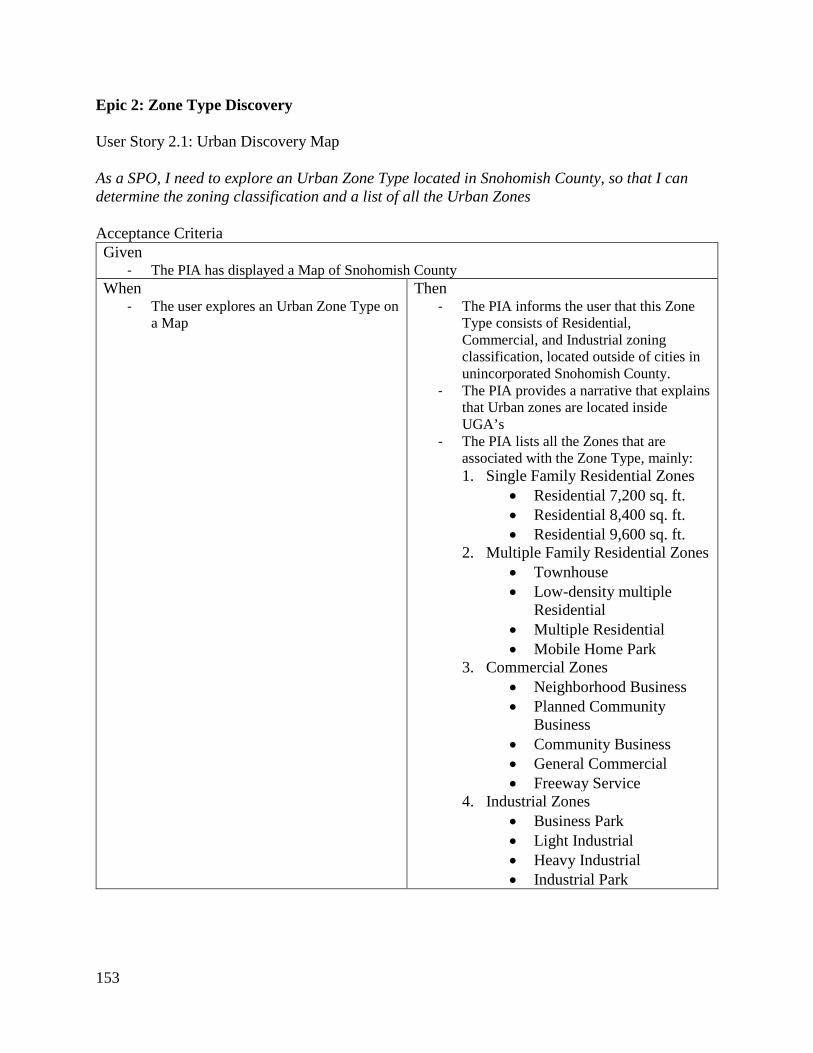
153
Epic 2: Zone Type Discovery User Story 2.1: Urban Discovery Map As a SPO, I need to explore an Urban Zone Type located in Snohomish County, so that I can determine the zoning classification and a list of all the Urban Zones Acceptance Criteria Given
- The PIA has displayed a Map of Snohomish County When
- The user explores an Urban Zone Type on a Map
Then - The PIA informs the user that this Zone
Type consists of Residential, Commercial, and Industrial zoning classification, located outside of cities in unincorporated Snohomish County.
- The PIA provides a narrative that explains that Urban zones are located inside UGA’s
- The PIA lists all the Zones that are associated with the Zone Type, mainly: 1. Single Family Residential Zones
• Residential 7,200 sq. ft. • Residential 8,400 sq. ft. • Residential 9,600 sq. ft.
2. Multiple Family Residential Zones • Townhouse • Low-density multiple
Residential • Multiple Residential • Mobile Home Park
3. Commercial Zones • Neighborhood Business • Planned Community
Business • Community Business • General Commercial • Freeway Service
4. Industrial Zones • Business Park • Light Industrial • Heavy Industrial • Industrial Park
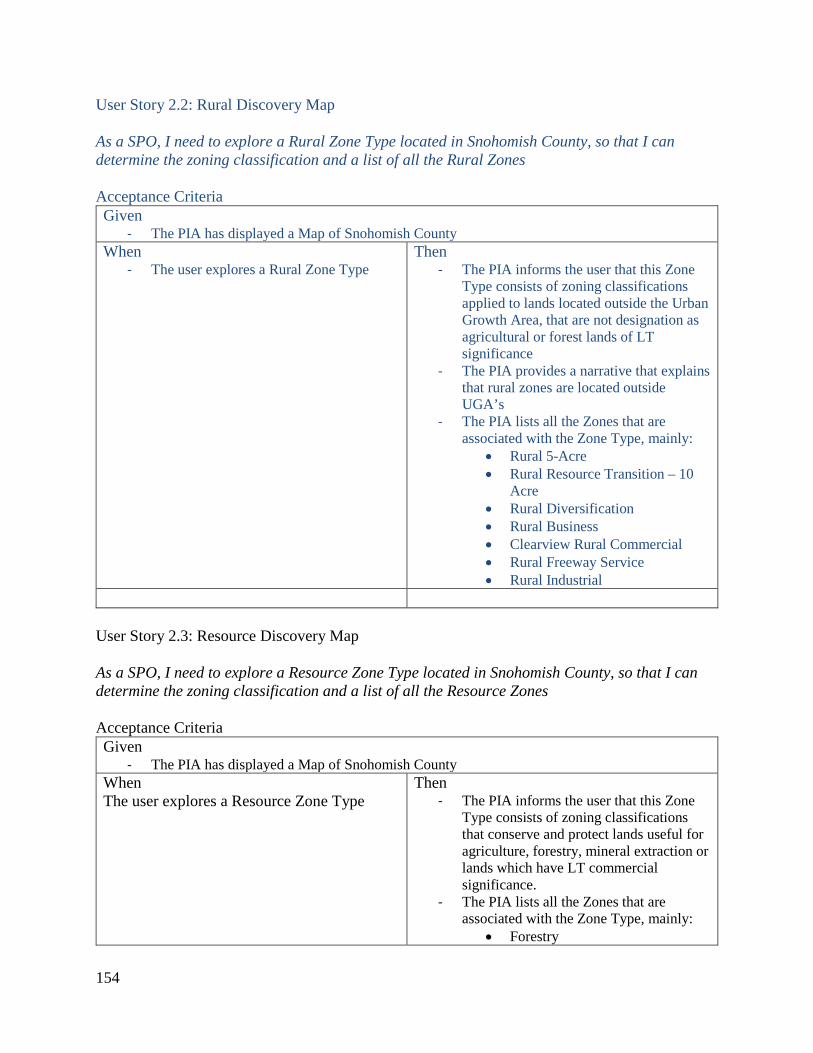
154
User Story 2.2: Rural Discovery Map As a SPO, I need to explore a Rural Zone Type located in Snohomish County, so that I can determine the zoning classification and a list of all the Rural Zones Acceptance Criteria Given
- The PIA has displayed a Map of Snohomish County When
- The user explores a Rural Zone Type Then
- The PIA informs the user that this Zone Type consists of zoning classifications applied to lands located outside the Urban Growth Area, that are not designation as agricultural or forest lands of LT significance
- The PIA provides a narrative that explains that rural zones are located outside UGA’s
- The PIA lists all the Zones that are associated with the Zone Type, mainly:
• Rural 5-Acre • Rural Resource Transition – 10
Acre • Rural Diversification • Rural Business • Clearview Rural Commercial • Rural Freeway Service • Rural Industrial
User Story 2.3: Resource Discovery Map As a SPO, I need to explore a Resource Zone Type located in Snohomish County, so that I can determine the zoning classification and a list of all the Resource Zones Acceptance Criteria Given
- The PIA has displayed a Map of Snohomish County When The user explores a Resource Zone Type
Then - The PIA informs the user that this Zone
Type consists of zoning classifications that conserve and protect lands useful for agriculture, forestry, mineral extraction or lands which have LT commercial significance.
- The PIA lists all the Zones that are associated with the Zone Type, mainly:
• Forestry
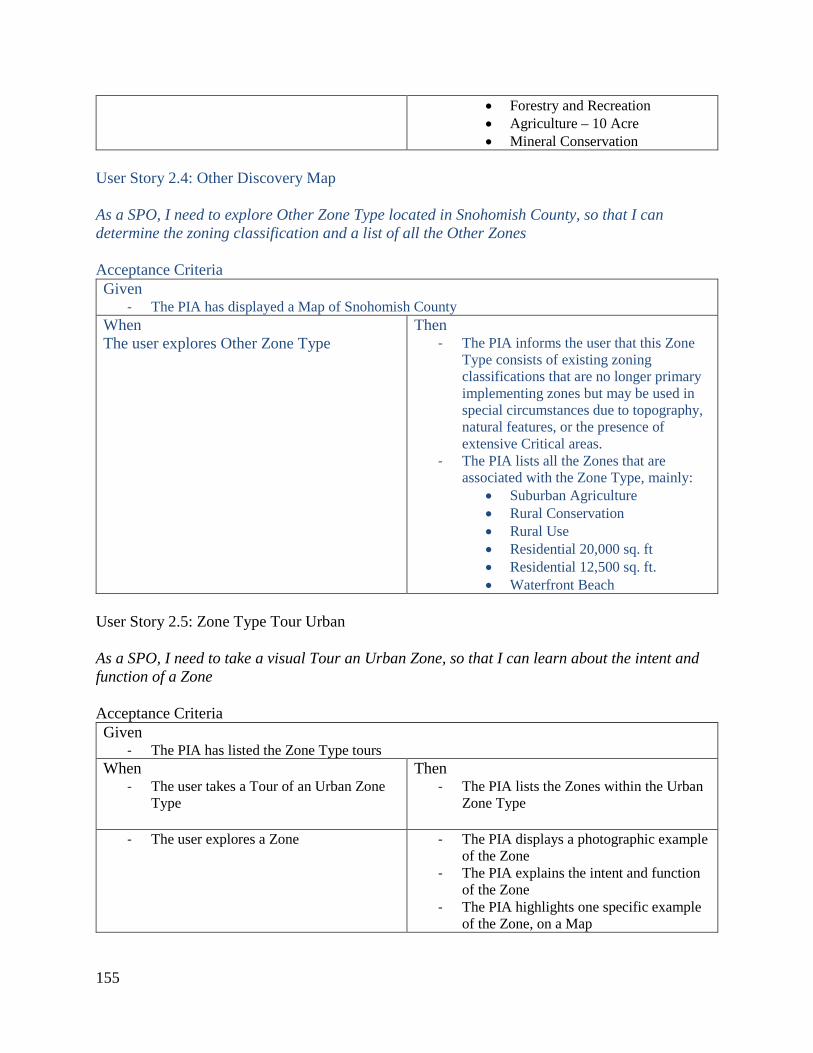
155
• Forestry and Recreation • Agriculture – 10 Acre • Mineral Conservation
User Story 2.4: Other Discovery Map As a SPO, I need to explore Other Zone Type located in Snohomish County, so that I can determine the zoning classification and a list of all the Other Zones Acceptance Criteria Given
- The PIA has displayed a Map of Snohomish County When The user explores Other Zone Type
Then - The PIA informs the user that this Zone
Type consists of existing zoning classifications that are no longer primary implementing zones but may be used in special circumstances due to topography, natural features, or the presence of extensive Critical areas.
- The PIA lists all the Zones that are associated with the Zone Type, mainly:
• Suburban Agriculture • Rural Conservation • Rural Use • Residential 20,000 sq. ft • Residential 12,500 sq. ft. • Waterfront Beach
User Story 2.5: Zone Type Tour Urban As a SPO, I need to take a visual Tour an Urban Zone, so that I can learn about the intent and function of a Zone Acceptance Criteria Given
- The PIA has listed the Zone Type tours When
- The user takes a Tour of an Urban Zone Type
Then - The PIA lists the Zones within the Urban
Zone Type
- The user explores a Zone - The PIA displays a photographic example of the Zone
- The PIA explains the intent and function of the Zone
- The PIA highlights one specific example of the Zone, on a Map
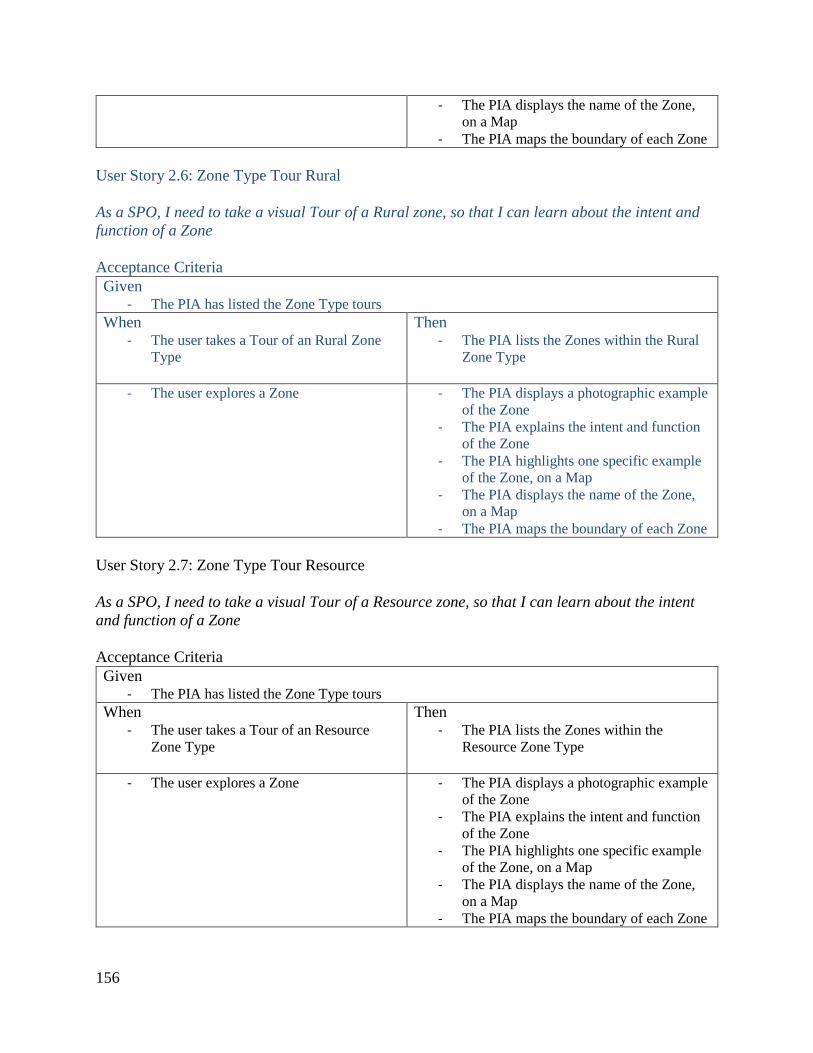
156
- The PIA displays the name of the Zone, on a Map
- The PIA maps the boundary of each Zone User Story 2.6: Zone Type Tour Rural As a SPO, I need to take a visual Tour of a Rural zone, so that I can learn about the intent and function of a Zone Acceptance Criteria Given
- The PIA has listed the Zone Type tours When
- The user takes a Tour of an Rural Zone Type
Then - The PIA lists the Zones within the Rural
Zone Type
- The user explores a Zone - The PIA displays a photographic example of the Zone
- The PIA explains the intent and function of the Zone
- The PIA highlights one specific example of the Zone, on a Map
- The PIA displays the name of the Zone, on a Map
- The PIA maps the boundary of each Zone User Story 2.7: Zone Type Tour Resource As a SPO, I need to take a visual Tour of a Resource zone, so that I can learn about the intent and function of a Zone Acceptance Criteria Given
- The PIA has listed the Zone Type tours When
- The user takes a Tour of an Resource Zone Type
Then - The PIA lists the Zones within the
Resource Zone Type
- The user explores a Zone - The PIA displays a photographic example of the Zone
- The PIA explains the intent and function of the Zone
- The PIA highlights one specific example of the Zone, on a Map
- The PIA displays the name of the Zone, on a Map
- The PIA maps the boundary of each Zone
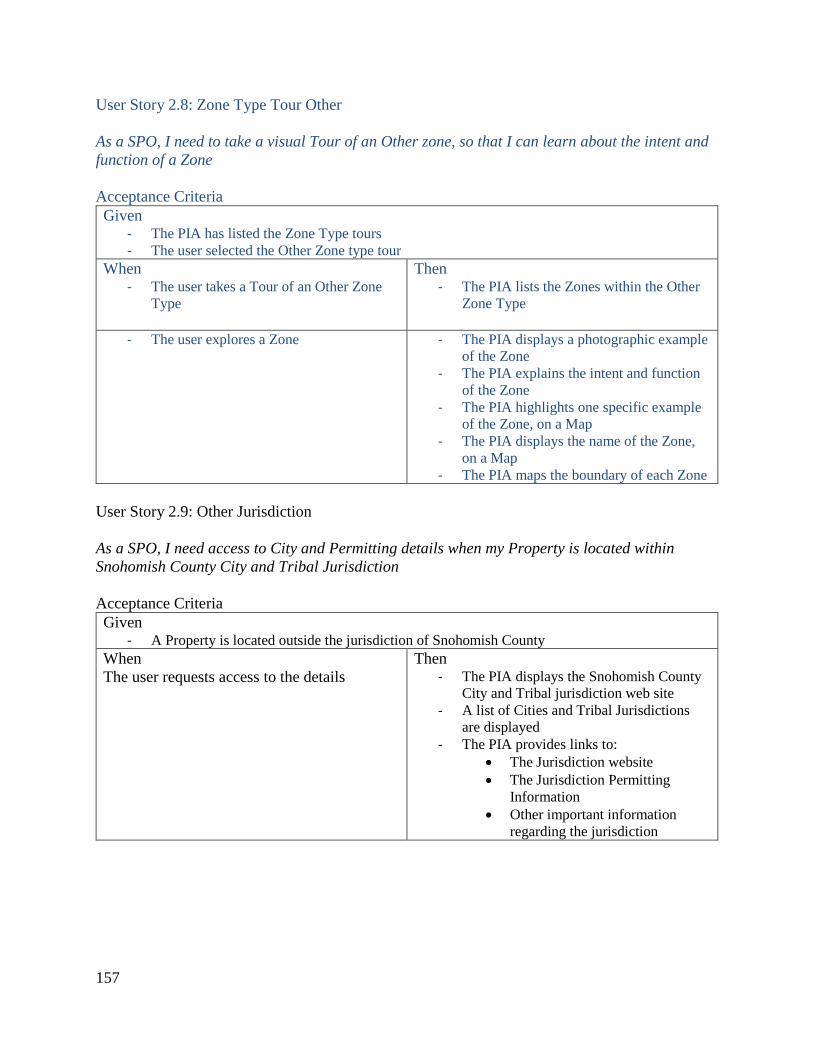
157
User Story 2.8: Zone Type Tour Other As a SPO, I need to take a visual Tour of an Other zone, so that I can learn about the intent and function of a Zone Acceptance Criteria Given
- The PIA has listed the Zone Type tours - The user selected the Other Zone type tour
When - The user takes a Tour of an Other Zone
Type
Then - The PIA lists the Zones within the Other
Zone Type
- The user explores a Zone - The PIA displays a photographic example of the Zone
- The PIA explains the intent and function of the Zone
- The PIA highlights one specific example of the Zone, on a Map
- The PIA displays the name of the Zone, on a Map
- The PIA maps the boundary of each Zone User Story 2.9: Other Jurisdiction As a SPO, I need access to City and Permitting details when my Property is located within Snohomish County City and Tribal Jurisdiction Acceptance Criteria Given
- A Property is located outside the jurisdiction of Snohomish County When The user requests access to the details
Then - The PIA displays the Snohomish County
City and Tribal jurisdiction web site - A list of Cities and Tribal Jurisdictions
are displayed - The PIA provides links to:
• The Jurisdiction website • The Jurisdiction Permitting
Information • Other important information
regarding the jurisdiction
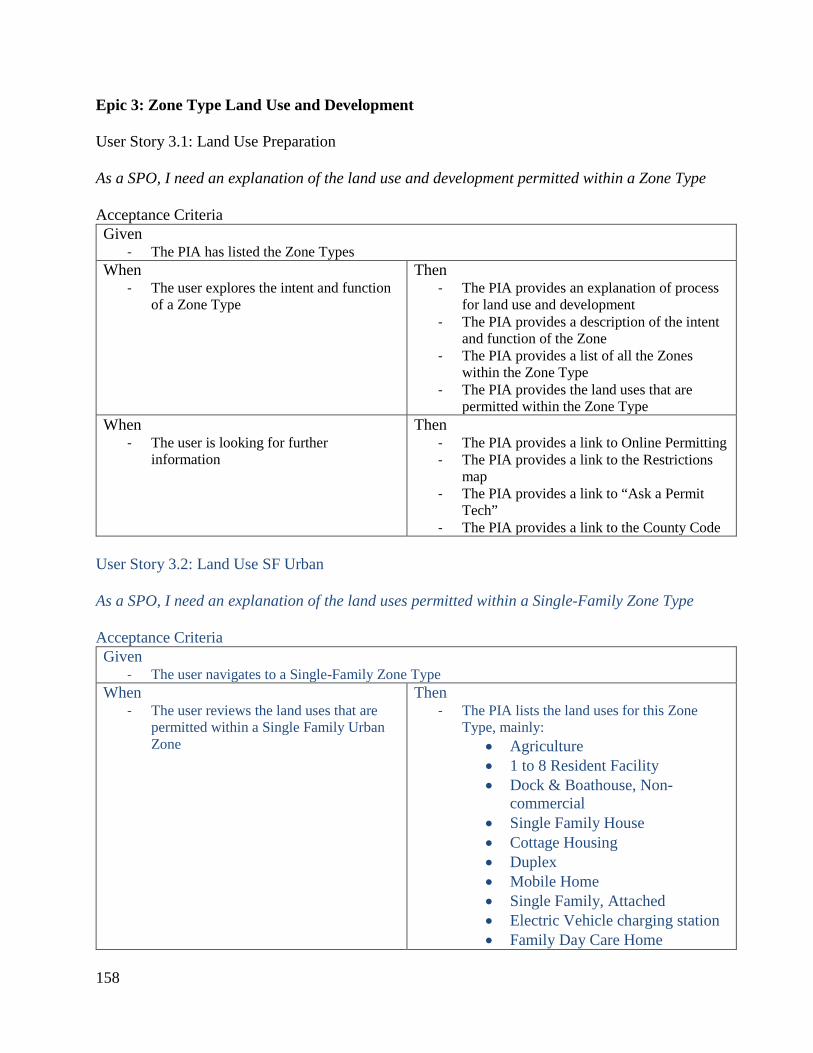
158
Epic 3: Zone Type Land Use and Development User Story 3.1: Land Use Preparation As a SPO, I need an explanation of the land use and development permitted within a Zone Type Acceptance Criteria Given
- The PIA has listed the Zone Types When
- The user explores the intent and function of a Zone Type
Then - The PIA provides an explanation of process
for land use and development - The PIA provides a description of the intent
and function of the Zone - The PIA provides a list of all the Zones
within the Zone Type - The PIA provides the land uses that are
permitted within the Zone Type When
- The user is looking for further information
Then - The PIA provides a link to Online Permitting - The PIA provides a link to the Restrictions
map - The PIA provides a link to “Ask a Permit
Tech” - The PIA provides a link to the County Code
User Story 3.2: Land Use SF Urban As a SPO, I need an explanation of the land uses permitted within a Single-Family Zone Type Acceptance Criteria Given
- The user navigates to a Single-Family Zone Type When
- The user reviews the land uses that are permitted within a Single Family Urban Zone
Then - The PIA lists the land uses for this Zone
Type, mainly: • Agriculture • 1 to 8 Resident Facility • Dock & Boathouse, Non-
commercial • Single Family House • Cottage Housing • Duplex • Mobile Home • Single Family, Attached • Electric Vehicle charging station • Family Day Care Home
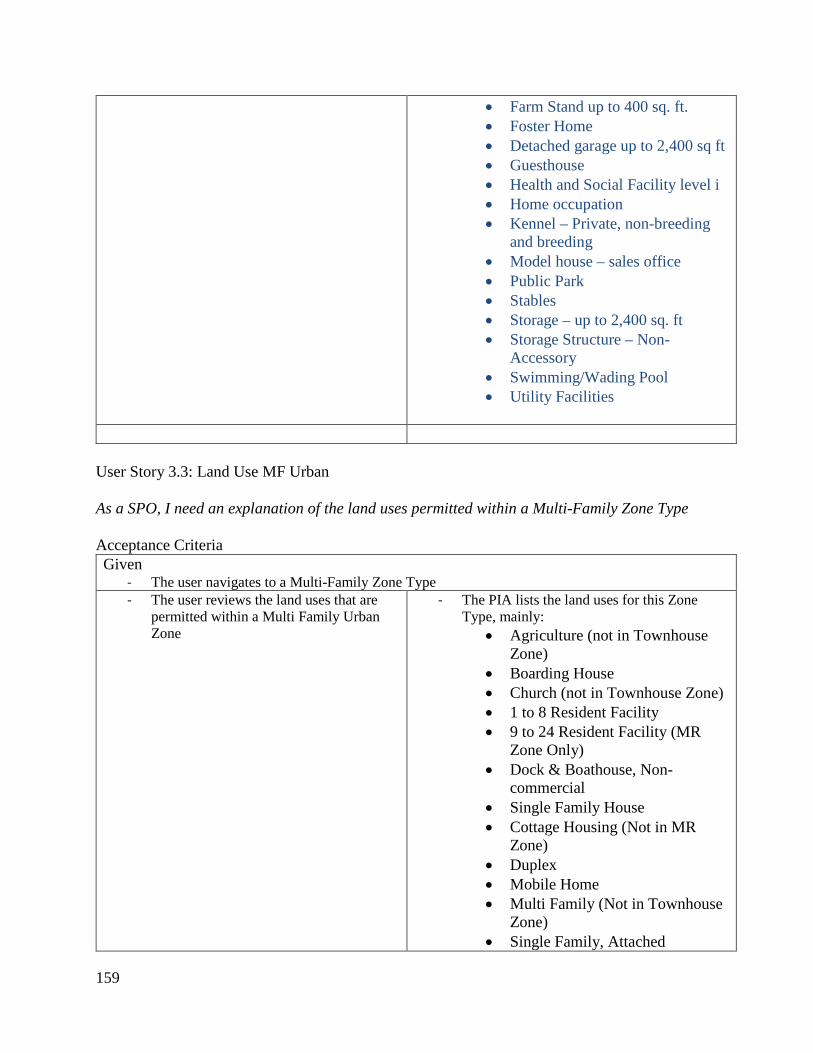
159
• Farm Stand up to 400 sq. ft. • Foster Home • Detached garage up to 2,400 sq ft • Guesthouse • Health and Social Facility level i • Home occupation • Kennel – Private, non-breeding
and breeding • Model house – sales office • Public Park • Stables • Storage – up to 2,400 sq. ft • Storage Structure – Non-
Accessory • Swimming/Wading Pool • Utility Facilities
User Story 3.3: Land Use MF Urban As a SPO, I need an explanation of the land uses permitted within a Multi-Family Zone Type Acceptance Criteria Given
- The user navigates to a Multi-Family Zone Type - The user reviews the land uses that are
permitted within a Multi Family Urban Zone
- The PIA lists the land uses for this Zone Type, mainly:
• Agriculture (not in Townhouse Zone)
• Boarding House • Church (not in Townhouse Zone) • 1 to 8 Resident Facility • 9 to 24 Resident Facility (MR
Zone Only) • Dock & Boathouse, Non-
commercial • Single Family House • Cottage Housing (Not in MR
Zone) • Duplex • Mobile Home • Multi Family (Not in Townhouse
Zone) • Single Family, Attached
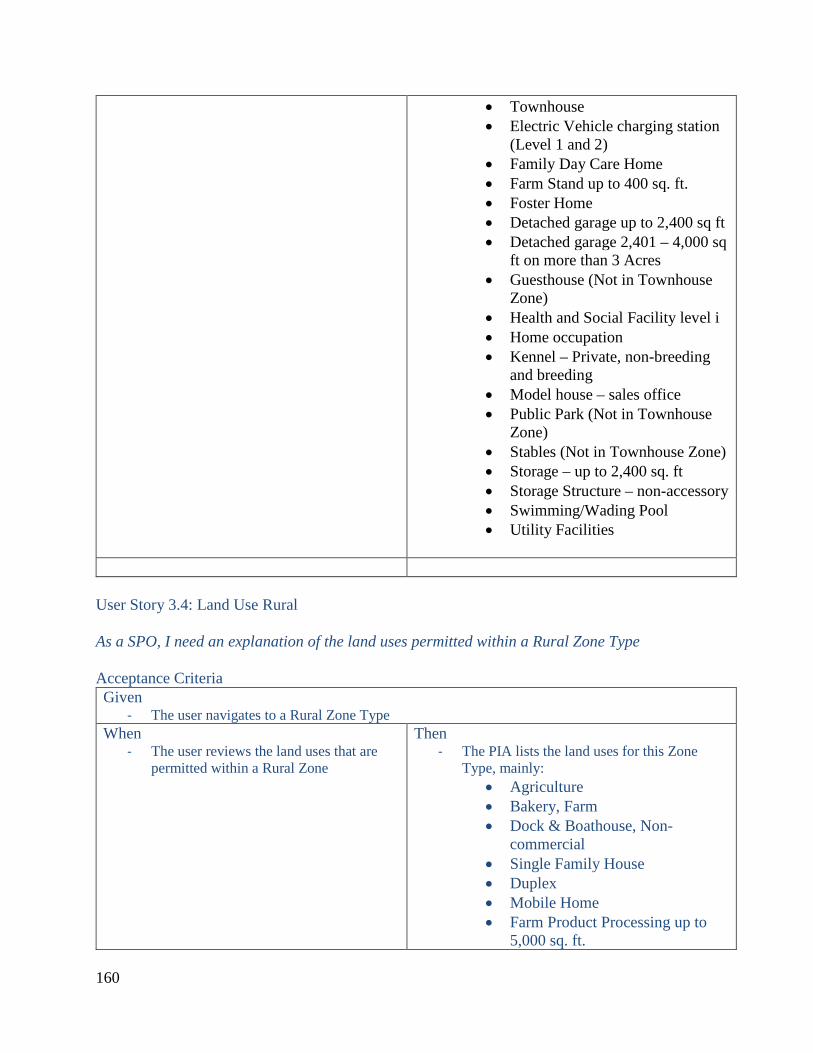
160
• Townhouse • Electric Vehicle charging station
(Level 1 and 2) • Family Day Care Home • Farm Stand up to 400 sq. ft. • Foster Home • Detached garage up to 2,400 sq ft • Detached garage 2,401 – 4,000 sq
ft on more than 3 Acres • Guesthouse (Not in Townhouse
Zone) • Health and Social Facility level i • Home occupation • Kennel – Private, non-breeding
and breeding • Model house – sales office • Public Park (Not in Townhouse
Zone) • Stables (Not in Townhouse Zone) • Storage – up to 2,400 sq. ft • Storage Structure – non-accessory • Swimming/Wading Pool • Utility Facilities
User Story 3.4: Land Use Rural As a SPO, I need an explanation of the land uses permitted within a Rural Zone Type Acceptance Criteria Given
- The user navigates to a Rural Zone Type When
- The user reviews the land uses that are permitted within a Rural Zone
Then - The PIA lists the land uses for this Zone
Type, mainly: • Agriculture • Bakery, Farm • Dock & Boathouse, Non-
commercial • Single Family House • Duplex • Mobile Home • Farm Product Processing up to
5,000 sq. ft.
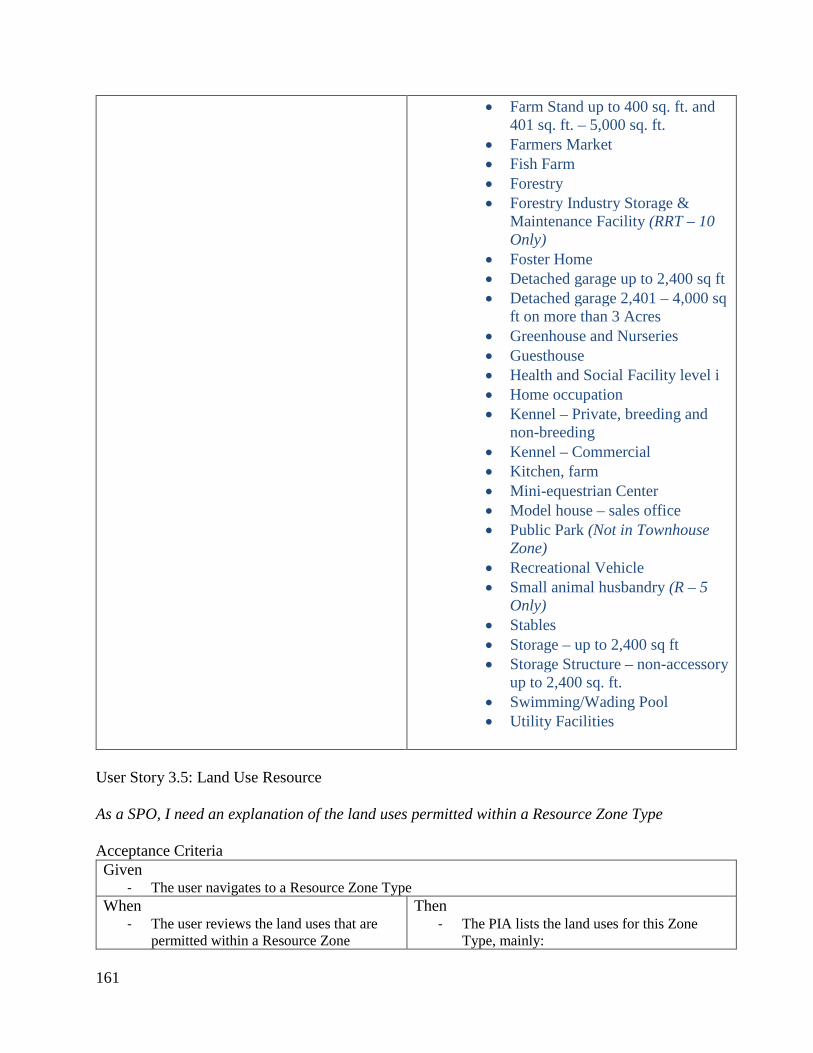
161
• Farm Stand up to 400 sq. ft. and 401 sq. ft. – 5,000 sq. ft.
• Farmers Market • Fish Farm • Forestry • Forestry Industry Storage &
Maintenance Facility (RRT – 10 Only)
• Foster Home • Detached garage up to 2,400 sq ft • Detached garage 2,401 – 4,000 sq
ft on more than 3 Acres • Greenhouse and Nurseries • Guesthouse • Health and Social Facility level i • Home occupation • Kennel – Private, breeding and
non-breeding • Kennel – Commercial • Kitchen, farm • Mini-equestrian Center • Model house – sales office • Public Park (Not in Townhouse
Zone) • Recreational Vehicle • Small animal husbandry (R – 5
Only) • Stables • Storage – up to 2,400 sq ft • Storage Structure – non-accessory
up to 2,400 sq. ft. • Swimming/Wading Pool • Utility Facilities
User Story 3.5: Land Use Resource As a SPO, I need an explanation of the land uses permitted within a Resource Zone Type Acceptance Criteria Given
- The user navigates to a Resource Zone Type When
- The user reviews the land uses that are permitted within a Resource Zone
Then - The PIA lists the land uses for this Zone
Type, mainly:
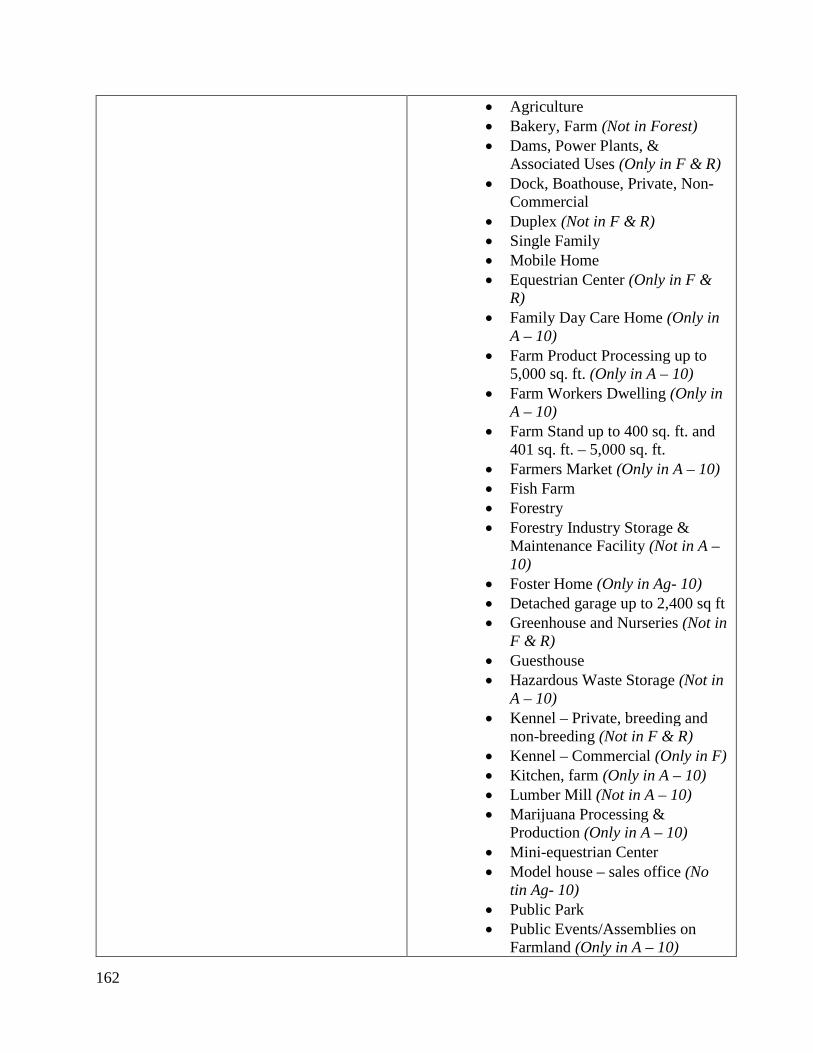
162
• Agriculture • Bakery, Farm (Not in Forest) • Dams, Power Plants, &
Associated Uses (Only in F & R) • Dock, Boathouse, Private, Non-
Commercial • Duplex (Not in F & R) • Single Family • Mobile Home • Equestrian Center (Only in F &
R) • Family Day Care Home (Only in
A – 10) • Farm Product Processing up to
5,000 sq. ft. (Only in A – 10) • Farm Workers Dwelling (Only in
A – 10) • Farm Stand up to 400 sq. ft. and
401 sq. ft. – 5,000 sq. ft. • Farmers Market (Only in A – 10) • Fish Farm • Forestry • Forestry Industry Storage &
Maintenance Facility (Not in A – 10)
• Foster Home (Only in Ag- 10) • Detached garage up to 2,400 sq ft • Greenhouse and Nurseries (Not in
F & R) • Guesthouse • Hazardous Waste Storage (Not in
A – 10) • Kennel – Private, breeding and
non-breeding (Not in F & R) • Kennel – Commercial (Only in F) • Kitchen, farm (Only in A – 10) • Lumber Mill (Not in A – 10) • Marijuana Processing &
Production (Only in A – 10) • Mini-equestrian Center • Model house – sales office (No
tin Ag- 10) • Public Park • Public Events/Assemblies on
Farmland (Only in A – 10)
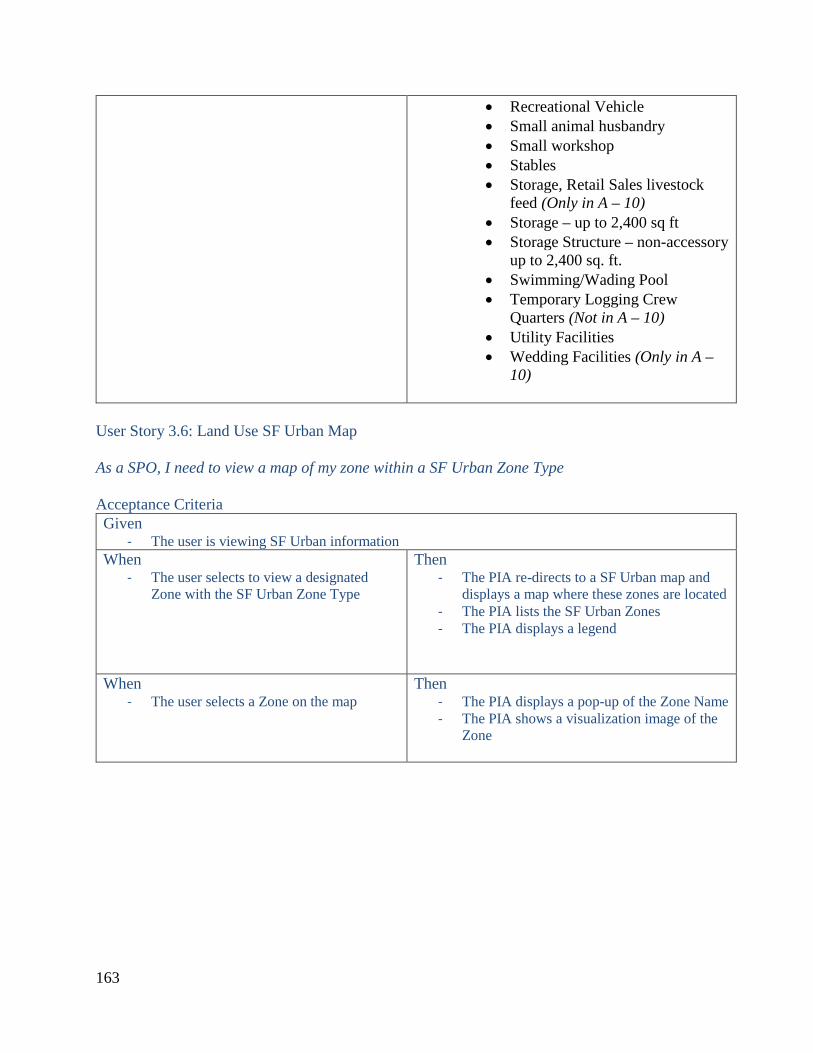
163
• Recreational Vehicle • Small animal husbandry • Small workshop • Stables • Storage, Retail Sales livestock
feed (Only in A – 10) • Storage – up to 2,400 sq ft • Storage Structure – non-accessory
up to 2,400 sq. ft. • Swimming/Wading Pool • Temporary Logging Crew
Quarters (Not in A – 10) • Utility Facilities • Wedding Facilities (Only in A –
10)
User Story 3.6: Land Use SF Urban Map As a SPO, I need to view a map of my zone within a SF Urban Zone Type Acceptance Criteria Given
- The user is viewing SF Urban information When
- The user selects to view a designated Zone with the SF Urban Zone Type
Then - The PIA re-directs to a SF Urban map and
displays a map where these zones are located - The PIA lists the SF Urban Zones - The PIA displays a legend
When
- The user selects a Zone on the map Then
- The PIA displays a pop-up of the Zone Name - The PIA shows a visualization image of the
Zone
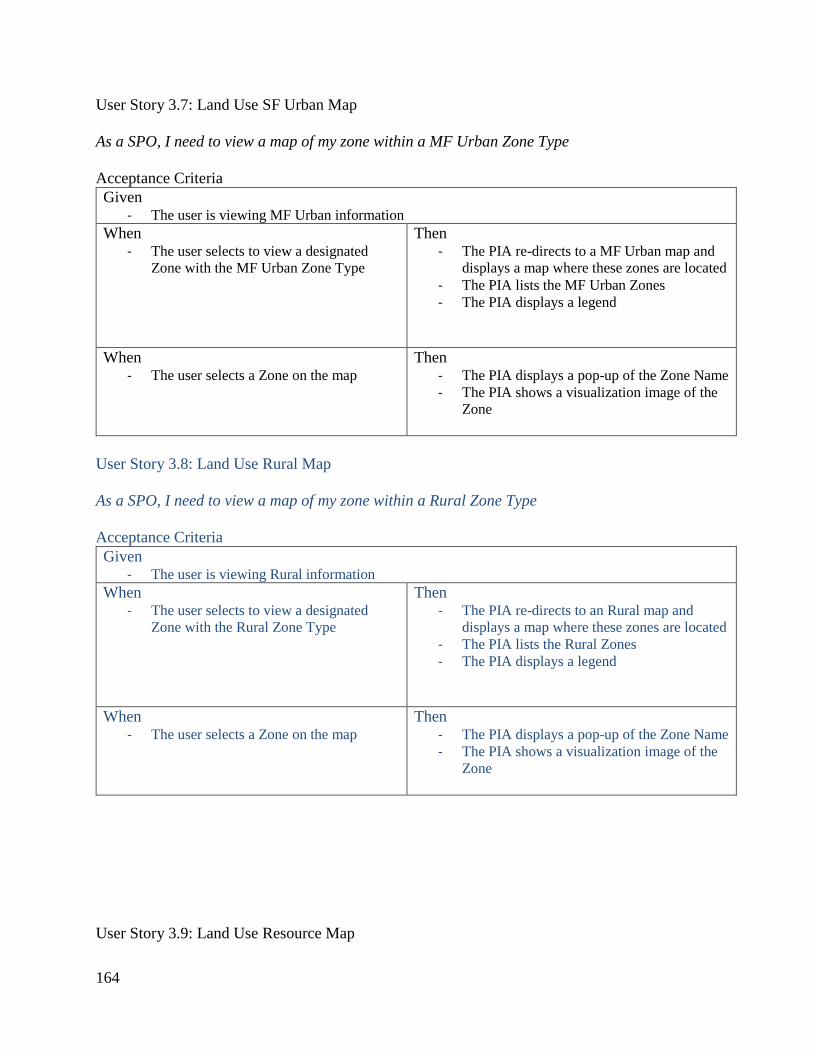
164
User Story 3.7: Land Use SF Urban Map As a SPO, I need to view a map of my zone within a MF Urban Zone Type Acceptance Criteria Given
- The user is viewing MF Urban information When
- The user selects to view a designated Zone with the MF Urban Zone Type
Then - The PIA re-directs to a MF Urban map and
displays a map where these zones are located - The PIA lists the MF Urban Zones - The PIA displays a legend
When
- The user selects a Zone on the map Then
- The PIA displays a pop-up of the Zone Name - The PIA shows a visualization image of the
Zone
User Story 3.8: Land Use Rural Map As a SPO, I need to view a map of my zone within a Rural Zone Type Acceptance Criteria Given
- The user is viewing Rural information When
- The user selects to view a designated Zone with the Rural Zone Type
Then - The PIA re-directs to an Rural map and
displays a map where these zones are located - The PIA lists the Rural Zones - The PIA displays a legend
When
- The user selects a Zone on the map Then
- The PIA displays a pop-up of the Zone Name - The PIA shows a visualization image of the
Zone
User Story 3.9: Land Use Resource Map
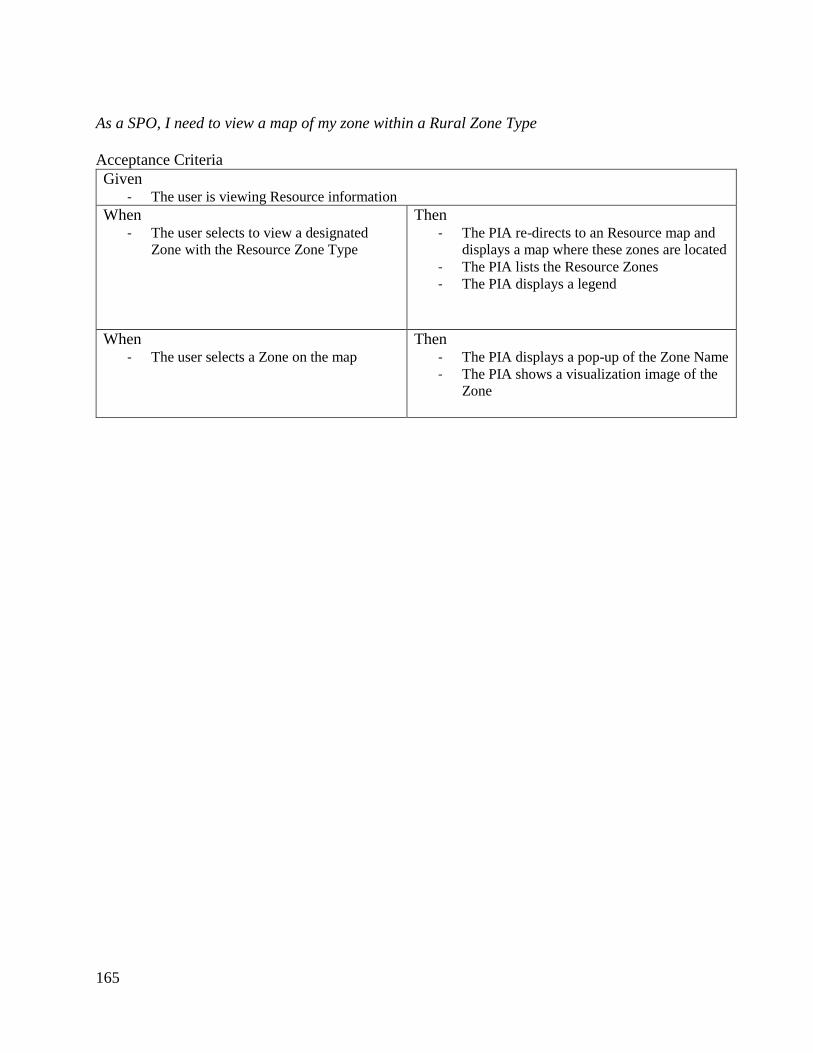
165
As a SPO, I need to view a map of my zone within a Rural Zone Type Acceptance Criteria Given
- The user is viewing Resource information When
- The user selects to view a designated Zone with the Resource Zone Type
Then - The PIA re-directs to an Resource map and
displays a map where these zones are located - The PIA lists the Resource Zones - The PIA displays a legend
When
- The user selects a Zone on the map Then
- The PIA displays a pop-up of the Zone Name - The PIA shows a visualization image of the
Zone
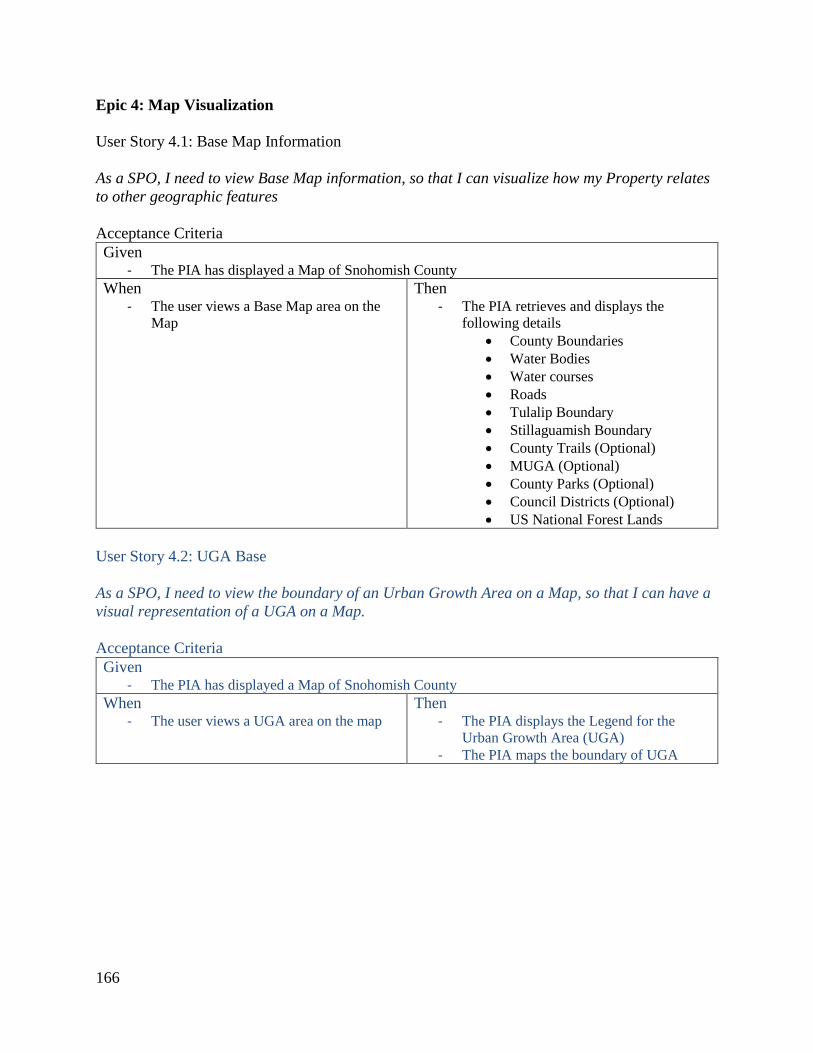
166
Epic 4: Map Visualization User Story 4.1: Base Map Information As a SPO, I need to view Base Map information, so that I can visualize how my Property relates to other geographic features Acceptance Criteria Given
- The PIA has displayed a Map of Snohomish County When
- The user views a Base Map area on the Map
Then - The PIA retrieves and displays the
following details • County Boundaries • Water Bodies • Water courses • Roads • Tulalip Boundary • Stillaguamish Boundary • County Trails (Optional) • MUGA (Optional) • County Parks (Optional) • Council Districts (Optional) • US National Forest Lands
User Story 4.2: UGA Base As a SPO, I need to view the boundary of an Urban Growth Area on a Map, so that I can have a visual representation of a UGA on a Map. Acceptance Criteria Given
- The PIA has displayed a Map of Snohomish County When
- The user views a UGA area on the map Then
- The PIA displays the Legend for the Urban Growth Area (UGA)
- The PIA maps the boundary of UGA
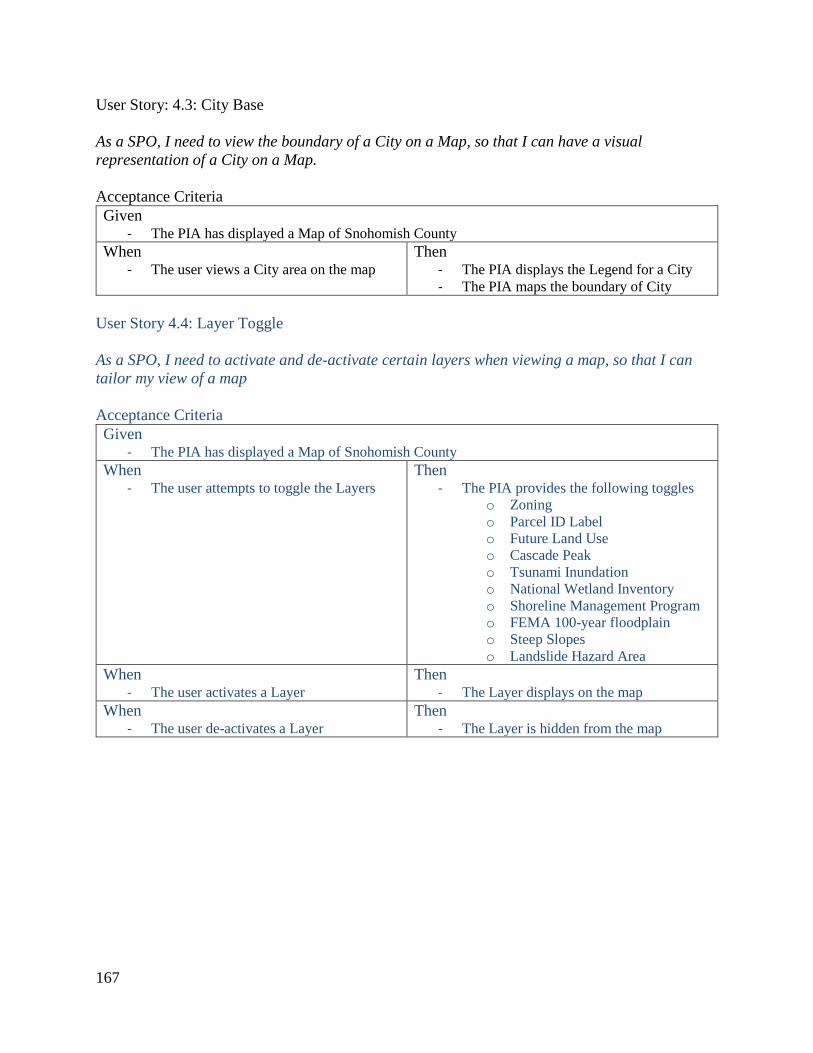
167
User Story: 4.3: City Base As a SPO, I need to view the boundary of a City on a Map, so that I can have a visual representation of a City on a Map. Acceptance Criteria Given
- The PIA has displayed a Map of Snohomish County When
- The user views a City area on the map Then
- The PIA displays the Legend for a City - The PIA maps the boundary of City
User Story 4.4: Layer Toggle As a SPO, I need to activate and de-activate certain layers when viewing a map, so that I can tailor my view of a map Acceptance Criteria Given
- The PIA has displayed a Map of Snohomish County When
- The user attempts to toggle the Layers
Then - The PIA provides the following toggles
o Zoning o Parcel ID Label o Future Land Use o Cascade Peak o Tsunami Inundation o National Wetland Inventory o Shoreline Management Program o FEMA 100-year floodplain o Steep Slopes o Landslide Hazard Area
When - The user activates a Layer
Then - The Layer displays on the map
When - The user de-activates a Layer
Then - The Layer is hidden from the map
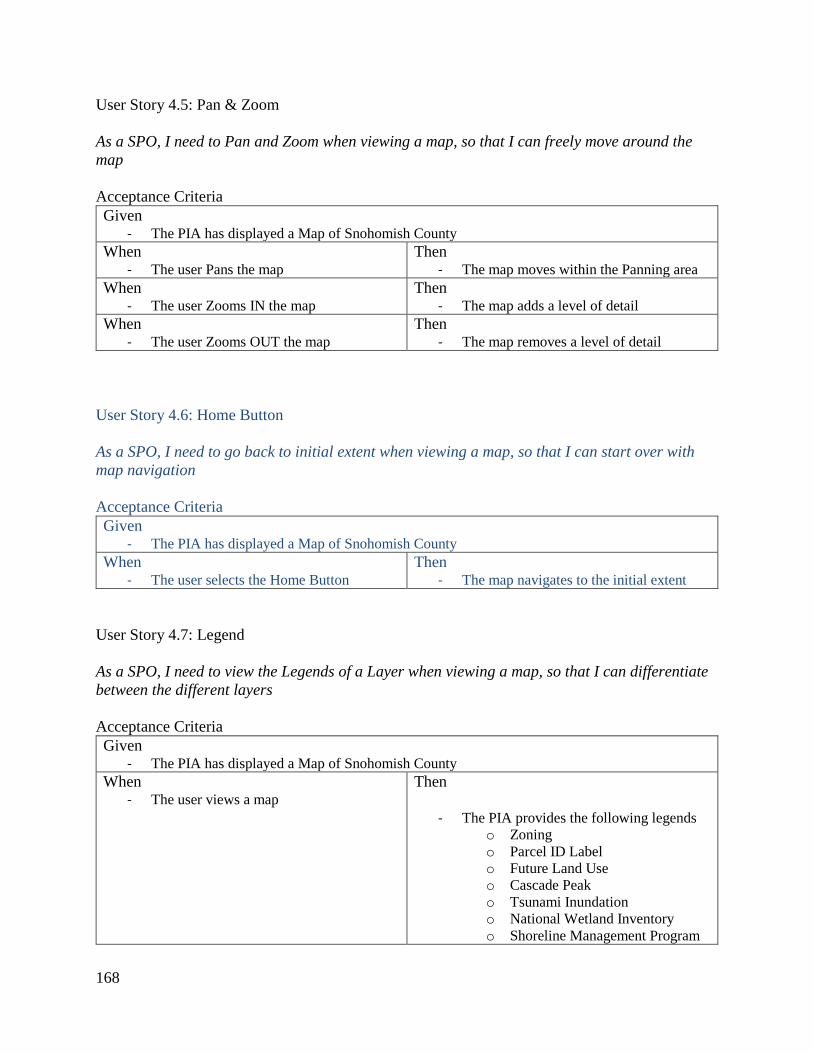
168
User Story 4.5: Pan & Zoom As a SPO, I need to Pan and Zoom when viewing a map, so that I can freely move around the map Acceptance Criteria Given
- The PIA has displayed a Map of Snohomish County When
- The user Pans the map Then
- The map moves within the Panning area When
- The user Zooms IN the map Then
- The map adds a level of detail When
- The user Zooms OUT the map Then
- The map removes a level of detail User Story 4.6: Home Button As a SPO, I need to go back to initial extent when viewing a map, so that I can start over with map navigation Acceptance Criteria Given
- The PIA has displayed a Map of Snohomish County When
- The user selects the Home Button Then
- The map navigates to the initial extent User Story 4.7: Legend As a SPO, I need to view the Legends of a Layer when viewing a map, so that I can differentiate between the different layers Acceptance Criteria Given
- The PIA has displayed a Map of Snohomish County When
- The user views a map
Then
- The PIA provides the following legends o Zoning o Parcel ID Label o Future Land Use o Cascade Peak o Tsunami Inundation o National Wetland Inventory o Shoreline Management Program

169
o FEMA 100-year floodplain o Steep Slopes o Landslide Hazard Area
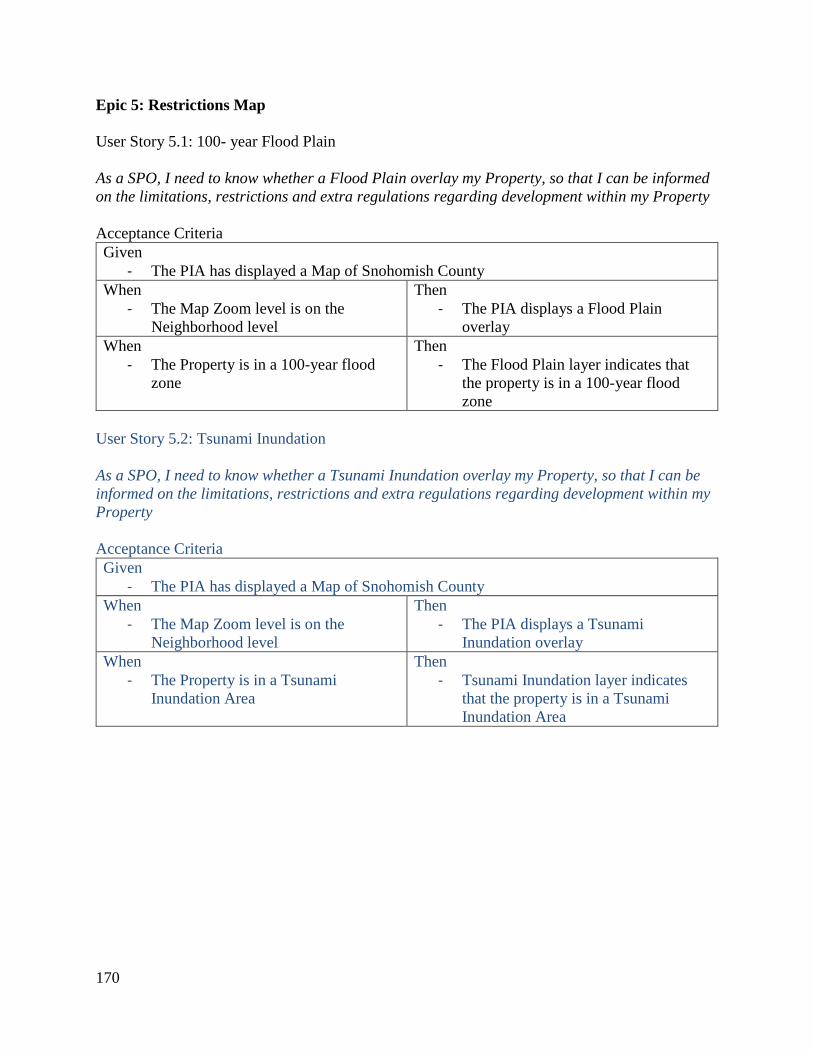
170
Epic 5: Restrictions Map User Story 5.1: 100- year Flood Plain As a SPO, I need to know whether a Flood Plain overlay my Property, so that I can be informed on the limitations, restrictions and extra regulations regarding development within my Property Acceptance Criteria Given
- The PIA has displayed a Map of Snohomish County When
- The Map Zoom level is on the Neighborhood level
Then - The PIA displays a Flood Plain
overlay When
- The Property is in a 100-year flood zone
Then - The Flood Plain layer indicates that
the property is in a 100-year flood zone
User Story 5.2: Tsunami Inundation As a SPO, I need to know whether a Tsunami Inundation overlay my Property, so that I can be informed on the limitations, restrictions and extra regulations regarding development within my Property Acceptance Criteria Given
- The PIA has displayed a Map of Snohomish County When
- The Map Zoom level is on the Neighborhood level
Then - The PIA displays a Tsunami
Inundation overlay When
- The Property is in a Tsunami Inundation Area
Then - Tsunami Inundation layer indicates
that the property is in a Tsunami Inundation Area
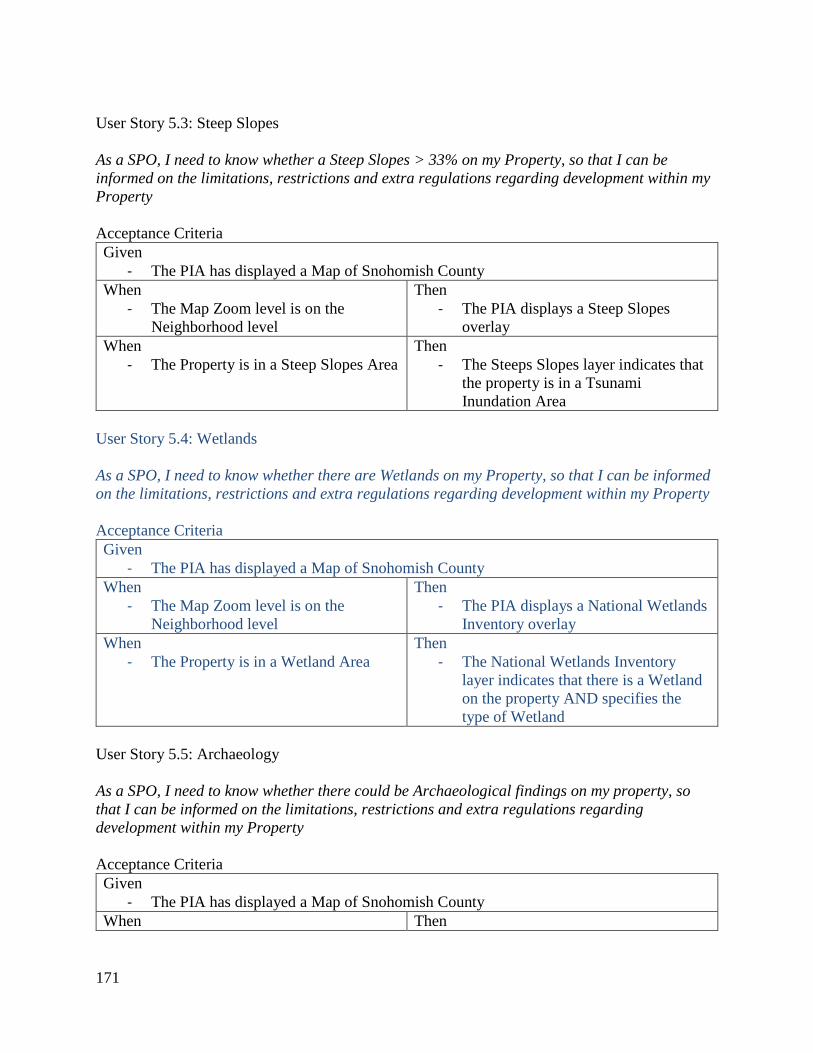
171
User Story 5.3: Steep Slopes As a SPO, I need to know whether a Steep Slopes > 33% on my Property, so that I can be informed on the limitations, restrictions and extra regulations regarding development within my Property Acceptance Criteria Given
- The PIA has displayed a Map of Snohomish County When
- The Map Zoom level is on the Neighborhood level
Then - The PIA displays a Steep Slopes
overlay When
- The Property is in a Steep Slopes Area Then
- The Steeps Slopes layer indicates that the property is in a Tsunami Inundation Area
User Story 5.4: Wetlands As a SPO, I need to know whether there are Wetlands on my Property, so that I can be informed on the limitations, restrictions and extra regulations regarding development within my Property Acceptance Criteria Given
- The PIA has displayed a Map of Snohomish County When
- The Map Zoom level is on the Neighborhood level
Then - The PIA displays a National Wetlands
Inventory overlay When
- The Property is in a Wetland Area Then
- The National Wetlands Inventory layer indicates that there is a Wetland on the property AND specifies the type of Wetland
User Story 5.5: Archaeology As a SPO, I need to know whether there could be Archaeological findings on my property, so that I can be informed on the limitations, restrictions and extra regulations regarding development within my Property Acceptance Criteria Given
- The PIA has displayed a Map of Snohomish County When Then
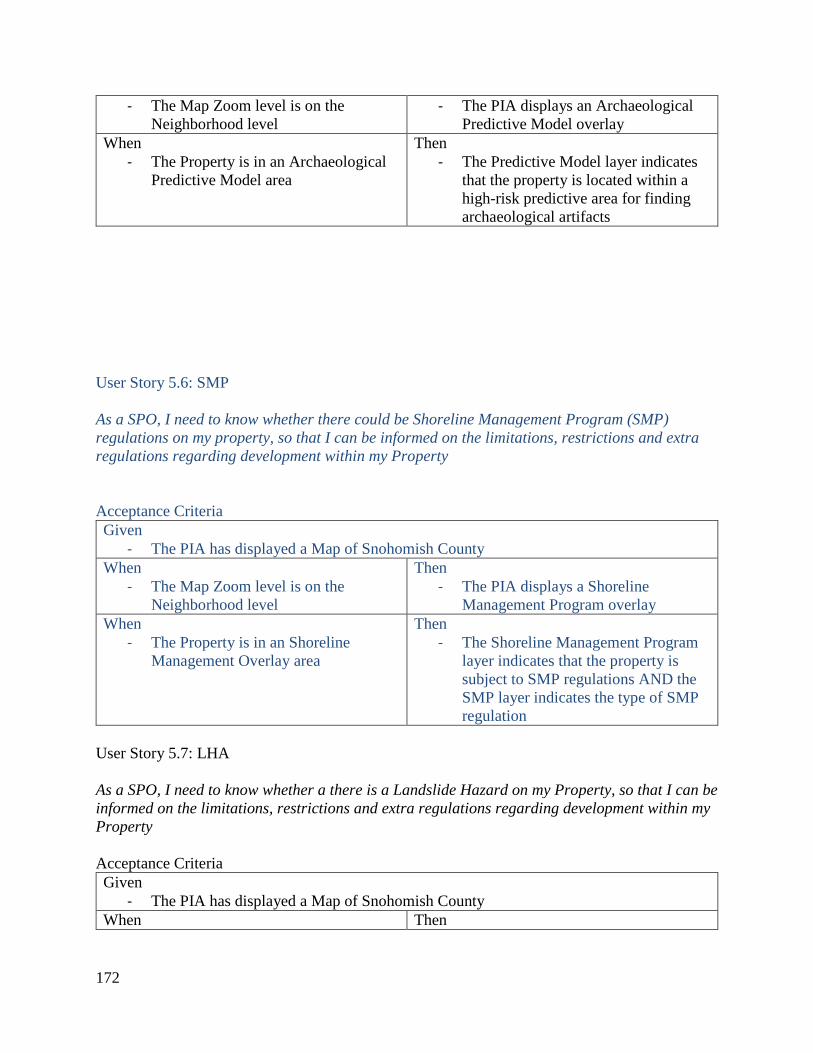
172
- The Map Zoom level is on the Neighborhood level
- The PIA displays an Archaeological Predictive Model overlay
When - The Property is in an Archaeological
Predictive Model area
Then - The Predictive Model layer indicates
that the property is located within a high-risk predictive area for finding archaeological artifacts
User Story 5.6: SMP As a SPO, I need to know whether there could be Shoreline Management Program (SMP) regulations on my property, so that I can be informed on the limitations, restrictions and extra regulations regarding development within my Property Acceptance Criteria Given
- The PIA has displayed a Map of Snohomish County When
- The Map Zoom level is on the Neighborhood level
Then - The PIA displays a Shoreline
Management Program overlay When
- The Property is in an Shoreline Management Overlay area
Then - The Shoreline Management Program
layer indicates that the property is subject to SMP regulations AND the SMP layer indicates the type of SMP regulation
User Story 5.7: LHA As a SPO, I need to know whether a there is a Landslide Hazard on my Property, so that I can be informed on the limitations, restrictions and extra regulations regarding development within my Property Acceptance Criteria Given
- The PIA has displayed a Map of Snohomish County When Then
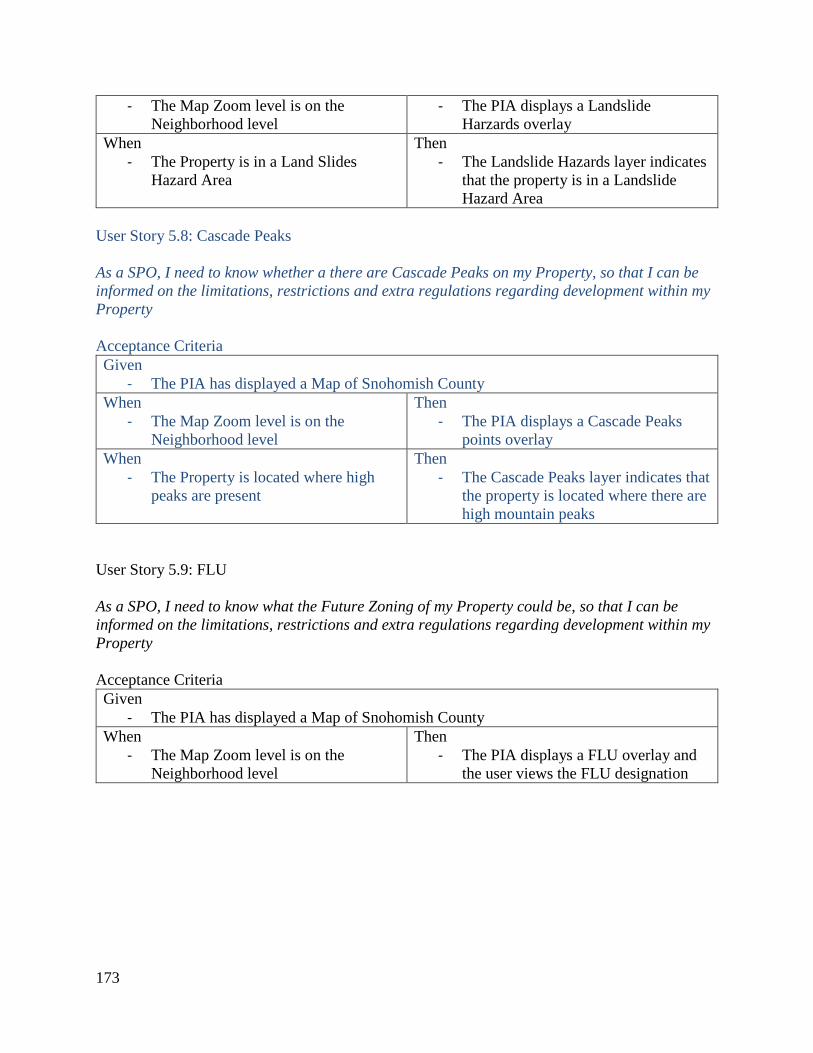
173
- The Map Zoom level is on the Neighborhood level
- The PIA displays a Landslide Harzards overlay
When - The Property is in a Land Slides
Hazard Area
Then - The Landslide Hazards layer indicates
that the property is in a Landslide Hazard Area
User Story 5.8: Cascade Peaks As a SPO, I need to know whether a there are Cascade Peaks on my Property, so that I can be informed on the limitations, restrictions and extra regulations regarding development within my Property Acceptance Criteria Given
- The PIA has displayed a Map of Snohomish County When
- The Map Zoom level is on the Neighborhood level
Then - The PIA displays a Cascade Peaks
points overlay When
- The Property is located where high peaks are present
Then - The Cascade Peaks layer indicates that
the property is located where there are high mountain peaks
User Story 5.9: FLU As a SPO, I need to know what the Future Zoning of my Property could be, so that I can be informed on the limitations, restrictions and extra regulations regarding development within my Property Acceptance Criteria Given
- The PIA has displayed a Map of Snohomish County When
- The Map Zoom level is on the Neighborhood level
Then - The PIA displays a FLU overlay and
the user views the FLU designation
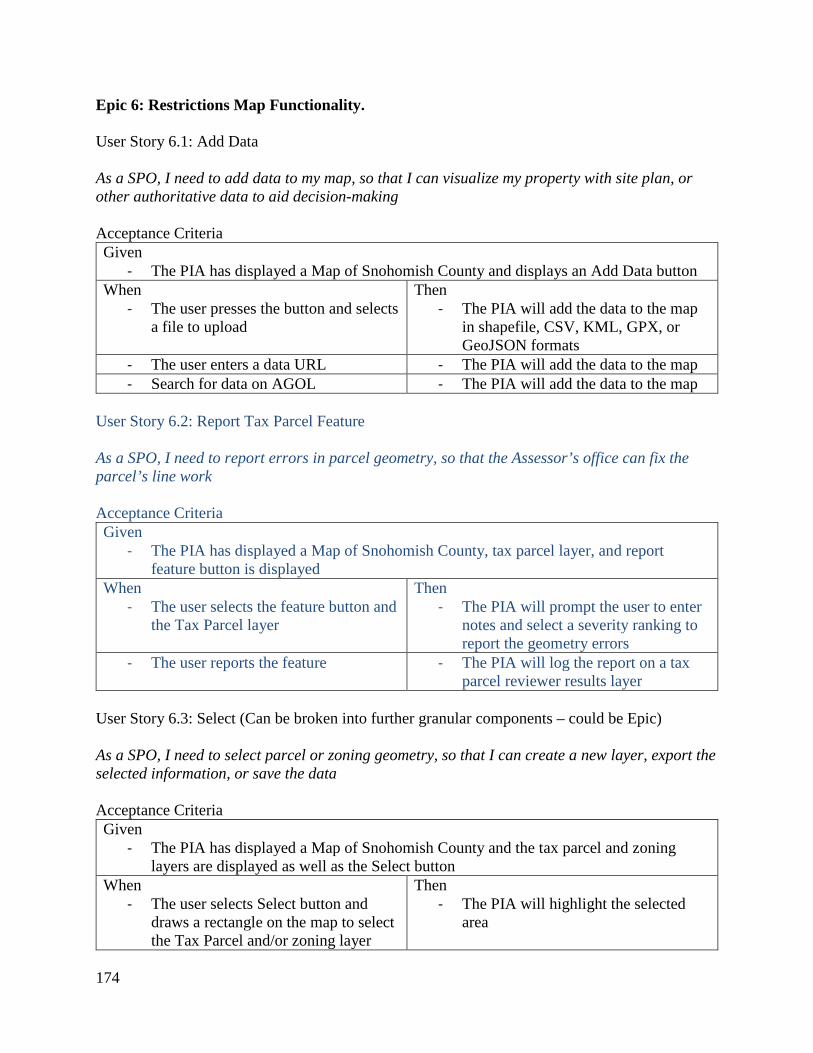
174
Epic 6: Restrictions Map Functionality. User Story 6.1: Add Data As a SPO, I need to add data to my map, so that I can visualize my property with site plan, or other authoritative data to aid decision-making Acceptance Criteria Given
- The PIA has displayed a Map of Snohomish County and displays an Add Data button When
- The user presses the button and selects a file to upload
Then - The PIA will add the data to the map
in shapefile, CSV, KML, GPX, or GeoJSON formats
- The user enters a data URL - The PIA will add the data to the map - Search for data on AGOL - The PIA will add the data to the map
User Story 6.2: Report Tax Parcel Feature As a SPO, I need to report errors in parcel geometry, so that the Assessor’s office can fix the parcel’s line work Acceptance Criteria Given
- The PIA has displayed a Map of Snohomish County, tax parcel layer, and report feature button is displayed
When - The user selects the feature button and
the Tax Parcel layer
Then - The PIA will prompt the user to enter
notes and select a severity ranking to report the geometry errors
- The user reports the feature - The PIA will log the report on a tax parcel reviewer results layer
User Story 6.3: Select (Can be broken into further granular components – could be Epic) As a SPO, I need to select parcel or zoning geometry, so that I can create a new layer, export the selected information, or save the data Acceptance Criteria Given
- The PIA has displayed a Map of Snohomish County and the tax parcel and zoning layers are displayed as well as the Select button
When - The user selects Select button and
draws a rectangle on the map to select the Tax Parcel and/or zoning layer
Then - The PIA will highlight the selected
area
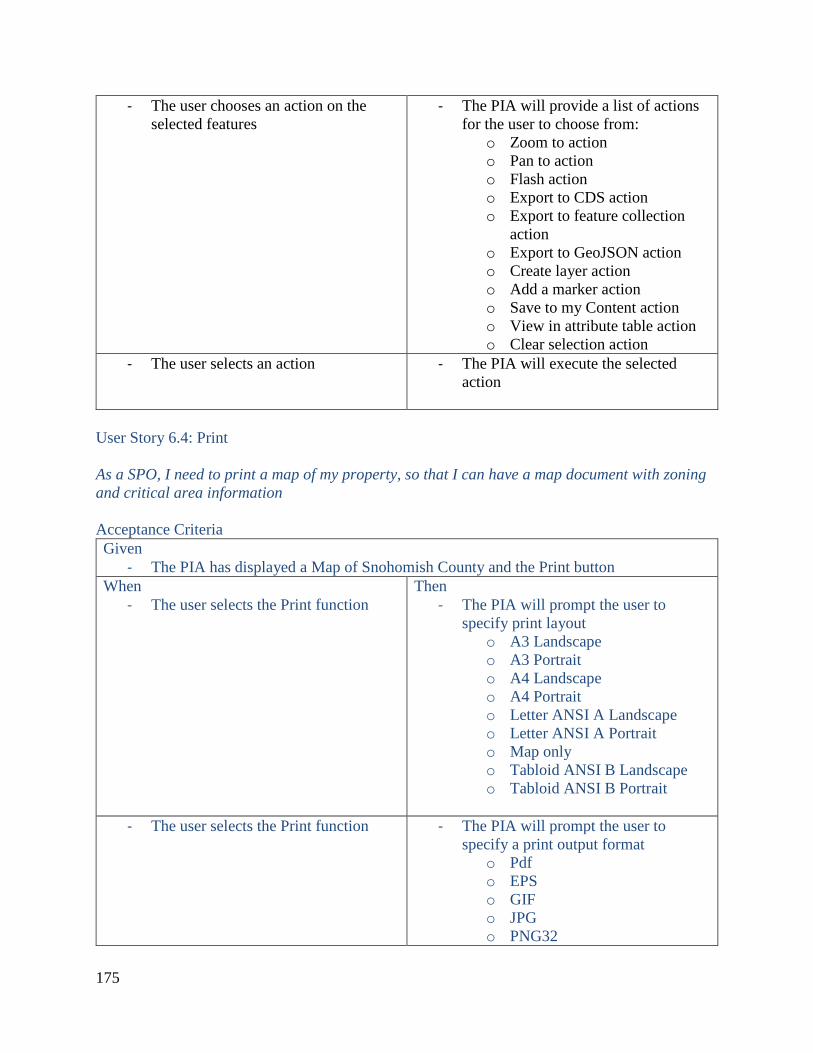
175
- The user chooses an action on the selected features
- The PIA will provide a list of actions for the user to choose from:
o Zoom to action o Pan to action o Flash action o Export to CDS action o Export to feature collection
action o Export to GeoJSON action o Create layer action o Add a marker action o Save to my Content action o View in attribute table action o Clear selection action
- The user selects an action - The PIA will execute the selected action
User Story 6.4: Print As a SPO, I need to print a map of my property, so that I can have a map document with zoning and critical area information Acceptance Criteria Given
- The PIA has displayed a Map of Snohomish County and the Print button When
- The user selects the Print function Then
- The PIA will prompt the user to specify print layout
o A3 Landscape o A3 Portrait o A4 Landscape o A4 Portrait o Letter ANSI A Landscape o Letter ANSI A Portrait o Map only o Tabloid ANSI B Landscape o Tabloid ANSI B Portrait
- The user selects the Print function - The PIA will prompt the user to
specify a print output format o Pdf o EPS o GIF o JPG o PNG32
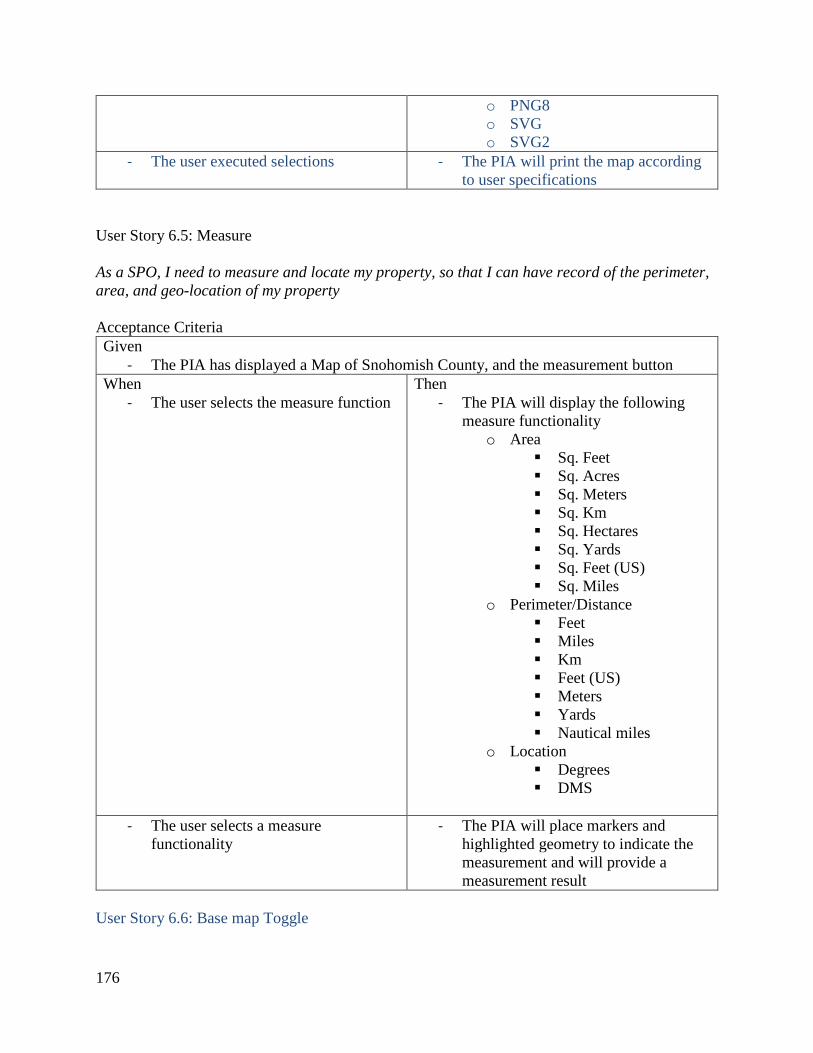
176
o PNG8 o SVG o SVG2
- The user executed selections - The PIA will print the map according to user specifications
User Story 6.5: Measure As a SPO, I need to measure and locate my property, so that I can have record of the perimeter, area, and geo-location of my property Acceptance Criteria Given
- The PIA has displayed a Map of Snohomish County, and the measurement button When
- The user selects the measure function Then
- The PIA will display the following measure functionality
o Area Sq. Feet Sq. Acres Sq. Meters Sq. Km Sq. Hectares Sq. Yards Sq. Feet (US) Sq. Miles
o Perimeter/Distance Feet Miles Km Feet (US) Meters Yards Nautical miles
o Location Degrees DMS
- The user selects a measure
functionality - The PIA will place markers and
highlighted geometry to indicate the measurement and will provide a measurement result
User Story 6.6: Base map Toggle
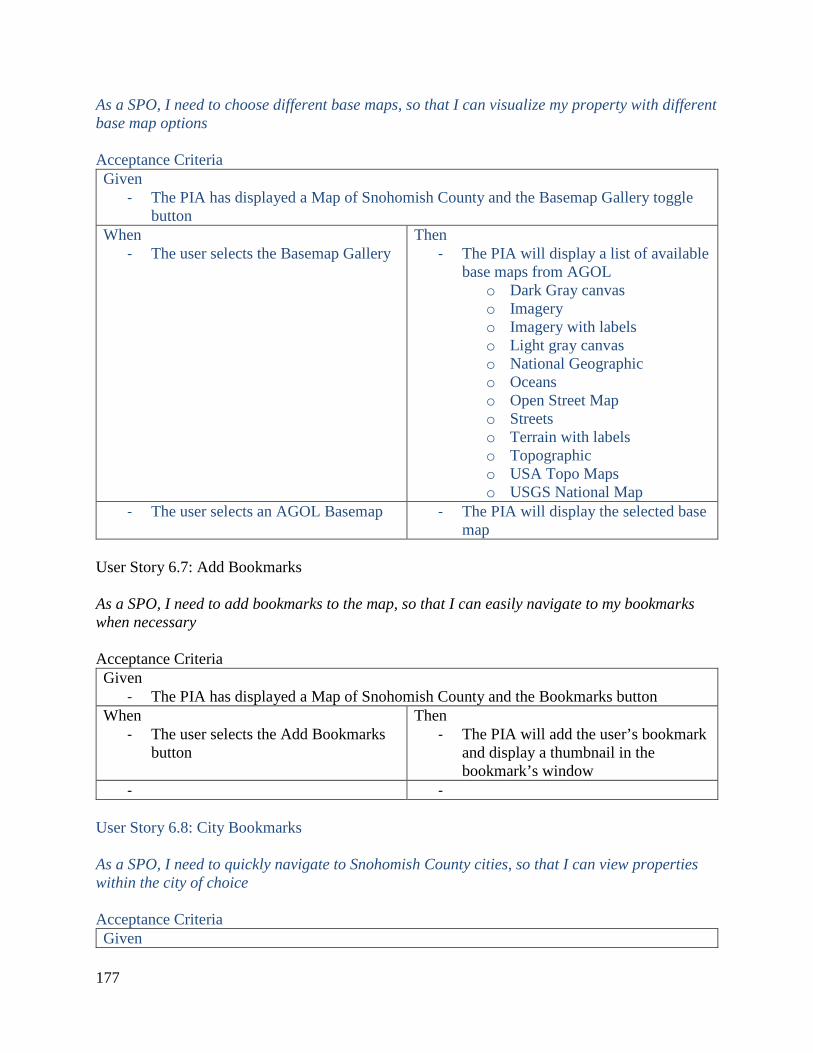
177
As a SPO, I need to choose different base maps, so that I can visualize my property with different base map options Acceptance Criteria Given
- The PIA has displayed a Map of Snohomish County and the Basemap Gallery toggle button
When - The user selects the Basemap Gallery
Then - The PIA will display a list of available
base maps from AGOL o Dark Gray canvas o Imagery o Imagery with labels o Light gray canvas o National Geographic o Oceans o Open Street Map o Streets o Terrain with labels o Topographic o USA Topo Maps o USGS National Map
- The user selects an AGOL Basemap - The PIA will display the selected base map
User Story 6.7: Add Bookmarks As a SPO, I need to add bookmarks to the map, so that I can easily navigate to my bookmarks when necessary Acceptance Criteria Given
- The PIA has displayed a Map of Snohomish County and the Bookmarks button When
- The user selects the Add Bookmarks button
Then - The PIA will add the user’s bookmark
and display a thumbnail in the bookmark’s window
- - User Story 6.8: City Bookmarks As a SPO, I need to quickly navigate to Snohomish County cities, so that I can view properties within the city of choice Acceptance Criteria Given
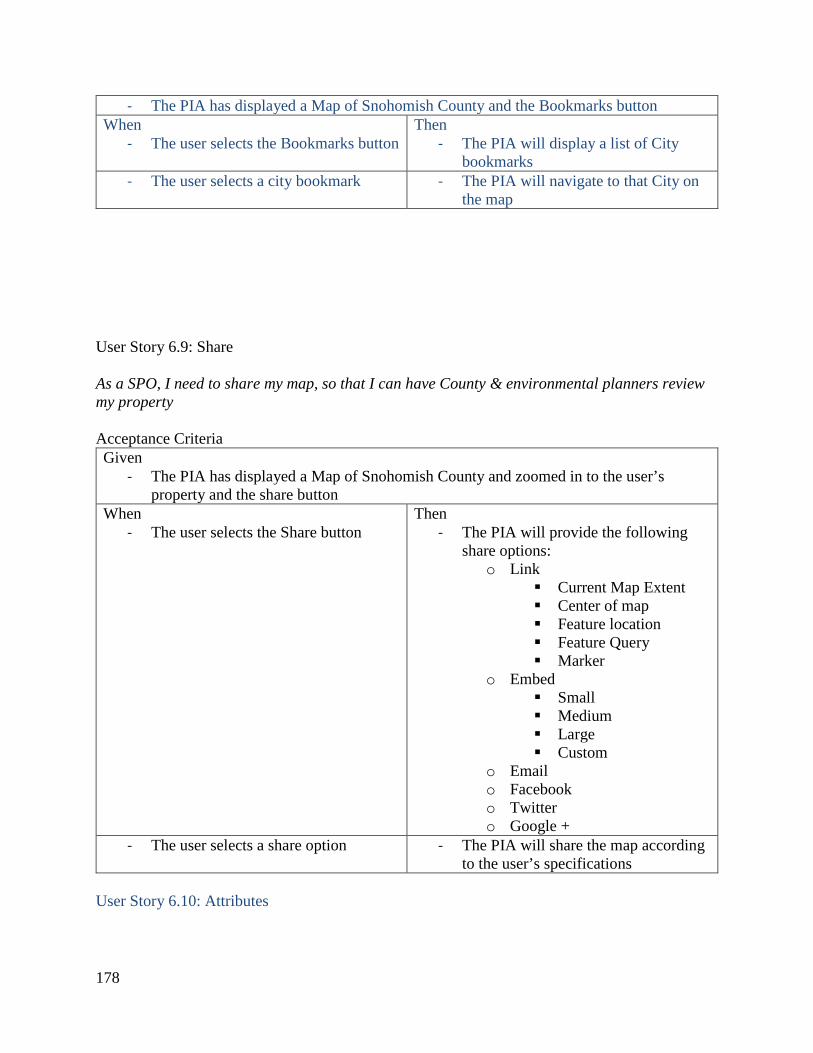
178
- The PIA has displayed a Map of Snohomish County and the Bookmarks button When
- The user selects the Bookmarks button Then
- The PIA will display a list of City bookmarks
- The user selects a city bookmark - The PIA will navigate to that City on the map
User Story 6.9: Share As a SPO, I need to share my map, so that I can have County & environmental planners review my property Acceptance Criteria Given
- The PIA has displayed a Map of Snohomish County and zoomed in to the user’s property and the share button
When - The user selects the Share button
Then - The PIA will provide the following
share options: o Link
Current Map Extent Center of map Feature location Feature Query Marker
o Embed Small Medium Large Custom
o Email o Facebook o Twitter o Google +
- The user selects a share option - The PIA will share the map according to the user’s specifications
User Story 6.10: Attributes
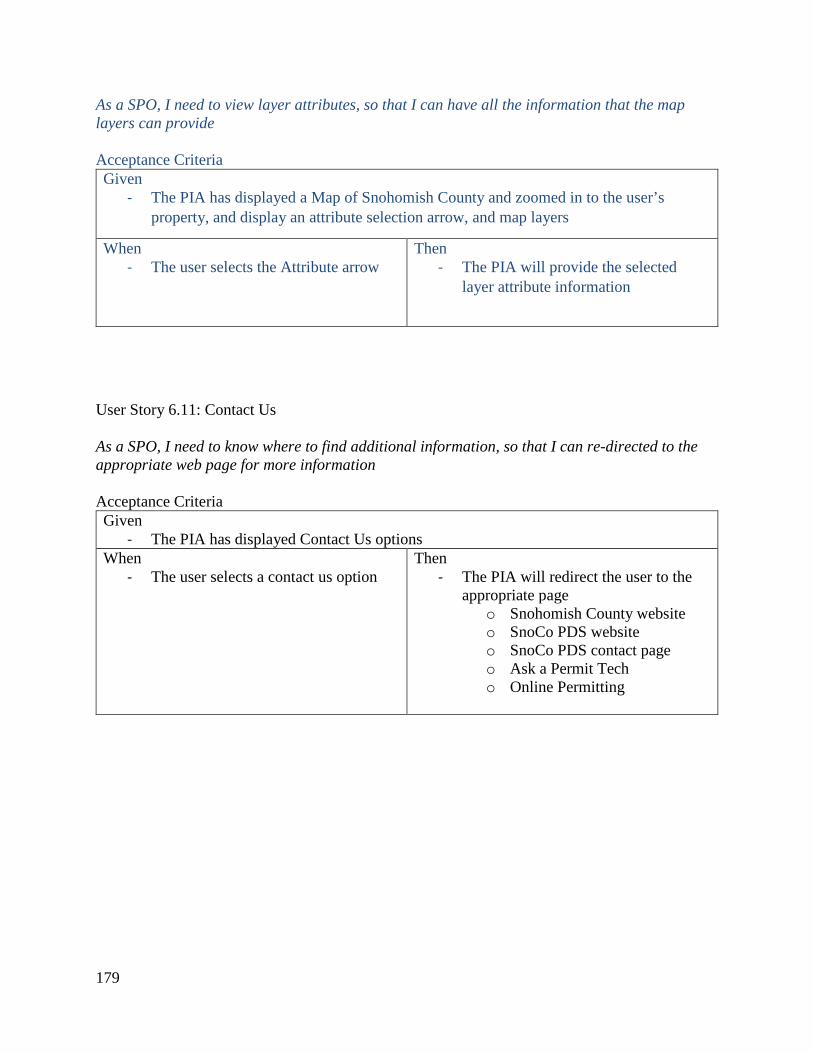
179
As a SPO, I need to view layer attributes, so that I can have all the information that the map layers can provide Acceptance Criteria Given
- The PIA has displayed a Map of Snohomish County and zoomed in to the user’s property, and display an attribute selection arrow, and map layers
When - The user selects the Attribute arrow
Then - The PIA will provide the selected
layer attribute information
User Story 6.11: Contact Us As a SPO, I need to know where to find additional information, so that I can re-directed to the appropriate web page for more information Acceptance Criteria Given
- The PIA has displayed Contact Us options When
- The user selects a contact us option Then
- The PIA will redirect the user to the appropriate page
o Snohomish County website o SnoCo PDS website o SnoCo PDS contact page o Ask a Permit Tech o Online Permitting
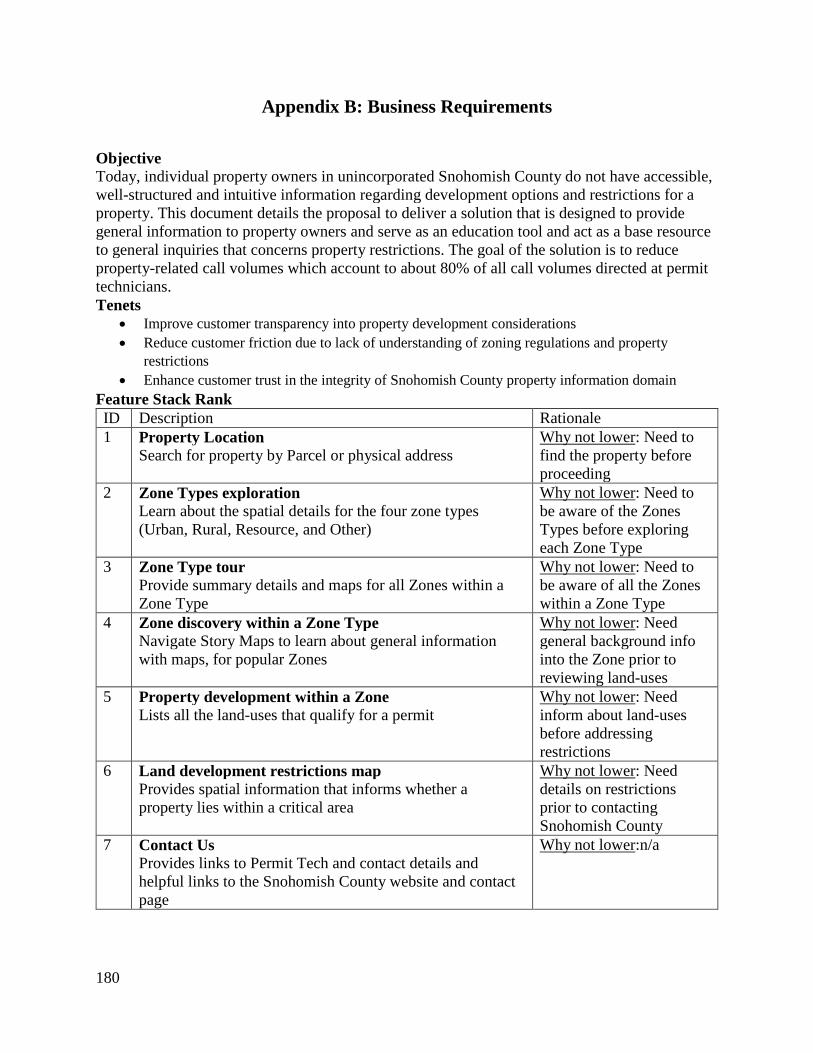
180
Appendix B: Business Requirements
Objective Today, individual property owners in unincorporated Snohomish County do not have accessible, well-structured and intuitive information regarding development options and restrictions for a property. This document details the proposal to deliver a solution that is designed to provide general information to property owners and serve as an education tool and act as a base resource to general inquiries that concerns property restrictions. The goal of the solution is to reduce property-related call volumes which account to about 80% of all call volumes directed at permit technicians. Tenets
• Improve customer transparency into property development considerations • Reduce customer friction due to lack of understanding of zoning regulations and property
restrictions • Enhance customer trust in the integrity of Snohomish County property information domain
Feature Stack Rank ID Description Rationale 1 Property Location
Search for property by Parcel or physical address Why not lower: Need to find the property before proceeding
2 Zone Types exploration Learn about the spatial details for the four zone types (Urban, Rural, Resource, and Other)
Why not lower: Need to be aware of the Zones Types before exploring each Zone Type
3 Zone Type tour Provide summary details and maps for all Zones within a Zone Type
Why not lower: Need to be aware of all the Zones within a Zone Type
4 Zone discovery within a Zone Type Navigate Story Maps to learn about general information with maps, for popular Zones
Why not lower: Need general background info into the Zone prior to reviewing land-uses
5 Property development within a Zone Lists all the land-uses that qualify for a permit
Why not lower: Need inform about land-uses before addressing restrictions
6 Land development restrictions map Provides spatial information that informs whether a property lies within a critical area
Why not lower: Need details on restrictions prior to contacting Snohomish County
7 Contact Us Provides links to Permit Tech and contact details and helpful links to the Snohomish County website and contact page
Why not lower:n/a
181
Appendix C: Important Links
1. Final Snohomish County PIA Application link:
http://uscssi.maps.arcgis.com/apps/Cascade/index.html?appid=cd0109bf52594159a8
1c4794c96189a0
2. Jira (Project Management Tool) Require login – will provide access and permissions:
https://antoun.atlassian.net/secure/RapidBoard.jspa?rapidView=3&projectKey=PIA
&view=planning&selectedIssue=PIA-57
3. Trello Board (Project Management – Testing) Require login – will provide access and
permissions: https://trello.com/b/LfyEEFsK/pia-test-plan
4. First UI of PIA App before UI Refactor Iteration:
http://uscssi.maps.arcgis.com/apps/MapSeries/index.html?appid=01494c873a8c4d91
a3c05841a870570b
PIA and Related Public Institution Applications URL’s:
5. Snohomish County PIA Application:
http://uscssi.maps.arcgis.com/apps/Cascade/index.html?appid=cd0109bf52594159a8
1c4794c96189a0
6. Snohomish County Map Portal (the pilot application):
7. : http://gismaps.snoco.org/Html5Viewer/Index.html?viewer=pdsmapportal
8. King County iMap: https://gismaps.kingcounty.gov/imap/
9. Shawnee County Property Search: http://gis.snco.us/publicgis/ps/
10. City of Mountain View:
http://www.mountainview.gov/depts/comdev/planning/regulations/zoning/default.asp
San Francisco Property Information Map: http://propertymap.sfplanning.org/
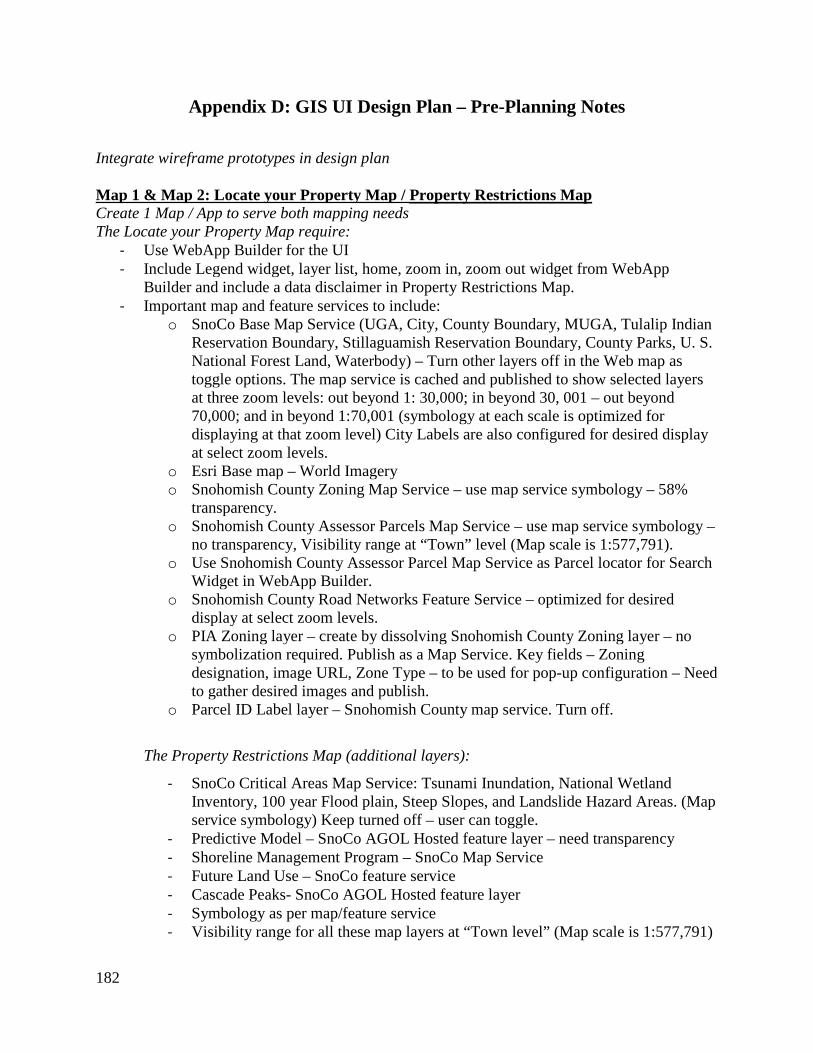
182
Appendix D: GIS UI Design Plan – Pre-Planning Notes
Integrate wireframe prototypes in design plan
Map 1 & Map 2: Locate your Property Map / Property Restrictions Map Create 1 Map / App to serve both mapping needs The Locate your Property Map require:
- Use WebApp Builder for the UI - Include Legend widget, layer list, home, zoom in, zoom out widget from WebApp
Builder and include a data disclaimer in Property Restrictions Map. - Important map and feature services to include:
o SnoCo Base Map Service (UGA, City, County Boundary, MUGA, Tulalip Indian Reservation Boundary, Stillaguamish Reservation Boundary, County Parks, U. S. National Forest Land, Waterbody) – Turn other layers off in the Web map as toggle options. The map service is cached and published to show selected layers at three zoom levels: out beyond 1: 30,000; in beyond 30, 001 – out beyond 70,000; and in beyond 1:70,001 (symbology at each scale is optimized for displaying at that zoom level) City Labels are also configured for desired display at select zoom levels.
o Esri Base map – World Imagery o Snohomish County Zoning Map Service – use map service symbology – 58%
transparency. o Snohomish County Assessor Parcels Map Service – use map service symbology –
no transparency, Visibility range at “Town” level (Map scale is 1:577,791). o Use Snohomish County Assessor Parcel Map Service as Parcel locator for Search
Widget in WebApp Builder. o Snohomish County Road Networks Feature Service – optimized for desired
display at select zoom levels. o PIA Zoning layer – create by dissolving Snohomish County Zoning layer – no
symbolization required. Publish as a Map Service. Key fields – Zoning designation, image URL, Zone Type – to be used for pop-up configuration – Need to gather desired images and publish.
o Parcel ID Label layer – Snohomish County map service. Turn off.
The Property Restrictions Map (additional layers):
- SnoCo Critical Areas Map Service: Tsunami Inundation, National Wetland Inventory, 100 year Flood plain, Steep Slopes, and Landslide Hazard Areas. (Map service symbology) Keep turned off – user can toggle.
- Predictive Model – SnoCo AGOL Hosted feature layer – need transparency - Shoreline Management Program – SnoCo Map Service - Future Land Use – SnoCo feature service - Cascade Peaks- SnoCo AGOL Hosted feature layer - Symbology as per map/feature service - Visibility range for all these map layers at “Town level” (Map scale is 1:577,791)
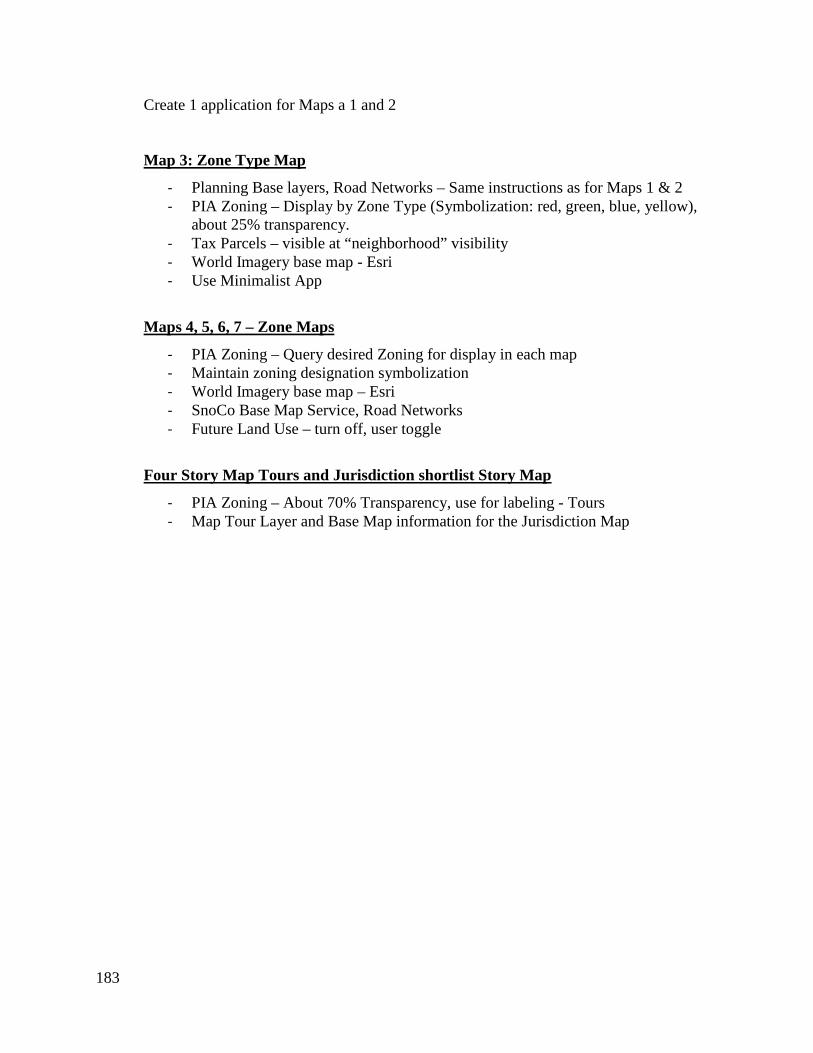
183
Create 1 application for Maps a 1 and 2
Map 3: Zone Type Map
- Planning Base layers, Road Networks – Same instructions as for Maps 1 & 2 - PIA Zoning – Display by Zone Type (Symbolization: red, green, blue, yellow),
about 25% transparency. - Tax Parcels – visible at “neighborhood” visibility - World Imagery base map - Esri - Use Minimalist App
Maps 4, 5, 6, 7 – Zone Maps
- PIA Zoning – Query desired Zoning for display in each map - Maintain zoning designation symbolization - World Imagery base map – Esri - SnoCo Base Map Service, Road Networks - Future Land Use – turn off, user toggle
Four Story Map Tours and Jurisdiction shortlist Story Map
- PIA Zoning – About 70% Transparency, use for labeling - Tours - Map Tour Layer and Base Map information for the Jurisdiction Map