Embed Size (px)
Citation preview
Carte & Russell/Moderation Errors
MIS Quarterly Vol. 27 No. 3, pp. XXX-XXX/September 2003 1
12 RESEARCH ESSAY
IN PURSUIT OF MODERATION: NINE3
COMMON ERRORS AND THEIR4
SOLUTIONS15
By: Traci A. Carte6Division of Management Information7
Systems8Price College of Business9University of Oklahoma10307 W. Brooks Drive11Norman, OK [email protected]
15Craig J. Russell16Division of Management Information17
Systems18Price College of Business19University of Oklahoma20307 W. Brooks Drive21Norman, OK [email protected]
Abstract2526
One result of the increasing sophistication and27complexity of MIS theory and research is the28number of studies hypothesizing and testing for29
1V. Sambamurthy was the accepting senior editor for this30paper.31
moderation effects. A review of the MIS andbroader management literatures suggests re-searchers investigating moderated relationshipsoften commit one or more errors falling into threebroad categories: inappropriate use or interpreta-tion of statistics, misalignment of research designwith phenomena of interest, and measurement orscaling issues. Examples of nine common errorsare presented. Commission of these errors isexpected to yield literatures characterized bymixed results at best, and thoroughly erroneousresults at worse. Procedures representing ex-amples of best practice and reporting guidelinesare provided to help MIS investigators avoid orminimize these errors.
Keywords: Tests of moderation, contingencymodels, PLS
ISRL Categories: AI0604; AI0610; AI0702; IB01
Introduction
Lee (2001) argued that the contribution manyuniversity researchers make to the MIS field is“scrupulous attention” to scientific methods, usinglargely quantitatively and statistically based ap-proaches. MIS researchers have recently focusedon improving the quantitative methods employed.

Carte & Russell/Moderation Errors
2 MIS Quarterly Vol. 27 No. 3/September 2003
For example, MIS researchers investigated meth-1odological issues in experiments (Jarvenpaa et al.21985), highlighted problems of statistical power3(Baroudi and Orlikowski 1989), questioned model4complexity (Lee et al. 1997), and examined the5rigor with which instruments are validated (Boud-6reau et al. 2001). The goal of this paper is to sen-7sitize MIS researchers to methodological issues8surrounding tests of moderated relationships.9
10Three types of relationships dominate MIS11research: simple linear or additive relationships,12mediated relationships (typically sequences of13linear relationships), and moderator relationships.14Moderator relationships are the most interesting15and perhaps the most difficult of the three to16establish empirically (McClelland and Judd 1993).17A review of recent MIS research reveals an18increasing interest in moderated relationships.19From 1991 through 2000, MIS Quarterly, Informa-20tion Systems Research, and Journal of Manage-21ment Information Systems published 26 articles22directly testing moderated relationships (see23Appendix A). MIS Quarterly and Information Sys-24tems Research had 17 articles suggesting but not25testing moderation in the same 10-year period.26
27The increasing interest in moderated relationships28reinforces a notion that MIS researchers are29increasingly addressing: context matters in MIS30research. Relevant contexts include organiza-31tional, technological, and individual. For example,32researchers investigating technology acceptance33have incorporated individual contexts such as34personal innovativeness (Agarwal and Prasad351998), work experience and gender (Venkatesh36and Morris 2000) and yielded a richer under-37standing of the phenomenon of interest.38
39This paper critically assesses moderation tests40performed by MIS researchers. We hope to raise41awareness about common errors and enhance the42craftsmanship of moderation testing by providing43a central summary of nine common errors. While44these errors have been separately identified45elsewhere, this is the first attempt to synthesize46and assess the extent to which MIS researchers47are prone to their commission. Some of these48errors, while generally understood, still occur49
frequently. Others are less well understood andoccur with great regularity. Importantly, theincreasingly popular use of partial least squares(PLS) applications (Gefen et al. 2000) has beenaccompanied by an introduction of a new error aswell as reintroduction of some old errors.
We critically assess moderation tests in thesample of 26 articles published from 1991 through2000, identifying three general types of errorslabeled inappropriate statistics, misalignment ofphenomena and research design, and measure-ment issues. Nine specific errors were distin-guished, although not all studies reported enoughinformation to determine whether an error oc-curred. Descriptions of these errors and methodsof avoiding them should help MIS investigatorsadvance theory and practice by minimizing Type Iand Type II errors in tests of moderation
We first review various conceptual definitions ofmoderation, then present three sets of commondifficulties encountered when searching formoderation in MIS research and ways to avoidthem. Analysis of select articles is presented todemonstrate error commission, potential conse-quences, and illustrations of best research prac-tice. We conclude by recommending reportingguidelines to improve the thoroughness with whichauthors report moderation-related evidence andenhance the ability of readers and reviewers toevaluate tests of moderation.
Definitions
Review of moderation definitions revealed what atfirst appeared to be an unsettlingly high level ofvariation. Fortunately, evidence supporting thepresence of virtually all conceptualizations ofmoderation in applied behavioral field researchcan be assessed using hierarchical moderatedmultiple regression (MMR, Saunders 1956) to testH0: ∆R2 = R2
mult – R2add = 0 using least squares
procedures (ordinary or PLS), where:
YÌ
= b0 + b1X + b2Z; R2add Equation 1

Carte & Russell/Moderation Errors
MIS Quarterly Vol. 27 No. 3/September 2003 3
YÌ
= b0 + b1X + b2Z + b2XZ; R2mult Equation 21
2An F statistic derived using Equation 3 that is3significantly greater than 1.00 leads to rejection of4H0: ∆R2 = 0 and the conclusion that either Z5moderates the X→Y relationship or X moderates6the Z→Y relationship.2 Using this procedure,7large values of ∆R2 occur when any one of a8number of conceptualizations of moderation9occurs.10
11
Equation 312 F1,N - 3 2mult(1- R ) (N - 3)
= R2∆F1,N - 3 2mult(1- R ) (N - 3)2mult(1- R ) (N - 3)
= R2∆R2∆
13Definitions of moderation provided in the literature14are summarized in Table 1. Of particular note is15Arnold’s (1982, 1984, amplified by Baron and16Kenney 1986) distinction between circumstances17where the strength of the X→Y relationship varies18as a function of Z versus the nature of the X→Y19relationship varies as a function of Z. The former20is often referred to as differential validity while the21latter is referred to as differential prediction.3 The22distinction between these two types is important23as differential prediction is the form of moderation24appropriately tested for using MMR. The definition25of moderation applied in this study is that of26differential prediction, where the nature of the27X→Y relationship varies as a function of Z. 28
29MIS researchers are not consistent in their30moderation conceptualizations. For example, a31number of MIS investigators incorrectly use32differential validity and differential prediction inter-33changeably. Four articles in our sample included34language describing moderation as differences in35strength of the X→Y relationship and differences36
in the nature of the X→Y relationship (Devaraj andKohli 2000; Hardgrave et al. 1999; Harrison et al.1997; McKeen et al. 1994). By way of illustration,McKeen et al. (1994) stated they examinedwhether “the strength of the participation-satis-faction relationship depended on the level of” (p.427) task complexity and other moderators.However, these authors did not report differencesin strength of participation-satisfaction (i.e.,rparticipation-satisfaction) across levels of task complexity,instead reporting differences in the nature or slopeof the participation-satisfaction relationship acrosslevels of task complexity.
Importantly, insight into underlying processesbehind moderation is most likely to result fromqualitative research efforts aimed at addingmeaning to abstract relationships found in quanti-tative research. Such efforts will be most justifiedwhen empirical evidence suggests the presenceof an underlying moderation process. In fieldstudies using random effects designs (by far thedominant research design used in appliedbehavior research), MMR procedures and recentPLS variants constitute the dominant method ofdetecting moderation effects (Aiken and West1991). The nine common errors discussed belowaddress interpretations of MMR and PLS resultsused to test the definition of moderation describedabove.
Nine Common Errors
Unfortunately, even a casual reader of research inMIS, organizational behavior, human resourcesmanagement, organizational theory, and strategycan find examples of ill-advised or outright inap-propriate research methods in studies examiningmoderation effects. Examination of the MISresearch generated a list of nine common errorsthat cause severe problems. These are sum-marized in Table 2 and grouped into three cate-gories based on our views of underlying simi-larities: (1) inappropriate use or interpretation ofstatistics, (2) misalignment of phenomena andresearch design, and (3) measurement or scalingissues.
2Note that mathematically the test of H0: ∆R2 = 0 is thesame as an omnibus test of whether b0 and b1 for thefollowing two equations are significantly different fromone another:
YÌ
= b1 + b2X; for Z = 1
YÌ
= b1 + b2X; for Z = 2
3Interested readers may contact the second author formore information on the distinction between differentialvalidity and differential prediction.
Carte & Russell/Moderation Errors
4 MIS Quarterly Vol. 27 No. 3/September 2003
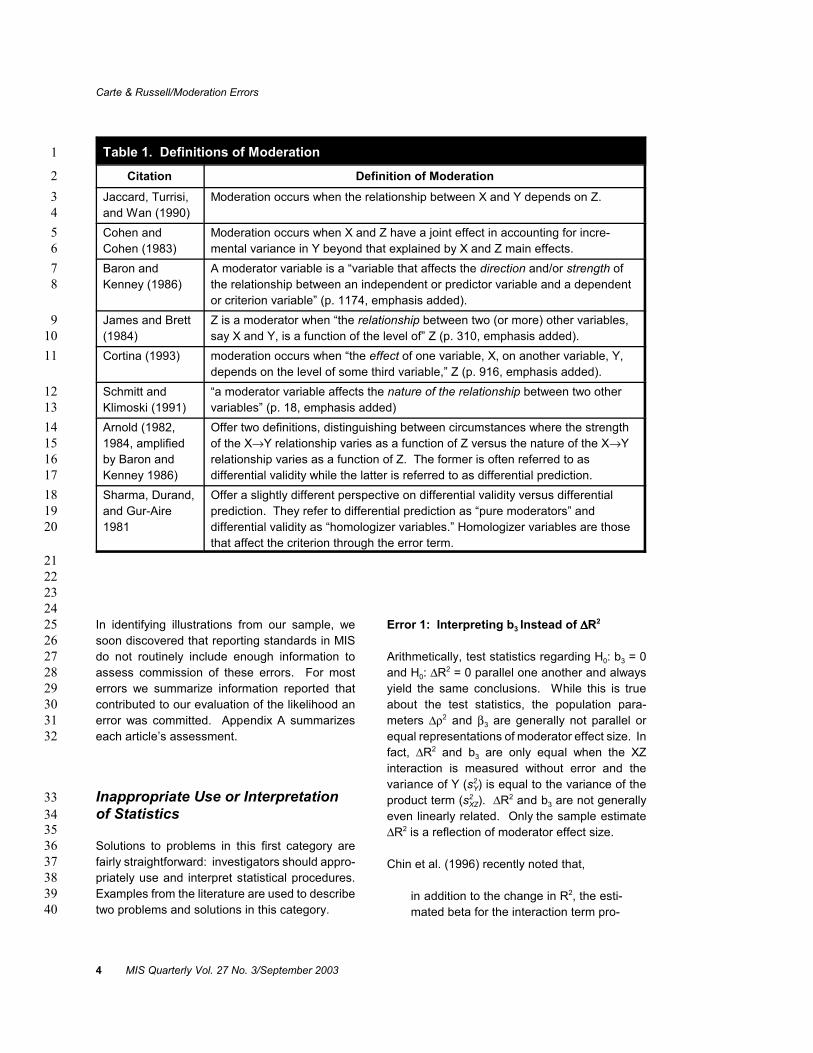
Table 1. Definitions of Moderation1
Citation2 Definition of ModerationJaccard, Turrisi,3and Wan (1990)4
Moderation occurs when the relationship between X and Y depends on Z.
Cohen and5Cohen (1983)6
Moderation occurs when X and Z have a joint effect in accounting for incre-mental variance in Y beyond that explained by X and Z main effects.
Baron and7Kenney (1986)8
A moderator variable is a “variable that affects the direction and/or strength ofthe relationship between an independent or predictor variable and a dependentor criterion variable” (p. 1174, emphasis added).
James and Brett9(1984)10
Z is a moderator when “the relationship between two (or more) other variables,say X and Y, is a function of the level of” Z (p. 310, emphasis added).
Cortina (1993)11 moderation occurs when “the effect of one variable, X, on another variable, Y,depends on the level of some third variable,” Z (p. 916, emphasis added).
Schmitt and12Klimoski (1991)13
“a moderator variable affects the nature of the relationship between two othervariables” (p. 18, emphasis added)
Arnold (1982,141984, amplified15by Baron and16Kenney 1986)17
Offer two definitions, distinguishing between circumstances where the strengthof the X→Y relationship varies as a function of Z versus the nature of the X→Yrelationship varies as a function of Z. The former is often referred to asdifferential validity while the latter is referred to as differential prediction.
Sharma, Durand,18and Gur-Aire19198120
Offer a slightly different perspective on differential validity versus differentialprediction. They refer to differential prediction as “pure moderators” anddifferential validity as “homologizer variables.” Homologizer variables are thosethat affect the criterion through the error term.
21222324
In identifying illustrations from our sample, we25soon discovered that reporting standards in MIS26do not routinely include enough information to27assess commission of these errors. For most28errors we summarize information reported that29contributed to our evaluation of the likelihood an30error was committed. Appendix A summarizes31each article’s assessment.32
Inappropriate Use or Interpretation33of Statistics34
35Solutions to problems in this first category are36fairly straightforward: investigators should appro-37priately use and interpret statistical procedures.38Examples from the literature are used to describe39two problems and solutions in this category.40
Error 1: Interpreting b3 Instead of ∆∆∆∆R2
Arithmetically, test statistics regarding H0: b3 = 0and H0: ∆R2 = 0 parallel one another and alwaysyield the same conclusions. While this is trueabout the test statistics, the population para-meters ∆ρ2 and β3 are generally not parallel orequal representations of moderator effect size. Infact, ∆R2 and b3 are only equal when the XZinteraction is measured without error and thevariance of Y (s2
Y) is equal to the variance of theproduct term (s2
XZ). ∆R2 and b3 are not generallyeven linearly related. Only the sample estimate∆R2 is a reflection of moderator effect size.
Chin et al. (1996) recently noted that,
in addition to the change in R2, the esti-mated beta for the interaction term pro-

Carte & Russell/Moderation Errors
MIS Quarterly Vol. 27 No. 3/September 2003 5
Table 2. Nine Common Errors of Commission in Conclusions Drawn about1Moderation Effects2
# 3 Error Description Error SolutionInappropriate Use or Interpretation of Statistics4
15 Using b3 instead of ∆R2 as anindex of moderator effect size
Use ∆R2 as the index of moderator effect size after establishingstatistical significance using either a t-test of H0: b3 = 0 or H0:∆R2 = 0.
26 Interpreting b1 and b2 when Xand Z are interval scalemeasures
Develop ratio scale measures of X and Z or do not use ordevelop models requiring interpretation of b1 and b2.
Misalignment of Phenomena and Research Design738 Confounding of X•Z with X2 Partial out X2 effects by adding X2 term to MMR analyses.49 Incorrect specification of the
X→Y versus Y→X causalsequence.
1. Careful consideration of theory or rationale justifying causalsequence to ensure correct sequence is selected.
2. Examine the moderation effects in both causal sequencesas part of exploratory efforts that might lead to theorydevelopment.
510 Low power of random effectsdesigns
1. Estimate sample size required to reject H0: ∆R2 = 0 with X, Zcombinations that are expected to be observed in the data.
2. Take extra care before “trimming” any outliers. Measurement or Scaling Issues11
612 Dependent variable scale istoo coarse
Investigate number of levels of X and Z expected and selectmethod of operationalizing Y that meets or exceeds theirproduct.
713 Nonlinear, monotonic Ytransformations
Do no transformations without a theoretical rationale. Bootstrapestimates of confidence interval around ∆R2 if parametricassumptions are not met.
814 Influence of measurementerror on X•Z.
First, estimate expected ∆R2 by simulating X•Z interaction andadjusting obtained ∆R2 for measurement error in X and Z. Second, estimate sample size required to reject H0: ∆R2 = 0when the expected MMR effect size is the adjusted estimate of∆R2.
915 Gamma Differences betweentwo Groups in PLS.
Test for differences between inter-item correlation matricesbetween two groups using Hotelling T2 and/or assess factorloading similarities using coefficient of concordance (Harman1976). If no differences exist, scales derived from the itemsmust be arrived at in the same way for all observations. Ifdifferences exist, explore for possible differences in latentconstruct domain tapped by items.
161718

Carte & Russell/Moderation Errors
6 MIS Quarterly Vol. 27 No. 3/September 2003
vides additional information regarding1the interaction effect. This estimate in-2forms us as to how much a unit change3in the moderator variable Z would4change the regression relationship of Y5on X. (p. 22)6
7Unfortunately, when X, Y, and Z are measured on8interval scales, the units of measurement are9arbitrary. Change in the X-Y relationship asso-10ciated with a unit change in Z can be artificially11inflated or deflated by simply changing Z’s scale of12measurement. Further, multicolinearity between13X, Z, and the XZ product term causes additional b314distortion.415
16After making this incorrect assertion, Chin et al.17focused on b3 estimates in reviewing 70 MIS18studies reporting tests of moderation since 1980.19In their Table 2 summarizing studies using regres-20sion and path analytic techniques, Chin et al.21reported b3 terms as evidence of moderator effect22size and concluded that23
24the literature consistently reported mod-25erators with a small effect size, beta26averaging 0.10, suggesting that moder-27ating terms play only a small part for28understanding information systems29issues. (p. 23)30
31In fact, as b3 is not an indicator of moderator effect32size, no conclusion can be drawn about the role33moderators play in understanding information34systems issues. Chin et al. could have formed a35conclusion about the role of moderators if they36had summarized ∆R2 across studies.37
38Unfortunately, Chin et al. may have been limited39by the information reported in their studies and40unable to draw strong conclusions about the role41of moderators in MIS research. Only seven42articles (27 percent) in our sample actually43
reported ∆R2. In one best practice example,Harrington (1996) investigated moderating effectsof denial of responsibility on codes of ethics andtheir relationship to computer abuse judgmentsand intentions. Her analysis included not only acalculation but a discussion of ∆R2 effect size.
Solution. Investigators must use ∆R2 to drawconclusions about relative moderator effect sizes;use of b3 will lead to spurious conclusions.
Error 2: Interpreting b1 and b2 When Xand Z are Interval Scale Measures
Error 2 occurs when X and Z are measured oninterval scales and investigators attempt tointerpret b1 and b2 in Equation 2. There are twopotential problems with interpreting these statis-tics: variability due to linear transformation and/orconfounding main and moderating effects.
To our knowledge, Schmidt (1973, footnote 4) firstnoted b1 and b2 could vary greatly after lineartransformations of X and Z. If X and Z aremeasured using interval scales, the informationcontained in those measures remains unchangedwhen a constant is added to or subtracted fromthem or they are multiplied or divided by aconstant—all linear transformations of X and Y areequally legitimate and viable. Unfortunately, b1
and b2 in Equation 2 do not stay the same if X andZ are subjected to such changes, although ∆R2
and the test statistics for H0: ∆R2= 0 and H0: b3 =0 are not affected.
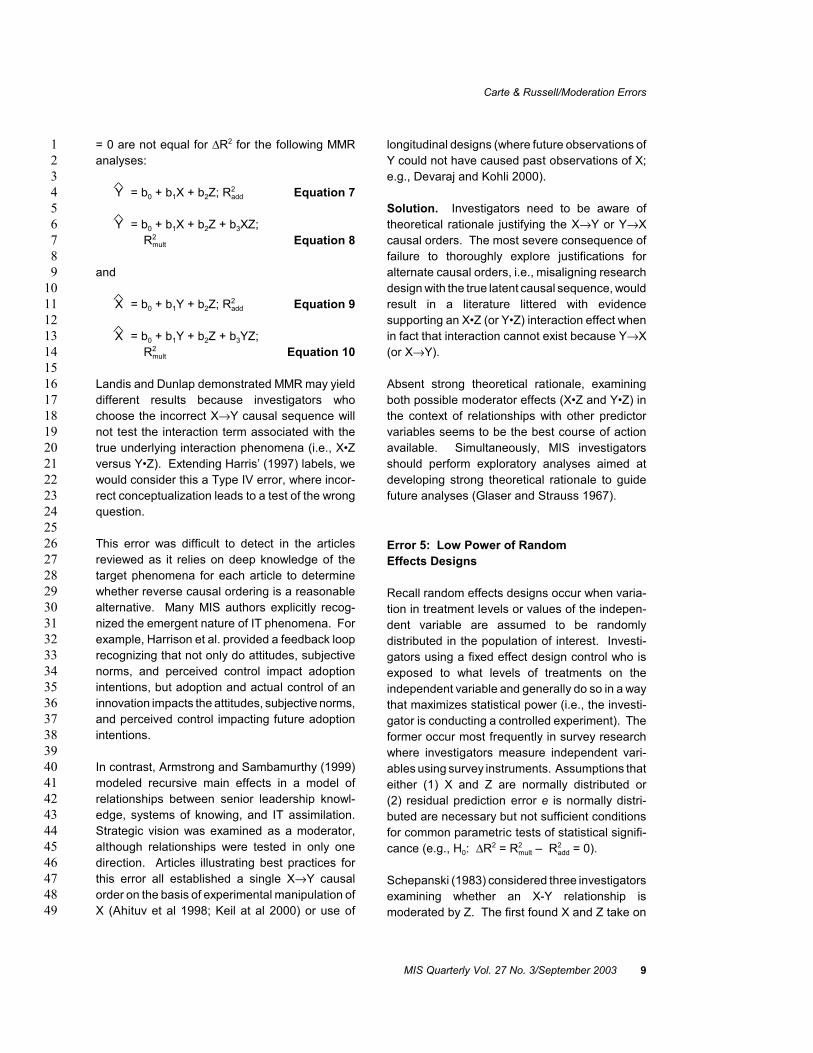
An alternate way of describing this problem iscaptured by Figures 1a and 1b. Both describepath models involving an X→Y relationship that ismoderated by Z. Figure 1b differs in that a directZ→Y relationship is also hypothesized. Figure 1adescribes the model Y = b0 + b1X•Z whileFigure 1b describes the model Y = b0 + b1X + b2Z+ b3X•Z + e (b1 = 0 in Figure 1b). Schmidtshowed it is impossible to differentiate betweenthese models in the presence of interval scalemeasurement. Unfortunately, many examples ofmodels similar to Figure 1b and interpretations ofb1 and b2 appear in applied behavioral research.
4Interested readers may contact the second author formore detail on how multicolinearity affects estimates ofb3 but not tests of H0: ∆R2 =0.

Carte & Russell/Moderation Errors
MIS Quarterly Vol. 27 No. 3/September 2003 7
Z
X Y
Y = X*Z
Z
X Y
Y = X*Z
Z
X Y
Y = X*Z
Z
X Y
Y = X*Z
Z
X Y
Y = Z + X*Z
Z
X Y
Y = Z + X*Z
Z
X Y
Y = Z + X*Z
Z
X Y
Y = Z + X*Z
a1 b
Figure 1. Two Interactive Path Models2345
Fifteen articles in our samples hypothesized main6and moderating effects. Three of these 15 illus-7trate best practices by employing ratio scales8(Ahituv et al. 1998; Banker and Slaughter 2000;9Devaraj and Kohli 2000). In fact, concurrent main10and moderating effects may be theoretically justi-11fied. Error 2 occurs as a shortcoming of traditional12data analysis techniques such as regression and13ANOVA. Five of the 15 articles used subgroup14analysis to avoid the issue addressed here. It15introduced a different concern as the main effects16of these articles were interpreted from analysis17that did not include interaction terms, resulting in18biased estimates in an underspecified model.19
20In one example, Harrison et al. (1997) hypo-21thesized that attitude, subjective norm, and22perceived behavioral control would directly impact23strategic decision to adopt new IT. They also24hypothesized that these relationships would be25moderated by organization size. Both sets of26hypotheses were tested and interpreted using27MMR. As Harrison et al. used interval scales,28main and interaction effects could not simul-29taneously be examined; the main effects they30report are uninterpretable.31
32In a best practice example, Banker and Slaughter33(2000) investigated the main effect of software34structure on enhancement costs, and the moder-35ating effects of software structure of the rela-36tionships between volatility, complexity, and37enhancement costs. They did not commit this38error because the measures employed were ratio39scaled. An additional 11 articles in our sample40
avoided this error by hypothesizing moderatingeffects only, or by interpreting main effects onlyafter moderating effects were found to beinsignificant (i.e., McKeen et al. 1994).
Solution. Unfortunately, the only way to interpretb1 and b2 in Equation 2 is when X and Z aremeasured on ratio scales. Creating ratio scalemeasures of organizational members’ perceptionsrequires advanced psychophysical scaling proce-dures (e.g., Birnbaum 1985, 1989, 1998) andsubstantial pre-study scale development efforts(for an example, see Arnold 1981). When ratioscales are not available, as is the case for manyimportant MIS phenomenon, investigators mustavoid models such as those portrayed inFigure 1b and resist temptations to interpret b1
and b2.
Misalignment of Phenomena andResearch Design
Solutions and problems in the next two categoriesoften depend on the research goal. Steps avail-able when testing strong theory-based moderationpredictions are constrained by the theory’sspecifications. These constraints may contributesubstantial power to investigators (e.g., Bobko1986), although constraints can make tests of atheory virtually impossible (e.g., Podsakoff et al.1995). This is especially true when constructscannot be operationalized at appropriate levels ofmeasurement. More steps are available when

Carte & Russell/Moderation Errors
8 MIS Quarterly Vol. 27 No. 3/September 2003
investigators attempt to build theory from explora-1tory analyses results (Glaser and Strauss 1967).2
3Errors in this category occur when investigators4make basic research design decisions that are5incongruent with questions being asked of the6phenomena under investigation.7
Error 3: Confounding of X•Z with X289
Cohen (1978) demonstrated how a curvilinear10relationship between X and Y is very similar to11conceptualizations of moderation. If moderation12occurs when the relationship of X and Y depends13on the level of Z, a curvilinear X→Y association14suggests the X→Y relationship depends on the15level of X. In a survey of 123 significant MMR16interaction effects reported in the Journal of17Applied Psychology in 1991 and 1992, Cortina18(1993) found multicolinearity (rxz) ranged from 0 to19.68 with an average of .21. Hence, Lubinsky and20Humphrey’s (1990) speculation that significant21moderators may be simply nonlinear X→Y effects22in disguise would seem to be a possibility in those23studies with relatively high multicolinearity (rxz),24although not an excessively common problem.25
26In an MIS illustration, Igbaria et al. (1994) inves-27tigated the moderating role of job involvement on28the relationships between work experiences,29expectations, and attitudinal outcomes for IS per-30sonnel. Previous results suggested job involve-31ment was quadratically related to career stage32(Raelin 1985) and tenure (Wagner 1987). To the33extent that job involvement is highly correlated34with career expectations, X2
JI ≅ XJI • ZCE. Because35of this, the results shown in Table 5 of Igbaria et al36may inaccurately confound moderation (XJI • ZCE)37and nonlinear (X2
JI) effects.3839
Only seven articles in our sample reported corre-40lation matrices without which the likelihood of this41error (in the form of high rxz ) cannot be deter-42mined. In articles reporting correlation matrices,43the rxz correlations ranged from .008 to .88344(weighted-average r = .187). The correlation of45.883 (Banker and Slaughter 2000) suggests this46error may have occurred. No illustration of best47
practices for avoiding this error was found in oursample because no author provided evidence(described below) that the error was not com-mitted. There were, however, several articles thatreported very low rxz correlations (e.g., McKeenand Guimaraes [1997] and McKeen et al. [1994]reported rxz ranging from .008 to .05, indicatingthis error was unlikely).
Solution. Cortina’s proposed solution wouldslightly decrease Equation 3’s statistical power(i.e., the F statistic of Ho: ∆R2 = 0). Decreasedpower would most likely be negligible as it wouldonly involve reducing the F statistic denominatordegrees of freedom by 2. The solution modifiesMMR to a three-step process examining ∆R2 forthe equations 4, 5, and 6:
YÌ
= b0 + b1X + b2Z Equation 4
YÌ
= b0 + b1X + b2Z + b3X•Xa
+ b4Z•Zc Equation 5
YÌ
= b0 + b1X + b2Z + b3X•Xa
+ b4Z•Zc + b5X•Z Equation 6
∆R2 between Equations 5 and 6 constitutes a testof moderation for investigators facing high multi-colinearity (rxz) and possible nonlinear relation-ships between Y and X or Y and Z.
Error 4: Causal Sequencing
This error occurs when the causal order is incor-rectly specified, i.e., confusing X→Y with Y→X.While tests of simple linear relationships betweenX and Y are not affected by which is designatedthe cause and which the effect, this is not true withMMR. Reexamination of moderation’s conceptualdefinitions above reveals that some do not specifyan X→Y or Y→X causal order. Others clearlyspecify a predictor “X” and criterion “Y.”Regardless, tests of whether Z moderates X→Yand Y→X differ both phenomenologically andmethodologically.
Landis and Dunlap (2000) demonstrated Fstatistics calculated to test H0: ∆R2 = R2
mult – R2add
Carte & Russell/Moderation Errors
MIS Quarterly Vol. 27 No. 3/September 2003 9
= 0 are not equal for ∆R2 for the following MMR1analyses:2
3YÌ
= b0 + b1X + b2Z; R2add Equation 74
5YÌ
= b0 + b1X + b2Z + b3XZ;6R2
mult Equation 878
and910
XÌ
= b0 + b1Y + b2Z; R2add Equation 911
12XÌ
= b0 + b1Y + b2Z + b3YZ;13R2
mult Equation 101415
Landis and Dunlap demonstrated MMR may yield16different results because investigators who17choose the incorrect X→Y causal sequence will18not test the interaction term associated with the19true underlying interaction phenomena (i.e., X•Z20versus Y•Z). Extending Harris’ (1997) labels, we21would consider this a Type IV error, where incor-22rect conceptualization leads to a test of the wrong23question.24
25This error was difficult to detect in the articles26reviewed as it relies on deep knowledge of the27target phenomena for each article to determine28whether reverse causal ordering is a reasonable29alternative. Many MIS authors explicitly recog-30nized the emergent nature of IT phenomena. For31example, Harrison et al. provided a feedback loop32recognizing that not only do attitudes, subjective33norms, and perceived control impact adoption34intentions, but adoption and actual control of an35innovation impacts the attitudes, subjective norms,36and perceived control impacting future adoption37intentions.38
39In contrast, Armstrong and Sambamurthy (1999)40modeled recursive main effects in a model of41relationships between senior leadership knowl-42edge, systems of knowing, and IT assimilation.43Strategic vision was examined as a moderator,44although relationships were tested in only one45direction. Articles illustrating best practices for46this error all established a single X→Y causal47order on the basis of experimental manipulation of48X (Ahituv et al 1998; Keil at al 2000) or use of49
longitudinal designs (where future observations ofY could not have caused past observations of X;e.g., Devaraj and Kohli 2000).
Solution. Investigators need to be aware oftheoretical rationale justifying the X→Y or Y→Xcausal orders. The most severe consequence offailure to thoroughly explore justifications foralternate causal orders, i.e., misaligning researchdesign with the true latent causal sequence, wouldresult in a literature littered with evidencesupporting an X•Z (or Y•Z) interaction effect whenin fact that interaction cannot exist because Y→X(or X→Y).
Absent strong theoretical rationale, examiningboth possible moderator effects (X•Z and Y•Z) inthe context of relationships with other predictorvariables seems to be the best course of actionavailable. Simultaneously, MIS investigatorsshould perform exploratory analyses aimed atdeveloping strong theoretical rationale to guidefuture analyses (Glaser and Strauss 1967).
Error 5: Low Power of RandomEffects Designs
Recall random effects designs occur when varia-tion in treatment levels or values of the indepen-dent variable are assumed to be randomlydistributed in the population of interest. Investi-gators using a fixed effect design control who isexposed to what levels of treatments on theindependent variable and generally do so in a waythat maximizes statistical power (i.e., the investi-gator is conducting a controlled experiment). Theformer occur most frequently in survey researchwhere investigators measure independent vari-ables using survey instruments. Assumptions thateither (1) X and Z are normally distributed or(2) residual prediction error e is normally distri-buted are necessary but not sufficient conditionsfor common parametric tests of statistical signifi-cance (e.g., H0: ∆R2 = R2
mult – R2add = 0).
Schepanski (1983) considered three investigatorsexamining whether an X-Y relationship ismoderated by Z. The first found X and Z take on

Carte & Russell/Moderation Errors
10 MIS Quarterly Vol. 27 No. 3/September 2003
F1,80mult(1 - R2 ) (80)
=R2∆F1,80
mult(1 - R2 ) (80)mult(1 - R2 ) (80)=
R2∆R2∆
the values 1, 2, 3, 4, 5, 6, 7, 8, and 9 and a1sample of N = 81 observations was obtained for2every possible X,Z combination. If the true latent3causal process is Y = X•Z and all variables are4measured without error, the MMR effect size is5∆R2 = R2
mult – R2add = .061. Alternatively, the6
second investigator for some bizarre reason7obtains a sample of N = 81 paired X,Z obser-8vations with values (1,9), (2,8), (3,7), (4,6), (5,5),9(6,4), (7,3), (8,2), and (9,1) occurring with equal10frequency (i.e., the off-diagonal cells in a 9 × 911experimental design). In this instance, R2
add = 012and ∆R2 = 1.0. Finally, a third investigator obtains13a sample containing 81 observations drawn from14cells in which Z + X = 9, 10, or 11 (i.e., the off-15diagonal cells in a 9 × 9 experimental design and16immediately adjacent cells). In this instance, ∆R217= .39. These results demonstrate X,Z combina-18tion frequencies directly influence the sample size19needed to reject H0: ∆R2 = 0 when moderation is20present. 21
22Schepanski explained these outcomes in terms of23the power of additive models when data exhibit24conditionally monotone independent → dependent25variable relationships. An additive model will26perfectly explain data in which all observations27exhibit strict dominance, i.e., where one member28of every pair of observations “possess higher29values on one or more independent variables and30equal values” on all other independent variables31(Schepanski 1983, p. 505). The three hypo-32thetical investigators described above obtained33different ∆R2 effect sizes because the data sets34differed in proportion of paired data points35exhibiting strict dominance. At one extreme, the36second investigator’s data set contained no strictly37dominant pairs of observations; none of the obser-38vations exhibited strict dominance relative to any39other observation, and the additive model40exhibited no predictive power (R2
add = 0.00). At the41other extreme, 18 percent of the paired obser-42vations exhibited strict dominance in the third43investigator’s data set.44
45Many articles in our sample reported very small46sample sizes; however, Hardgrave et al.’s (1999)47exploration of prototyping strategy seems parti-48cularly compelling. They surveyed 133 firms in a49
random effects field design about 168 differentprototyping projects and used moderated regres-sion analysis to evaluate 15 hypothesizedmoderator effects. The number of observationsavailable for analysis varied from 91 to 111 (pre-sumably due to missing data) and the inclusion of16 main effects (15 hypothesized moderators andtype of prototype employed) and one interactioneffect consumed 17 degrees of freedom. Hence,F-test of H0: ∆R2 = 0 for the interaction effectsyielded a df range from 1,74 to 1,94. The average∆R2 reported was .0261. Given the largest R2
mult
reported by Hardgrave et al. was R2mult = .131 and
obtaining the critical value at α = .05 of F1,80 = 3.84(i.e., conservatively using the largest df = 111 – 17= 94 reported), solving the formula
for ∆R2 indicates these authors’ analyses at bestwould only have rejected H0: ∆R2 = 0 whenobserved ∆R2 > .0363, which is more than50percent larger than the average ∆R2.
The question remaining is, what ∆R2 shouldHardgrave et al. have expected if true moderationeffects were occurring? If the expected ∆R2 <.0363, then failure to reject H0: ∆R2 = 0 would beexpected as the sample size and observed R2
mult
only permitted detection of moderator effectswhich yield ∆R2 > .0363.
Solution. At least two implications can be drawnfor MIS investigators. First, before initiating astudy in which moderation is hypothesized,investigators should estimate the frequency withwhich X and Z assume different values and fore-cast the expected ∆R2 effect size.5 SolvingEquation 3 for N will find the minimum sample sizeneeded to detect any true interaction effect.
5Note any estimate of effect size will have to take intoaccount reliability of X,Z and the XZ product term usingBusemeyer and Jones’ (1983) correction, which isdescribed in the section discussing Error 8.

Carte & Russell/Moderation Errors
MIS Quarterly Vol. 27 No. 3/September 2003 11
As part of a program of research examining1prototyping, Hardgrave et al. should count the2relative proportion of strictly dominant paired3observations in their data. Given most phenom-4ena were measured using seven-point Likert5scales, Hardgrave and his colleagues would then6generate paired observations with this particular7proportion of strictly dominant pairs in a Monte8Carlo simulation of a 3 × 7 design (three types of9prototype strategy by seven possible levels of10each moderator). The ∆R2 obtained from this11simulation (corrected for measurement error as12described in the solution to Error 8) would then be13plugged into Equation 3 along with the average14R2
mult reported in the original Hardgrave et al. effort15and the critical value of F to determine the16minimum sample size needed to detect this17expected ∆R2 effect size. 18
19Second, authors should choose X,Z combinations20that maximize statistical power (P{reject H0} when21H0 is false for tests of H0: ∆R2 = 0). McClelland22and Judd (1993) demonstrated data sets23containing observations drawn only from X,Z24combinations of (1,1), (1,9), (9,1), and (9,9) in25Schepanski’s example maximized statistical26power. This suggests investigators must take27special care in trimming any outlier observations28from the data. Given McClelland and Judd’s29demonstrated observations drawn from extreme30X,Z combinations maximize ∆R2, investigators31who incorrectly label outlier observations as32having been drawn from some population other33than the population of interest are effectively34decreasing expected ∆R2 effect size and35increasing the sample size required to reject H0:36∆R2 = 0.37
38Finally, careful readers will note a subtle39distinction in our discussion of Error 5, i.e., the40distinction between model testing versus maxi-41mizing Y prediction accuracy (Birnbaum 1973,421974). The percent of strictly dominant paired43cells in a study’s design will determine both the44incremental increase in prediction accuracy by the45multiplicative model and whether the additive46model is rejected (Aguinis 1995). As noted by47Schepanski, when the true latent model is multi-48plicative, knowledge of that fact will add minimally49
to prediction accuracy in a population containingmostly strictly dominant pairs of observations(e.g., an additional 6.1 percent of the variance forthe first investigator above). However, in thosecases in which the additive and multiplicativemodels yield different Y
Ìi estimates, Y
Ìaddi will be
very different from YÌ
multi and prediction error for theadditive model (Y
Ìaddi – Yi) will be much larger than
for the multiplicative model (YÌ
multi – Yi). Hence,while incremental variance explained may beminimal in some populations of X, Z, and Yobservations, the investigator (the first investigatorin the examples above) risks making a smallnumber of very severe prediction errors whenembracing an incorrect additive model simplybecause it is more parsimonious and explains thevast majority of Y variance. Investigators aligningtheir research designs with the phenomenon ofinterest must weigh both the relative frequencyand severity of errors before endorsing the simpleradditive model.
Measurement and Scaling Issues
Errors 6, 7, 8, and 9 occur due to issues involvingscale coarseness, nonlinear transformations,measurement error, and use of different subgroupmeasurement models.
Error 6: Dependent Variable ScaleIs Too Coarse
When X and Z take on multiple possible values, atrue model Y = X•Z will yield a latent dependentoutcome Y that often contains more possiblelevels than investigators used in measuring Y.For example, if X and Z are phenomena measuredon five-point interval scales, Y could have at leastseven different values (e.g., if X and Z range from–2 to +2, Y = X•Z takes on the values of –4, –2,–1, 0, 1, 2, 4) and at most 25 different values.Subjects faced with reporting Y responses on afive-point Likert scale must somehow reduce theirlatent 7- to 25-point dependent Y response intothe relatively coarse five-point overt responseformat.

Carte & Russell/Moderation Errors
12 MIS Quarterly Vol. 27 No. 3/September 2003
Russell and Bobko (1992) found subjects in this1exact scenario using the model Y = X•Z and facing2a 150-point overt response scale yielded a ∆R23MMR effect size that was 97 percent larger than4subjects faced with placing overt Y responses on5a traditional five-point Likert scale. It is important6to place this result in context of Likert’s (1932) oft7replicated finding that increasing the number of8response categories beyond five to seven does9not yield substantial gains in observed reliability10(cf. Cicchetti et al. 1985). While reliability may11not change, construct validity of the dependent Y12measure may. Russell and Bobko’s findings sug-13gest investigators using Likert scales that are too14coarse relative to latent Y construct domains will15dilute construct validity of their Y operationali-16zations and attenuate ability to detect true17moderation relationships. MIS investigators who18do not determine the number of meaningfully19different levels of Y occurring from Y = X•Z run the20risk of severely attenuating observed ∆R2.21
22In all, 20 articles in our sample used dependent23measures that were too coarsely scaled (ranging24from five- to ten-point Likert scales). In one poten-25tial example of this error, Agarwal and Prasad26(1999) reported tests of three interactions that27were theoretically related to intentions to use IT28innovations: perceived usefulness × personal29innovation, perceived ease of use × personal30innovation, and compatibility × personal innova-31tion. Measures obtained on an individual dif-32ference characteristic, three perceptual variables,33and the dependent variable all used seven-point34Likert item response scales. Hence, subjects35were potentially faced with portraying a latent 7 ×367 = 49 level latent dependent response on a37seven-point scale used to measure intention to38use an IT innovation. Agarwal and Prasad’s MMR39analysis found only a compatibility × personal40innovation effect statistically significant. Russell41and Bobko’s findings suggest a 49-point scale to42measure intention to use IT innovations could43have caused Agarwal and Prasad to enjoy at least44a 97 percent increase in effect size for the45perceived usefulness × personal innovation and46perceived ease of use × personal innovation47effects if these effects were actually present.48
Illustrating a potential best practice, Keil et al.investigated the moderating effect of nationalculture on relationships between risk propensity,level of sunk cost, and risk perception. In theirstudy, risk perception was operationalized using a100-point scale.
Solution. The solution requires investigators toidentify a priori the expected number of distinct Xand Z values (i.e., #x, #Y) that might occur andselect a Y measurement scale portraying all#x • #Y possible values. Arnold (1981) reportedpilot efforts that might be used to establish #x and#Y in the first field test to unambiguously supportVroom’s (1964) original multiplicative expectancytheory formulation. Cautious investigator willoperationalize Y as a continuous variable (i.e.,one that can take on an infinite number of values).
Error 7: Nonlinear MonotonicTransformations on Y, X, and Z
A number of assumptions must be met to useEquation 3 to test H0: ∆R2 = 0. In a randomeffects design, one must assume X and Z aredistributed multivariate normal or that predictionerror (e) is normal with a constant standarddeviation across all predicted Y values (commonlyreferred to as homoskedasticity). A number oftransformations are available to convert observa-tions in such a way that they less severely violateone or more of these assumptions. For example,statistical texts routinely reference log transfor-mations to make a positively skewed distributionappear more bell shaped or normal (Winer 1974).Other common nonlinear transformations includeuse of arc-sine transformations on percentagedata, square roots, and Fischer’s z transformationon Pearson product moment correlations.6
Theoretical rationale exists for nonlinear intervalscale transformations in a number of arenas (e.g.,Stevens 1958). We are unaware of any theoriesor models in applied management research that
6See Bartlett (1947) for a discussion of log, arc-sine, andsquare root transformations.

Carte & Russell/Moderation Errors
MIS Quarterly Vol. 27 No. 3/September 2003 13
provide strong theoretical rationale for nonlinear1interval scale transformations.7 Statistical ele-2gance (i.e., meeting parametric assumptions)3appears to be the major purpose of these trans-4formations. Unfortunately, severe unintended5consequences can occur.6
7Specifically, Busemeyer and Jones (1983)8demonstrated “when it is theoretically permissible9to monotonically transform the criterion variable,10then hierarchical regression analysis cannot yield11an interpretable test of the multiplicative versus12additive structural model” (p. 555). They provided13examples showing how data derived from a truly14additive model (e.g.,Y
Ì = b0 + b1X + b2Z) can be15
monotonically transformed in such a way that H0:16∆R2 = 0 will be rejected and how data derived from17a truly multiplicative model can be monotonically18transformed in such a way that H0: ∆R2 = 0 will19not be rejected. MMR results do not provide a20reliable index of moderation effects when Y has21been subjected to monotonic transformation.22Birnbaum (1973, 1974) demonstrated the same23problems occur when X and Z are subjected to24nonlinear, monotonic transformations.25
26Only one article in our sample reported a non-27linear transformation. Harrison et al. investigated28the moderating effect of organizational size on the29relationship between attitudes, subjective norms,30perceived control, and decisions to adopt. How-31ever, they performed a logarithmic transformation32of their organizational size variable. Analysis pro-33duced a significant ∆R2 and they concluded34organizational size does moderate the relationship35between their independent and dependent vari-36ables. Unfortunately, as noted by the Busemeyer37and Jones quote above, Harrison et al.’s signi-38ficant ∆R2 is not interpretable: no conclusion can39be drawn from their analyses about organizational40size and moderation.41
42Solution. Russell and Dean (2000) recently43applied bootstrapping procedures to estimate44confidence intervals around ∆R2 without trans-45
forming the dependent variable or making para-metric assumptions. Using examples involvingpositively skewed dependent variables drawn fromcompensation research, Russell and Dean foundthe preferred monotonic transformation (i.e., a logtransformation) severely decreased estimates oftrue moderator effects using moderated regres-sion procedures in a Monte Carlo simulation.MMR ∆R2 moderator effect sizes were sub-stantially better estimates of the true latentmoderator effect (i.e., larger by a multiple of 2.6 to534) when estimated using a simple percentilebootstrap procedure in the original, untransformed(positively skewed) data.8
Conclusions regarding the presence or absence ofa true moderator effect using simple bootstrapprocedures were unaffected by violations of para-metric assumptions in the original, positivelyskewed data. Conclusions when moderatedregression analysis was performed on a log Yseverely increased frequency of Type II errors.Hence, Harrison et al. could have arrived at aninterpretable test of H0: ∆R2 = 0 if they hadfollowed this bootstrap procedure. It remains tobe seen whether bootstrap procedures for esti-mating ∆R2 confidence intervals exhibit the samepower in circumstances where characteristics ofthe Y distribution suggest a monotonic transfor-mation other than a log Y. Regardless, appliedbehavioral science investigators should never useMMR when Y has been subjected to monotonictransformations absent some strong theoretical(i.e., not statistical) justification.
Error 8: Influence of MeasurementError on X•Z
Well-trained MIS investigators conducting pro-grammatic research usually estimate the samplesize necessary to detect the effect of interest (i.e.,reject H0 at p < .05). Using a 5 × 5 experimentaldesign to gather Y observations from subjectswho were known to generate them from a Y = X•Z
7The only exception we are familiar with is the notion ofmarginal decreasing utility of money from labor econo-mics.
8Note confidence intervals for parameters estimatedusing PLS are estimated using bootstrap procedures.

Carte & Russell/Moderation Errors
14 MIS Quarterly Vol. 27 No. 3/September 2003
F1,N - 3mult(1 - R2 ) (N - 3)
=R2∆F1,N - 3
mult(1 - R2 ) (N - 3)mult(1 - R2 ) (N - 3)=
R2∆R2∆
model, Russell and Bobko found the average ∆R21= .03 when a five-point Likert scale was used to2measure Y. Assuming ∆R2 = .03, a sample of N =396 would have been needed to reject H0: ∆R2 = 0,4where N = 96 is derived by solving Equation 35(reprinted below) for N: 6
7
where ∆R2 = .03,8R2
mult = .25, and9F1,N - 3 = 3.8410
11The ∆R2 used in this example already reflects12measurement error, i.e., ∆R2 = .030 was Russell13and Bobko’s observed ∆R2 derived using Y14measures that contained measurement error. MIS15investigators examining moderation phenomena16for which estimates of ∆R2 have not been reported17in the literature will have to estimate ∆R2 by18simulating X and Z distributions, using them to19create Y = X•Z, and finally deriving ∆R2 and the20attendant N needed to detect it. However, ∆R221obtained from simulation data must be attenuated22for measurement error in order to accurately23approximate E(∆R2), and hence the estimate of N24needed to reject H0: ∆R2 = 0.25
26Most of the reliabilities reported in our sample fall27above Nunnally’s (1967) α >.70 rule of thumb,28although seven do not. For example, McKeen et29al. (1994) examined the relationship between user30participation and user satisfaction, task com-31plexity, system complexity, user influence, and32user-developer communication as moderators.33Reliabilities for system complexity (α = .65) and34user-developer communications (α = .54) fell35below the .70. Further, the authors rejected H0:36∆R2 = 0 for two (task complexity and system37complexity). It is possible the two insignificant38findings were due to a reduction in observed ∆R239due to measurement error.40
41Boudreau et al. (2001) examined MIS research42from 1997 through 1999 and concluded at least 2043percent (depending on the journal) of published44empirical work failed to report reliability measures.45Articles in our sample using perceptual measures46
all reported reliabilities (in varying degrees ofdetail): the average sample size for those studieswas N
_ = 255.2 and the weighted average
reliability (weighted by sample size) across allreliabilities reported was α
_ = .824. Authors and
reviewers should insure reliabilities are reported toassist future assessments of measurement error’simpact on required sample sizes.
Solution. Busemeyer and Jones also developeda method of correcting expected MMR effect sizefor measurement error in X and Z. ρX•Z = 1.00 ifMIS investigators use fixed effects designs inwhich there is no measurement error in X or Z.Alternatively, the MIS investigator using a randomeffects design and questionnaire measures willlikely have operationalizations of X and Z (i.e., Xand Z scale scores) containing measurementerror. The MIS investigator can simulate X and Zobservations to (1) estimate expected interactioneffect size (∆R2) in the absence of measurementerror (described in solutions to Errors 5 and 7),(2) plug X and Z reliability estimates obtained fromthe literature into Equation 11, (3) plug that resultinto Equation 12 to estimate the expected ∆R2
obtained under actual research conditions inwhich measurement error is present.
Equation 11=(ρx • ρz)
1 + ρ2x, z
ρx • z =
(ρx • ρz)
1 + ρ2x, z
1 + ρ2x, z
ρx • z
ρx • z
=ρx • z[b2 • s2 ]
∆ρ2 3 xz
s2y
=ρx • z[b2 • s2 ]
∆ρ2 3 xz
s2y Equation 12
Where ρX•Z = reliability of the X•Z product termρX = reliability of Xρz = reliability of ZρX,Z = simple correlation between X
and Zb3 = regression coefficient for the pro-
duct term in Equation 2s2
xz = variance of the X•Z product terms2
y = variance of the dependentvariable Y

Carte & Russell/Moderation Errors
MIS Quarterly Vol. 27 No. 3/September 2003 15
Using this expected ∆R2 estimate in Equation 31will yield a more accurate estimate of the sample2size needed to reject H0: ∆R2 = 0 if in fact Y =3X•Z.4
5Finally, Chin et al. (1996) demonstrated how PLS6derives estimates of regression coefficients after7correcting for X and Z internal consistency reli-8ability estimates. We would expect PLS results to9converge with MMR results that have been10corrected for unreliability using Busemeyer and11Jones’ formula if initial estimates of X and Z12reliabilities are the same.13
Error 9: Gamma Differences in PLS1415
A final measurement issue is unique to the use of16PLS. The PLS technique differs from MMR in that17it provides for concurrent estimation of the struc-18tural and measurement models. In doing so, it19derives factor scores (by summing the products of20PCA factor analysis loadings and subjects’ item21responses) as best estimates of latent constructs.22
23Six studies in our sample used PLS to test24moderation hypotheses in which the moderator Z25was a dummy coded variable capturing member-26ship in one of two or more groups. Further, three27out of the five moderation studies published in28MIS Quarterly and Information Systems Research29in 2000 used this method (e.g., Keil et al. 2000;30Venkatesh 2000; Venkatesh and Morris 2000).31
32Tests for moderation using PLS require separating33samples into groups where membership is based34on some level of the hypothesized moderator vari-35able. Separate analyses are run for each group36and path coefficients are generated for each sub-37sample. Path coefficients are then compared to38determine whether the relationship between some39set of predictors X and criteria Y depended on sub-40group membership Z. In a recent example, Keil et41al. derived separate PLS estimates for latent struc-42tural relationships between risk propensity, risk43perceptions, sunk costs, and project escalation for44three samples drawn from different cultures. Com-45paring path coefficients across subsamples indi-46cated culture moderated the relationship between47risk propensity and risk perception.48
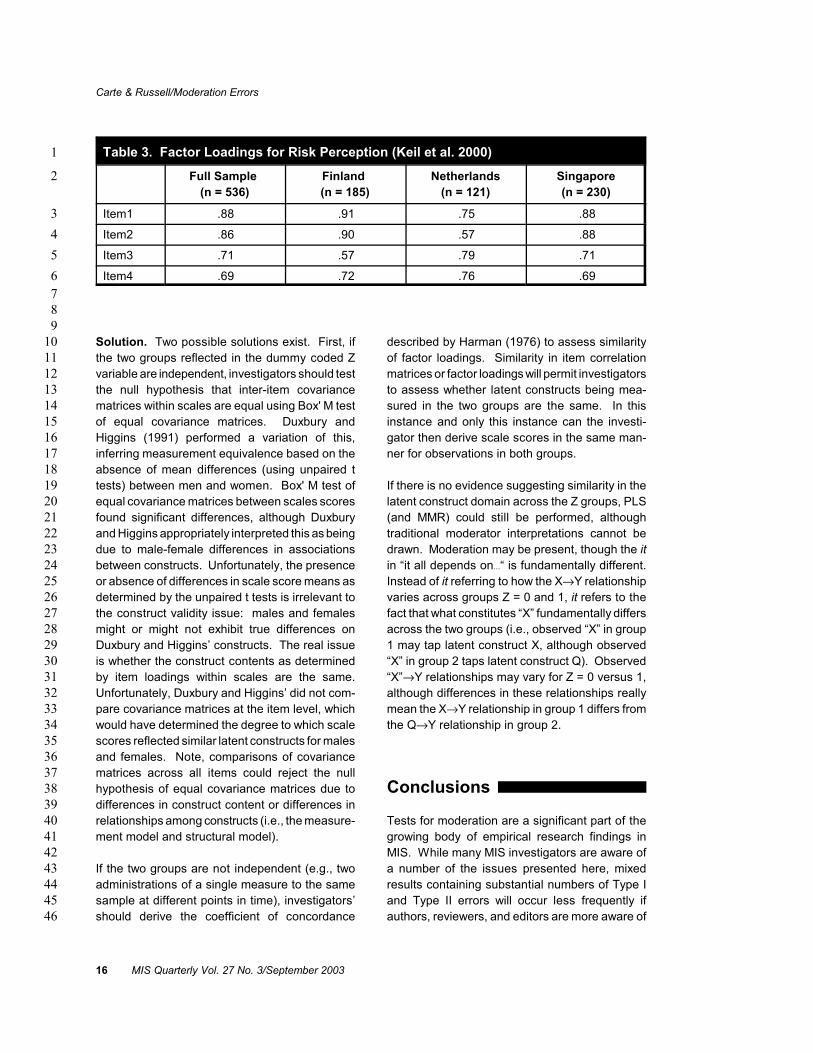
The comparison of the same path coefficient in twosubsamples (Chow 1960) is computationally thesame as rejecting H0: ∆R2 = 0 in an MMR analysisin which X is some continuous predictor and Z is adummy coded nominal variable (Bobko 1995, pp.228-229). Problems occur when PLS derives newfactor loadings and weights in separate analysesconducted in each subsample. The construct-levelscores are subsequently estimated using differentitem weights in each subsample. For example, Kielet al. compared path coefficients in models inSingapore, Finland, and the Netherlands. Risk per-ception was a composite of four questions. Kielet al. did not report item weights, although theirTable 3 shows that the factor loadings for the riskperception items were different in each subsample.At the extreme, item 2 loadings varied from .57 to.90. Loading variability suggests PLS also varieditem weights, causing estimates of the riskperception construct to be created from differentweighted combinations of the four items in eachsubsample and influencing statistical tests fordifferences in path coefficients. Simply stated, riskperception scores derived in this manner have sub-stantially different meanings for observations drawnfrom Finland, the Netherlands, and Singapore.Path coefficients may differ significantly acrosscountries when risk perception is constructed froma different weighted sum of the four items and notdiffer significantly when risk perception is a simplesum of the four item responses (or vice versa).
This is one of many examples in MIS researchusing PLS to examine differences in path coeffi-cients across groups. In these instances, PLSconfounds true differences in path coefficients withdifferences in latent construct composition (i.e.,different factor loadings), preventing any inter-pretations of PLS results bearing on the hypothe-sized moderation effect. Interested readers shouldsee discussions by Rice and Contractor (1990),Schmitt (1982), and Schmitt et al. (1984) of gammadifferences in latent factor structure between twoadministrations of the same instrument.9
9Alpha change occurs when some true change hasoccurred between administrations of some measure.Beta change occurs when no true change occurred,although a difference in observed scores occurs due toa change in scaling (i.e., commitment previously viewedas a “3” on a Likert scale is now viewed as “3.5”).
Carte & Russell/Moderation Errors
16 MIS Quarterly Vol. 27 No. 3/September 2003
Table 3. Factor Loadings for Risk Perception (Keil et al. 2000)1
2 Full Sample (n = 536)
Finland (n = 185)
Netherlands(n = 121)
Singapore(n = 230)
Item13 .88 .91 .75 .88
Item24 .86 .90 .57 .88
Item35 .71 .57 .79 .71
Item46 .69 .72 .76 .69789
Solution. Two possible solutions exist. First, if10the two groups reflected in the dummy coded Z11variable are independent, investigators should test12the null hypothesis that inter-item covariance13matrices within scales are equal using Box' M test14of equal covariance matrices. Duxbury and15Higgins (1991) performed a variation of this,16inferring measurement equivalence based on the17absence of mean differences (using unpaired t18tests) between men and women. Box' M test of19equal covariance matrices between scales scores20found significant differences, although Duxbury21and Higgins appropriately interpreted this as being22due to male-female differences in associations23between constructs. Unfortunately, the presence24or absence of differences in scale score means as25determined by the unpaired t tests is irrelevant to26the construct validity issue: males and females27might or might not exhibit true differences on28Duxbury and Higgins’ constructs. The real issue29is whether the construct contents as determined30by item loadings within scales are the same.31Unfortunately, Duxbury and Higgins’ did not com-32pare covariance matrices at the item level, which33would have determined the degree to which scale34scores reflected similar latent constructs for males35and females. Note, comparisons of covariance36matrices across all items could reject the null37hypothesis of equal covariance matrices due to38differences in construct content or differences in39relationships among constructs (i.e., the measure-40ment model and structural model). 41
42If the two groups are not independent (e.g., two43administrations of a single measure to the same44sample at different points in time), investigators’45should derive the coefficient of concordance46
described by Harman (1976) to assess similarityof factor loadings. Similarity in item correlationmatrices or factor loadings will permit investigatorsto assess whether latent constructs being mea-sured in the two groups are the same. In thisinstance and only this instance can the investi-gator then derive scale scores in the same man-ner for observations in both groups.
If there is no evidence suggesting similarity in thelatent construct domain across the Z groups, PLS(and MMR) could still be performed, althoughtraditional moderator interpretations cannot bedrawn. Moderation may be present, though the itin “it all depends onÿ“ is fundamentally different.Instead of it referring to how the X→Y relationshipvaries across groups Z = 0 and 1, it refers to thefact that what constitutes “X” fundamentally differsacross the two groups (i.e., observed “X” in group1 may tap latent construct X, although observed“X” in group 2 taps latent construct Q). Observed“X”→Y relationships may vary for Z = 0 versus 1,although differences in these relationships reallymean the X→Y relationship in group 1 differs fromthe Q→Y relationship in group 2.
Conclusions
Tests for moderation are a significant part of thegrowing body of empirical research findings inMIS. While many MIS investigators are aware ofa number of the issues presented here, mixedresults containing substantial numbers of Type Iand Type II errors will occur less frequently ifauthors, reviewers, and editors are more aware of

Carte & Russell/Moderation Errors
MIS Quarterly Vol. 27 No. 3/September 2003 17
Table 4. Guidelines for Authors and Evaluators1
Error2 Advice to Authors Advice to Evaluators Result
3 Authors should take care todescribe the type of modera-tion they are hypothesizing. Specifically authors need tobe certain whether it is thestrength or the nature of theX→Y relationship that de-pends on the moderator vari-able (Z) and then match theanalysis method to thisconceptual definition.
Where authors are interestedin differences in the strengthof the X→Z relationshipdepending on levels of Z, theissues addressed in thismanuscript are all relevant.
Matching analysis method tothe correct hypothesizedinteractions avoids Type IVerrors where incorrectconceptualization leads to atest of the wrong question.
14 Report effect size in the formof ∆R2 or an equivalentmeasure (such as η2).
Without ∆R2 (or an equivalentmeasure) no conclusions canbe drawn about effect size.
This is important in helpingreaders understand thecontribution of the study inhand but also in helping MISresearchers be more awareof the overall role moderationplays in understanding MISissues.
25 Interpret main effects onlywhen moderating effects areinsignificant.
No conclusions can be drawnabout main effects in thepresence of moderatingeffects.
Both Type I and Type IIerrors can be avoided.
36 Report correlation matrix.Report application ofequations 4-6 to partial outany X2 effects when X and Zare highly correlated.
Failure to partial out X2
effects could cause re-searchers to conclude amoderation effect existswhen in fact it is a nonlinearrelationship between X and Yin disguise. This is espe-cially a concern when X andZ are highly correlated.
Type I errors can be avoided.
47 Report evidence to clearlyestablish causal ordering orresults from investigatingboth X→Y and Y→X.
Authors who fail to clearlyestablish causal order maybe testing the wrongquestion. The ordering canbe established theoreticallyor by research design.
Clearly establishing causalorder (or examining effects inboth causal sequences)avoids Type IV errors, thepotential error of testing thewrong questions.
58 Report power analysis andneeded sample size.
In the case of insignificantfindings, evaluate whether ornot the sample size issufficient to find moderatingeffects when they arepresent.
Type II errors can beavoided.

Carte & Russell/Moderation Errors
18 MIS Quarterly Vol. 27 No. 3/September 2003
Table 4. Guidelines for Authors and Evaluators (Continued)1
Error2 Advice to Authors Advice to Evaluators Result
63 Report all scales. The scale of the dependentmeasure should reflect theproduct of the independentand moderating variables.
Type II errors can beavoided.
74 Report all transformations,nature of transformation, andrationale.
Nonlinear transformations ofpredictor, criterion, ormoderator variables makethe comparison ofmultiplicative and additivemodels uninterpretable.
Both Type I and Type IIerrors can be avoided.
85 Report scale reliabilities. Low reliabilities canattenuate ∆R2 .
Type II errors can beavoided.
96 Report item weights whenusing PLS. Also, report Box'M and/or coefficient ofconcordance.
Subgroups cannot be com-pared without evidence thatthey do not vary significantlyin construct score weighting.
Type I errors can be avoided.
789
the nine errors and solutions described above.10Importantly, several of these errors can be11avoided only if authors follow and editors enforce12certain reporting standards. We provide reporting13guidelines and advice for evaluators in Table 4.14This table also summarizes the consequences of15these errors (either in the form of erroneously16rejecting the null hypothesis, erroneously ac-17cepting the null hypothesis, or failing to test the18correct question). This is important to note19because there is a subtle but important distinction.20Errors 2, 3, 7, and 9 can result in Type I error (i.e.,21false positive results) and consequently results22derived from studies having committed these23errors are potentially invalid. In contrast, studies24committing errors 5, 6, or 8 may be committing25Type II errors (i.e., false negative results) when26moderation is present. Error 4 can result in the27wrong question being investigated, leading to28Type I or Type II errors. 29
30For researchers beginning a new study, the mes-31sage is clear. Errors 2, 3, 4, 7, and 9 must be32avoided. Further, errors 5, 6, and 8 should be33avoided. If they cannot be avoided (for example,34the researcher has calculated the required sample35
size and it is unattainable), then the researchershould be aware the effort is risky: the likelihoodof detecting the true moderation effect is very low.Error 1 may result in Type I or Type II errors, andits reporting directly effects our ability to accu-mulate findings. This error can and should alwaysbe avoided.
While some of these errors have been made fordecades in applied behavioral science research,the most recent manifestation occurred with theadvent and increasing popularity of PLS appli-cations in MIS research. It was not our intentionto imply PLS analysis is inappropriate. Use ofPLS when fundamental differences in a latentconstruct content exist between groups can leadto severe misinterpretations regarding the pre-sence or form of any moderator relationships.
In sum, researchers can lower the cost of andincrease the speed with which new MIS knowl-edge is generated by avoiding the problemsdescribed above. MIS researchers are forced tomake decisions balancing study generalizabilityagainst the control exercised over researchenvironments, i.e., to balance the relevance of
Carte & Russell/Moderation Errors
MIS Quarterly Vol. 27 No. 3/September 2003 19
studies against the rigor with which they are con-1ducted. Studies involving tests of moderation will2be more powerful and rigorous when the nine3errors reviewed above are minimized. Investigator4decisions about which statistics to report, how to5interpret them, designs and analysis techniques to6apply, and how to operationalize constructs of7interest in the search for moderation effects8directly influence the accuracy of subsequent9results and conclusions drawn.10
Acknowledgements1112
Comments by Laku Chidambaram, Wynne Chin,13Carol Saunders, Jane Webster, and Bob Zmud on14an earlier version of this paper are greatly appre-15ciated. Order of authorship is alphabetical and16reflects the authors’ equal contributions to the17study.18
References1920
Agarwal, R., and Prasad, J. “A Conceptual and21Operational Definition of Personal Innovative-22ness in the Domain of Information23Ttechnology,” Information Systems Research24(9:2), 1998, pp. 204-215.25
Aguinis, H. “Statistical Power Problems in26Multiple Moderated Regression in Management27Research,” Journal of Management (21:6),281995, pp. 1141-1158.29
Ahituv, N., Igbaria, M., and Sella, A. “The Effects30of Time Pressure and Completes of Information31on Decision Making,” Journal of Management32Information Systems (15:2), 1998, pp. 153-172.33
Aiken, L. S., and West, S. G. Multiple Regres-34sion: Testing and Interpreting Interactions,35Sage Publications, Newberry Park, CA, 1996.36
Armstrong, C. P., and Sambamurthy, V. “Informa-37tion Technology Assimilation in Firms: The38Influence of Senior Leadership and IT39Infrastructures,” Information Systems Research40(10:4), 1999, pp. 304-327.41
Arnold, H. J. “Moderator Variables: A Clarifica-42tion of Conceptual, Analytic, and Psychometric43
Issues,” Organizational Behavior and HumanPerformance (29:2), 1982, pp. 143-174.
Arnold, H. J. “Test Moderator Variable Hypothe-sis: A Reply to Stone and Hollenbeck,” Organi-zational Behavior and Human Performance(34), 1984, pp. 214-224.
Arnold, H. J. “A Test of the Multiplicative Hypo-thesis of Expectancy Valence Theories of WorkMotivation,” Academy of Management Journal,(24) 1981, pp. 128-141.
Banerjee, D., Cronan, T. P., Jones, T. W.“Modeling IT Ethics: A Study of SituationalEthics,” MIS Quarterly (22:1), 1998, pp. 31-60.
Banker, R. D., and Slaughter, S. A. “The Moder-ating Effects of Structure on Volatility and Com-plexity in Software Enhancement,” InformationSystems Research (11:3), 2000, pp. 219-240.
Baron, R. M., and Kenny, D. A. “The Moderator-Mediator Variable Distinction in Social Psycho-logy Research: Conceptual, Strategic, and Sta-tistical Considerations,” Journal of Personalityand Social Psychology (51:6), 1986, pp. 1173-1182.
Baroudi, J. J., and Orlikowski, W. J. “The Prob-lem of Statistical Power in MIS Research,” MISQuarterly (13:1), 1989, pp. 87-106.
Bartlett, M. S. “The Use of Transformations,”Biometrics (3), 1947, pp. 22-38.
Birnbaum, M. H. “The Devil Rides Again: Cor-relation as an Index of Fit,” PsychologicalBulletin (79), 1973, pp. 239-242.
Birnbaum, M. H. Measurement, Judgement, andDecision Making, Academic Press, San Diego,CA, 1998.
Birnbaum, M. H. “Relationships Among Models ofSalary Bbias,” American Psychologist (40),1985, pp. 862-866.
Birnbaum, M. H. “Reply to the Devil’s Advocates:Don’t Confound Model Testing with Measure-ment,” Psychological Bulletin (81), 1974, pp.854-859.
Birnbaum, M. H. “To Resolve Fechner vs.Stevens: Settle the Dispute Concerning‘Ratios’ and ‘Differences,’” Behavioral andBrain Sciences (12), 1989, pp. 270-271.
Bobko, P. Correlation and Regression: Principlesand Applications of Industrial/OrganizationalPsychology and Management. McGraw-HillInc., New York, 1995.

Carte & Russell/Moderation Errors
20 MIS Quarterly Vol. 27 No. 3/September 2003
Bobko, P. “A Solution to Some Dilemmas When1Testing Hypotheses About Ordinal Inter-2actions,” Journal of Applied Psychology (71),31986, pp. 323-326.4
Boudreau, M. C., Gefen, D., and Straub, D. W.5“Validation in Information Systems Research:6A State-of-the-Art Assessment,” MIS Quarterly7(25:1), 2001, pp. 1-16.8
Busemeyer, J. R., and Jones, J. E. “Analysis of9Multiplicative Combination Rules When the10Causal Variables Are Measured with Error,”11Psychological Bulletin (93), 1983, pp. 549-562.12
Chin, W. W., Marcolin, B. L., and Newsted, P. R.13“A Partial Least Squares Latent Variable14Modeling Approach for Measuring Interaction15Effects: Results from a Monet Carlo Simulation16Study and Voice Mail Emotion/Adoption Study,”17in Proceedings of the Seventeenth International18Conference on Information Systems, J. I.19DeGross, S. Jarvenpaa, and A. Srinivasan20(eds.), Cleveland, OH, 1996, pp. 21-41.21
Choe, J. M. “The Relationships Among Perfor-22mance of Accounting Information Systems,23Influence Factors, and Evolution Level of Infor-24mation Systems” Journal of Management25Information Systems (12:4), 1996, pp. 215-239.26
Chow, G. “Test of Equality between Sets of Coef-27ficients in Two Linear Regressions,” Econo-28metrica (28:3), 1960, pp. 591-604.29
Cicchetti, D. V., Showalter, D., and Tyrer, P. J.30“The Effect of Number of Rating Scale Cate-31gories on Levels of Interrater Reliability: A32Monte Carlo Investigation,” Applied Psycho-33logical Measurement (9), 1985, pp. 31-36.34
Cohen, J. “Partial Products Are Interactions µ35Partial Powers Are Curve Components,” Psych-36ological Bulletin (85), 1978, pp. 858-866.37
Cohen, J., and Cohen, P. Applied Multiple38Regression/Correlation Analysis for the Beha-39vioral Sciences (2nd ed.), Lawrence Erlbaum,40Hillsdale, NJ, 1983.41
Cortina, J. M. “Interaction, Nonlinearity, and Multi-42colinearity: Implications for Multiple Regres-43sion,” Journal of Management (19), 1993, pp.44915-922.45
Devaraj, S., and Kohli, R. “Information Techno-46logy Payoff in the Health-Care Industry: A47Longitudinal Study,” Journal of Management48Information Systems (16:4), 2000, pp. 41-67.49
Duxbury, L. E., and Higgins, C. A. “Gender Dif-ferences in Work-Family Conflict,” Journal ofApplied Psychology (76:1), 1991, pp. 60-74.
Duxbury, L. E., Higgins, C. A., and Mills, S.“After-Hours Telecommuting and Work FamilyConflict: A Comparative Analysis,” InformationSystems Research (3:2), 1992, pp 173-190.
Fritz, M. B. W., Yarasimhan, S., and Rhee, H.-S.“Communications and Coordinations on theVirtual Office” Journal of Management Infor-mation Systems (14:4), 1998, pp. 7-28.
Gefen, D., Straub, D. W., and Boudreau, M. C.“Structural Equation Modeling and Regression:Guidelines for Research Practice,” Communi-cations of the AIS (1:7), 2000, pp. 1-78.
Glaser, B. G., and Strauss, A. L. The Discovery ofGrounded Theory: Strategies for QualitativeResearch, Aldine Publishing, New York, 1967.
Grover, V., Cheon, M. J., and Teng, J. T. C.“The Effect of Service Quality and Partnershipon the Outsourcing of Information SystemsFunctions,” Journal of Management InformationSystems (12:4), 1996, pp. 89-116.
Hardgrave, B. C., Wilson, R. L., and Eastman, K.“Toward a Contingency Model for Selecting anInformation System Prototyping Strategy,” Jour-nal of Management Information Systems (16:2),1999, pp. 113-136.
Harman, H. H. Modern Factor Analysis (3rd ed.),University of Chicago Press, Chicago, 1976.
Harris, R. J. “Reforming Significance Testing ViaThree-Valued Logic,” In What If There Were NoSignificance Testing?, L. L. Harlow, S. A.Mulaik, and J. H. Steiger (eds.), LawrenceErlbaum, Mahwah, NJ, 1997.
Harrington, S. “The Effect of Codes of Ethics andPersonal Denial of Responsibility on ComputerAbuse and Intention Judgments,” MIS Quarterly(20:3), 1996, pp. 257-278.
Harrison, D. A., Mykytyn Jr., P. P., and Riemen-schneider, C. K. “Executive Decisions AboutAdoption of Information Technology in SmallBusinesses: Theory and Empirical Tests,”Inforation Systems Research (8:2), 1997, pp.171-195.
Igbaria, M., and Guimaraes, T. “Antecedents andConsequence of Job Satisfaction Among Infor-mation Center Employees” Journal of Manage-ment Information Systems (9:4), 1993, pp. 145-174.

Carte & Russell/Moderation Errors
MIS Quarterly Vol. 27 No. 3/September 2003 21
Igbaria, M., and Guimaraes, T. “Exploring Dif-1ferences in Employee Turnover Intentions and2Its Determinants Among Telecommuters and3Non-Telecommuters,” Journal of Management4Information Systems (16:1), 1999, pp. 147-164.5
Igbaria, M., Parasuraman, S., and Badaway, M. K.6“Work Experiences, Job Involvement, and7Quality of Work Life Among Information Sys-8tems Personnel,” MIS Quarterly (18:2), 1994,9pp. 175-201.10
Jaccard, J., Turrisi, R., and Wan, C. K. Interaction11Effects in Multiple Regression, Sage University12Paper Series on Quantitative Applications in13the Social Sciences 07-072, Newbury Park, CA,141990.15
Jarvenpaa, S. L., Dickson, G. W., and DeSanctis,16G. “Methodological Issues in Experimental IS17Research: Experiences and Recommenda-18tions,“ MIS Quarterly (9:2), 1985, pp. 141-156.19
James, L., and Brett, J. “Mediators, Moderators,20and Tests for Mediations,” Journal of Applied21Psychology (69:2), 1984, pp. 307-321.22
Keil, M., Tan, B. C. Y., Wei, K. K., Saarinen, T.,23Tuunainen, V., and Wassenaar, A. “A Cross-24Cultural Study on Escalation of Commitment25Behavior in Software Projects,” MIS Quarterly,262000 (24:2), pp. 299-325.27
Landis, R. S., and Dunlap, W. P. “Moderated28Multiple Regression Tests Are Criterion Spe-29cific,” Organizational Research Methods (3),302000, pp. 254-266.31
Lee, A. “Executive Overview. Validation in Infor-32mation Systems Research: A State of the Art33Assessment,” MIS Quarterly (25:1), 2001, p. xi.34
Lee, B., Barua, A., and Whinston, A. B. “Dis-35covery and Representation of Causal Relation-36ships in MIS Research: A Methodological37Framework,“ MIS Quarterly (21:1), 1997, pp.38109-136.39
Likert, R. A. “A Technique for the Measurement of40Attitudes,” Archives of Psychology (140), 1932.41
Lubinski, D., and Humphreys, L. G. “Assessing42Spurious ‘Moderator Effects’: Illustrated Sub-43stantively with the Hypothesized (‘Synergistic’)44Relation between Spatial and Mathematical45ability,” Psychological Bulletin (107), 1990, pp.46385-393.47
McClelland, G. H., and Judd, C. M. “Statistical48Difficulties of Detecting Interactions and Moder-49
ator Effects,” Psychological Bulletin (114),1993, pp. 376- 390.
McKeen, J. D., and Guimaraes, T. “SuccessfulStrategies for User Participation in SystemsDevelopment,” Journal of Management Infor-mation Systems (14:2), 1997, pp. 133-150.
McKeen, J. D., Guimaraes, T., and Wetherbe, J.C. “The Relationship between User Participa-tion and User Satisfaction: An Investigation ofFour Contingency Factors,” MIS Quarterly(18:4), 1994, pp. 427-451.
Nunnally, J. Psychometric Theory, McGraw-Hill, New York, 1967.
Podsakoff, P. M., MacKenzie, S. B., Ahearne, M.,and Bommer, W. H. “Searching for a Needle ina Haystack: Trying to Identify the IllusiveModerators of Leadership Behaviors,” Journalof Management (21), 1995, pp. 422-470.
Raelin, J. A. “Work Patterns in the ProfessionalLifecycle,” Journal of Occupational Psychology(58:3), 1985, pp. 177-187.
Rice, R. E., and Contractor, N. S. “Conceptua-lizing Effects of Office Information Systems: AMethodology and Application for the Study ofAlpha, Beta, and Gamma Changes,” DecisionScience (21), 1990, pp. 301-317.
Russell, C. J., and Bobko, P. “ModeratedRegression Analysis and Likert Scales: TooCoarse for Comfort,” Journal of AppliedPsychology (77), 1992, pp. 336-342.
Russell, C. J., and Dean, M. A. “To Log or Not toLog: Bootstrap as an Alternative to ParametricEstimation of Moderation Effects in the Pre-sence of Skewed Dependent Variables,”Organizational Research Methods (3), 2000,pp. 167-185.
Saleem, Y, “An Empirical Test of the ContingencyApproach to User Participation in InformationSystems Development,” Journal of Manage-ment Information Systems (13:1), 1996, pp.145-166.
Saunders, D. R. “Moderator Variables in Predic-tion,” Educational and Psychological Measure-ment (16), 1956, pp. 209-222.
Schepanski, A. “The Predictive Ability Criterion inExperimental Judgment Research inAccounting,” Decision Sciences (14), 1983, pp.503-512.
Schmidt, F. E. “Implications of a MeasurementProblem for Expectancy Theory Research,”

Carte & Russell/Moderation Errors
22 MIS Quarterly Vol. 27 No. 3/September 2003
Organizational Behavior and Human Perfor-1mance (10), 1973, pp. 243-251.2
Schmitt, N. W. “The Use of Analysis of Covari-3ance Structures to Assess Beta and Gamma4Change,” Multivariate Behavioral Research5(17), 1982, pp. 343-358.6
Schmitt, N. W., and Klimoski, R. J. Research7Methods in Human Resource Management,8South-Western, Cincinnati, OH, 1991.9
Schmitt, N. W., Pulakos, E. D., and Lieblein, A.10“Comparison of Three Techniques to Assess11Group-Level Beta and Gamma Change,”12Applied Psychological Measurement (8), 1984,13pp. 249-260.14
Sharma, S., Durand, R. M., and Gur-Aire, O.15“Identification and Analysis of Moderator Vari-16ables,” Journal of Marketing Research (18),171981, August, pp. 291-300.18
Stevens, S. S. “Problems and Methods of19Psychophysics,” Psychological Bulletin (55),201958, pp. 177-196.21
Taylor, S., and Todd, P. “Assessing IT Usage:22The Role of Prior Experience,” MIS Quarterly231995 (19:4), pp. 561-570.24
Thompson, R. L., Higgins, C. A., and Howell, J. M.25“Influence of Experience on Personal Computer26Utilization: Testing a Conceptual Model,”27Journal of Management Information Systems28(11:1), 1994, pp. 167-187.29
Todd, P., and Benbasat, I. “Evaluating the Impact30of DSS, Cognitive Effort, and Incentives on31Strategy Selection,” Information Systems32Research (10:4), 1999, pp. 356-374.33
Venkatesh, V. “Determinants of Perceived Ease34of Use: Integrating Control, Intrinsic Motivation,35and Emotion into the Technology Acceptance36Model,” Information Systems Research (11:4),372000, pp. 342-365.38
Venkatesh, V., and Morris, M. G. “Why Don’t Men39Ever Stop to Ask for Directions? Gender,40Social Influence, and Their Role in Technology41Acceptance and Usage Behavior,” MIS42Quarterly (24:1), 2000 pp. 115-139.43
Vroom, V. H. Work and Motivation, Wiley, New44York, 1964.45
Wagner, J. A. “The Organizational Tenure-JobInvolvement Relationship: A Job-CareerExperience Explanation,” Journal of Organiza-tional Behavior (8:1), 1987, pp. 63-70.
Weill, P. “The Relationship between Investmentin Information Technology and Firm Perfor-mance: A Study of the Valve ManufacturingSector,” Information Systems Research (3:4),1992, pp. 307-333.
Winer, B. J. Statistical Principles in ExperimentalDesign, McGraw Hill, New York, 1974.
About the Authors
Traci A. Carte is an assistant professor of MIS inthe Michael F. Price College of Business at theUniversity of Oklahoma. She received her Ph.D.in MIS from the University of Georgia. Herresearch focuses on contingency factors related toIT implementation success. Her research hasbeen published or is forthcoming in InformationSystems Research, MIS Quarterly, Decision Sup-port Systems, Public Productivity and Manage-ment Review, and numerous national and inter-national conference proceedings.
Craig J. Russell is a professor of Managementand Psychology in the Michael F. Price College ofBusiness at the University of Oklahoma. Hereceived his Ph.D. in business administration fromthe University of Iowa, majoring in humanresource management and minoring in appliedstatistics. Craig’s research focuses on advancingtheory and practice in selection and developmentof organizational leaders. His work has appearedin Academy of Management Journal, AppliedPsychological Measurement, Human ResourceManagement Review, Human Relations, Journalof Applied Psychology, Journal of Management,Journal of Occupational and OrganizationalPsychology, Leadership Quarterly, PersonnelPsychology, and Research in Personnel/HumanResources Management.
46

Carte & Russell/Moderation Errors
MIS Quarterly Vol. 27 No. 3/September 2003 23
Appendix A1
Testing Moderated Relationships23
Citation4∆∆∆∆r2
Reported
Hypothesized Main Effect
(No RatioScales)
ReportedX→→→→ Z
Correlation
CoarseScalingof Dv
Used Plsw/Sub
GroupsAgarwal and Prasad (1998)5 N Y N Y NAhituv, Igbaria, and Sella (1998) 6 N N N N NArmstrong and Sambamurthy (1999)7 N Y N Y YBanerjee, Cronan, and Jones (1998)8 N Y N Y NBanker and Slaughter (2000)9 N N Y N NChoe (1996)10 Y Y N Y NDevaraj and Kohli (2000) 11 N N Y Y NDuxbury, Higgins, and Mills (1992)12 N N N Y NFritz, Yarasimhan, and Rhee (1998) 13 N N N Y NGrover, Cheon, and Teng (1996)14 Y N Y Y NHardgrave, Wilson, and Eastman15(1999)16
Y N N Y N
Harrington (1996)17 Y N N Y NHarrison, Mykytyn, and18Riemenschneider (1997) 19
Y Y N Y N
Igbaria and Guimaraes (1993) 20 Y N Y Y NIgbaria and Guimaraes (1999) 21 N N N Y NIgbaria, Parasuraman, and Badaway22(1994)23
N Y N Y Y
Keil, Tan, Wei, Saarinen, Tuunainen,24and Wassenaar (2000)25
N Y N N Y
McKeen and Guimaraes (1997) 26 N N Y Y NMcKeen, Guimaraes, and Wetherbe27(1994)28
Y Y Y Y N
Saleem (1996) 29 N Y N Y NTaylor and Todd (1995)30 N N N Y NThompson, Higgins, and Howell31(1994) 32
N Y Y Y Y
Todd and Benbasat (1999)33 N Y N N NVenkatesh (2000)34 N N N Y YVenkatesh and Morris (2000)35 N N N Y YWeill (1992)36 N Y N N N
37