Embed Size (px)
Citation preview
Carsten Eckel; Florian Unger:
Credit constraints, endogenous innovations, and pricesetting in international trade
Munich Discussion Paper No. 2015-8
Department of EconomicsUniversity of Munich
Volkswirtschaftliche FakultätLudwig-Maximilians-Universität München
Online at http://epub.ub.uni-muenchen.de/24858/
Credit constraints, endogenous innovations,
and price setting in international trade�
Carsten Eckely
University of Munich,
CESifo, and CEPR
Florian Ungerz
University of Munich
May 21, 2015
Abstract
We introduce credit frictions motivated by moral hazard in a general equilibrium model of
international trade with two dimensions of heterogeneity and endogenous investments. Firms'
competitiveness consists of capabilities to conduct process and quality innovations at low costs,
whereas investment outlays have to be �nanced by external capital. We show that the scope for
vertical product di�erentiation in a sector determines how credit tightening a�ects investment
and price setting. Consistent with recent empirical evidence, our model rationalizes positive
as well as negative correlations of �rm-level FOB prices with �nancial frictions and variable
trade costs. Faced with an increase in the borrowing rate, producers reduce both types of
innovation resulting in opposing e�ects on marginal production costs and prices. In general
equilibrium, �nancial frictions intensify quality-based (cost-based) sorting of �rms if the scope
for vertical product di�erentiation is high (low). Consequently, credit tightening leads to �rm
exit, increased innovation activity among existing suppliers, and welfare losses that are larger
in sectors with low investment intensity.
JEL Classi�cation: F12, G32, L11
Keywords: international trade, external �nance, credit constraints, moral hazard, quality, in-
novation, product prices.
�We are grateful to Daniel Baumgarten, Peter Egger, Lisandra Flach, Anna Gumpert, Andreas Moxnes,Peter Neary, Banu Demir Pakel, Monika Schnitzer and Erdal Yalcin, as well as participations of the 7th FIW-Research Conference "International Economics" in Vienna, 16th Annual Conference of the European TradeStudy Group (ETSG) in Munich, "Mainz Workshop in Trade and Macroeconomics" 2014, 18th Conferenceof the SFB/TR 15 in Mannheim, 16th G�ottingen Workshop "Internationale Wirtschaftsbeziehungen", 8thSFB/TR15 Workshop for Young Researchers at the University of Munich, and the Munich "IO and Tradeseminar" for helpful comments and suggestions. Financial support from the Deutsche Forschungsgemein-schaft through SFB/TR 15 is gratefully acknowledged.
yDepartment of Economics, D-80539 Munich, Germany; [email protected] of Economics, D-80539 Munich, Germany; [email protected]
1 Introduction
A growing empirical literature documents negative e�ects of credit constraints on �rms'
export behavior. Exporting usually requires additional upfront costs for investments in
marketing, capacity, product customization or distribution networks. Transportation leads to
longer time lags between investment outlays and pro�t realization.1 Consequently, empirical
studies �nd that credit rationing decreases �rm-level exports and reduces the probability
of serving foreign markets (Berman and H�ericourt, 2010; Minetti and Zhu, 2011; Muuls,
2014). Recent theoretical work based on �xed upfront costs and �rm heterogeneity �a la
Melitz (2003) shows that �nancial frictions prevent foreign market entry of low productivity
�rms (e.g. Manova, 2013). Besides intensi�ed productivity sorting, credit constraints and
leverage negatively a�ect exporters' choice of product quality (Fan, Lai, and Li, 2015; Bernini,
Guillou, and Bellone, 2013; Ciani and Bartoli, 2014). Firm-level studies document a positive
relation of prices with �rm size which points to competition through quality (Baldwin and
Harrigan, 2011; Johnson, 2012; Kugler and Verhoogen, 2012; Crozet, Head, and Mayer,
2012). In contrast, cost-based productivity sorting �a la Melitz (2003) suggests a negative
correlation between prices and �rm size (Roberts and Supina, 1996; Foster, Haltiwanger, and
Syverson, 2008).
Depending on the importance of quality di�erentiation, recent empirical studies �nd
opposing e�ects of credit frictions on price setting. For Italian �rm-level data, Secchi, Ta-
magni, and Tomasi (2014) show that �nancially constrained exporters charge higher prices
than unconstrained �rms within the same product-destination market, whereas this positive
relationship is reduced for product categories with high vertical di�erentiation. The authors
follow Kugler and Verhoogen (2012) and measure the scope for vertical product di�erentia-
tion as the ratio of advertising and R&D expenditures to total sales in U.S. industries. Using
Chinese �rm-level data, Fan et al. (2015) �nd negative e�ects of �nancial frictions on FOB
prices. Furthermore, Fan, Li, and Yeaple (2014) show that tari� reductions induce quality
upgrading associated with higher prices in highly di�erentiated sectors and lower prices in
non-di�erentiated sectors.
Motivated by this empirical evidence, we analyze the e�ects of credit frictions on endoge-
nous innovation choices, price setting and selection into exporting when both cost-based
productivity and product quality determine the competitiveness of a producer. The main
message of this paper is that credit tightening increases price (quality) competition if the
sectoral scope for vertical product di�erentiation is low (high). Therefore, we develop a
1See Amiti and Weinstein (2011), Chor and Manova (2012), as well as Feenstra, Li, and Yu (2014).Contessi and de Nicola (2012) as well as Manova and Foley (2014) provide reviews of the trade and �nanceliterature.
1
general equilibrium model of international trade with credit constraints, two sources of �rm
heterogeneity and endogenous sunk costs. We allow for both cost-based and quality-based
sorting as producers di�er in capabilities to conduct process and quality innovations. Invest-
ments are associated with endogenous sunk costs that decrease in �rm-speci�c capabilities.
In contrast to standard models with monopolistic competition, innovation choices endoge-
nously determine marginal production costs. Depending on their capabilities, �rms choose
di�erent investment levels and prices. Process innovations decrease marginal costs and hence
increase the cost-based productivity of a �rm for any given quality level. Whereas this chan-
nel is closely related to productivity sorting in Melitz (2003), the second type of investment
is motivated by the quality and trade literature. Quality innovations shift demand up at the
expense of higher marginal production costs. The two types of innovation are complements
as they increase price-adjusted quality and thus pro�ts. Firms have to raise external capital
for investment outlays, whereas labor is used for �xed and variable production costs. Based
on Holmstrom and Tirole (1997), we motivate credit constraints by moral hazard between
borrowing �rms and outside investors. In equilibrium, only the most capable �rms over-
come �nancial frictions and become exporters, whereas some low capability producers with
pro�table investment projects fail to borrow external capital and exit the market.
We use this framework to show that the scope for vertical product di�erentiation in a
sector determines how di�erent �nancial shocks a�ect optimal �rm behavior and export per-
formance. Consistent with the empirical evidence mentioned above, our model rationalizes
positive as well as negative relations of �rm-level FOB prices with trade and credit costs. An
increase in the borrowing rate negatively a�ects both types of innovation and triggers quality
as well as cost e�ects that in uence marginal production costs and thus optimal prices in
opposite directions. Lower process innovations increase marginal costs (cost e�ect), whereas
reduced product quality decreases prices (quality e�ect). If the scope for vertical product
di�erentiation is high (low), the quality (cost) e�ect dominates and tighter credit conditions
are associated with lower (higher) �rm-level prices. This measure for quality di�erentiation
is de�ned as the ratio of expenditures associated with product upgrades relative to invest-
ment outlays for processes. Theoretically, this ratio is independent of �rm capabilities and
only determined by exogenous technology parameters. Empirically, the measure is closely
related to sectoral proxies of vertical di�erentiation used in �rm-level studies.2 Analogously,
changes in variable trade costs induce opposing quality and cost e�ects as well.
We analyze the e�ects of credit frictions on investment and price setting both in partial
and general equilibrium. Whereas the partial equilibrium results could be interpreted as
short-term e�ects of credit tightening with a �xed number of suppliers, the general equi-
2See Sutton (2001) and Kugler and Verhoogen (2012) as well as the discussion in section 4.
2
librium scenario allows for adjustments along the extensive margin. In general equilibrium,
stronger credit frictions reduce the number of active producers and intensify quality-based
(cost-based) sorting of �rms if the scope for vertical product di�erentiation is high (low). In
contrast to partial equilibrium, innovation activity as well as �rm size of existing suppliers
increases. Intuitively, the negative e�ect of credit frictions along the extensive margin en-
hances the bene�ts of investments for active �rms resulting in an equilibrium with a lower
number of producers that are larger on average. Furthermore, we show that credit tighten-
ing leads to welfare losses that di�er across sectors with high and low investment intensity
(either quality or cost-based). In sectors with low investment intensity, credit frictions in-
duce stronger reactions along the extensive margin and thus lead to larger welfare losses. In
contrast, an increase in the borrowing rate that is not caused by �nancial imperfections, but
rather a decrease in capital supply, leads to negative reactions along the intensive margin.
This cost shock causes stronger within-�rm adjustments and thus larger welfare losses in
sectors with high investment intensity.
Our paper di�ers from the theoretical trade and �nance literature in several important
aspects. First, we analyze the impact of credit frictions in a framework with both cost-
based and quality-based sorting. The scope for vertical product di�erentiation in a sector
determines the selection pattern of �rms and how �nancial shocks a�ect optimal investment
and pricing behavior. Second, we consider external �nancing of investment outlays instead of
trade related upfront costs. Third, we allow for credit constraints not only among exporters,
but also among non-exporters. Fourth, we do not restrict our analysis to partial equilibrium,
but rather show that general equilibrium e�ects change �rm responses to credit tightening.
Finally, we investigate the welfare implications of �nancial shocks. The next section reviews
related theoretical literature. Section 3 sets up the model and derives optimal �rm behavior.
In part 4, we analyze the e�ects of �nancial shocks and of trade liberalization on investment
and price setting in partial equilibrium. The following two sections discuss credit frictions
in general equilibrium. Finally, section 7 concludes.
2 Related theoretical literature
Most closely related to our theoretical setup with two dimensions of heterogeneity, Hallak
and Sivadasan (2013) and Sutton (2007) develop two-attribute �rm models of international
trade with endogenous sunk costs. Besides Melitz-type productivity, Hallak and Sivadasan
(2013) allow producers to di�er in their ability to develop high-quality products at low �xed
outlays. We additionally consider endogenous process investments and introduce credit fric-
tions. Whereas our framework is based on monopolistic competition, Sutton (2007) considers
3
Cournot competition and non-CES preferences and thus allows only for vertical product dif-
ferentiation but neglects horizontal di�erentiation. Similar to these papers, cost-based and
quality-based capabilities jointly determine �rms' competitiveness in our model and are sum-
marized in a one-dimensional productivity measure related to Melitz (2003). Whereas we
focus on single product manufacturers, Bernard, Redding, and Schott (2011) introduce het-
erogeneity in product attributes within the boundaries of multi-product �rms that di�er in
productivity as in Melitz (2003). In a multi-product �rm model with exible manufactur-
ing and quality investment, Eckel, Iacovone, Javorcik, and Neary (2015) show that prices
fall with distance from the core product (quality-based competence) in di�erentiated-good
sectors, but the opposite holds in non-di�erentiated sectors (cost-based competence).
Closely related to our analysis, Fan et al. (2014) extend a Melitz-type partial equilibrium
model by endogenous quality choice to rationalize positive as well as negative relations of
�rm-level FOB prices with trade costs depending on the sectoral scope for vertical product
di�erentiation. Fan et al. (2015) build on Arkolakis (2010) as well as Manova (2013) and
di�erentiate between exogenous and endogenous quality. The authors show that �nancially
constrained �rms sell at higher prices when quality is exogenous, whereas the opposite holds
in case of endogenous quality choice. In contrast, our model explains the prevalence of
quality and cost e�ects when �rms endogenously choose two innovation types that a�ect
marginal production costs and thus prices in opposite ways. Furthermore, we analyze the
e�ects of �nancial shocks in general equilibrium.
Additionally, this paper is related to work that considers investment decisions of hetero-
geneous �rms. Bustos (2011), Lileeva and Tre er (2010) as well as Yeaple (2005) allow for
process innovations that reduce marginal production costs. Consistent with our framework,
these models predict that trade liberalization increases the incentives of technology upgrad-
ing. With respect to quality, we build on recent e�orts to extend international trade models
by quality sorting (Baldwin and Harrigan, 2011; Johnson, 2012) as well as endogenous quality
and input choices (Kugler and Verhoogen, 2012; Antoniades, 2015).
Furthermore, this paper is related to a growing literature on �nancial frictions and in-
ternational trade with heterogeneous �rms. These models are mainly based on productivity
sorting �a la Melitz (2003) and focus on �nancial constraints of exporters. In contrast, we
assume that domestic as well as international sellers face credit frictions concerning endoge-
nous innovation choices. Manova (2013) considers external �nancing of �xed and variable
export costs and motivates credit constraints by imperfect �nancial contractibility. By in-
troducing liquidity as a second source of heterogeneity, Chaney (2013) and Suwantaradon
(2012) break up the one-to-one relationship between productivity and �rm success in the
presence of credit constraints. While we assume that endogenous innovations have to be
4
�nanced by external capital, these approaches stress the role of internal funds for �nancing
of �xed export costs (Chaney, 2013) and capital inputs (Suwantaradon, 2012). Feenstra
et al. (2014) introduce �nancial frictions by information asymmetry between �rms and a
monopolistic bank. Instead, we assume perfect competition in the �nancial sector and sym-
metric information with respect to �rm characteristics, but ex-post moral hazard motivated
by Holmstrom and Tirole (1997) introduces �nancial frictions.
Closely related to our notion of credit constraints, four other papers introduce imperfect
capital markets motivated by Holmstrom and Tirole (1997) in international trade settings.
First, von Ehrlich and Seidel (2013) analyze the impact of �nancial frictions on agglomera-
tion of industries in a new economic geography model based on Krugman (1991). Second,
Egger and Keuschnigg (2015) show how discrete R&D investment choices generate endoge-
nous �nancial constraints. Third, Irlacher and Unger (2015) introduce �rm-speci�c credit
frictions and endogenous borrowing costs in a model of international trade. Fourth, in the
framework of Antr�as and Caballero (2009), �rms engage in FDI as a response to imperfect
�nancial contracting and weak investor protection in the host country. Related to that,
Buch, Kesternich, Lipponer, and Schnitzer (2010) analyze the impact of �nancial frictions
on FDI based on Helpman, Melitz, and Yeaple (2004). Other work considers credit frictions
in the model of Melitz and Ottaviano (2008) with varying markups (Peters and Schnitzer,
2015; Mayneris, 2011).
3 Setup of the model
To analyze the impact of credit conditions on innovation and optimal price setting, this
section presents a general equilibrium model of international trade with two sources of �rm
heterogeneity. We consider two symmetric countries with population of size L and capital
endowment K, trading in di�erentiated varieties. Producers di�er in their capabilities to
introduce process and quality innovations at low costs. Motivated by a time lag between
innovation activity and pro�t realization, we assume that investment outlays have to be
�nanced by external capital, whereas labor is used for �xed and variable production costs.
Capital costs are denoted by the gross interest rate r > 1, and the nominal wage is chosen as
num�eraire (w = 1). Following Holmstrom and Tirole (1997), we introduce a non-veri�able
project choice of �rms which leads to moral hazard and credit frictions. The following
subsections discuss the optimal behavior of consumers and producers.
5
3.1 Consumers
Preferences of a representative consumer in one country are characterized by a CES utility
function over a continuum of goods indexed by i 2 :
X =
�Zi2(qixi)
��1� di
� ���1
; (1)
where � > 1 is the elasticity of substitution and qi denotes the quality of a product. The
quality-adjusted price index is de�ned as:
P =
"Zi2
�piqi
�1��di
# 11��
: (2)
From the consumer's maximization problem follows that demand for one di�erentiated vari-
ety i increases in the quality level qi and decreases in the price pi:
xi = q��1i X�piP
���: (3)
By introducing a quality component in the utility function of the representative consumer
(1), we follow the quality and trade literature.3 Product quality qi is endogenously chosen
by producers and shifts demand outwards for any given price. Additionally, �rms decide on
the level of process innovations. The next two subsections describe optimal �rm behavior in
the presence of credit frictions.
3.2 Production and investment with credit constraints
The production sector of the economy is characterized by monopolistic competition. Each
�rm manufactures one di�erentiated variety i and decides on process and quality innovations
that are both associated with endogenous sunk costs increasing in investment levels:
f(qi) =1
�iq�i ; g(ei) =
1
'ie�i : (4)
Parameters � and � determine the convexity of the investment cost functions and are ex-
ogenously given for producers in one sector. Hence, 1�and 1
�re ect the elasticities of quality
and processes to innovation outlays. Low values of � and � imply that one additional unit
3See e.g. Baldwin and Harrigan (2011), Kugler and Verhoogen (2012), and Hallak and Sivadasan (2013).
6
of investment spending is very e�ective.4 Producers di�er in their capabilities to invest in
process innovations 'i and quality upgrades �i:5 Higher values of these �rm-speci�c draws
scale down investment costs and hence increase incentives to innovate. The two types of
innovation a�ect marginal production costs mc in opposite directions:
mc(q; e) =q�
ewith 0 < � < 1: (5)
The bene�t of process innovations e is a reduction of marginal production costs which is
closely related to the productivity draw in Melitz (2003). Quality innovations q increase
demand for one variety (3), but are associated with higher labor requirements, where � de-
scribes the sensitivity of marginal costs to changes in quality. The positive relation between
product quality and marginal production costs can be motivated by advertising expenditures
or marketing. Related to our approach, other papers endogenize �rm's quality choice and
consider additional product-speci�c outlays or the use of higher-quality inputs.6 As we al-
low for both cost-based and quality-based sorting with endogenous sunk costs, our model is
closely related to Sutton (2007, 2012) and Hallak and Sivadasan (2013). Compared to previ-
ous work, we analyze the impact of credit conditions on two types of investment. Therefore,
we assume that �rms have to cover expenditures associated with endogenous innovations (4)
by external capital before revenues are realized, whereas labor is used for variable and �xed
production costs. The decision problem of a single �rm consists of four stages:
1. Entry stage. A potential producer of a di�erentiated variety decides to enter the
market and pays a �xed entry cost fe. After entry, the �rm draws both investment
capabilities ' and � from a joint probability distribution h('; �) with positive support
over ['; ']� [�; �] :
2. Financial contracting and investment. Producers choose the optimal levels of
process and quality innovations and sign a contract with an outside investor to cover
the investment costs. Optimal prices are set.
3. Moral hazard. After �nancial contracting, the agent in the �rm chooses to conduct
the project diligently or to misbehave and reap a non-veri�able private bene�t.
4. Production and pro�t realization. Production and pro�ts are realized and the
loan is repaid to the lender.
4See Sutton (2012), section 1.10, for a comparable speci�cation of quality outlays. In section 3.3, weimpose a convexity assumption for technology parameters � and �:
5For notational simplicity we drop the �rm's index i in what follows.6See Kugler and Verhoogen (2012) or Johnson (2012), among others.
7
Stages 2 and 3 introduce endogenous investment choices and �nancial frictions. Based
on Holmstrom and Tirole (1997), we motivate credit constraints by a project choice which is
non-veri�able for external investors and thus prone to moral hazard. The optimal contract
between a �rm and an outside investor speci�es the loan size dl > 0 at a gross interest rate
r > 1, and the credit repayment kl, whereas the index l 2 d; x denotes non-exporters (d) andexporters (x) respectively. We solve the model by backward induction. The next subsection
describes optimal �rm behavior after entry.
3.3 Optimal �rm behavior
After entry, �rms choose the optimal levels of process (el) and quality innovations (ql) and
set prices at home and possibly in the foreign market. Exporters sell their product to
consumers in an identical foreign country, but face higher �xed costs fx > fd, and iceberg-
type transportation costs such that � > 1 units of a good have to be shipped for 1 unit to
arrive. Whereas domestic and export prices of a �rm di�er because of transportation costs,
we do not allow for market-speci�c investments. Hence, if a �rm exports, the bene�ts of
process and quality innovations are spread across sales in both destinations. Total sales of
producers are de�ned as: sl = plxl + 1fx�x>0gp�xx�x, whereas demand is given by equation (3)
and the dummy variable 1fx�x>0g takes a value of 1 if the �rm exports and is zero otherwise.
Firms choose optimal investment levels and prices to maximize expected pro�ts:
maxpl;p�x;el;ql
��l = ��sl �mc(ql; el)
�xl + 1fx�x>0g�x
�x
�� kl
�� fl: (6)
Variable pro�ts net of loan repayment kl realize with success probability 0 < � < 1. Firms
use labor input for �xed and variable production costs, but have to �nance innovation outlays
by external capital. This assumption can be motivated by a time lag between investment
activity and pro�t realization. Depending on their export status l 2 d; x, �rms face the
following constraints:
dl �1
�q�l +
1
'e�l ; (7)
�kl � rdl; (8)
�l � 0: (9)
The budget constraint (7) states that the received credit amount has to be su�ciently high
to cover endogenous investment costs. Participation constraints (8) and (9) ensure that
external investors do not incur losses from lending and �rms make at least zero pro�ts. We
assume perfect competition in the �nancial sector such that equation (8) holds with equality.
8
Based on Holmstrom and Tirole (1997), we motivate credit frictions by moral hazard.
After �nancial contracting and loan provision, the success of the investment depends on
a non-veri�able project choice within the �rm. On the one hand, the agent can decide to
behave diligently and conduct the project properly which implies that pro�ts realize with high
success probability �. On the other hand, if the agent chooses to misbehave, the probability
of success is lower �b < �, but the borrower can reap a share of �xed investments as a non-
veri�able private bene�t bfl > 0: The manager faces incentives to implement the project in a
more pleasant way or pursue own advantages at the expense of investment success. Following
Tirole (2006), the private bene�t can be interpreted as a disutility of e�ort.7 Hence, both
investment and entrepreneurial e�ort are inputs in the production process. There are no
information asymmetries with respect to �rm characteristics, but the project choice is non-
contractible for external investors which leads to moral hazard. Shirking can be ruled out if
the following incentive compatibility constraint holds:
��l � �b�l + bfl: (10)
We assume that the success probability �b is su�ciently low such that the net present value
of the marginal �rm which just meets incentive compatibility (10) is negative in case of
shirking. Thus, the optimal �nancial contract has to satisfy incentive compatibility to rule
out misbehavior and potential losses from lending. As long as the private bene�t is positive,
equation (10) is more restrictive than the zero-pro�t requirement (9). Hence, only �rms
that generate su�ciently high pro�ts overcome moral hazard and have access to external
�nance. As private bene�ts are related to �xed costs, exporters face a trade-o� between
additional pro�ts from selling abroad in case of diligent behavior and the prospect of higher
perks in case of shirking. To describe the optimal behavior of �rms, we proceed in two steps.
First, conditional on access to �nance, �rms maximize expected pro�ts (6) by taking into
account constraints (7) and (8). Second, incentive compatibility (10) determines access to
external capital and selection into exporting. Solving �rm's maximization problem leads to
the following optimal choices of process and quality innovations:8
el('; �) =
��Alr
�� �1� �
��
� (��1)(1��)
�'
�
��+(1��)(1��)
; (11)
ql('; �) =
��Alr
�� �1� �
��
��+1�� �'
�
���1
; (12)
7See Tirole (2006), section 3.2, for a disussion of moral hazard in a simple model of credit rationing.8See Appendix 8.1 for a detailed derivation of �rm's maximization problem.
9
whereby � �� + (1� �) [�+ (1� �) �], and Ad � XP ����1�
��, Ax � (1 + � 1��)Ad are
measures of market size for domestic sellers and exporters respectively. Consistent with
theoretical and empirical work on investment activity in international trade, our model
suggests a positive relationship between innovation and market size.9 As exporters spread
investment costs across both markets, they face larger incentives to engage in quality and
process innovations, (Ax > Ad), whereas iceberg transportation costs � and the borrowing
rate r reduce investment activity. We assume that investment costs are su�ciently convex:
�; � > (� � 1) (2� �) ; such that > 0. The convexity assumption implies that quality and
process innovations are complements and increase in both capabilities ' and �: A higher
capability draw for one type of innovation has a direct positive impact on the corresponding
investment level due to lower endogenous sunk costs, and additionally increases the marginal
bene�t of the other innovation type. This complementary structure relates to the literature
on simultaneous process and product R&D choices and is driven by the fact that both types
of innovation increase the price-adjusted quality and hence the success of a �rm in the
market.10 Consequently, producers will always engage in both types of innovation, whereas
the relative investment in processes compared to quality improvements is given by:
el('; �)
ql('; �)=
��Alr
���� �1� �
��
� (��1)(2��)��
�'
�
��+(2��)(1��)
: (13)
The convexity assumption regarding endogenous sunk costs implies further that investments
in process innovations relative to quality upgrades increase in the cost-based capability and
decrease in the quality-based capability:@( eq )@'
> 0,@( eq )@�
< 0: Additionally, the relative invest-
ment increases in � and decreases in � as �rms react to changes in the relative e�ectiveness
of innovations. A higher sensitivity of marginal production costs with respect to quality
(larger �) reduces the marginal bene�t of vertical product di�erentiation and increases the
relative investment in processes. In the extreme case, if � = 1; higher quality leads to a
one-to-one increase in marginal costs (5), such that marginal bene�ts of product upgrades
and thus innovation choices (11) and (12) are driven down to zero.
Analogous to standard models with monopolistic competition and CES demand struc-
ture, �rms set the optimal price as a constant markup over marginal costs. In contrast to
Melitz (2003), marginal production costs are endogenously determined by the two innovation
9See Bustos (2011) as well as Kugler and Verhoogen (2012), among others.10Theoretical studies discuss complementarities between product and process innovations under di�erent
modes of market competition (Athey and Schmutzler, 1995; Lin and Saggi, 2002; Rosenkranz, 2003), as wellas over the product life cycle (Klepper, 1996; Lambertini and Mantovani, 2010).
10
choices, whereas pl denotes domestic prices of �rms with export status l 2 d; x:
pl('; �) =�
� � 1q�lel=
�
� � 1
�r
�Al
����� �1� �
��
���+1��
��
'
����+1
; (14)
and p�x('; �) = �px('; �) stands for the export price of internationally active producers. The
pricing rule captures two opposing e�ects of investment behavior. A higher level of process
innovations enhances production e�ciency, whereas quality innovations increase marginal
costs according to equation (5). Consequently, the optimal price decreases in the cost-based
capability ', but increases in the quality-based capability �.11 Hence, the setup with two
innovation choices captures both a negative relation between prices and �rm size based on
cost-based sorting �a la Melitz (2003) and a positive correlation between prices and �rm size
as suggested by the recent quality and trade literature (e.g. Kugler and Verhoogen, 2012).
The success of a producer in the market results from the ability to invest in processes as well
as product quality at low costs. Therefore, we de�ne �rm's overall e�ciency as a combination
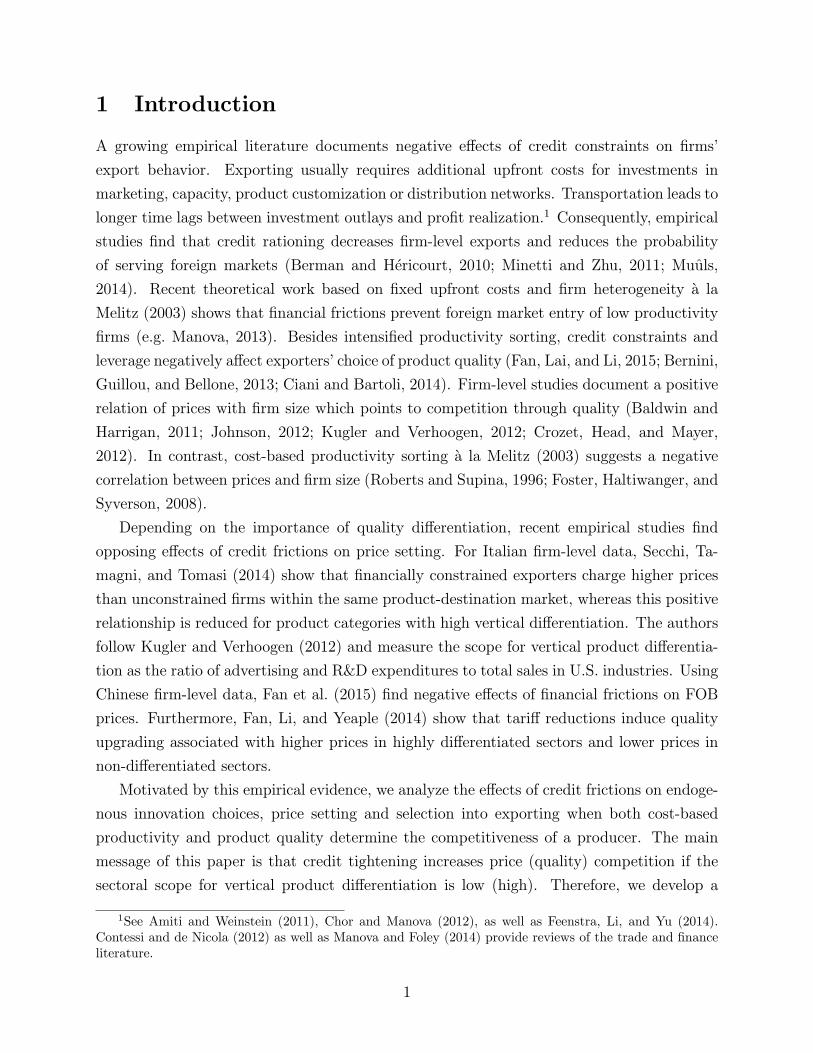
of both capabilities: z = '���(1��). Figure 1 depicts an example for an iso-e�ciency curve
in the two-dimensional space, whereas the vertical axis shows the quality-based capability �
and the horizontal axis shows the cost-based capability ': The curve represents a non-linear
trade-o� between the two attributes: @�@'< 0 and @2�
@'2> 0: If a �rm possesses a low ability to
invest in processes (low '); it requires a relatively high quality-based capability � to achieve
the same overall e�ciency level. Firms located along a particular iso-e�ciency curve earn
the same expected revenues and pro�ts, since the latter can be expressed as monotone and
increasing functions of e�ciency z:
�sl(z) =�
� � 1 (�Al)��
r����(1��)���
�1� �
�
��(1��)z
!��1
; (15)
��l(z) =(� � 1) v
��sl(z)� fl; (16)
where v = 1��1 �
�1�+ 1��
�
�> 0: Comparable to single-attribute �rm models, e�ciency z is
a one-dimensional measure of pro�ts and �rm size. However, producers with the same size
or e�ciency z choose di�erent levels of quality and process innovations and thus set di�erent
prices, depending on their �rm-speci�c capabilities. Revenues and pro�ts depend positively
on market size Al, but negatively on the borrowing rate r and investment cost parameters
11Elasticities of prices with respect to capabilities are given by: @pl@''pl= ��1��
< 0 and @pl@�
�pl= ����+1
>
0, if � > ��1� . Note that this condition for the technology parameter � is more restrictive than the convexity
assumption discussed earlier in this section.
11
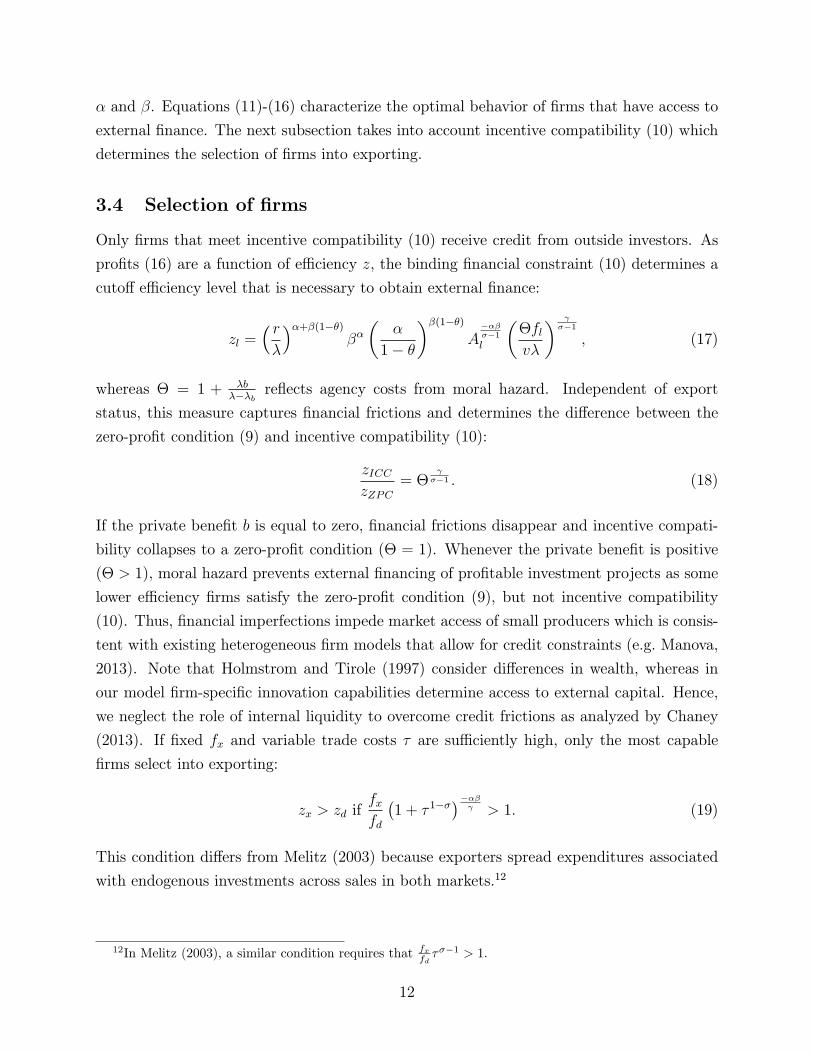
� and �. Equations (11)-(16) characterize the optimal behavior of �rms that have access to
external �nance. The next subsection takes into account incentive compatibility (10) which
determines the selection of �rms into exporting.
3.4 Selection of �rms
Only �rms that meet incentive compatibility (10) receive credit from outside investors. As
pro�ts (16) are a function of e�ciency z, the binding �nancial constraint (10) determines a
cuto� e�ciency level that is necessary to obtain external �nance:
zl =� r�
��+�(1��)���
�
1� �
��(1��)A
�����1l
��flv�
� ��1
; (17)
whereas � = 1 + �b���b re ects agency costs from moral hazard. Independent of export
status, this measure captures �nancial frictions and determines the di�erence between the
zero-pro�t condition (9) and incentive compatibility (10):
zICCzZPC
= �
��1 : (18)
If the private bene�t b is equal to zero, �nancial frictions disappear and incentive compati-
bility collapses to a zero-pro�t condition (� = 1). Whenever the private bene�t is positive
(� > 1), moral hazard prevents external �nancing of pro�table investment projects as some
lower e�ciency �rms satisfy the zero-pro�t condition (9), but not incentive compatibility
(10). Thus, �nancial imperfections impede market access of small producers which is consis-
tent with existing heterogeneous �rm models that allow for credit constraints (e.g. Manova,
2013). Note that Holmstrom and Tirole (1997) consider di�erences in wealth, whereas in
our model �rm-speci�c innovation capabilities determine access to external capital. Hence,
we neglect the role of internal liquidity to overcome credit frictions as analyzed by Chaney
(2013). If �xed fx and variable trade costs � are su�ciently high, only the most capable
�rms select into exporting:
zx > zd iffxfd
�1 + � 1��
���� > 1: (19)
This condition di�ers from Melitz (2003) because exporters spread expenditures associated
with endogenous investments across sales in both markets.12
12In Melitz (2003), a similar condition requires that fxfd ���1 > 1:
12
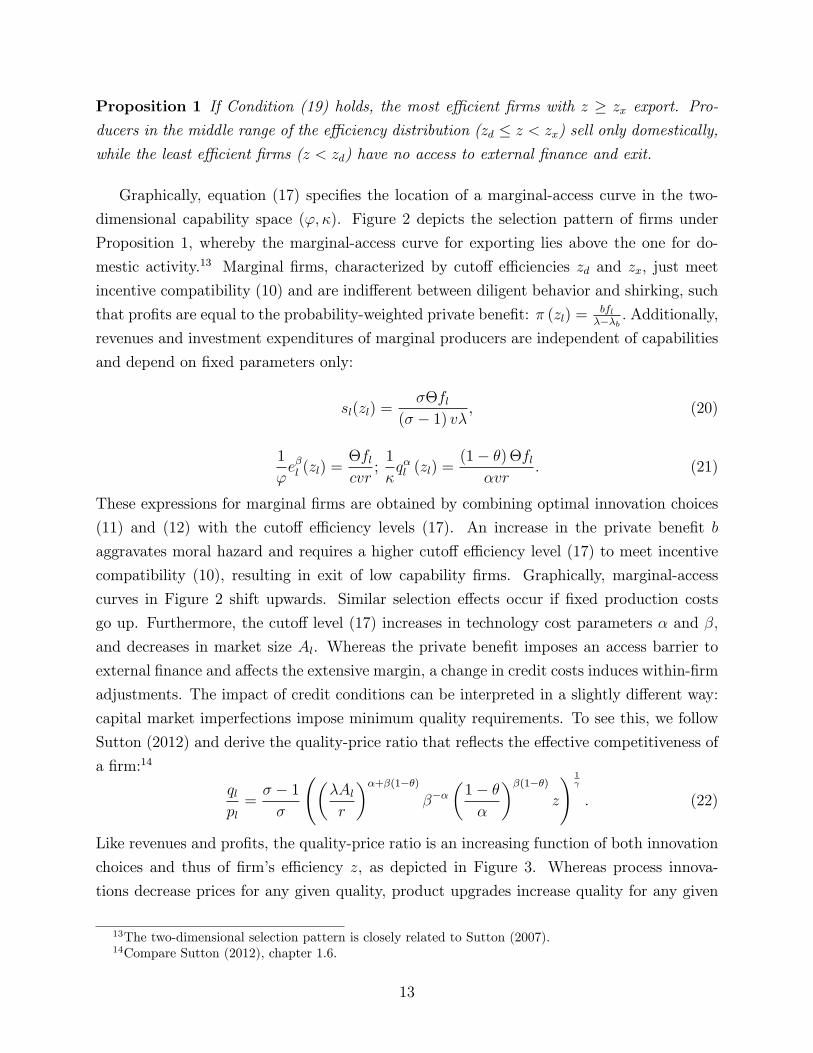
Proposition 1 If Condition (19) holds, the most e�cient �rms with z � zx export. Pro-
ducers in the middle range of the e�ciency distribution (zd � z < zx) sell only domestically,
while the least e�cient �rms (z < zd) have no access to external �nance and exit.
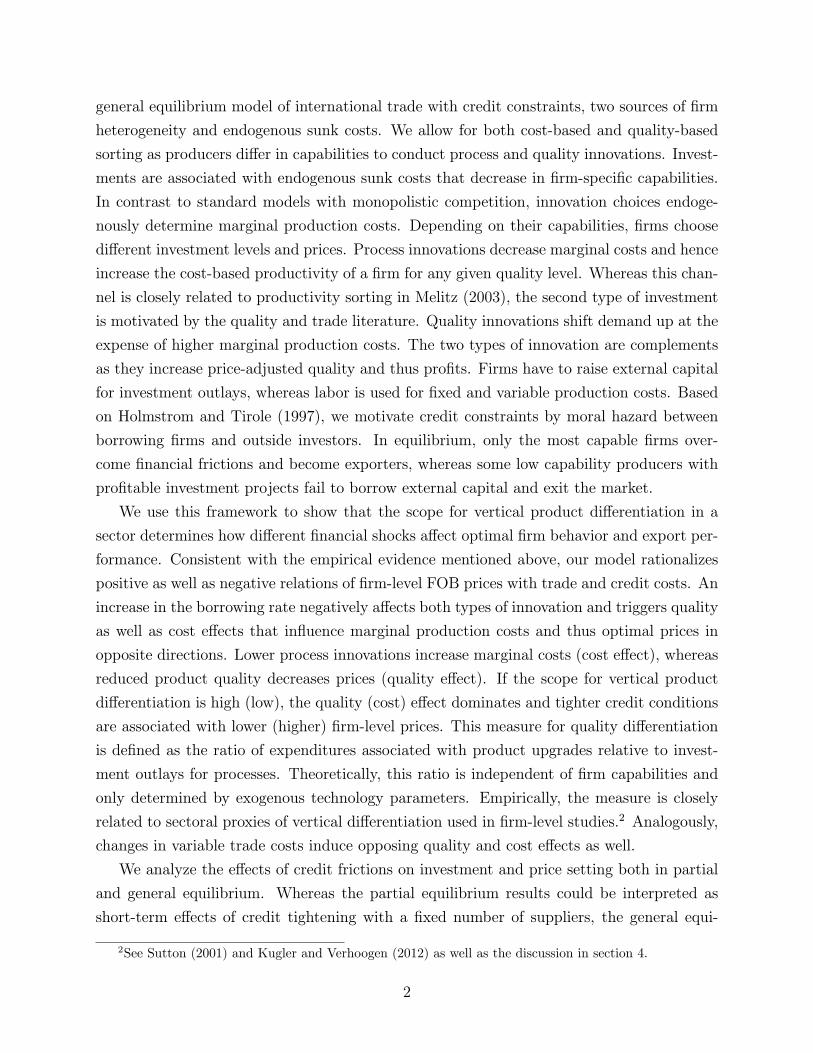
Graphically, equation (17) speci�es the location of a marginal-access curve in the two-
dimensional capability space ('; �). Figure 2 depicts the selection pattern of �rms under
Proposition 1, whereby the marginal-access curve for exporting lies above the one for do-
mestic activity.13 Marginal �rms, characterized by cuto� e�ciencies zd and zx, just meet
incentive compatibility (10) and are indi�erent between diligent behavior and shirking, such
that pro�ts are equal to the probability-weighted private bene�t: � (zl) =bfl���b : Additionally,
revenues and investment expenditures of marginal producers are independent of capabilities
and depend on �xed parameters only:
sl(zl) =��fl
(� � 1) v� , (20)
1
'e�l (zl) =
�flcvr
;1
�q�l (zl) =
(1� �)�fl�vr
: (21)
These expressions for marginal �rms are obtained by combining optimal innovation choices
(11) and (12) with the cuto� e�ciency levels (17). An increase in the private bene�t b
aggravates moral hazard and requires a higher cuto� e�ciency level (17) to meet incentive
compatibility (10), resulting in exit of low capability �rms. Graphically, marginal-access
curves in Figure 2 shift upwards. Similar selection e�ects occur if �xed production costs
go up. Furthermore, the cuto� level (17) increases in technology cost parameters � and �;
and decreases in market size Al. Whereas the private bene�t imposes an access barrier to
external �nance and a�ects the extensive margin, a change in credit costs induces within-�rm
adjustments. The impact of credit conditions can be interpreted in a slightly di�erent way:
capital market imperfections impose minimum quality requirements. To see this, we follow
Sutton (2012) and derive the quality-price ratio that re ects the e�ective competitiveness of
a �rm:14
qlpl=� � 1�
��Alr
��+�(1��)���
�1� �
�
��(1��)z
! 1
: (22)
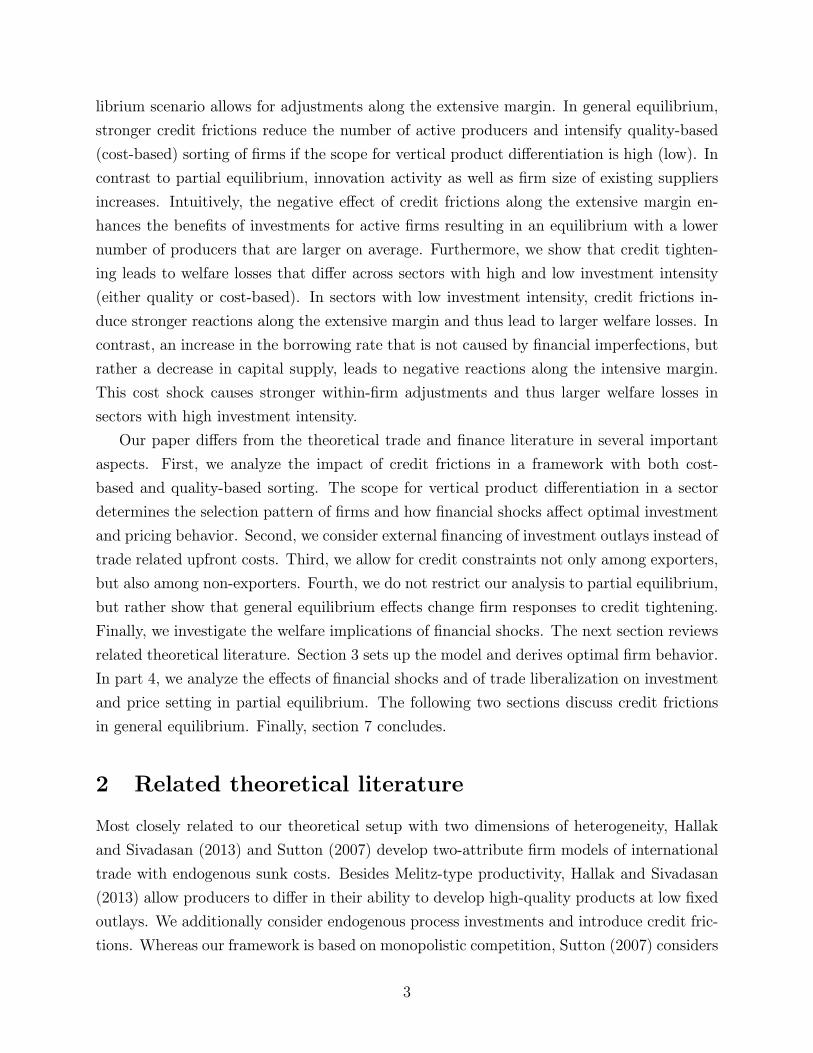
Like revenues and pro�ts, the quality-price ratio is an increasing function of both innovation
choices and thus of �rm's e�ciency z, as depicted in Figure 3. Whereas process innova-
tions decrease prices for any given quality, product upgrades increase quality for any given
13The two-dimensional selection pattern is closely related to Sutton (2007).14Compare Sutton (2012), chapter 1.6.
13
price. Faced with higher borrowing rates, �rms scale down both types of innovation re-
sulting in a lower quality-price ratio. Graphically, within-�rm adjustments correspond to a
downward shift of the quality-price pro�le depicted in Figure 3 for two di�erent borrowing
rates: r1 < r2. While this e�ect negatively in uences the intensive margin of international
trade, credit frictions a�ect the extensive margin. The horizontal line represents a minimum
quality requirement that is necessary to obtain external capital. This threshold is derived by
inserting the cuto� e�ciency level (17) in equation (22). An increase in the private bene�t
raises the cuto� e�ciency level and hence the minimum quality requirement re ected in an
upward shift of the horizontal line in Figure 3, whereas within-�rm adjustments and hence
changes in the individual price-adjusted quality are not present. The remainder of the paper
discusses the implications of within-�rm adjustments and selection e�ects in partial and gen-
eral equilibrium. Consistent with recent empirical evidence, the following section shows that
reoptimizations of innovation choices can explain positive as well as negative correlations of
credit costs with export prices, depending on the scope for vertical product di�erentiation.
In chapters 5 and 6, we analyze the general equilibrium e�ects of credit tightening.
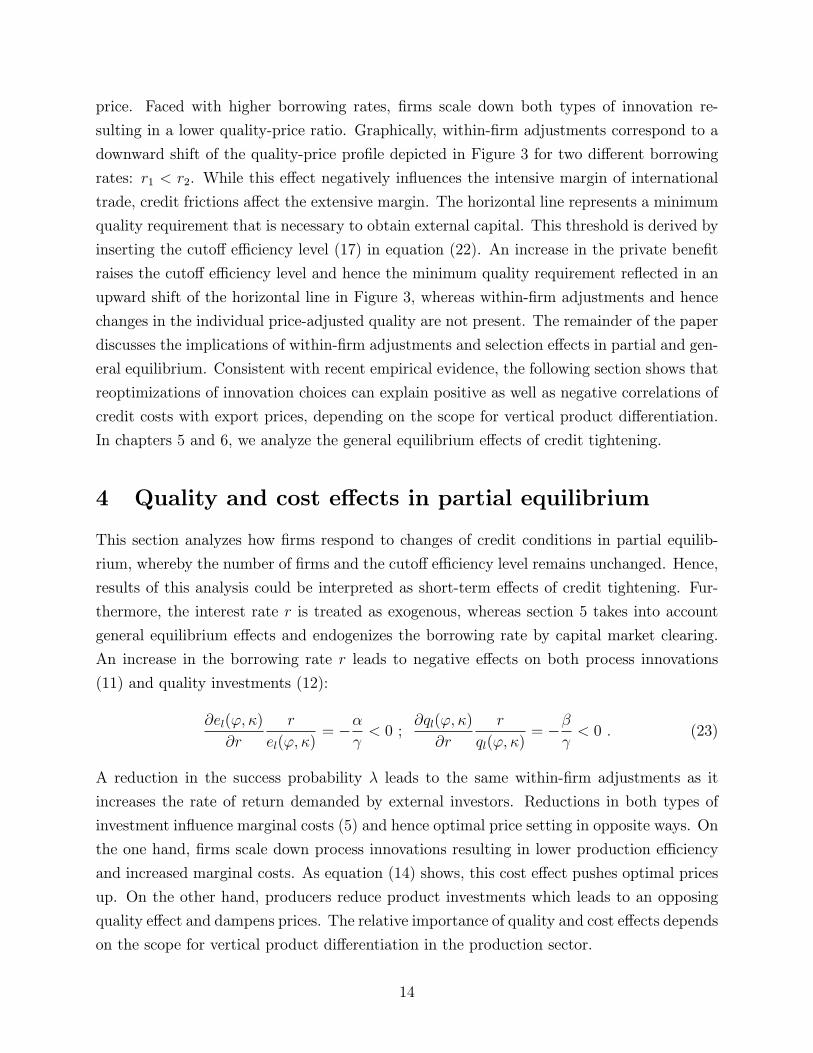
4 Quality and cost e�ects in partial equilibrium
This section analyzes how �rms respond to changes of credit conditions in partial equilib-
rium, whereby the number of �rms and the cuto� e�ciency level remains unchanged. Hence,
results of this analysis could be interpreted as short-term e�ects of credit tightening. Fur-
thermore, the interest rate r is treated as exogenous, whereas section 5 takes into account
general equilibrium e�ects and endogenizes the borrowing rate by capital market clearing.
An increase in the borrowing rate r leads to negative e�ects on both process innovations
(11) and quality investments (12):
@el('; �)
@r
r
el('; �)= ��
< 0 ;
@ql('; �)
@r
r
ql('; �)= ��
< 0 : (23)
A reduction in the success probability � leads to the same within-�rm adjustments as it
increases the rate of return demanded by external investors. Reductions in both types of
investment in uence marginal costs (5) and hence optimal price setting in opposite ways. On
the one hand, �rms scale down process innovations resulting in lower production e�ciency
and increased marginal costs. As equation (14) shows, this cost e�ect pushes optimal prices
up. On the other hand, producers reduce product investments which leads to an opposing
quality e�ect and dampens prices. The relative importance of quality and cost e�ects depends
on the scope for vertical product di�erentiation in the production sector.
14
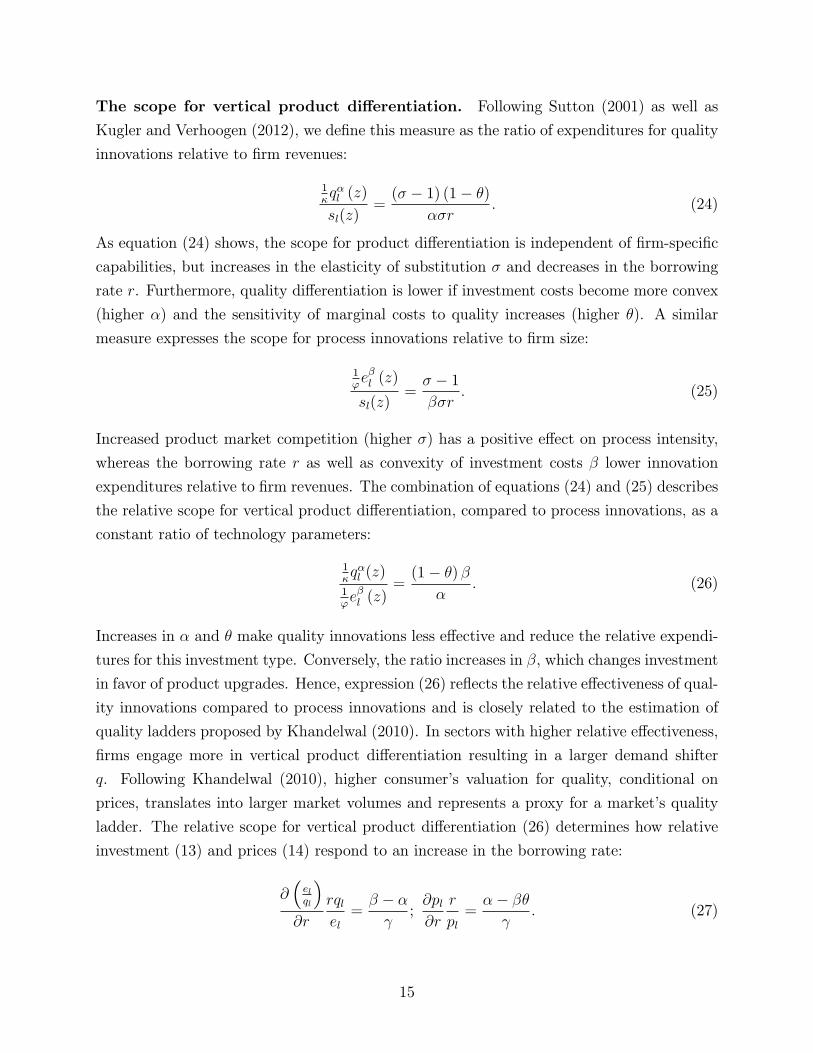
The scope for vertical product di�erentiation. Following Sutton (2001) as well as
Kugler and Verhoogen (2012), we de�ne this measure as the ratio of expenditures for quality
innovations relative to �rm revenues:
1�q�l (z)
sl(z)=(� � 1) (1� �)
��r: (24)
As equation (24) shows, the scope for product di�erentiation is independent of �rm-speci�c
capabilities, but increases in the elasticity of substitution � and decreases in the borrowing
rate r. Furthermore, quality di�erentiation is lower if investment costs become more convex
(higher �) and the sensitivity of marginal costs to quality increases (higher �). A similar
measure expresses the scope for process innovations relative to �rm size:
1'e�l (z)
sl(z)=� � 1��r
: (25)
Increased product market competition (higher �) has a positive e�ect on process intensity,
whereas the borrowing rate r as well as convexity of investment costs � lower innovation
expenditures relative to �rm revenues. The combination of equations (24) and (25) describes
the relative scope for vertical product di�erentiation, compared to process innovations, as a
constant ratio of technology parameters:
1�q�l (z)
1'e�l (z)
=(1� �) �
�: (26)
Increases in � and � make quality innovations less e�ective and reduce the relative expendi-
tures for this investment type. Conversely, the ratio increases in �, which changes investment
in favor of product upgrades. Hence, expression (26) re ects the relative e�ectiveness of qual-
ity innovations compared to process innovations and is closely related to the estimation of
quality ladders proposed by Khandelwal (2010). In sectors with higher relative e�ectiveness,
�rms engage more in vertical product di�erentiation resulting in a larger demand shifter
q. Following Khandelwal (2010), higher consumer's valuation for quality, conditional on
prices, translates into larger market volumes and represents a proxy for a market's quality
ladder. The relative scope for vertical product di�erentiation (26) determines how relative
investment (13) and prices (14) respond to an increase in the borrowing rate:
@�elql
�@r
rqlel=� � �
;@pl@r
r
pl=�� ��
: (27)
15
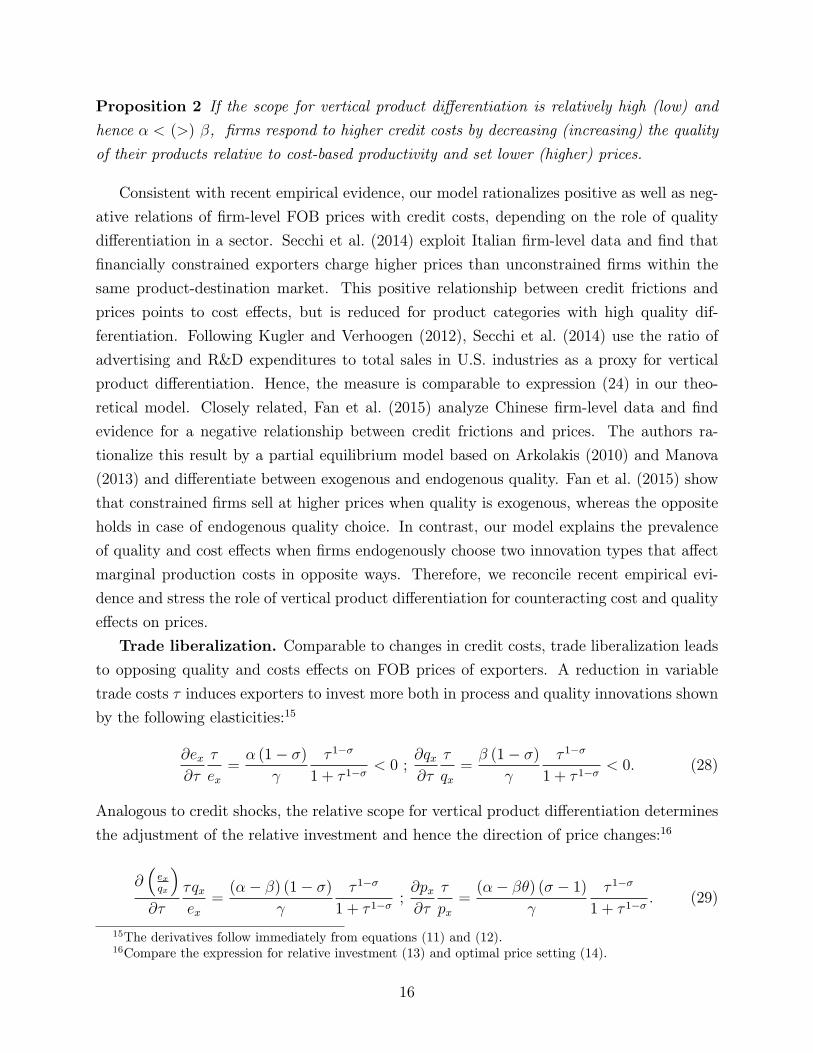
Proposition 2 If the scope for vertical product di�erentiation is relatively high (low) and
hence � < (>) �, �rms respond to higher credit costs by decreasing (increasing) the quality
of their products relative to cost-based productivity and set lower (higher) prices.
Consistent with recent empirical evidence, our model rationalizes positive as well as neg-
ative relations of �rm-level FOB prices with credit costs, depending on the role of quality
di�erentiation in a sector. Secchi et al. (2014) exploit Italian �rm-level data and �nd that
�nancially constrained exporters charge higher prices than unconstrained �rms within the
same product-destination market. This positive relationship between credit frictions and
prices points to cost e�ects, but is reduced for product categories with high quality dif-
ferentiation. Following Kugler and Verhoogen (2012), Secchi et al. (2014) use the ratio of
advertising and R&D expenditures to total sales in U.S. industries as a proxy for vertical
product di�erentiation. Hence, the measure is comparable to expression (24) in our theo-
retical model. Closely related, Fan et al. (2015) analyze Chinese �rm-level data and �nd
evidence for a negative relationship between credit frictions and prices. The authors ra-
tionalize this result by a partial equilibrium model based on Arkolakis (2010) and Manova
(2013) and di�erentiate between exogenous and endogenous quality. Fan et al. (2015) show
that constrained �rms sell at higher prices when quality is exogenous, whereas the opposite
holds in case of endogenous quality choice. In contrast, our model explains the prevalence
of quality and cost e�ects when �rms endogenously choose two innovation types that a�ect
marginal production costs in opposite ways. Therefore, we reconcile recent empirical evi-
dence and stress the role of vertical product di�erentiation for counteracting cost and quality
e�ects on prices.
Trade liberalization. Comparable to changes in credit costs, trade liberalization leads
to opposing quality and costs e�ects on FOB prices of exporters. A reduction in variable
trade costs � induces exporters to invest more both in process and quality innovations shown
by the following elasticities:15
@ex@�
�
ex=� (1� �)
� 1��
1 + � 1��< 0 ;
@qx@�
�
qx=� (1� �)
� 1��
1 + � 1��< 0: (28)
Analogous to credit shocks, the relative scope for vertical product di�erentiation determines
the adjustment of the relative investment and hence the direction of price changes:16
@�exqx
�@�
�qxex
=(�� �) (1� �)
� 1��
1 + � 1��;@px@�
�
px=(�� ��) (� � 1)
� 1��
1 + � 1��: (29)
15The derivatives follow immediately from equations (11) and (12).16Compare the expression for relative investment (13) and optimal price setting (14).
16
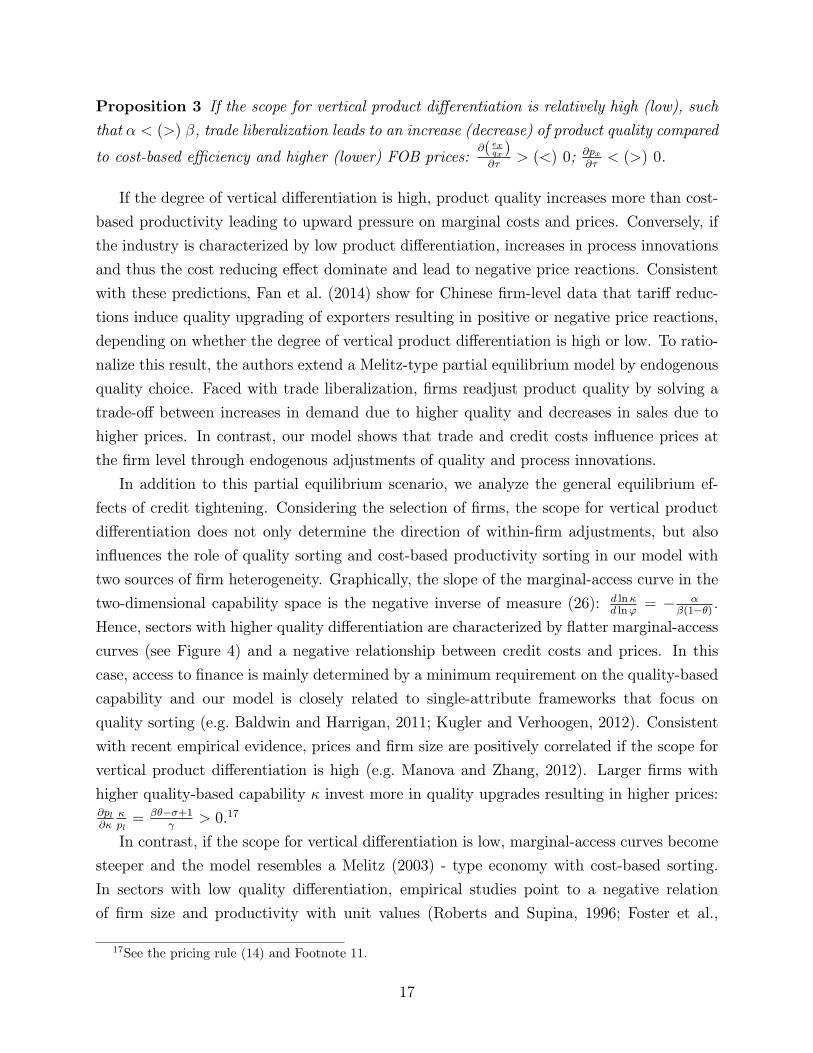
Proposition 3 If the scope for vertical product di�erentiation is relatively high (low), such
that � < (>) �, trade liberalization leads to an increase (decrease) of product quality compared
to cost-based e�ciency and higher (lower) FOB prices:@( exqx )@�
> (<) 0; @px@�
< (>) 0.
If the degree of vertical di�erentiation is high, product quality increases more than cost-
based productivity leading to upward pressure on marginal costs and prices. Conversely, if
the industry is characterized by low product di�erentiation, increases in process innovations
and thus the cost reducing e�ect dominate and lead to negative price reactions. Consistent
with these predictions, Fan et al. (2014) show for Chinese �rm-level data that tari� reduc-
tions induce quality upgrading of exporters resulting in positive or negative price reactions,
depending on whether the degree of vertical product di�erentiation is high or low. To ratio-
nalize this result, the authors extend a Melitz-type partial equilibrium model by endogenous
quality choice. Faced with trade liberalization, �rms readjust product quality by solving a
trade-o� between increases in demand due to higher quality and decreases in sales due to
higher prices. In contrast, our model shows that trade and credit costs in uence prices at
the �rm level through endogenous adjustments of quality and process innovations.
In addition to this partial equilibrium scenario, we analyze the general equilibrium ef-
fects of credit tightening. Considering the selection of �rms, the scope for vertical product
di�erentiation does not only determine the direction of within-�rm adjustments, but also
in uences the role of quality sorting and cost-based productivity sorting in our model with
two sources of �rm heterogeneity. Graphically, the slope of the marginal-access curve in the
two-dimensional capability space is the negative inverse of measure (26): d ln�d ln'
= � ��(1��) :
Hence, sectors with higher quality di�erentiation are characterized by atter marginal-access
curves (see Figure 4) and a negative relationship between credit costs and prices. In this
case, access to �nance is mainly determined by a minimum requirement on the quality-based
capability and our model is closely related to single-attribute frameworks that focus on
quality sorting (e.g. Baldwin and Harrigan, 2011; Kugler and Verhoogen, 2012). Consistent
with recent empirical evidence, prices and �rm size are positively correlated if the scope for
vertical product di�erentiation is high (e.g. Manova and Zhang, 2012). Larger �rms with
higher quality-based capability � invest more in quality upgrades resulting in higher prices:@pl@�
�pl= ����+1
> 0.17
In contrast, if the scope for vertical di�erentiation is low, marginal-access curves become
steeper and the model resembles a Melitz (2003) - type economy with cost-based sorting.
In sectors with low quality di�erentiation, empirical studies point to a negative relation
of �rm size and productivity with unit values (Roberts and Supina, 1996; Foster et al.,
17See the pricing rule (14) and Footnote 11.
17
2008). Accordingly, larger �rms with higher cost-based capability ' invest more in process
innovations that reduce marginal costs and prices: @pl@'
'pl= ��1��
< 0: In this case, �nancial
shocks induce mainly cost e�ects resulting in a positive relationship between credit costs and
optimal prices. To analyze the e�ects of credit tightening on aggregate export performance
and �rm selection, the next section presents the general equilibrium.
5 Equilibrium in the open economy
At the entry stage, �rms draw both investment capabilities ' and � from a joint probability
distribution h('; �) with positive support over ['; '] � [�; �] : As described in section 3.3,we summarize these two capabilities in a single measure of �rm's e�ciency: z = '���(1��).
The marginal-access cuto� levels (17) de�ne regions in the two-dimensional capability space
('; �), as depicted in Figure 2:
D =�('; �) 2 ['; ']� [�; �] : z � zd
, (30)
Dd =�('; �) 2 ['; ']� [�; �] : zd � z < zx
, (31)
Dx =�('; �) 2 ['; ']� [�; �] : z � zx
, (32)
where D is the set of all active �rms in equilibrium and Dl, with l 2 d; x, denotes regions ofdomestic producers and exporters respectively. Ex-ante probabilities of being active in one
particular region �l as well as the probability of success �s are de�ned as:
�l =
Z Z(';�)2Dl
h('; �)d'd�; �s =
Z Z(';�)2D
h('; �)d'd�, (33)
and corresponding conditional probabilities are given by �s('; �) =h(';�)�s
and �l('; �) =h(';�)�l
: For aggregation purposes we de�ne the average e�ciency within each group:
ez ��1 l =
Z Z(';�)2Dl
z��1 ('; �)�l('; �)d'd�: (34)
Average revenues and expected pro�ts by group of non-exporters and exporters can be
expressed as: esl = Z Z(';�)2Dl
sl('; �)�s('; �)d'd�, (35)
18
E�l =
Z Z(';�)2Dl
��l('; �)�s('; �)d'd�. (36)
Analogous to Melitz (2003), revenues of a particular �rm with e�ciency z can be expressed
relative to the marginal domestic seller or exporter, characterized by the cuto� level zl:
sl(z) =
�z
zl
���1
sl(zl): (37)
As discussed in section 3.4, revenues of marginal �rms depend only on �xed parameters of
the model. By taking into account expression (20) and the de�nition of average e�ciency
(34), we write expected revenues and pro�ts by group as follows:
�esl = ��fl(� � 1) v
�ezlzl
���1
; E�l =(� � 1) v
��esl � fl. (38)
The equilibrium is determined by equation (38) and a free entry condition to ensure that
�xed entry costs fe are equal to expected pro�ts before �rms know their capability draws:
E� =�fe�s; (39)
whereas � is the exogenous probability of a death shock. Total expected pro�ts are the
weighted sum of pro�ts by group: E� =P
l lE�l, whereby the share of producers in one
group is de�ned as l =�l�s. Equations (38) and (39) determine the minimum e�ciency
of marginal �rms zd that are just able to produce for the domestic market. The general
equilibrium is characterized by two additional conditions. Labor market clearing pins down
the number of active �rms M in the economy and capital market clearing determines the
interest rate r. Labor requirements of single �rms consist of variable and �xed production
costs and can be expressed as functions of revenues:
mcl('; �)�xl ('; �) + 1fx�x>0g�x
�x ('; �)
�+ fl =
� � 1�
sl(z) + fl: (40)
Producers with higher e�ciency z employ more labor due to increased investment expen-
ditures and larger sales. In equilibrium, the inelastic labor supply L has to be equal to
labor demands in the entry sector (Le = Mefe) and of the two groups of active producers:
L = Le +P
l Ll. Analogous to Melitz (2003), aggregation of single labor requirements pins
19
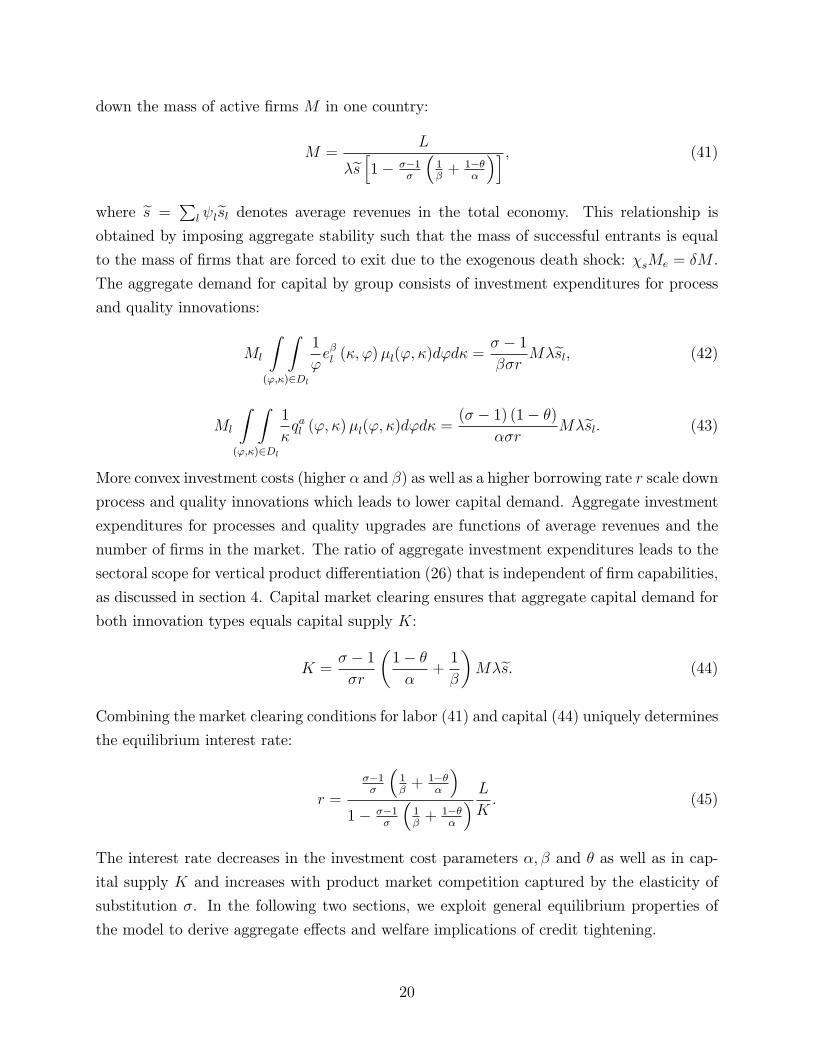
down the mass of active �rms M in one country:
M =L
�es h1� ��1�
�1�+ 1��
�
�i ; (41)
where es = Pl lesl denotes average revenues in the total economy. This relationship is
obtained by imposing aggregate stability such that the mass of successful entrants is equal
to the mass of �rms that are forced to exit due to the exogenous death shock: �sMe = �M .
The aggregate demand for capital by group consists of investment expenditures for process
and quality innovations:
Ml
Z Z(';�)2Dl
1
'e�l (�; ')�l('; �)d'd� =
� � 1��r
M�esl; (42)
Ml
Z Z(';�)2Dl
1
�qal ('; �)�l('; �)d'd� =
(� � 1) (1� �)
��rM�esl: (43)
More convex investment costs (higher � and �) as well as a higher borrowing rate r scale down
process and quality innovations which leads to lower capital demand. Aggregate investment
expenditures for processes and quality upgrades are functions of average revenues and the
number of �rms in the market. The ratio of aggregate investment expenditures leads to the
sectoral scope for vertical product di�erentiation (26) that is independent of �rm capabilities,
as discussed in section 4. Capital market clearing ensures that aggregate capital demand for
both innovation types equals capital supply K:
K =� � 1�r
�1� �
�+1
�
�M�es. (44)
Combining the market clearing conditions for labor (41) and capital (44) uniquely determines
the equilibrium interest rate:
r =
��1�
�1�+ 1��
�
�1� ��1
�
�1�+ 1��
�
� LK: (45)
The interest rate decreases in the investment cost parameters �; � and � as well as in cap-
ital supply K and increases with product market competition captured by the elasticity of
substitution �. In the following two sections, we exploit general equilibrium properties of
the model to derive aggregate e�ects and welfare implications of credit tightening.
20
6 E�ects of credit tightening in general equilibrium
In general equilibrium, we take into account that credit frictions change the number of
active producers in the sector. To derive explicit solutions of aggregate variables, we assume
that capabilities ' and � are independently Pareto distributed with positive support over
[1; ']� [1;1] and ' > 1. The probability of drawing a particular combination of ' and � isgiven by: h ('; �) = h'(')h�(�) with h�(�) = �����1 and h'(') = # '
�#�1
1�'�# , where � and # are
the shape parameters of the Pareto distributions.18 As we consider two symmetric countries,
our general equilibrium analysis neglects implications of bilateral di�erences in �nancial
development or in credit conditions. In contrast, another strand of literature examines how
national di�erences in �nancial characteristics in uence cross-border trade and capital ows
(see Antr�as and Caballero, 2009; Furusawa and Yanagawa, 2010, among others). The next
subsection shows how �nancial shocks a�ect optimal investment and pricing behavior in
general equilibrium and compares the results to the partial equilibrium analysis in section
4. Subsection 6.2 discusses the welfare e�ects of credit tightening.
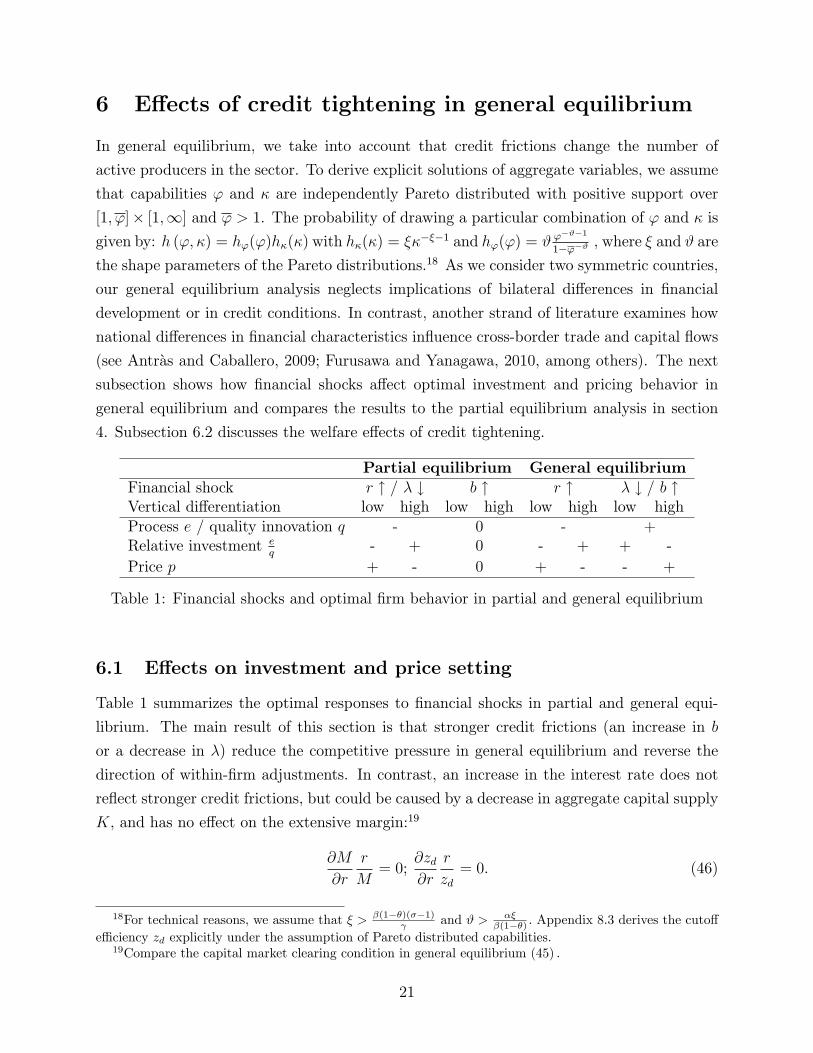
Partial equilibrium General equilibriumFinancial shock r " = � # b " r " � # = b "Vertical di�erentiation low high low high low high low highProcess e / quality innovation q - 0 - +Relative investment e
q- + 0 - + + -
Price p + - 0 + - - +
Table 1: Financial shocks and optimal �rm behavior in partial and general equilibrium
6.1 E�ects on investment and price setting
Table 1 summarizes the optimal responses to �nancial shocks in partial and general equi-
librium. The main result of this section is that stronger credit frictions (an increase in b
or a decrease in �) reduce the competitive pressure in general equilibrium and reverse the
direction of within-�rm adjustments. In contrast, an increase in the interest rate does not
re ect stronger credit frictions, but could be caused by a decrease in aggregate capital supply
K, and has no e�ect on the extensive margin:19
@M
@r
r
M= 0;
@zd@r
r
zd= 0. (46)
18For technical reasons, we assume that � > �(1��)(��1) and # > ��
�(1��) : Appendix 8.3 derives the cuto�
e�ciency zd explicitly under the assumption of Pareto distributed capabilities.19Compare the capital market clearing condition in general equilibrium (45) :
21
This result depends on the assumption that only endogenous investment costs have to be
�nanced by external capital, whereas labor input is used for �xed production costs. As Table
1 shows, optimal �rm responses to an increase in the borrowing rate r go into the same direc-
tion in partial and general equilibrium. If �xed costs have to be �nanced by external capital,
exit of low e�ciency �rms would raise the cuto� e�ciency. Consequently, increased compet-
itive pressure would even amplify the responses in general equilibrium without changing the
direction of the e�ects.20
Proposition 4 An increase in the borrowing rate r has no e�ect on the extensive margin,
whereas within-�rm adjustments go into the same direction in partial and general equilibrium.
In contrast to an increase in borrowing costs r, stronger credit frictions change the direc-
tion of optimal �rm responses in general equilibrium. The private bene�t b can be interpreted
as an inverse measure of �nancial development which might be a�ected by countries' �nancial
policies. Following Tirole (2006) and Antr�as, Desai, and Foley (2009), this managerial bene-
�t of shirking might be reduced by improved investor protection or stronger enforceability of
�nancial contracts. An increase in the private bene�t b enhances incentives of borrowers to
misbehave such that external investors demand more pledgeable income to provide loans for
investment. A decrease in the success probability of investment projects � increases the rate
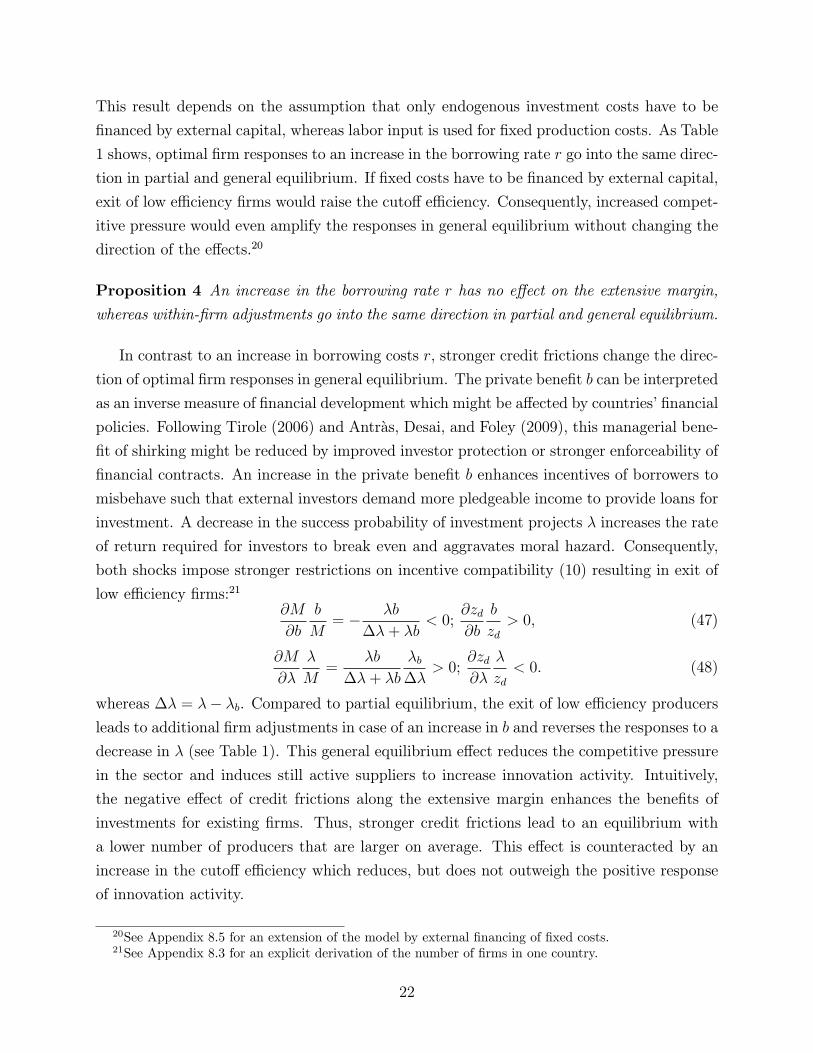
of return required for investors to break even and aggravates moral hazard. Consequently,
both shocks impose stronger restrictions on incentive compatibility (10) resulting in exit of
low e�ciency �rms:21
@M
@b
b
M= � �b
��+ �b< 0;
@zd@b
b
zd> 0, (47)
@M
@�
�
M=
�b
��+ �b
�b��
> 0;@zd@�
�
zd< 0. (48)
whereas �� = �� �b. Compared to partial equilibrium, the exit of low e�ciency producers
leads to additional �rm adjustments in case of an increase in b and reverses the responses to a
decrease in � (see Table 1). This general equilibrium e�ect reduces the competitive pressure
in the sector and induces still active suppliers to increase innovation activity. Intuitively,
the negative e�ect of credit frictions along the extensive margin enhances the bene�ts of
investments for existing �rms. Thus, stronger credit frictions lead to an equilibrium with
a lower number of producers that are larger on average. This e�ect is counteracted by an
increase in the cuto� e�ciency which reduces, but does not outweigh the positive response
of innovation activity.
20See Appendix 8.5 for an extension of the model by external �nancing of �xed costs.21See Appendix 8.3 for an explicit derivation of the number of �rms in one country.
22
Proposition 5 In general equilibrium, stronger credit frictions (an increase in the private
bene�t b or a reduction in the success probability �) reduce the number of active producers,
raise the cuto� e�ciency zd, and increase innovation activity as well as �rm size of existing
suppliers.
Proof. See Appendix 8.4.
In contrast to partial equilibrium, stronger �nancial frictions lead to a reduction of prices
in sectors with low quality di�erentiation. Thus, credit tightening intensi�es quality-based
(cost-based) sorting if the scope for vertical di�erentiation is high (low). The next subsection
discusses the welfare consequences of �nancial shocks.
6.2 Welfare analysis
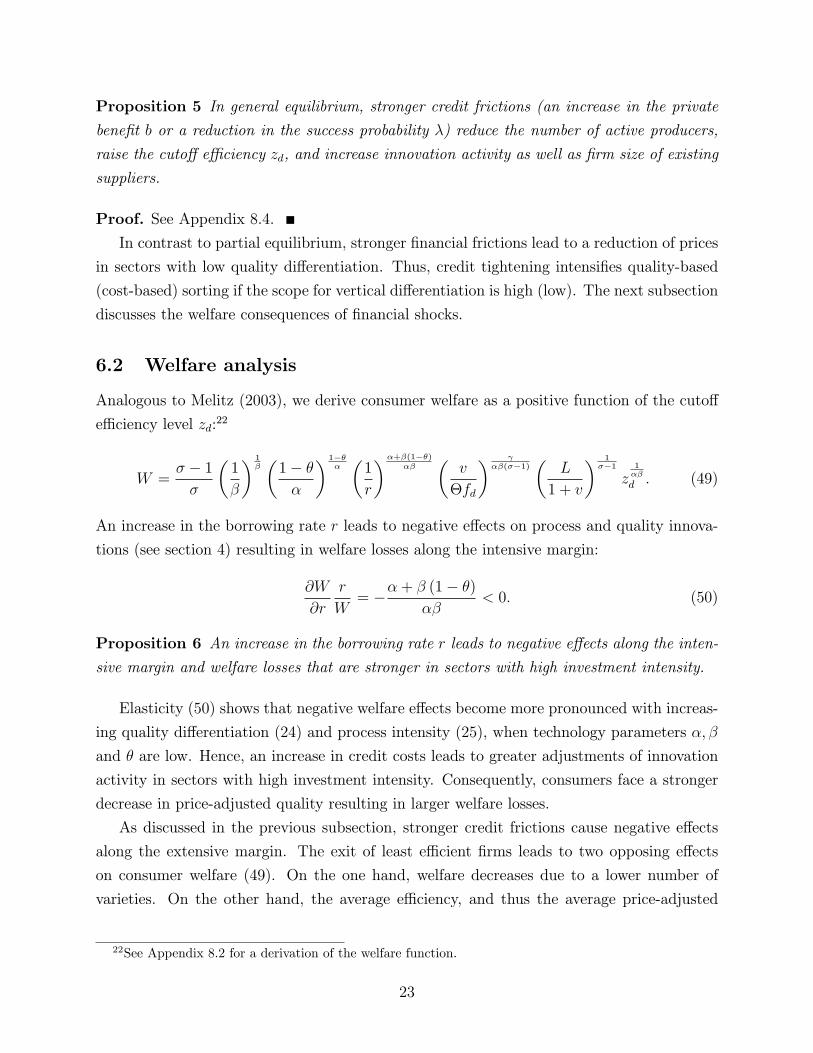
Analogous to Melitz (2003), we derive consumer welfare as a positive function of the cuto�
e�ciency level zd:22
W =� � 1�
�1
�
� 1��1� �
�
� 1����1
r
��+�(1��)��
�v
�fd
� ��(��1)
�L
1 + v
� 1��1
z1��
d : (49)
An increase in the borrowing rate r leads to negative e�ects on process and quality innova-
tions (see section 4) resulting in welfare losses along the intensive margin:
@W
@r
r
W= ��+ � (1� �)
��< 0: (50)
Proposition 6 An increase in the borrowing rate r leads to negative e�ects along the inten-
sive margin and welfare losses that are stronger in sectors with high investment intensity.
Elasticity (50) shows that negative welfare e�ects become more pronounced with increas-
ing quality di�erentiation (24) and process intensity (25), when technology parameters �; �
and � are low. Hence, an increase in credit costs leads to greater adjustments of innovation
activity in sectors with high investment intensity. Consequently, consumers face a stronger
decrease in price-adjusted quality resulting in larger welfare losses.
As discussed in the previous subsection, stronger credit frictions cause negative e�ects
along the extensive margin. The exit of least e�cient �rms leads to two opposing e�ects
on consumer welfare (49). On the one hand, welfare decreases due to a lower number of
varieties. On the other hand, the average e�ciency, and thus the average price-adjusted
22See Appendix 8.2 for a derivation of the welfare function.
23
quality o�ered in the economy, increases (@zd@b
> 0; @zd@�
< 0). The e�ects of credit tightening
on consumer welfare are given by:
@W
@b
b
W= � 1
��
�
� � 1�b
��+ �b� @zd
@b
b
zd
�< (>) 0; (51)
@W
@�
�
W=
1
��
� �b
�� (� � 1)�b
��+ �b+@zd@�
�
zd
�< (>) 0: (52)
Proposition 7 Stronger credit frictions (an increase in the private bene�t b or a reduction
in the success probability �) reduce consumer welfare if the private bene�t b is su�ciently
high. Welfare losses are more pronounced in sectors with low investment intensity (high �
and/or �).
Proof. See Appendix 8.4.
If �nancial development is low (captured by a high private bene�t b), stronger credit
frictions will lead to a large reduction in product variety that outweighs e�ciency gains.
Proposition 7 shows that the extent of welfare losses after credit tightening depends on the
sectoral investment intensity. An increase in the borrowing rate leads to a larger reduction
in consumer welfare in sectors with high investment intensity due to stronger within-�rm
adjustments (see Proposition 6). In contrast, changes in the private bene�t b and the success
probability � lead to a negative impact along the extensive margin which a�ects sectors with
low investment intensity more severely. The reason is that consumers in those sectors put
more weight on the loss of variety compared to e�ciency gains due to the exit of �rms. Figure
5 illustrates the larger welfare responses to an increase in b for sectors with high levels of
investment cost parameters � and � (see Table 2 for chosen parameter values). The negative
variety e�ect and thus welfare losses are more pronounced if �nancial development is low
(high private bene�t) and dispersion of �rm capabilities is high (larger values for Pareto
shape parameters). If the distribution of �rms in the e�ciency space is more dispersed,
e�ciency gains after �rm exit will be lower, which results in stronger reactions of welfare.
Thus, the comparative static analysis shows that the e�ects of �nancial shocks within
a sector depend on the investment intensity and the role of quality di�erentiation. Both
in partial and general equilibrium, the scope for vertical di�erentiation (26) determines
how optimal investment and pricing behavior is a�ected by credit conditions. Furthermore,
aggregate e�ects of credit tightening depend on the sectoral investment intensity for quality
(24) and processes (25). Interest rate shocks lead to adjustments along the intensive margin
and especially hurt sectors with high investment intensity. Stronger credit frictions a�ect
the extensive margin of international trade, whereas sectors with low investment intensity
face larger welfare losses.
24
7 Conclusion
This paper has analyzed the e�ects of credit frictions on within-�rm adjustments and selec-
tion into exporting in a two-dimensional heterogeneous �rm model with endogenous inno-
vation choices. Whereas existing trade models with �nancial frictions are mainly based on
Melitz (2003), three elements are crucial for our theoretical analysis. First, we allow both for
Melitz-type cost sorting and vertical product di�erentiation. Like in single-attribute models,
�rm's competitiveness and hence pro�ts are determined by a one-dimensional productivity
measure. The latter can be separated along two dimensions, namely the cost-based and
the quality-based capability of a producer. Second, we consider innovations in quality and
processes associated with endogenous sunk costs that decrease in capabilities. Third, we
assume that investment costs have to be �nanced by external investors and introduce credit
constraints motivated by moral hazard based on Holmstrom and Tirole (1997).
We show that the scope for vertical product di�erentiation in a sector determines how
�nancial shocks a�ect investment and price setting. Consistent with recent empirical ev-
idence, we rationalize positive as well as negative correlations of FOB prices with credit
frictions and variable trade costs. In addition, we distinguish the e�ects of �nancial frictions
in partial and general equilibrium. In partial equilibrium, which could be interpreted as a
short-term scenario, the number of suppliers is �xed and credit tightening leads to negative
e�ects on investment. In general equilibrium, stronger credit frictions intensify quality-based
(cost-based) sorting of �rms if the scope for vertical product di�erentiation is high (low).
Consequently, credit tightening leads to �rm exit, increased innovation activity among ex-
isting suppliers and welfare losses that are larger in sectors with low investment intensity.
Our theoretical analysis could be extended in several directions. First, we do not allow
for market-speci�c investments. Both process innovations and quality upgrades are spread
across domestic and foreign markets, whereas recent empirical evidence points to quality-
based market segmentation of exporters (Bastos and Silva, 2010; Manova and Zhang, 2012;
Flach, 2014). Second, suppliers rely on one source of external capital to �nance total in-
vestment costs. This allows us to focus on within-�rm adjustments, whereas selection ef-
fects between di�erent sources of external �nance might play an important role as well (see
Hou and Zhang, 2012). Third, whereas our analysis focuses on a CES demand structure,
credit frictions may in uence price-cost markups. Lastly, we concentrate on ex-post moral
hazard to introduce credit rationing. Empirical and theoretical literature suggests other
channels through which �nancial market imperfections may in uence export behavior like
higher default risk, information asymmetries regarding �rm attributes or imperfect �nancial
contractibility (see Manova, 2013; Feenstra et al., 2014, among others).
25
8 Mathematical Appendix
8.1 Maximization problem of �rm
This section derives the optimal investment and pricing behavior of a �rm with export status
l 2 d; x, whereas 1fx�x>0g takes a value of 1 if the �rm is an exporter and is zero otherwise.
Firms maximize expected pro�ts (6) which can be written as follows:
��l = �XP �q��1l
�p1��l + 1fx�x>0g (p
�x)1�� � q�l
el
�p��l + 1fx�x>0g� (p
�x)����� �kl � fl, (53)
subject to the constraints (7), (8) and (10). The �rst order conditions for optimal domestic
prices pl and export prices p�x, as well as investment levels el and ql, are given by:
(�+ �3)XP�q��1l
�(1� �)p��l + �p���1l
q�lel
�= 0, (54)
(�+ �3)XP�q��1x
�(1� �) (p�x)
�� + �� (p�x)���1 q
�x
ex
�= 0, (55)
(�+ �3)XP� q
�+��1l
e2l
�p��l + 1fx�x>0g� (p
�x)���� �1
�
'e��1l = 0, (56)
(�+ �3)XP� (� � 1) q��2l
�p1��l + 1fx�x>0g (p
�x)1���
+(�+ �3)XP� (� + � � 1) q�+��2l
el
�p��l + 1fx�x>0g� (p
�x)���� �1
�
�q��1l = 0 (57)
Optimality conditions with respect to credit amount dl and loan repayment kl are:
�1 � r�2 = 0 , (58)
��+ �2�� �3 = 0 , (59)
whereas �1, �2 and �3 are the Lagrange multipliers of the constraints (7), (8) and (10)
respectively. Combining equations (58) and (59) leads to �+�3�1
= ��2�1= �
r, whereas �3 = 0
if incentive compatibility is not binding. The optimal prices (14) follow immediately from
equations (54) and (55). Combining the optimal pricing rules with the �rst-order conditions
for quality (56) and process innovations (57), leads to:
el =
��'Al�r
� 1�+1��
q(��1)(1��)�+1��
l ; (60)
26
ql =
�� (1� �)�Al
�r
� 1�+(1��)(1��)
e��1
�+(1��)(1��)l ; (61)
where market size for domestic producers and exporters is de�ned as: Ad = XP ����1�
��,
Ax = (1 + � 1��)Ad: Equations (60) and (61) show the complementary structure of process
and quality innovations, as discussed in section 3.3. Combining the two expressions leads
to the optimal investment choices described by equations (11) and (12). By inserting the
optimal investment levels into the �rst order conditions (54) and (55), one obtains the
optimal price (14). Total sales of a �rm with export status l 2 d; x are de�ned by sl('; �) =XP �
�qlpl
���1+ 1fx�x>0gXP
��qxp�x
���1, whereas p�x = �px: Inserting the optimal choices of
quality innovation (12) and price setting (14) immediately leads to expression (15). The
optimal loan repayment kl follows from the constraints (7) as well as (8) and can be written
as function of revenues:
�kl =� � 1�
�sl(z)
�1
�+1� �
�
�: (62)
8.2 Derivation of welfare
To derive the welfare function (49), we aggregate the price index (2) as follows:
P 1�� =Md
Z Z(';�)2Dd
�qdpd
���1�d('; �)d'd�+
�1 + � 1��
�Mx
Z Z(';�)2Dx
�qxpx
���1�x('; �)d'd�:
By using the expression for �rm-speci�c quality-price ratios (22) and exploiting the labor
market clearing condition (41), consumer welfare can be written as:
W = P�1 =� � 1�
��1�
�1� �
�
� 1����
L
r (1 + v)
��+�(1��)��
�Mdez ��1 d +
�1 + � 1��
��� Mxez ��1 x �
��(��1)
:
Analogous to Melitz (2003), we substitute for average e�ciencies ezl by using the relationshipsl(ezl)sl(zl)
=� ezlzl
���1 = Sl
Ml
(��1)v�( 1�+
b��)fl
, and exploit that zxzd=�fxfd
� ��1(1 + � 1��)
�����1 : After some
modi�cations, this allows to write welfare per worker as a function of the cuto� e�ciency
zd, as speci�ed in equation (49).
8.3 Solution with Pareto distributed capabilities
To obtain an explicit solution for the cuto� e�ciency zd, we assume that �rm speci�c capabili-
ties ' and � are independently Pareto distributed with positive support over [1; ']�[1;1] and' > 1. The probability of drawing a particular combination of ' and � is then given by:
27

h ('; �) = h'(')h�(�) with h�(�) = �����1 and h'(') = # '�#�1
1�'�# , where � and # are the
shape parameters of the Pareto distributions. Probabilities of success �s and of belonging to
the groups of non-exporters and exporters respectively �l, as de�ned by equation (33), can
be expressed as functions of cuto� e�ciency levels zl; for l 2 d; x:
�s =1
z
���(1��)d ;�d =
1
�z
���(1��)d � z
���(1��)x
�;�x =
1
z
���(1��)x ;
whereby = ���#�(1��)#�(1��)
1�'�#
'���#�(1��)
�(1��) �1. The shares of exporters and domestic sellers, l =
�l�s;
are then given by:
x =
�zdzx
� ��(1��)
; d = 1��zdzx
� ��(1��)
;
with zdzx=�fdfx
� ��1(1 + � 1��)
����1 . The components of expected pro�ts in equation (38) can
be expressed as:
d
�ezdzd
���1
=
1�
�zdzx
� � ��(1��)(��1) �(1��)
!; (63)
x
�ezxzx
���1
=
�zdzx
� ��(1��)
; (64)
where = � � ��(1��)(��1) . The free entry condition (39) is an increasing function of the cuto�
e�ciency zd:
E� = �fEz�
�(1��)d :
For technical reasons, we assume that the Pareto shape parameters are su�ciently large,
� > �(1��)(��1)
and # > ���(1��) , such that ; > 0. For the further analysis, we de�ne a
measure for average e�ciency �z and the average �xed costs ef in the economy:�z = 1 + x
fxfd
(1 + � 1��)�� � 1
(1 + � 1��)��
; ef = dfd + xfx.
Combining expected pro�ts and the free entry condition, leads to an explicit solution for the
cuto� e�ciency level zd:
zd =
�E�
�fE
��(1��)�
; (65)
whereas expected pro�ts can be written as: E� = �z�fd � ef .Number of active �rms As shown by equation (41), the number of active �rms in
one country is a function of labor supply L and average revenues (38). To solve for the
28
number of �rms explicitly, we use the expressions for expected e�ciencies of non-exporters
and exporters (63) and (64). With Pareto distributed capabilities, average revenues can be
expressed as:
�es = ��s�fd(� � 1) v ;
with �s = 1 + xfxfd
(1+�1��)1 �1
(1+�1��)1 . The number of active �rms in one country is given by:
M =(� � 1) vL
��s�fd
h1� ��1
�
�1�+ 1��
�
�i , (66)
and the number of total varieties in one economy is de�ned as: Mx = (1 + x)M:
8.4 Proofs
Proof of Proposition 5. The change of the number of �rms with respect to the private
bene�t b and the success probability � , as shown in equations (47) and (48) respectively,
follows immediately from the derivative of equation (66). The derivatives of the cuto�
e�ciency zd (65) are given by:
@zd@b
b
zd=�(1� �)
���
�bfd�z
E�> 0; (67)
@zd@�
�
zd= ��(1� �)
���2��bbfd�z
E�< 0: (68)
The general equilibrium e�ects of credit tightening on investment and price setting can be
derived from equations (11)-(14), by taking into account incentive compatibility (17) and
the changes in the cuto� e�ciency (67) and (68). The responses of process and quality
innovations to an increase in the private bene�t b are given by:
@el@b
b
el=1
�
b�
b�+��
1� �(1� �) (� � 1)
�
E� + ~f
E�
!; (69)
@ql@b
b
el=1
�
b�
b�+��
1� �(1� �) (� � 1)
�
E� + ~f
E�
!: (70)
The investment responses are positive as long as �(1��)(��1)�
E�+ ~fE�
< 1. Note that �(1��)(��1)�
<
1 and E�+ ~fE�
> 1, whereas@�E�+ ~fE�
�@b
< 0. Hence, the general equilibrium response of innovations
is positive whenever private bene�ts are su�ciently high. The derivatives of the relative
29
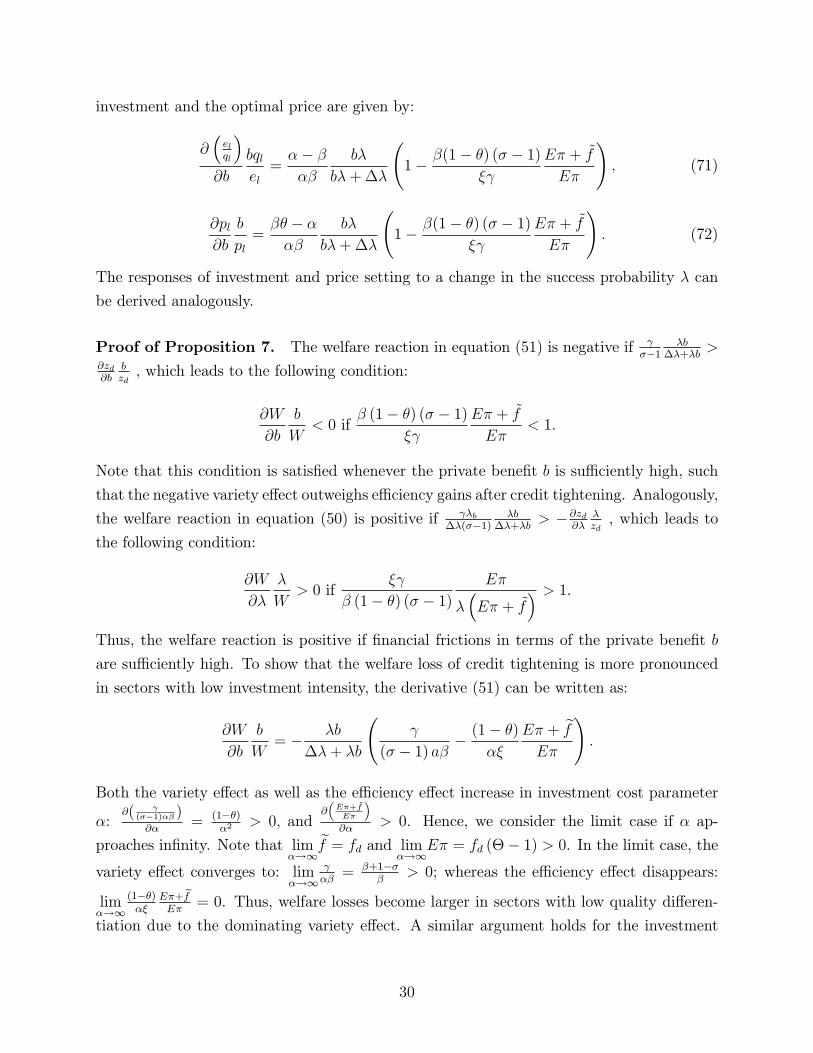
investment and the optimal price are given by:
@�elql
�@b
bqlel=�� �
��
b�
b�+��
1� �(1� �) (� � 1)
�
E� + ~f
E�
!; (71)
@pl@b
b
pl=�� � �
��
b�
b�+��
1� �(1� �) (� � 1)
�
E� + ~f
E�
!: (72)
The responses of investment and price setting to a change in the success probability � can
be derived analogously.
Proof of Proposition 7. The welfare reaction in equation (51) is negative if ��1
�b��+�b
>@zd@b
bzd, which leads to the following condition:
@W
@b
b
W< 0 if
� (1� �) (� � 1)�
E� + ~f
E�< 1.
Note that this condition is satis�ed whenever the private bene�t b is su�ciently high, such
that the negative variety e�ect outweighs e�ciency gains after credit tightening. Analogously,
the welfare reaction in equation (50) is positive if �b��(��1)
�b��+�b
> �@zd@�
�zd, which leads to
the following condition:
@W
@�
�
W> 0 if
�
� (1� �) (� � 1)E�
��E� + ~f
� > 1.Thus, the welfare reaction is positive if �nancial frictions in terms of the private bene�t b
are su�ciently high. To show that the welfare loss of credit tightening is more pronounced
in sectors with low investment intensity, the derivative (51) can be written as:
@W
@b
b
W= � �b
��+ �b
(� � 1) a� �(1� �)
��
E� + efE�
!:
Both the variety e�ect as well as the e�ciency e�ect increase in investment cost parameter
�:@(
(��1)�� )@�
= (1��)�2
> 0; and@�E�+ ~fE�
�@�
> 0. Hence, we consider the limit case if � ap-
proaches in�nity. Note that lim�!1
ef = fd and lim�!1
E� = fd (�� 1) > 0. In the limit case, thevariety e�ect converges to: lim
�!1 ��= �+1��
�> 0; whereas the e�ciency e�ect disappears:
lim�!1
(1��)��
E�+ efE�
= 0. Thus, welfare losses become larger in sectors with low quality di�eren-
tiation due to the dominating variety e�ect. A similar argument holds for the investment
30
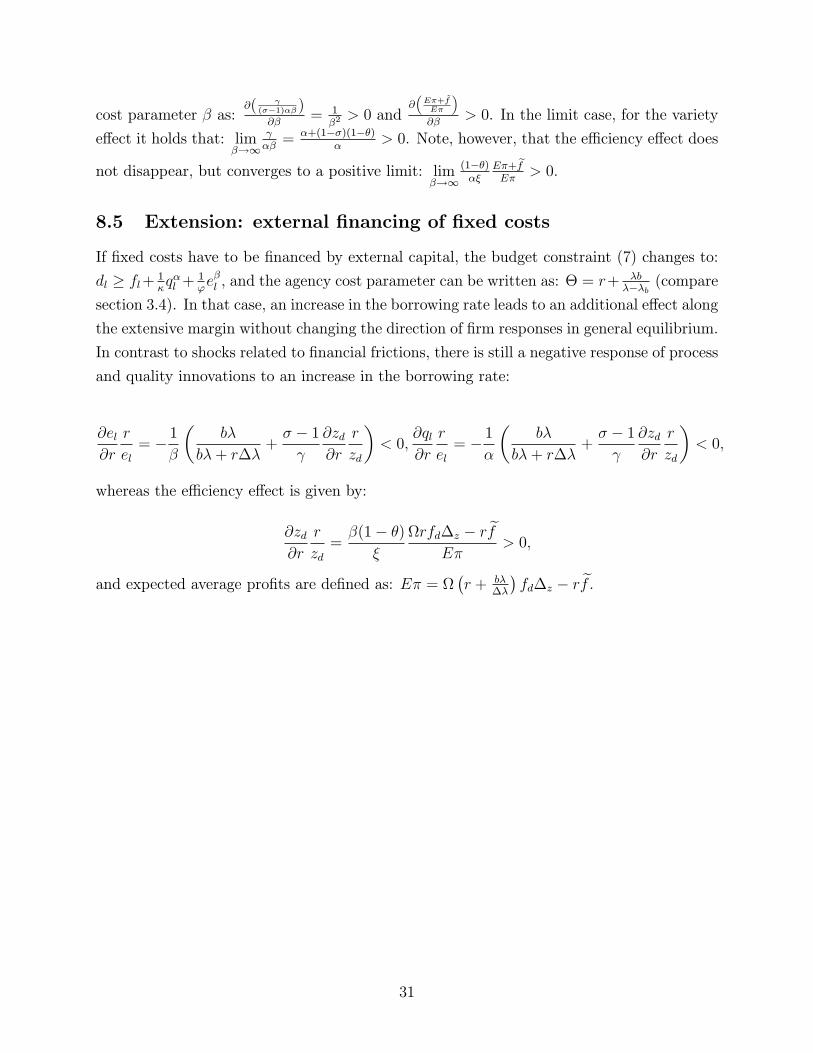
cost parameter � as:@(
(��1)�� )@�
= 1�2> 0 and
@�E�+ ~fE�
�@�
> 0. In the limit case, for the variety
e�ect it holds that: lim�!1
��= �+(1��)(1��)
�> 0. Note, however, that the e�ciency e�ect does
not disappear, but converges to a positive limit: lim�!1
(1��)��
E�+ efE�
> 0:
8.5 Extension: external �nancing of �xed costs
If �xed costs have to be �nanced by external capital, the budget constraint (7) changes to:
dl � fl+1�q�l +
1'e�l , and the agency cost parameter can be written as: � = r+ �b
���b (compare
section 3.4). In that case, an increase in the borrowing rate leads to an additional e�ect along
the extensive margin without changing the direction of �rm responses in general equilibrium.
In contrast to shocks related to �nancial frictions, there is still a negative response of process
and quality innovations to an increase in the borrowing rate:
@el@r
r
el= � 1
�
�b�
b�+ r��+� � 1
@zd@r
r
zd
�< 0;
@ql@r
r
el= � 1
�
�b�
b�+ r��+� � 1
@zd@r
r
zd
�< 0;
whereas the e�ciency e�ect is given by:
@zd@r
r
zd=�(1� �)
�
rfd�z � r efE�
> 0;
and expected average pro�ts are de�ned as: E� = �r + b�
��
�fd�z � r ef .
31
References
Amiti, M. and D. E. Weinstein (2011). Exports and Financial Shocks. The Quarterly Journal
of Economics 126 (4), 1841{1877.
Antoniades, A. (2015). Heterogeneous Firms, Quality, and Trade. Journal of International
Economics 95 (2), 263{273.
Antr�as, P. and R. J. Caballero (2009). Trade and Capital Flows: A Financial Frictions
Perspective. Journal of Political Economy 117 (4), 701{744.
Antr�as, P., M. A. Desai, and C. F. Foley (2009). Multinational Firms, FDI Flows, and
Imperfect Capital Markets. The Quarterly Journal of Economics 124 (3), 1171{1219.
Arkolakis, C. (2010). Market Penetration Costs and the New Consumers Margin in Interna-
tional Trade. Journal of Political Economy 118 (6), 1151 { 1199.
Athey, S. and A. Schmutzler (1995). Product and Process Flexibility in an Innovative
Environment. RAND Journal of Economics 26 (4), 557{574.
Baldwin, R. and J. Harrigan (2011). Zeros, Quality, and Space: Trade Theory and Trade
Evidence. American Economic Journal: Microeconomics 3 (2), 60{88.
Bastos, P. and J. Silva (2010). The quality of a �rm's exports: Where you export to matters.
Journal of International Economics 82 (2), 99{111.
Berman, N. and J. H�ericourt (2010). Financial factors and the margins of trade: Evidence
from cross-country �rm-level data. Journal of Development Economics 93 (2), 206{217.
Bernard, A. B., S. J. Redding, and P. K. Schott (2011). Multiproduct Firms and Trade
Liberalization. The Quarterly Journal of Economics 126 (3), 1271{1318.
Bernini, M., S. Guillou, and F. Bellone (2013). Firms' Leverage and Export Quality: Ev-
idence from France. GREDEG Working Papers 2013-29, University of Nice Sophia An-
tipolis.
Buch, C. M., I. Kesternich, A. Lipponer, and M. Schnitzer (2010). Exports Versus FDI
Revisited: Does Finance Matter? CEPR Discussion Papers 7839.
Bustos, P. (2011). Trade Liberalization, Exports, and Technology Upgrading: Evidence on
the Impact of MERCOSUR on Argentinian Firms. American Economic Review 101 (1),
304{40.
32
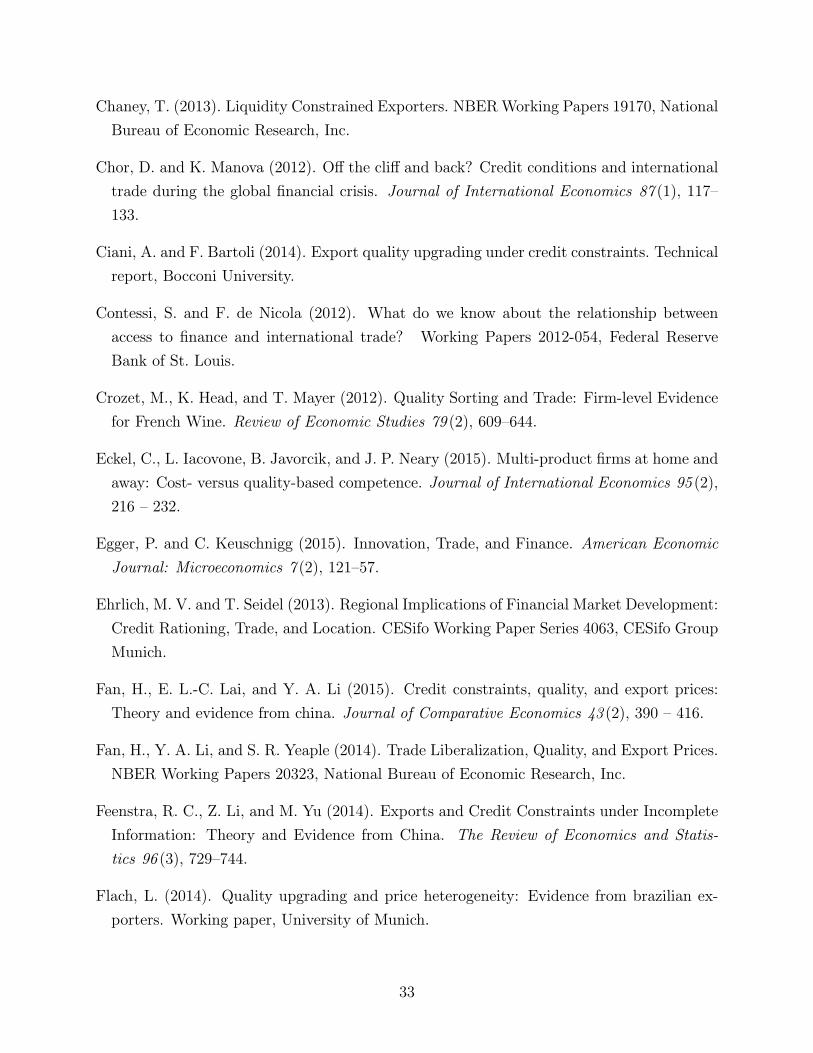
Chaney, T. (2013). Liquidity Constrained Exporters. NBERWorking Papers 19170, National
Bureau of Economic Research, Inc.
Chor, D. and K. Manova (2012). O� the cli� and back? Credit conditions and international
trade during the global �nancial crisis. Journal of International Economics 87 (1), 117{
133.
Ciani, A. and F. Bartoli (2014). Export quality upgrading under credit constraints. Technical
report, Bocconi University.
Contessi, S. and F. de Nicola (2012). What do we know about the relationship between
access to �nance and international trade? Working Papers 2012-054, Federal Reserve
Bank of St. Louis.
Crozet, M., K. Head, and T. Mayer (2012). Quality Sorting and Trade: Firm-level Evidence
for French Wine. Review of Economic Studies 79 (2), 609{644.
Eckel, C., L. Iacovone, B. Javorcik, and J. P. Neary (2015). Multi-product �rms at home and
away: Cost- versus quality-based competence. Journal of International Economics 95 (2),
216 { 232.
Egger, P. and C. Keuschnigg (2015). Innovation, Trade, and Finance. American Economic
Journal: Microeconomics 7 (2), 121{57.
Ehrlich, M. V. and T. Seidel (2013). Regional Implications of Financial Market Development:
Credit Rationing, Trade, and Location. CESifo Working Paper Series 4063, CESifo Group
Munich.
Fan, H., E. L.-C. Lai, and Y. A. Li (2015). Credit constraints, quality, and export prices:
Theory and evidence from china. Journal of Comparative Economics 43 (2), 390 { 416.
Fan, H., Y. A. Li, and S. R. Yeaple (2014). Trade Liberalization, Quality, and Export Prices.
NBER Working Papers 20323, National Bureau of Economic Research, Inc.
Feenstra, R. C., Z. Li, and M. Yu (2014). Exports and Credit Constraints under Incomplete
Information: Theory and Evidence from China. The Review of Economics and Statis-
tics 96 (3), 729{744.
Flach, L. (2014). Quality upgrading and price heterogeneity: Evidence from brazilian ex-
porters. Working paper, University of Munich.
33
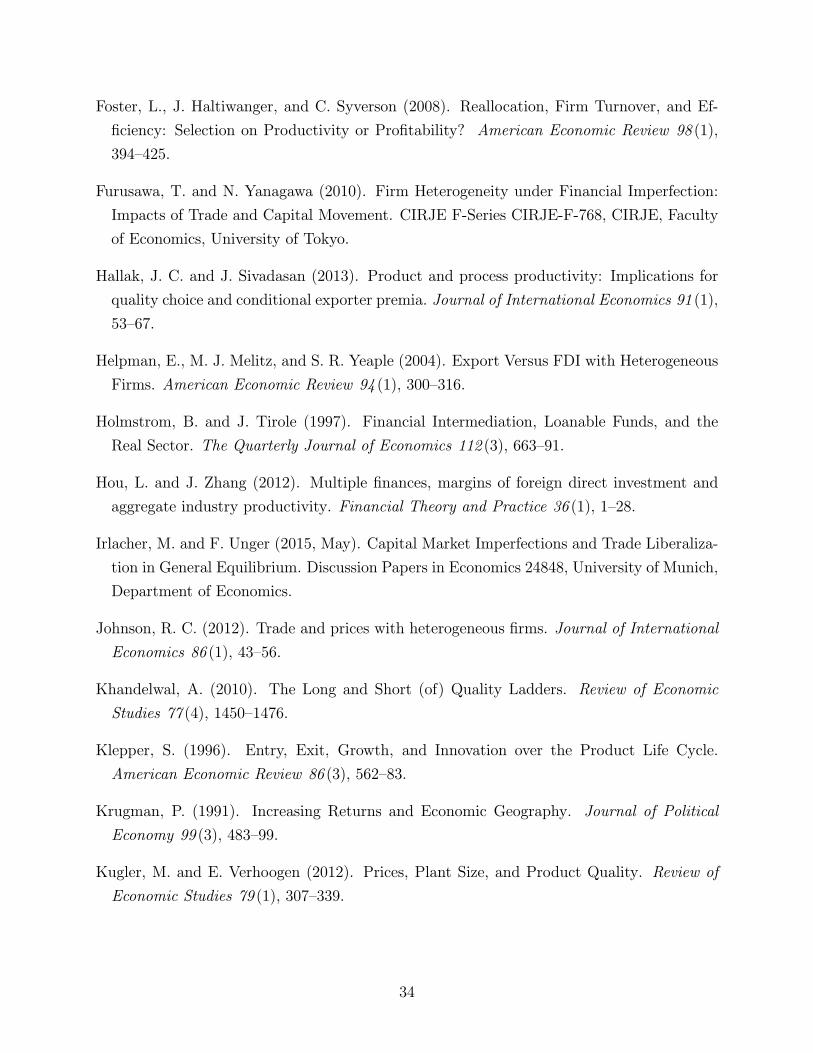
Foster, L., J. Haltiwanger, and C. Syverson (2008). Reallocation, Firm Turnover, and Ef-
�ciency: Selection on Productivity or Pro�tability? American Economic Review 98 (1),
394{425.
Furusawa, T. and N. Yanagawa (2010). Firm Heterogeneity under Financial Imperfection:
Impacts of Trade and Capital Movement. CIRJE F-Series CIRJE-F-768, CIRJE, Faculty
of Economics, University of Tokyo.
Hallak, J. C. and J. Sivadasan (2013). Product and process productivity: Implications for
quality choice and conditional exporter premia. Journal of International Economics 91 (1),
53{67.
Helpman, E., M. J. Melitz, and S. R. Yeaple (2004). Export Versus FDI with Heterogeneous
Firms. American Economic Review 94 (1), 300{316.
Holmstrom, B. and J. Tirole (1997). Financial Intermediation, Loanable Funds, and the
Real Sector. The Quarterly Journal of Economics 112 (3), 663{91.
Hou, L. and J. Zhang (2012). Multiple �nances, margins of foreign direct investment and
aggregate industry productivity. Financial Theory and Practice 36 (1), 1{28.
Irlacher, M. and F. Unger (2015, May). Capital Market Imperfections and Trade Liberaliza-
tion in General Equilibrium. Discussion Papers in Economics 24848, University of Munich,
Department of Economics.
Johnson, R. C. (2012). Trade and prices with heterogeneous �rms. Journal of International
Economics 86 (1), 43{56.
Khandelwal, A. (2010). The Long and Short (of) Quality Ladders. Review of Economic
Studies 77 (4), 1450{1476.
Klepper, S. (1996). Entry, Exit, Growth, and Innovation over the Product Life Cycle.
American Economic Review 86 (3), 562{83.
Krugman, P. (1991). Increasing Returns and Economic Geography. Journal of Political
Economy 99 (3), 483{99.
Kugler, M. and E. Verhoogen (2012). Prices, Plant Size, and Product Quality. Review of
Economic Studies 79 (1), 307{339.
34
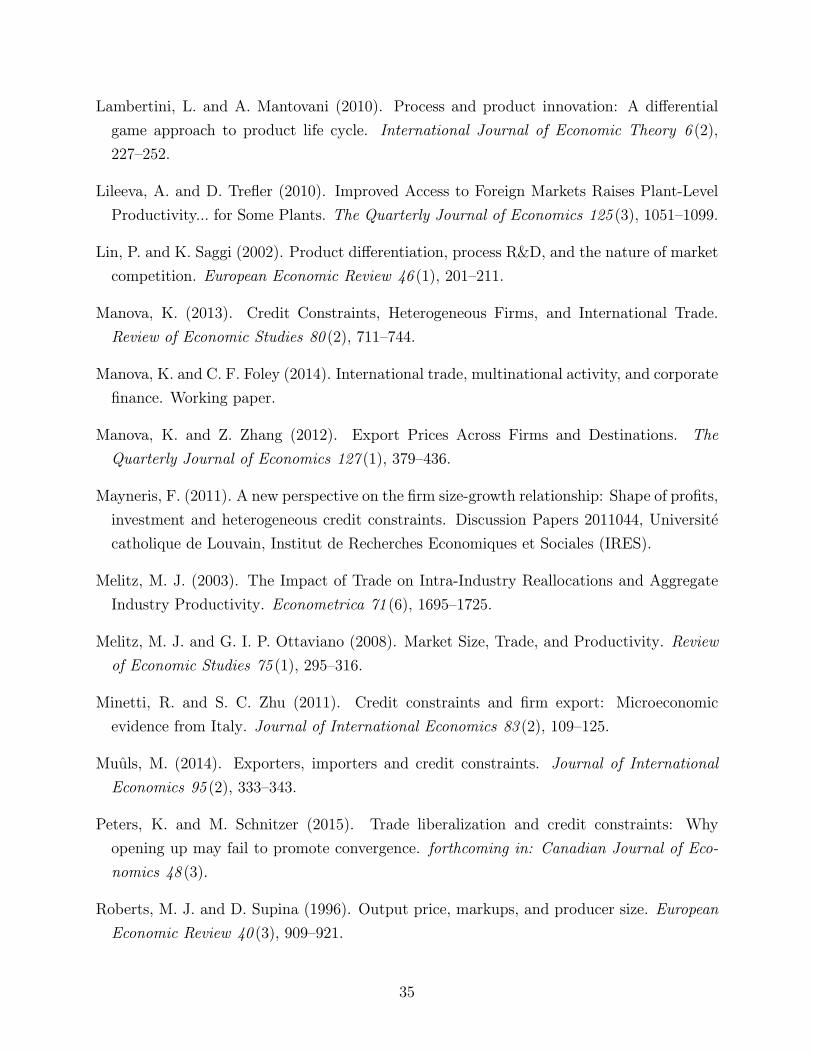
Lambertini, L. and A. Mantovani (2010). Process and product innovation: A di�erential
game approach to product life cycle. International Journal of Economic Theory 6 (2),
227{252.
Lileeva, A. and D. Tre er (2010). Improved Access to Foreign Markets Raises Plant-Level
Productivity... for Some Plants. The Quarterly Journal of Economics 125 (3), 1051{1099.
Lin, P. and K. Saggi (2002). Product di�erentiation, process R&D, and the nature of market
competition. European Economic Review 46 (1), 201{211.
Manova, K. (2013). Credit Constraints, Heterogeneous Firms, and International Trade.
Review of Economic Studies 80 (2), 711{744.
Manova, K. and C. F. Foley (2014). International trade, multinational activity, and corporate
�nance. Working paper.
Manova, K. and Z. Zhang (2012). Export Prices Across Firms and Destinations. The
Quarterly Journal of Economics 127 (1), 379{436.
Mayneris, F. (2011). A new perspective on the �rm size-growth relationship: Shape of pro�ts,
investment and heterogeneous credit constraints. Discussion Papers 2011044, Universit�e
catholique de Louvain, Institut de Recherches Economiques et Sociales (IRES).
Melitz, M. J. (2003). The Impact of Trade on Intra-Industry Reallocations and Aggregate
Industry Productivity. Econometrica 71 (6), 1695{1725.
Melitz, M. J. and G. I. P. Ottaviano (2008). Market Size, Trade, and Productivity. Review
of Economic Studies 75 (1), 295{316.
Minetti, R. and S. C. Zhu (2011). Credit constraints and �rm export: Microeconomic
evidence from Italy. Journal of International Economics 83 (2), 109{125.
Muuls, M. (2014). Exporters, importers and credit constraints. Journal of International
Economics 95 (2), 333{343.
Peters, K. and M. Schnitzer (2015). Trade liberalization and credit constraints: Why
opening up may fail to promote convergence. forthcoming in: Canadian Journal of Eco-
nomics 48 (3).
Roberts, M. J. and D. Supina (1996). Output price, markups, and producer size. European
Economic Review 40 (3), 909{921.
35
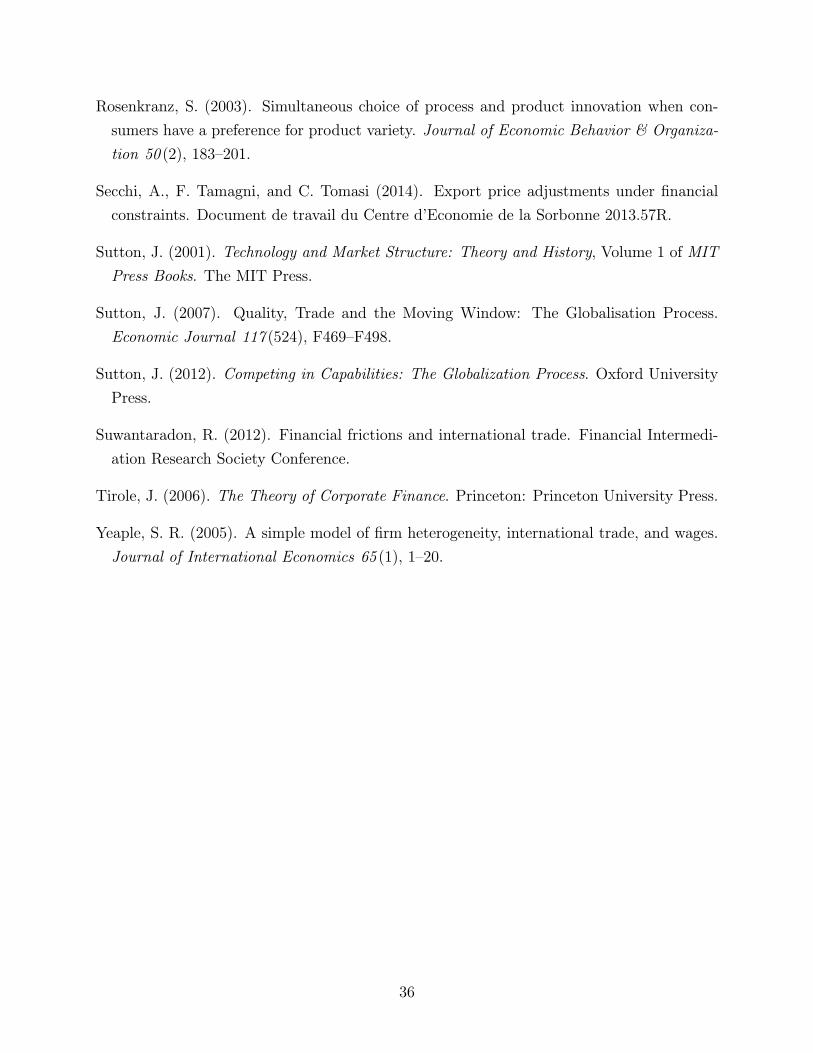
Rosenkranz, S. (2003). Simultaneous choice of process and product innovation when con-
sumers have a preference for product variety. Journal of Economic Behavior & Organiza-
tion 50 (2), 183{201.
Secchi, A., F. Tamagni, and C. Tomasi (2014). Export price adjustments under �nancial
constraints. Document de travail du Centre d'Economie de la Sorbonne 2013.57R.
Sutton, J. (2001). Technology and Market Structure: Theory and History, Volume 1 of MIT
Press Books. The MIT Press.
Sutton, J. (2007). Quality, Trade and the Moving Window: The Globalisation Process.
Economic Journal 117 (524), F469{F498.
Sutton, J. (2012). Competing in Capabilities: The Globalization Process. Oxford University
Press.
Suwantaradon, R. (2012). Financial frictions and international trade. Financial Intermedi-
ation Research Society Conference.
Tirole, J. (2006). The Theory of Corporate Finance. Princeton: Princeton University Press.
Yeaple, S. R. (2005). A simple model of �rm heterogeneity, international trade, and wages.
Journal of International Economics 65 (1), 1{20.
36
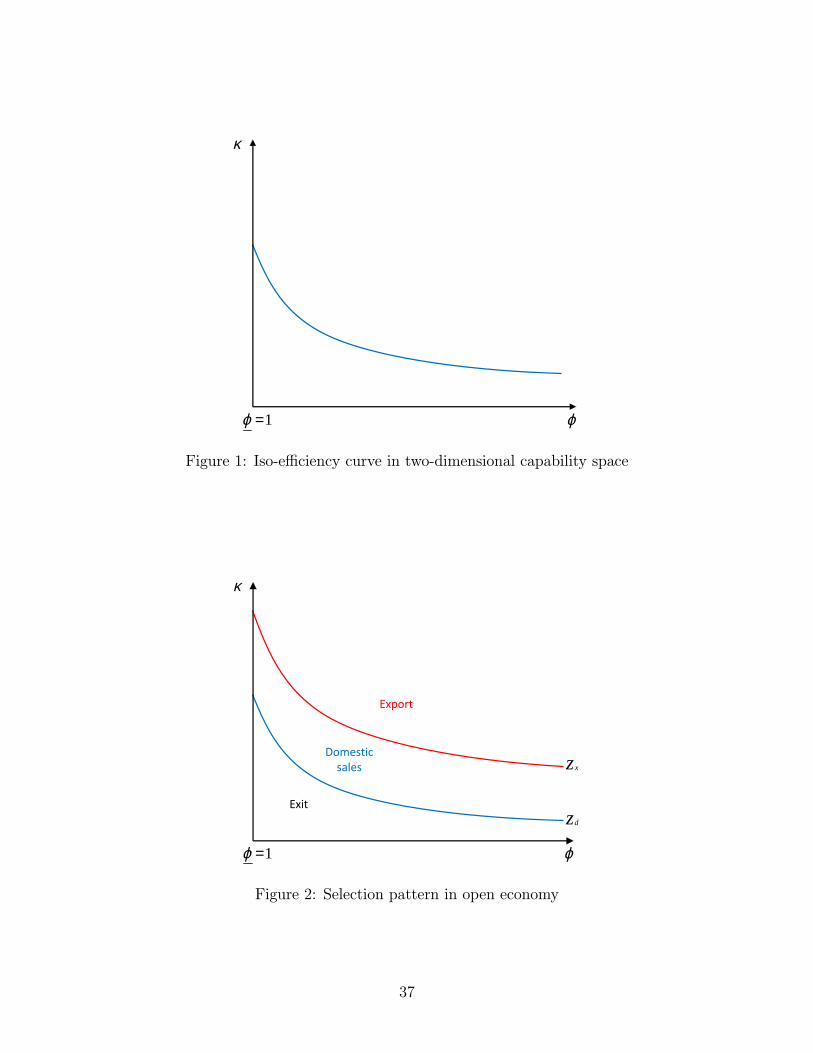
κ
ϕ1=ϕ
Figure 1: Iso-e�ciency curve in two-dimensional capability space
κ
ϕ1=ϕ
z x
zd
Export
Domesticsales
Exit
Figure 2: Selection pattern in open economy
37
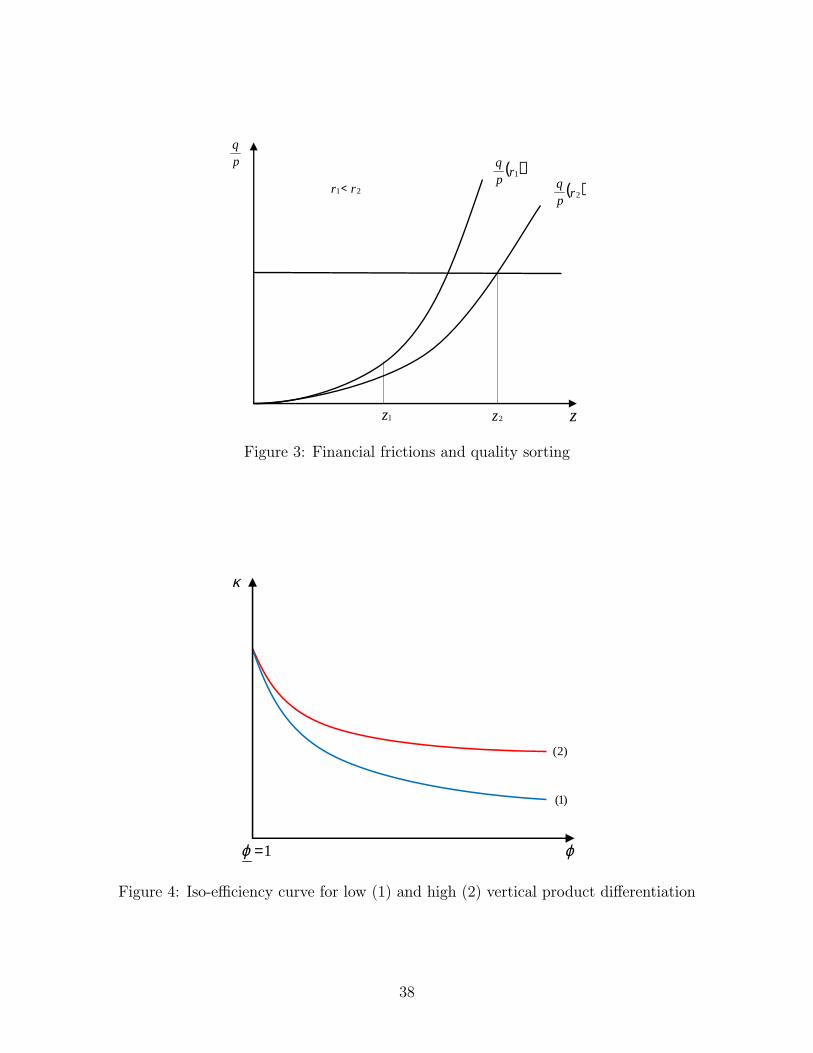
z1
( )rpq
2
( )rpq
1pq
z
rr < 21
z2
Figure 3: Financial frictions and quality sorting
κ
ϕ1=ϕ
)1(
)2(
Figure 4: Iso-e�ciency curve for low (1) and high (2) vertical product di�erentiation
38
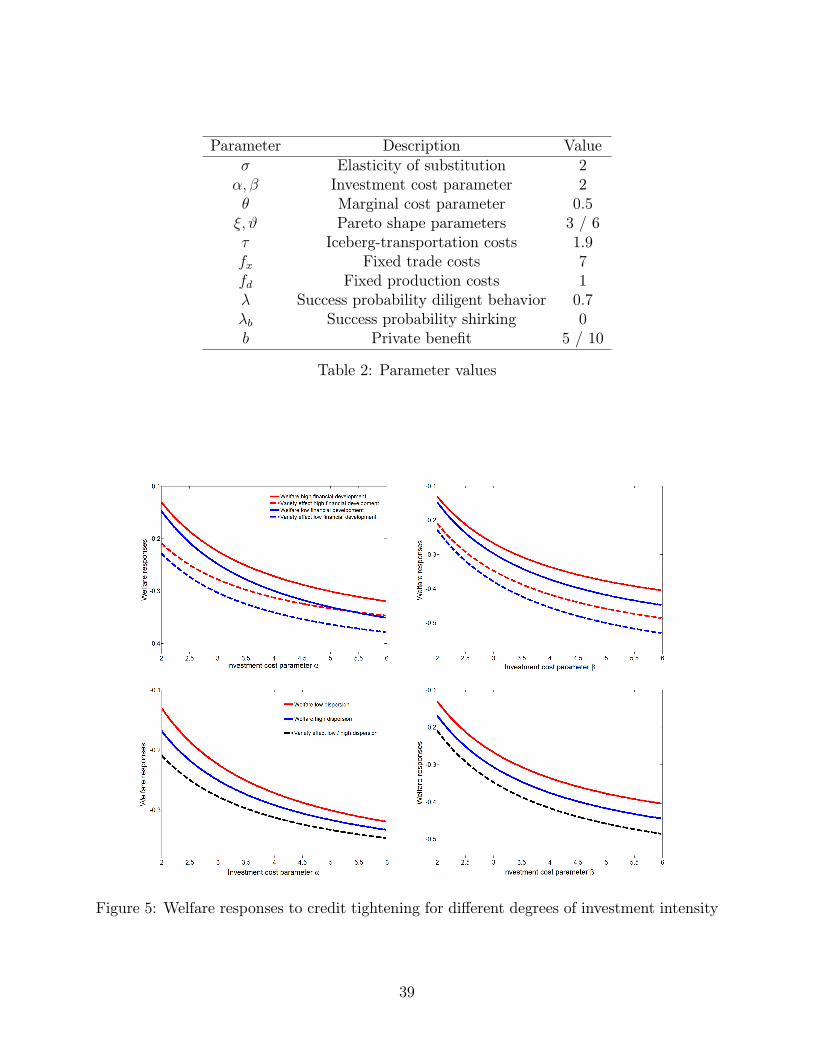
Parameter Description Value� Elasticity of substitution 2�; � Investment cost parameter 2� Marginal cost parameter 0.5�; # Pareto shape parameters 3 / 6� Iceberg-transportation costs 1.9fx Fixed trade costs 7fd Fixed production costs 1� Success probability diligent behavior 0.7�b Success probability shirking 0b Private bene�t 5 / 10
Table 2: Parameter values
Figure 5: Welfare responses to credit tightening for di�erent degrees of investment intensity
39