Embed Size (px)
Citation preview
Carrying the work burden of the Covid-19
pandemic:
working class women in the UK
Final report
Tracey Warren, Clare Lyonette
and the UK Women’s Budget Group
2
Contents
Executive Summary .............................................................................................................................................. 4
1. Introduction ................................................................................................................................................ 6
2. Methodology ............................................................................................................................................... 7
2.1 The data ............................................................................................................................................................ 7
2.2 The sample ........................................................................................................................................................ 7
2.3 Analysis ............................................................................................................................................................. 7
3. Paid employment ........................................................................................................................................ 8
3.1 How many hours do people spend at work? ..................................................................................................... 8
3.2 Who is on furlough? ........................................................................................................................................ 10
3.3 Who are the keyworkers? ............................................................................................................................... 10
3.4 Working at home ............................................................................................................................................ 11
3.5 Summary ......................................................................................................................................................... 12
4. Housework and childcare ........................................................................................................................... 13
4.1 How was housework shared before and during the pandemic?..................................................................... 13
4.2 How much time was spent on housework? .................................................................................................... 13
4.3 Who was responsible for childcare and home-schooling? .............................................................................. 14
4.4 How much time was spent on childcare/home-schooling? ............................................................................ 15
4.5 Who had access to flexible working arrangements? ...................................................................................... 16
4.6 Whose jobs were impacted by the time spent in childcare/ home-schooling?............................................... 16
4.7 Summary ......................................................................................................................................................... 17
5. Finances and hardship................................................................................................................................ 18
5.1 Which workers had low earnings? .................................................................................................................. 18
5.2 Who was able to make savings? ..................................................................................................................... 19
5.3 Financial hardship ........................................................................................................................................... 19
5.4 Summary ......................................................................................................................................................... 20
6. Life satisfaction and wellbeing.................................................................................................................... 21
6.1 Life satisfaction ............................................................................................................................................... 21
6.2 Subjective wellbeing ........................................................................................................................................ 22
6.3 Summary ......................................................................................................................................................... 22
7. Conclusions and recommendations ............................................................................................................ 23
7.1 Conclusions ...................................................................................................................................................... 23
7.2 Recommendations........................................................................................................................................... 23
For more information ......................................................................................................................................... 25
Acknowledgements ............................................................................................................................................ 25
Citation .............................................................................................................................................................. 25
3
Figures Figure 3.1: Hours worked before and after lockdown ......................................................................................................... 8
Figure 3.2: Which class groups were doing no hours of paid work in their job(s)? Women only. ...................................... 9
Figure 3.3: Who was working no hours in their job(s) in April 2020, by their work-time in January/February 2020? ....... 9
Figure 3.4: Who was furloughed? ...................................................................................................................................... 10
Figure 3.5: What % of each class group were keyworkers?............................................................................................... 11
Figure 3.6: Which sectors did keyworkers work in? .......................................................................................................... 11
Figure 3.7: Which women were always working at home, by class?................................................................................. 12
Figure 4.1: Who usually does the housework? .................................................................................................................. 13
Figure 4.2: How many hours were spent a week in routine housework? ......................................................................... 14
Figure 4.3: How many hours were spent a week in childcare/home-schooling? .............................................................. 15
Figure 4.4: Which women had access to flexible working arrangements in their workplace? ......................................... 16
Figure 4.5: Who reduced their working hours or adapted their schedules to deal with additional childcare or home-schooling?........................................................................................................................................................................... 17
Figure 5.1: Which workers had low weekly earnings? ....................................................................................................... 18
Figure 5.2: Weekly household earnings ............................................................................................................................. 19
Figure 5.3: Which workers had made savings from their income? ................................................................................... 19
Figure 5.4: Which workers were in financial hardship? ..................................................................................................... 20
Figure 6.1: Life satisfaction before and during the pandemic ........................................................................................... 21
Figure 6.2: Who was experiencing psychological distress? ............................................................................................... 22
Tables
Table 4.1: Who was responsible for childcare and home-schooling? ............................................................................... 14
Table 4.2: Which class groups of women had the main responsibility for childcare and home-schooling?..................... 15
4
Executive Summary Working class women are carrying the burden of the extra physical and emotional labour being generated by the Covid-19 pandemic. These women care for children, sick and frail elderly, clean buildings, cook and serve food, administer institutions and staff shops, while retaining major responsibility for domestic work and caring at home. Our 12-month project, funded by the Economic and Social Research Council, as part of UK Research and Innovation’s rapid response to Covid-19, was conducted in collaboration with the UK Women’s Budget Group, the leading independent organisation that deals with the impact of policy on women's lives. We analysed data from ‘Understanding Society’ (the UK Household Longitudinal Study), including vital new information gathered monthly from April 2020 on the impact of Covid-19.
More than a year on from the first lockdowns in the UK, we found that the Covid-19 pandemic has highlighted the key, essential but under-valued work performed by working class women. It both exposed and intensified the deep gender and class inequalities that, together, impact the women’s working lives, with pandemic pressures resulting in further job and financial insecurity, heavier care responsibilities, and real challenges in managing unpaid and paid work.
Paid employment: Lockdown brought a big increase in the numbers of people who were still employed but doing no work at all in their jobs. Working class women and/or women working short part-time hours were those most likely to go from positive to no hours of paid work during the pandemic. Working class women and men were more likely to be furloughed than workers in middle class jobs, but keyworking was also highest among working class women. Female keyworkers disproportionately work in frontline customer- and patient-facing jobs, bringing a greater exposure to health risks at work. Very few working class women were working from home during the pandemic.
Housework and childcare: Employed women were doing much more housework, more childcare and more home-schooling than men during the pandemic, and women’s share of housework and childcare grew after the pandemic hit. Mothers were far more likely than fathers to have main responsibility for childcare and home-schooling. Working class women were the women least likely to reduce their hours in work or change their work schedules because of the time they were spending on childcare or home-schooling. Working class women fared poorly in terms of access to good quality flexible working arrangements more generally.
Finances and hardship: Working class women had the lowest wages of all workers and those living with another adult earner had the lowest household earnings of all groups. Fewer working class women were able to make savings from their income than other women, and over a third were suffering from financial hardship.
Life satisfaction and wellbeing: Male workers reported lower levels of life satisfaction before the pandemic but, as the pandemic progressed, levels of life satisfaction among employed women decreased, taking them below men’s. Levels of life satisfaction among women and men rose and fell according to lockdown, with figures for January 2021 the lowest for both groups of worker. Working class women reported some of the lowest levels of life satisfaction in early 2021. Levels
5
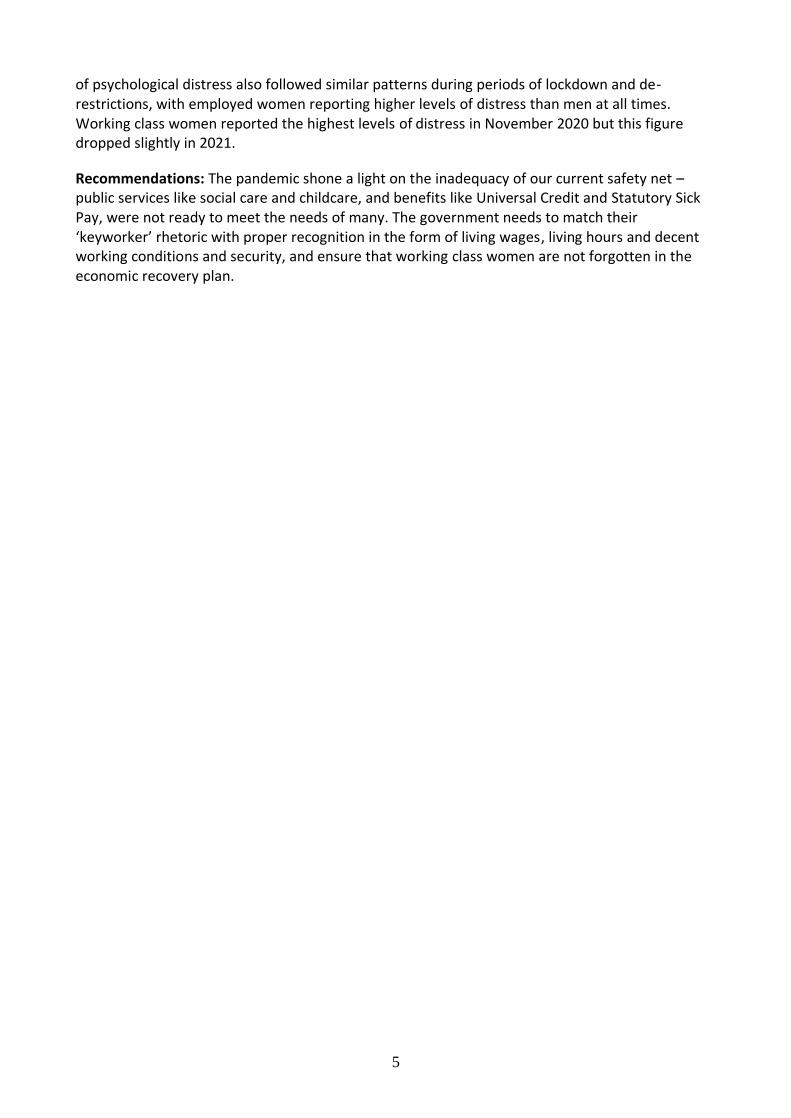
of psychological distress also followed similar patterns during periods of lockdown and de-restrictions, with employed women reporting higher levels of distress than men at all times. Working class women reported the highest levels of distress in November 2020 but this figure dropped slightly in 2021.
Recommendations: The pandemic shone a light on the inadequacy of our current safety net – public services like social care and childcare, and benefits like Universal Credit and Statutory Sick Pay, were not ready to meet the needs of many. The government needs to match their ‘keyworker’ rhetoric with proper recognition in the form of living wages, living hours and decent working conditions and security, and ensure that working class women are not forgotten in the economic recovery plan.
6
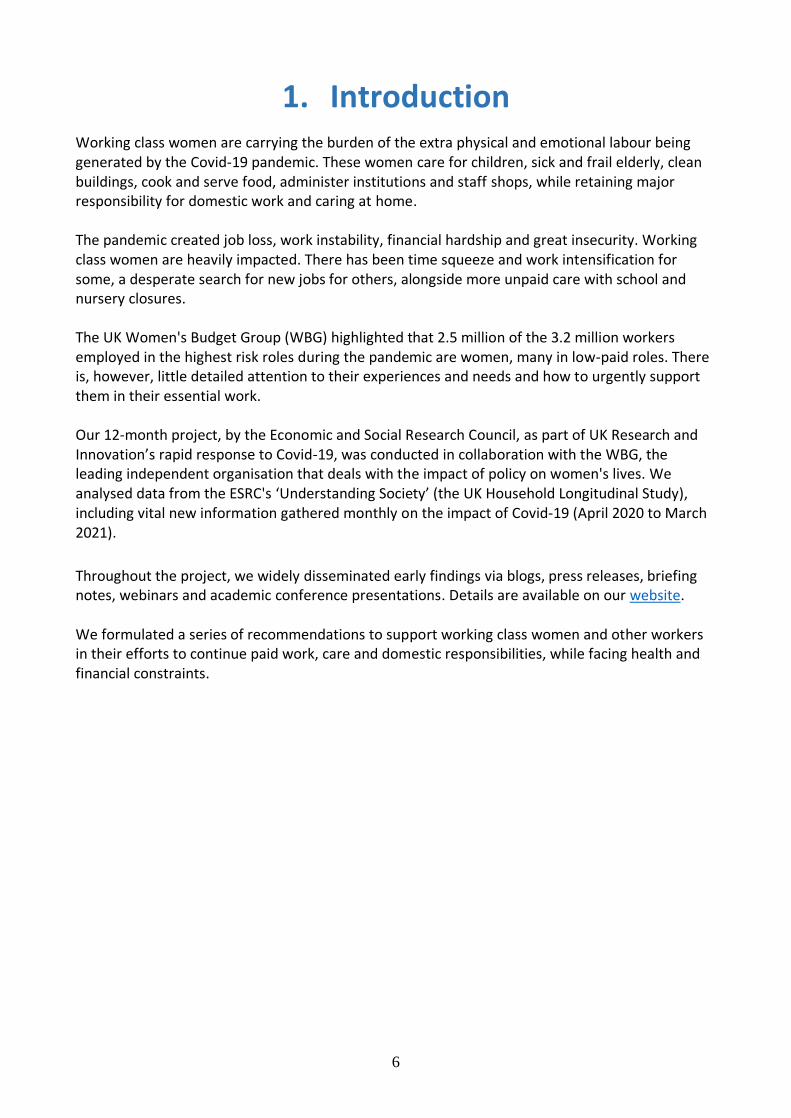
1. Introduction Working class women are carrying the burden of the extra physical and emotional labour being generated by the Covid-19 pandemic. These women care for children, sick and frail elderly, clean buildings, cook and serve food, administer institutions and staff shops, while retaining major responsibility for domestic work and caring at home. The pandemic created job loss, work instability, financial hardship and great insecurity. Working class women are heavily impacted. There has been time squeeze and work intensification for some, a desperate search for new jobs for others, alongside more unpaid care with school and nursery closures. The UK Women's Budget Group (WBG) highlighted that 2.5 million of the 3.2 million workers employed in the highest risk roles during the pandemic are women, many in low-paid roles. There is, however, little detailed attention to their experiences and needs and how to urgently support them in their essential work. Our 12-month project, by the Economic and Social Research Council, as part of UK Research and Innovation’s rapid response to Covid-19, was conducted in collaboration with the WBG, the leading independent organisation that deals with the impact of policy on women's lives. We analysed data from the ESRC's ‘Understanding Society’ (the UK Household Longitudinal Study), including vital new information gathered monthly on the impact of Covid-19 (April 2020 to March 2021).
Throughout the project, we widely disseminated early findings via blogs, press releases, briefing notes, webinars and academic conference presentations. Details are available on our website. We formulated a series of recommendations to support working class women and other workers in their efforts to continue paid work, care and domestic responsibilities, while facing health and financial constraints.
7
2. Methodology
2.1 The data
The ‘Understanding Society’ Covid-19 study is a monthly survey of the experiences and reactions of the UK population to the Covid-19 pandemic, funded by the Economic and Social Research Council and the Health Foundation. The survey forms part of the UK Household Longitudinal Study (UKHLS), which is a representative survey of UK households and began in 2009. The first wave of the Covid-19 survey was fielded in April 2020. All ‘Understanding Society’ adult sample members (aged 16+) who had taken part in one of the two last waves of the main study were invited to participate in a new Covid-19 study. 17,450 participants completed the survey in the first wave in April 2020.
2.2 The sample
Our study looked at employed women and men, aged 18-65. We also looked at those women and men who were employed in the pre-pandemic survey (UKHLS wave 10, collected 2018–2019) to access their class details. We used the National Statistics Socio-economic Classification (NS-SEC) to explore how the working class workers (employed in routine or semi-routine jobs) fared compared with other class groups. Semi-routine work includes care-workers, retail assistants, hospital porters. Routine work includes cleaners, waiting staff, bus drivers, bar staff, sewing machinists. We exclude details of ‘Small employers and Own Account’ workers from our Figures due to small sample sizes, but we retain them when we compare women with men overall.
2.3 Analysis
This report draws upon descriptive analysis of the working lives of employed women and men in the Covid-19 survey from April 2020 through to March 2021. There are around 3,700 women and 3,600 men in the working age sample in April 2020 (weighted results). We compare working women with men and examine class diversity among the employed women and men. The following sections outline the project findings, grouped by theme: paid employment, housework and childcare, finances and hardship, and life satisfaction and subjective wellbeing.
8
3. Paid employment The Covid-19 pandemic changed the way many of us engage in paid work but it impacted in starkly dissimilar ways on different social groups. Pre-pandemic, it was working class women who already faced severe and enduring disadvantage in the workplace, over-concentrated in jobs with a range of lower quality characteristics such as short hours and low wages.
3.1 How many hours do people spend at work?
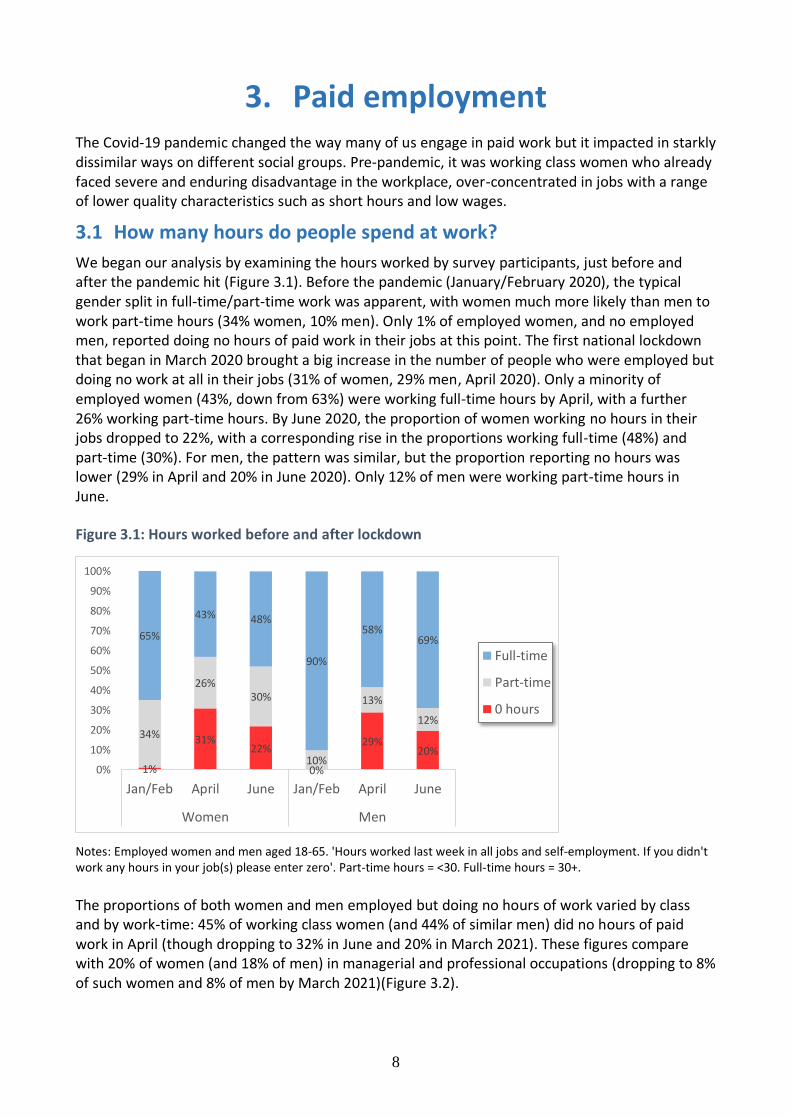
We began our analysis by examining the hours worked by survey participants, just before and after the pandemic hit (Figure 3.1). Before the pandemic (January/February 2020), the typical gender split in full-time/part-time work was apparent, with women much more likely than men to work part-time hours (34% women, 10% men). Only 1% of employed women, and no employed men, reported doing no hours of paid work in their jobs at this point. The first national lockdown that began in March 2020 brought a big increase in the number of people who were employed but doing no work at all in their jobs (31% of women, 29% men, April 2020). Only a minority of employed women (43%, down from 63%) were working full-time hours by April, with a further 26% working part-time hours. By June 2020, the proportion of women working no hours in their jobs dropped to 22%, with a corresponding rise in the proportions working full-time (48%) and part-time (30%). For men, the pattern was similar, but the proportion reporting no hours was lower (29% in April and 20% in June 2020). Only 12% of men were working part-time hours in June.
Figure 3.1: Hours worked before and after lockdown
Notes: Employed women and men aged 18-65. 'Hours worked last week in all jobs and self-employment. If you didn't work any hours in your job(s) please enter zero'. Part-time hours = <30. Full-time hours = 30+.
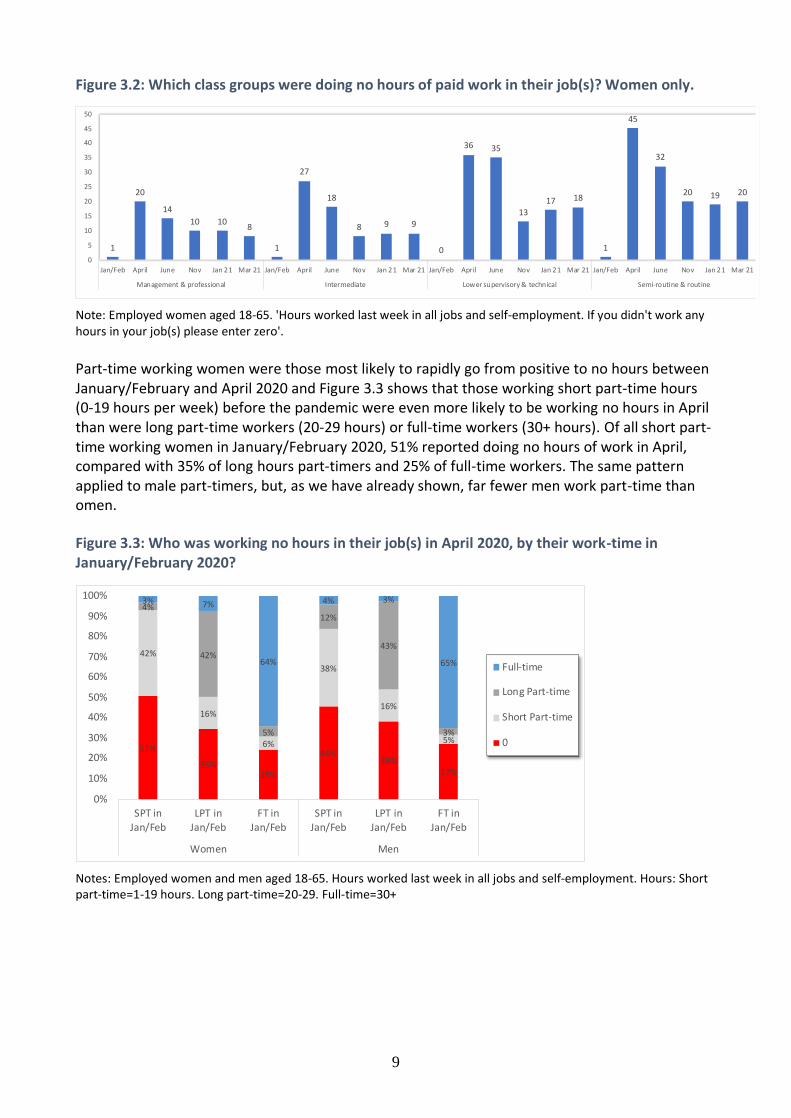
The proportions of both women and men employed but doing no hours of work varied by class and by work-time: 45% of working class women (and 44% of similar men) did no hours of paid work in April (though dropping to 32% in June and 20% in March 2021). These figures compare with 20% of women (and 18% of men) in managerial and professional occupations (dropping to 8% of such women and 8% of men by March 2021)(Figure 3.2).
1%
31%22%
0%
29%20%
34%
26%30%
10%
13%
12%
65%
43% 48%
90%
58%69%
0%
10%
20%
30%
40%
50%
60%
70%
80%
90%
100%
Jan/Feb April June Jan/Feb April June
Women Men
Full-time
Part-time
0 hours
9
Figure 3.2: Which class groups were doing no hours of paid work in their job(s)? Women only.
Note: Employed women aged 18-65. 'Hours worked last week in all jobs and self-employment. If you didn't work any hours in your job(s) please enter zero'.
Part-time working women were those most likely to rapidly go from positive to no hours between January/February and April 2020 and Figure 3.3 shows that those working short part-time hours (0-19 hours per week) before the pandemic were even more likely to be working no hours in April than were long part-time workers (20-29 hours) or full-time workers (30+ hours). Of all short part-time working women in January/February 2020, 51% reported doing no hours of work in April, compared with 35% of long hours part-timers and 25% of full-time workers. The same pattern applied to male part-timers, but, as we have already shown, far fewer men work part-time than omen.
Figure 3.3: Who was working no hours in their job(s) in April 2020, by their work-time in January/February 2020?
Notes: Employed women and men aged 18-65. Hours worked last week in all jobs and self-employment. Hours: Short part-time=1-19 hours. Long part-time=20-29. Full-time=30+
1
20
14
10 108
1
27
18
8 9 9
0
36 35
13
17 18
1
45
32
20 19 20
0
5
10
15
20
25
30
35
40
45
50
Jan/Feb April June Nov Jan 21 Mar 21 Jan/Feb April June Nov Jan 21 Mar 21 Jan/Feb April June Nov Jan 21 Mar 21 Jan/Feb April June Nov Jan 21 Mar 21
Management & professional Intermediate Lower supervisory & technical Semi-routine & routine
51%
35%25%
46%38%
27%
42%
16%
6%
38%
16%
5%
4%
42%
5%
12%
43%
3%
3% 7%
64%
4% 3%
65%
0%
10%
20%
30%
40%
50%
60%
70%
80%
90%
100%
SPT inJan/Feb
LPT inJan/Feb
FT inJan/Feb
SPT inJan/Feb
LPT inJan/Feb
FT inJan/Feb
Women Men
Full-time
Long Part-time
Short Part-time
0
10
3.2 Who is on furlough?
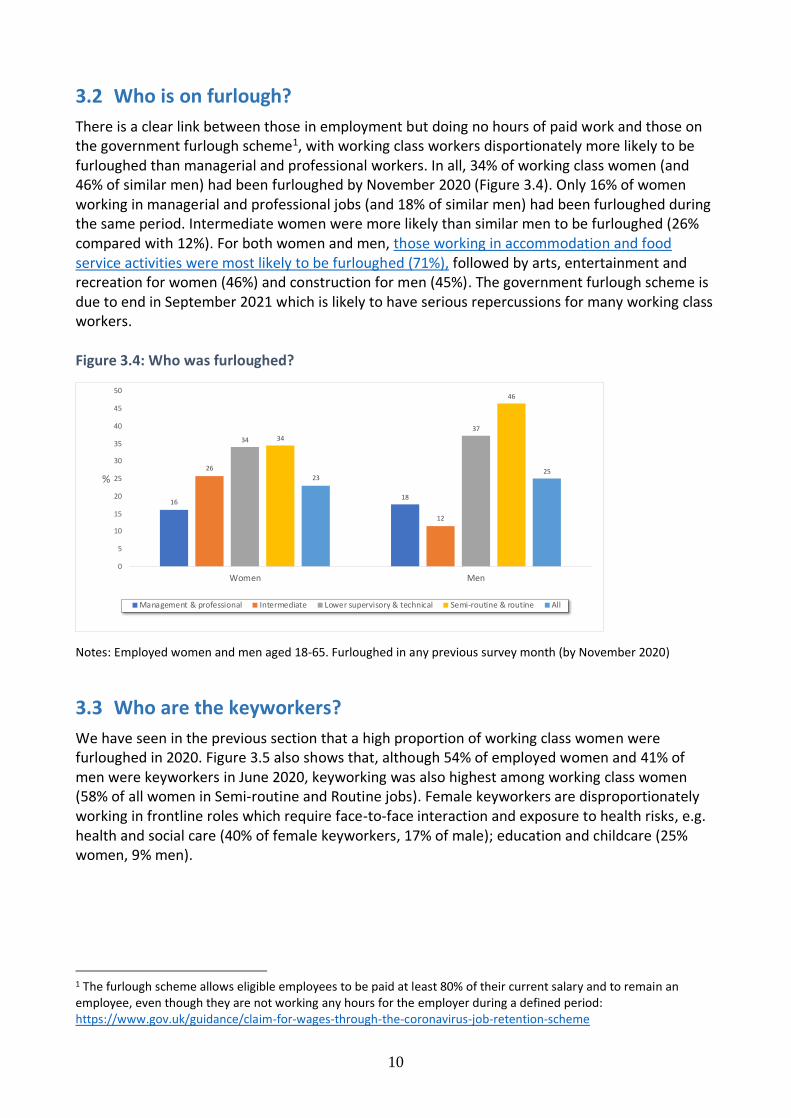
There is a clear link between those in employment but doing no hours of paid work and those on the government furlough scheme1, with working class workers disportionately more likely to be furloughed than managerial and professional workers. In all, 34% of working class women (and 46% of similar men) had been furloughed by November 2020 (Figure 3.4). Only 16% of women working in managerial and professional jobs (and 18% of similar men) had been furloughed during the same period. Intermediate women were more likely than similar men to be furloughed (26% compared with 12%). For both women and men, those working in accommodation and food service activities were most likely to be furloughed (71%), followed by arts, entertainment and recreation for women (46%) and construction for men (45%). The government furlough scheme is due to end in September 2021 which is likely to have serious repercussions for many working class workers. Figure 3.4: Who was furloughed?
Notes: Employed women and men aged 18-65. Furloughed in any previous survey month (by November 2020)
3.3 Who are the keyworkers?
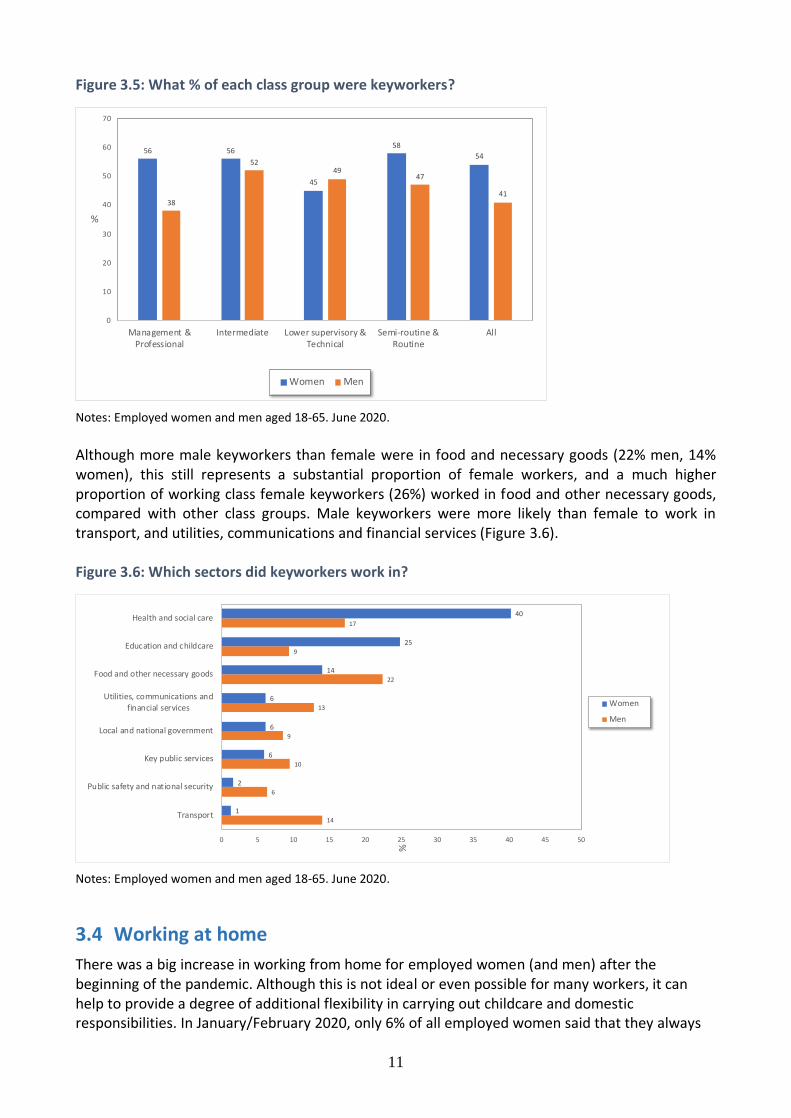
We have seen in the previous section that a high proportion of working class women were furloughed in 2020. Figure 3.5 also shows that, although 54% of employed women and 41% of men were keyworkers in June 2020, keyworking was also highest among working class women (58% of all women in Semi-routine and Routine jobs). Female keyworkers are disproportionately working in frontline roles which require face-to-face interaction and exposure to health risks, e.g. health and social care (40% of female keyworkers, 17% of male); education and childcare (25% women, 9% men).
1 The furlough scheme allows eligible employees to be paid at least 80% of their current salary and to remain an employee, even though they are not working any hours for the employer during a defined period: https://www.gov.uk/guidance/claim-for-wages-through-the-coronavirus-job-retention-scheme
1618
26
12
34
37
34
46
2325
0
5
10
15
20
25
30
35
40
45
50
Women Men
%
Management & professional Intermediate Lower supervisory & technical Semi-routine & routine All
11
Figure 3.5: What % of each class group were keyworkers?
Notes: Employed women and men aged 18-65. June 2020.
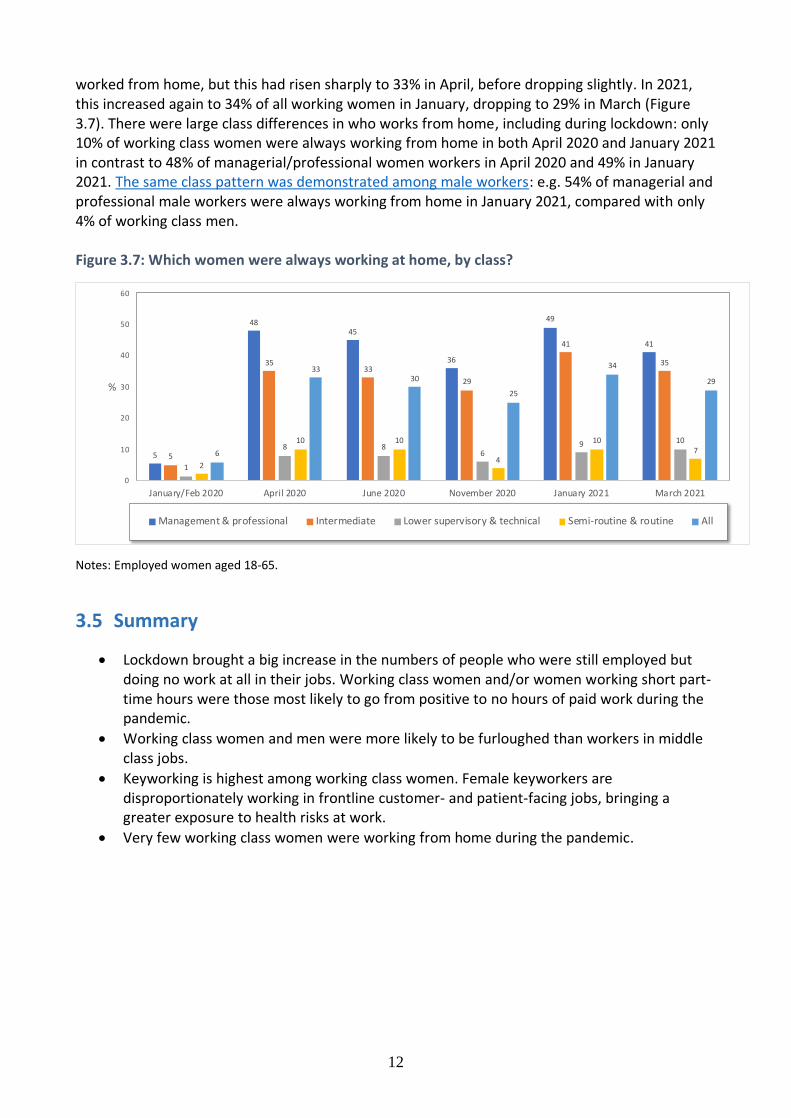
Although more male keyworkers than female were in food and necessary goods (22% men, 14% women), this still represents a substantial proportion of female workers, and a much higher proportion of working class female keyworkers (26%) worked in food and other necessary goods, compared with other class groups. Male keyworkers were more likely than female to work in transport, and utilities, communications and financial services (Figure 3.6). Figure 3.6: Which sectors did keyworkers work in?
Notes: Employed women and men aged 18-65. June 2020.
3.4 Working at home
There was a big increase in working from home for employed women (and men) after the beginning of the pandemic. Although this is not ideal or even possible for many workers, it can help to provide a degree of additional flexibility in carrying out childcare and domestic responsibilities. In January/February 2020, only 6% of all employed women said that they always
56 56
45
58
54
38
5249
47
41
0
10
20
30
40
50
60
70
Management &Professional
Intermediate Lower supervisory &Technical
Semi-routine &Routine
All
%
Women Men
14
6
10
9
13
22
9
17
1
2
6
6
6
14
25
40
0 5 10 15 20 25 30 35 40 45 50
Transport
Public safety and national security
Key public services
Local and national government
Utilities, communications and
financial services
Food and other necessary goods
Education and childcare
Health and social care
%
Women
Men
12
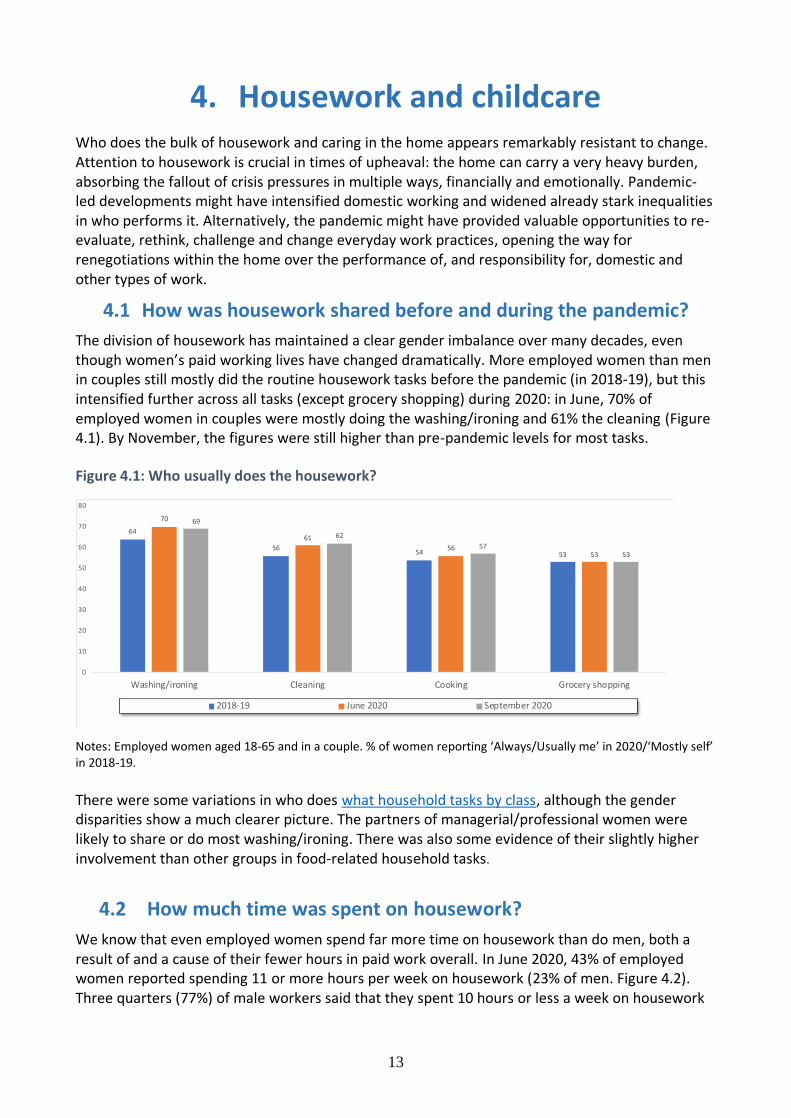
worked from home, but this had risen sharply to 33% in April, before dropping slightly. In 2021, this increased again to 34% of all working women in January, dropping to 29% in March (Figure 3.7). There were large class differences in who works from home, including during lockdown: only 10% of working class women were always working from home in both April 2020 and January 2021 in contrast to 48% of managerial/professional women workers in April 2020 and 49% in January 2021. The same class pattern was demonstrated among male workers: e.g. 54% of managerial and professional male workers were always working from home in January 2021, compared with only 4% of working class men. Figure 3.7: Which women were always working at home, by class?
Notes: Employed women aged 18-65.
3.5 Summary
• Lockdown brought a big increase in the numbers of people who were still employed but doing no work at all in their jobs. Working class women and/or women working short part-time hours were those most likely to go from positive to no hours of paid work during the pandemic.
• Working class women and men were more likely to be furloughed than workers in middle class jobs.
• Keyworking is highest among working class women. Female keyworkers are disproportionately working in frontline customer- and patient-facing jobs, bringing a greater exposure to health risks at work.
• Very few working class women were working from home during the pandemic.
5
4845
36
49
41
5
3533
29
41
35
1
8 86
9 10
2
10 10
4
1076
3330
25
34
29
0
10
20
30
40
50
60
January/Feb 2020 April 2020 June 2020 November 2020 January 2021 March 2021
%
Management & professional Intermediate Lower supervisory & technical Semi-routine & routine All
13
4. Housework and childcare Who does the bulk of housework and caring in the home appears remarkably resistant to change. Attention to housework is crucial in times of upheaval: the home can carry a very heavy burden, absorbing the fallout of crisis pressures in multiple ways, financially and emotionally. Pandemic-led developments might have intensified domestic working and widened already stark inequalities in who performs it. Alternatively, the pandemic might have provided valuable opportunities to re-evaluate, rethink, challenge and change everyday work practices, opening the way for renegotiations within the home over the performance of, and responsibility for, domestic and other types of work.
4.1 How was housework shared before and during the pandemic?
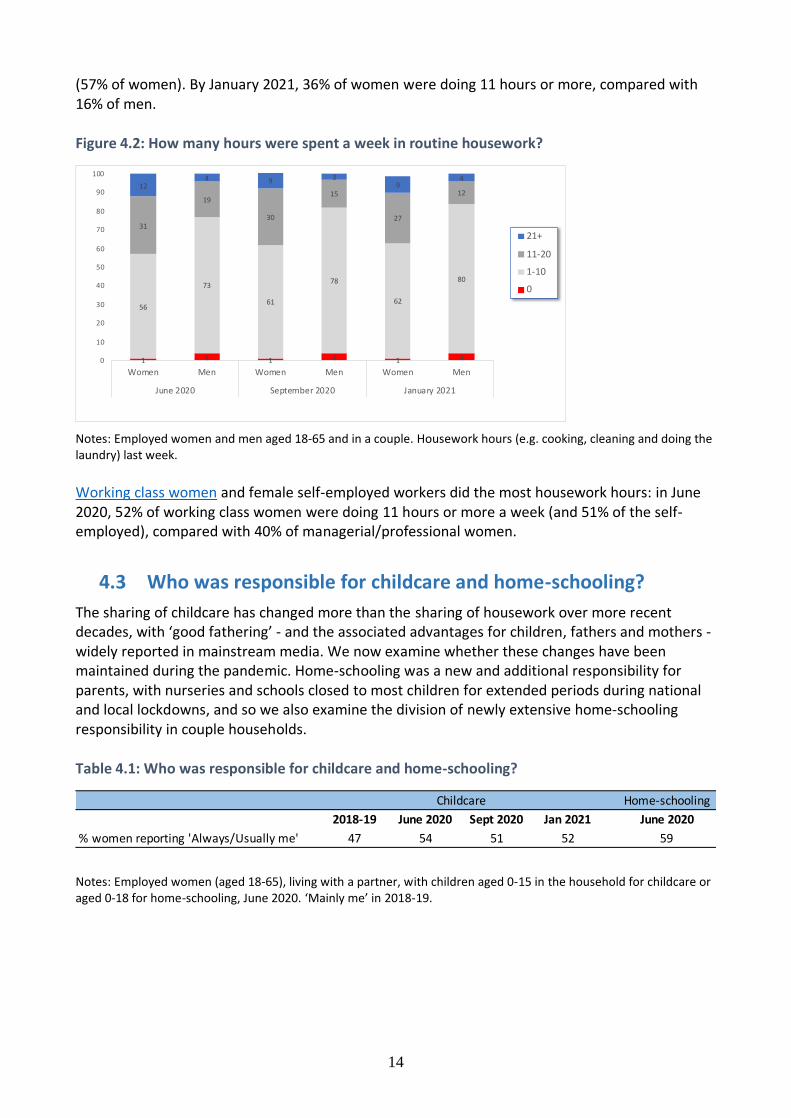
The division of housework has maintained a clear gender imbalance over many decades, even though women’s paid working lives have changed dramatically. More employed women than men in couples still mostly did the routine housework tasks before the pandemic (in 2018-19), but this intensified further across all tasks (except grocery shopping) during 2020: in June, 70% of employed women in couples were mostly doing the washing/ironing and 61% the cleaning (Figure 4.1). By November, the figures were still higher than pre-pandemic levels for most tasks.
Figure 4.1: Who usually does the housework?
Notes: Employed women aged 18-65 and in a couple. % of women reporting ‘Always/Usually me’ in 2020/‘Mostly self’ in 2018-19.
There were some variations in who does what household tasks by class, although the gender disparities show a much clearer picture. The partners of managerial/professional women were likely to share or do most washing/ironing. There was also some evidence of their slightly higher involvement than other groups in food-related household tasks.
4.2 How much time was spent on housework?
We know that even employed women spend far more time on housework than do men, both a result of and a cause of their fewer hours in paid work overall. In June 2020, 43% of employed women reported spending 11 or more hours per week on housework (23% of men. Figure 4.2). Three quarters (77%) of male workers said that they spent 10 hours or less a week on housework
64
5654 53
70
61
5653
69
62
5753
0
10
20
30
40
50
60
70
80
Washing/ironing Cleaning Cooking Grocery shopping
2018-19 June 2020 September 2020
14
(57% of women). By January 2021, 36% of women were doing 11 hours or more, compared with 16% of men. Figure 4.2: How many hours were spent a week in routine housework?
Notes: Employed women and men aged 18-65 and in a couple. Housework hours (e.g. cooking, cleaning and doing the laundry) last week.
Working class women and female self-employed workers did the most housework hours: in June 2020, 52% of working class women were doing 11 hours or more a week (and 51% of the self-employed), compared with 40% of managerial/professional women.
4.3 Who was responsible for childcare and home-schooling?
The sharing of childcare has changed more than the sharing of housework over more recent decades, with ‘good fathering’ - and the associated advantages for children, fathers and mothers - widely reported in mainstream media. We now examine whether these changes have been maintained during the pandemic. Home-schooling was a new and additional responsibility for parents, with nurseries and schools closed to most children for extended periods during national and local lockdowns, and so we also examine the division of newly extensive home-schooling responsibility in couple households. Table 4.1: Who was responsible for childcare and home-schooling?
Notes: Employed women (aged 18-65), living with a partner, with children aged 0-15 in the household for childcare or aged 0-18 for home-schooling, June 2020. ‘Mainly me’ in 2018-19.
1 4 1 4 1 4
56
73
61
78
62
80
31
19
30
15
27
1212
4 9 39
4
0
10
20
30
40
50
60
70
80
90
100
Women Men Women Men Women Men
June 2020 September 2020 January 2021
21+
11-20
1-10
0
Home-schooling
2018-19 June 2020 Sept 2020 Jan 2021 June 2020
% women reporting 'Always/Usually me' 47 54 51 52 59
Childcare
15
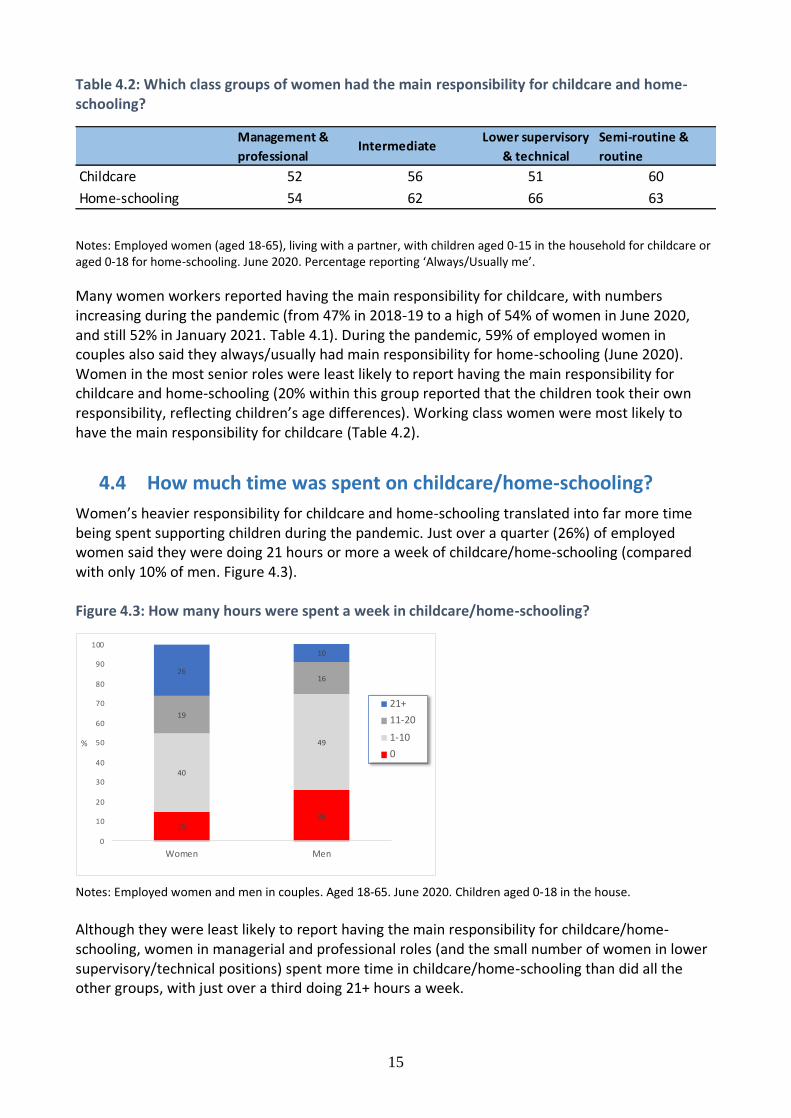
Table 4.2: Which class groups of women had the main responsibility for childcare and home-schooling?
Notes: Employed women (aged 18-65), living with a partner, with children aged 0-15 in the household for childcare or aged 0-18 for home-schooling. June 2020. Percentage reporting ‘Always/Usually me’.
Many women workers reported having the main responsibility for childcare, with numbers increasing during the pandemic (from 47% in 2018-19 to a high of 54% of women in June 2020, and still 52% in January 2021. Table 4.1). During the pandemic, 59% of employed women in couples also said they always/usually had main responsibility for home-schooling (June 2020). Women in the most senior roles were least likely to report having the main responsibility for childcare and home-schooling (20% within this group reported that the children took their own responsibility, reflecting children’s age differences). Working class women were most likely to have the main responsibility for childcare (Table 4.2).
4.4 How much time was spent on childcare/home-schooling?
Women’s heavier responsibility for childcare and home-schooling translated into far more time being spent supporting children during the pandemic. Just over a quarter (26%) of employed women said they were doing 21 hours or more a week of childcare/home-schooling (compared with only 10% of men. Figure 4.3). Figure 4.3: How many hours were spent a week in childcare/home-schooling?
Notes: Employed women and men in couples. Aged 18-65. June 2020. Children aged 0-18 in the house.
Although they were least likely to report having the main responsibility for childcare/home-schooling, women in managerial and professional roles (and the small number of women in lower supervisory/technical positions) spent more time in childcare/home-schooling than did all the other groups, with just over a third doing 21+ hours a week.
Management &
professionalIntermediate
Lower supervisory
& technical
Semi-routine &
routine
Childcare 52 56 51 60
Home-schooling 54 62 66 63
1526
40
49
19
1626
10
0
10
20
30
40
50
60
70
80
90
100
Women Men
%
21+
11-20
1-10
0
16
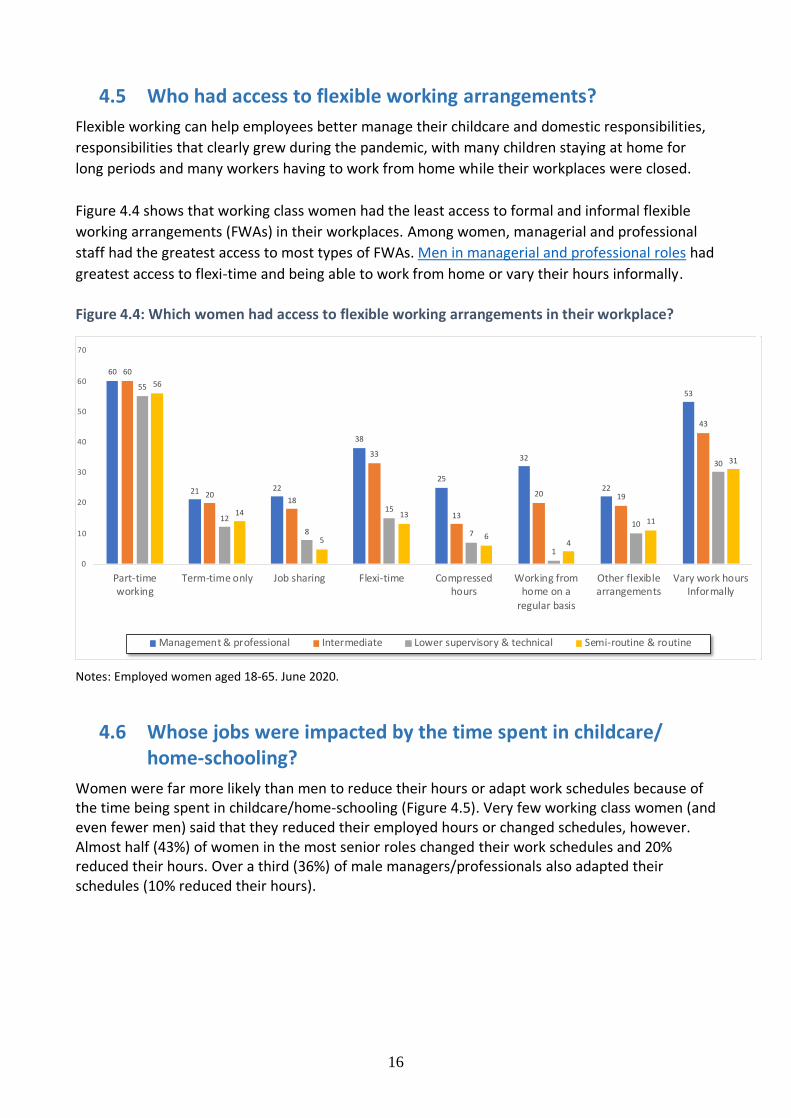
4.5 Who had access to flexible working arrangements?
Flexible working can help employees better manage their childcare and domestic responsibilities,
responsibilities that clearly grew during the pandemic, with many children staying at home for
long periods and many workers having to work from home while their workplaces were closed.
Figure 4.4 shows that working class women had the least access to formal and informal flexible
working arrangements (FWAs) in their workplaces. Among women, managerial and professional
staff had the greatest access to most types of FWAs. Men in managerial and professional roles had
greatest access to flexi-time and being able to work from home or vary their hours informally.
Figure 4.4: Which women had access to flexible working arrangements in their workplace?
Notes: Employed women aged 18-65. June 2020.
4.6 Whose jobs were impacted by the time spent in childcare/
home-schooling?
Women were far more likely than men to reduce their hours or adapt work schedules because of the time being spent in childcare/home-schooling (Figure 4.5). Very few working class women (and even fewer men) said that they reduced their employed hours or changed schedules, however. Almost half (43%) of women in the most senior roles changed their work schedules and 20% reduced their hours. Over a third (36%) of male managers/professionals also adapted their schedules (10% reduced their hours).
60
21 22
38
25
32
22
53
60
2018
33
13
20 19
43
55
12
8
15
7
1
10
30
56
14
5
13
64
11
31
0
10
20
30
40
50
60
70
Part-timeworking
Term-time only Job sharing Flexi-time Compressedhours
Working fromhome on a
regular basis
Other flexiblearrangements
Vary work hoursInformally
Management & professional Intermediate Lower supervisory & technical Semi-routine & routine
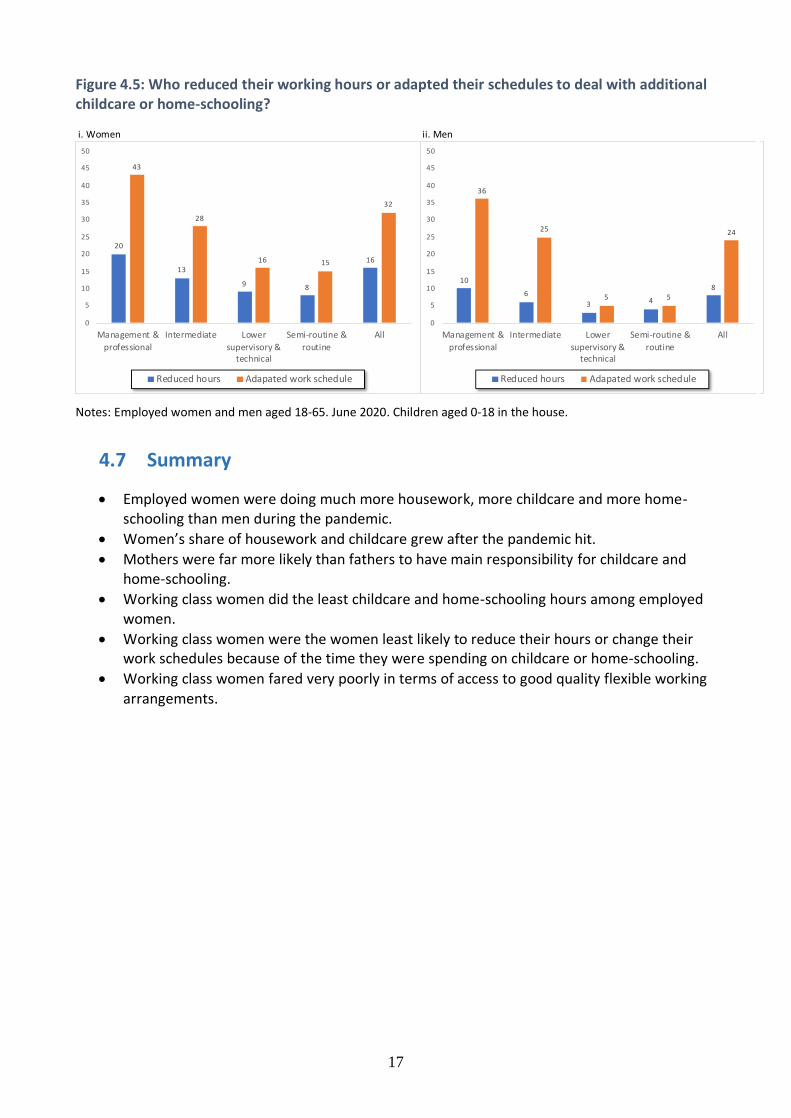
17
Figure 4.5: Who reduced their working hours or adapted their schedules to deal with additional childcare or home-schooling?
Notes: Employed women and men aged 18-65. June 2020. Children aged 0-18 in the house.
4.7 Summary
• Employed women were doing much more housework, more childcare and more home-schooling than men during the pandemic.
• Women’s share of housework and childcare grew after the pandemic hit.
• Mothers were far more likely than fathers to have main responsibility for childcare and home-schooling.
• Working class women did the least childcare and home-schooling hours among employed women.
• Working class women were the women least likely to reduce their hours or change their work schedules because of the time they were spending on childcare or home-schooling.
• Working class women fared very poorly in terms of access to good quality flexible working arrangements.
i. Women ii. Men
20
13
9 8
16
43
28
16 15
32
0
5
10
15
20
25
30
35
40
45
50
Management &
professional
Intermediate Lower
supervisory &technical
Semi-routine &
routine
All
Reduced hours Adapated work schedule
10
6
3 4
8
36
25
5 5
24
0
5
10
15
20
25
30
35
40
45
50
Management &
professional
Intermediate Lower
supervisory &technical
Semi-routine &
routine
All
Reduced hours Adapated work schedule
18
5. Finances and hardship We already know that many women in the UK (and in particular working class women) worked part-time hours before the pandemic, and that working class women were also more likely to have been furloughed and to have had their hours cut than middle class women in 2020. Part-time jobs are associated with more financial hardship than are full-time, and not being able to manage financially day-to-day is a key source of anxiety in the UK, with workers who live on low and precarious incomes reporting deep feelings of financial insecurity. We now turn to the impact of Covid-19 on finances and financial hardship.
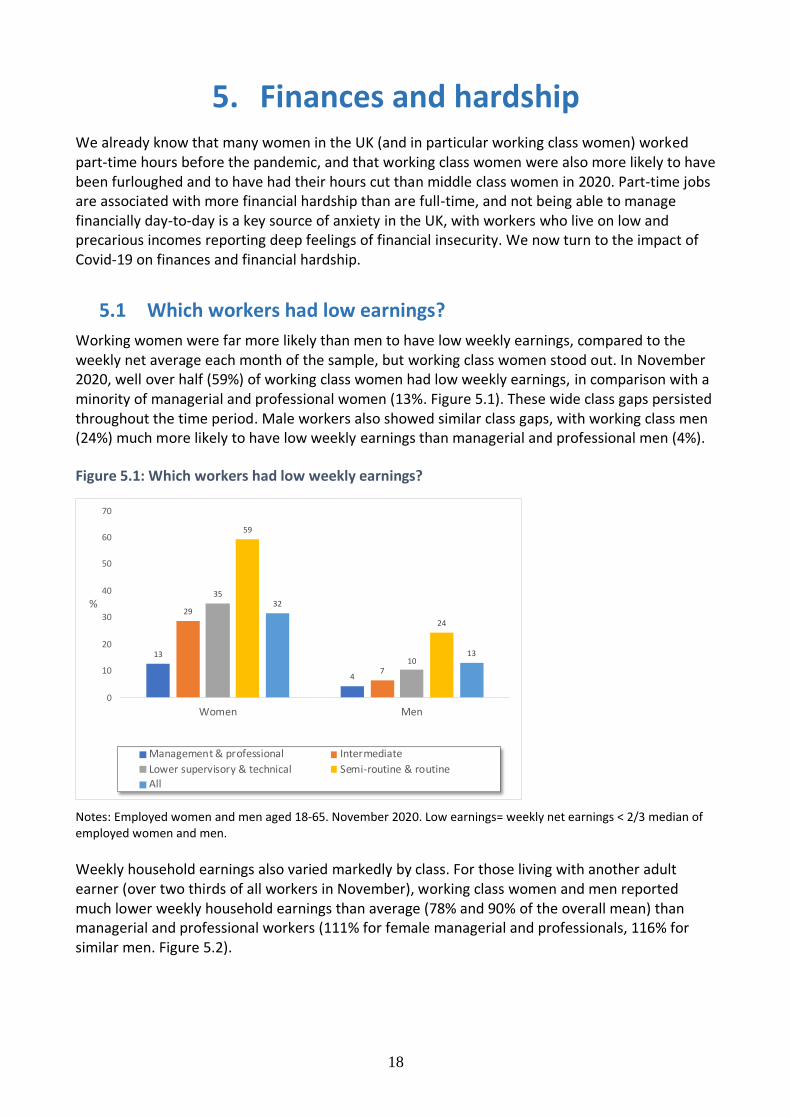
5.1 Which workers had low earnings?
Working women were far more likely than men to have low weekly earnings, compared to the weekly net average each month of the sample, but working class women stood out. In November 2020, well over half (59%) of working class women had low weekly earnings, in comparison with a minority of managerial and professional women (13%. Figure 5.1). These wide class gaps persisted throughout the time period. Male workers also showed similar class gaps, with working class men (24%) much more likely to have low weekly earnings than managerial and professional men (4%).
Figure 5.1: Which workers had low weekly earnings?
Notes: Employed women and men aged 18-65. November 2020. Low earnings= weekly net earnings < 2/3 median of employed women and men.
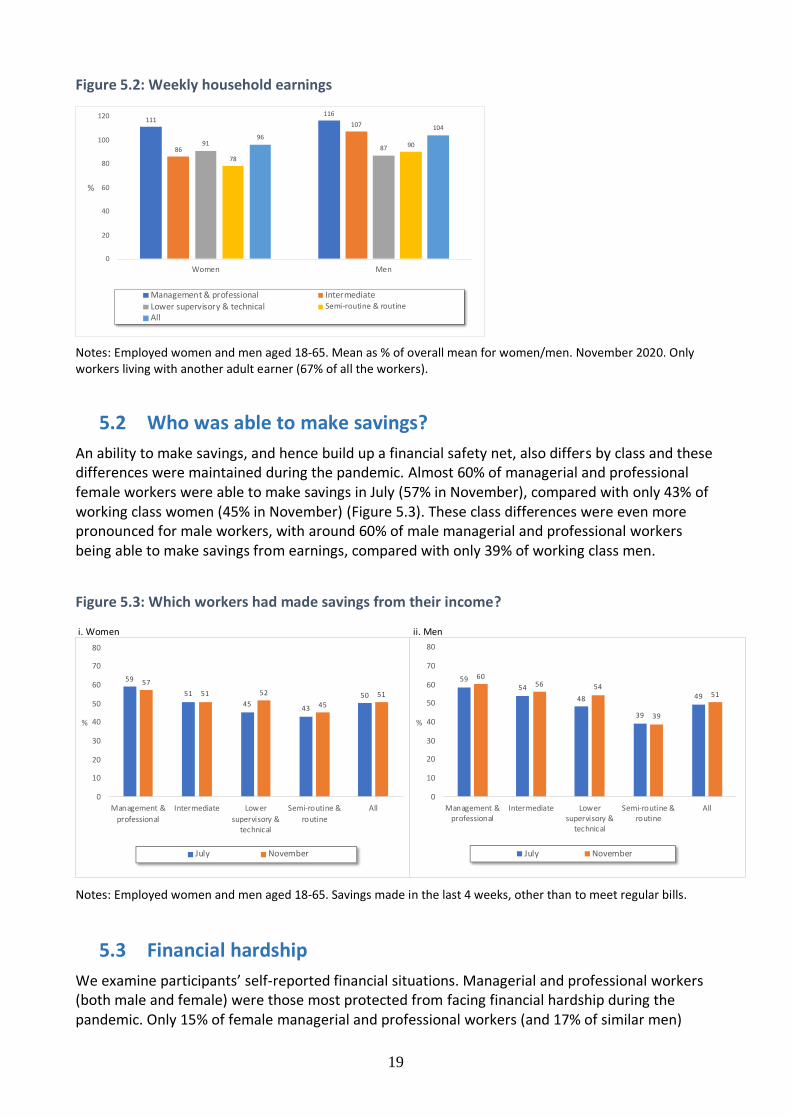
Weekly household earnings also varied markedly by class. For those living with another adult earner (over two thirds of all workers in November), working class women and men reported much lower weekly household earnings than average (78% and 90% of the overall mean) than managerial and professional workers (111% for female managerial and professionals, 116% for similar men. Figure 5.2).
13
4
29
7
35
10
59
24
32
13
0
10
20
30
40
50
60
70
Women Men
%
Management & professional Intermediate
Lower supervisory & technical Semi-routine & routineAll
19
Figure 5.2: Weekly household earnings
Notes: Employed women and men aged 18-65. Mean as % of overall mean for women/men. November 2020. Only workers living with another adult earner (67% of all the workers).
5.2 Who was able to make savings?
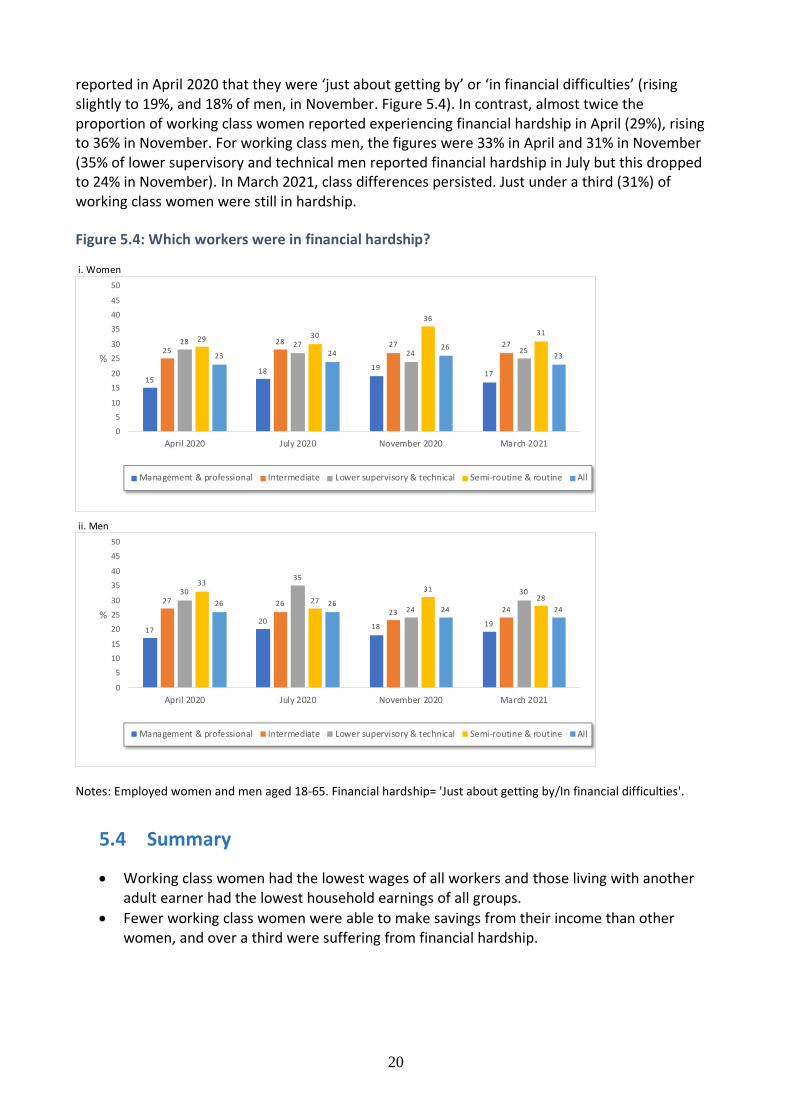
An ability to make savings, and hence build up a financial safety net, also differs by class and these differences were maintained during the pandemic. Almost 60% of managerial and professional female workers were able to make savings in July (57% in November), compared with only 43% of working class women (45% in November) (Figure 5.3). These class differences were even more pronounced for male workers, with around 60% of male managerial and professional workers being able to make savings from earnings, compared with only 39% of working class men.
Figure 5.3: Which workers had made savings from their income?
Notes: Employed women and men aged 18-65. Savings made in the last 4 weeks, other than to meet regular bills.
5.3 Financial hardship
We examine participants’ self-reported financial situations. Managerial and professional workers (both male and female) were those most protected from facing financial hardship during the pandemic. Only 15% of female managerial and professional workers (and 17% of similar men)
111116
86
107
9187
78
9096
104
0
20
40
60
80
100
120
Women Men
%
Management & professional IntermediateLower supervisory & technical Semi-routine & routine
All
i. Women ii. Men
59
51
4543
50
57
51 52
45
51
0
10
20
30
40
50
60
70
80
Management &
professional
Intermediate Lower
supervisory &technical
Semi-routine &
routine
All
%
July November
5954
48
39
49
6056 54
39
51
0
10
20
30
40
50
60
70
80
Management &professional
Intermediate Lowersupervisory &
technical
Semi-routine &routine
All
%
July November
20
reported in April 2020 that they were ‘just about getting by’ or ‘in financial difficulties’ (rising slightly to 19%, and 18% of men, in November. Figure 5.4). In contrast, almost twice the proportion of working class women reported experiencing financial hardship in April (29%), rising to 36% in November. For working class men, the figures were 33% in April and 31% in November (35% of lower supervisory and technical men reported financial hardship in July but this dropped to 24% in November). In March 2021, class differences persisted. Just under a third (31%) of working class women were still in hardship.
Figure 5.4: Which workers were in financial hardship?
Notes: Employed women and men aged 18-65. Financial hardship= 'Just about getting by/In financial difficulties'.
5.4 Summary
• Working class women had the lowest wages of all workers and those living with another adult earner had the lowest household earnings of all groups.
• Fewer working class women were able to make savings from their income than other women, and over a third were suffering from financial hardship.
i. Women
ii. Men
1518 19
17
2528 27 2728 27
24 25
29 30
36
31
23 2426
23
0
5
10
15
20
25
30
35
40
45
50
April 2020 July 2020 November 2020 March 2021
%
Management & professional Intermediate Lower supervisory & technical Semi-routine & routine All
1720
18 19
27 2623 24
30
35
24
3033
27
3128
26 2624 24
0
5
10
15
20
25
30
35
40
45
50
April 2020 July 2020 November 2020 March 2021
%
Management & professional Intermediate Lower supervisory & technical Semi-routine & routine All
21
6. Life satisfaction and wellbeing Lastly, we turn to broader evaluations of the outcomes of the pandemic, most particularly in terms of workers’ self-reported life satisfaction and wellbeing. The Covid-19 pandemic has intensified the deep gender and class inequalities that, together, impact working lives. In the context of a year of increasingly insecure jobs and unsafe paid working environments for many, alongside additional housework and caring responsibilities, the struggles to cope with these pressures have taken their toll on inequalities in subjective well-being.
6.1 Life satisfaction
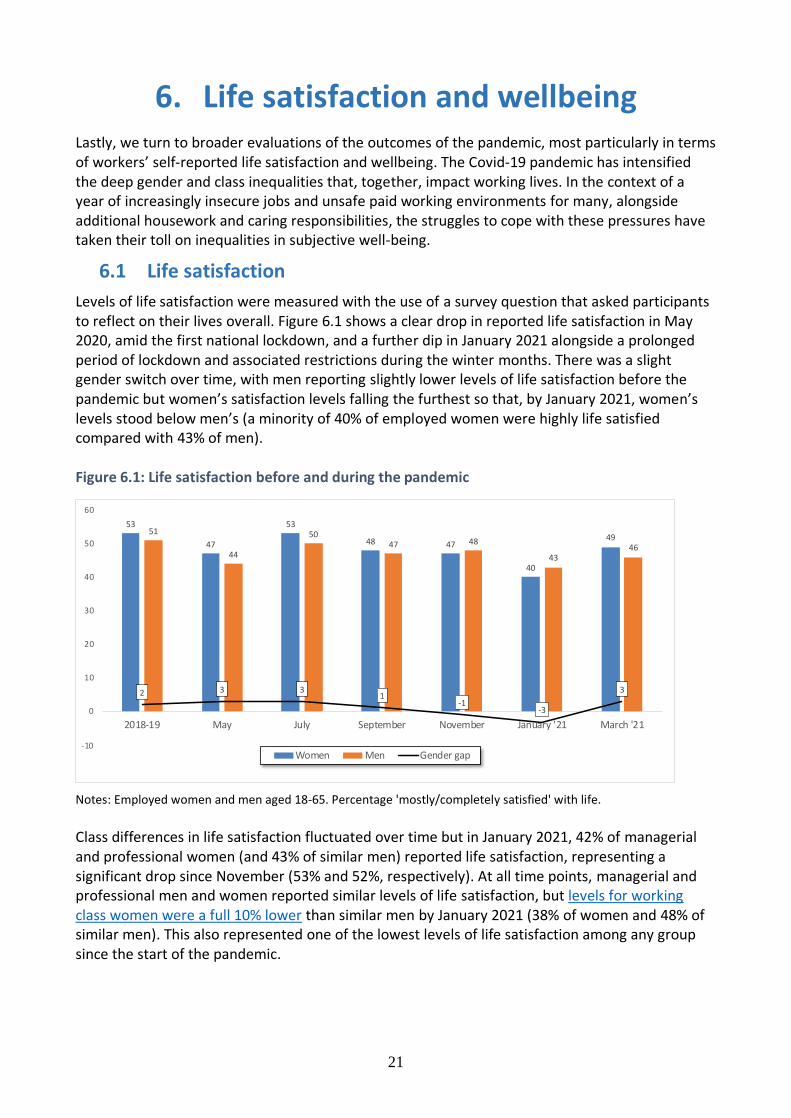
Levels of life satisfaction were measured with the use of a survey question that asked participants to reflect on their lives overall. Figure 6.1 shows a clear drop in reported life satisfaction in May 2020, amid the first national lockdown, and a further dip in January 2021 alongside a prolonged period of lockdown and associated restrictions during the winter months. There was a slight gender switch over time, with men reporting slightly lower levels of life satisfaction before the pandemic but women’s satisfaction levels falling the furthest so that, by January 2021, women’s levels stood below men’s (a minority of 40% of employed women were highly life satisfied compared with 43% of men). Figure 6.1: Life satisfaction before and during the pandemic
Notes: Employed women and men aged 18-65. Percentage 'mostly/completely satisfied' with life.
Class differences in life satisfaction fluctuated over time but in January 2021, 42% of managerial and professional women (and 43% of similar men) reported life satisfaction, representing a significant drop since November (53% and 52%, respectively). At all time points, managerial and professional men and women reported similar levels of life satisfaction, but levels for working class women were a full 10% lower than similar men by January 2021 (38% of women and 48% of similar men). This also represented one of the lowest levels of life satisfaction among any group since the start of the pandemic.
53
47
53
48 47
40
4951
44
5047 48
4346
2 3 31
-1-3
3
-10
0
10
20
30
40
50
60
2018-19 May July September November January '21 March '21
Women Men Gender gap
22
6.2 Subjective wellbeing
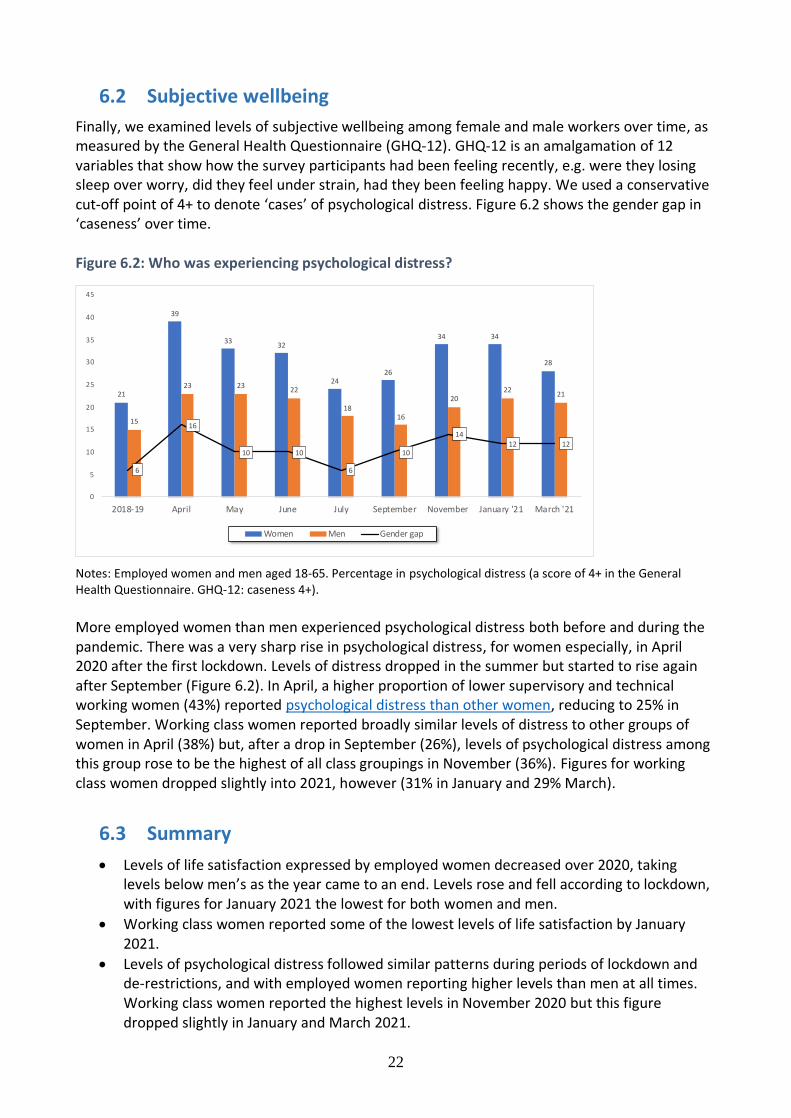
Finally, we examined levels of subjective wellbeing among female and male workers over time, as measured by the General Health Questionnaire (GHQ-12). GHQ-12 is an amalgamation of 12 variables that show how the survey participants had been feeling recently, e.g. were they losing sleep over worry, did they feel under strain, had they been feeling happy. We used a conservative cut-off point of 4+ to denote ‘cases’ of psychological distress. Figure 6.2 shows the gender gap in ‘caseness’ over time. Figure 6.2: Who was experiencing psychological distress?
Notes: Employed women and men aged 18-65. Percentage in psychological distress (a score of 4+ in the General Health Questionnaire. GHQ-12: caseness 4+).
More employed women than men experienced psychological distress both before and during the pandemic. There was a very sharp rise in psychological distress, for women especially, in April 2020 after the first lockdown. Levels of distress dropped in the summer but started to rise again after September (Figure 6.2). In April, a higher proportion of lower supervisory and technical working women (43%) reported psychological distress than other women, reducing to 25% in September. Working class women reported broadly similar levels of distress to other groups of women in April (38%) but, after a drop in September (26%), levels of psychological distress among this group rose to be the highest of all class groupings in November (36%). Figures for working class women dropped slightly into 2021, however (31% in January and 29% March).
6.3 Summary
• Levels of life satisfaction expressed by employed women decreased over 2020, taking levels below men’s as the year came to an end. Levels rose and fell according to lockdown, with figures for January 2021 the lowest for both women and men.
• Working class women reported some of the lowest levels of life satisfaction by January 2021.
• Levels of psychological distress followed similar patterns during periods of lockdown and de-restrictions, and with employed women reporting higher levels than men at all times. Working class women reported the highest levels in November 2020 but this figure dropped slightly in January and March 2021.
21
39
3332
2426
34 34
28
15
23 2322
1816
2022
21
6
16
10 10
6
10
1412 12
0
5
10
15
20
25
30
35
40
45
2018-19 April May June July September November January '21 March '21
Women Men Gender gap
23
7. Conclusions and recommendations
7.1 Conclusions
More than a year on from the first lockdowns in the UK, the Covid-19 pandemic has highlighted the key, essential but under-valued work performed by working class women. It has both exposed and intensified the deep gender and class inequalities that, together, impact the women’s working lives, with pandemic pressures resulting in further job and financial insecurity, heavier care responsibilities, and real challenges in managing unpaid and paid work.
Working class women’s paid work was less protected from the negative effects of the pandemic than women in the highest level jobs. Keyworking was highest among working class women. Female keyworkers were disproportionately working in customer- and patient-facing jobs, bringing a greater exposure to health risks at work. Working class men (and women) were those most likely to be furloughed. Working class women were also much more likely than other working women to be doing no hours of work in their jobs. They were much less likely than women employed in managerial or professional roles to be able to work from home, giving them less flexibility to cope with additional domestic and care responsibilities. Working class women had the lowest wages of all workers and those living with another adult earner had the lowest household earnings of all groups. Fewer were able to save than other working women, and over a third of working class women reported suffering from financial hardship.
Working class women in coupled households, like women from all classes, also had to cope with additional domestic and care responsibilities during the pandemic. Employed women were doing much more housework, more childcare and more home-schooling than men during the pandemic, and women’s share of housework and childcare grew after the pandemic hit. Employed mothers were far more likely than fathers to have main responsibility for childcare and home-schooling. Working class women were the women least likely to reduce their hours or change their work schedules because of the time they were spending on childcare or home-schooling. They also fared very poorly in terms of access to good quality flexible working arrangements more generally.
The mental health impact of struggling to cope with dangerous or insecure work, financial difficulties, and additional care responsibilities due to lockdown and home-schooling, all suggest a perfect storm which inevitably takes its toll. While women overall reported higher levels of psychological distress than men at all time points in our study, working class women reported the highest levels of all groups in November, when numbers started to creep up again during further lockdown measures. Levels of life satisfaction also declined among working class women.
7.2 Recommendations
This report shows that working class women have borne the brunt of the economic impact of the pandemic. Working class women are the majority of those working in the sectors most likely to have been affected by closures and restrictions during Covid-19 and they are the ones who could least afford to lose their jobs, hours and income. Working class women are also the bulk of the workforce behind the services that kept us going through the crisis, from social care workers to cleaners, from shop assistants to auxiliary staff in our hospitals.
24
The pandemic also shone a light on the inadequacy of our current safety net – public services like social and childcare and benefits like Universal Credit and Statutory Sick Pay were not ready to meet the needs of many. The government should:
• Improve safety for workers: Statutory Sick Pay should be increased to the Real Living Wage and be extended to all workers with no income floor to ensure that those who have symptoms of Covid-19 or awaiting test results are not forced to go to work. This would benefit women in particular as they are the majority of low-paid workers and less likely to qualify for SSP.
• Stronger safety net: This pandemic highlighted the importance of social security to alleviate and prevent poverty. The holes in this safety net were also put into stark relief. The cut to Universal Credit and Working Tax Credits planned for September should be abandoned to avoid a fall in income at the same time as the coronavirus income support schemes come to an end.
• Stronger rights: The government must reintroduce the Employment Bill to reduce
insecurity for low-paid workers by extending employment rights and investing in strong
and effective enforcement.
• Sectoral support: Post-Covid-19 recovery needs to include support for hardest hit sectors like retail, hospitality, leisure and tourism, sectors that are important employers of working class women and young people.
• Investment in care: Urgent funding is required for the early years sector to avoid widespread closures which would have a huge impact on mothers’ employment, particularly women in low-paid jobs. Sustainable funding and longer-term major reform are sorely needed for both the early years and the social care sectors. Investment in care would also create much needed green jobs.
The government needs to match their ‘key worker’ rhetoric with proper recognition in the form of living wages, living hours and good working conditions and security, and ensure that working class women are not forgotten in the economic recovery plan.
25
For more information • Tracey Warren: [email protected]; Clare Lyonette:
[email protected]; Ruth Tarlo: [email protected]
• Project website: https://www.nottingham.ac.uk/business/research/carrying-the-work-burden-of-covid-19/index.aspx
Acknowledgements • The project ‘Carrying the work burden of the Covid-19 pandemic: working class women in
the UK’ is funded by the Economic and Social Research Council, as part of UK Research and Innovation’s rapid response to Covid-19 (Project ES/V009400/1).
• The ‘Understanding Society’ Covid-19 study is funded by the Economic and Social Research Council and the Health Foundation. Fieldwork for the survey is carried out by Ipsos MORI and Kantar. Understanding Society is an initiative funded by the Economic and Social Research Council and various government departments, with scientific leadership by the Institute for Social and Economic Research, University of Essex. The research data are distributed by the UK Data Service. The original data creators, the depositors, the copyright holders, the funders and the UK Data Archive bear no responsibility for the analysis or interpretation of the data made in this paper.
• We are grateful to Dr Mary-Ann Stephenson and Dr Sara Reis from the UK Women’s Budget Group for their collaboration on the project. Our thanks for project support go to Dr Ruth Tarlo.
Citation Warren T, Lyonette C, and the UK Women’s Budget Group (2021) Carrying the work burden of the Covid-19 pandemic: working class women in the UK. Final report, Nottingham: Nottingham University Business School.