Embed Size (px)
Citation preview
at SciVerse ScienceDirect
Utilities Policy 19 (2011) 218e225
Contents lists available
Utilities Policy
journal homepage: www.elsevier .com/locate/ jup
Carrots and sticks: A comprehensive business model for the successfulachievement of energy efficiency resource standards
Andrew Satchwell a,*, Peter Cappers b, Charles Goldman a
a Lawrence Berkeley National Laboratory, 1 Cyclotron Road, Mailstop 90R4000, Berkeley, CA 94720, USAb Lawrence Berkeley National Laboratory, 7847 Karakul Lane, Fayetteville, NY 13066, USA
a r t i c l e i n f o
Article history:Received 4 May 2011Accepted 17 July 2011
Keywords:Utility regulationDecouplingEnergy efficiencyEnergy efficiency resource standard
Abbreviations: ACC, Arizona Corporation CommService; BAU, Business as Usual; DSM, Demand SidEfficiency; EERS, Energy Efficiency Resource StandStandard; FERC, Federal Energy Regulatory CommissUnderstanding; O&M, Operations and Maintenance;Revenue-Per-Customer; RPS, Renewable Portfolio Sta* Corresponding author. Tel.: þ1 510 4866544; fax:
E-mail addresses: [email protected] (A. Sat(P. Cappers), [email protected] (C. Goldman).
0957-1787/$ e see front matter � 2011 Elsevier Ltd.doi:10.1016/j.jup.2011.07.004
a b s t r a c t
U.S. utilities face significant financial disincentives under traditional regulation in aggressively pursuingcost-effective energy efficiency. Regulators are considering some combination of mandated goals andalternative utility business model components to align the utility’s business and financial interests withstate and federal energy efficiency public policy goals. We analyze the financial impacts of an EnergyEfficiency Resource Standard on an Arizona electric utility using a pro-forma utility financial model,including impacts on utility earnings, ROE, customer bills and rates. We demonstrate how a viablebusiness model can be designed to improve the business case while retaining sizable benefits for utilitycustomers.
� 2011 Elsevier Ltd. All rights reserved.
1. Introduction
U.S. regulators and legislators are utilizing energy savings goalsin the form of energy efficiency resource standards (EERS) asa means to mandate aggressive energy efficiency (EE) savings(Barbose et al., 2009). As of December 2010, twenty-six U.S. stateshad some form of an EERS. Policy drivers for suchmandates includeoffsetting potentially higher costs and environmental impactsassociated with the construction of new generation resources andproviding additional options for customers to control their energycosts. In the U.S., energy efficiency programs funded by utilitycustomers are a common means of delivering these savings.
U.S. utilities face significant financial disincentives under tradi-tional regulation in pursuing aggressive energy efficiency goalswhich limits the interest of shareholders and managers. Both areconcerned that the pursuit of aggressive EE savings will result inreduced utility revenues, affecting the utility’s ability to fullyrecover its fixed costs and ultimately increasing the likelihood thatthe utility under-achieves its authorized return on equity (ROE),
ission; APS, Arizona Publice Management; EE, Energyard; EES, Energy Efficiencyion; MOU, Memorandum ofROE, Return on Equity; RPC,ndard.þ1 510 4866996.chwell), [email protected]
All rights reserved.
and limited opportunities to expand rate base thereby foregoingearnings-generating investments. Regulators and policymakers areconsidering or have adopted more comprehensive business models(e.g., shareholder incentives, and/or lost revenue recovery mecha-nisms) to align the utility’s business and financial interests witha state’s public policy goals for the electricity sector (e.g., increasedefficiency, reduced emissions).
In establishing energy efficiency goals and targets, policymakersand legislators in the U.S. can utilize varying combinations of“sticks” and “carrots”. At one extreme is a “stick-only” approach,whereby utilities must meet mandated energy savings targets orface financial penalties. This approach is common in many U.S.states that have adopted a Renewable Portfolio Standard (RPS) withan alternative compliance payment provision if a utility does notachieve renewable energy goals. However, this “stick-only”approach (i.e., mandate with penalties) is much less common in theU.S. for energy efficiency.1 As a practical matter though, because offinancial disincentives, some U.S. utilities would characterize anenergy savings mandate (i.e., EERS) absent the ability to recoverfixed costs as a “stick-only” approach. In the U.S., utility energyefficiency programs have been most successful in those states thatutilize a “sticks-and-carrots” approach, combining a mandatedsavings goal or target with a comprehensive business model (seeCroucher, 2011).
1 Pennsylvania is an example of a state with an EERS with a financial penaltyprovision; currently utilities do not have an opportunity to earn an incentive forsuccessful achievement of energy efficiency targets or to recover lost revenues.
A. Satchwell et al. / Utilities Policy 19 (2011) 218e225 219
This study examines (1) the customer bill and rate impacts, and(2) the shareholder earnings and return on equity impacts whena utility achieves aggressive energy savings due to the existence ofan EERS. Our analysis will compare a “stick-only” approach ofmandated energy savings goals to a “sticks-and-carrots” approachthat includes a comprehensive business model. We model ouranalysis based on the Arizona Energy Efficiency Standard (EES),which directs Arizona investor-owned utilities to achieve 22%cumulative energy savings by 2020.2 We provide a long-termassessment of impacts on ratepayers and shareholders fromenergy efficiency programs that achieve these savings reductiontargets (about 2% per year) through 2020 with impacts over a 20-year time horizon (2011e2030) to fully capture the benefits overthe economic lifetime of the installed EE measures.
We characterize and model Arizona Public Service (APS), whichis the largest investor-owned utility in Arizona, and analyze two EEportfolios: (1) a “business as usual” (BAU) EE scenario as if the EESwas not enacted and APS continues on its pre-existing EE savingspath of approximately 1% annual savings; and (2) an EES scenario asif APS meets the EES savings targets of about 2% annual savings.3
We examine issues from a customer perspective e impacts of theEES on aggregate customer bills and rates compared to the “busi-ness as usual” case. We also analyze issues from the perspective ofutility shareholders and managers and assess the effects on earn-ings and ROE of the EES compared to the “business as usual” casewith andwithout a comprehensive business model (e.g., a revenue-per-customer decoupling mechanism and a shareholder incentivemechanism).
The remainder of the paper describes the comprehensive busi-ness model, discusses the study approach (including the utilityfinancial characterization, EE portfolios, and ratepayer and share-holder impact scenarios), presents analysis results, and concludeswith key findings and policy discussion.
2. Comprehensive business model
The traditional electric utility business model in the U.S.provides a financial incentive for increasing electricity sales andmaking investment in supply-side generation. Regulators in theU.S. establish a utility’s tariff (i.e., rates), based on forecasted salesand its existing and forecasted costs, including a return on invest-ment, in a rate case proceeding. Once rates are established, theutility may improve its financial performance between rate casesby either increasing sales above those forecasted and/or managingits costs. This financial incentive comes in the form of increasedrevenues and/or lower costs, respectively, and hence larger profits(if revenues grow faster than costs), as well as a guaranteed returnon supply-side investments that are utilized to serve increasingdemand.
Conversely, a utility may experience financial harm when salesdecrease between rate cases. Because a utility’s revenues area function of the regulated price for energy and its sales tocustomers, any downward change in sales from the forecasted levelresults in reduced utility revenues. The pursuit of energy savingsexists then as a disincentive to the investor-owned utility as itdirectly impacts and reduces the utility’s collected revenue and
2 Arizona Corporation Commission. In the Matter of the Notice of Proposed Rule-making on Electric Energy Efficiency. Decision No. 71819. Docket No. RE-09-0427.August 10, 2010. An Energy Efficiency Standard (EES) is the same as an EnergyEfficiency Resource Standard (EERS).
3 The specific provisions of the Arizona EES allow utilities to take some credit forenergy efficiency measures installed prior to 2011 (starting in 2016), demandresponse programs, and the effects of improved building codes as part of complyingwith their savings target.
hence profitability between rate cases (again only if revenuereductions outpace cost savings) through decreased sales whiledeferring investment in supply-side generation. Despite the clearbenefits of EE to ratepayers and society as a whole, there is a biasamong U.S. investor-owned utilities against the pursuit of energysavings under the traditional regulatory model (Jensen, 2007).
A regulatory or legislative energy savings mandate (e.g., EERS)may adversely affect utility earnings opportunities under tradi-tional regulation; thus a viable business model is needed toencourage utilities to capture the societal benefits of energy effi-ciency, delivering benefits to customers, while ensuring that prof-itability can in fact come from EE investment (see Moskovitz, 1989;Hirst et al., 1991; Hirst and Blank, 1994; Harrington et al., 1994;Golove and Eto, 1996).
There are three components of a comprehensive EE businessmodel, from the utility perspective: recovery of prudently incurredprogram costs, collection of lost revenues associated with EEsavings (the portion of lost revenues that would be used to recoverauthorized fixed costs), and the development of a shareholderincentive. If a regulator approves only a subset of the threecomponents, the effectiveness of any component may be under-mined (Hayes et al., 2011). To whit:
1 Ensure cost recovery. The recovery of program costs is intendedto allow the utility to fully offset the costs of implementing andadministering EE programs. In the U.S., when energy efficiencyprograms were first offered by utilities in the late 1980s andearly 1990s, a few utilities were unable to recover all of theircosts for administering EE programs in subsequent regulatoryproceedings because cost recovery mechanisms were not inplace. Since then, utilities request and regulatory authoritiesoften provide guidance on the cost recovery mechanism thatutilities can use to contemporaneously recover program costsassociated with administering energy efficiency programs. Inmany cases, regulatory authorities allow and authorize utilitiesto expense their program costs incurred in situations wherethe regulatory authority has reviewed and approved an EEplan; this approach is designed to mitigate the risk that theutility will not fully recover prudently incurred EE programexpenses in a timely fashion.
2 Reduce the disincentive. The utility must have sufficient reve-nues to cover its system costs. A utility’s past investments intheir generation, transmission, and distribution systems arerecovered through current and, to some degree, future retailrates based on a forecast of energy sales, among other things.As discussed earlier, any decrease in forecasted sales betweenrate cases, because of, for example, energy savings from energyefficiency programs, may result in a reduction in utility reve-nues. Regulators may approve the collection of those revenueslost due to the decline in sales in order to insulate the companyfrom being unable to recover its fixed, non-fuel costs, therebymaking the utility financially indifferent to a change in salesfromEE. Decoupling is a common form of lost revenue recoverymechanism and is designed to remove the link between salesand revenues by establishing a determined amount of revenuesthe utility may collect for a set period of time, regardless ofsales levels (Eto et al., 1997).
3 Provide a shareholder incentive. The intent of a shareholderincentive is to provide a utility with an opportunity for addi-tional earnings if it is successful in achieving aggressive savingsgoals and to make energy efficiency a potential business “profitcenter” for the utility. Supply-side investments are often muchlarger than dollars spent on EE and utilities can account forsuch investments in its rate base, or value of utility property,and earn a return on the investment. This presents a potential

4 These assumptions and results were presented twice to the ACC and wereverified on the record with the utility.
5 Fuel and purchased power costs are passed through to APS customers annuallythrough a fuel adjustment clause (FAC) and so are modeled as if they are completelycollected in the year they are incurred.
6 APS receives additional base revenues as the number of customer accountsincrease each year (2.7% per year) and/or as customers increase their electricityusage; although revenues from retail rates increase at a slower rate than expectednon-fuel costs.
7 APS is assumed to use a historic test year in their rate case filings. Generallythere is a two-year lag between the time a general rate case is filed and the time theACC issues an order setting retail rates.
8 Arizona Corporation Commission. In the Matter of the Notice of ProposedRulemaking on Electric Energy Efficiency. Decision No. 71819. Docket No. RE-09-0427. August 10, 2010.
9 There are several provisions in the regulation that allow credits for pre-standard energy savings beginning in 2016, a credit for improvements in buildingcodes, and a credit for demand response savings.
A. Satchwell et al. / Utilities Policy 19 (2011) 218e225220
bias toward such investments, as utilities may find the supply-side investment more attractive when compared to energyefficiency investments that typically are not part of rate base. Ifa utility does not receive regulatory approval to implementa shareholder incentive but has a pre-existing incentive tomake investments in supply-side generation, the utility willtend to prefer supply-side investments that provide greaterearnings opportunities.
Shareholder incentives and lost revenue recovery mechanismshave seen increased attention in recent years at the federal andstate levels. The American Recovery and Reinvestment Act of 2009,passed in February 2009, included additional state energy grantopportunities if the state regulator has sought to implementa policy that aligns financial incentives for electric utilities tovigorously pursue cost-effective energy efficiency opportunities. Atthe state level, 31 states have currently enacted some sort of lostrevenue recovery and/or shareholder incentive mechanism. Ofthose states who lead the U.S. in energy efficiency programspending, eight of the top ten have implemented a combinedshareholder incentive and lost revenue recovery mechanism(Molina et al., 2010).
3. Approach
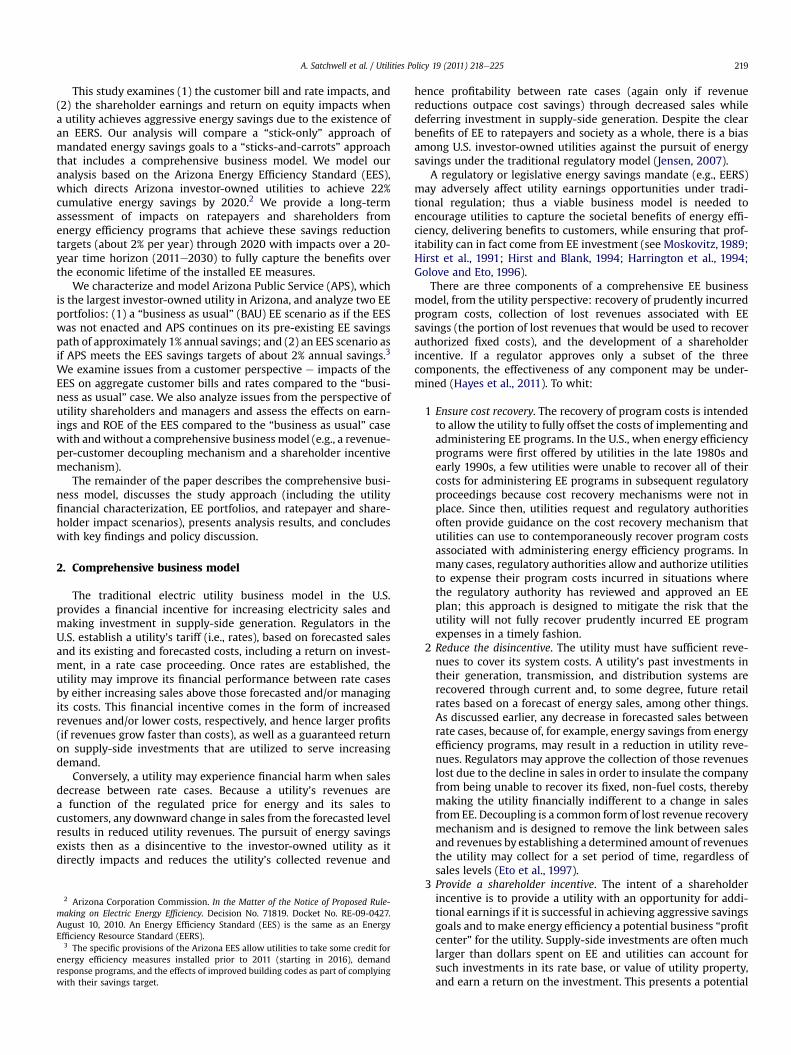
We used a pro-forma, spreadsheet-based financial modeladapted from a tool (Benefits Calculator) constructed to supportthe National Action Plan for Energy Efficiency (Cappers et al.,2009a). This model builds on previous Lawrence BerkeleyNational Laboratory work on shareholder incentives (Cappers andGoldman, 2009b, 2009c; Cappers et al., 2010) by characterizingthe effects of an EERS. The major steps in our analysis are depictedin Fig. 1.
The first step is to identify the main inputs (“Model Inputs”):(1) a characterization of the utility which includes its initialfinancial and physical market position, a forecast of the utility’sfuture sales, peak demand, and resource strategy and estimatedcosts to meet projected growth; and (2) a characterization of thedemand side management (DSM) portfolio e projected electricityand demand savings, costs and useful lifetime of a portfolio ofenergy efficiency and demand response programs that the utilityis planning or considering implementing during the analysisperiod.
The second step is to identify the scenarios of interest for theanalysis (“Scenario Analysis”). These scenarios include a base casethat maintains the current portfolio of DSM programs (“Business asUsual (BAU)”) as well as alternative scenarios that include differentenergy efficiency and demand response resource savings levels andalternative business models (“With DSM”).
The third step is to define the characteristics of the DSM busi-ness model of interest (“DSM Business Model”), determining whatcomponents will be included (e.g., DSM program cost recovery, lostfixed cost recovery and/or shareholder incentives).
The model provides outputs in the form of common stake-holder metrics (“Model Outputs”): (1) shareholder metrics includeROE and total earnings; and (2) ratepayer metrics include esti-mated retail rates and total customer bills for each year of thestudy period. Model outputs from various scenarios that differ bythe level of achieved DSM savings and costs, application of alter-native DSM business models, etc. can be compared to assesschanges in utility earnings, ROE, average retail rates, and customerbills. The Benefits Calculator model also estimates total DSMresource costs and benefits of the DSM portfolio (“DSM ResourceCosts & Benefits”) using a forecast of avoided capacity and energycosts.
4. Modeling characteristics
4.1. Utility characterization
We developed a long-range load and cost forecast to 2030 forArizona Public Service (APS) using historic information from the USFederal Energy Regulatory Commission (FERC) Form 1 and theutility’s most recent general rate case data. This information wasused to construct an expected relationship between growth in peakdemand and growth in costs, which was reviewed by APS staff andserved as the basis for our analysis.4
According to our utility characterization, APS has retail sales ofw30,000 GWh and a peak demand of w6470 MW in 2011, whichare forecasted to grow at a compound annual rate of 2.9% and 3.1%per year, respectively over a 20-year time horizon (excludingenergy efficiency programs). The utility hasw1.1 million customersin 2011 and expects significant customer account growth of 2.7%per year. With such fast growing electricity requirements, ourutility characterization projects that the utility’s non-fuel expenses,inclusive of return of and on capital expenditures and operationsand maintenance (O&M) expenses associated with new generationassets will increase in excess of 5% per year. Increases in non-fuelexpenses are reflected in retail rates after the Arizona Corpora-tion Commission (ACC) has issued an order in a general rate case orother regulatory filing.5 However, revenue growth between ratecases is not anticipated to keep pace with the w5% annual growthin non-fuel expenses.6 Thus, our characterization of APS impliesthat the utility would be unable to achieve its authorized ROE of11%. This is a case of significant utility under-earning prior to theachievement of aggressive EE savings. Without a decouplingmechanism to mitigate the revenue erosion between rate cases, weassume that the utility would file a rate case triennially (i.e., everythird year) to reduce the detrimental impact on shareholderreturns.7
4.2. Demand side management portfolio characterization
Arizona utilities reported electricity savings of w0.53% of retailsales in 2008, which places Arizona near the national averageamong U.S. utilities in pursuing energy efficiency (Molina et al.,2010). However, in 2010, the state’s policymakers establishedenergy savings goals that are currently among the most ambitiousin the United States. In July 2010, the ACC established an EES whichrequired electric utilities to achieve 22% cumulative savings in2020.8 Annual savings targets are set at 1.25% in 2011 and accelerateto 2.5% per year in 2016e2020.9 We have constructed two EEportfolios; the first captures the pre-existing level of energy
Utility Characterization
Model Inputs
Model Calculations
Business-as-Usual Scenario Analysis
Utility Shareholder Metrics
Model Outputs
Utility Ratepayer Metrics
Model Calculations
With DSM Scenario Analysis
DSM Business Model
DSM Program Cost Recovery
Lost Fixed Cost Recovery
Shareholder Incentive
Utility Characterization
DSM Portfolio Characterization
Model Inputs
DSM Resource Costs & Benefits
Utility Shareholder Metrics
Model Outputs
Utility Ratepayer Metrics
Fig. 1. Flowchart for analyzing impacts of portfolio of energy efficiency programs on stakeholders.
A. Satchwell et al. / Utilities Policy 19 (2011) 218e225 221
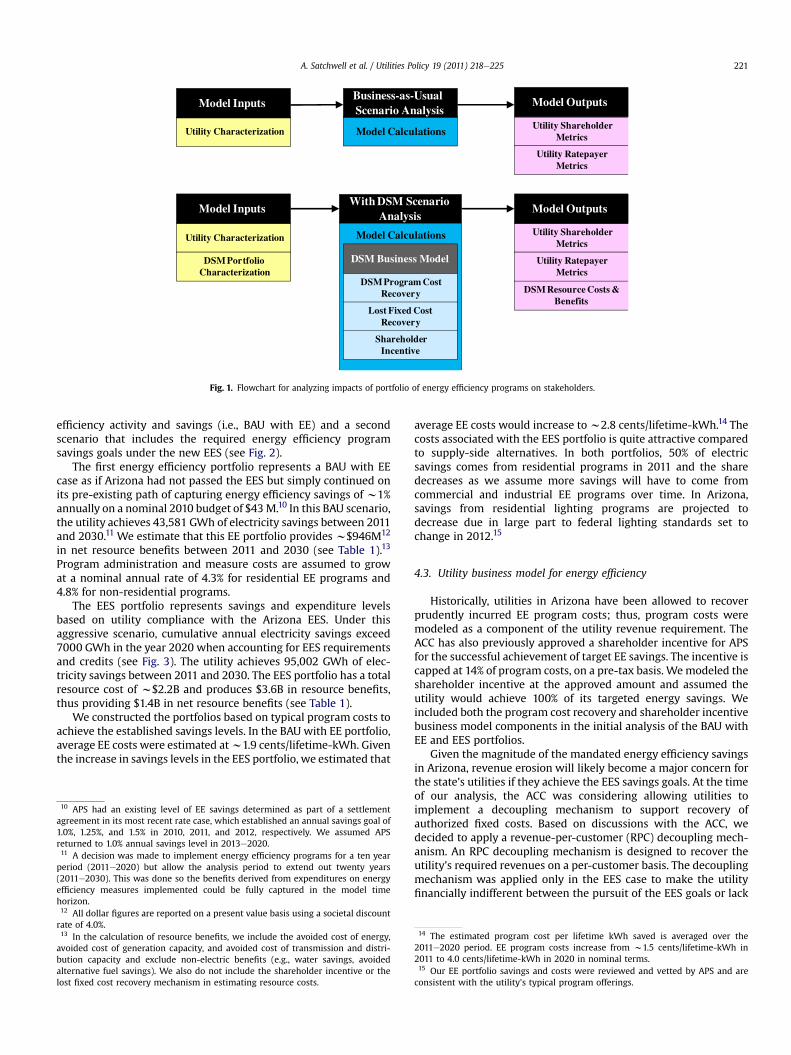
efficiency activity and savings (i.e., BAU with EE) and a secondscenario that includes the required energy efficiency programsavings goals under the new EES (see Fig. 2).
The first energy efficiency portfolio represents a BAU with EEcase as if Arizona had not passed the EES but simply continued onits pre-existing path of capturing energy efficiency savings of w1%annually on a nominal 2010 budget of $43M.10 In this BAU scenario,the utility achieves 43,581 GWh of electricity savings between 2011and 2030.11 We estimate that this EE portfolio provides w$946M12
in net resource benefits between 2011 and 2030 (see Table 1).13
Program administration and measure costs are assumed to growat a nominal annual rate of 4.3% for residential EE programs and4.8% for non-residential programs.
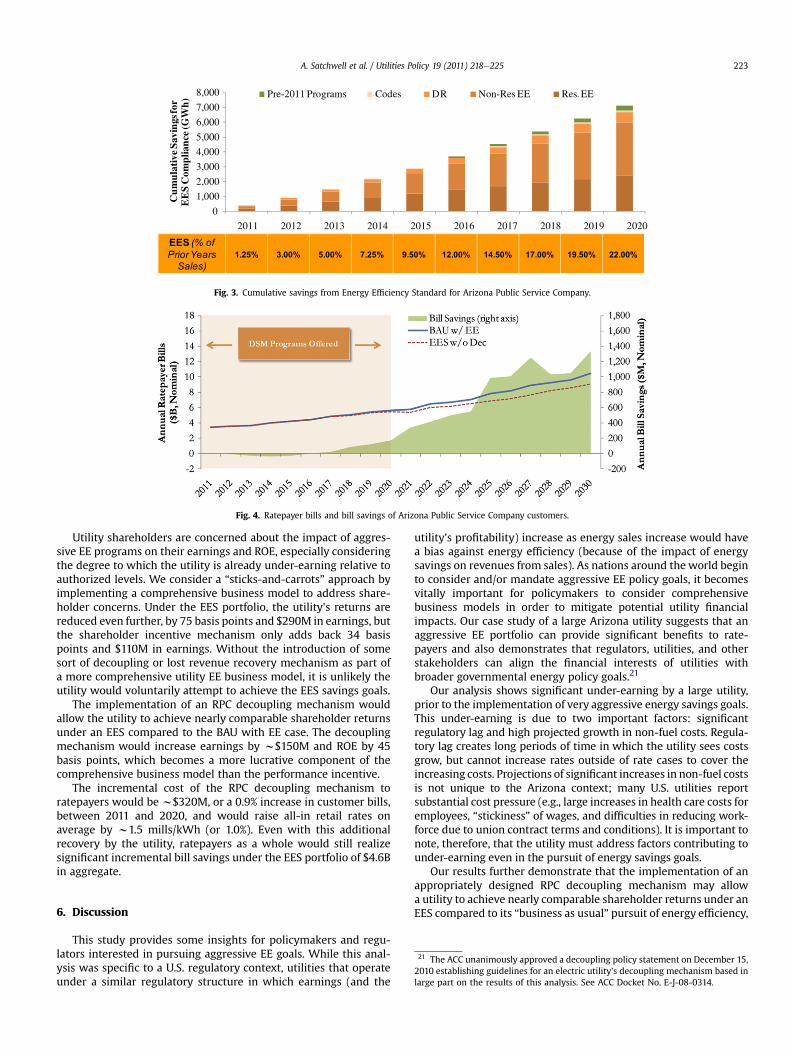
The EES portfolio represents savings and expenditure levelsbased on utility compliance with the Arizona EES. Under thisaggressive scenario, cumulative annual electricity savings exceed7000 GWh in the year 2020 when accounting for EES requirementsand credits (see Fig. 3). The utility achieves 95,002 GWh of elec-tricity savings between 2011 and 2030. The EES portfolio has a totalresource cost of w$2.2B and produces $3.6B in resource benefits,thus providing $1.4B in net resource benefits (see Table 1).
We constructed the portfolios based on typical program costs toachieve the established savings levels. In the BAU with EE portfolio,average EE costs were estimated atw1.9 cents/lifetime-kWh. Giventhe increase in savings levels in the EES portfolio, we estimated that
10 APS had an existing level of EE savings determined as part of a settlementagreement in its most recent rate case, which established an annual savings goal of1.0%, 1.25%, and 1.5% in 2010, 2011, and 2012, respectively. We assumed APSreturned to 1.0% annual savings level in 2013e2020.11 A decision was made to implement energy efficiency programs for a ten yearperiod (2011e2020) but allow the analysis period to extend out twenty years(2011e2030). This was done so the benefits derived from expenditures on energyefficiency measures implemented could be fully captured in the model timehorizon.12 All dollar figures are reported on a present value basis using a societal discountrate of 4.0%.13 In the calculation of resource benefits, we include the avoided cost of energy,avoided cost of generation capacity, and avoided cost of transmission and distri-bution capacity and exclude non-electric benefits (e.g., water savings, avoidedalternative fuel savings). We also do not include the shareholder incentive or thelost fixed cost recovery mechanism in estimating resource costs.
average EE costs would increase tow2.8 cents/lifetime-kWh.14 Thecosts associated with the EES portfolio is quite attractive comparedto supply-side alternatives. In both portfolios, 50% of electricsavings comes from residential programs in 2011 and the sharedecreases as we assume more savings will have to come fromcommercial and industrial EE programs over time. In Arizona,savings from residential lighting programs are projected todecrease due in large part to federal lighting standards set tochange in 2012.15
4.3. Utility business model for energy efficiency
Historically, utilities in Arizona have been allowed to recoverprudently incurred EE program costs; thus, program costs weremodeled as a component of the utility revenue requirement. TheACC has also previously approved a shareholder incentive for APSfor the successful achievement of target EE savings. The incentive iscapped at 14% of program costs, on a pre-tax basis. Wemodeled theshareholder incentive at the approved amount and assumed theutility would achieve 100% of its targeted energy savings. Weincluded both the program cost recovery and shareholder incentivebusiness model components in the initial analysis of the BAU withEE and EES portfolios.
Given the magnitude of the mandated energy efficiency savingsin Arizona, revenue erosion will likely become a major concern forthe state’s utilities if they achieve the EES savings goals. At the timeof our analysis, the ACC was considering allowing utilities toimplement a decoupling mechanism to support recovery ofauthorized fixed costs. Based on discussions with the ACC, wedecided to apply a revenue-per-customer (RPC) decoupling mech-anism. An RPC decoupling mechanism is designed to recover theutility’s required revenues on a per-customer basis. The decouplingmechanism was applied only in the EES case to make the utilityfinancially indifferent between the pursuit of the EES goals or lack
14 The estimated program cost per lifetime kWh saved is averaged over the2011e2020 period. EE program costs increase from w1.5 cents/lifetime-kWh in2011 to 4.0 cents/lifetime-kWh in 2020 in nominal terms.15 Our EE portfolio savings and costs were reviewed and vetted by APS and areconsistent with the utility’s typical program offerings.
Fig. 2. Effect of energy efficiency portfolios on Arizona Public Service Company load forecast.
Table 1Lifetime savings, resource costs and benefits of alternative energy efficiency port-folios (2011e2020).
Case Portfolio lifetime savings Total resource ($M, PV)
Peakenergy(GWh)
Off-peakenergy(GWh)
Totalenergy(GWh)
Peakdemand(MW)
Benefits Costs Netbenefits
BAU w/EE 30,507 13,074 43,581 602 1675 729 946EES 75,664 19,338 95,002 1520 3616 2208 1408
A. Satchwell et al. / Utilities Policy 19 (2011) 218e225222
thereof (relative to the BAU with EE).16 When paired with a share-holder incentive mechanism, this comprehensive business modelmay provide an opportunity for the utility to realize additionalearnings and/or a higher ROE from the successful achievement ofthe aggressive energy efficiency savings goals.
5. Results
Our analysis suggests that the EES portfolio provides substantialratepayer bill savings at relatively modest rate increases.17 If APSachieves the savings targets in the EES, then ratepayers wouldrealize about $4.6B of customer bill savings between 2011 and 2030(see Fig. 4). These incremental bill savings are in addition to the billsavings that customers realize from participating in the existingenergy efficiency programs offered by the utility in the BAU case(w$4.3B) and are also net of the costs of energy efficiency programs(e.g., costs of administering the program, incentives to customers).It is important to note that ratepayers, as a whole, begin to see billsavings starting in 2016 as new generation plants begin to bedeferred and fuel costs are reduced (see Fig. 4). This trend inaggregate bill savings occurs for two reasons. First, the utility costsavings associated with these energy efficiency portfolios (e.g.reduced fuel costs and lower capital and O&M requirements fornew generation) take time to develop and inure to ratepayers(based on the timing of general rate case filings) sufficient to offsetthe annual EE program expenditures. Second, the costs of theenergy efficiency programs are expensed during each programyear,while the energy savings and other benefits accrue over the life-times of the measures.18 Thus, in this situation, a short-term anal-ysis might not fully capture the bill reductions that would occur
16 We did not include a decoupling or lost revenue recovery mechanism in theBAU with EE case based on discussions with ACC and Arizona utilities.17 The Benefits Calculator model used to perform this analysis only providesaggregate ratepayer effects; thus rate and bill impacts cannot be broken outseparately for participants in the EE program or non-participating customers.18 Bill savings also increase after 2020 because DSM program costs are no longerincurred while savings from measures installed continue to yield savings over theireconomic lifetime (assumed to be 10 years for the entire portfolio of measures) andreduce customer bills.
over time and inure to consumers as a whole, depending upon thetime horizon chosen.
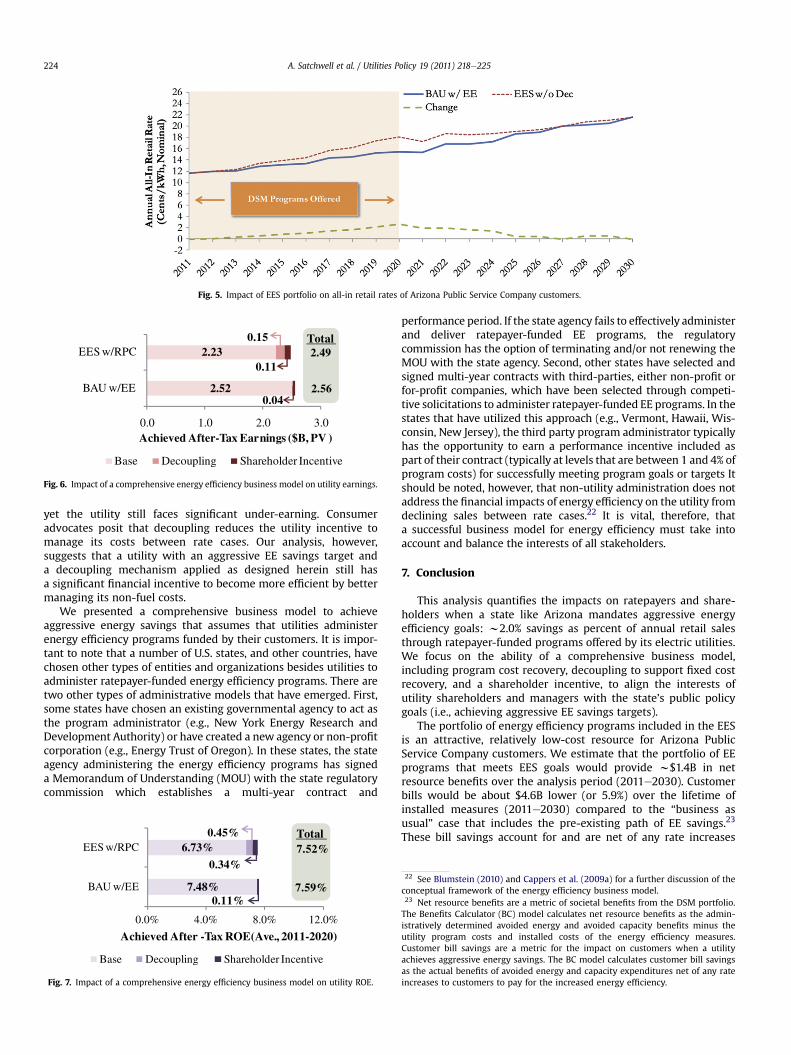
Customer rate impacts from energy efficiency increase assavings levels rise. This is primarily a function of the decline in salesbeing higher than the reduction in revenue requirement from theachieved EE savings.19 In the EES portfolio, annual rates arew1.0 cents/kWh higher, on average, than in the BAU with EEportfolio (see Fig. 5). There is an observed increase in retail rateswhile DSM programs are being offered (2011e2020) and a decreasein retail rates when DSM programs costs are no longer incurred andthe savings from EE accrue to ratepayers.
If the regulators adopt a “stick-only” approach, they wouldestablish energy savings goals that the utility must achieve andonly provide for recovery of energy efficiency program costs. Theutility’s base earnings and base ROE for each scenario in Fig. 6 andFig. 7 reflect this “stick-only” approach in which the utility is onlyallowed to recover the costs of energy efficiency programs, but isnot allowed to recover “lost revenues” associated with energyefficiency or provided an opportunity for additional earnings if theyachieve energy efficiency savings targets. In the “business as usual”case (which includes the current level of energy efficiencyprograms), utility base earnings are about $2.52B between 2010and 2030 (see Fig. 6). In the EES scenario, the utility achieves baseearnings of $2.23B, which is w$290M lower than the BAU with EEcase. This illustrates the point that a utility which achievesaggressive EES goals will end up with lower earnings compared toa BAU case. A similar trend is observed with respect to the impactson the utility’s return on equity (ROE). The achieved ROE for APS ismuch lower (w7%) than its authorized ROE (11%); APS is under-earning the authorized ROE by w400 basis points based on ouranalysis.20 The utility is experiencing significant under-earnings asa result of the lag in years between when a request for rate changeis filed with regulators and when the regulators approve the rateincrease (i.e., regulatory lag), as well as non-fuel costs areincreasing at a much faster rate than revenue collections. In addi-tion to these pre-existing impacts on utility earnings, aggressiveEES goals exacerbate the impact on the utility’s ROE in the absenceof a comprehensive business model. The utility’s base ROE is 75basis points lower if it achieves the EES savings goals compared tothe BAU case, 6.73% vs. 7.48% (see Fig. 7).
19 All-in retail rates are a function of the utility’s revenue requirement in thenumerator and sales in the denominator. Mathematically, a unit decrease in thenumerator will decrease the fraction while a unit decrease in the denominator willincrease the fraction, ceteris paribus. In this case, both the numerator anddenominator are being reduced. In percentage terms, electricity sales (denomi-nator) are dropping much faster than the revenue requirement (numerator), soretail rates (the fraction) will increase.20 Basis points are used to denote the change in a financial metric. For example,a 100 basis points drop in ROE is equal to a 1% reduction in return on equity.
0
1,000
2,000
3,000
4,000
5,000
6,000
7,000
8,000
2011 2012 2013 2014 2015 2016 2017 2018 2019 2020
Cu
mu
lati
ve S
avin
gs fo
r E
ES
Com
plia
nce
(GW
h) Pre-2011 Programs Codes DR Non-Res EE Res. EE
EES (% of
Prior Years
Sales)
1.25% 3.00% 5.00% 7.25% 9.50% 12.00% 14.50% 17.00% 19.50% 22.00%
Fig. 3. Cumulative savings from Energy Efficiency Standard for Arizona Public Service Company.
Fig. 4. Ratepayer bills and bill savings of Arizona Public Service Company customers.
A. Satchwell et al. / Utilities Policy 19 (2011) 218e225 223
Utility shareholders are concerned about the impact of aggres-sive EE programs on their earnings and ROE, especially consideringthe degree to which the utility is already under-earning relative toauthorized levels. We consider a “sticks-and-carrots” approach byimplementing a comprehensive business model to address share-holder concerns. Under the EES portfolio, the utility’s returns arereduced even further, by 75 basis points and $290M in earnings, butthe shareholder incentive mechanism only adds back 34 basispoints and $110M in earnings. Without the introduction of somesort of decoupling or lost revenue recovery mechanism as part ofa more comprehensive utility EE business model, it is unlikely theutility would voluntarily attempt to achieve the EES savings goals.
The implementation of an RPC decoupling mechanism wouldallow the utility to achieve nearly comparable shareholder returnsunder an EES compared to the BAU with EE case. The decouplingmechanism would increase earnings by w$150M and ROE by 45basis points, which becomes a more lucrative component of thecomprehensive business model than the performance incentive.
The incremental cost of the RPC decoupling mechanism toratepayers would be w$320M, or a 0.9% increase in customer bills,between 2011 and 2020, and would raise all-in retail rates onaverage by w1.5 mills/kWh (or 1.0%). Even with this additionalrecovery by the utility, ratepayers as a whole would still realizesignificant incremental bill savings under the EES portfolio of $4.6Bin aggregate.
21 The ACC unanimously approved a decoupling policy statement on December 15,2010 establishing guidelines for an electric utility’s decoupling mechanism based inlarge part on the results of this analysis. See ACC Docket No. E-J-08-0314.
6. Discussion
This study provides some insights for policymakers and regu-lators interested in pursuing aggressive EE goals. While this anal-ysis was specific to a U.S. regulatory context, utilities that operateunder a similar regulatory structure in which earnings (and the
utility’s profitability) increase as energy sales increase would havea bias against energy efficiency (because of the impact of energysavings on revenues from sales). As nations around the world beginto consider and/or mandate aggressive EE policy goals, it becomesvitally important for policymakers to consider comprehensivebusiness models in order to mitigate potential utility financialimpacts. Our case study of a large Arizona utility suggests that anaggressive EE portfolio can provide significant benefits to rate-payers and also demonstrates that regulators, utilities, and otherstakeholders can align the financial interests of utilities withbroader governmental energy policy goals.21
Our analysis shows significant under-earning by a large utility,prior to the implementation of very aggressive energy savings goals.This under-earning is due to two important factors: significantregulatory lag and high projected growth in non-fuel costs. Regula-tory lag creates long periods of time in which the utility sees costsgrow, but cannot increase rates outside of rate cases to cover theincreasing costs. Projections of significant increases in non-fuel costsis not unique to the Arizona context; many U.S. utilities reportsubstantial cost pressure (e.g., large increases in health care costs foremployees, “stickiness” of wages, and difficulties in reducing work-force due to union contract terms and conditions). It is important tonote, therefore, that the utility must address factors contributing tounder-earning even in the pursuit of energy savings goals.
Our results further demonstrate that the implementation of anappropriately designed RPC decoupling mechanism may allowa utility to achieve nearly comparable shareholder returns under anEES compared to its “business as usual” pursuit of energy efficiency,
2.52
2.230.15
0.04
0.11
0.0 1.0 2.0 3.0
BAU w/EE
EES w/RPC
Achieved After-Tax Earnings ($B, PV )
Base Decoupling Shareholder Incentive
2.49
2.56
Total
Fig. 6. Impact of a comprehensive energy efficiency business model on utility earnings.
Fig. 5. Impact of EES portfolio on all-in retail rates of Arizona Public Service Company customers.
A. Satchwell et al. / Utilities Policy 19 (2011) 218e225224
yet the utility still faces significant under-earning. Consumeradvocates posit that decoupling reduces the utility incentive tomanage its costs between rate cases. Our analysis, however,suggests that a utility with an aggressive EE savings target anda decoupling mechanism applied as designed herein still hasa significant financial incentive to become more efficient by bettermanaging its non-fuel costs.
We presented a comprehensive business model to achieveaggressive energy savings that assumes that utilities administerenergy efficiency programs funded by their customers. It is impor-tant to note that a number of U.S. states, and other countries, havechosen other types of entities and organizations besides utilities toadminister ratepayer-funded energy efficiency programs. There aretwo other types of administrative models that have emerged. First,some states have chosen an existing governmental agency to act asthe program administrator (e.g., New York Energy Research andDevelopment Authority) or have created a new agency or non-profitcorporation (e.g., Energy Trust of Oregon). In these states, the stateagency administering the energy efficiency programs has signeda Memorandum of Understanding (MOU) with the state regulatorycommission which establishes a multi-year contract and
7.48%
6.73%0.45%
0.11%
0.34%
0.0% 4.0% 8.0% 12.0%
BAU w/EE
EES w/RPC
Achieved After -Tax ROE(Ave., 2011-2020)
Base Decoupling Shareholder Incentive
7.52%
7.59%
Total
Fig. 7. Impact of a comprehensive energy efficiency business model on utility ROE.
performance period. If the state agency fails to effectively administerand deliver ratepayer-funded EE programs, the regulatorycommission has the option of terminating and/or not renewing theMOU with the state agency. Second, other states have selected andsigned multi-year contracts with third-parties, either non-profit orfor-profit companies, which have been selected through competi-tive solicitations to administer ratepayer-funded EE programs. In thestates that have utilized this approach (e.g., Vermont, Hawaii, Wis-consin, New Jersey), the third party program administrator typicallyhas the opportunity to earn a performance incentive included aspart of their contract (typically at levels that are between 1 and 4% ofprogram costs) for successfully meeting program goals or targets Itshould be noted, however, that non-utility administration does notaddress the financial impacts of energy efficiency on the utility fromdeclining sales between rate cases.22 It is vital, therefore, thata successful business model for energy efficiency must take intoaccount and balance the interests of all stakeholders.
7. Conclusion
This analysis quantifies the impacts on ratepayers and share-holders when a state like Arizona mandates aggressive energyefficiency goals: w2.0% savings as percent of annual retail salesthrough ratepayer-funded programs offered by its electric utilities.We focus on the ability of a comprehensive business model,including program cost recovery, decoupling to support fixed costrecovery, and a shareholder incentive, to align the interests ofutility shareholders and managers with the state’s public policygoals (i.e., achieving aggressive EE savings targets).
The portfolio of energy efficiency programs included in the EESis an attractive, relatively low-cost resource for Arizona PublicService Company customers. We estimate that the portfolio of EEprograms that meets EES goals would provide w$1.4B in netresource benefits over the analysis period (2011e2030). Customerbills would be about $4.6B lower (or 5.9%) over the lifetime ofinstalled measures (2011e2030) compared to the “business asusual” case that includes the pre-existing path of EE savings.23
These bill savings account for and are net of any rate increases
22 See Blumstein (2010) and Cappers et al. (2009a) for a further discussion of theconceptual framework of the energy efficiency business model.23 Net resource benefits are a metric of societal benefits from the DSM portfolio.The Benefits Calculator (BC) model calculates net resource benefits as the admin-istratively determined avoided energy and avoided capacity benefits minus theutility program costs and installed costs of the energy efficiency measures.Customer bill savings are a metric for the impact on customers when a utilityachieves aggressive energy savings. The BC model calculates customer bill savingsas the actual benefits of avoided energy and capacity expenditures net of any rateincreases to customers to pay for the increased energy efficiency.

A. Satchwell et al. / Utilities Policy 19 (2011) 218e225 225
necessary to fund the increased energy efficiency efforts. Rates aremodestly increased by w1.0 cents/kWh higher, on average, than inthe pre-existing case.
Our analysis also suggests that the utility faces significanterosion in earnings and a lower ROE as more aggressive energyefficiency programs are implemented. Without the effect of an RPCdecoupling mechanism, utility earnings are w$220M lower underthe EES scenario compared to the BAU with EE scenario. Ouranalysis, however, shows that it is possible to design an RPCdecoupling mechanism that allows the utility to effectively removethe impacts on the utility’s achieved ROE from the lower sales andthus reduced recovery of fixed costs. With the implementation ofan RPC decoupling mechanism designed in this fashion along witha shareholder incentive that provides the Arizona utility with 14%of program costs on a pre-tax basis, shareholder returns (i.e., ROE)would be comparable to the BAU with EE scenario. The imple-mentation of this type of decoupling mechanism would onlyslightly increase average all-in retail rates by w1.0%.
Acknowledgments
The work described in this report was funded by the U.S.Department of Energy’s Office of Electricity Delivery and EnergyReliability (OE) - Permitting, Siting and Analysis Division underContract No. DE-AC02-05CH11231. The authors would like to thankLarry Mansueti (DOE OE) for his support of this project. The authorswould also like to thank Jeff Schlegel for his comments and feed-back on this paper.
References
Barbose, G., Goldman, C., Schlegel, J., 2009. The shifting landscape of ratepayerfunded energy efficiency in the U.S. The Electricity Journal 22 (8), 29e44.
Blumstein, C., 2010. Program evaluation and incentives for administrators of energyefficiency programs: Can evaluation solve the principal/agent problem? EnergyPolicy 38, 6232e6239.
Cappers, P., Goldman, C., 2009b. Empirical Assessment of Shareholder IncentiveMechanisms Designs under Aggressive Savings Goals: Case Study of a Kansas"Super-Utility". LBNL. Report No.: 2492E.
Cappers, P., Goldman, C., 2009c. Financial impact of energy efficiency undera federal renewable electricity standard: case study of a Kansas "super-utility".Energy Policy 38, 3998e4010.
Cappers, P., Goldman, C., Chait, M., Edgar, G., Schlegel, J., Shirley, W., 2009a.Financial Analysis of Incentive Mechanisms to Promote Energy Efficiency: CaseStudy of a Prototypical Southwest Utility. Lawrence Berkeley National Labora-tory (LBNL). Report No.: 1598E.
Cappers, P., Satchwell, A., Goldman, C., Schlegel, J., 2010. Benefits and Costs ofAggressive Energy Efficiency Programs and the Impacts of Alternative Sourcesof Funding: Case Study of Massachusetts. LBNL. Report No.: 3833E.
Croucher, M., 2011. Are energy efficiency standards within the electricity sectora form of regulatory capture? Energy Policy 39 (6), 3602e3604.
Eto, J., Stoft, S., Belden, T., 1997. The theory and practice of decoupling utilityrevenues from sales. Utilities Policy 6 (1), 43e55.
Golove, W.H., Eto, J.H., 1996. Market Barriers to Energy Efficiency: A CriticalAppraisal of the Rationale for Public Policies to Promote Energy Efficiency. LBNL.Report No.: 38059.
Harrington, S., Moskovitz, D., Austin, T., Weinberg, C., Holt, E., 1994. RegulatoryReform: Removing the Disincentives. The Regulatory Assistance Project(Gardiner, ME and Montpelier, VT).
Hayes, S., Nadal, S., Kushler, M., York, D., 2011. Carrots for Utilities: ProvidingFinancial Returns for Utility Investments in Energy Efficiency. American Councilfor an Energy Efficient Economy (ACEEE). Report No.: U111.
Hirst, E., Blank, E., 1994. Solutions to regulatory disincentives for utility DSM pro-grammes. Utilities Policy 4, 105e112.
Hirst, E., Goldman, C., Hopkins, M.E., 1991. Integrated resource planning: electricand gas utilities in the USA. Utilities Policy 1, 172e186.
Jensen, V., 2007. Aligning Utility Incentives with Investment in Energy Efficiency:A Product of the National Action Plan for Energy Efficiency. ICF International,Inc.
Molina, M., Neubauer, M., Sciortino, M., Nowak, S., Vaidyanathan, S., Kaufman, N.,Chittum, A., 2010. The 2010 State Energy Efficiency Scorecard. ACEEE. ReportNo.: E107.
Moskovitz, D., 1989. Profits and Progress Through Least-Cost Planning. Reportprepared by the National Association of Regulatory Utility Commissioners,Washington, DC.