Embed Size (px)
Citation preview
1
Abstract—Datacenter federations are able to manage appropriately the green energy resources available in each datacenter (DC) thanks to their geographically distributed infrastructure, thus reducing energy expenditure. Scheduling algorithms can perform virtual machine migration, transferring a huge amount of raw data from one DC to another to minimize operational costs and ensuring a certain Quality of Experience (QoE). Optical connections can be used to provide connectivity services of enough capacity so as to perform those migrations. In particular, elastic optical networks can provide connections with multi-granular bitrate, which can be adapted on demand. DC resource managers can request optical connections and control their capacity. However, that scheme involves the resource managers to implement algorithms and interfaces to deal with network specifics and complexity. To solve that issue, in this paper we propose carrier software defined network (SDN) to perform network-driven transfer mode for inter-DC operations; inter-DC connectivity is requested in terms of volume of data and completion time. We analyze cost savings when each connectivity model is applied in a DC federation. For the sake of a compelling analysis, exhaustive simulation experiments are carried out considering realistic scenarios. Results show that the network-driven model can save up to 20% of energy costs and more than 30% of communication costs in the evaluated scenarios.
Key words—Federated datacenters, Energy costs minimization, Inter-datacenter networks.
I. INTRODUCTION he huge energy consumption of datacenters (DC) requires an elastic resource management, e.g. by turning servers off when they are not used or turning them on to satisfy
increments in the demand. Thanks to virtualization, jobs (e.g., web applications) can be encapsulated in virtual machines (VM) mixed with other workloads and consolidate them in the most proper server according to their performance goals. The local resource manager can migrate VMs from one server to another looking for reducing energy consumption while ensuring the committed quality of experience (QoE) [1].
Large Internet companies, such as Google, have their own IT infrastructures consisting in a number of large DCs placed in geographically diverse locations to guarantee the appropriate QoE to users; DCs are interconnected through a wide area network [2]. Using infrastructure, workloads can be moved among DCs to take advantage of reduced energy cost during off-peak energy periods in some locations while using green energy when it is available in some other locations. Servers are turned off when they are not used, thus minimizing their energy expenditure. Nonetheless, smaller independently
The research leading to these results has received funding from the European Community's Seventh Framework Programme FP7/2007-2013 under grant agreement n° 317999 IDEALIST project and from the MICINN TEC2011-27310 ELASTIC project.
operated infrastructures cannot perform such elastic operations; notwithstanding, they can cooperate by creating DC federations [3] to increase their revenue from using IT resources that would otherwise be under-utilized, and to expand their geographic coverage without building new DCs.
Within a single DC, VM migrations for consolidation and load balancing purposes are commonly automated using scheduled-based algorithms running in the local resource manager. These algorithms target at optimizing some utility function, ensuring quality of experience and service availability; its outcome is the set of VMs to be activated, stopped or migrated in the local DC. When a DC federation is created, scheduling algorithms need to consider not only local workload and resources but also those in the rest of federated DCs and compute VM migration towards remote DCs, as well as within the local DC.
In a recent global cloud index study [4], Cisco forecasts DC traffic to quadruple over the next years, reaching 554 EB per month by 2016. Two main components of traffic leaving DCs can be distinguished: traffic among DCs (DC2DC) and traffic between DCs and end users (DC2U). The former includes VM migration to manage the cloud elastically, whilst the latter is associated to applications, such as web, email, etc. Network providers can facilitate federated DCs interconnection by allowing them to request connections’ setup on demand with the desired bitrate, while tearing down those connections when they are not needed. In the last years, huge standardization work has been done defining control plane architectures and protocols to automate connection provisioning. The IETF is defining the Application-Based Network Operations (ABNO) architecture [5], which is based on standard components such as the active stateful Path Computation Element (PCE).
Since DC2DC traffic is generated by VM migration, the connectivity required between two DCs highly varies along the day, presenting dramatic differences in an hourly time scale. In [6], we proposed to use flexgrid-based optical network to interconnect DCs, since that technology provides fine and multiple granularity. In flexgrid optical networks the available optical spectrum is divided into frequency slices of fixed spectrum width. Optical connections can be allocated into a variable number of these slices, and its capacity can be dynamically managed by allocating or releasing slices provided that the spectrum allocated to an optical connection remain contiguous [7]. A. Related work
In this work we assume a scenario where federated DCs interconnected by a flexgrid-based network, are strategically placed around the globe to provide worldwide high QoE
Carrier SDN to Control Flexgrid-based Inter-Datacenter Connectivity
A. Asensio*, L. Velasco, M. Ruiz, and G. Junyent Optical Communications Group (GCO). Universitat Politècnica de Catalunya (UPC), Barcelona, Spain
T
2014 copyright by IFIP
ONDM 2014, 19-22 May, Stockholm, Sweden
43
services. Each DC obtains its required energy from green sources and from the electric grid (brown energy). Green energy can cover a given percentage of the total energy DC requirement (green coverage), while the rest of required energy is covered by the electric grid. In our previous work [8], we studied two approaches to orchestrate DC federation: distributed and centralized, and concluded that the centralized approach takes full advantage from green energy availability in the federated DCs helping to minimize energy and communication costs while ensuring QoE. Thus, here we assume a centralized federation orchestrator computing periodically the global optimal placement for all the VMs in the federated DCs.
When deploying energy-efficient DCs, their internal architecture must be kept in mind. A certain number of switches are needed to provide connectivity between servers in the DC and to interface the DC with the Internet. Consequently, according to the DC architecture being adopted, a corresponding power is consumed, which basically depends on the number and type of switches used. Several intra-DC architectures have been studied in literature (see [9] for a detailed survey). Among them, the so-called flattened butterfly architecture has been identified as the most power-efficient DC architecture, since its power consumption is proportional to the number of currently used servers. However, the most widely-deployed architecture for DC is the so-called fat-tree topology [10], which is based on a hierarchical structure where large higher-order switches represent the interface of the DC towards the network infrastructure, and are connected to the servers via a series of lower-order switches, providing the intra-DC connectivity.
Many papers can be found in the literature addressing the energy expenditure minimization in DC management [11]-[14]. In [11], the authors propose scheduling workload in a DC coinciding with the availability of green energy, consolidating all the jobs on time slots with solar energy available, increasing green energy consumption up to 31%. Authors in [12] present a DC architecture to reduce power consumption, while guarantee QoE. They consider online-monitoring and VM placement optimization achieving energy savings up to 27%. Some works, e.g. [13], refer to the problem of load balance DC workloads geographically, following green energy availability, to reduce the amount of brown energy consumed focusing mainly on wind energy and the capability of store energy. Other authors focus on the importance of counting as “energy expenditure” every element in the DC, not only computing machinery. The author in [14] remarks the idea that all IT equipment counts when consuming energy, also the fluctuation of green energy production and energy transportation are important factors.
As elastic operations for VM migration require huge bitrate to be available among DCs for some time periods, the inter-DC network can be based on the optical technology and must provide automated interfaces to set-up and tear down optical connections with the required bitrate. Some works consider optical networks to interconnect DCs. For instance, routing algorithms considering both routing and scheduling are presented in [15] and energy savings are shown with respect to solving routing and scheduling problems separately.
Some works using flexgrid networks to interconnect DCs
are currently appearing in the literature. Authors in [16] propose an application controller that interfaces an OpenFlow controller for the flexgrid network, similarly to the approach followed by Google [2]. Notwithstanding, some network operators are supporting ABNO in the IETF, so there is a lack of consensus on the architecture. In this work we assume IETF’s architecture, supported by major European network operators within the IDEALIST project [17]. B. Contributions
Even though local resource managers can request optical connections set-up, tear down, and on-demand adapt their capacity, the flexgrid interconnection network supports additional traffic for different services and clients. Therefore, competence for network resources could lead to connections capacity being reduced or even blocked at requesting time. In that case, resource managers can either perform connection request retries, similar to I/O pooling (software-driven I/O) in computers, to increase the bitrate of already established connections or set-up new ones, although without guarantees of success, resulting in a poor cloud performance.
To alleviate to some extend the dependency between cloud management and network connectivity, in this paper we propose a novel connectivity model named network-driven. An abstraction layer on the top of the ABNO controller, the carrier SDN, could be deployed. The carrier SDN controller implements a northbound interface to request transfer operations. Those applications’ operations are transformed into network connection requests. The northbound interface uses application-oriented semantic, liberating application developers from understanding and dealing with network specifics and complexity.
The rest of this paper is organized as follows. Section 2 describes a power model for intra-DC architecture, the motivation of this work, and the proposed architecture for the federated DC interfacing the carrier SDN controller, which, in turn, interfaces the ABNO controller in charge of the interconnection network. Illustrative results are provided in section 3 to compare application-driven and network-driven connectivity models. We show that the latter reduces both energy and communications costs compared to the former. Finally, section 4 concludes the paper.
II. ORCHESTRATING FEDERATED DATACENTERS A. Datacenter Power Model
Power consumption in DCs comes mainly from IT devices, PIT, which includes both the servers and the switches connecting them, and from non-IT equipment, Pnon-IT, such as cooling, power supplies and power distribution systems. Although PIT can be easily estimated, it is difficult to evaluate the power consumption of non-IT devices since it depends on factors which cannot be easily estimated, such as the geographical location or the building hosting that DC. An indirect way to estimate Pnon-IT is to consider the Power Usage Effectiveness (PUE) metric [18]. PUE can be used as a measure of the energy efficiency of a DC and quantifies the amount of power consumed by non-IT equipment in that DC. Therefore, if PIT and PUE can be estimated for a given DC, the total power consumed in a DC can be computed as PDC=PUE*PIT.
2014 copyright by IFIP
ONDM 2014, 19-22 May, Stockholm, Sweden
44
To compute PIT, the power consumed by both the servers and network equipment must be considered. The power consumption of a server depends mainly on the CPU utilization as function of the load, and can be estimated as Pserver(load) = Pserver-idle + (Pserver-max - Pserver-idle)*load (1), where load represents the ratio between the current load and the maximum capacity of the server, whilst Pserver-idle and Pserver-max represent the power consumed by the server when it is idle and when it operates at its maximum capacity, respectively [15]. The power consumed by network equipment depends on the specific architecture of the DC. In this work, we assume the fat-tree architecture [10], which consists of three switching layers; from top to bottom: Core, Aggregation and Edge. The aggregation and edge layers together with the servers are organized in a number of clusters M. Each cluster has M/2 edge switches, M/2 aggregation switches, and M2/4 servers. In addition, there are M2/4 M-port core switches, each having one port connected to each cluster, whilst each cluster is connected to every core switch. Then, power consumption of the IT devices in the DC can eventually be computed as follows, where Pcore, Pagg, and Pedge denote power consumption of core, aggregation, and edge switches, respectively and loads
i the load in server s, which is in cluster i.
(2)
B. Minimizing energy expenditures A first optimization to reduce energy expenditures is to
perform consolidation, placing VMs so as to load servers as much as possible and switching off those servers that become unused. To further reduce energy consumption, consolidation can be performed by taking into account clusters structure, and switching on/off clusters as single units. Those servers in switched on clusters without assigned load remain active and ready to accommodate spikes in demand.
In addition, DC federations can perform elastic operations, migrating VMs among DCs aiming at minimizing operational costs by taking advantage from available green energy in some DCs and off-peak cheap brown energy in others DCs while ensuring the desired QoE level. We use latency experienced by the users of a service as a measure of QoE level.
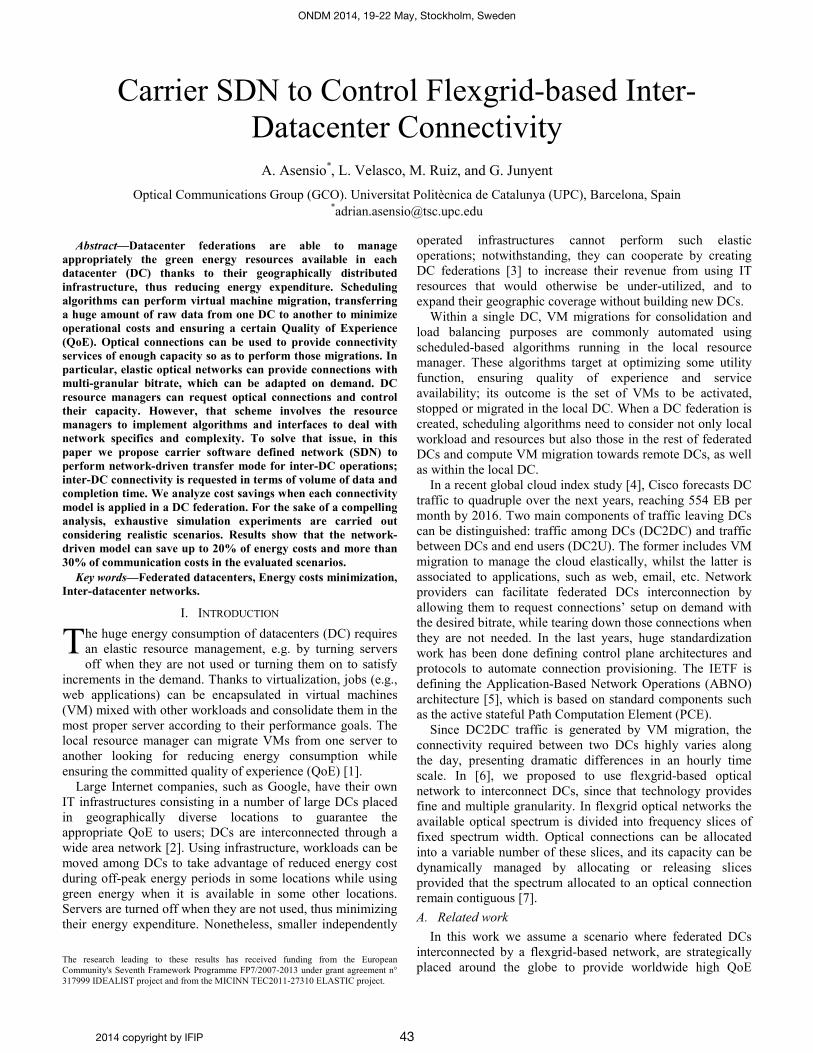
We assume that a federation orchestrator (Fig. 1) computes periodically the global optimal placement for all the VMs in the federated DCs so as to minimize operational costs whilst ensuring QoE. That centralized architecture has proved to reduce operational costs, when dominated by energy and communications costs [8]. The orchestrator computes VM placement and communicates that to each DC resource manager; local resource managers interface the rest of DCs to coordinate VM migration and the SDN controlling the interconnection network to request optical DC2DC connections’ set-up and teardown. To solve the scheduling problem some data must be available, such an estimation of QoE perceived by the users, the amount of green energy available in each DC, the cost of brown energy, among others. QoE can be estimated by a specialized module inside each resource manager. The cost of brown energy comes from the contract each DC has with the local power supply company, which varies with the time of day. Finally, the amount of green energy that will be likely available in the next period
Fig. 1. Carrier SDN implementing a northbound interface for the application layer and request/response and notifications towards the network.
can be predicted using historical data and weather forecast [19]. Then, each local resource manager performs VM migration sending its data to some remote DC.
We assume that DCs are dimensioned to cover some proportion βd of the total energy consumption for the maximum dimensioning. Then, green coverage in DC d, αd, can be estimated as, αd(t) = βd * δd(t), where δd(t) is the normalized availability of green energy as a function of the time of day in the location of DC d. Finally, the amount of green energy available at period t can be estimated as gd(t)= αd(t)*Energy_MaxDimensioning. Therefore, being the VMs to be placed in each DC in the next period known, the federation orchestrator can compute precisely the amount of workload in each DC, compute the green energy available and thus, the optimal VM placement.
After the federation scheduler schedules the next period, local resource managers can start performing VM migration. To that end, they interface the interconnection network control plane as a way to automatize connection set-up and tear down with the required bitrate.
C. Carrier SDN for federated Datacenters Since scheduling algorithms run periodically each hour,
VM migrations are required to be performed within each period. In fact, from the client point of view, the offered network service is better when the VMs are transferred fast to their proper locations. However, the network operator wants to use its resources as much as possible, so it is required to assess a connectivity model which can fit with users and operators requirements. In this paper we compare two connectivity models: i) application-driven, and ii) network-driven model.
In the application-driven model, each local resource manager controls connectivity to remote DCs so as to perform VM migration in the shortest total time. The source resource manager requests Label Switched Paths (LSP) set-up, tear down, as well as elastic operations to the ABNO controller (Fig. 2a). After checking local policies, the ABNO controller forwards the requests to the active stateful PCE, which performs LSP operations on the controlled network. It is worth noting that, although applications have full control over the connectivity process, physical network resources are shared with a number of clients and LSP set-up and elastic spectrum increments could be blocked as a result of lack of resources in
( )∑ ∑= =
++⋅+⋅=
M
i
M
s
isserveredgeaggcoreIT loadPPPMPMP
1
4
1
2 2
)(24
Connectivity Control
LocalScheduler
Resource manager
QoE estimation
DatacenterA
Green energy estimation
Resource manager
DatacenterB
Core Optical Network
Optical Connection
IT resources coordination and synchronization
LocalScheduler
QoE estimation
Green energy estimation
Carrier SDNRequest/Response
Notify
ActiveStateful
PCE
ABNOController
Policy Agent
TED LSP-DB
Prov. Mngr OAM Handler
Federation OrchestratorCentral
Scheduler
2014 copyright by IFIP
ONDM 2014, 19-22 May, Stockholm, Sweden
45
t
Bitra
te (G
b/s)
t1 t2 t3
20
50
80
t4
Resourcemanager SDN ABNO
TRANS RqVol=5TB
Time=25minError
Time=35min
OKBW=20Gb/s
PATH RqBW=20Gb/s
t3
t1
~~
~~
TRANS RqVol=5TB
Time=35min OK
t
Bitra
te (G
b/s)
t1 t2
102030
t3
Resourcemanager ABNO
PATH RqBW=100Gb/s
PATH RqBW=20Gb/s
OK
INC RqBW=100Gb/s
t1
INC RqBW=30Gb/s
OK
~~
ErrorBW=20Gb/s
ErrorBW=30Gb/s
t2
INC RqBW=100Gb/s
~~Error
BW=30Gb/s
SUBSCRIBE
PATH RqBW=30Gb/s
ErrorBW=20Gb/s
INC RqBW=50Gb/s
OK
NOTIFY
NOTIFYBW=50Gb/s
t2
INC RqBW=80Gb/s
OK
NOTIFY
NOTIFYBW=80Gb/s
a) Application-driven b) Network-driven
PATH Tear
OK t3
~~PATH Tear
OK t4
~~PATH Tear
OK
Application-driven
Network-driven
c) Bitrate vs. time
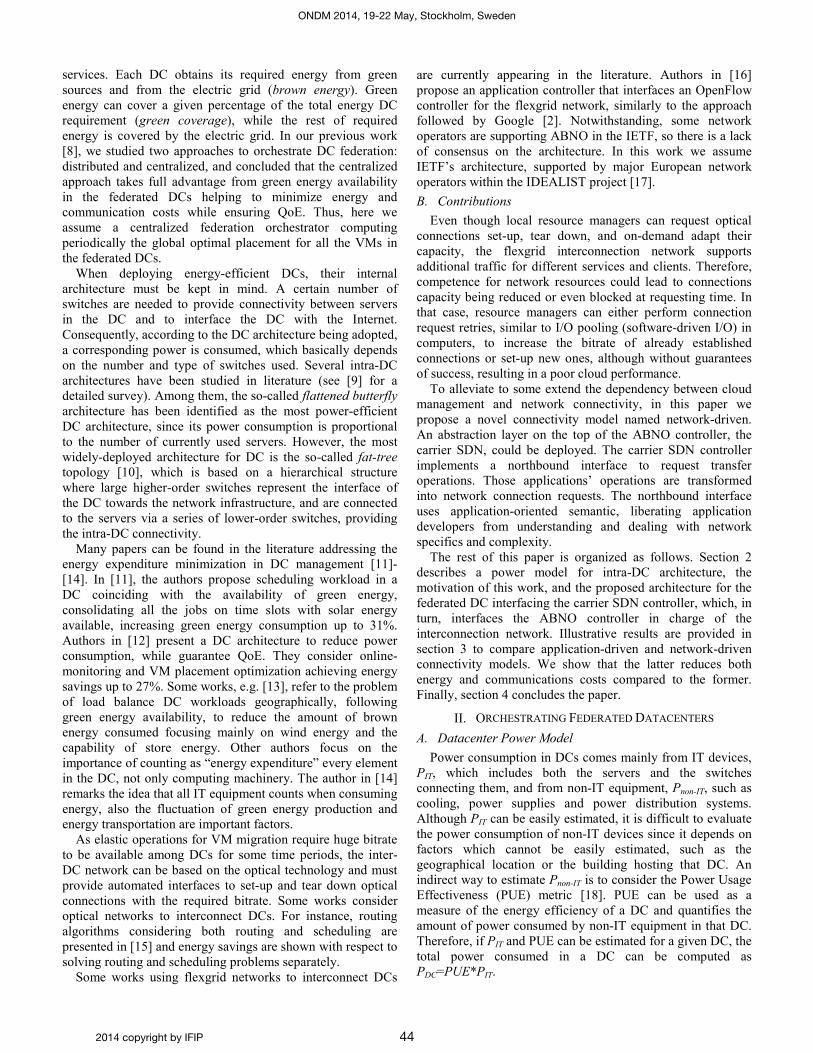
Fig. 2. Connection models and bitrate under each model.
the network. Hence, applications need to implement some sort of periodical retries to increase the allocated bandwidth until reaching the required level. These retries, could impact negatively on the performance of the inter-DC control plane and do not ensure achieving higher bandwidth.
In the network-driven model, applications request transferences instead of connectivity; a carrier SDN is deployed in between the network control plane and DC resource managers, as a new stratum to provide an abstraction layer to the underlying network. The carrier SDN controller implements a northbound interface to request transfer operations. Those applications’ operations are transformed into network connection requests. The northbound interface uses application-oriented semantic, liberating application developers from understanding and dealing with network specifics and complexity. Thus, resource managers request transfers using its native semantic: amount of data to be transferred, DC destination, completion time, etc. The carrier SDN controller is in charge of managing inter-DC connectivity; if not enough resources are available at requesting time, notifications (similar to interruptions in computers) are sent from the PCE to the carrier SDN controller each time specific resources are released. To that end, a subscription service has been implemented in the ABNO controller: the carrier SDN controller subscribes to a notification service in the ABNO controller; when some resource in the set of specified links is released the ABNO controller sends a notification message towards the subscribed carrier SDN controller. Upon receiving a notification, the carrier SDN controller takes decisions on whether to increase the bitrate associated to a transfer. Therefore, we have effectively removed the pooling mechanism and migrated to a network-driven transfer mode.
In the proposed network-driven model (Fig. 2b), the source resource manager sends a transfer request to the carrier SDN controller specifying the destination DC, the amount of data to be transferred, and the required completion time. Upon its reception, the carrier SDN controller requests the ABNO controller to find the greatest spectrum width available, taking into account local policies and current service level agreements (SLA) and sends a response back to the resource manager with the best completion time. The source resource manager organizes data transference and sends a new request with the suggested completion time. A new connection is set
TABLE I ALGORITHM FOR TRANSFER REQUEST INPUT source, destination, dataVol, rqTime, slotWidth OUTPUT Response 1: 2: 3: 4: 5: 6: 7: 8: 9:
minBitrate ← translateAppRequest (dataVol, rqTime, slotWidth) netResp ← requestConnection (source, destination, minBitrate) if netResp==KO then
maxBitrate ← getMaxBitrate (source , destination) minTime ← translateNetResponse (maxBitrate) return {KO, minTime}
requestSubscription (netResp.connId.route) time ← translateNetResponse (netResp.connId.bitrate) return {OK, netResp.connId, time}
up and its capacity is sent in the response message; besides, the carrier SDN controller requests ABNO controller to keep it informed upon more resources are left available in the route of that LSP. Algorithms deployed in the ABNO controller monitor spectrum availability in those physical links, so when resource availability allows increasing the allocated bitrate of some LSP, the carrier SDN controller performs elastic spectrum operations to ensure committed transfer completion times. Each time the carrier SDN controller modifies bitrate, a notification is sent to the source resource manager with the new throughput. The resource manager then optimizes VM migration as a function of the actual throughput while delegating ensuring completion transfer time to the carrier SDN controller. Fig. 2c shows the bitrate of the connections under both models. It is worth noting that the network-driven model takes advantage of the use of subscriptions and notify messages, being able to reduce time-to-transfer remarkably.
Table I presents the algorithm that we implemented in the carrier SDN controller for Transfer Requests. It translates requested data, data volume and completion time, into a required bitrate, taking into account frequency slot width in the Flexgrid network (line 1). Next an optical connection request is sent towards the ABNO controller, specifying source and destination of the connection and the bitrate (line 2). In case of lack of network resources (lines 3-6), the maximum available bitrate between source and destination DCs is requested to the ABNO controller, its result translated into the minimum completion time, which is used to inform the requesting DC resource manager. If the connection could be established, the carrier SDN requests a subscription to the links in the route of the connection, so as to be aware of available resources as soon as they are released in the network (line 7). Finally, the actual completion time is recomputed taking into consideration the connection’s bitrate and communicated back to the requesting DC resource manager.
III. ILLUSTRATIVE RESULTS In this section, we present the scenario considered in our
experiments and we show the results from using the application-driven and the network-driven connection models.
For evaluation purposes, we developed resource managers in an OpenNebula-based cloud middleware emulator. The federation orchestrator with the centralized scheduling algorithm was implemented as a stand-alone module in Java. Federated DCs are connected to an ad-hoc event-driven simulator developed in OMNET++. The simulator implements the carrier SDN controller and the flexgrid network with an ABNO controller on the top, as described in Fig. 1. Finally, the algorithm described in [20] for elastic spectrum allocation
2014 copyright by IFIP
ONDM 2014, 19-22 May, Stockholm, Sweden
46
was implemented. Federated DCs are connected to an ad-hoc event-driven simulator developed in OMNET++.
In our experiments, we assume a global 11-node topology where locations are used as source for DC2U traffic collecting user traffic towards the set of DCs, which consists of five DCs strategically located in Taiwan, India, Spain, and Illinois and California in the USA. A global telecom operator provides optical connectivity among DCs, which is based upon the flexgrid technology. The number of users in each location was computed considering Wikipedia's audience by regions that was scaled and distributed among the different locations in each region. Latency was computed according to Verizon’s data (See http://www.verizonbusiness.com).
Brown energy cost for each DC was estimated from their respective local electric company rates (e.g. Europe’s Energy Portal and U.S. Department of Labor) and green energy coverage was obtained from U.S. Department of Labor. Servers in DCs are assumed to be HP ProLiant DL580 G3, equipped with four processors, 2 cores per processor, with Pserver-idle = 520W and Pserver-max = 833W.
In line with [10], DCs are dimensioned assuming a fat-tree topology with a maximum of M=48 clusters with two levels of switches and M2/4=576 servers each. The number of VMs was set to 35,000, with individual image size of 5 GB; we assume that each VM runs in one single core. An integer number of clusters is always switched on, to support the load assigned to the DC; those servers without assigned load remain active and ready to accommodate spikes in demand. Green cover was set to ensure, at the highest green energy generation time, a proportion of energy βd when all VMs run in DC d.
We consider a different type of switch, and thus a different power consumption value, for each layer of the intra-DC architecture. We selected the Huawei CloudEngine switches series. Table II details switching capacity and power consumption of the switches.
We consider that each DC is connected to the flexgrid inter-DC network through a router equipped with 100Gb/s bandwidth variable transponders. Therefore, the actual capacity of optical connections is limited to that value. To compute the real throughput, we consider headers for the different protocols, i.e. TCP, IP, and GbE. The capacity requested for optical connections was computed to guarantee that VM migration is performed in less than 40 minutes. Note that transponders capacity together with maximum scheduled transfer time limit the amount of VMs that can be moved between two DCs to 4620.
Finally, a dynamic network environment was simulated for the scenario under study, where background incoming connection requests arrive following a Poisson process and are sequentially served without prior knowledge of future incoming connection requests. Background traffic competes with the one generated by the federated DCs for network resources. The bitrate demanded by each background connection request was set to 100 Gb/s. The holding time of connections is exponentially distributed with the mean value
TABLE II CHARACTERISTICS OF HUAWEI CLOUDENGINE SWITCHES. Layer Model Sw. capacity P(W) Core 12812 48 Tb/s 16200
Aggregation 6800 1.28 Tb/s 270 Edge 5800 336 Gb/s 150
equal to 2 hours. Source/destination pairs are randomly chosen with equal probability among all nodes. Different values of offered network load were considered by changing the arrival rate while keeping the mean holding time constant.
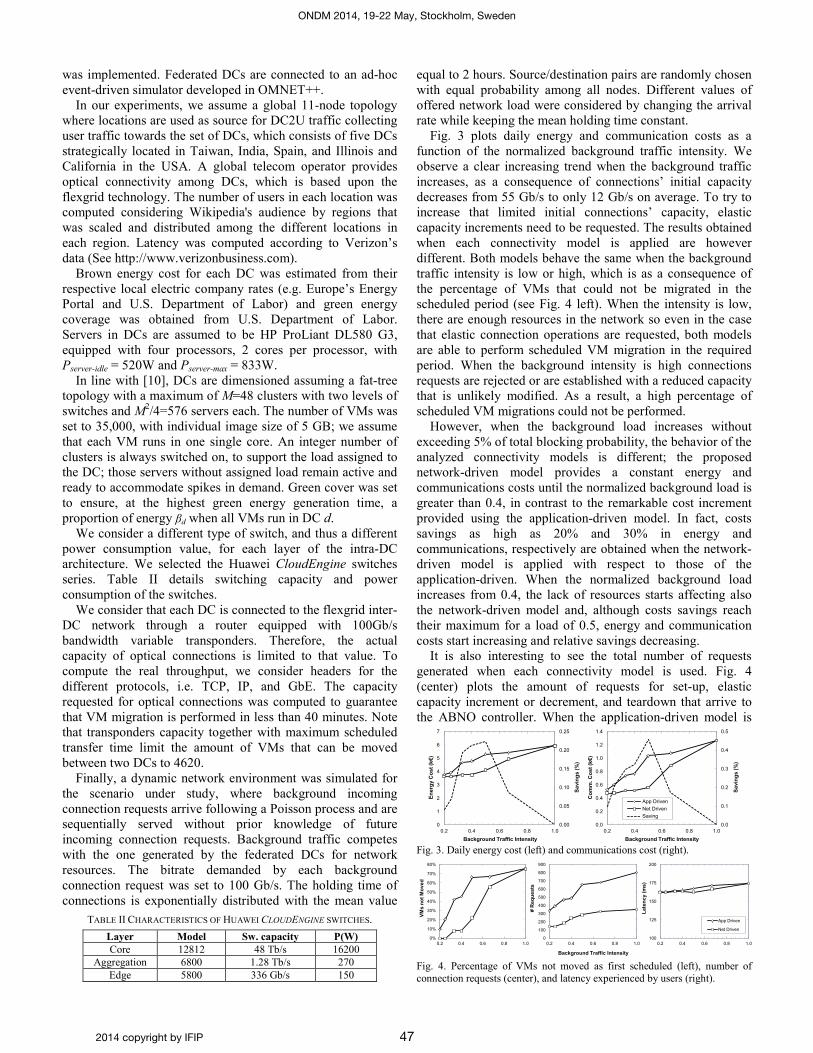
Fig. 3 plots daily energy and communication costs as a function of the normalized background traffic intensity. We observe a clear increasing trend when the background traffic increases, as a consequence of connections’ initial capacity decreases from 55 Gb/s to only 12 Gb/s on average. To try to increase that limited initial connections’ capacity, elastic capacity increments need to be requested. The results obtained when each connectivity model is applied are however different. Both models behave the same when the background traffic intensity is low or high, which is as a consequence of the percentage of VMs that could not be migrated in the scheduled period (see Fig. 4 left). When the intensity is low, there are enough resources in the network so even in the case that elastic connection operations are requested, both models are able to perform scheduled VM migration in the required period. When the background intensity is high connections requests are rejected or are established with a reduced capacity that is unlikely modified. As a result, a high percentage of scheduled VM migrations could not be performed.
However, when the background load increases without exceeding 5% of total blocking probability, the behavior of the analyzed connectivity models is different; the proposed network-driven model provides a constant energy and communications costs until the normalized background load is greater than 0.4, in contrast to the remarkable cost increment provided using the application-driven model. In fact, costs savings as high as 20% and 30% in energy and communications, respectively are obtained when the network-driven model is applied with respect to those of the application-driven. When the normalized background load increases from 0.4, the lack of resources starts affecting also the network-driven model and, although costs savings reach their maximum for a load of 0.5, energy and communication costs start increasing and relative savings decreasing.
It is also interesting to see the total number of requests generated when each connectivity model is used. Fig. 4 (center) plots the amount of requests for set-up, elastic capacity increment or decrement, and teardown that arrive to the ABNO controller. When the application-driven model is
Fig. 3. Daily energy cost (left) and communications cost (right).
Fig. 4. Percentage of VMs not moved as first scheduled (left), number of connection requests (center), and latency experienced by users (right).
Background Traffic Intensity
Ener
gy C
ost (
k€)
Savi
ngs
(%)
Com
m. C
ost (
k€)
0.00
0.05
0.10
0.15
0.20
0.25
0
1
2
3
4
5
6
7
0.2 0.4 0.6 0.8 1.00.0
0.1
0.2
0.3
0.4
0.5
0.0
0.2
0.4
0.6
0.8
1.0
1.2
1.4
0.2 0.4 0.6 0.8 1.0
App DrivenNet DrivenSaving
Savi
ngs
(%)
Background Traffic Intensity
VMs
not M
oved
# R
eque
sts
0%
10%
20%
30%
40%
50%
60%
70%
80%
0.2 0.4 0.6 0.8 1.00
100
200
300
400
500
600
700
800
900
0.2 0.4 0.6 0.8 1.0
Background Traffic Intensity
100
125
150
175
200
0.2 0.4 0.6 0.8 1.0
App Driven
Net Driven
Late
ncy
( ms)
2014 copyright by IFIP
ONDM 2014, 19-22 May, Stockholm, Sweden
47
0
50
100
150
200
250
300
350
400
0 2 4 6 8 10 12 14 16 18 20 22 24
0
10
20
30
40
50
60
70
80
0 2 4 6 8 10 12 14 16 18 20 22 240
10
20
30
40
50
60
70
80
0 2 4 6 8 10 12 14 16 18 20 22 24
App DrivenNet Driven
0
50
100
150
200
250
300
350
400
0 2 4 6 8 10 12 14 16 18 20 22 240
50
100
150
200
250
300
350
400
0 2 4 6 8 10 12 14 16 18 20 22 24
0
10
20
30
40
50
60
70
80
0 2 4 6 8 10 12 14 16 18 20 22 24
Ener
gy C
ost (
€)C
omm
. Cos
t (€)
Time (Hour)
Background TrafficIntensity = 0.33
Background TrafficIntensity = 0.4
Background TrafficIntensity = 0.67
Fig. 5. Hourly costs for several background traffic intensities
used, the number of requests is really high compared to that number under the network-driven model. However, since the requests are generated by the DC resource managers without any knowledge of the state of the resources, the majority of those requests are blocked as a result of lack of resources. Such high utilization of the network resources is the target for the network operator. In contrast, in the network-driven model, elastic capacity increment or decrement requests are generated by the carrier SDN, which knows that some resources in the route of established connections have been released and elastic capacity operation could be successfully applied. In this case, the amount of requests is much lower but many of them are successfully completed (although some few can be also blocked). Regarding latency, both models are able to provide similar performance, as shown in Fig. 4 (right). This fact, however, is as a result of the scheduler algorithm that focuses at guaranteeing the committed QoE.
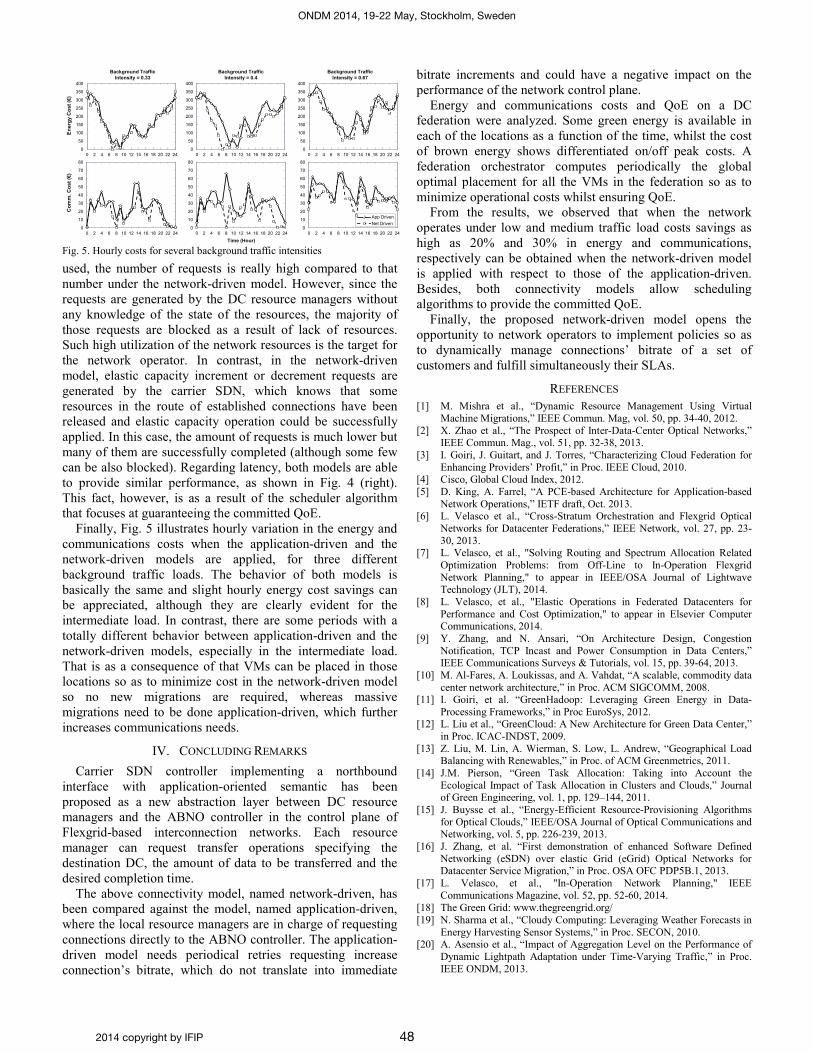
Finally, Fig. 5 illustrates hourly variation in the energy and communications costs when the application-driven and the network-driven models are applied, for three different background traffic loads. The behavior of both models is basically the same and slight hourly energy cost savings can be appreciated, although they are clearly evident for the intermediate load. In contrast, there are some periods with a totally different behavior between application-driven and the network-driven models, especially in the intermediate load. That is as a consequence of that VMs can be placed in those locations so as to minimize cost in the network-driven model so no new migrations are required, whereas massive migrations need to be done application-driven, which further increases communications needs.
IV. CONCLUDING REMARKS Carrier SDN controller implementing a northbound
interface with application-oriented semantic has been proposed as a new abstraction layer between DC resource managers and the ABNO controller in the control plane of Flexgrid-based interconnection networks. Each resource manager can request transfer operations specifying the destination DC, the amount of data to be transferred and the desired completion time.
The above connectivity model, named network-driven, has been compared against the model, named application-driven, where the local resource managers are in charge of requesting connections directly to the ABNO controller. The application-driven model needs periodical retries requesting increase connection’s bitrate, which do not translate into immediate
bitrate increments and could have a negative impact on the performance of the network control plane.
Energy and communications costs and QoE on a DC federation were analyzed. Some green energy is available in each of the locations as a function of the time, whilst the cost of brown energy shows differentiated on/off peak costs. A federation orchestrator computes periodically the global optimal placement for all the VMs in the federation so as to minimize operational costs whilst ensuring QoE.
From the results, we observed that when the network operates under low and medium traffic load costs savings as high as 20% and 30% in energy and communications, respectively can be obtained when the network-driven model is applied with respect to those of the application-driven. Besides, both connectivity models allow scheduling algorithms to provide the committed QoE.
Finally, the proposed network-driven model opens the opportunity to network operators to implement policies so as to dynamically manage connections’ bitrate of a set of customers and fulfill simultaneously their SLAs.
REFERENCES [1] M. Mishra et al., “Dynamic Resource Management Using Virtual
Machine Migrations,” IEEE Commun. Mag, vol. 50, pp. 34-40, 2012. [2] X. Zhao et al., “The Prospect of Inter-Data-Center Optical Networks,”
IEEE Commun. Mag., vol. 51, pp. 32-38, 2013. [3] I. Goiri, J. Guitart, and J. Torres, “Characterizing Cloud Federation for
Enhancing Providers’ Profit,” in Proc. IEEE Cloud, 2010. [4] Cisco, Global Cloud Index, 2012. [5] D. King, A. Farrel, “A PCE-based Architecture for Application-based
Network Operations,” IETF draft, Oct. 2013. [6] L. Velasco et al., “Cross-Stratum Orchestration and Flexgrid Optical
Networks for Datacenter Federations,” IEEE Network, vol. 27, pp. 23-30, 2013.
[7] L. Velasco, et al., "Solving Routing and Spectrum Allocation Related Optimization Problems: from Off-Line to In-Operation Flexgrid Network Planning," to appear in IEEE/OSA Journal of Lightwave Technology (JLT), 2014.
[8] L. Velasco, et al., "Elastic Operations in Federated Datacenters for Performance and Cost Optimization," to appear in Elsevier Computer Communications, 2014.
[9] Y. Zhang, and N. Ansari, “On Architecture Design, Congestion Notification, TCP Incast and Power Consumption in Data Centers,” IEEE Communications Surveys & Tutorials, vol. 15, pp. 39-64, 2013.
[10] M. Al-Fares, A. Loukissas, and A. Vahdat, “A scalable, commodity data center network architecture,” in Proc. ACM SIGCOMM, 2008.
[11] I. Goiri, et al. “GreenHadoop: Leveraging Green Energy in Data-Processing Frameworks,” in Proc EuroSys, 2012.
[12] L. Liu et al., “GreenCloud: A New Architecture for Green Data Center,” in Proc. ICAC-INDST, 2009.
[13] Z. Liu, M. Lin, A. Wierman, S. Low, L. Andrew, “Geographical Load Balancing with Renewables,” in Proc. of ACM Greenmetrics, 2011.
[14] J.M. Pierson, “Green Task Allocation: Taking into Account the Ecological Impact of Task Allocation in Clusters and Clouds,” Journal of Green Engineering, vol. 1, pp. 129–144, 2011.
[15] J. Buysse et al., “Energy-Efficient Resource-Provisioning Algorithms for Optical Clouds,” IEEE/OSA Journal of Optical Communications and Networking, vol. 5, pp. 226-239, 2013.
[16] J. Zhang, et al. “First demonstration of enhanced Software Defined Networking (eSDN) over elastic Grid (eGrid) Optical Networks for Datacenter Service Migration,” in Proc. OSA OFC PDP5B.1, 2013.
[17] L. Velasco, et al., "In-Operation Network Planning," IEEE Communications Magazine, vol. 52, pp. 52-60, 2014.
[18] The Green Grid: www.thegreengrid.org/ [19] N. Sharma et al., “Cloudy Computing: Leveraging Weather Forecasts in
Energy Harvesting Sensor Systems,” in Proc. SECON, 2010. [20] A. Asensio et al., “Impact of Aggregation Level on the Performance of
Dynamic Lightpath Adaptation under Time-Varying Traffic,” in Proc. IEEE ONDM, 2013.
2014 copyright by IFIP
ONDM 2014, 19-22 May, Stockholm, Sweden
48