Embed Size (px)
Citation preview
Appendix D
Carrier Profiles and Economic Impact

1
CONTENTS
D.1 Carrier Profiles .................................................................................................................................. 2
D.1.1 Barge Carriers ............................................................................................................................................... 2
Select Barge Carriers ............................................................................................................................................ 2
D.1.2 Lake and Ocean Carriers............................................................................................................................... 6
Types of Great Lakes Vessels Using Illinois Ports ................................................................................................. 7
Select Domestic (US-Flag) Carriers ....................................................................................................................... 7
Select Canadian Carriers ...................................................................................................................................... 9
D.1.3 Select Foreign-Flag Carriers ........................................................................................................................ 10
D.1.4 Select Shipping Agents ............................................................................................................................... 11
D.1.5 Facility Operators ....................................................................................................................................... 12
Select Operators ................................................................................................................................................ 12
D.1.6 Rail and Truck Carriers ............................................................................................................................... 15
Select Rail Carriers ............................................................................................................................................. 16
Select Truck Carriers .......................................................................................................................................... 18
D.2 Economic Impact ............................................................................................................................. 19
D.2.1 Marine Freight and Illinois ......................................................................................................................... 19
D.2.2 State Associated Marine Freight ................................................................................................................ 20
D.2.3 Goods Movement and the Economy ......................................................................................................... 26
D.2.4 Methodology .............................................................................................................................................. 28
Marine Industry ................................................................................................................................................. 28
Marine-Supportive and Related Impacts ........................................................................................................... 29
Marine Users ...................................................................................................................................................... 30
Modal Terminology and Understanding the Results ......................................................................................... 30
State Level Impacts ............................................................................................................................................ 32
Port District Impacts .......................................................................................................................................... 35

2
D.1 CARRIER PROFILES
D.1.1 BARGE CARRIERS
Illinois’ river system is served by a wide range of barge carriers. These operators have different specializations and roles within the system. This section provides a brief overview of the major barge carriers in Illinois, their services, facilities, routes, commodities, and other characteristics. These firms are members of the Illinois River Carriers Association (IRCA) whose full barge carrier membership is listed in TableD-1. Note that all barge carriers in Illinois may not be members of the IRCA, so the list and profiles below should not be considered an exhaustive list of all barge carriers in the state.
TableD-1: Carrier Members* of the Illinois River Carriers Association
IRSCA Carriers
American Commercial Barge Line Kindra Lake Towing
American River Transportation Company Kirby Inland Marine
Blessey Marine Services LeBeouf Bros. Towing
Calumet River Fleeting Logsdon Tug Service
Canal Barge Company Magnolia Marine Transport
Ceres Barge Marquette Transportation Company
East Side River Transportation Middle River Marine
Florida Marine Transportation Osage Marine Services
Genesis Marine SCF Marine
Illinois Marine Towing Southern Towing
Ingram Barge Company
*Note: This list does not include IRCA members who are not carriers, such as terminal operators.
SELECT BARGE CARRIERS
American Commercial Barge Line
American Commercial Barge Line (ACBL) is based in Jeffersonville, Indiana, and provides barge transportation solutions through 7,200 miles of inland waterways in the Great Lakes and Southern Gulf region. They have a wide range of carrying capabilities for both dry and liquid bulk, and primary commodities carried by ACBL include chemicals, coal, ethanol, petroleum, grain, salt, and steel.
One of ACBL’s major terminals is in Lemont, Illinois. Lemont is an optimal location for transferring cargo and freight from barge-to-truck because the facility enables shippers with smaller volume shipments to save capital by not having to transport by rail. ACBL’s Lemont Terminal serves the greater Chicago area with access to Calumet and Chicago harbors. ACBL has an additional, smaller, facility in Cairo, Illinois.

3
American River Transportation Company
American River Transportation Company (ARTCO) is a wholly owned subsidiary of Archer Daniels Midland (ADM) and is part of ADM’s larger third-party logistics service. Their operations include line-haul, dry bulk hauling, liquid bulk hauling, harbor, and fleeting services. Their operational area includes the Mississippi, Illinois, and Ohio rivers.
Blessey Marine Services
Blessey Marine Services is headquartered in Louisiana and specializes in liquid bulk transportation for petroleum and petrochemical companies. The company owns and operates towboats as well as tank barges, and their primary commodities include residual fuel, asphalt, lubricating oil, petroleum feedstock, refined petroleum, petrochemicals, and alcohols. Service areas include the Mississippi, Illinois, and Ohio River systems, as well as the Gulf Intracoastal Waterway and Tennessee Tombigbee Waterway.
Calumet River Fleeting
Calumet River fleeting is based in Chicago and operates on the Calumet River as well as the Great Lakes. Their geographic focus is Lake Michigan, and the company serves southwestern Lake Michigan, from Milwaukee to Burns Harbor, Indiana. The firm has six tugs and two barges, and services include ship assistance and towing, bulk and project cargo transportation, switching, fleeting, icebreaking, and crane moves.
Canal Barge Company
Canal Barge Company is headquartered in New Orleans and provides transportation as well as terminal services. Their service area covers the Lower Mississippi, Illinois, and Ohio Rivers as well as the Intracoastal Waterway. Additionally, the company has oceangoing barges capable of movement to the Caribbean and South America. As a large firm, Canal Barge handles liquid cargo, dry cargo, break-bulk, and project cargo. The company also provides towing services for other firms.
In addition to a wide range of carriage services, Canal Barge operates Canal Terminal, a liquid cargo transfer point south of Joliet. Canal Barge also owns Illinois Marine Towing, which is described further below.
Ceres Barge
Ceres Barge operates hopper and deck barges and provides logistics services and consulting to bulk and cargo importers and exporters in the Midwest and Gulf Regions. They conduct a majority of their business at their headquarters in East St. Louis, Illinois, but also provide a large portion of vessel and maintenance service through subcontractors all throughout the inland waterways system by way of the Illinois, Mississippi, and Ohio rivers.

4
East Side River Transportation
East Side River Transportation (ESRT) is based in Swansea, Illinois, and specializes in the movement of bulk products such as grain, coal, steel, and ore. The firm owns 225 dry bulk barges and four towboats and provides chartering and management services to
other clients as well.
Florida Marine Transportation
Florida Marine Transportation (FMT) is headquartered in Louisiana and bills itself as the US’s largest independent or privately owned marine transporter. The company handles most types of cargoes, including chemicals, pressurized cargoes like propane, refined products and petroleum feedstocks, crude oil, dry bulk like grain and minerals, and
building materials such as concrete, steel, and asphalt. FMT’s extensive service area includes the Mississippi, Missouri, Illinois, and Ohio River systems, as well as the Gulf and Tennessee-Tombigbee Waterway. The firm also operates a shipyard in Louisiana.
Genesis Marine
Illinois Marine Towing (IMT) is a wholly owned subsidiary of Canal Barge Company in Joliet, Illinois. IMT has operated on and served the IMTS for over 30 years. Specifically, they provide services in South Chicago, Lemont, Joliet, Peoria, and Channahon.
IMT provides two main offerings: waterline carrying and shipyard storage and operations. Their waterline business ships agricultural projects, grain, salt, and steel from Chicago down to Peoria via the Illinois River. IMT’s shipyard services include repair
services, liquid and dry barge cleaning, loading and offloading, and barge readiness (scheduling and logistics for incoming and outgoing barges). Their shipyard offerings are primarily handled at their Lemont and Channahon locations.1
Ingram Barge Company
Ingram is based in Nashville, Tennessee, and operates over the Mississippi and Ohio Rivers and the Tennessee-Tombigbee Waterway. The firm bills itself as the US’s largest dry cargo carrier and has approximately 150 towboats and 5,000 barges. It handles grain, metal, minerals, and coal. Ingram also operates a tank barge fleet for liquid bulk operations. Their Illinois office is located near the Mississippi River, in East Carondelet.
Kindra Lake Towing
Kindra Lake Towing is based in Chicago and focuses on operations on the Great Lakes in northwest Illinois and northern Indiana. The firm owns three lake tugs, three harbor boats, and deck barges. Services provided include the movement of river barges on Lake Michigan between South Chicago and Indiana, fleeting on the Calumet River and Lake Calumet, and general barge towing and transportation on the Great Lakes. The company also supports river-related construction projects in the Chicago area.
1 Illinois Marine Towing. “Shipyard.” https://imtowing.com/our-services/shipyard/

5
Kirby Inland Marine
Kirby Inland Marine operates the United States’ largest fleet of inland tank barges and has about 1000 tank barges and 300 tank vessels with 23.4 million barrels of capacity. The firm is based in Houston and provides service across the Intracoastal Waterway, and Mississippi, Illinois, and Ohio River systems. Specific types of commodities carried
include oil, refined petroleum products, pressurized gasses, and ammonia. The company also provides fleeting and towing services.
LeBeouf Bros. Towing
LeBeouf Bros. is based in Louisiana and operates on all of the US major inland waterways. The company specializes in liquid bulk movements and owns its own shipyard. The company services all major inland waterways in the US.
Magnolia Marine Transport
Magnolia Marine Transport (MMT) specializes in petroleum transportation and operates the largest asphalt transportation fleet in the US – 20 towboats and 75 barges. The company services all major inland waterways. MMT has a facility in Wood River, Illinois, which consists of a drive-on dock barge that provides office space for
operations, maintenance, and engineering personnel. In addition, this Wood River facility provides mooring space.
Marquette Transportation Company
Marquette Transportation Company is one of the country’s largest full-service marine transportation providers with operations divided into three business units: River, Gulf-Inland, and Offshore. The company is based in Paducah, Kentucky, and operates over 800 vessels with the ability to move dry, liquid, and specialty cargo products.2 The bulk of the River unit’s business is focused on the Mississippi and Ohio Rivers. Common origins and destinations in Illinois include Granite City, Joliet, and Chicago.
Middle River Marine
Middle River Marine is a subsidiary of Ozinga’s logistics division and provides harbor and fleeting services as well as cleaning, loading, repair, project cargo handling, and short-haul towing. The company’s service area includes a portion of the Illinois River from Peoria north to Chicago, and Middle River provides services at 8 locations: Henry, Joliet, Lemont, Alsip, Blue Island, South Chicago, Chinatown (Chicago), and Armitage Avenue (Chicago).
Osage Marine Services
Osage Marine Services is based in St. Louis, with offices in Hennepin and Naples, IL. The company has 19 towboats and services the Illinois and Mississippi Rivers. The company
does not carry goods directly; instead, it provides tow building, switching, crew change operations, cleaning, and repair operations in its service area.
2 Marquette Transportation Company. “Professional Affiliations.” https://www.marquettetrans.com/Page/Affiliations.aspx

6
SCF Marine
SCF Marine is located in St. Louis and provides integrated river transportation and logistics services in the US and South America. The company owns barges and towboats as well as inland terminals, transfer facilities, and storage and distribution centers. In
the US, the company focuses on dry cargo transportation and operates on the Mississippi, Illinois, Ohio, Tennessee, and Gulf Intracoastal waterways. The company has a terminal in Illinois, which is discussed in Chapter 3 – facility operators.
Southern Towing
Southern Towing specializes in the movement of fertilizer and owns the largest fleet of anhydrous ammonia barges in the US. The company is based in Memphis, Tennessee, and operates across the Mississippi, Illinois, Ohio, and Intracoastal Waterways. In addition to fertilizer, Southern supports the movement of general dry bulk goods such as coal and grain.
D.1.2 LAKE AND OCEAN CARRIERS
Illinois’ Lake Michigan ports are served by a variety of carriers with different cargo and geographic specialities. US and Canadian vessels conduct trade within the Great Lakes, while foreign-registered vessels carry goods for import and export to overseas markets. Domestic operators focus on movement of dry bulk commodities, while foreign-flag carriers are handling dry bulk as well as break-bulk and project cargo like grain, steel, and machinery.
Illinois’ Great Lakes maritime system is relatively small in geographic scope compared to the inland river system, with activity focused on ports in Chicago and Waukegan. Despite a small Great Lakes shoreline, Illinois and the Chicago area in particular play an important role in Great Lakes trade, especially since Chicago’s waterways provide the only navigable link between the Mississippi River and Great Lakes. By comparison, Waukegan’s commercial navigation role is currently more limited, as the majority of the port’s commercial traffic is incoming gypsum from Michigan.
There are two main groups of users at Illinois’ Great Lake Ports: (1) domestic-registered and Canadian-registered carriers and (2) foreign carriers. These distinctions between users relate to a ship’s registration (or “flag,” as flags indicate the country of registration) and related laws. In the US, the Jones Act prohibits foreign-flag vessels from moving cargo between two points in the US. Canada has a similar regulation prohibiting foreign-flag vessels from moving cargo between two Canadian ports. These regulations mean that US- and Canadian-flag vessels handle trade between ports on the Great Lakes system while foreign-flag vessels handle imports and exports from overseas trading partners like Europe.
7
TYPES OF GREAT LAKES VESSELS USING ILLINOIS PORTS
Different types of vessels are used for Great Lakes shipping depending on the flag of the carrier, service area for the vessel, type and volume of cargo being carried, and loading or unloading capabilities of customers. Ultimately, there are three major types of vessels operating on the Great Lakes: lakers, tug-barge combinations, and “salties.”
Lakers make up the bulk of US and Canadian-flag shipping capacity on the Great Lakes and were often built specifically for operation on the Great Lakes - and for specific customers such as steel or cement manufacturers. The US-flag fleet has some of the largest lakers by size, including the 1000+ foot “thousand footers” which were designed to maximize the amount of cargo carried through the Soo Locks in Michigan. By comparison, Canadian-flag lakers are often smaller, as they are often constructed to fit within the smaller dimensions of the St. Lawrence Seaway locks. Lakers most often handle dry bulk materials, and therefore, most are equipped with self-unloading equipment that allows them to unload materials at unimproved dock areas.
Tug/Barge units are also used by US- and Canadian-flag carriers, particularly for customers that require smaller shipments. Most of these tug/barge units are larger than single inland barges and designed to handle the rougher waters of the open lakes.
Salties are vessels used for trade with overseas ports and are almost exclusively operated by carriers flagged in other countries. The size of these vessels is limited by the dimensions of locks on the St. Lawrence Seaway, and they handle a wide range of goods for international trade.
SELECT DOMESTIC (US-FLAG) CARRIERS
Domestic (or US-flag) carriers are carriers with vessels registered in the US. On the Great Lakes, domestic operators primarily handle dry bulk commodities such as iron ore, coal, limestone, cement, and salt. Together, domestic operators carried about 83.7 million tons of commodities like these in 2018.3 The operations of Great Lakes domestic carriers are usually limited in scope to the Great Lakes, and the largest domestic-flag vessels are too large to navigate the Welland Canal into Lake Ontario. Most of the US-Flag Great Lakes Carriers are members of the Lake Carriers Association whose membership roster is listed in Table D-2.4 Some of the larger or more-common carriers on the Great Lakes are described below. Note that this list is not comprehensive, and there are additional small domestic flag operators sailing the Great Lakes.
3 Lake Carriers Association. “2019 State of the Lakes,” 2019. http://www.lcaships.com/wp-content/uploads/2019/04/LCA-2019-SOTL-Online.pdf 4 Lake Carriers Association. “Meet Our Members,” January 2020. http://www.lcaships.com/members/

8
Table D-2: Lake Carriers Association Members
Name Vessels in Roster
American Steamship Company 12 lakers
Andrie Inc. 2 tug/barge units
Central Marine Logistics 3 lakers
Great Lakes Fleet 8 lakers
1 tug/barge unit
Inland Lakes Management 1 laker
Interlake Steamship Company 9 lakers
1 tug/barge
Lake Michigan Carferry 1 ferry
Pere Marquette Shipping Company 1 tug/barge
Port City Marine Services 3 barges
Van Enkevort Tug & Barge 3 tug/barge units
American Steamship Company
American Steamship Company (ASC) operates the largest U.S. domestic fleet on the Great Lakes. The company was founded in 1907 and is a subsidiary of the GATX Corporation, pending an upcoming sale to Rand Logistics, Inc. ASC’s fleet ranges in size from relatively small 635-foot vessels to six “thousand footers” that are among the
largest vessels on the Great Lakes. In the Chicago area, ASC carries cargoes serving the steel and power industries, carrying inbound western coal, iron ore pellets, and limestone aggregates. The company also loads outbound eastern coal in South Chicago.
Great Lakes Fleet
Similar to ASC, Great Lakes Fleet often services customers related to steel production and carries iron ore from Minnesota to steelmaking ports on other Great Lakes, as well as coal and limestone to a variety of ports. Originally US Steel’s in-house fleet, Great
Lakes Fleet is now effectively owned by Canadian National Railway, but the fleet is managed by Keystone Shipping Company, an arrangement necessitated by restrictions in the Jones Act. Great Lakes Fleet’s vessels include three different “thousand footers” as well as a mix of smaller vessels.
Interlake Steamship Company
Interlake Steamship is the largest privately held US-flag fleet on the Great Lakes and operates in markets similar to ASC and Great Lakes Fleet. Like ASC and Great Lakes, it also has a number of “thousand footers” as well as smaller ships. Notably, Interlake is currently constructing the first new US-flag laker to be built in 35 years.

9
SELECT CANADIAN CARRIERS
Like US Carriers, Canadian-flag carriers on the Great Lakes often specialize in dry bulk commodities such as grain, ore, coal, and limestone. However, there are some differences in US and Canadian Great Lakes fleets:
Canadian fleets service Canadian customers on Lake Ontario which lies downstream of Welland, Canada. Therefore, the average vessel size of Canadian fleets must be smaller in order for vessels to pass through Welland’s locks.
Canadian fleets have a greater capacity for the movement of liquid bulk such as petroleum and asphalt.
Canadian fleets often have newer vessels as Canadian firms can purchase vessels built at lower cost shipyards overseas. By comparison, the Jones Act requires that US-flag fleets only use vessels constructed in the US where construction costs are higher. US carriers have chosen to invest capital in modernization and overhaul work that can keep existing vessels operating longer.
As a result, Canadian carriers have a large fleet of medium- and small-sized vessels. Table D-3 lists some of the major Canadian Great Lakes carriers, but it is not a comprehensive list.
Table D-3: Major Canadian Great Lakes Carriers
Name Vessels in Roster
Algoma Central 27 lakers
7 salties
Canada Steamship Lines 17 lakers
Desgagnes 21 vessels
Lower Lakes Towing 8 lakers
Algoma Central
Algoma is headquartered in St. Catharine’s, Ontario, and owns and operates the largest fleet of lakers on the Great Lakes. Their fleet includes dry bulk and liquid bulk vessels. Currently, Algoma is renewing its dry bulk fleet with a new class of vessels (Equinox Class) designed to further improve energy efficiency and reduce emissions.
Canada Steamship Lines
Canada Steamship Lines (CSL) is based in Montreal and operates a fleet of dry-bulk vessels. Similar to Algoma, CSL is currently modernizing parts of its fleet with the construction of a new class of vessels (the Trillium class).
Desgagnes
Desgagnes is based in Quebec City. They have 12 liquid bulk tankers, nine dry bulk carriers, and two passenger vessels.

10
Lower Lakes Towing
Lower Lakes Towing is a subsidiary of Rand Logistics, which recently purchased the US-flag American Steamship Company. The company operates six self-unloading bulk lakers and three lakers without unloading gear.
D.1.3 SELECT FOREIGN-FLAG CARRIERS
For the purposes of Great Lakes discussions, foreign flag carriers are synonymous with carriers registered in nations other than the US and Canada. Considering that both the US and Canada prohibit foreign-flag carriers from carrying cargo between domestic ports, and since US and Canadian lakers are often purpose-built for Great Lakes operations, foreign flag vessels handle the majority of Great Lakes’ ports trade with overseas ports. In particular, Europe is a key trading partner for Great Lakes ports due to the direct sailing routes from the St. Lawrence River over to Europe. Trade with other regions including South America, Africa, and Asia does occur, but not as frequently. The Great Lakes’ trade with foreign ports is often described as “steel in, grain out” as Salties delivering specialty loads of steel often carry grain outbound for export. Other major imports include higher-value machinery, such as mining equipment, construction equipment, generators, boilers, refinery parts, and wind turbines.
Given the wide variety of goods moving in and out of the Great Lakes in foreign trade, Salties must be able to carry a wide variety of cargos. Subsequently, the size of St. Lawrence Seaway locks limits the size of salties entering the Great Lakes, and vessels entering the Seaway must be equipped with select elements of mooring equipment for passage through Seaway locks. Given the size restraints and gear requirements associated with passage, not all foreign-flag vessels can enter the system, and some carriers have specialized in serving the Great Lakes. A list of common foreign-flag operators is provided in Table D-4, which is not intended to be comprehensive, but instead to provide an overview of the most common foreign-flag operators on the Lakes.
Table D-4: Common Foreign-Flag Operators on the Great Lakes
Name National Registration
Fednav Canadian firm with vessels registered elsewhere
Spliethoff Based in the Netherlands
Wagenborg Based in the Netherlands
BBC Chartering Based in Germany
Canfornav Canadian firm chartering foreign flag vessels.
Fednav
Fednav is headquartered in Montreal and bills itself as Canada’s largest bulk shipping company and the top international carrier in the Great Lakes. While the company is headquartered in Canada, its focus is international shipping, and it operates vessels registered under foreign flags. The majority of the company’s vessels are used to import manufacturing equipment, steel, and other break-bulk cargo into the Great Lakes, and then used to export grain. In particular, Fednav offers 50-60 sailings annually for its continuous cargo liner service between Great Lakes ports and Western Europe. In addition to cargo carriage, Fednav has interests and operations in stevedoring (Federal Marine Terminals).

11
Spliethoff
Based in the Netherlands, Spliethoff provides regular service to the Great Lakes. The company offers dry bulk services as well as the ability to carry break-bulk and custom cargo. Most notably, Spliethoff supports the Great Lakes’ only regularly scheduled container service, the Cleveland-Europe Express.
Wagenborg
Also headquartered in the Netherlands, Wagenborg provides dry-bulk, break-bulk, and project cargo services linking the Lakes with Western Europe. Prior to the mid-1990s, the company operated primarily in the North and Baltic Seas and did not begin transatlantic sailings until 1995 when they leveraged their coastal trade experience to build connections in the Great Lakes.
BBC Chartering
BBC Chartering is based in Germany and specializes in the movement of oversized and break-bulk cargo such as wind turbine components and building components.
Canadian Forest Navigation Group
Canadian Forest Navigation Group (Canfornav) is another Canadian firm based in Montreal that utilizes foreign-flagged ships and like Fednav is one of the most-regular foreign-flag carriers for the Great Lakes. Like other foreign-flag carriers, their vessels can handle dry bulk as well as break-bulk and project cargoes.
D.1.4 SELECT SHIPPING AGENTS
Shipping agents can be thought of as maritime concierges; they provide logistical and administrative support to carriers visiting a port, handling tasks like booking of pilots, filing of Customs and Border Patrol paperwork, interfacing with port authorities in advance of a port call, and arranging for resupply of vessels. Two agents serving Great Lakes carriers at the Port of Chicago were consulted as seen in Table D-5.
Table D-5: Select Shipping Agents
Name
Central Marine Logistics/Inter Ship
World Shipping, Inc.
Central Marine Logistics/Inter Ship
Central Marine Logistics (CML) is located in Griffith, Indiana, and operates commercial vessels for and provides fleet management and marine engineering to the Great Lakes maritime industry. In addition, CML owns a maritime agency called Inter Ship, which provides on-scene support for Canadian and foreign-flagged commercial vessels.
In Illinois, CML operates two vessels and a fuel barge that mostly serves the Port of Chicago and Southwest side of Calumet Harbor. Their customers at the Port of Chicago and the surrounding area include North American Stevedoring, Morton Salt, Compass Minerals, and the Chicago Export Terminal.
On average, CML moves 750,000 tons of salt, 500,000 tons of stone, and 250,000 tons of steel through the Port of Chicago and the IMTS per year.

12
World Shipping, Inc.
World Shipping, Inc. is based in Cleveland and serves all of the Great Lakes region. In addition to agency services for cargo vessels, the company is an agent for Pearl Seas Cruises, which operates the Pearl Mist, one of the luxury cruise ships that serve the Great Lakes.
D.1.5 FACILITY OPERATORS
Facility operators help move cargo between land and water and can provide additional services such as fleeting of barges, maintenance, and shipbuilding, to name a few. The list of facility operators provided in this section each offers a wide variety of services to manufacturers, shippers, and other users of the IMTS. Below is a selection of offerings facility operators may provide:
Port and Infrastructure. Especially on the inland waterway system, operators provide inbound and outbound opportunities for barge, rail, and trucking carriers
Logistics Services. Many operators offer customers on-time shipping coordination, advanced loading and unloading capabilities, dock crews, and a full suite of logistics offerings
Storage and Warehousing. Often, operators will provide outdoor (ground) and indoor storage for their own commodities or products of other companies who utilize the terminal
The operators profiled there are shown in Table D-6, they were profiled because consultations were conducted with their staff and/or they have extensive coverage across Illinois’ waterways.
Table D-6: Facility Operators
Name
American Electric Power
Consolidated Terminals and Logistics Company
Lehigh Hanson
Peoria Barge Terminal
QSL Stevedoring
SCF Marine
SELECT OPERATORS
American Electric Power
American Electric Power (AEP) is one of America’s largest generators of electricity – owning or operating about 26,000 megawatts of electric capacity in the US. 5 In 2016, they sold their commercial barge
5 American Electric Power. “Supplying Energy Nationwide,” January 2020. https://www.aep.com/about/businesses/generation
13
transportation subsidiary, AEP Rivers Operations, to American Commercial Lines for $550 million. 6 However, they did retain ownership of their captive barge fleet. The captive barge fleet delivers 19 million tons of coal annually to their coal-fuel power plants in Indiana and Kentucky which are owned by Appalachian Power, Kentucky Power, and Indiana Michigan Power. The fleet has 12 towboats, 498 barges, and 229 employees. As a result, AEP’s captive barge business is still a user of the IMTS.
In terms of AEP’s direct footprint in Illinois, their Cook Coal Terminal in Metropolis, Illinois, is a key supplier for AEP’s plants along the Ohio River. Ultimately, AEP’s captive barge business is their only current direct business operation that relies on the IMTS. Declining coal consumption means that this terminal is likely to ship less coal in the future; AEP’s use of coal as a generation source has declined from 70% to 48% and is expected to drop to 33% by 2030.7 This decline may lead to the closure or the re-purposing of the Cook terminal.
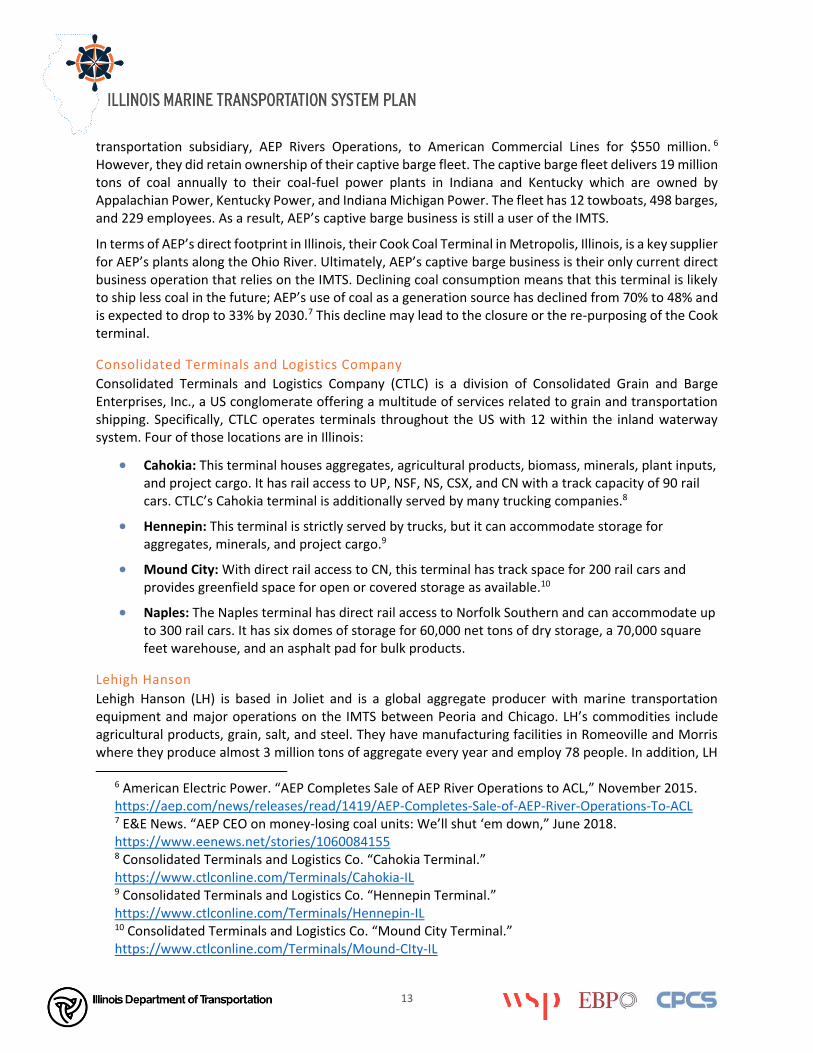
Consolidated Terminals and Logistics Company
Consolidated Terminals and Logistics Company (CTLC) is a division of Consolidated Grain and Barge Enterprises, Inc., a US conglomerate offering a multitude of services related to grain and transportation shipping. Specifically, CTLC operates terminals throughout the US with 12 within the inland waterway system. Four of those locations are in Illinois:
Cahokia: This terminal houses aggregates, agricultural products, biomass, minerals, plant inputs, and project cargo. It has rail access to UP, NSF, NS, CSX, and CN with a track capacity of 90 rail cars. CTLC’s Cahokia terminal is additionally served by many trucking companies.8
Hennepin: This terminal is strictly served by trucks, but it can accommodate storage for aggregates, minerals, and project cargo.9
Mound City: With direct rail access to CN, this terminal has track space for 200 rail cars and provides greenfield space for open or covered storage as available.10
Naples: The Naples terminal has direct rail access to Norfolk Southern and can accommodate up to 300 rail cars. It has six domes of storage for 60,000 net tons of dry storage, a 70,000 square feet warehouse, and an asphalt pad for bulk products.
Lehigh Hanson
Lehigh Hanson (LH) is based in Joliet and is a global aggregate producer with marine transportation equipment and major operations on the IMTS between Peoria and Chicago. LH’s commodities include agricultural products, grain, salt, and steel. They have manufacturing facilities in Romeoville and Morris where they produce almost 3 million tons of aggregate every year and employ 78 people. In addition, LH
6 American Electric Power. “AEP Completes Sale of AEP River Operations to ACL,” November 2015. https://aep.com/news/releases/read/1419/AEP-Completes-Sale-of-AEP-River-Operations-To-ACL 7 E&E News. “AEP CEO on money-losing coal units: We’ll shut ‘em down,” June 2018. https://www.eenews.net/stories/1060084155 8 Consolidated Terminals and Logistics Co. “Cahokia Terminal.” https://www.ctlconline.com/Terminals/Cahokia-IL 9 Consolidated Terminals and Logistics Co. “Hennepin Terminal.” https://www.ctlconline.com/Terminals/Hennepin-IL 10 Consolidated Terminals and Logistics Co. “Mound City Terminal.” https://www.ctlconline.com/Terminals/Mound-CIty-IL

14
has marine transportation facilities at harbors on the IMTS and host a few tenants on these properties: Morton Salt, Cargill Salt, and Reliable Asphalt. Beyond pure transportation operations, their facilities provide bulk outdoor storage for LH products and their tenants’ goods.
LH’s manufactured products – approximately 2.5 million tons per year – are transported via truck and the CN railway to their marine hubs. LH loads and unloads about 30 barges per week in and out of their Romeoville facility. As a global manufacturer with its own marine transportation equipment, LH has the ability to offer affordable full-service product offerings to customers. Ultimately, LH decided to supply their own equipment for two main reasons: 1) to keep costs at a reasonable level and 2) because the reliability of the maritime system is strong. As a result, it is a top priority of theirs to maintain reliability, or their customers will find other manufacturers or ways to receive products.
Peoria Barge Terminal
Since 1957, PBT has conducted freight transfer and storage business along the Illinois River at their docks in Peoria, Illinois. They provide operations for numerous commodities, including steel, bulk, wood pellets, granite, mulch, bark, salt, fuel, and oil. PBT’s terminal and surrounding property cover about 100 acres with 40 acres of outdoor storage, 200,000 square feet of indoor storage, and numerous tanks for bulk liquid storage.11 They own a 1,200-foot unloading dock which allows them to handle up to four barges at one time. Additionally, there is an on-site rail spur that can accommodate 24 standard-sized rail cars.
PBT’s terminal is connected to rail lines operated by UP, Toledo, Peoria & Western Railway, and Peoria & Pekin Union Railway. Additionally, their facility is adjacent to a major US highway with easy access to two interstates for trucking. In regard to trucking, as mentioned above, PBT has an affiliation with NEFCO’s trucking business which is readily accessible for PBT’s customers and their shipping needs.
PBT’s major asset is its location along the Illinois River. Their portion of the river rarely freezes resulting in an ability to load and unload barges year-round. Another strength of PBT is their existing infrastructure for customers to have access to shipping by barge, rail, and trucking all at one facility.
QSL Stevedoring
QSL is based in Quebec City, and its subsidiary North America Stevedoring Company (NASCO) operates the Iroquois Landing and Lake Calumet public terminals at the Illinois International Port District. These terminals handle goods from both lakers and barges, and common commodities include steel, forest products, dry bulk cargoes, general cargo, and project cargo.
SCF Marine
Headquartered in St. Louis, Missouri, SCF Marine – a subsidiary of Seacor – is a full-service maritime operations company that provides bulk transportation, port & infrastructure, logistics, and managed services throughout the Midwest and Southern Gulf Regions. SCF’s core business model is to partner with small and large carriers in addition to large terminals along their routes to complement their in-house owned harbors and docks. Their partners primarily transport steel, metal, wood, petroleum, and fuel.
SCF has a mid-size terminal in Granite City, Illinois, which is their main access to the IMTS, they also have locations in Madison, East St. Louis, and a partner arrangement in Fairmont City. They partner with numerous facilities in Joliet, Calumet, and Chicago to remain competitive in Illinois.
11 Peoria Barge Terminal. “About Us.” http://peoriabarge.com/about-us/

15
As a provider of fleet, logistics, and shipyard operations, SCF’s major competitive advantage is their flexibility and “one size fits all” business model. Their combination of terminal facilities, warehousing, and advanced loading and unloading capabilities provides them with a significant capacity to deliver for their customers. Additionally, SCF’s main geographic focus is the inland waterway system. This has allowed them to craft a niche market while also having the ability to grow.
D.1.6 RAIL AND TRUCK CARRIERS
Rail and trucking are critical elements of the maritime transportation system because they provide firms without water access the opportunity to ship and receive goods by water. This section provides brief overviews of some of the rail and trucking carriers operating in Illinois. The carriers profiled here are listed because they interface with the maritime system or have routes that provide parallel routes to the Illinois or Mississippi Rivers. Depending on the geographic location and economic conditions, rail and truck operators can be competitors of barge carriers, vying for bulk traffic on similar trade lanes. In other areas, the land transport and river relationship can be complementary, with a combination of barge, rail, and convenient truck access service attracting new customers. Additional information on Illinois’ rail network and its operators can be found in the 2017 Illinois State Rail Plan Update.12 Table D-7 shows the rail and truck carriers profiled.
Table D-7: Rail and Truck Carriers
Name Type of Carrier
Burlington Northern Santa Fe Railway Rail Carrier
Canadian National Railway Rail Carrier
Canadian Pacific Railway Rail Carrier
CSX Transportation Rail Carrier
Norfolk Southern Railway Rail Carrier
Union Pacific Railroad Rail Carrier
Port Harbor Railroad Rail Carrier
Terminal Railroad Association of St. Louis Rail Carrier
N.E. Finch Co. Truck Carrier
Stock Transport, Inc. Truck Carrier
12 Illinois Department of Transportation. “2017 Illinois State Rail Plan Updated,” 2017. http://www.idot.illinois.gov/Assets/uploads/files/Transportation-System/Fact-Sheets/Rail%20Plan%20Report_12_28_2017_FULL_Final_FRA.pdf

16
SELECT RAIL CARRIERS
Burlington Northern Santa Fe Railway
The Burlington Northern Santa Fe Railway (BNSF) operates 1,542 miles of rail lines in Illinois – the company’s 8th largest served State.13 This mileage makes it the
second-largest Class I railroad in Illinois – carrying grain, agricultural projects, auto parts, metals, industrial goods, petroleum, and housing materials.
BNSF manages four intermodal facilities in Illinois: Cicero, Corwith, Logistics Park, and Willow Springs, and runs seven different rail yards across the State. As of 2018, the company employs over 4,100 people in Illinois and has dedicated billions of dollars in capital projects – over $150 million in 2018 and $135 million in 2019 alone.14 15
Canadian National Railway
Illinois is home to Canadian National Railway’s (CN) US Headquarters – Homewood, Illinois – and is the company’s largest state in terms of operations and employees. As of 2019, CN operates 1,254 miles of track throughout Illinois and employs 1,705 people in
the State.16 They carry automobiles, auto parts, metals, agricultural products, and chemicals.
CN has invested $1.1 billion in Illinois which includes $221 million in capital investments. In 2019, they planned to invest $190 million in Illinois to expand and strengthen the rail network with the goal of ensuring long-term growth and stability in the State.
CN’s US railway routes converge in Chicago including lines formerly owned by the Illinois Central. These Illinois Central lines are particularly important in relation to the inland river system because the lines connect Chicago with New Orleans – providing a rail trade lane that parallels the river route of the Mississippi. The company has Illinois facilities at Markham Yard and Woodcrest, Centralia, Chicago, Joliet, Decatur, Carbondale, Springfield, Rockford, and suburban areas of St. Louis. In addition to freight service, CN’s lines host Amtrak and Metra passenger trains in suburban Chicago.
Canadian Pacific Railway
Headquartered in Calgary, Canada, Canadian Pacific Railway (CP) operates all throughout the State of Illinois. CP has a major intermodal terminal (Bensenville) in Franklin Park and a container yard in Schiller Park. Additionally, CP operates or utilizes
10 transload facilities and two grain facilities in Alsip, Bensenville, Bridgeview, Chicago, Elk Grove Village, Leaf River, Riverdale, and Rockford. In Illinois, they move automobiles, coal, fertilizer, food products, grain, industrial products, petroleum, and steel.
13 BNSF Railway Company. “Class I Railroad Annual Report,” December 31, 2018. https://www.bnsf.com/about-bnsf/financial-information/pdf/18R1.pdf 14 BNSF Railway. “BNSF Plans $150 Million Capital Program in Illinois for 2018,” February 2018. https://www.bnsf.com/news-media/news-releases/bnsf-capital-plan-illinois-2018.html 15 BNSF Railway. “BNSF Plans $135 Million Capital Program in Illinois for 2019,” March 2019. http://www.bnsf.com/news-media/news-releases/bnsf-capital-program-illinois-2019.html 16Canadian National Railway. “1919-2019 Partnering with our Neighbors for the Next 100 Years,” 2019. https://www.cn.ca/-/media/Files/Delivering-Responsibly/Community/2019-CNIYC-Report-EN.pdf?la=en

17
CSX Transportation
CSX operates and maintains approximately 1,400 miles of track in Illinois and handles over 2.5 million freight carloads on the state’s rail network.17 In 2015, CSX employed 980 people in Illinois and invested over $32.3 million in the State alone.
In Illinois, CSX has major rail yards in Chicago (Barr) and East St. Louis, and intermodal terminals in Bedford Park and Chicago (59th Street). In terms of commodities, CSX carries consumer products, automobiles, food and agricultural products, coal, feed grain, and petroleum products.
Norfolk Southern Railway
Headquartered in Norfolk, Virginia, Norfolk Southern Railway (NS) operates 1,256 miles and six rail yards in Illinois.18 Every day, NS moves over 100 trains connecting from Chicago and Illinois to various markets throughout the US. They employ 1,450
people in Illinois – many of whom work at their $9.5 million locomotive maintenance and report facility in Chicago, opened in 2017.
Union Pacific Railroad
The Union Pacific Railroad (UP) is based in Omaha and operates 2,310 miles of railroad track in Illinois which is the company’s third-largest state of operations.19 They provide the State with consumer products, coal, automobiles, auto parts, grain, and soybeans.
In 2018, UP invested $168.8 million in infrastructure improvement projects in Illinois and employed nearly 4,000 people Statewide.20
In 2019, UP scaled back three facilities in Illinois in a company-wide effort to streamline and increase the efficiency of their freight operations in Chicago, including the closure of portions of the Proviso Yard, of the Global III intermodal ramp, and of the Canal Street (Chicago) container processing facility. 21 22
17 CSX Transportation. “CSX in Illinois,” 2015. https://www.csx.com/index.cfm/library/files/about-us/state-information/illinois/ 18 Illinois Department of Transportation. “2017 Illinois State Rail Plan Updated,” 2017. http://www.idot.illinois.gov/Assets/uploads/files/Transportation-System/Fact-Sheets/Rail%20Plan%20Report_12_28_2017_FULL_Final_FRA.pdf 19 Union Pacific Railroad. “Class I Railroad Annual Report R-1,” December 31, 2018. https://www.up.com/cs/groups/public/@uprr/@investor/documents/investordocuments/pdf_up_r1_2018.pdf 20 Union Pacific Railroad. “Union Pacific in Illinois,” 2018. https://www.up.com/cs/groups/public/@uprr/@corprel/documents/up_pdf_nativedocs/pdf_illinois_usguide.pdf 21 Chicago Tribune. “Union Pacific Laying Off Workers in Illinois as it Streamlines Operations,” July 2019. https://www.chicagotribune.com/business/ct-biz-union-pacific-closing-facilities-and-laying-off-workers-20190710-qym5h42zmjgjrb3ujgdl4hlg6y-story.html 22 City of Rochelle, Illinois. “Rochelle Completes Projects to Attract Future Development,” September 2019. https://www.cityofrochelle.net/news/city-news/rochelle-completes-projects-to-attract-future-development.html

18
Port Harbor Railroad
A Class III short line railroad based in Granite City, the Port Harbor Railroad connects to the rest of Illinois by way of the Terminal Railroad Association (TRRA) in St. Louis, Missouri. Most of Port Harbor’s rail traffic is interchanged with TRRA. They primarily carry steel pipes, ethanol, lumber, fuel, oil, grain, corn, wheat, and soybean. Every week, Port Harbor handles approximately 250 rail carloads, six rail-
to-truck exchanges, and one rail-to-barge exchange. They employ seven full-time and six part-time people.
Port Harbor has deeply rooted business connections with trucking and barge companies as well. In addition to general rail services, they provide empty/loaded car storage, transloading, warehousing, and cross-docking at their facilities. For example, Port Harbor supports rail-to-barge transloading at Madison Harbor at America’s Central Port.
Terminal Railroad Association of St. Louis
The TRRA is a privately held railroad based in St. Louis, Missouri, that primarily provides switching and terminal services. They are a 214-person company and are jointly owned by BNSF, CN, KCS, CSX Transportation, Norfolk Southern Railway, and UP. Their facilities handle 7,000 carloads per week and 30 million tons of cargo per year by way of barge, rail and trucking. TRRA generally carries automobiles, auto parts, steel, metal scrap, grain, corn, and soybean.
In regards to the IMTS, TRRA has five main customers that serve Illinois by barge: US Steel, Cargill, Bulk Services, Bunge, and Oakley. Additionally, ADM Milling, Henkel, INEOS, Affton Chemical, Exxon, and Phillips 66 utilize TRRA for rail services.
SELECT TRUCK CARRIERS
N.E. Finch Co.
N.E. Finch Co. (NEFCO) is based in Peoria and has been serving the State of Illinois and its maritime system for almost 80 years. Their services include trucking, site excavation and development, pile driving, bridge construction, demolition, aggregate sales, and equipment rental. As a trucking provider, NEFCO provides long-haul and just-in-time delivery. NEFCO has a longstanding relationship with Peoria Barge Terminal which is where a large portion of their trucking is utilized. In addition, NEFCO developed a power plant facility – Duck Creek Power Plant – in Canton, Illinois, where many of their trucking orders originate. Ultimately, trucking is a crucial part of their business as whenever they are hired for construction and development, they need to move loads of material during the entire project.
Stock Transport, Inc.
For over 47 years, Stock Transport – located in Lebanon, Illinois – has been serving America’s Central Port in Granite City, Illinois, including 35 years to its barge terminals. They are a truck broker with over 20 full-time flatbed-only owner operators dispatched through Stock Transport Brokerage Company.

19
Stock Transport is the house carrier for five of the nine major steel manufacturers in their area and carries over 30,000 loads per year across 150 total trailers. In addition, they handle 2,600 loads per year from SCF Marine – an operator based in St. Louis that serves the IMTS frequently.
D.2 ECONOMIC IMPACT
The Illinois Marine Transportation System supported over 166,628 jobs that generated almost $17.4 billion in gross state product in 2017. These jobs represent the total range of economic effects: from direct users of the waterways and providers of marine transportation services, to indirectly affected supply chains and businesses which benefit from the re-spending of their income in the local economy. These 166,628 workers earned a total of approximately $10.5 Billion in income, which in turn generated $2.9 Billion in federal, state and local taxes. Of the 166,628 jobs in total, 74,682 of them (45%) can be said to be directly tied to the waterways. The majority of these direct jobs (78%, ~59,400 jobs) represent the economic activity of businesses who source and ship goods via the waterway with the other 12% (~15,400 jobs) representing marine transportation and supporting businesses who render service to all marine traffic and not just Illinois businesses.
The following section provides a systematic accounting of the process that produced this estimation of statewide marine transportation system impacts. The intention throughout this process has been to establish a transparent, reproducible methodology that can be leveraged by the state to create an ongoing measure of waterborne contributions to the state economy. Through the discussion of how the marine transportation system affects the economy, greater detail is provided on the sources of data leveraged, and the key assumptions made during the analysis. Next, as part of linking commodity movements to businesses, a regional supply chain is constructed leveraging the available freight and economic data. This process depicts how commodity movements relate to regional industry activity within Illinois as a way of graphically representing conceptually vague relationships. Finally, after the impacts are estimated, a method is derived for regionalizing the sources of the impacts to enable a discussion on where the cargo handling activities are occurring in the state which in turn are responsible for generating the impacts previously estimated.
D.2.1 MARINE FREIGHT AND ILLINOIS
The Illinois marine system covers both inland navigable waterways and Great Lakes ports. This system transports a vast amount of cargo, totaling 90.6 million tons in 2017, serving major Illinois industry and supported by an array of freight carriers, as earlier sections of this chapter described. One of the challenges in assessing the importance of a system this large is differentiating between the economic activity it serves to generate in the state and the benefits enjoyed by other non-Illinois users. The facilities in Illinois provide benefits to a broader userbase that encompasses more than just Illinois businesses. Given the importance of identifying the impacts of the IMTS on the state itself, it is therefore necessary to distinguish the impacts it generates within the state economy as a commerce enabling transportation source for Illinois businesses trying to support their supply chain needs. The analysis presented in the subsequent pages does not look at the non-freight impacts of the waterways. Even so, it is estimated that some 166,600 workers are either directly or indirectly affected by the marine services across the state. $36 billion in economic output is generated in Illinois, and each Port District contributes to the total state impact. These figures are based on three pillars of activity capturing the scope of activity. The following Figure D-1 shows the composition of these impacts.

20
Figure D-1 Components of Marine Transportation System Impacts
Central to the work done in quantifying the economic effects is putting forth a transparent methodology that can be repeated as a way of benchmarking the role of the IMTS as the Illinois economy continues to evolve. While the impacts estimated in this marine transportation system plan are limited to a current year snapshot of activity, this method of assessing the role the IMTS plays in the economy should be continued to better understand future needs. Doing so will elucidate how real-world events – ranging from the 2020 pandemic to the historic shifting patterns of trade policy - play a role in determining local industry reliance on waterways in sourcing and shipping to all parts of their supply chains.
D.2.2 STATE ASSOCIATED MARINE FREIGHT
To fully address the question of to what extent Illinois businesses are reliant on the waterways, we must be able to quantify the value and type of cargo moving along the waterways. There are two data sources which obviously lend themselves to understanding the activity on the waterways, both of them used in the commodity flow analysis and forecast presented earlier in this chapter: the US Army Corps of Engineers waterborne commerce statistics and the Federal Highway Administrations Freight Analysis Framework data (FAF for short). The challenge with describing activity on the system is that these two sources are geared towards answering different kinds of questions. The US Army Corps of Engineers’ waterborne commerce statistics boast an impressive assemblage of data summarizing movements on the waterways by direction and commodity. The challenge with this data, aside from it only describing the volume and not value of goods, is that it emphasizes the physical movement of goods with respect to where they come on and off the waterways, rather than the location of the ultimate shipper or receiver. Portions of the volume of goods getting on and off the system at terminals in the state are intermodal traffic cross hauled from neighboring states. Simply using this data as though it were literal in its reporting of origin-destination would cause overestimation of Illinois marine cargo traffic and its impact on the economy. That does not mean the data cannot be used – it helps in the estimation of Illinois based
Marine Transportation
Industry
Marine Supporting Industries
Illinois Business
Usage

21
services provided to the entirety of traffic on the system – rather that care must be employed in doing so. Figure D-2 compares the directional flow of goods for the state of Illinois.
Figure D-2 Comparison of Data Sources
Note that Figure D-2 includes estimation of the value of goods shipped on the waterway based on the tonnage by commodity. This was done because discussion of the economic value of the IMTS to businesses requires traffic be put in monetary terms to mesh with the economic data it will be tied to. This estimation was done by applying a value per ton factor from the FAF data on the portion of freight traffic that had a known commodity mix. While doing so gives us a more complete picture of the total value of economic activity making use of the waterway, it also emphasizes the importance of combining multiple sources and the usefulness of the FAF data.
To capture the portion of activity related directly to cargo originating or destined for Illinois industries, FAF has the advantage of reporting the movement of cargo in terms of a shipper origin (production) – receiver destination (consumption) context, which lends itself to the economic analysis. While still subject to trip overestimation because trip segments can show up as distinct moves, it is the dataset best able to depict the flows of goods in an economy across all modes (versus in terms of entrance and exit from the IMTS). In the following discussion of the value to Illinois businesses of shipping goods on the waterways, the analysis is implicitly based on FAF data because of its definition of origin and destination. However, in discussion about supporting services for marine cargo, such as in estimation of supporting truck and rail activity, the basis is the physical volume of traffic supported and derives from waterborne commerce data.
Figure D-3 Comparison of FAF Volume and Value
-
10,000.0
20,000.0
30,000.0
40,000.0
50,000.0
60,000.0
Tonange ('000s) Value ($M) Tonange ('000s) Value ($M)
FAF WCSC
Tho
usa
nd
s o
f To
ns,
Mill
ion
s o
f D
olla
rs
Comparison of Freight Volumes Between Data Sources (2017)
Internal Inbound Outbound

22
Figure D-3 shows a predominant IMTS emphasis on handling domestic outbound Illinois marine cargo when measured by tonnage.23 Much of this traffic is aptly described as high volume, low value bulk cargo such as grains, minerals, metallic ores and products, etc. This can be seen in the relationship between the level of tonnage and value of goods shipped in each direction. Note that in Figure D-3 we have split inbound and outbound into their domestic and international components (import for inbound, export for outbound) to demonstrate the relative emphasis of trade, and markets. However, what is most interesting in Figure D-3, is that the pattern is reversed with imports: demonstrating a higher value to weight ratio than would normally be expected. Table D-8 shows the mix of commodities by direction which serves to confirm the normal volume to value trends, but also sheds light on what is driving the import figures – a presence of more finished goods being distributed inland such as plastics and rubber, transportation equipment, and electronics/machinery.
Table D-8 Value of Commodities by Direction
Value of Illinois Waterborne Commerce by Direction, Commodity ($M)
SCTG Commodity Inbound Import Internal Export Outbound
2 Cereal grains 16.9
21.2
60.3
3.2 958.3
3 Other ag prods. 582.1
125.8
122.6
27.5 3,151.1
4 Animal feed - 77.5 -
5.0 83.4
5 Meat/seafood - 215.4 -
9.2 -
6 Milled grain prods. - 174.8 -
1.5 -
7 Other foodstuffs - 441.3 -
10.6 -
23 As noted previously in this chapter, outbound food products on the IMTS ship mostly to Louisiana. While this appears as domestic freight in the waterborne commerce data, much of it ultimately is bound for export markets.
-
5,000.0
10,000.0
15,000.0
20,000.0
25,000.0
Export Import Inbound Internal Outbound
Illinois Marine Cargo: Value and Tonnage
Value of Goods Shipped ($M) Thousands of Tons

23
8 Alcoholic beverages -
303.2 -
19.7 -
9 Tobacco prods. - 2.0 -
- -
10 Building Stone - 0.1 -
- -
11 Natural sands - 0.2
3.6
0.1 7.9
12 Gravel - 1.6
12.4
- 5.3
13 Nonmetallic minerals
22.8
5.5 -
0.2 -
16 Crude petroleum 184.4 -
1.3
3.3 6.8
17 Gasoline - - - 2.6 152.0
18 Fuel oils - 0.2
248.0
6.6 57.3
19 Coal-n.e.c. 77.4
0.1
106.5
0.1 -
20 Basic chemicals 199.8
398.5 -
7.7 2,063.5
21 Pharmaceuticals - 146.7 -
0.1 -
22 Fertilizers 118.3
4.1 -
- -
23 Chemical prods. - 518.9 -
13.3 -
24 Plastics/rubber - 1,105.8 -
11.6 -
25 Logs - - - 0.1 -
26 Wood prods. - 176.7 -
0.5 -
27 Newsprint/paper - 69.4 -
2.6 -
28 Paper articles - 109.5 -
0.1 -
29 Printed prods. - 41.0 -
2.2 -
30 Textiles/leather - 473.1 -
1.8 -
31 Nonmetal min. prods.
90.7
322.2 -
7.0 55.7

24
32 Base metals - 437.9 -
1.9 69.2
33 Articles-base metal - 277.3 -
26.5 -
34 Machinery - 713.0 -
153.7 -
35 Electronics - 3,171.5 -
28.3 -
36 Motorized vehicles - 918.5 -
19.9 -
37 Transport equip. - 27.7 -
1.7 -
38 Precision instruments -
765.0 -
23.9 -
39 Furniture - 635.7 -
1.4 -
40 Misc. mfg. prods. - 356.0 -
10.4 -
41 Waste/scrap 1.6
17.1 -
8.4 87.8
43 Mixed freight - 64.3 -
0.4 -
Total 1,294.0
12,118.8
554.7
413.1 6,698.3
This value of import commodities can be traced back to the FAF using its publicly available data tabulation tool to confirm the trend: goods arrive at the port of Chicago and are then distributed inland via the marine transportation system. This trend seems to indicate something contrary to the volume of activity reported at the port according to the US Army Corps.

25
Figure D-4 Valuation of Imported Marine Cargo
Source FAF Online freight analysis tool: https://faf.ornl.gov/fafweb/Extraction0.aspx
The reason for such a discrepancy in magnitudes is simple: FAF is reporting activity at the port based on port of entry, or the location where goods are registered with customs before being distributed inland. Contrary to this are sources such as the Army Corp’s data is reporting based on the port of unlading, or where goods are first unloaded as they enter or exit . To demonstrate this, Wiser Trade data was reviewed for marine cargo imports destined to Illinois. By tabulating cargo by port based on unlading and port of entry, the pattern emerges clearly (Figure D-5). Much of the cargo that FAF is reporting is coming from east and west coast container ports and is hauled over to the port of Chicago by a combination of truck and rail. The important thing to note is that Figure D-4 shows this cargo is distributed inland via water.

26
Figure D-5 Illinois-Bound Imports: By Port of Unlading/Import
Source EBP-US analysis of WISER Trade data
D.2.3 GOODS MOVEMENT AND THE ECONOMY
In describing the importance of freight in the economy, the analysis is referencing the role of the marine economy in moving goods to and from markets, specifically in the Illinois economy. Industries are both producers and consumer of goods, and trade between industries for components is what necessitates marine and other modes of transporting goods. It is therefore crucial to understand how the IMTS satisfies industries by providing inputs to their production. To that end, the economic flow diagram of the Illinois economy in Figure D-6 serves to map the movement of goods via water within the Illinois economy. From left to right one can see the commodities which enter the state and are consumed by industries. Intuitively, one can see bulk commodities such as agricultural products being consumed by industries involved in food manufacturing as an input to their production. On the right-hand side are the industries generating outbound freight such as Illinois crop growing industries (soybeans, wheat, corn) creating outbound bulk goods such as cereal grains and other agricultural products. Note that the commodity relationships shown are only those associated with marine cargo moves. This means that mostly bulk raw and primary manufactured goods are involved. This figure was constructed by linking the Implan state economic data and production functions communicating the pattern of trade between industries to an underlying set of FAF-freight commodity data.
0
1000
2000
3000
4000
5000
6000
Tho
usa
nd
s o
f To
ns
2018 Cargo Destined for Illinois by Port, Definition
Port of Unlading Port of Entry

27
Figure D-6 Flow of Marine Goods in the Illinois Economy
Source EBP-US analysis of Freight-Economy Linkages
These sorts of diagrams can be created to highlight the relative emphasis of modes in servicing specific sectors and industries within the state as a way of distinguishing between different supply chains and the nuances of freight markets. They also conceptually demonstrate the role of marine cargo traffic as a way of demystifying how freight lines up with discussions of the economy. To accomplish this mapping of goods, a freight-economy model was built which linked commodities in the freight database with the commodities being tracked in the economic model of the state of Illinois (using IMPLAN data). Note that this approach inherently captures cargo which is either inbound to businesses as an input to production, goods moving within the state by water for value addition or consumption, or finally as produced goods leaving the state for an external market. There is a large volume of goods using the system that ultimately does not tie into Illinois businesses as it relates to production/manufacturing. Obviously, this is not the entire picture, however, as there are services which the marine sectors provide to everyone (not just Illinois businesses only) which must be accounted for.
28
D.2.4 METHODOLOGY
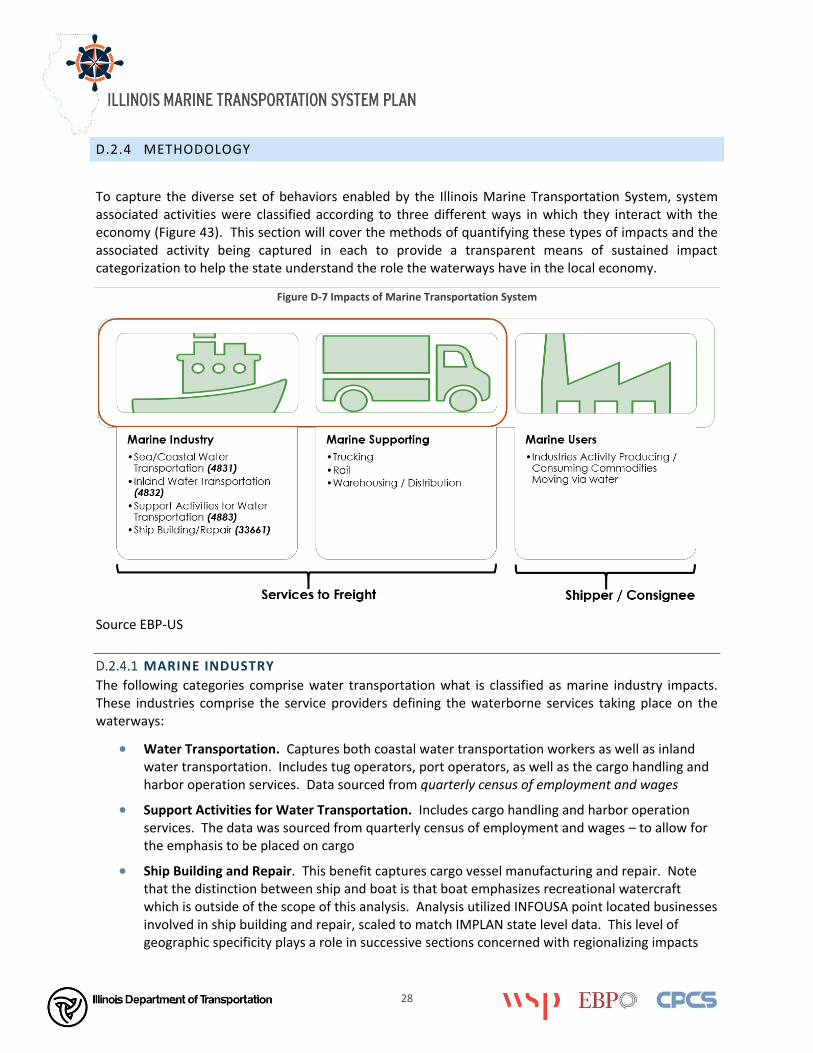
To capture the diverse set of behaviors enabled by the Illinois Marine Transportation System, system associated activities were classified according to three different ways in which they interact with the economy (Figure 43). This section will cover the methods of quantifying these types of impacts and the associated activity being captured in each to provide a transparent means of sustained impact categorization to help the state understand the role the waterways have in the local economy.
Figure D-7 Impacts of Marine Transportation System
Source EBP-US
MARINE INDUSTRY
The following categories comprise water transportation what is classified as marine industry impacts. These industries comprise the service providers defining the waterborne services taking place on the waterways:
Water Transportation. Captures both coastal water transportation workers as well as inland water transportation. Includes tug operators, port operators, as well as the cargo handling and harbor operation services. Data sourced from quarterly census of employment and wages
Support Activities for Water Transportation. Includes cargo handling and harbor operation services. The data was sourced from quarterly census of employment and wages – to allow for the emphasis to be placed on cargo
Ship Building and Repair. This benefit captures cargo vessel manufacturing and repair. Note that the distinction between ship and boat is that boat emphasizes recreational watercraft which is outside of the scope of this analysis. Analysis utilized INFOUSA point located businesses involved in ship building and repair, scaled to match IMPLAN state level data. This level of geographic specificity plays a role in successive sections concerned with regionalizing impacts

29
down to a district level. Whereas services can be typically contracted for, and therefore take place outside of the physical business location contracted from, ship building and repair activities predominantly take place on site, and so the usage of point locations of businesses was desirable when we regionalized the state impacts.
MARINE-SUPPORTIVE AND RELATED IMPACTS
Separate from the physical operators responsible for the provision of transportation services are the supporting industries which provide services to waterways users. This activity encompasses not just warehousing and distribution activities taking place around port premises but also the truck and rail transportation acting as a feeder service getting goods on and off the water.
Warehousing Activity. Captured by looking at INFOUSA businesses buffering the waterways.
This operates in a 1-to-5-mile zone around the river24.
Supporting Truck/Rail transportation. Estimates the magnitude of non-marine traffic
responsible for getting goods on and off the waterways.
Note that especially during the off season, port districts may act as traditional truck-rail intermodal yards. This goes beyond the scope of this marine cargo analysis, and as such, should be noted is not part of the IMTS figures. On top of the raw value of a good representing its production cost are value added premiums representing additional costs going into the purchaser price due to other supply chain costs such as transportation. Assessment of feeder traffic takes the total volume of traffic getting on and off at the county (based on the commodity flow analysis presented previously in this chapter) and estimates the value of that cargo (as demonstrated in the earlier Figure D-2). From there, the Implan data is used to estimate the associated trucking and rail transportation margins representing the value to feeder traffic. For quantifying the magnitude of warehousing/distribution activity, the INFOUSA database is used to quantify the magnitude of businesses within a 1 to 5-mile buffer around the waterway (with a 1-mile buffer in the denser areas around the surrounding Chicago area). Figure D-8 shows the relation of the identified businesses to the docks identified by the US Army Corp’s Masterdock Plus database.
24 To Prevent over-attribution, we used a 5 mile buffer around the river except in the more dense areas are Chicago, where it was tightened to a 1 mile radius.

30
Figure D-8 Relationship of Warehousing to Master Dock Ports
Source EBP-US Analysis of Masterdock Plus, INFOUSA
MARINE USERS
Finally, to give a full accounting of the value of marine traffic to the state, the magnitude of industry activity taking place on the waterways is quantified. Note that the value of cargo on the waterways from FAF cannot be used directly, as there is an implicit double count between the value of inbound cargo and the value of outbound cargo. This is primarily because the purchasing price of the goods includes both the intermediate inputs (as represented by inbound goods) as well as the value-added activity taking place at facility location by manufacturing businesses. This requires adjusting the value of outbound cargo to only include the value-added portion of activity captured in the valuation of the cargo. Implicit in doing this, all non-marine hauled components to production is being discounted. Post adjusted values are then allocated out to Illinois businesses based on their role in production – either as an input, produced output, or both. These direct effects to industry are then applied to the economic model to look at broader economic effects of the activity. One key fact to note is that this methodology emphasizes only the portion of production that is traveling via water mode.
MODAL TERMINOLOGY AND UNDERSTANDING THE RESULTS
Because this report examines in some detail the ways in which the IMTS affects the economy, it is helpful to detail the terminology which is used to describe the components of IMTS economic impacts. The ways in which the IMTS impacts the economy of a region are generalized to three types of interactions which Figure D-9 below will help depict.

31
Figure D-9: Description of Port Direct, Indirect, and Induced Impacts
Direct Effects – these are the result of expenditures associated with the port-user, port industry, construction, and tourism aspects of the Port. All these effects are from the values of initial costs, labor, and materials associated with the port’s operation and usage.
Indirect Effects – represent the purchasing of goods and services by suppliers in order to meet the demand of the direct port activity.
Induced Effects – represent the income earned by workers being re-spent in the economy on household goods and services.
Thus, following the arrows in the diagram, the direct effects of the port in the center generate indirect effects because of the need to supply those activities with goods and services as well as induced effects of the spending by workers involved either directly or indirectly as they earn wages from their labor. There is some simplification in the way this is being presented with this graphic; it portrays an overview of the types of effects captured in the model but simplifies the scope of what is being captured.
Functional Definitions of Economic Measures
Employment – represents the fulltime, or part-time jobs within a region for a given industry. To this extent, one single person working multiple jobs may be represented twice if they work two part time jobs.
(Labor) Income – represents not just an employee’s level of compensation, but also fringe/benefits and proprietor income. Put simply, a measure of all forms of income gained from employment.
Value Added (GDP) – is measured as the difference between an industry’s economic output and the value of intermediate inputs to its production process. Value added is the combination of labor costs, taxes, and any other proprietor or property income. Focuses on net new production occurring, rather than including any purchased inputs.
32
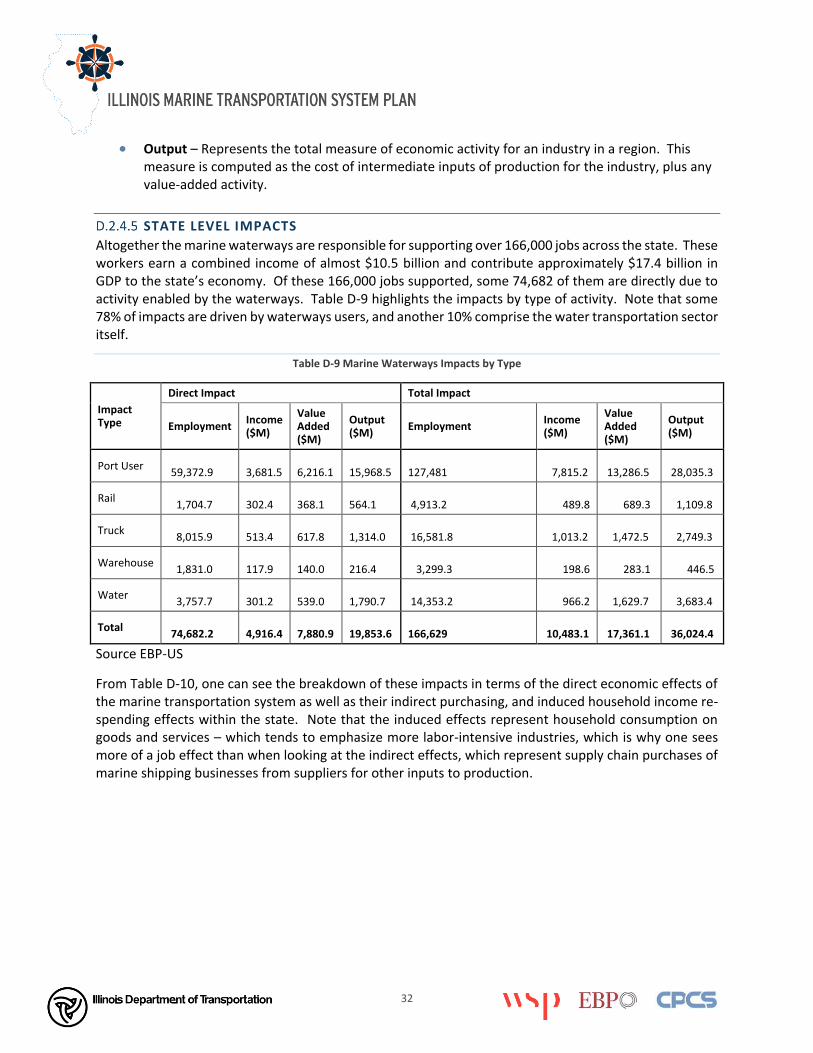
Output – Represents the total measure of economic activity for an industry in a region. This measure is computed as the cost of intermediate inputs of production for the industry, plus any value-added activity.
STATE LEVEL IMPACTS
Altogether the marine waterways are responsible for supporting over 166,000 jobs across the state. These workers earn a combined income of almost $10.5 billion and contribute approximately $17.4 billion in GDP to the state’s economy. Of these 166,000 jobs supported, some 74,682 of them are directly due to activity enabled by the waterways. Table D-9 highlights the impacts by type of activity. Note that some 78% of impacts are driven by waterways users, and another 10% comprise the water transportation sector itself.
Table D-9 Marine Waterways Impacts by Type
Impact Type
Direct Impact Total Impact
Employment Income ($M)
Value Added ($M)
Output ($M)
Employment Income ($M)
Value Added ($M)
Output ($M)
Port User 59,372.9
3,681.5
6,216.1
15,968.5 127,481 7,815.2 13,286.5 28,035.3
Rail 1,704.7
302.4
368.1
564.1 4,913.2 489.8 689.3 1,109.8
Truck 8,015.9
513.4
617.8
1,314.0 16,581.8 1,013.2 1,472.5 2,749.3
Warehouse 1,831.0
117.9
140.0
216.4 3,299.3 198.6 283.1 446.5
Water 3,757.7
301.2
539.0
1,790.7 14,353.2 966.2 1,629.7 3,683.4
Total 74,682.2
4,916.4
7,880.9
19,853.6 166,629 10,483.1 17,361.1 36,024.4
Source EBP-US
From Table D-10, one can see the breakdown of these impacts in terms of the direct economic effects of the marine transportation system as well as their indirect purchasing, and induced household income re-spending effects within the state. Note that the induced effects represent household consumption on goods and services – which tends to emphasize more labor-intensive industries, which is why one sees more of a job effect than when looking at the indirect effects, which represent supply chain purchases of marine shipping businesses from suppliers for other inputs to production.

33
Table D-10 Breakdown of Impact by Type
Breakdown of State Impacts by Type of Economic Response
Type Employment Income ($M) Value Added ($M) Output ($M)
Direct 74,682 $ 4,916.4 $ 7,880.9 $ 19,853.6
Indirect 42,107 $ 2,993.3 $ 4,909.1 $ 8,635.1
Induced 49,840 $ 2,573.4 $ 4,571.1 $ 7,535.7
Total 166,629 $ 10,483.1 $ 17,361.1 $ 36,024.4
Source EBP-US
Table D-11 displays the impacts on the top 15 industries affected. Based on the mix of commodities, much of the industries reliant on the waterways are associated with agriculture, chemical products manufacturing (including fertilizers), plastics, and rubber products. When one looks at the total impacts by industry, there is more of an emphasis on household services such as healthcare and media.
Table D-11 Impacts to Industry
Impact by Industry
Industry Direct Impact Total Impact
Employment Income ($M) Value Added ($M) Output ($M) Employment Income ($M)
Crop Production 5,635 266 548 1,645 6,337 291
Food Manufacturing 2,124 147 289 1,578 2,439 167
Water Transportation 2,079 192 402 1,510 2,103 194
Truck Transportation 8,560 548 660 1,403 10,593 679
Transportation Equipment Mfg 1,898 144 232 1,368 2,020 153
Construction & Bldgs 6,406 435 617 1,231 7,793 532
Chemical Mfg 1,233 163 377 1,230 1,469 197
Machinery Mfg 2,119 220 388 998 2,221 230
Media & Information 683 62 279 742 2,447 231
Health Care and Social Assistance 5,794 337 401 656 15,884 937
Computer and Electronic Mfg 1,582 153 282 655 1,663 159
Rail Transportation 1,758 312 380 582 2,011 357
Plastics & Rubber Products Mfg 1,451 110 199 535 1,671 127
Petroleum and Coal Products Mfg 131 26 144 488 233 47
Fabricated Metal Mfg 1,801 130 210 488 2,376 172
Rest of Industries 31,429 1,671 2,473 4,745 105,369 6,010
Total 74,682 4,916 7,881 19,854 166,629 10,483
Source EBP-US Analysis
There is a critical distinction to be made about these impacts concerning their representation as a snapshot, as opposed to depiction of industry dependence. Intuitively, it is expected that some businesses would be unable to adapt to the added transportation cost burden to move goods in the absence of the

34
marine waterways system and would either relocate or close up shop in the state. This study presents a snapshot in time, so it does not attempt to estimate that distinction. There was an attempt to claim dependence based on firm location proximity to the waterway as a measure of sensitivity to transportation services. While there is likely a correlation, it is far from conclusive, and would require large scale interviews with businesses to truly understand how many are dependent upon the system overall, versus the inland waterways, versus the Great Lakes connection of ports.
Tax Impacts
The $36 billion in economic impacts represent the magnitude of industry activity in the state that is either directly or indirectly tied to the marine transportation system. This industry activity and household consumption is subject to income and consumption taxes which serve to generate revenue at a federal, as well as state and local level. Using IMPLAN data, one can look at the tax implications and estimate the revenue derived from the activity supported by the waterways. In total, this amounts to approximately $2.9 billion in revenue generated each year. Of this $2.9 billion in revenue, as depicted in Figure D-10, approximately 60% of it is in the form of federal tax revenue on businesses and households. The remaining $1.2 billion represents revenue generated to support Illinois state and local budgets. Table D-12 shows the breakout of tax revenue by collector as well as tax type.
Figure D-10 Split of Tax Revenue Generated
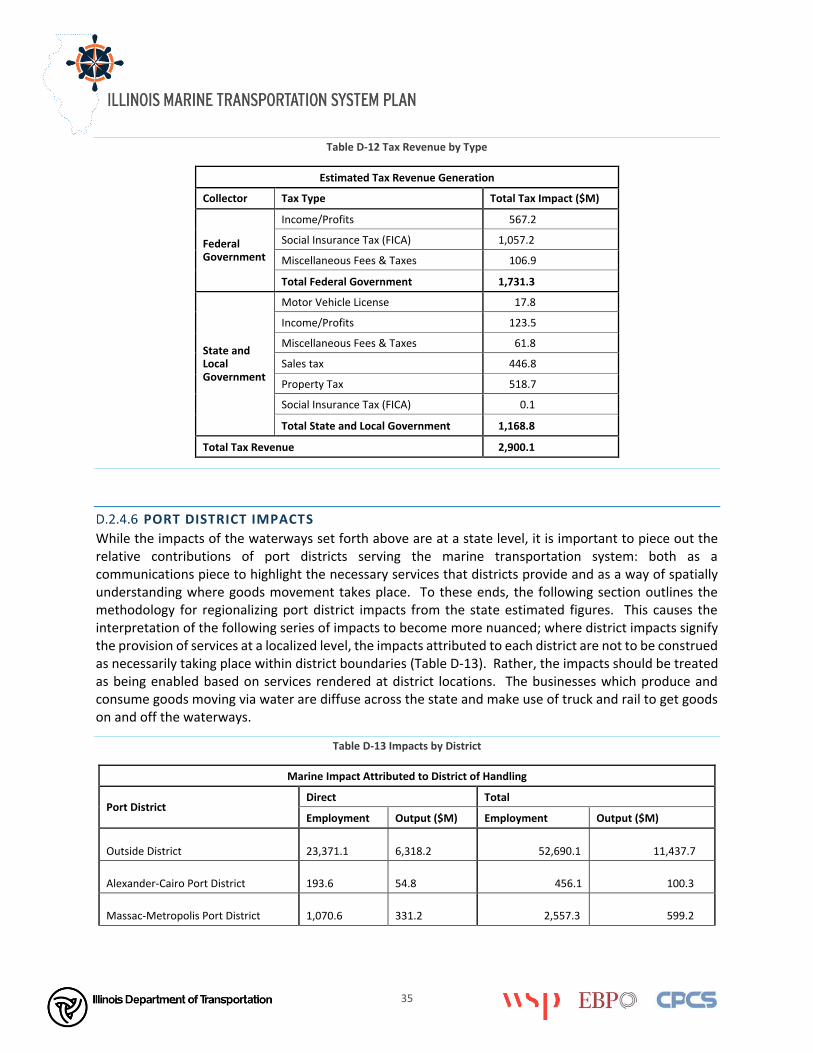
35
Table D-12 Tax Revenue by Type
Estimated Tax Revenue Generation
Collector Tax Type Total Tax Impact ($M)
Federal Government
Income/Profits 567.2
Social Insurance Tax (FICA) 1,057.2
Miscellaneous Fees & Taxes 106.9
Total Federal Government 1,731.3
State and Local Government
Motor Vehicle License 17.8
Income/Profits 123.5
Miscellaneous Fees & Taxes 61.8
Sales tax 446.8
Property Tax 518.7
Social Insurance Tax (FICA) 0.1
Total State and Local Government 1,168.8
Total Tax Revenue 2,900.1
PORT DISTRICT IMPACTS
While the impacts of the waterways set forth above are at a state level, it is important to piece out the relative contributions of port districts serving the marine transportation system: both as a communications piece to highlight the necessary services that districts provide and as a way of spatially understanding where goods movement takes place. To these ends, the following section outlines the methodology for regionalizing port district impacts from the state estimated figures. This causes the interpretation of the following series of impacts to become more nuanced; where district impacts signify the provision of services at a localized level, the impacts attributed to each district are not to be construed as necessarily taking place within district boundaries (Table D-13). Rather, the impacts should be treated as being enabled based on services rendered at district locations. The businesses which produce and consume goods moving via water are diffuse across the state and make use of truck and rail to get goods on and off the waterways.
Table D-13 Impacts by District
Marine Impact Attributed to District of Handling
Port District Direct Total
Employment Output ($M) Employment Output ($M)
Outside District 23,371.1
6,318.2 52,690.1 11,437.7
Alexander-Cairo Port District 193.6
54.8 456.1 100.3
Massac-Metropolis Port District 1,070.6
331.2 2,557.3 599.2

36
Mid-America Intermodal Authority Port District
6,631.7
1,585.3 13,913.4 2,896.5
Ottawa Port District 558.3
147.2 1,253.6 269.0
Seneca Regional Port District 162.4
52.8 394.0 94.1
Shawneetown Regional Port District 53.5
12.5 114.6 22.8
Southwest Regional Port District 3,628.4
1,080.6 8,713.3 1,985.9
Upper Mississippi River International Port District
741.5
182.1 1,604.5 331.4
Waukegan Port District 46.4
13.2 106.8 23.6
America's Central Port District 5,317.0
1,426.8 11,980.4 2,591.5
Havana Regional Port District 598.5
171.8 1,384.5 313.3
Heart of Illinois Regional Port District 12,922.9
3,196.1 27,623.6 5,797.6
Illinois International Port District 9,915.4
2,797.2 22,851.2 5,068.8
Illinois Valley Regional Port District 884.9
241.6 1,992.4 435.7
Jackson-Union Counties Regional Port District
198.6
55.5 453.4 100.5
Joliet Regional Port District 5,205.0
1,313.0 11,320.5 2,377.7
Kaskaskia Regional Port District 3,182.3
873.5 7,219.3 1,578.8
Total 74,682.2
19,853.6 166,628.9 36,024.4
As a caveat to these figures, interviews with port districts revealed that the services they provide are numerous and of a magnitude of benefit that goes beyond what is described here. The emphasis of this report was on capturing Illinois-related contributions to the economy, but the scope of services rendered goes beyond state boundaries. These services should be recognized, even though they are not quantified in this impact summary.25
25 The impact to port users goes well beyond state boundaries, with cargo originating and destined to states across the country

37
Figure D-11 Impacts by District
Methodology for Estimation
The approach to regionalizing state marine impacts required a tiered process that leveraged a combination of Army Corps data (including the Masterdock Plus data), interviews with port districts, and INFOUSA establishment-level data to construct a tiered process to allocate impacts. The allocation process required going from first the state level down to a county level, and then from the county level creating a district allocation to handle counties that span multiple districts or have a ‘rest of component’, where there may be active docks outside of port district boundaries which are operating within the county. Before this sequence of steps, a distinction was drawn between activities representing mobile service s versus rooted services. The reason for doing so is that rooted services are fixed industry locations that provide service at a discrete location. Industries such as shipbuilding and repair and warehousing are classic representations of fixed services. They have a location which can be point located using INFOUSA data, and their impacts are allocated based on employment reported at each location. These are the easiest to go straight to a district allocation and can bypass the two-step process. Note also that in the map in Figure D-11, the cases where impacts reside in counties not adjacent to the water represent locations where shipbuilding/repair businesses are said to reside.
Separate from the rooted services are mobile services which represent economic activity that is more fluid and more aptly represented based on the volume of goods being handled at a county level.

38
Classically this would include transportation sectors (water, truck, rail) – as they directly service cargo handled. The reason for tying water transportation to this type of allocation process is that much of the activity is performed on a contractual basis that extends far beyond the physical location of the businesses. Based on this, it therefore makes sense to allocate sectoral employment to the volume of cargo handled. These impact types therefore must undergo the two-step allocation process.
To get commodities down to a county level, the FAF value of goods by commodity was allocated to counties based on findings from the commodity flow analysis to show where goods get on and off the water. Figure D-12 below shows the location of where inbound commodities leave the waterways by county. The Army Corps data for these counties only described 14 commodities which made it difficult to crosswalk to the 42 commodity codes used by FAF. To circumvent this problem, the 14 commodities were related to a larger Army Corps database with greater commodity definition but less geographic specificity. Once this was done, commodities by direction were allocated out to counties based on tonnage handled from the Army Corps data.
Figure D-11 Inbound Freight Leaving the Waterway by County

39
Having allocated the activity down to a county level, it was necessary to next go from county level down to the District (plus rest of) level to finish the process. To do so, the analysis relied on the Army Corp’s Masterdock Plus database. This series of data has information on the physical location of docks, the types of commodities they might handle, and the attributes of those docks (such as connection to rail). To allocate to sub county geography, commodities handled at the various docks were associated with the NAICS industry codes responsible for producing or consuming those commodities. Next, the INFOUSA data was used to allocate each NAICS code in the respective county associated with a commodity to the closest dock using a haversine formula to calculate the straight-line distance. After normalization by county and commodity, the result of this process is a representation of the relative demand at each facility. This representation finally was used to allocate county activity down to the subcounty level of detail and thereby produced the District impacts reported above.